Article

THz Time-Domain Ellipsometer for Material Characterization and Paint Quality Control with More Than 5 THz Bandwidth

1
Helmut Fischer GmbH, Industriestraße 21, 71069 Sindelfingen, Germany
2
Fraunhofer Institute for Telecommunications, Heinrich Hertz Institute, Einsteinufer 37, 10587 Berlin, Germany
3
Institut für Festkörperphysik, Technische Universität Berlin, Hardenbergstr. 36, EW 6-1, 10623 Berlin, Germany
*
Author to whom correspondence should be addressed.
Appl. Sci. 2022, 12(8), 3744; https://doi.org/10.3390/app12083744
Submission received: 25 February 2022 / Revised: 4 April 2022 / Accepted: 5 April 2022 / Published: 8 April 2022
(This article belongs to the Special Issue Terahertz Applications for Nondestructive Testing)

Abstract

:

Featured Application

Multi-layer thin film measurements for quality control by terahertz time-domain spectroscopy in reflection geometry.

Abstract

Quality control of car body paint in the automotive industry is a promising industrial application of terahertz technology. Terahertz time-domain spectroscopy in reflection geometry enables accurate, fast, and nondestructive measurement of individual layer thicknesses of multi-layer coatings. For high precision thickness measurements, the frequency dependent complex refractive index of all layers must be calibrated very accurately. THz time-domain ellipsometry is self-referencing and provides reliable, frequency resolved material properties with high signal-to-noise ratio. The method is characterized by a high sensitivity to optical material properties and layer thicknesses. We present characterization results in the frequency range 0.1–6 THz for typical automotive paints and different substrates such as polypropylene (PP), which features a high material anisotropy. We demonstrate that the broadband material properties derived from ellipsometry allow for inline thickness measurements of multi-layer car body paints with high accuracy.

1. Introduction

In the automotive industry, quality control is a key step for every production stage. The multi-layer coating on the car body is important for the durability and appearance of the car. The functionality of the coating essentially depends on the correct thickness of the individual coating layers, which requires a thickness measuring system with high accuracy of at least ±1 µm. Commonly used methods are eddy current techniques and magnetic gauges (that only measure total thickness), microsection (which is destructive), and ultrasonic measurements (that require a coupling medium). Since most paints used in the automotive industry are transparent in the terahertz spectral range, terahertz time-domain spectroscopy (THz TDS) in reflection geometry is a promising tool for measuring the thicknesses of each layer of a multi-layer stack. Furthermore, THz TDS measurements are not only limited to metal substrates but are applicable to many different substrate materials. This includes plastics like polypropylene (PP), which are commonly used in the automotive industry, too. Rapid progress in system performance in recent years allows for accurate, fast, non-contact and nondestructive inline terahertz measurements in production environments, making THz TDS in reflection geometry the ideal tool for automotive quality control [1,2,3,4,5,6,7,8].
For precise inline thickness measurements of dielectric layers, the exact frequency dependent complex refractive indices of each layer must be known in advance. Thus, there is a lot of research activity regarding the determination of optical properties of unknown materials in the THz frequency range [9,10,11,12,13,14,15,16]. Spectroscopic ellipsometry is a well-established technique for the characterization of a plurality of isotropic and anisotropic materials and for thickness measurements in a broad range from the VUV to the IR spectral range [17,18,19,20,21]. In contrast to pure reflectometry measurements [22,23], no reference measurements are needed for ellipsometric measurements. In combination with its high sensitivity to material properties and film thicknesses, ellipsometry is the ideal tool for material characterization.
Recently, ellipsometry has also gained importance for the measurement of optical constants in the terahertz frequency range [24,25,26,27,28,29,30,31]. In contrast to transmission measurements, ellipsometry is applicable to highly absorbing substrates and thin films on non-transparent substrates. In contrast to reflectometry measurements, ellipsometry does not need any reference measurement and avoids the problems of phase detection due to misplacement errors [32,33,34]. This makes THz TDS-ellipsometry the ideal tool for characterizing the optical properties of thin films and complex substrates in the terahertz frequency range.
In this work, we apply THz TDS ellipsometry with more than 5 THz bandwidth to multi-layer systems of automotive car body paint on different substrates. This type of measurement is planned to become a central part of the quality control of automotive paints: THz-TDS ellipsometry is used in the laboratory to accurately determine the material properties of the paint layers in the THz range. These data are then used as a fixed calibration for inline thickness measurements with THz-TDS reflectometry, which can be conducted at higher measurement speeds. The goal of this study is to validate the feasibility of THz ellipsometry measurements for the calibration parameter determination for THz TDS inline quality control. This process is presented with the first sample, which is a three-layer stack on a metal substrate. Firstly, each individual layer was characterized by THz TDS ellipsometry. Secondly, a THz TDS reflectometry measurement is performed and compared with the results from the ellipsometric measurement. A second example demonstrates the material characterization of a plastic substrate with an anisotropy in the refractive index. For this sample, we show THz TDS transmission and reflection measurements and compare them to THz TDS ellipsometry measurements, with respect to their sensitivity to absorption and anisotropy. Finally, we demonstrate a thickness measurement of a three-layer stack on this anisotropic substrate using THz TDS reflectometry.

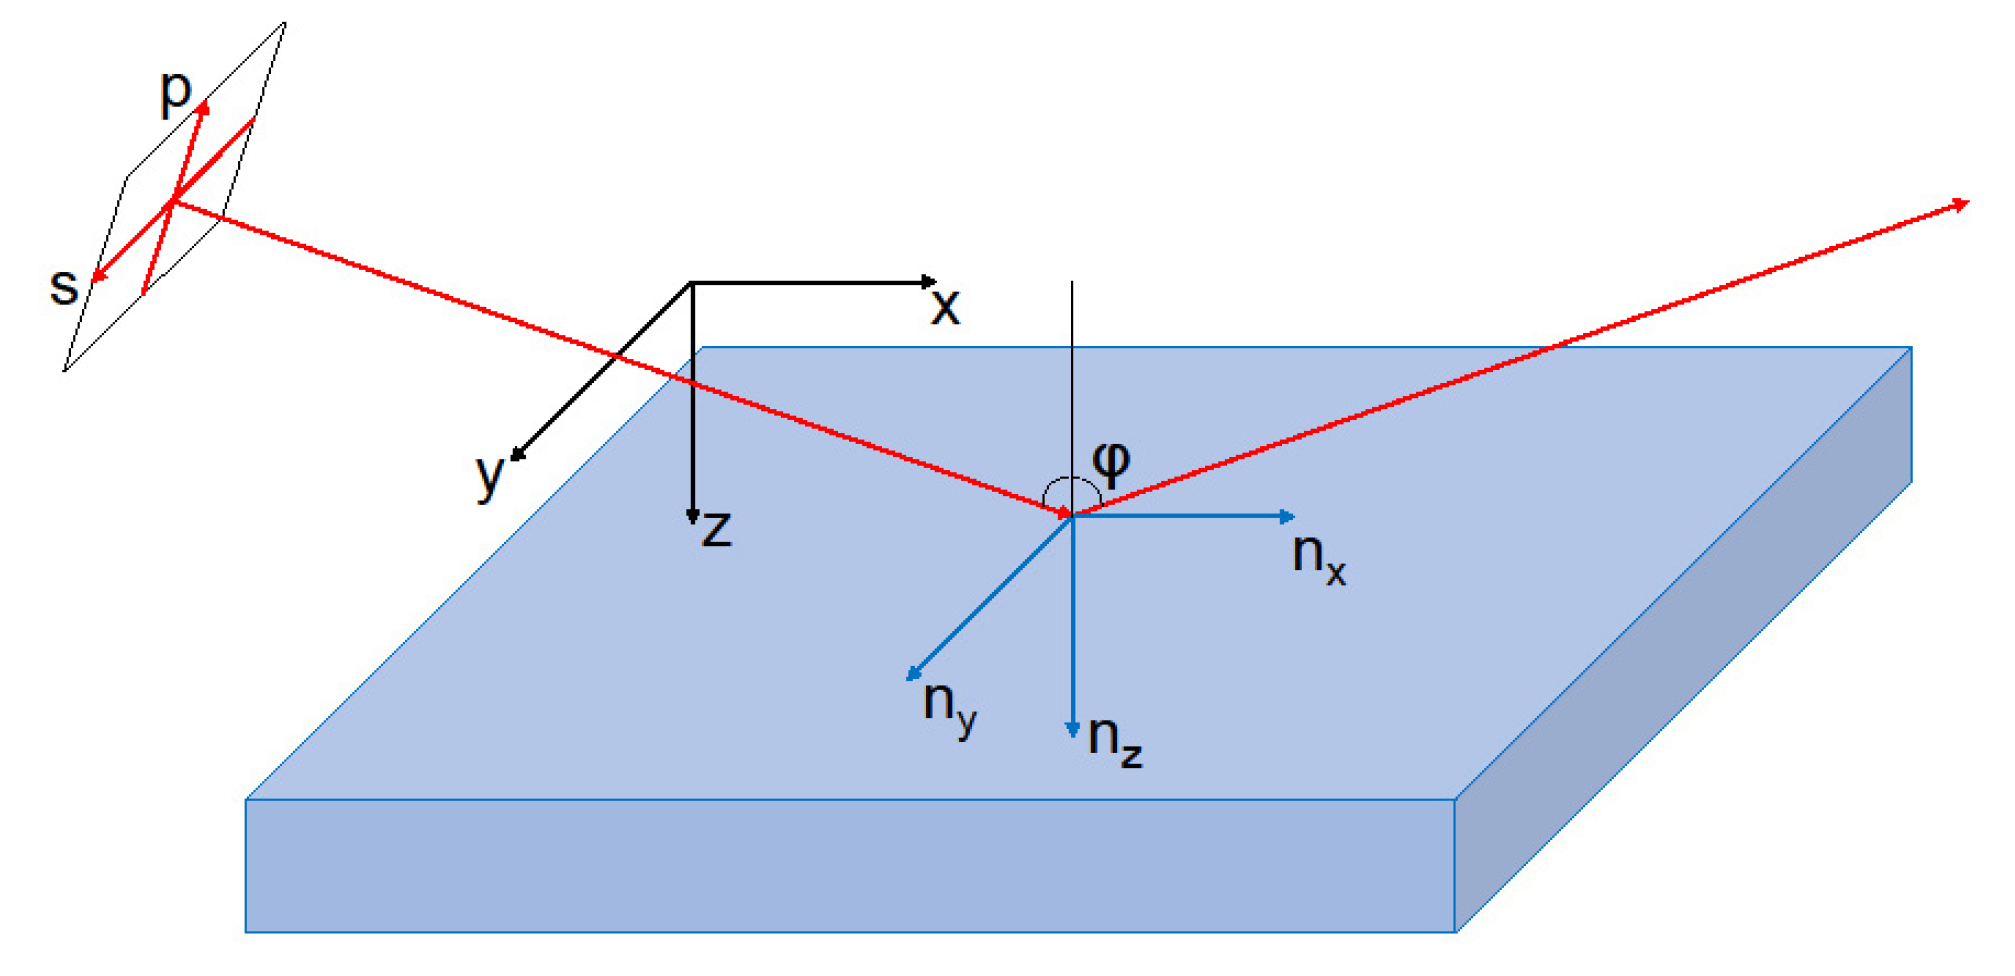
2. Experimental Setup

A schematic and a photograph of the designed terahertz time-domain ellipsometer are shown in Figure 1. The ellipsometer uses a TeraFlash pro system from TOPTICA Photonics (TOPTICA Photonics AG, Munich, Germany). The system employs a new generation of fiber-coupled photoconductive antennas consisting of InGaAs:Rh [35] emitters in combination with photoconductive membrane receivers made of a 1.2 µm thin-film of InGaAs:Fe on a silicon substrate [36]. While the new emitter allows for THz output powers of >100 µW, the photoconductive membrane receiver increases the dynamic range of the system by more than 10 dB compared to the current state-of-the-art, especially for frequencies above 2 THz. With these components, the THz ellipsometer enables measurements with an unprecedented dynamic range from 0.1 THz to more than 5 THz. The THz radiation emitted from the photoconductive antenna is collimated using a protected aluminum coated off-axis parabolic mirror with an effective focal length of 50.8 mm. Although the THz field emitted by the photoconductive antenna is already polarized linearly, the collimated beam is filtered once again with a tungsten wire grid polarizer (WGP) with high extinction ratio. The diameter of the wires measures 5 µm, the wire spacing is 12.5 µm and the aperture of the WGP is 34 mm. The extinction ratio of the WGP is of the order of 10−4 for 0.5 THz and increases to 10−2 for 5 THz. This procedure guarantees a high degree of polarization. For the ellipsometric measurements, the WGP is rotated by 45° relative to the plane of incidence using a motorized rotary stage. The THz antenna is rotated around its optical axis to the identical azimuthal angle to obtain the maximum intensity. Four apertures are used to minimize stray light and to control the beam diameter. This results in a spot size of about 50 × 16 mm2 on the sample (beam diameter about 16 mm). The maximum sample size is roughly 250 × 140 mm2.
The samples are measured at 70° angle of incidence. This is a compromise between the different samples, as the angle of incidence with highest sensitivity is near the Brewster angle and therefore it is material dependent. The reflected THz radiation from the sample passes a second WGP. This analyzer is also mounted on a motorized rotary stage, which can be set to 0° or 90° with respect to the plane of incidence. An off-axis parabolic mirror focusses the beam on the fiber-coupled detector, whose preferred polarization axis is rotated by 45° with respect to the plane of incidence. This enables nearly equal detection sensitivity for the two orthogonal analyzer settings of 0° and 90°.
For precise measurements, the sample must be accurately aligned with the optical beam path. Therefore, an auto collimating telescope (ACT) in combination with a microscope objective was used for correctly aligning height and tilt of the samples. Badly aligned samples will impact the measurement accuracy. A wrong height and/or a wrong tilt of the sample will reduce the signal quality and decrease the signal-to-noise ratio. In addition, a wrong tilt leads to errors in the angle of incidence and in the azimuthal angles of the polarizers relative to the plane of incidence. Similar effects could occur for curved samples.
In contrast to ellipsometric measurements in the visible or near infrared spectral range, THz TDS measurements allow the determination of the amplitude and phase of the detected radiation. Therefore, only two measurements at analyzer settings of 0° and 90° relative to the plane of incidence are needed to calculate the basic ellipsometric parameters Ψ and Δ, which are the amplitude ratio and the phase difference of the reflected p- and s-polarized THz-radiation. The acquired temporal signal of the detector is transferred into the frequency domain using a Fourier transform. The resulting complex frequency spectrum allows for calculating the frequency dependent amplitude and phase of the signal. The complex parameter ρ is the ratio of the detector signals for azimuthal analyzer settings θA = 0° (p-polarization) and θA = 90° (s-polarization):
ρ ( Ψ , Δ , θ P , N O N ) = I e x p ( θ A = 0 ° ) I e x p ( θ A = 90 ° )  
where Iexp refers to the measured complex spectra and ρ to the theoretical spectrum as a function of the ellipsometric parameters Ψ and Δ, the polarizer azimuthal angle θP (usually 45°) and all non-idealities NON of the components used. The latter are the extinction ratio and phase retardance of polarizer and analyzer, the polarization dependent sensitivity of the detector and the source polarization of the emitter. For ideal components and θP = 45°, the ellipsometric parameters can be calculated as
Ψ = tan 1 | ρ | ,   Δ = arg ( ρ )     ,
where arg( ρ ) denotes the argument or phase angle of ρ .
In the THz spectral range, the aforementioned non-idealities cannot be neglected. Hence, the frequency dependent values of these non-idealities must be calibrated in advance in order to measure the ellipsometric parameters accurately. In addition, the errors of the azimuthal angles θP and θA of the motorized polarizer and analyzer must be determined accurately. The calibration procedure was carried out according to [37,38] using a gold coated metal substrate and a fused silica substrate for maximum accuracy.
The fundamental ellipsometric equation [39] is:
ρ = tan Ψ e i Δ = r p r s     ,
where rp and rs denote the Fresnel coefficients in reflection for p- and s-polarization, respectively. It connects the measured ellipsometric parameters Ψ and Δ with the sample properties. The Fresnel coefficients depend on the angle of incidence, the complex refractive indices and the thicknesses of each layer and the substrate.
By solving Equation (3), the dielectric function of a bare substrate can be calculated directly from the measured ellipsometric parameters Ψexp and Δexp [39]:
ε 1 + i ε 2 = sin 2 φ { 1 + [ 1 ρ 1 + ρ ] 2 tan 2 φ } ,
where φ is the angle of incidence. Therefore, only the exact knowledge of the angle of incidence is needed to calculate the optical parameters of a substrate from the ellipsometric parameters.
For all the other cases, like thin films on a substrate (see Figure 2), a surface roughness on a bare substrate or a transparent substrate with thickness T, a more complicated model of the sample and data analysis is required.
For a three-layer model on a transparent substrate, as shown in Figure 2, the thickness of each layer and of the substrate, and the angle of incidence as well as the frequency-dependent complex refractive indices of each layer and the substrate must be known to be able to obtain the Fresnel coefficients in reflection for p- and s-polarization. Using Equation (3), the model ellipsometric parameters Ψmod and Δmod can then be derived. By varying some of the model parameters like the thicknesses and/or the dispersion of the complex refractive index of one layer, the model can be fitted to the experimental data. The sample properties are derived from the model parameters by fitting the model to the experimental data.
The frequency dependent complex refractive index is usually parametrized by suitable dispersion functions like Lorentz oscillators, Drude, Cauchy or Sellmeier dispersions. In this paper, one or more Lorentz oscillators are generally used for parametrizing the dielectric functions of the measured layers:
ε ( ν ) = ε 1 ( ν ) + i ε 2 ( ν ) = ε 1 + k Ω p , k 2 Ω 0 , k 2 ν 2 i Ω τ , k ν     ,
where ν is the wavelength of light in wavenumbers and Ω0, Ωp and Ωτ are the oscillator center frequency, strength, and damping, respectively. This dispersion function can be used for the modelling of collective vibrations of atoms, called phonons.

3. Results

The application of the THz time-domain ellipsometer will be shown for two samples, which are commonly used in the automotive industry. Typical automotive multi-layer systems consist of different functional layers (see Figure 2). The first layer on a metal substrate is usually a cathodic electrodeposition coat (E-coat) for corrosion protection. On a plastic substrate, the first layer is a primer as an adherence agent. The second layer is called the base coat (BC). It is responsible for the visual appearance and color. The last, topmost layer is a clear coat (CC) for protection against mechanical damage and UV exposure. In order to demonstrate a first application, we use the ellipsometer for material characterization of a typical automotive multi-layer system of a car body paint on a metal substrate. A second application scenario will focus on the characterization of a PP substrate, which shows a strong anisotropy. The substrate dispersion will be determined by using THz TDS measurements in reflection and transmission geometry as well as THz TDS ellipsometry. Subsequently, the complete stack of an automotive car body paint consisting of multiple layers on this PP substrate will be measured with a THz TDS reflectometer.

3.1. Automotive Multi-Layer System on Metal Substrate

A typical automotive multi-layer system with an E-coat, a white BC and a CC on a metal substrate will be analyzed. First, each individual layer is deposited as a single layer on a metal substrate and characterized by THz time-domain ellipsometry to determine its frequency dependent complex refractive index. Subsequently, the complete stack will be measured and analyzed at once. Finally, the dispersions of the layers will be used to evaluate the thicknesses based on data from THz TDS reflectometry.

3.1.1. Single Layer Characterization

Figure 3 shows the dispersion of the optical parameters of the E-coat, the BC layer and the CC layer. The dispersions were obtained by fitting the ellipsometric measurements of the single layers deposited on a metal substrate from 0.1 THz up to 6 THz.
The E-coat measurement can be modeled with a constant refractive index and absorption, without any frequency dependence. The complex refractive index of the E-coat layer is n = 1.762 + i0.076 with a thickness of 18.5 µm.
The thickness of the white BC layer is 43.2 µm. The dispersion is parametrized by two Lorentz oscillators, one clearly visible at about 2.2 THz. The second one lies outside the measured spectral range at 7.5 THz and is much broader. This Lorentz oscillator is responsible for the slope of the absorption.
The ellipsometric measurement of the CC layer can be seen in Figure 4. Here, two measurements with different layer thicknesses are shown. Measurement one (black) and measurement two (blue) correspond to a layer thickness of 54 µm and 57 µm, respectively. Although the thickness difference was only 3 µm, both spectra are clearly distinguishable, which demonstrates the sensitivity of the ellipsometric measurement. The differences between the spectra increase with frequency, indicating that the sensitivity grows with the measurement bandwidth. The dispersion is parametrized by a single broad Lorentz oscillator.

3.1.2. Full Stack Characterization

Figure 5a shows the ellipsometric measurement of the full layer stack of the E-coat, BC, and CC layer. The optical properties of the layers, especially the BC layer, tend to change when they are deposited within the full stack, compared to a single layer. This is mainly caused by layer interactions and makes an additional adjustment of the refractive index of the BC inside the stack necessary. Therefore, the dispersion of the BC layer is considered a free parameter alongside all three thicknesses during the fitting of the ellipsometric measurement. The result of this procedure can be seen in Figure 5. The dispersion of the stack-calibrated BC is still parametrized by two Lorentz oscillators. The first one has shifted from 2.2 THz to 2.5 THz and is broader, compared to the single layer dispersion. The second one has shifted to 6.7 THz. In addition, the refractive index of the BC layer has changed from approx. 2.44 to 2.35 after the stack calibration.
The resulting thicknesses are shown in Table 1. These are average values evaluated over the illuminated area, which depends on the ellipsometer spot size of 50 × 16 mm2. The uncertainty is estimated from the variance of repetitive measurements on the same position.

3.1.3. Thickness Measurement

Inline quality control of multi-layer car body paint with THz TDS is commonly done with reflectometry, since it is faster, more robust, and less expensive compared to ellipsometry. In addition, THz TDS reflectometry does not require any moving parts such as motorized rotary stages. Figure 6 shows the THz TDS reflectometry measurement at 8° angle of incidence using a focused measurement spot with a diameter of about 1 mm, which is much smaller, compared to the ellipsometric spot size. A comparable setup to the one described in [40] was used for the THz TDS reflectometry measurements. The modelling of this measurement data is based on the dispersion curves, which were previously measured with the THz ellipsometer. Here, only the thicknesses were employed as free parameters.
The agreement between the measurement and the model of the time-domain signal is very good for both the absolute value and the phase of the measured transfer function. The resulting thicknesses are summarized in Table 1. The values are in good agreement with confocal CC thickness measurements and microsection results. The differences between ellipsometry and reflectometry results are probably due to the different spot sizes and measurement positions. The single layer root-mean-square roughness measured with a confocal microscope is about 0.4 µm for the E-coat, 0.5 µm for the BC and 0.1 µm for the CC. These roughnesses could also contribute to the thickness variations.

3.2. Automotive Multi-Layer System on Plastic Substrate

A general advantage of THz TDS is that it is not limited to metallic substrates only. Many different substrate materials like plastic [41], aircraft composite materials [42] or glass and silicon [43] can be used. In the automotive industry, different plastic materials, such as PP, are common, e.g., for bumpers, which are coated with similar paint stacks as the metal car body. Before measuring multi-layer stacks on these plastic materials, they must be characterized in detail. The characterization of an anisotropic PP compound substrate will be shown in the following section.

3.2.1. Substrate Characterization

The plastic substrate shown here is a SABIC® PP compound 8500 elastomer-modified mineral filled polypropylene for automotive painted exterior applications. In contrast to metallic substrates, plastic substrates are transparent in the terahertz region, so backside reflections together with transmission properties can give additional information (see Figure 2). Figure 7 shows the time-domain signal, which was measured with THz TDS reflectometry at 8° angle of incidence. At a delay time of about 33 ps, a backside reflection signal appears. The oscillations towards longer delay times are caused by a sharp absorption band in the PP material.
If the time-domain signal is set to zero outside the green box in Figure 7, the backside reflection can be ignored. This results in the THz spectra shown in Figure 8a, with no indication of an absorption feature in the PP material. If the complete pulse trace inside the blue box of Figure 7 is used, the spectra shown in Figure 8b are obtained. The time interval between the front and backside reflection pulses is responsible for the oscillations in the reflection signal (see Figure 8b) and enables us to determine the thickness of the PP substrate. The shape of the backside reflection pulse at a delay time of about 33 ps contains information about the complex refractive index of the PP, especially about the spectral absorption, which can be clearly seen around 1.1 THz in Figure 8b. Note that this feature is not visible in Figure 8a. Since the THz radiation that was reflected on the backside travelled twice through the PP substrate, this backside reflection contains much more information about any absorption features inside the PP than the front side reflection. If the reflection measurement is additionally combined with the results of a transmission measurement, another small absorption feature appears around 3.3 THz, which is not visible in the reflection measurements (see Figure 8c). The transmission measurement was made with the ellipsometer set up at 0° angle of incidence, with a collimated beam and a beam diameter of 16 mm. For these measurements we align a metallic mirror on the sample stage. First, a reference measurement is acquired. Afterwards, the measured sample is put between the aperture and the polarizer for the transmission measurement.
By fitting all measurements simultaneously using the same optical parameters, the substrate thickness and the frequency dependent complex refractive index can be determined with high accuracy and with very good agreement between measurement and model (see Figure 7 and Figure 8). The resulting dispersion is shown in Figure 9b, denoted as nxy and kxy. Here, nxy and kxy refer to the in-plane dispersion of the sample while nz and kz refer to the out of plane orthogonal direction. The dispersion is parametrized by four Lorentz oscillators. The first one, at 1.15 THz, and the second one, at 3.3 THz, are used for describing the pronounced spectral resonance features. The third and fourth oscillators, outside the measurable spectral range, are responsible for the overall shape of the dispersion. The measured substrate thickness was 3016.4 µm in transmission and 3010.4 µm in reflection geometry, which corresponds to a difference of 6 µm or 0.2% of the substrate thickness. Considering that the measurement location as well as the spot sizes (~1 mm for reflection and ~16 mm for transmission) were different, the results suggest a good agreement between both methods.
In analogy to reflection measurements, ellipsometric measurements that do not account for backside reflections are insensitive to weak absorption features. However, if the backside reflection is included in the ellipsometric measurement (see Figure 9a), additional optical properties can be obtained. When modelling the ellipsometric spectra, these properties can only be described by adding anisotropy to the complex refractive index of the PP substrate. For an isotropic material, the complex refractive index is identical for all directions. For materials that are uniaxial anisotropic, the complex refractive index is different in one direction compared with the two other directions (see Figure 10). For biaxial anisotropic materials, the refractive index is different for all directions. These effects can be measured and analyzed using ellipsometry [44].
Transmission measurements at 0° angle of incidence and reflectometry measurements with s-polarization at 8° angle of incidence are sensitive to nx and ny only. Hence, the nz component cannot be measured using these measurement techniques. However, ellipsometry enables us to measure nx, ny and nz.
Figure 9a illustrates a good agreement between the ellipsometric measurement and the model function, which accounts for the anisotropic substrate. This indicates a negative uniaxial material. Here, nxy and kxy obtained from reflection and transmission measurements are used in one model with nz and kz, which was obtained by the fitting process of the ellipsometric measurement. The corresponding dispersion is shown in Figure 9b. The ellipsometric measurement results in a substrate thickness of 3017.7 µm, a value which is close to the results obtained in transmission geometry (3016.4 µm) with comparable spot size.

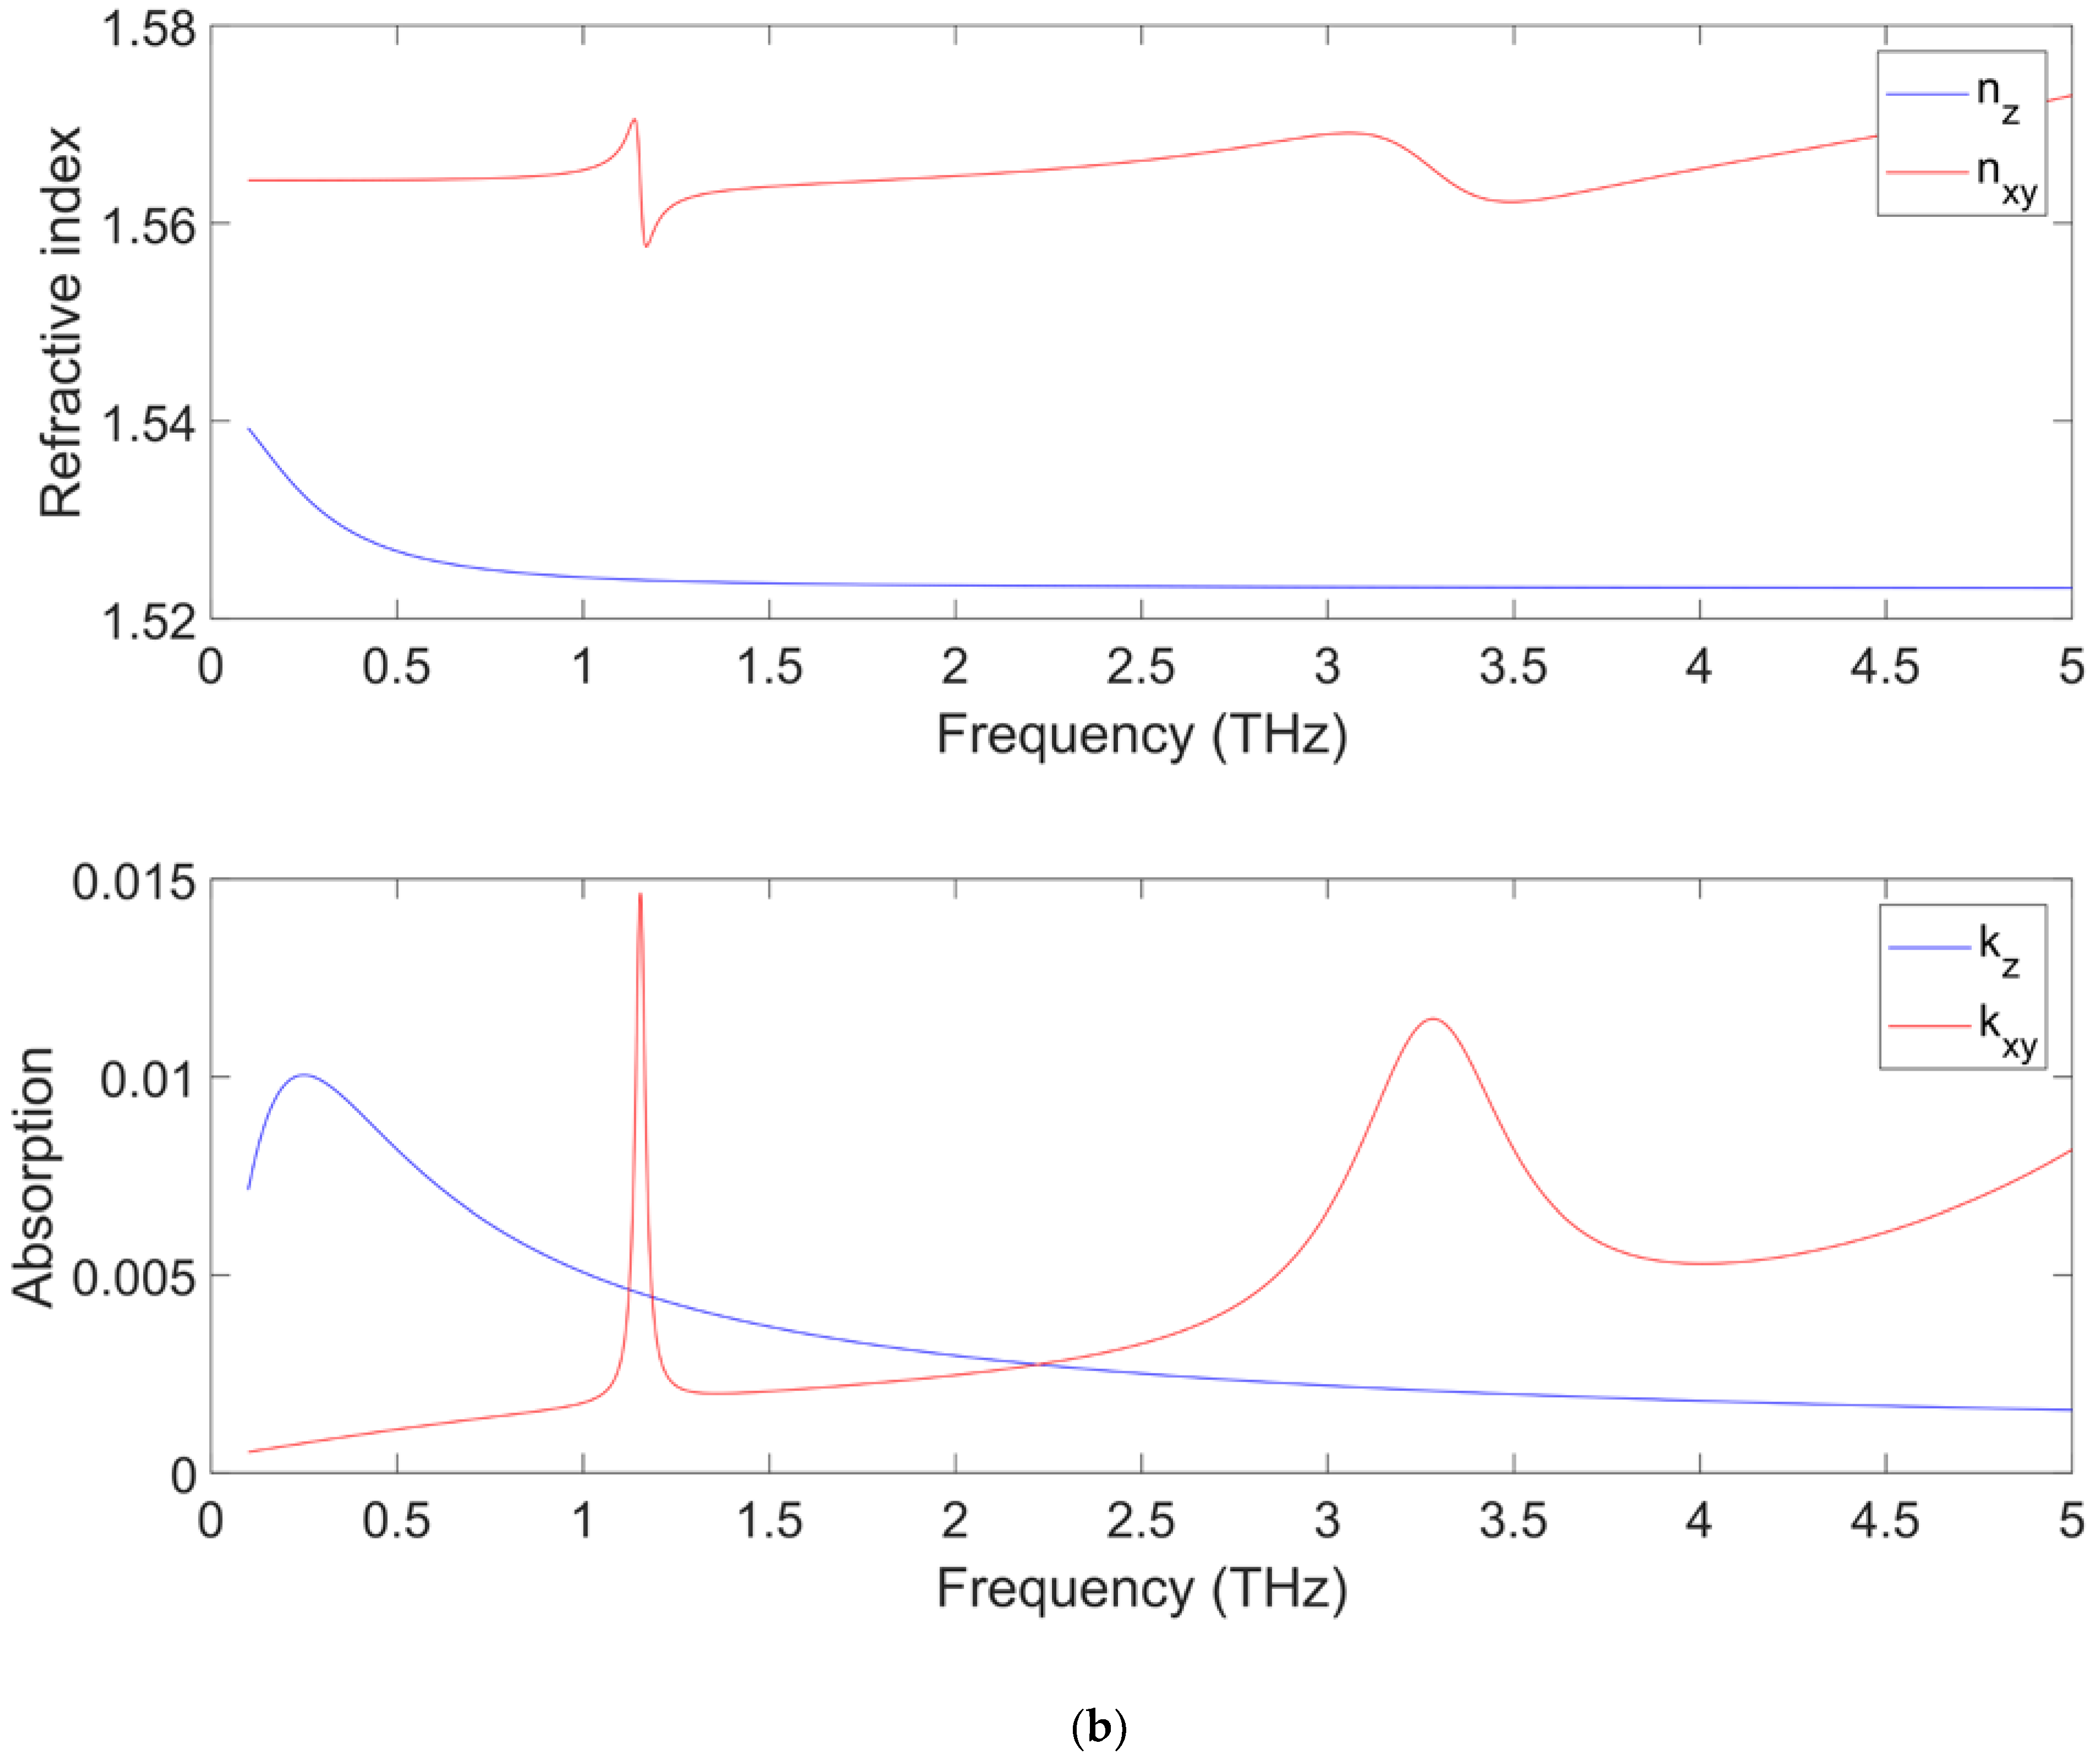
3.2.2. Multi-Layer on Anisotropic Plastic Substrate

Similarly to the characterization of a multi-layer stack on metal substrates, we performed the same characterization with a paint stack on the anisotropic plastic substrate, which was characterized in the previous section. The ellipsometric measurements were evaluated without and with accounting for the backside reflection.
The layer thicknesses obtained from this evaluation are shown in Table 2. The uncertainty is estimated from the variance of repeated measurements. Again, the dispersion was determined using THz time-domain ellipsometry.
The corresponding THz TDS reflectometry measurement is shown in Figure 11 and Figure 12. The resulting layer thicknesses are listed in Table 2. The single layer root-mean-square roughness, measured with a confocal microscope, is about 0.8 µm for the primer, 1.0 µm for the BC and 0.1 µm for the CC. These roughnesses could also contribute to the thickness variations.
Considering the different measurement spot sizes for ellipsometry and reflectometry, a very good agreement between the thickness values obtained by ellipsometry and reflectometry measurement was achieved.

4. Conclusions

We have demonstrated the potential of THz TDS ellipsometry for determining the optical parameters of typical automotive paints on both metal and plastic substrates. Ellipsometry is self-referencing and provides the possibility of evaluating the complex refractive index and the layer thickness at the same time. The resulting dispersion curves can be used in the evaluation of thickness measurements with THz time-domain reflectometry on multi-layer car body paints with high accuracy. Thus, the combination of both measurement techniques allows for fast and precise quality control of paint thicknesses in production environments.
In addition, we have demonstrated that anisotropic materials can be fully analyzed with THz ellipsometry. Up to now, thickness measurements of car body paints on anisotropic substrates were based on THz reflectometry only, which is unable to measure the out-of-plane refractive index. However, the out-of-plane refractive index is important in many cases: First, if the substrate thickness has to be measured simultaneously with the thickness of all paint layers. Second, if the absolute transmission and/or reflection values for different angles of incidences and polarizations are of interest. This information is extremely important for radar transmission/reflection, which becomes even more relevant in the context of autonomous driving.
Furthermore, the presented methodology can also be used for characterizing complex, unknown materials in research and development applications. The combination of THz TDS ellipsometry with THz TDS transmission and reflectometry measurements enable material characterization with extremely high accuracy.
Nevertheless, the thickness and dispersion results of the proposed methodology have to be verified with other measurement methods, if the optical constants of the material under test are not precisely known. Because THz TDS measurements are indirect measurements, the results depend strongly on the choice of a suitable model. After verifying the correctness of the model with complementary techniques, the proposed methodology allows high precision sample characterizations.
Outlook:
In future, we are planning to reduce the spot size of the ellipsometer to a value comparable to standard THz TDS reflectometers (~1 mm) by adding additional focusing optics. Moreover, we would like to introduce a variable angle of incidence. The highest sensitivity of ellipsometric measurements is obtained close to the Brewster angle, which is material dependent. Therefore, multi-layer samples should be characterized under different angles of incidence, in order to further increase the accuracy of the measurement.

Author Contributions

Conceptualization, H.K. and R.M.; Development of THz components: L.L. and R.K., Methodology, H.K.; Software, H.K.; Validation, H.K., Formal analysis, H.K.; Investigation, H.K.; Resources, R.M.; Data curation, H.K.; Writing—original draft preparation, H.K.; Writing—review and editing, H.K., B.G., L.L., R.K. and R.M.; Visualization, H.K.; Supervision, R.M., B.G.; Funding acquisition, B.G. All authors have read and agreed to the published version of the manuscript.

Funding

This work was funded by Deutsche Forschungsgesellschaft (DFG) under Grant Nos. GL 958/1-2.

Institutional Review Board Statement

Not applicable.

Informed Consent Statement

Not applicable.

Data Availability Statement

Data are contained within the article.

Conflicts of Interest

The authors declare no conflict of interest.

References

  1. Ellrich, F.; Bauer, M.; Schreiner, N.; Keil, A.; Pfeiffer, T.; Klier, J.; Weber, S.; Jonuscheit, J.; Friedrich, F.; Molter, D. Terahertz Quality Inspection for Automotive and Aviation Industries. J. Infrared Millim. Terahertz Waves 2020, 41, 470–489. [Google Scholar] [CrossRef] [Green Version]
  2. Izutani, Y.; Akagi, M.; Kitagishi, K. Measurements of paint thickness of automobiles by using THz time-domain spectroscopy. In Proceedings of the 2012 37th International Conference on Infrared, Millimeter, and Terahertz Waves, Wollongong, NSW, Australia, 23–28 September 2012; pp. 1–2. [Google Scholar]
  3. Krimi, S.; Klier, J.; Herrmann, M.; Jonuscheit, J.; Beigang, R. Inline multilayer thickness sensing by using terahertz time-domain spectroscopy in reflection geometry. In Proceedings of the 2013 38th International Conference on Infrared, Millimeter, and Terahertz Waves, Mainz, Germany, 1–6 September 2013; pp. 1–2. [Google Scholar]
  4. Van Mechelen, J.L.M.; Kuzmenko, A.B.; Merbold, H. Stratified dispersive model for material characterization using terahertz time-domain spectroscopy. Opt. Lett. 2014, 39, 3853–3856. [Google Scholar] [CrossRef] [PubMed] [Green Version]
  5. Su, K.; Shen, Y.-C.; Zeitler, J.A. Terahertz Sensor for Non-Contact Thickness and Quality Measurement of Automobile Paints of Varying Complexity. IEEE Trans. Terahertz Sci. Technol. 2014, 4, 432–439. [Google Scholar] [CrossRef]
  6. Hernandez-Serrano, A.I.; Castro-Camus, E. Determination of automobile paint thickness using non-contact THz TDS technique. In Proceedings of the 2015 40th International Conference on Infrared, Millimeter, and Terahertz Waves, Hong Kong, China, 23–28 August 2015; p. 1. [Google Scholar]
  7. Ellrich, F.; Klier, J.; Weber, S.; Jonuscheit, J.; Freymann, G. Terahertz time-domain technology for thickness determination of industrial relevant multi-layer coatings. In Proceedings of the 2016 41st International Conference on Infrared, Millimeter, and Terahertz Waves, Copenhagen, Denmark, 25–30 September 2016; pp. 1–2. [Google Scholar]
  8. Krimi, S.; Torosyan, G.; Beigang, R. Advanced GPU-Based terahertz Approach for In-Line Multilayer Thickness Measurements. IEEE J. Sel. Top. Quantum Electron. 2017, 23, 1–12. [Google Scholar] [CrossRef]
  9. Duvillaret, L.; Garet, F.; Coutaz, J.-L. Highly precise determination of optical constants and sample thickness in terahertz time-domain spectroscopy. Appl. Opt. 1999, 38, 409–415. [Google Scholar] [CrossRef]
  10. Li, M.; Fortin, J.; Kim, J.Y.; Fox, G.; Chu, F.; Davenport, T.; Lu, T.-M.; Zhang, X.-C. Dielectric Constant Measurement of Thin Films Using Goniometric Terahertz Time-Domain Spectroscopy. IEEE J. Sel. Top. Quantum Electron. 2001, 7, 624–629. [Google Scholar]
  11. Scheller, M. Real-time terahertz material characterization by numerical three-dimensional optimization. Opt. Express 2011, 19, 10647–10655. [Google Scholar] [CrossRef]
  12. Hejase, J.A.; Rothwell, E.J.; Chahal, P. A multiple Angle Method for THz Time-Domain Material Characterization. IEEE Trans. Terahertz Sci. Technol. 2013, 3, 656–665. [Google Scholar] [CrossRef]
  13. Scheller, M. Data Extraction from Terahertz Time Domain Spectroscopy Measurements. J. Infrared Millim. Terahertz Waves 2014, 35, 638–648. [Google Scholar] [CrossRef]
  14. Bernier, M.; Garet, F.; Kato, E.; Blampey, B.; Coutaz, J.-L. Comparative Study of Material Parameter Extraction Using Terahertz Time-Domain Spectroscopy in Transmission and in Reflection. J. Infrared Millim. Terahertz Waves 2018, 39, 349–366. [Google Scholar] [CrossRef]
  15. Krimi, S.; Klier, J.; Jonuscheit, J.; von Freymann, G.; Urbansky, R.; Beigang, R. Highly accurate thickness measurement of multi-layered automotive paints using terahertz technology. Appl. Phys. Lett. 2016, 109, 021105. [Google Scholar] [CrossRef]
  16. Taschin, A.; Bartolini, P.; Tasseva, J.; Torre, R. THz time-domain spectroscopic investigations of thin films. Measurement 2018, 118, 282–288. [Google Scholar] [CrossRef] [Green Version]
  17. Röseler, A. IR spectroscopic ellipsometry: Instrumentation and results. Thin Solid Films 1993, 234, 307–313. [Google Scholar] [CrossRef]
  18. Jellison, G.E., Jr. The calculation of thin film parameters from spectroscopic ellipsometry data. Thin Solid Films 1996, 290–291, 40–45. [Google Scholar] [CrossRef] [Green Version]
  19. Schubert, M. Generalized ellipsometry and complex optical system. Thin Solid Films 1998, 313–314, 323–332. [Google Scholar] [CrossRef]
  20. Collins, R.W.; Koh, J.; Fujiwara, H.; Rovira, P.I.; Ferlauto, A.S.; Zapien, J.A.; Wromski, C.R.; Messier, R. Recent progress in thin film growth analysis by multichannel spectroscopic ellipsometry. Appl. Surf. Sci. 2000, 154–155, 217–228. [Google Scholar] [CrossRef]
  21. Aspnes, D.E. Expanding horizons: New developments in ellipsometry and polarimetry. Thin Solid Films 2004, 455–456, 3–13. [Google Scholar] [CrossRef]
  22. Birch, J.R. The Absolute Determination of Complex Reflectivity. Infrared Phys. 1978, 18, 613–620. [Google Scholar] [CrossRef]
  23. Gatesman, A.J.; Giles, R.H.; Waldman, J. High-precision reflectometer for submillimeter wavelengths. J. Opt. Soc. Am. B 1995, 12, 212–219. [Google Scholar] [CrossRef]
  24. Neshat, M.; Armitage, N.P. Developments in THz range ellipsometry. J. Infrared Millim. Terahertz Waves 2013, 34, 682–708. [Google Scholar] [CrossRef] [Green Version]
  25. Nagashima, T.; Hangyo, M. Measurement of complex optical constants of a highly doped Si wafer using terahertz ellipsometry. Appl. Phys. Lett. 2001, 79, 3017–3019. [Google Scholar] [CrossRef] [Green Version]
  26. Matsumoto, N.; Fujii, T.; Kageyama, K.; Takagi, H.; Nagashima, T.; Hangyo, M. Measurement of the Soft-Mode Dispersion in SrTiO3 by Terahertz Time-Domain Spectroscopic Ellipsometry. Jpn. J. Appl. Phys. 2009, 48, 09KC11. [Google Scholar] [CrossRef]
  27. Iwata, T.; Uemura, H.; Mizutani, Y.; Yasui, T. Double-modulation reflection-type terahertz ellipsometer for measuring the thickness of a thin paint coating. Opt. Express 2014, 22, 20595–20606. [Google Scholar] [CrossRef]
  28. Chen, X.; Parrott, E.P.J.; Huang, Z.; Chan, H.-P.; Pickwell-MacPherson, E. Robust and accurate terahertz time-domain spectroscopic ellipsometry. Photonics Res. 2018, 6, 768–775. [Google Scholar] [CrossRef] [Green Version]
  29. Guo, Q.; Zhang, Y.; Lyu, Z.; Zhang, D.; Huang, Y.; Meng, C.; Zhao, Z.; Yuan, J. THz Time-Domain Spectroscopic Ellipsometry with Simultaneous Measurements of Orthogonal Polarizations. IEEE Trans. Terahertz Sci. Technol. 2019, 9, 422–429. [Google Scholar] [CrossRef] [Green Version]
  30. Agulto, V.C.; Iwamoto, T.; Kitahara, H. Terahertz time-domain ellipsometry with high precision for the evaluation of GaN crystals with carrier densities up to 1020 cm−3. Sci. Rep. 2021, 11, 18129. [Google Scholar] [CrossRef]
  31. Matsumoto, N.; Hosokura, T.; Nagashima, T.; Hangyo, M. Measurement of the dielectric constant of thin films by terahertz time-domain spectroscopic ellipsometry. Opt. Lett. 2011, 36, 265–267. [Google Scholar] [CrossRef]
  32. Lucarini, V.; Ino, Y.; Peiponen, K.-E.; Kuwata-Gonokami, M. Detection and correction of the misplacement error in terahertz spectroscopy by application of singly subtractive Kramers-Kronig relations. Phy. Rev. B 2005, 72, 125107. [Google Scholar] [CrossRef] [Green Version]
  33. Vartiainen, E.M.; Peiponen, K.-E.; Asakura, T. Phase Retrieval in Optical Spectroscopy: Resolving Optical Constants from Power Spectra. Appl. Spectrosc. 1996, 50, 1283–1289. [Google Scholar] [CrossRef]
  34. Vartiainen, E.M.; Ino, Y.; Shimano, R.; Kuwata-Gonokami, M.; Svirko, Y.P.; Peiponen, K.-E. Numerical phase correction method for terahertz time-domain reflection spectroscopy. J. Appl. Phys. 2004, 96, 4171–4175. [Google Scholar] [CrossRef]
  35. Kohlhaas, R.; Breuer, S.; Liebermeister, L.; Nellen, S.; Deumer, M.; Semtsiv, M.P.; Masselink, T.; Globisch, B. 637 µW emitted terahertz power from photoconductive antennas based on rhodium doped InGaAs. Appl. Phys. Lett. 2020, 117, 131105. [Google Scholar] [CrossRef]
  36. Kohlhaas, R.B.; Breuer, S.; Mutschall, S.; Kehrt, M.; Nellen, S.; Liebermeister, L.; Schell, M.; Globisch, B. Fiber Coupled THz Time-Domain Spectrometer with 10 THz Bandwidth. In Proceedings of the 2021 46th International Conference on Infrared, Millimeter, and Terahertz Waves, Chengdu, China, 29 August–3 September 2021; pp. 1–2. [Google Scholar]
  37. Neshat, M.; Armitage, N.P. Improved measurement of polarization state in terahertz polarization spectroscopy. Opt. Lett. 2012, 37, 1811–1813. [Google Scholar] [CrossRef]
  38. Neshat, M.; Armitage, N.P. Terahertz time-domain spectroscopic ellipsometry: Instrumentation and calibration. Opt. Express 2012, 20, 29063–29075. [Google Scholar] [CrossRef]
  39. Tompkins, H.G.; Irene, E.A. Handbook of Ellipsometry; William Andrew Publishing: Norwich, NY, USA; Springer-Verlag GmbH & Co. KG: Heidelberg, Germany, 2005; pp. 77, 282. [Google Scholar]
  40. Liebermeister, L.; Nellen, S.; Kohlhaas, R.B.; Lauck, S.; Deumer, M.; Breuer, S.; Schell, M.; Globisch, B. Terahertz Multilayer Thickness Measurements: Comparison of Optoelectronic Time and Frequency Domain Systems. J. Infrared Millim. Terahertz Waves 2021, 42, 1153–1167. [Google Scholar] [CrossRef]
  41. Scheller, M.; Koch, M. Fast and Accurate Thickness Determination of Unknown Materials using Terahertz Time Domain Spectroscopy. J. Infrared Millim. Terahertz Waves 2009, 30, 762–769. [Google Scholar] [CrossRef]
  42. Stoik, C.D.; Bohn, M.J.; Blackshire, L. Nondestructive evaluation of aircraft composites using transmissive time domain spectroscopy. Opt. Express 2008, 16, 17039–17051. [Google Scholar] [CrossRef]
  43. Chudpooti, N.; Duangrit, N.; Burnett, A.D.; Freeman, J.R.; Gill, T.B.; Phongcharoenpanich, C.; Imberg, U.; Torrungrueng, D.; Akkaraekthalin, P.; Robertson, I.D.; et al. Wideband dielectric properties of silicon and glass substrates for terahertz integrated circuits and microsystems. Mater. Res. Express 2021, 8, 056201. [Google Scholar] [CrossRef]
  44. Fujiwara, H. Spectroscopic Ellipsometry—Principles and Applications; John Wiley & Sons Ltd.: Chichchester, UK, 2007; pp. 209–246. [Google Scholar]
Figure 1. Experimental setup of the ellipsometer: (a) Schematic diagram. The system is composed of a fiber-coupled emitter (FCE), two off-axis parabolic mirrors (OAP), four apertures (AP), two wire grid polarizers (WGP) mounted on rotary stages, a sample (S) illuminated at φ = 70° angle of incidence and a fiber-coupled detector (FCD). The beam path is housed (H) for dry air purging; (b) Photograph of the designed THz time-domain ellipsometer.
Applsci 12 03744 g001
Figure 2. Model of a three-layer system on a PP/metal substrate. Transmission and backside reflection (dashed lines) only occur for the transparent PP substrate.
Applsci 12 03744 g002
Figure 3. Dispersions of the refractive index and the absorption for the E-coat, the BC layer and the CC layer.
Applsci 12 03744 g003
Figure 4. Ellipsometric measurement (black and blue) and fitted model (red) of the CC single layer on a metal substrate.
Applsci 12 03744 g004
Figure 5. Stack calibration of the BC layer as part of the full stack on a metal substrate: (a) Ellipsometric measurement (black) and best fit of the theoretical model (red); (b) Dispersion based on the ellipsometric measurement shown in (a).
Applsci 12 03744 g005aApplsci 12 03744 g005b
Figure 6. Reflection measurement (black) and fitted model (red) of the full three-layer stack on a metal substrate.
Applsci 12 03744 g006
Figure 7. THz TDS measurement in reflection geometry on a plastic substrate. For evaluation without backside reflection, the signal outside the green box was set to zero. For evaluation with backside reflection, the signal outside the blue box was set to zero.
Applsci 12 03744 g007
Figure 8. Substrate calibration: (a) Reflectometric measurement and theoretical model at 8° angle of incidence without accounting for the backside reflection in s-polarization; (b) Reflectometric measurement and theory at 8° angle of incidence with backside reflection for s-polarization; (c) Transmission measurement and theory at 0° angle of incidence.
Applsci 12 03744 g008aApplsci 12 03744 g008bApplsci 12 03744 g008c
Figure 9. Substrate calibration: (a) Ellipsometric measurement (black) and theoretical model (red) at 70° angle of incidence with backside reflection; (b) Resulting in-plane nxy and out-of-plane nz dispersion.
Applsci 12 03744 g009aApplsci 12 03744 g009b
Figure 10. Measurement of anisotropic materials with angle of incidence φ: e.g., negative uniaxial material with nx = ny > nz.
Applsci 12 03744 g010
Figure 11. TDS signal of the multi-layer measurement on an anisotropic plastic substrate. For evaluation without backside reflection, the signal outside the green box was set to zero. For evaluation with backside reflection, the signal outside the blue box was set to zero.
Applsci 12 03744 g011
Figure 12. Characterization of the three-layer paint stack on an anisotropic plastic substrate in reflection geometry: (a) Reflectometric measurement and theory at 8° angle of incidence without backside reflection; (b) Reflectometric measurement and theory at 8° angle of incidence with backside reflection allowing the determination of all layer thicknesses and the substrate thickness.
Applsci 12 03744 g012aApplsci 12 03744 g012b
Table 1. Thickness results of a three-layer paint on a metal substrate.
LayerTHz Ellipsometry
(µm)
THz Reflectometry
(µm)
Confocal Microscope
(µm)
Clear coat (CC)39.5 ± 0.239.6 ± 0.140.0 ± 0.9
Base coat (BC)44.9 ± 0.442.8 ± 0.1-
E-coat17.1 ± 0.518.1 ± 0.1-
Table 2. Thickness results of a three-layer paint on an anisotropic plastic substrate.
LayerTHz Ellipsometry
(µm)
THz Reflectometry
(µm)
Confocal Microscope
(µm)
Clear coat (CC)32.2 ± 0.231.3 ± 0.132 µm ± 1.6
Base coat (BC)14.2 ± 0.213.1 ± 0.1-
Primer12.2 ± 0.213.4 ± 0.1-
Substrate2940.5 ± 0.52937.0 ± 1-
Publisher’s Note: MDPI stays neutral with regard to jurisdictional claims in published maps and institutional affiliations.

