
Design of a System for Verification of Automatic Guided Vehicle Routes Using Computer Emulation


1
Department of Industrial Engineering, Faculty of Mechanical Engineering, University of Žilina, Univerzitná 8215/1, 010 26 Žilina, Slovakia
2
Asseco CEIT, a.s., Univerzitná 8661/6A, 010 08 Žilina, Slovakia
*
Author to whom correspondence should be addressed.
Appl. Sci. 2022, 12(7), 3397; https://doi.org/10.3390/app12073397
Submission received: 3 March 2022
/
Revised: 23 March 2022
/
Accepted: 24 March 2022
/
Published: 27 March 2022
(This article belongs to the Topic Modern Technologies and Manufacturing Systems)
Abstract
:A frequent change in the manufacturing program caused by a change in customer requirements requires a logistics system in the company that can respond flexibly to these changes. In order for business logistics to respond flexibly and optimally to the tasks created, a tool is needed to verify the functionality of the entire process. This article, at its core, deals with the use of emulation in a mixed environment of the real and virtual worlds as a tool for optimising automatic guided vehicle (AGV) routes. The main objective of the article is the design of a system that allows verification of AGV routes using computer emulation. The solution was created and programmed in the Tecnomatix Plant Simulation program, in cooperation with AGV logistics supply tractors, and tested on a logistic test circuit. The results show that the main area of application of such a solution is mainly in the area of the capacity utilisation of the AGVs that are used in internal logistics processes. This solution helps to cut down on the time it takes to design and optimise logistics operations as well as on the time it takes to test logistics systems at full capacity before commencing production.
1. Introduction
Current trends in manufacturing logistics development show that, in terms of logistics system productivity, the fastest, cheapest, and most efficient system wins. Manufacturing logistics can be defined as a system for managing the in-house movement of materials and goods, for managing the movement of materials and products from suppliers to the plant and to individual workplaces, and for the movement of products and semi-finished products from workplaces and plants to the customer [1]. When creating logistics chains, i.e., coordinating, connecting, and optimising material flow from the place of production to the place of consumption, a range of activities such as transport, packaging, material handling, and storage should be ensured [2]. While logistics equipment is used to provide this, among the most widespread is the automatic guided vehicle (AGV). An AGV is a computer-controlled cargo carrier that moves without an operator—the driver. Their movement is controlled by a combination of software and guidance systems that are based on sensors [3,4]. When logistics system designers design such a system, they aim to incorporate flexibility into their characteristics in the form of rapid adaptation to changing market conditions. The AGV as a system is also suitable for flexibility because its movement path can be changed within minutes depending on the changing priorities of the manufacturing system. The involvement of flexible logistics allows holding inventory at an optimal level in terms of minimum costs and increases possibilities during the scheduling process when unexpected events occur [5,6]. In order to achieve a certain degree of flexibility and the possibility of the reconfiguration of logistics processes, the incorporation of digital technologies contained in the concept of Industry 4.0 is essential. With the advent of digital technologies, there was a breakthrough in industry that has been called the digital factory. In addition to a real manufacturing system, businesses also have a digital manufacturing system represented by digital models mutually integrated into the digital factory. The main characteristic of a digital factory is its use of simulation [7,8]. A simulation is the imitation of the operation of a real-world process or system over time [9]. This makes it possible to use the digital model to conduct large-scale experiments with inputs from the model in order to detect the behaviour of a designed or real object [10]. The use of simulation is growing, especially in the fields of planning, implementing, and operating complex technical systems. Using a digital factory and the contained simulation makes it possible to analyse the efficiency of manufacturing systems before making a well-defined change in real operation. Industry 4.0 brings the implementation of technologies such as the Industrial Internet of Things (IIoT), cyber–physical systems, and simulations. In current logistics systems, a huge amount of data is generated as a result of the use of sensors [11]. By combining monitoring systems and parametric dynamic models, it is possible to mirror the behaviour of the real world based on impulses from the virtual environment [12]. For real objects, their virtual representatives are created, which we now refer to as digital twins. The virtual model thus created (a digital twin) can be used in all phases of the development, operation, and improvement of the product. The entire development and most of the tests can be implemented through virtual testing and simulations using the digital model. The current turbulent environment requires new approaches (both exact and approximative), i.e., those that are robust, fast enough, and functional enough to support executive decision-making, particularly in the area of bottleneck prevention [13]. One of the many progressive methods that finds application in the control of modern complex systems is the emulation of manufacturing and logistics systems. The static planning of logistics resources can predict their utilisation at a certain point in time [14]. Flexible logistics need to be predicted based on real-world conditions [15]. The fundamental distinction between simulation, the digital twin, and emulation is that the simulation is the realisation of system future-state forecast, whereas the digital twin represents a model digital object that, with its state and attributes, is identical to the real object that was modelled, and emulation is the realisation of simulation in real time with the digital twin and other emulated (digital) objects. The basic idea of emulation is the possibility of replacing the missing elements from the manufacturing system created by their simulation model, which is subsequently linked to existing real elements [16]. The simulation model thus becomes a full-fledged replacement of the real (missing) module, or the elements of the complex simulation model are gradually replaced by real-world devices with the deployment of the relevant technologies [17]. The synergy of the deployment and cooperation of virtual and real elements in practice radically eliminates the waste caused by the need for changes in the system’s design, as all potential errors are localised and addressed significantly earlier than is currently the case [18]. Emulation can serve as a link between design and implementation, making the manufacturing process more efficient. Inspection can be carried out in the process earlier, leaving more time for process changes and troubleshooting. Such a comprehensive solution enables the future adaptation of real logistics systems with the support of a virtual environment. The authors of [19] conducted research where they used the emulation of the control system that integrates a simulation model with a real manufacturing control system. Based on statistics they obtained from the system, they were able to handle the expected rush of orders and helped refine the planning logistics that were used in the control system in real processes. Other authors [20] in their study looked at the emulation of the manufacturing system, which was proposed as one of the methods for frontloading at the implementation stage of the manufacturing system. The result of their research was the confirmation that the emulator world and the real world could be combined and synchronised using a manufacturing system emulator, real manufacturing system equipment, real controllers, and system control applications. Further research on emulation systems was conducted in [21]. As a result of their research, they found that every hour of testing in an emulated environment, more than 25% of the time otherwise needed for physical testing on the site was eliminated. All of the tests in the emulated environment resulted in a seamless transition from the old system to the new. The authors in [22] indicated that, thanks to emulation, the commissioning time for new layouts can be reduced by up to 50%, and the product can be put into manufacturing earlier than planned. In the field of logistics processes, emulation was devoted to work [23] that creates connections through the simulation software FLEXIM for solving tasks in logistics. The authors in [24,25] describe the involvement of emulation in logistics processes and the integration of the model with a physical object. There is, however, no single system that is capable of dealing not just with the specific interrelated phases, but also with the additional phases that occur in virtual commissioning and designing.
This article aims to present the outputs of a research project focused on designing a system that uses computer emulation in the verification of AGV routes in internal logistics, with a description of the achieved results. The innovative benefit of such a system lies in the ability of industrial production plants to respond to the need to test logistics systems in real conditions in the event of changes in production before the installation of equipment. As the main problem for the research, we chose the design of principles and solutions for an emulation system for ex ante verification of internal factory logistics systems using AGVs. The research hypothesis itself was that through emulation in a mixed environment of the real and virtual worlds, emulation could be used as a tool for optimising logistics systems. This article’s content is a detailed description of the proposed system and the verification of this system on the logistic test circuit, along with the results, and a description of the benefits that the solution represents in practice. The entire solution was created and programmed in the Tecnomatix Plant Simulation program in conjunction with the use of AGV logistics tractors. The solution was implemented both in the final phase and under real-world deployment conditions.
The structure of the article is conceived in two parts. The first part contains a description of the system for the verification of AGV routes using a computer simulation. The individual modules on which the whole system is based are described. The next section is dedicated to describing the integration of the modules into a single solution, with a description of the data collection process. The next chapter describes the solution that was created and through which the system was verified. The final chapter of the discussion assesses the results achieved from the initial hypotheses point of view. It also contains references to future research in the field of emulation, given the current state of the research. The last chapter summarises the results of the research carried out.
2. Materials and Methods
2.1. Designing a System for Verification of AGV Routes Using Computer Emulation
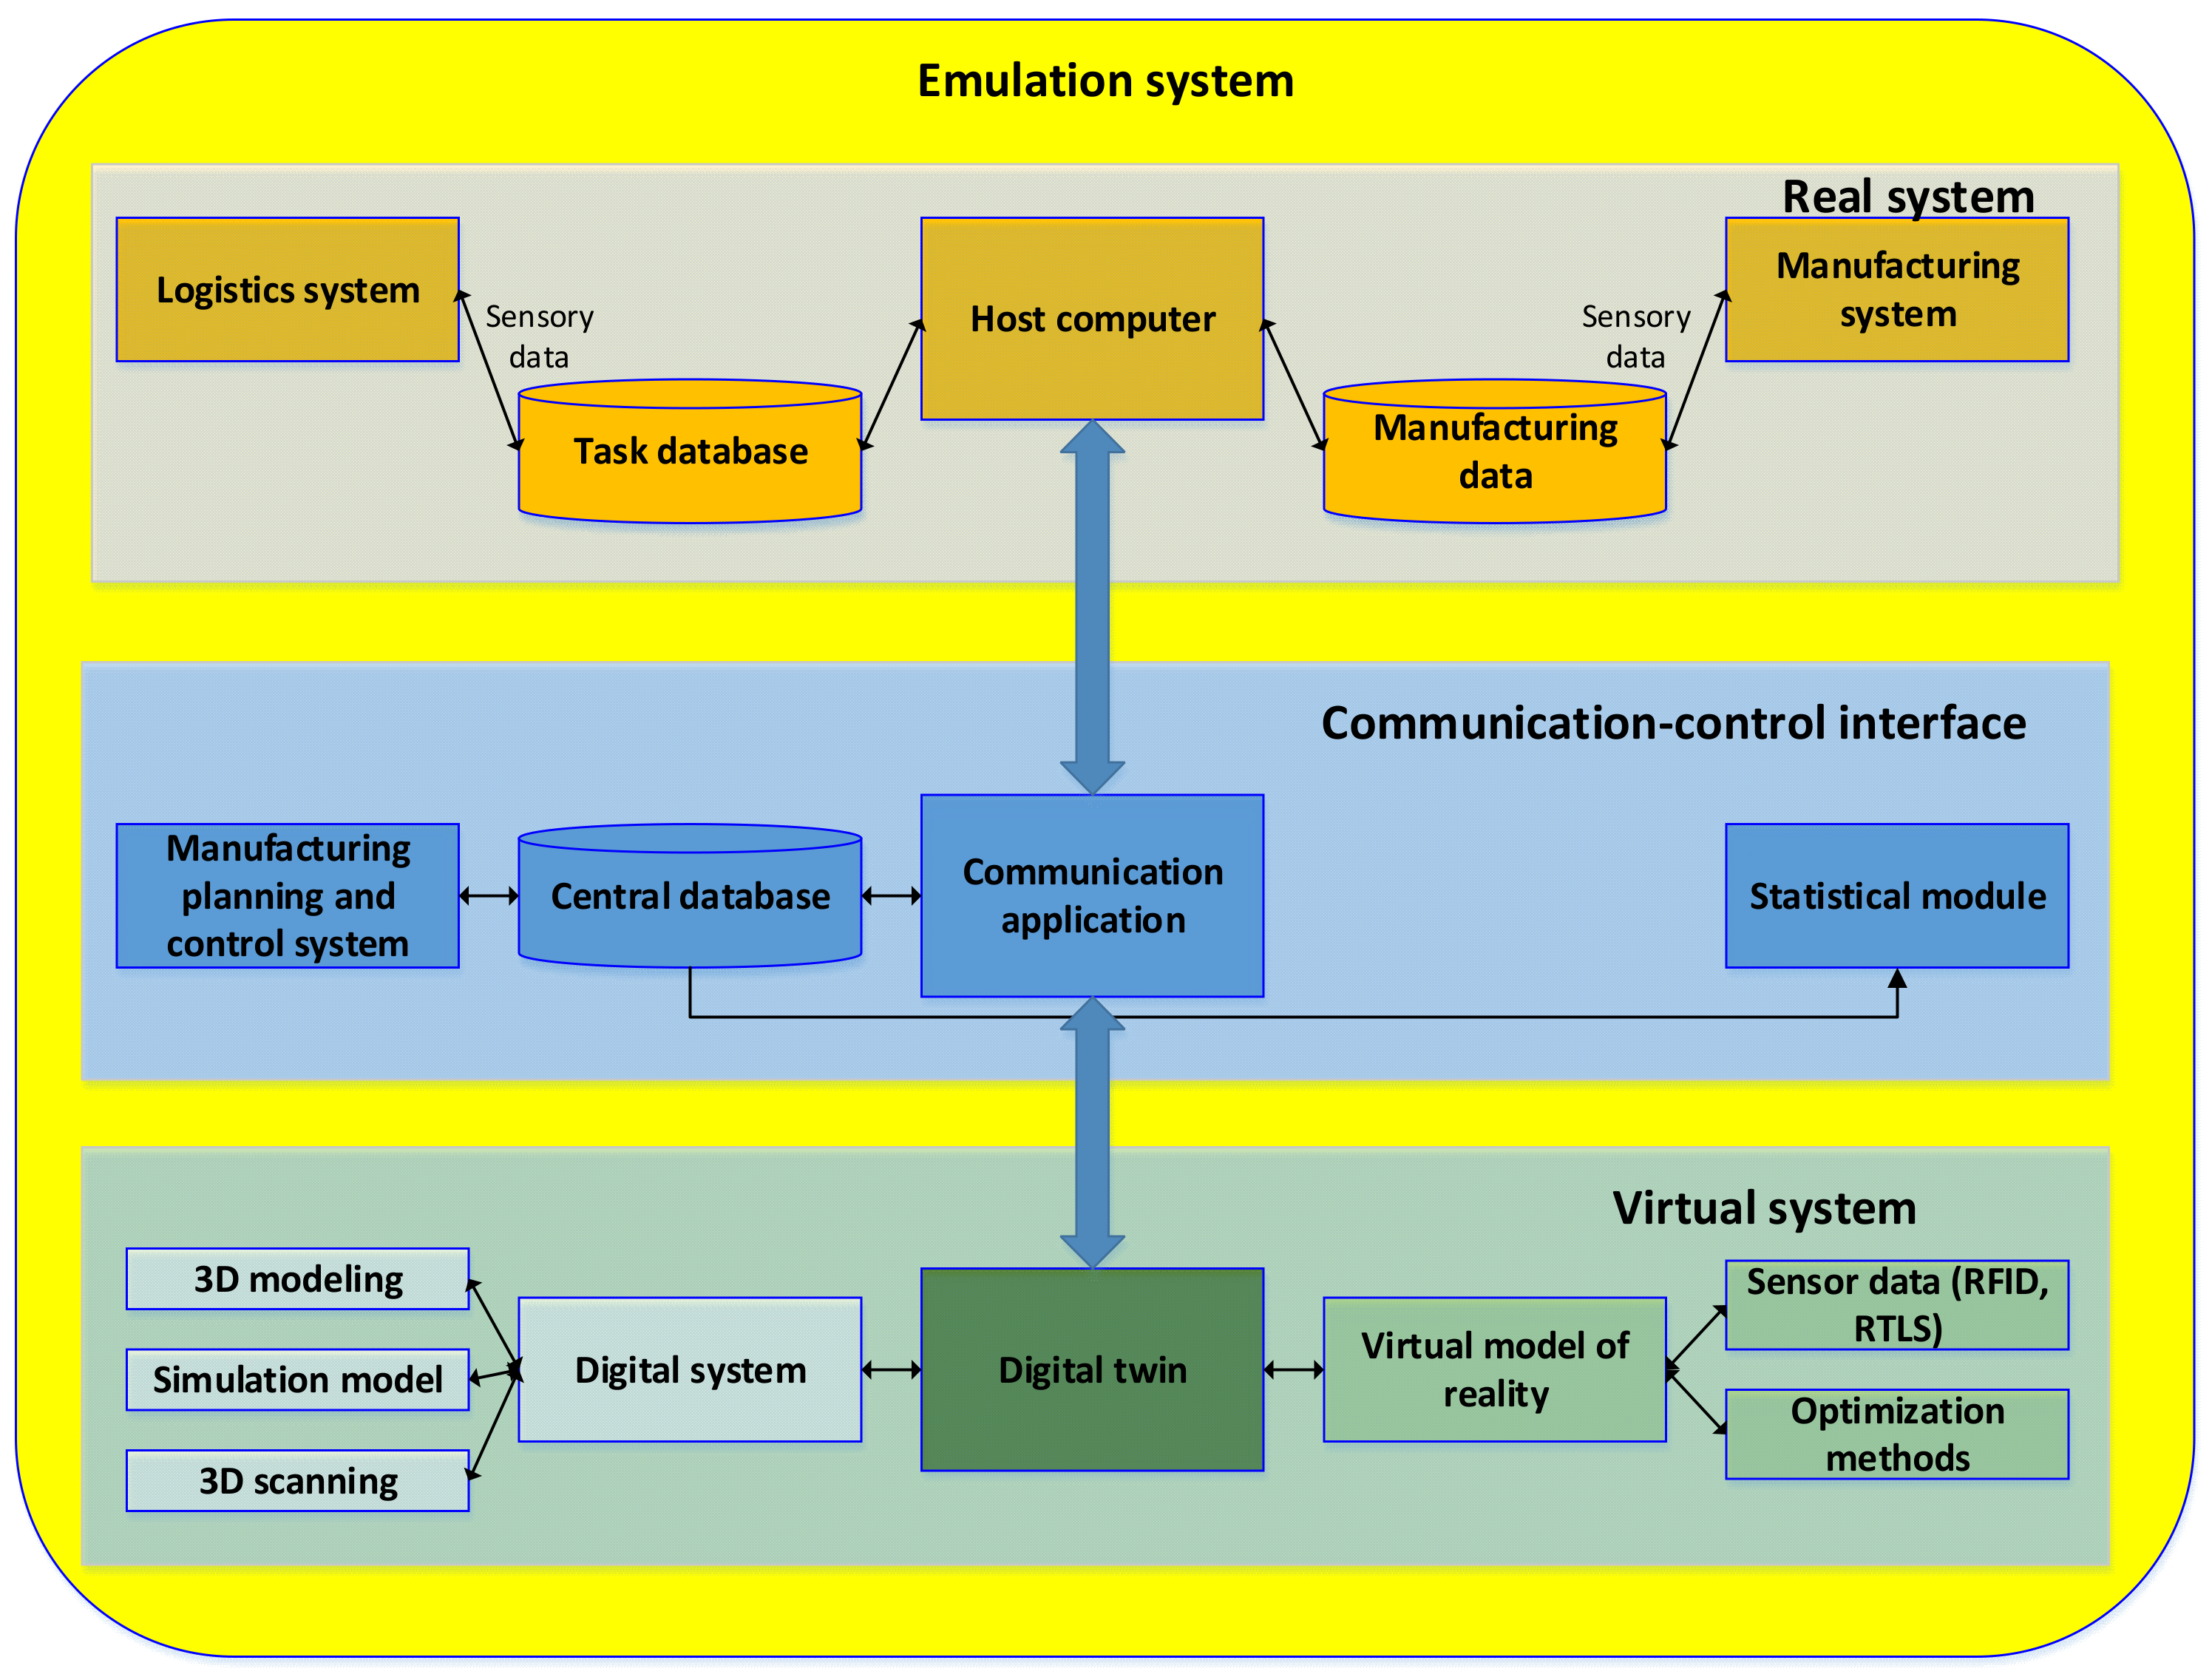
The proposed system for the verification of AGV routes using computer emulation comprises several partial components (modules) that communicate, process, and evaluate each other’s information while providing feedback. Subsequently, the solutions transform these sub-proposals into a comprehensive, integrated system. This system integrates computer simulation and the emulation of manufacturing, assembly, and logistics systems with modules for the communication of real logistics elements and virtual emulation models of manufacturing and assembly systems. Figure 1 depicts a simplified representation of the proposed integrated system structure.
The integrated system consists of three basic levels. The first level is made up of elements that represent real logistical handling equipment such as forklifts and automatically guided logistic tractors (Section 2.1.1). The second level consists of systems for 3D modelling, optimisation, and simulation of the manufacturing system, and for the visualisation of the system through immersive technologies depicting the virtual world [26] (Section 2.1.3 and Section 2.1.4). Between these two levels, there is a communication interface, the task of which is to transform the simulation model into an emulation model (Section 2.1.2).
The real system simulation model has been designed as a parametric model. The model’s parameters are quantities obtained from the real system through radio-frequency identification (RFID) tags, on which individual commands to be executed by the device during operation are programmed. Data from the real system is processed and stored in a Structured Query Language (SQL) database and subsequently transformed into a simulation/emulation model through software bridging.
These elements combine to form a functional unit that encapsulates the essential ideals of the digital manufacturing concept.
2.1.1. Structure of the Module Representing Real Logistical Elements
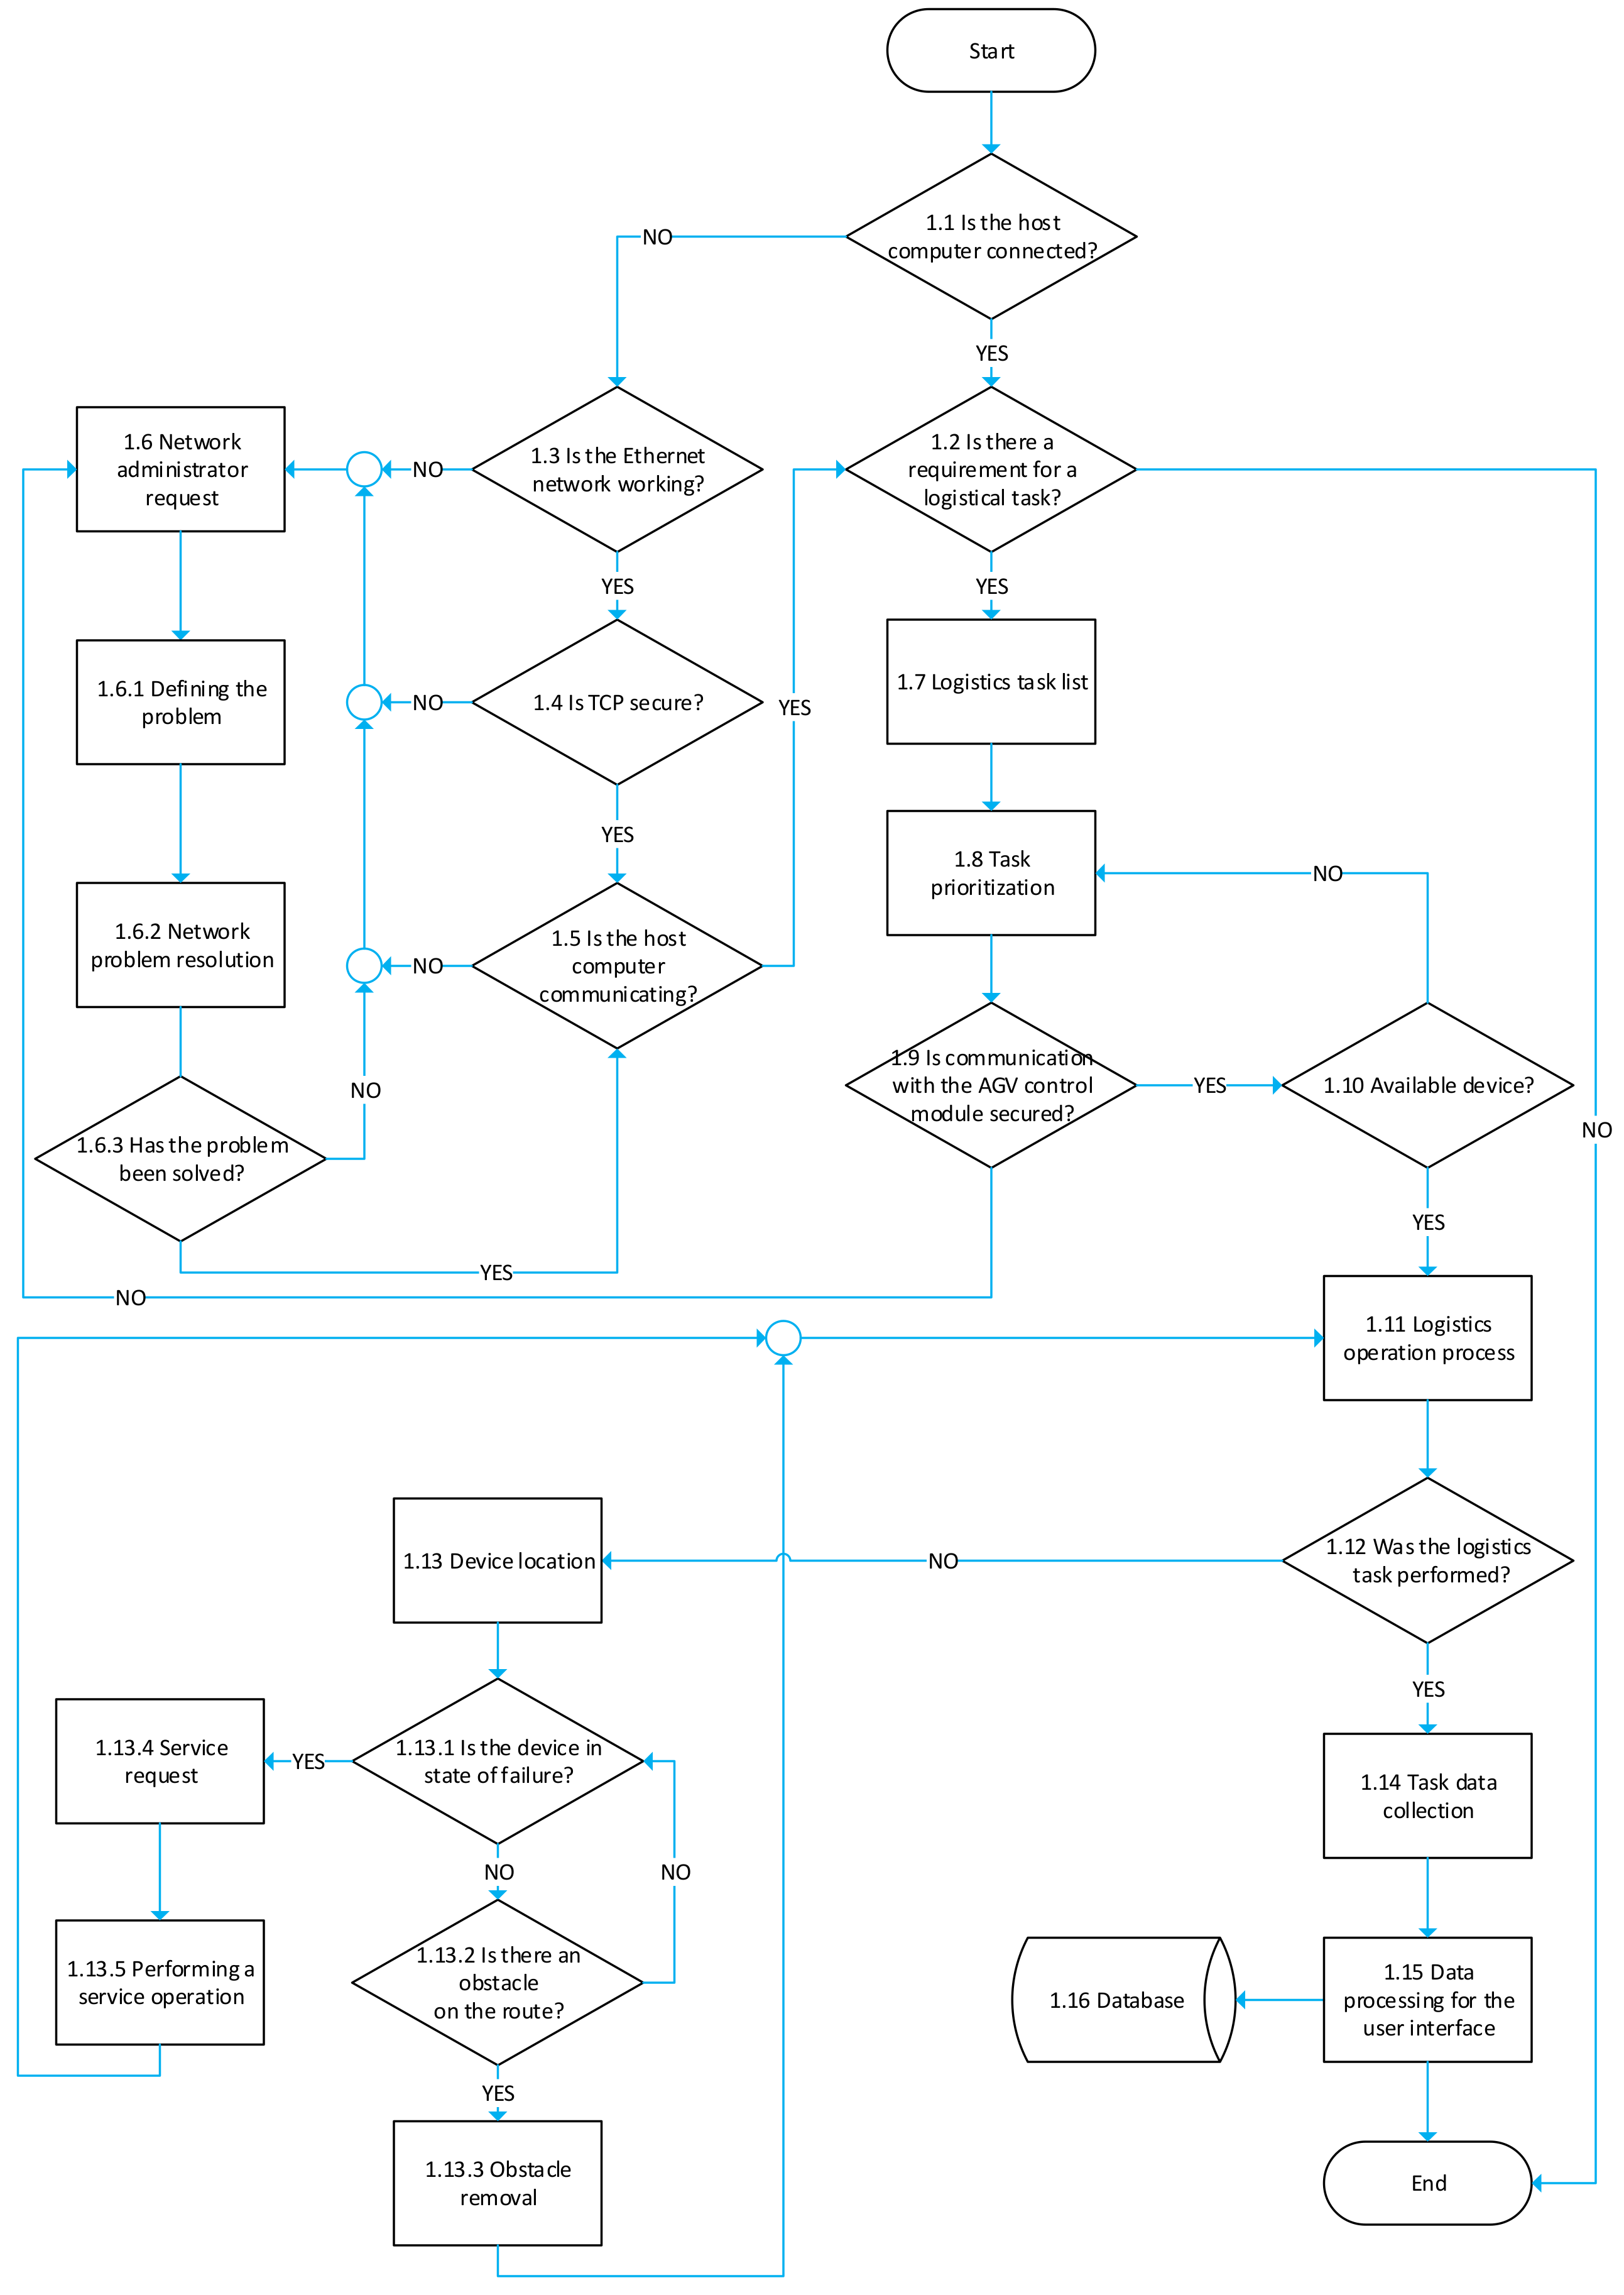
Logistics systems are often not only about moving material from one point to another according to a predefined track. It is a complex system composed of tractors, transhippers, or dynamic conveyors which bring the material to the necessary place exactly on time and load and unload it independently. Therefore, the system must actively process manufacturing data, react flexibly, and make decisions independently. The main advantages that AGVs offer are their flexibility, the possibility of wide use for the performance of activities, their use of space, security, and overall operating costs. For solving tasks in flexible logistics intended for industrial processes, AGVs were chosen for this the article due to these features. Also, from the deployment point of view, the AGV is one of the most widespread autonomous means of transport in industry and their deployment is possible in a wide range of internal logistics tasks. An AGV is a device that performs the function of a driverless, towing, motor tractor for transporting dynamic superstructures, dynamic tables, mobile conveyors, or peripheral handling. The AGV runs on a predetermined track (defined by default magnetic tape) on which it follows commands from RFID tags or from a superior control system. Batteries are the energy source and must be charged at charging stations during operation. Charging automatically occurs during stops between individual rides on a given circuit or by manually connecting the battery connector to the charger. Behind the AGV, wagons can be connected with the maximum width corresponding to the scanner setting and with all controlled axles to track the track of the tractor. The control system for AGVs is represented by a software solution that serves to manage the autonomous logistics resources active in the manufacturing process. Driving in this case also means avoiding collision states that limit or stop the movement of AGV tractors that are trying to cross a certain section of the track. As a rule, the control system is a set of operating system services running in the background. Thus, the task of the software solution is to automatically control the movement of individual AGV tractors, for example, through intersections, traffic lights, service points, and chargers without the need for human intervention. The algorithm of the control system for AGV is depicted in Figure 2. It shows how the information used in the creation of and the experiments in the virtual part of the logistics system is collected.
The AGV-tractor control process itself begins with connecting and creating communication between the host computer and the logistics element control module (Block 1.1). This communication is provided through an Ethernet network managed by the local network administrator, and if we are connected, then we continue to (Block 1.2). If there is a problem with the host computer connection based on the information obtained from the communication system, the problem is defined (Block 1.3) and its subsequent solution proposed. This approach also applies if the Ethernet network is in order. But there is a problem with the Transmission Control Protocol TCP (Block 1.4). TCP is a reliable, connection-oriented communication protocol in the transport layer, which transmits byte flow. The connective orientation is realised between two equal communication entities (computers). This means that in order to establish a connection at the TCP protocol level, it is necessary to have the option of binding the connection to the IP level, i.e., the IP addresses of the devices. Suppose a problem has been defined on the network communication side, or at the TCP level, and this issue has been resolved. In that case, communication between the host computer and the AGV control module is ensured (Block 1.5). Communication between the host computer and the AGV control module is ensured in this instance (Block 1.5). The host computer is connected. The status in the internal database is checked to see if it contains a logistical task request (Block 1.2). Where such a requirement exists, it shall be included in the list of transport tasks to be carried out (Block 1.7). This list collects information about inventory manufacturing and tracking requirements at individual logistics hubs. The information sent to the to-do list is personalised for a specific logistics node or logistics system, depending on the difficulty of the logistics system’s tasks. Based on this information, the process of prioritising individual tasks becomes necessary (Block 1.8). The prioritisation system is set up individually according to user-defined rules. The rules thus defined may consider the interconnections of individual logistics hubs for the maximum utilisation of logistical elements and the supply of bottlenecks and critical points to ensure continuous manufacturing. After creating a task execution plan, communication is established between the host computer and the already-selected logistics equipment that will perform the task (Block 1.9). Suppose the device is not available, either due to a malfunction or to performing another task (Block 1.10). In that case, the control system returns to the task prioritisation step, where a new logistical task is selected for another available device (Blok 1.8). After ensuring the availability of the logistics equipment, the process of performing the logistical task is initiated (Block 1.11). If the logistical task has not been fulfilled (Block 1.12), the location of the logistics element is necessary (Block 1.13). This localisation is possible through software solutions that collect movement information based on the RFID tag and real-time location system (RTLS). After (Block 1.13), we check the state of the device that was used in (Block 1.13.1–1.13.5). If the logistics task was performed, the data collection process is started (Block 1.14), which is also personalised according to the client’s requirements. This might contain information such as the state of the logistical means, statistics on the length of the logistical task, and inventory monitoring in particular logistics nodes. The information gathered in this manner is subsequently translated into a user-friendly format (Block 1.15) and transferred to an internal database for analysis (Block 1.16).
2.1.2. Structure of the Communication-Control Module
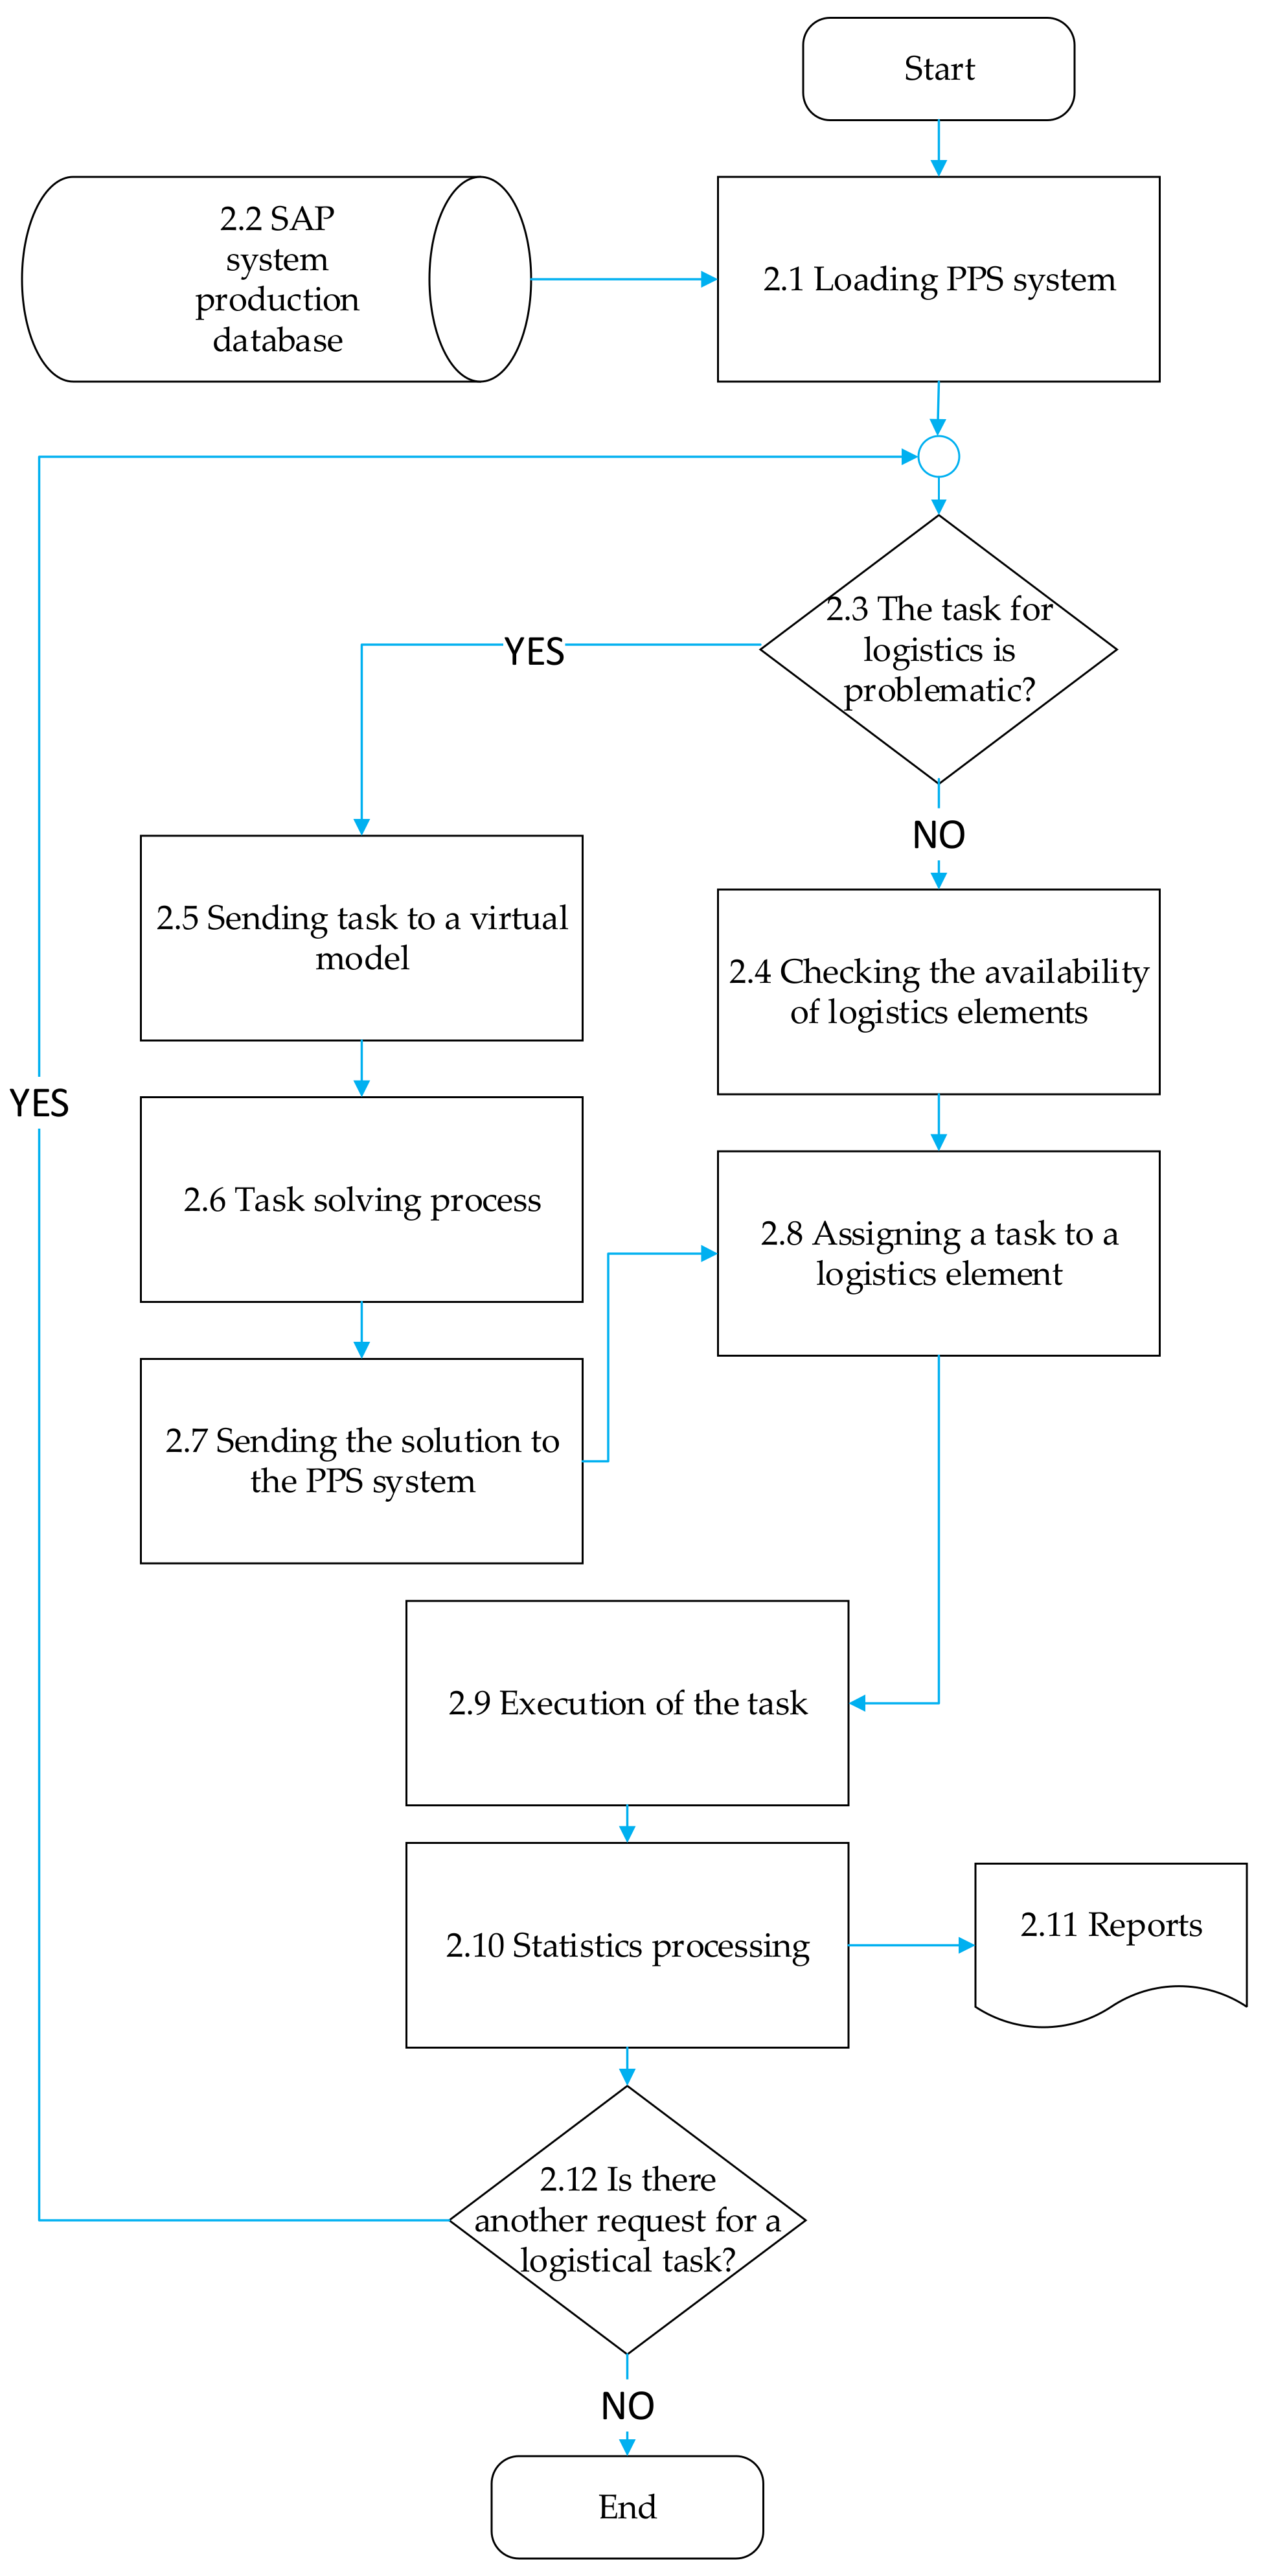
Between the real part of the logistics system and the virtual model of the manufacturing system, it is necessary to create a communication-control module that decides on the need to perform logistics tasks, and assigns them in the sequence. Decision-making is made in compliance with the deadlines of customer requirements, taking into account the capacity possibilities of the system. The alignment of customer requirements and capacity options is carried out by the production planning and control (PPC) system (Figure 3).
The first step is needed to load the data into the PPC system (Block 2.1). The system uses information from the internal factory information system, SAP (Block 2.2). Information about orders and inventory is retrieved from the SAP system database as needed. Subsequently, this information is processed by a manufacturing planning and control system through which a manufacturing plan is established. Based on this plan, we move to the decision-making module (Block 2.3) with the question of whether it is a standard manufacturing plan with a normal requirement for logistics processes or whether it is necessary to modify the manufacturing plan through a virtual model of the monitored system and to find a solution to the problem by changing the manufacturing plan or changing the logistics tasks. If the system evaluates the task as normal, the PPC system verifies the availability of logistics equipment (Block 2.4). Subsequently, the task is assigned to the logistical elements that perform it. If, through PPC, the task is evaluated as non-standard or based on customer requirements, it is a newly created problem. This task is sent to the virtual model of the system (Block 2.5). Once the problem has been resolved (Block 2.6), the solution is sent back to the PPC control system (Block 2.7). The system assigns the task to the selected logistical means based on the information received (Block 2.8). Subsequently, as with standard logistics requirements, the task execution process follows (Block 2.9). After execution, the resulting statistics are processed and subsequently interpreted (Block 2.10). The statistical information obtained is stored in the form of reports (Block 2.11), which serve as the basis for analyses and based on which the necessary decisions are made to optimise activities. If there are new requirements for logistics tasks after the tasks have been completed and the reports have been processed (Block 2.12), the next step is to return to the decision module and calculate the complexity of the logistic task. If there is no request for a new task, the processes in the control model can be terminated.
2.1.3. Structure of the System Representing the Virtual Part in the Logistics System
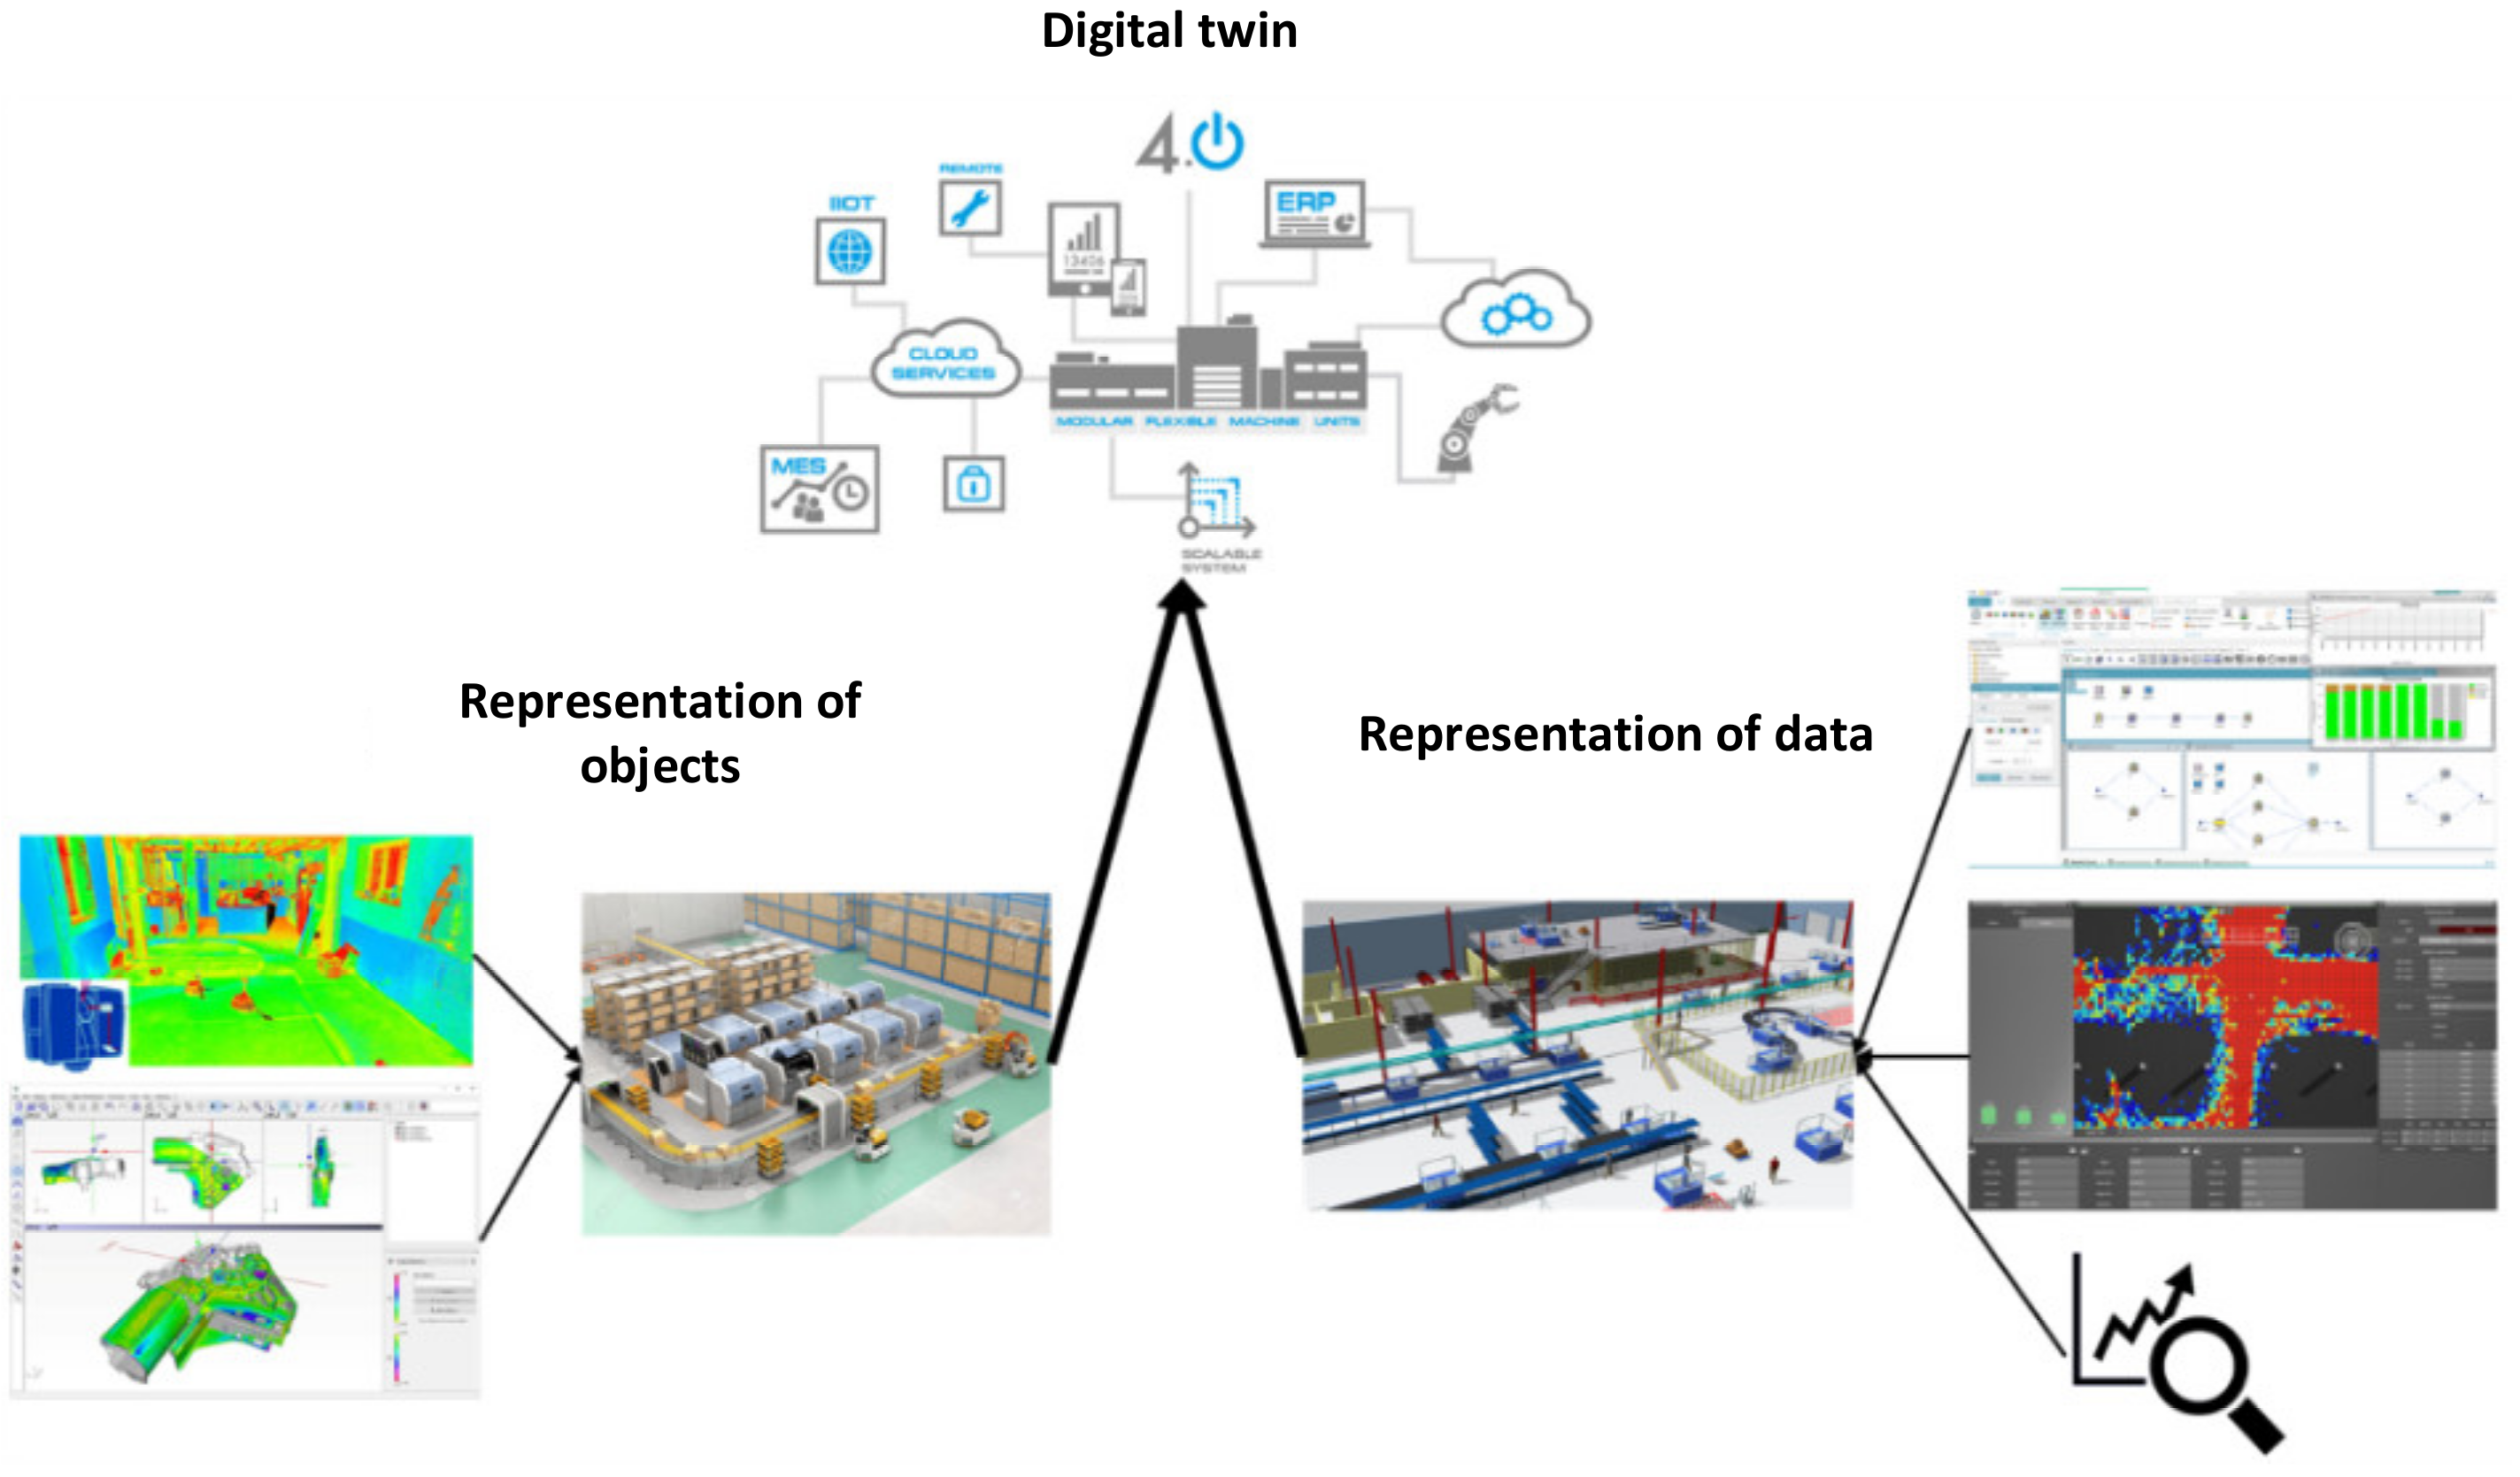
The current methods and procedures used in practice run into their limits due to the progressively exhausting potential. Optimisation of internal logistics is a constantly repeating process, while implementation is possible in different ways. Therefore, methods based on advanced technologies are increasingly starting to appear in practice. In practice, this application is represented by various paradigms, such as virtual factories or digital twins. The virtual model of the factory acts as a data representation of the real world. The data collected to create a virtual model of the logistics system are obtained from various sensors. The virtual model of the logistics system uses a set of tools such as mathematical and optimisation methods, probability and statistics, simulation, and emulation. The structure of the module of the virtual part of the logistics system, which represents the real logistics system through simulation, emulation, and optimisation methods, is shown in Figure 4.
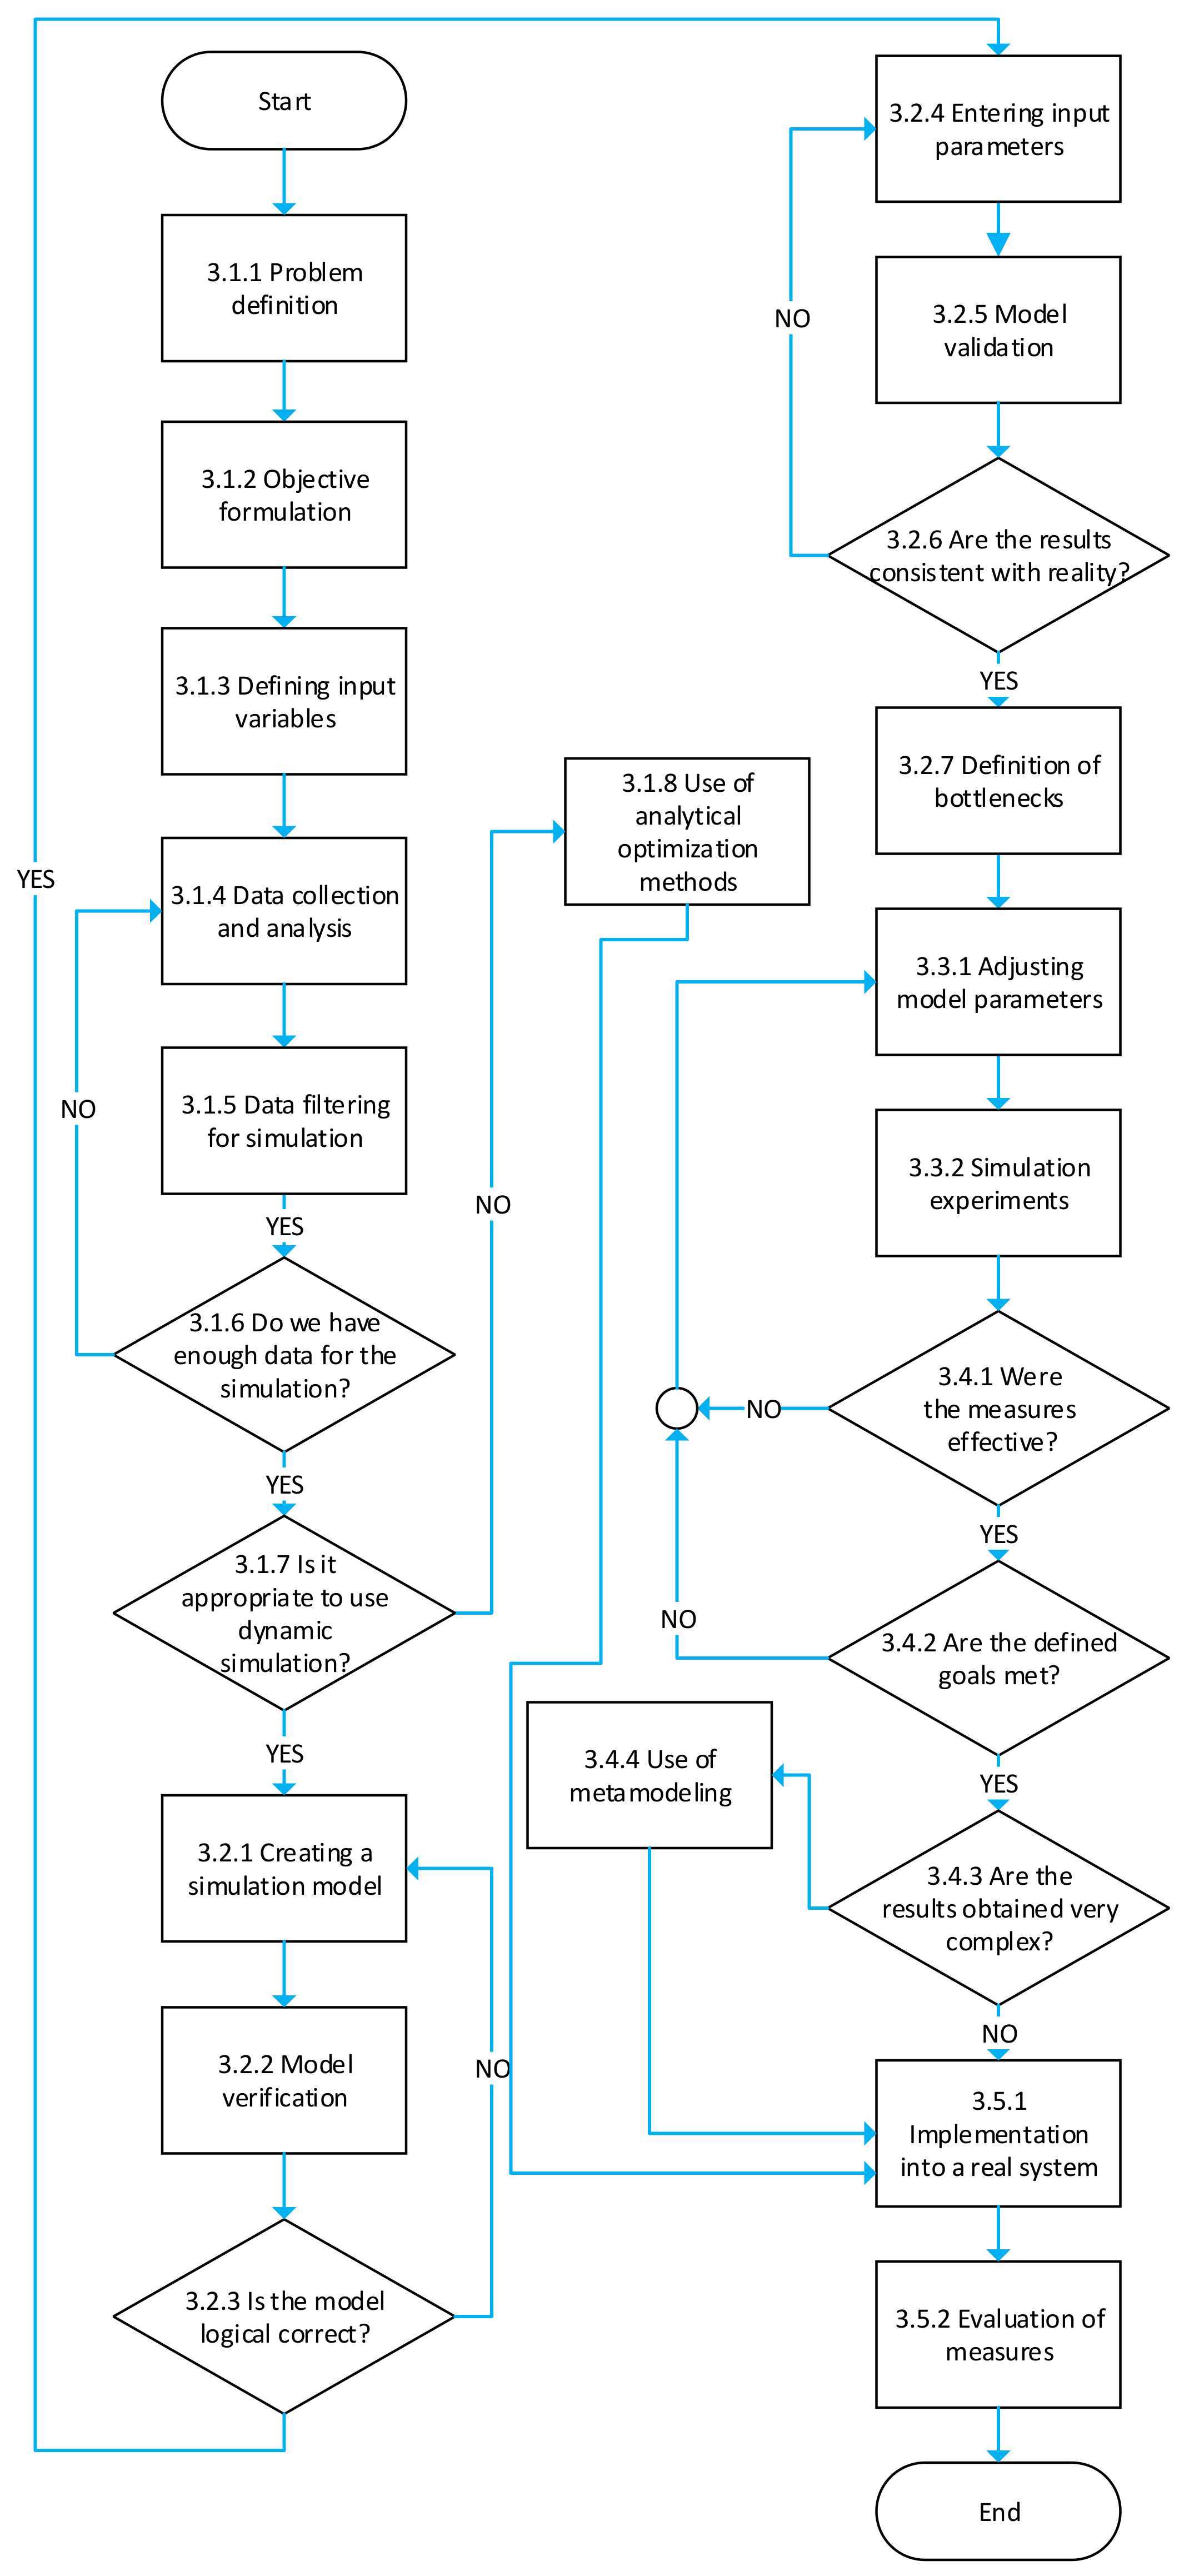
As part of our research, a simulation model of the logistics system was created, the essence of which lies in the fact that the investigated real-time dynamic logistics system was replaced by its simulation model. With this model, experiments were subsequently conducted to obtain information about the future behaviour of the real system. For the created simulation model, its verification and validation were verified. Subsequently, optimisation procedures were initiated using the simulation model. The proposed discrete simulation model thus provided information on how a given real system reacts to a change in input factors. However, the simulation model itself did not directly provide information on how the model factor levels should be set so that the system works in an optimal mode. The aim in formulating the concept of the proposed solution was to achieve a state such that, in the environment of the virtual model, it was possible to find the most suitable solution to the problem that arose. The simulation project preparation process can be divided into five partial components that each contain steps (see Figure 5).
Within the initial phase, the problems (Block 3.1.1) and expected objectives (Block 3.1.2) to be achieved by the simulation were clearly defined. Appropriate factors (independent variables), and their levels, as well as selected model parameters (dependent variables), were selected at this stage (Block 3.1.3). The obtained parameter (response) values were used to assess simulation outputs. This was followed by the collection and processing of data, including selecting appropriate adaptations or empirical distributions (Block 3.1.4). Then we filtered the data (Block 3.1.5) and evaluated its completeness for the model’s needs (Block 3.1.6). Based on the availability of data, the definition of the problem, and the objectives, it was necessary to evaluate the complexity of the problem under investigation (Block 3.1.7) and then to consider whether it was appropriate to solve the project using dynamic simulation or whether it was preferable to use analytical optimisation methods (Block 3.1.8). The second stage was represented by the creation of a simulation model (Block 3.2.1) and the verification of its properties. The created simulation model was verified in two steps: verification (Block 3.2.2) and validation (Block 3.2.5). Verification verified the correctness of the simulation model’s internal logic, i.e., whether the proposed simulation model accurately represented the structure and relationships of the modelled system (Block 3.2.3). The goal of validation was to ensure that the simulation model’s outputs matched the outputs of the simulated system, which was accomplished by considering the input variables and the corrections to them (3.2.4).
The validation of the model took place and took into account the purpose of the simulation model. The data for validation were extracted from the real system and compared with the outputs from the simulation model (Block 3.2.6). If they matched, bottlenecks could be defined (Block 3.2.7). In the case of a conceptual system, i.e., in the absence of a real system, theoretical predictions about the characteristics of the simulated system are used, and hypotheses about its behaviour are formulated. For validation, comparison of simulation model outputs with suitable mathematical models (e.g., analytical or regression models) is often used. An experimental phase followed the verification and validation of the model.
The third phase was represented by the preparation of simulation experiments and self-experimentation (Block 3.3.2). By preparing experiments in this case, we mean the planning of experiments, that is, determining the levels of the factors in their combinations and interactions. For each simulation run, this step defined a number of different model parameter options (experiment) (Block 3.3.1).
For self-experimentation, it was necessary to determine the initialisation conditions for simulation. These were determined within the pilot simulation runs. The following phase assessed the simulation model’s sensitivity to changes in the values of specified components.
Self-experimentation involves carrying out appropriate experiments. Appropriate statistics were collected within each simulation run. Each experiment was followed by an analysis of the results obtained in order to evaluate them and possibly modify further experiments. Based on the outputs of simulation runs, the bottlenecks of the modelled system were identified and measures were designed to eliminate them (for example, modification of factor levels, modification of the structure of the simulation model, or of the initiation conditions of the simulation). Following the execution of all scheduled simulation runs and the identification of an acceptable solution to the problem under investigation, simulation experimentation was completed.
The fourth stage was the analysis of summary statistics and the interpretation of the results obtained by simulation experimentation (Blocks 3.4.1–3.4.3). Based on the complexity of the obtained results, we could also choose metamodeling to achieve results that could be implemented (Block 3.4.4). The last stage was to apply what we had learned to improve the simulated system’s characteristics (Block 3.5.1) and measure the evaluation (Block 3.5.2).
2.1.4. Design of Simulation Models Using Emulation
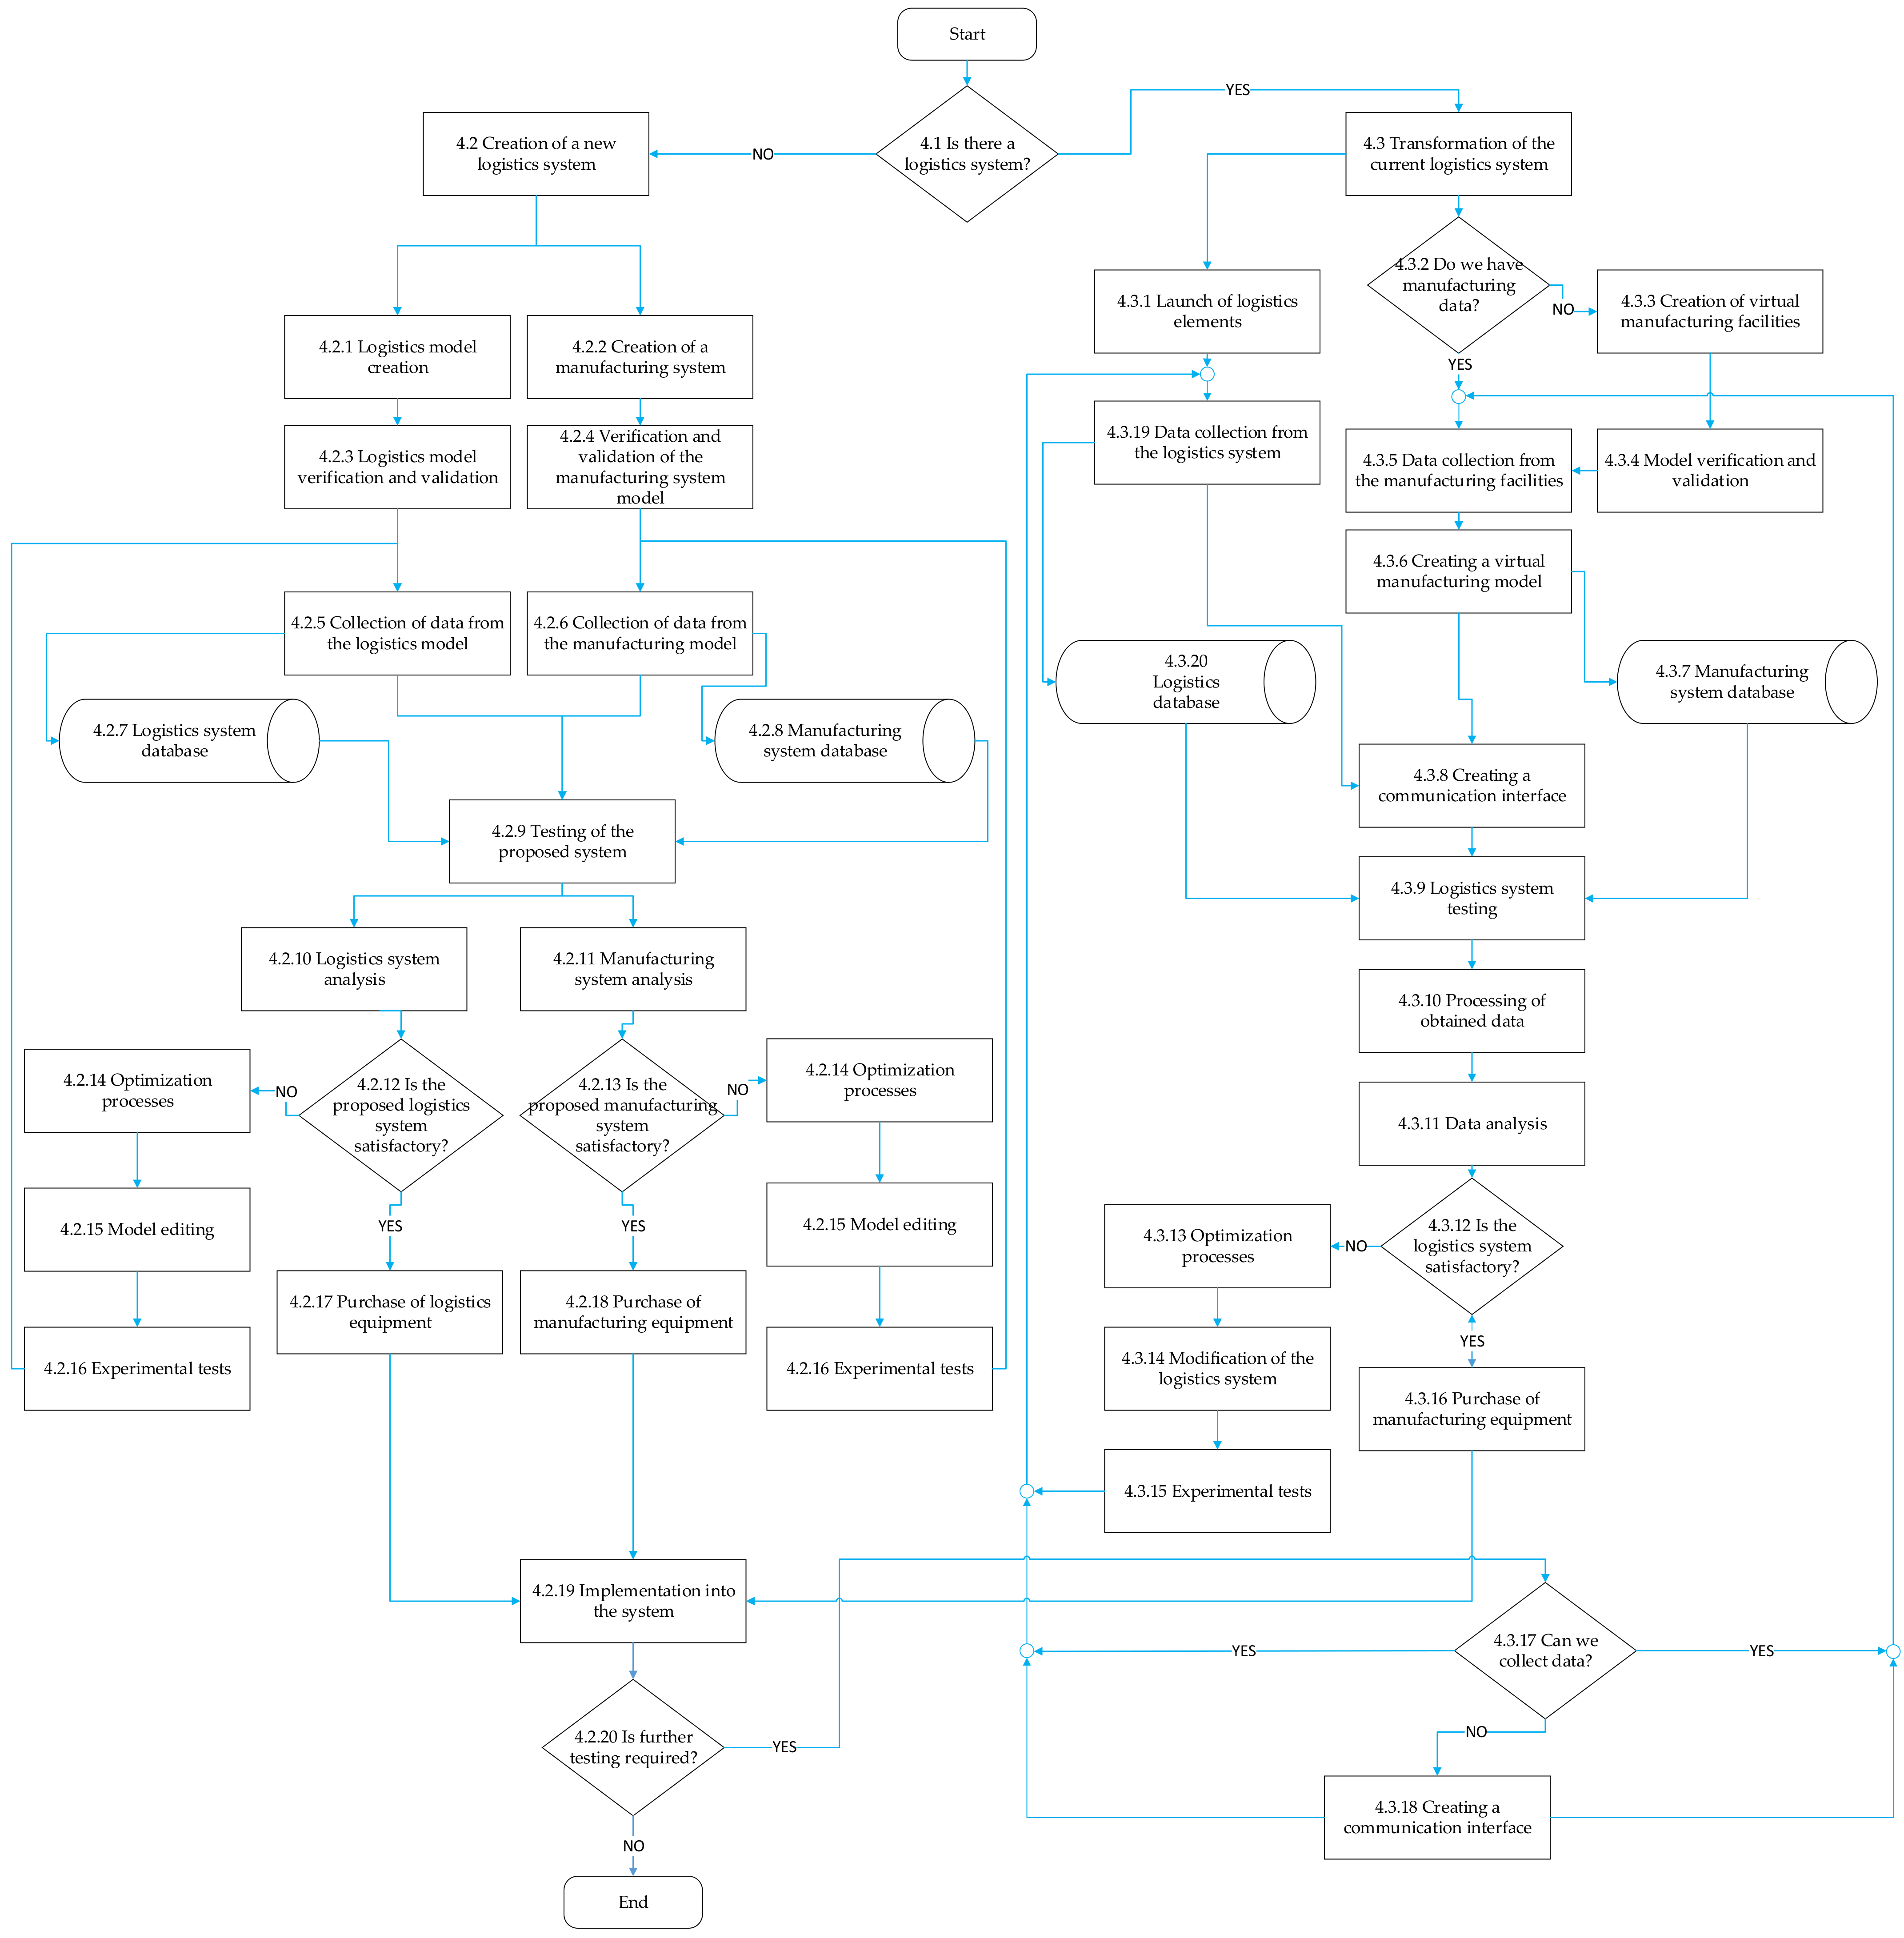
The use of computer simulation in the planning and designing of logistics systems in factories is quite common today. However, its use ends with the verification of the design before the system is itself procured, implemented, and launched. Just as simulation can shorten the planning process and prevent design errors, emulation can help solve problems, especially when testing communication and control processes in manufacturing, logistics, and information systems. The use of emulation eliminates the need to physically deploy all manufacturing facilities to test the functioning of logistics and can eliminate errors before all machines and equipment are procured before the start of manufacturing. The algorithm for creating simulation models using emulation is shown in Figure 6.
The first piece of information for the next decision-making process is information about whether there is currently a logistics system in the manufacturing company and whether we are dealing with its transformation or whether we are engaged in the creation of a new logistics system (Block 4.1). Based on this decision, we proceed with the following steps in the algorithm. The first option is to discuss the case when we are creating a new logistics system (Block 4.2). When creating a new logistics system, it is necessary to create a model of the logistics system (Block 4.2.1) as well as a model of the manufacturing system (Block 4.2.2) in parallel in the virtual environment of the simulation software. After the creation of the models of both systems and subsequent work with these models, the verification and validation of the models of both the logistics (Block 4.2.3) and manufacturing systems (Block 4.2.4) are required. The successful verification and validation process is followed by the collection of data from both modelled systems (Blocks 4.2.5–4.2.6). The collected data are sent to the logistics and manufacturing system databases for the testing of the proposed systems (Blocks 4.2.7–4.2.8). The process of testing the proposed system is based on conducting several cycles of simulation experiments (Block 4.2.9). Subsequently, a parallel analysis of the results obtained from both created models as well as the logistics (Block 4.2.10) and manufacturing systems (4.2.11) is carried out, evaluating the statistics obtained and the selected sequence of steps within which a decision is taken on the correctness of the design of the logistics or manufacturing system, as well as on the purchase of equipment. If one or both of the suggested systems (Blocks 4.2.12–4.2.13) require additional adjustments, then an optimisation-based procedure (Block 4.2.14), subsequent model modification, and a re-conducting of the trials and testing should be performed (Block 4.2.15). After modifying the proposed solution, the algorithm returns to the process of collecting data on the analysed system (Block 4.2.16). After additional modifications, testing, and analysis of the system, which confirm the correctness of the proposed solution, it is possible to proceed to the purchase of equipment (Blocks 4.2.17–4.2.18). The delivery of the proposed machines and equipment is followed by the process of the implementation of individual elements of the system (Block 4.2.19). Then we ask if further testing is required (Block 4.2.20). After carrying out the above processes, if necessary, we follow the algorithm according to the steps that are already described in the transformation of the already existing logistics system (4.3). The transformation processes are described as follows. The transformation of the existing logistics system requires a parallel process both on the logistics side (Block 4.3.1) and the manufacturing-system side (Block 4.3.2). In these procedures, the decision module must decide whether all manufacturing machinery and equipment are present or if replacement is required by constructing virtual pictures of them in a simulation environment (Block 4.3.3) where they are checked and confirmed (Block 4.3.4). If the manufacturing machines and equipment are available, or their virtual images are available in a simulation environment, it is possible to start the process of collecting data from both monitored systems (Block 4.3.5). The same is done for the logistics system (Block 4.3.19). Based on the collected data from the manufacturing system, we can create a virtual model of the manufacturing system (Block 4.3.6), which is used for experimental testing when changing manufacturing plans and the requirements for logistics tasks. The data are stored in the databases of the respective systems for the need to test the systems from manufacturing facilities (Block 4.3.7) for logistics elements (Block 4.3.20). Suppose a model of the manufacturing system is created. In that case, it is necessary to create a communication interface (Block 4.3.8) that, based on impulses from the logistic elements, allows the transfer of the information about the monitored parameter to the simulation model, where this information is processed. Then the impulse is sent with the task from the virtual manufacturing equipment to the logistic element of the system. As a result of this procedure, we have a safe communication flow between actual logistics and a virtual manufacturing system produced in a simulation environment. The creation of an information flow between the two systems enables the testing process of the logistics system (Block 4.3.9). After conducting the tests of the system, the steps of processing the obtained data (Block 4.3.10) and their subsequent analysis follow (Block 4.3.11). Based on the analysis, it is possible to decide whether the existing logistics system can operate in accordance with the requirements of the manufacturing planning and control system (Block 4.3.12). Suppose the logistics system is unable to process the requirements of the manufacturing system. In that case, it is necessary to proceed to optimise the logistics system (Block 4.3.13), modify it (Block 4.3.14), and experimentally verify the proposed changes (Block 4.3.15). Subsequently, the algorithm returns before the data collection process, and the system is retested based on PPC system requirements. If the logistics system meets the requirements of the manufacturing system, it is possible to proceed to the process of purchasing machinery and manufacturing equipment (Block 4.3.16) and installing it in the factory (Block 4.2.19). The installation of the machines and equipment is followed by a decision-making process regarding the need for further data collection (Block 4.2.20). If necessary, further data collection is followed by a decision-making process regarding the ability to collect data (Block 4.3.17). This decision-making process is necessary because when we followed the steps of creating a new logistics system after the initial decision-making process, the process of creating a communication interface between the real logistics elements and the virtual model of the manufacturing system was absent. The communication interface can only be created with the existing logistics system (Block 4.3.18). After creating a communication interface, it is necessary to return to the process of collecting data from the logistics and manufacturing facilities. If the current logistics system is able to cover the requirements of the manufacturing planning and control system, and there is no need for additional modifications to the logistics system, the algorithm can be terminated.
2.2. Integrating Modules into a Single Solution
The individual modules of the proposed system must be incorporated into a comprehensive solution that ensures the overall system’s integrity. Figure 1 depicts the structure of the proposed system. The integrated system’s idea and functioning are based on incentives from the production planning and control procedures. Based on the manufacturing plan, the system issues a logistical request. The planned Ethernet network transmits data to the logistics system. The logistical aspect is activated upon receipt of the request. During the task’s execution, the logistical equipment collects the device’s status information and information about the task performed. The device’s capacity utilisation, information, and location, are also collected, with the option of supplementing the information that is required for further analysis and optimisation of the process. After performing the logistical task, the collected information is sent to the communication-interface module. In this interface, status information obtained from the internal logistical element database is evaluated. The communication interface also contains a manufacturing database in which information is collected from the enterprise resource planning (ERP) internal manufacturing system. According to the system settings of a particular manufacturing factory, information is collected, such as technological manufacturing parameters, key operating parameters (for example, overall equipment effectiveness (OEE), mean time to repair (MTTR), and mean time between failures (MTBF)), reliability and availability of equipment, and others. At the same time, data from the manufacturing system are also sent to the virtual model of the monitored system. This information can be transformed into a model through an Extensible Markup Language (XML) file. The simulation software converts the values thus obtained into data types, defining the data type for each column of data collected. From the obtained data, it is necessary to filter out data that are not necessary for the simulation model. As a result of using information from the logistics system and working on the basis of a production plan from the manufacturing planning and control system, new logistical demands develop. These tasks need to be compared with the capacity capabilities of the manufacturing plan through a virtual model created by the simulation software. In the simulation model, it is possible to verify the suitability of the current logistical settings. If the manufacturing requirements obtained from the PPC system are not met in capacity, an alternative solution is sought through optimisation methods and experiments in the simulation model, which may consist of, for example, rescheduling logistics routes, changes to individual supply circuits, and the modifications and settings of the manufacturing system. The virtual model module of the system is linked to the human-machine interface (HMI) module. The HMI module is an interface that connects the operator to the system and allows the operator to interact with the process. The task of the HMI module is to enable the operator to easily and comprehensibly use the monitored technology so that it can react quickly on the basis of the received message. The solution to the problem is returned from the virtual model to the communication interface, which transmits changed commands to logistical elements depending on the information collected. This process is cyclically repeated based on input from the manufacturing planning and control system.
2.2.1. Design of the Communication Interface between Real System Elements and Virtual Emulation Models
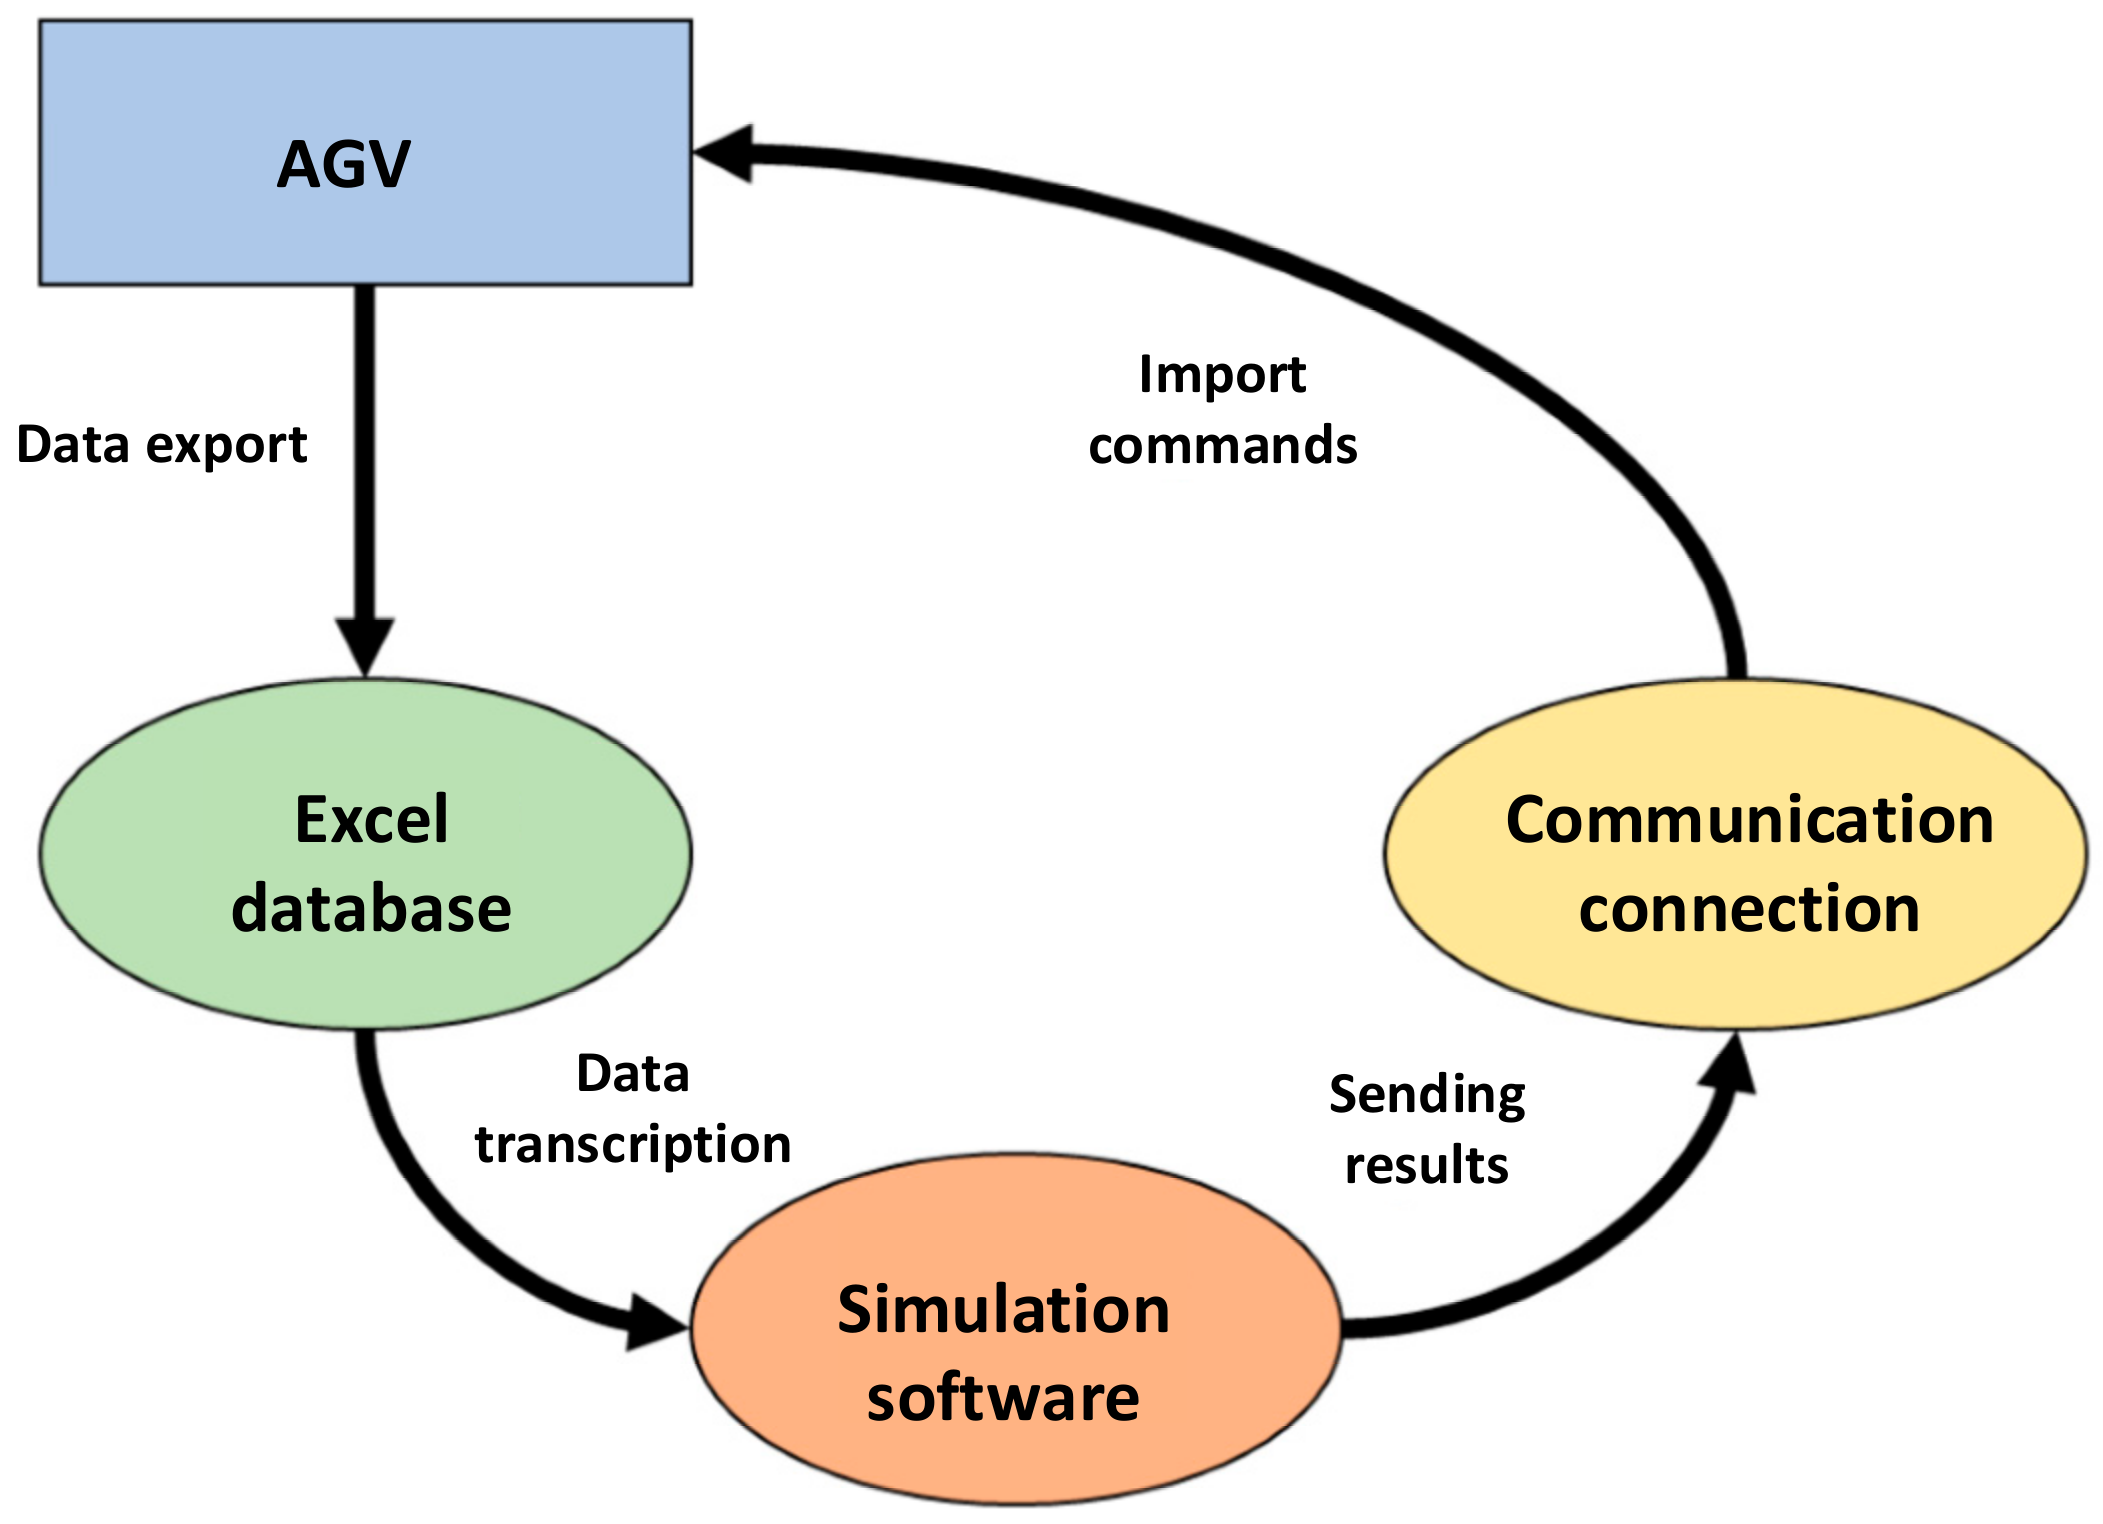
In order to ensure mutual communication between logistics means-of-transport and the simulation software, it is necessary to create an application to bridge the flow of data. The principle of communication is displayed in Figure 7.
In the first step, it is necessary to define in the control system logistical elements the range of data that is recorded in the internal database. It is also necessary to set up a data filter to make the mining of data more transparent and to avoid unnecessarily large data flows of information that may burden the system. Subsequently, this information is exported from logistic elements to a Microsoft Excel spreadsheet, which contains cells arranged in rows and columns and is used to process more interconnected numeric data. The exported data is in comma-separated value (CSV) format. The CSV format is designed on the grounds that it is not limited to a specific character set. It works just as well with Unicode, American Standard Code for Information Interchange (ASCII), and Extended Binary Coded Decimal Interchange Code (EBCDIC) characters, although some limitations may exist for specific programs. The CSV format also has support in libraries that are available for many programming languages. Data exported from an internal database of logistic elements can be extracted into simulation software through an interface used to read exported data. After importing the data, the data must be ensured to be of the same data type that is set up in the internal tables of the simulation software. It may also be necessary to filter and clean the data from data that is not used in the simulation model. After data processing, a simulation run is started based on the parameters obtained. After statistical evaluation, experimental runs are carried out in order to find a solution to the problem that has arisen. Subsequently, the data can be exported using the newly created method for writing data from internal tables to the desired data type. The data type of the exported data must be set depending on the program into which the data will be imported. Data exported from simulation software are sent to a communication interface that overcomes the connection between the simulation software and the database system of logistical elements. The principle of the communication interface is based on connecting to the communication bus of the logistics element for the purpose of data transmission. Data transmission is provided through an Ethernet network.
2.2.2. Proposal for Data Collection and Evaluation of Capacity Utilisation of Manufacturing and Logistics Facilities Using Automated Data Collection
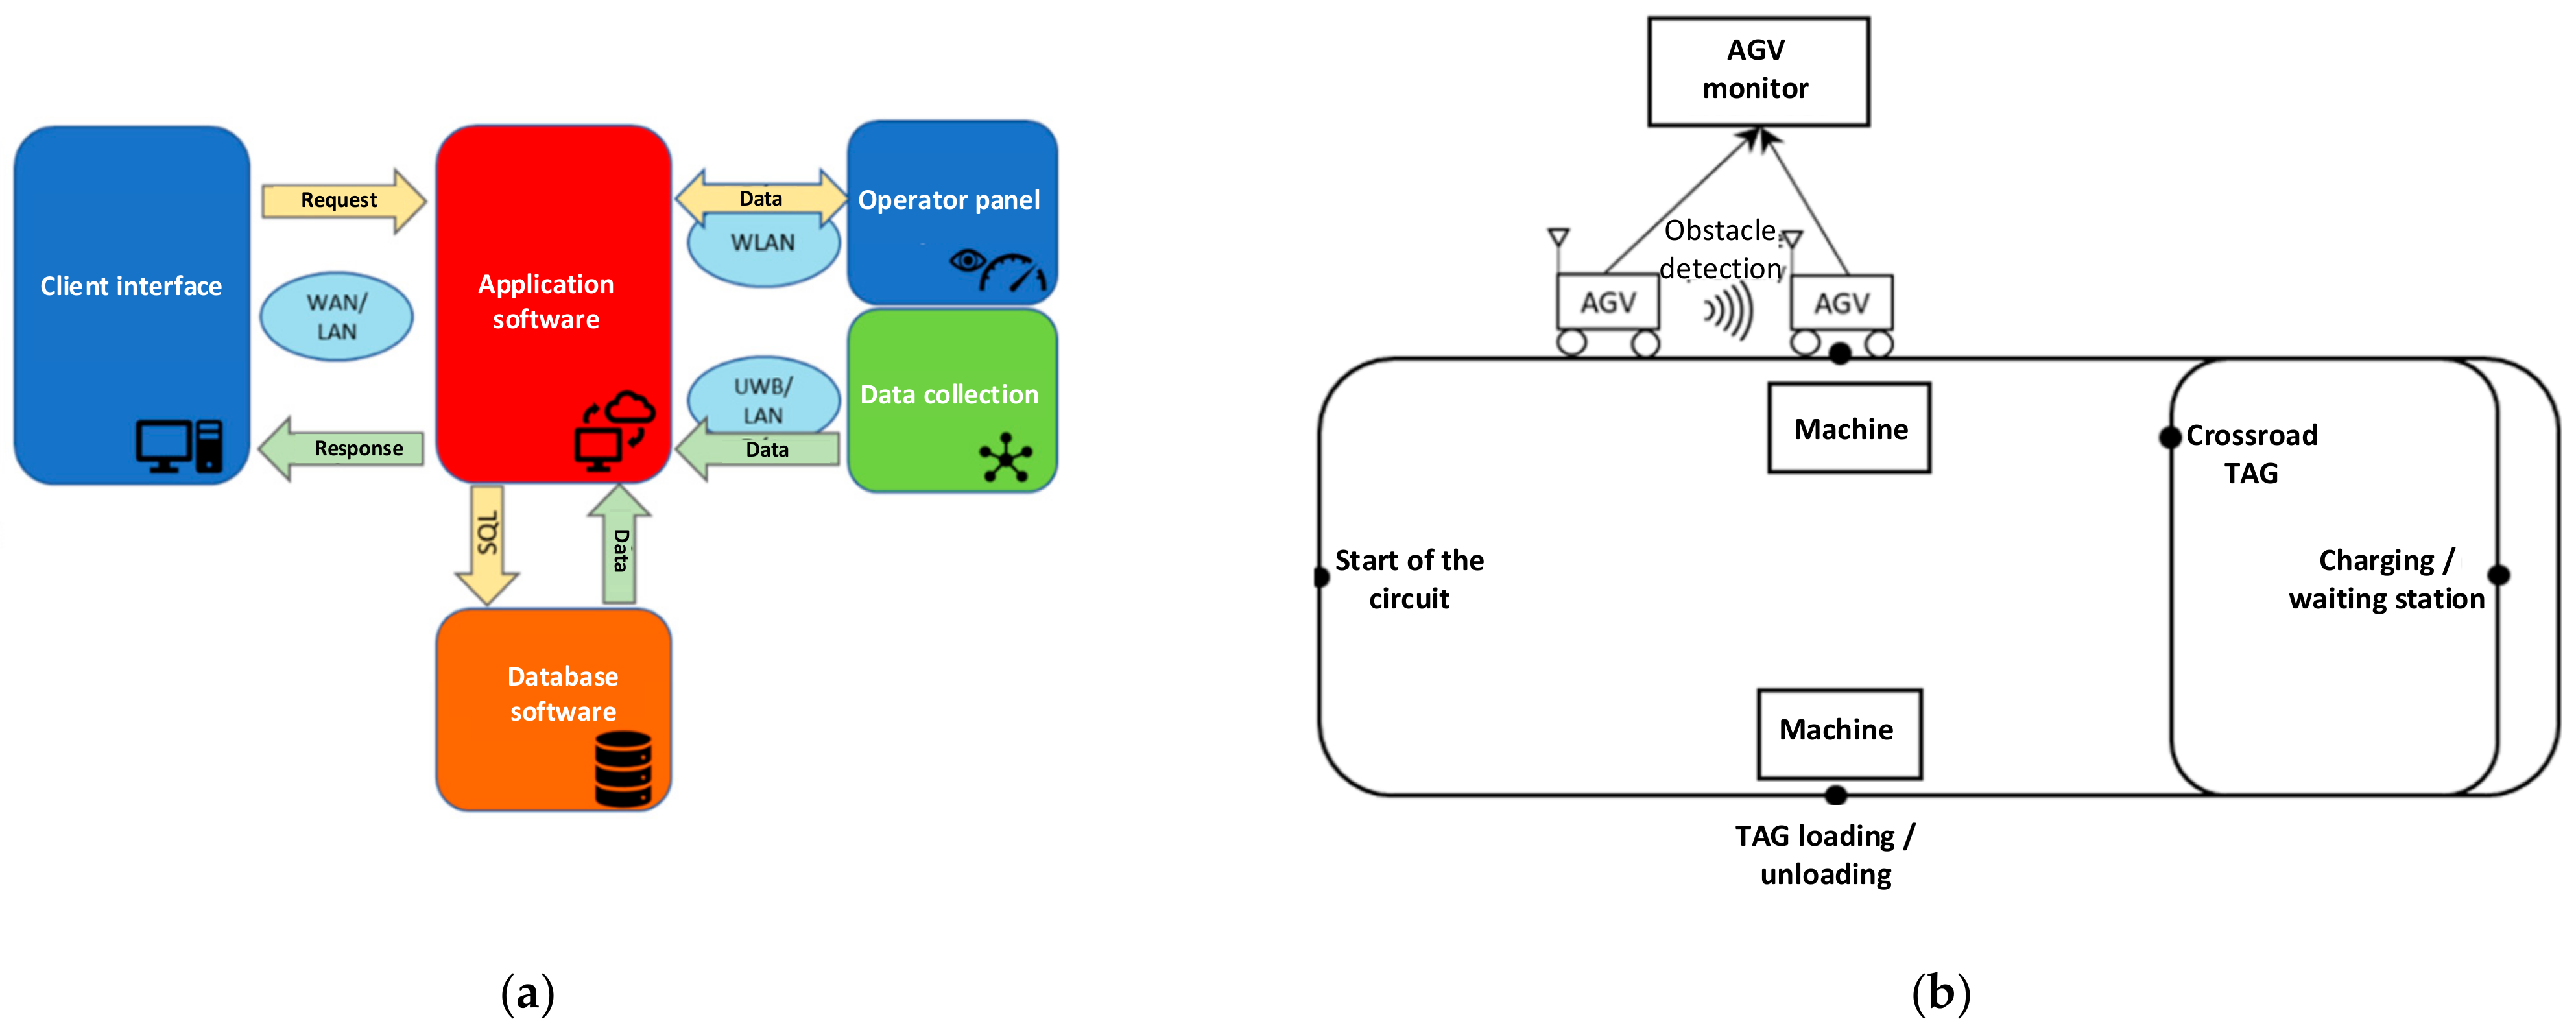
By deploying new communication and sensor systems in manufacturing and logistics systems, we obtain a wealth of data that provide real-time status information about individual devices. This enables the digitalisation of the manufacturing environment. A system for monitoring intra-logistics processes with the ability to easily expand the coverage of monitored elements, as well as the ability to extend functionality to elements of automation, analysis, or the advanced navigation of moving objects, is included in automatic data collection and evaluation. In addition to the sensory part, the digitisation of machinery and equipment requires infrastructure for processing digital quantities and network infrastructure for the transmission and processing of information. Part of the proposed solution is the incorporation of location technology meeting the Industry 4.0 standard, covering defined areas of manufacturing and logistics premises of the factory, with the potential for universal use for the needs of digital and virtual factories. The module for automatic data collection is based on Ultra-Wideband (UWB) technology. The module architecture for automatic data collection is shown in Figure 8.
The following are the primary components of the automated data gathering system’s application architecture:
- Client interface—is represented by an application or web browser on a computer, tablet, or smartphone. This ensures that input and output data are displayed. Requests are sent via http, which is used to transfer documents between servers and service clients.
- Application server—in this module, the entire logic of the system is realised and is designed to install, operate, and host applications and related services for end users. This allows the server to dynamically generate a response to a client request. Outgoing requests are distributed to the application server for the most efficient processing. The application server is linked to the internal database server of a particular factory. Results from the application server are sent in HyperText Markup Language (HTML) format and are used to display elements such as text, images, and video.
- The database server—communicates directly with the application server. It is used to store all collected data. It is part of the company’s infrastructure. Central storage of data serves as a gateway for superior control and information systems. The main tool of the database server is the SQL database, which is used to manipulate and define data. Data exchange is via a Local Area Network (LAN).
- Data collection—a module composed of UWB hardware equipment. The system consists of mobile tags, which are identification devices, the location of which is determined by the location server. A location device collects and analyses the UWB signal from mobile tags before transmitting packets to an application server via a LAN network.
- An operator panel—is a display unit, intended primarily for the operator. It contains information about the current performance of devices, downtime, and OEE. Communication with the application server is accomplished via the factory’s internal Wireless Local Area Network (WLAN).
The collection and evaluation of the capacity utilisation of logistics facilities is based on data obtained from sensors, which in automatic logistics systems with magnetic navigation represent RFID tags. For vehicles guided by laser navigation, sensors and tags are represented as virtual and changes occur in the software solution environment. If contour navigation is used, the space plan is imported into the virtual environment in the solution software. Tags and sensors are virtual, just like laser navigation. The data required for the calculation are obtained from sensors located on the AGV path. It is necessary to create an application through which we define, for example, the following states of the device: driving time, delay time at the intersection, loading and unloading of material, time of delay, and time of charging or waiting for commands.
These times are obtained through individual sensors (tags) that are located on the AGV path (see Figure 8b). After loading the sensor data onto the path, we get data about the time at which a particular tag was launched. These data are recorded in the AGV monitor control system in the form of a tabular database in which we can define the times of specific operations through filters. On the basis of these classifications, each AGV must have its own specific name, on the basis of which we can assign the obtained parameters. In addition to the tags placed on the track, it is also necessary to collect information from sensors placed on the AGV. These are sensors that detect obstacles along the route. After recording the obstacle, the AGV stops and it is necessary to record the time of this fact. Based on this information, we calculate the blocking time caused by the obstacle on the route. In addition to tags that provide us with information about the status of the AGV, it is necessary to include a tag on the track that defines the beginning of the tracked circuit and records the travel time. By subtracting other status periods recorded by the AGV during the execution of a specific circuit from this tag, we may determine driving time. The time capacity utilisation of an individual i-th AGV is defined as an ordered set of elements <xi, tRi, tCi, tLi, tUi, tBi, tWi> where:
- xi—time capacity utilisation AGV, i = 1, …, n;
- n—total number of AGVs;
- tRi—driving-time component of the i-th AGV;
- tCi—time component of the i-th AGV at the intersection;
- tLi—loading-time component of the i-th AGV;
- tUi—unloading-time component of the i-th AGV;
- tBi—time component for blocking of the i-th AGV;
- tWi—task/charging-waiting-time component of the i-th AGV;
- TT—total operating time (e.g., shift length);
- xT—average utilisation of all AGVs.
Then the time utilisation of the individual i-th AGV xi can be defined as:
The following will apply to the average utilisation of all AGVs xT:
By analogy, we can determine the percentages of all other time components.
Percentage of i-th AGV driving time xRi:
The following will apply to the average AGV driving percentage for all AGVs xR:
Percentage of delay time at the intersection of the i-th AGV xCi:
The following will apply to the average percentage of intersection times for all AGVs xC:
Percentage of loading time of the i-th AGV xLi:
The following will apply to the average percentage of loading time for all AGVs xL:
Percentage of unloading time of the i-th AGV xUi:
The following will apply to the average percentage of unloading time for all AGVs xU:
Percentage of i-th AGV blocking time xBi:
The following will apply to the average blocking-time percentage for all AGVs xB:
Percentage of task-waiting/charging-time for the i-th AGV xWi:
For the average percentage of task-wait/charge-time for all AGVs, the following will apply xW:
We can create a graph of the load based on the calculation of individual components of the capacity utilisation of logistical facilities.
3. Results
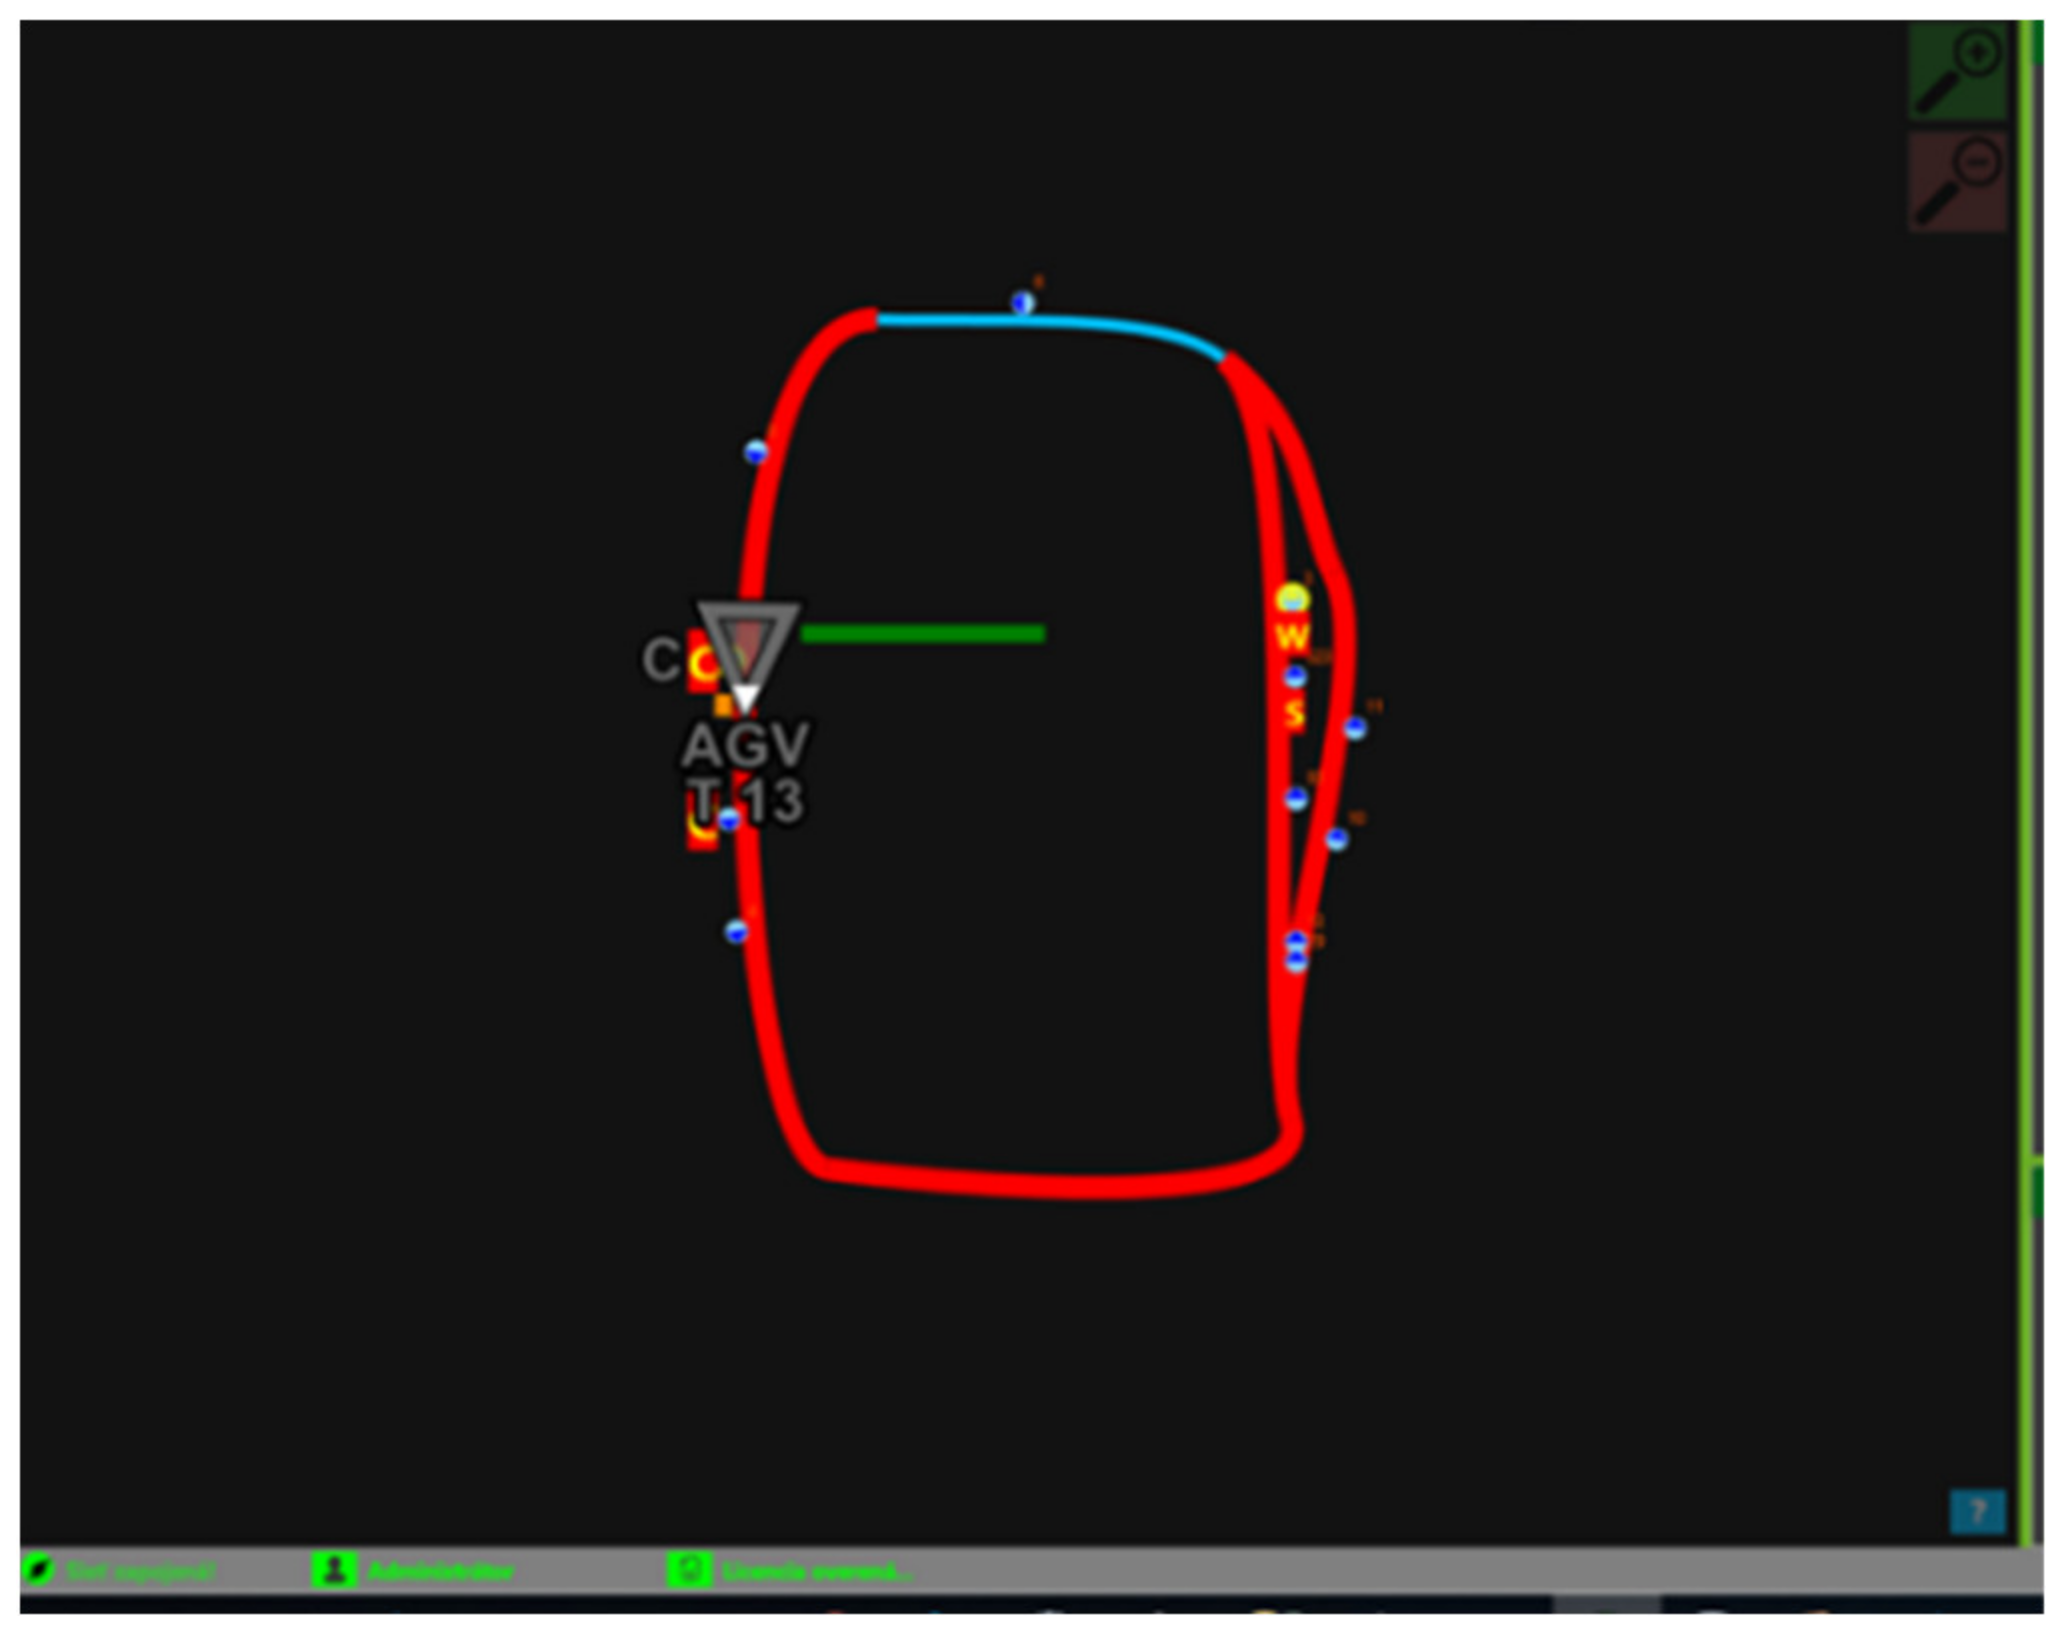
The proposed system for verification of AGV routes using computer emulation is suitable for automatic logistics systems. The partner organisation for the research of this system is Asseco CEIT a.s., the most famous innovation of which is intelligent mobile robots which ensure reliable, efficient, and safe automatic logistics in industrial halls. The created system processes manufacturing data, reacts flexibly, and can make independent decisions. Information from the control system is processed through the AGV Monitor system application, displayed in Figure 9, which displays the processed information in a user-friendly form, mainly by graphically visualising the status and position of individual logistics resources. All information, actions, and changes to settings, are recorded and collected by the system and deposited into the documents for later analysis or subsequent optimisation of logistics processes.
In the experimental design, a control system with a global control method was unjustified. It is an intelligent control with automatically generated inputs for transport that are applied with full automation. The control is able to decide and subsequently manage transport based on the states of the peripheries, the type of material transported, requirements from external equipment and systems, robotic workplaces, or manufacturing lines. Based on this information, it decides and subsequently manages the automatic import and removal of materials or finished parts to specified positions for a specific type of material or finished part. All this happens without the presence and intervention of the operator. If necessary, intelligent control can only control and prioritise a specific AGV tractor. It also allows a specific AGV of the tractor to check whether further transport is still needed on the track or if the AGV tractor is to return to the starting position. Control is an autonomous, flexible solution that requires a complete package of services installed on the server, thanks to which it can comprehensively automate logistically demanding processes, synchronise with the manufacturing process, and ensure the continuity of material flow. Intelligent conditional control evaluates the fulfilment of transport conditions based on information from the database. The database information obtained (such as information on the status of peripherals, types of material, and automatically generated requests from external equipment and systems) is used for immediate decision-making and subsequent control of the automatic import and removal of materials or finished parts to specified positions for a specific type of material or finished part. In this way, even more logistically demanding processes can be automated. Intelligent control also uses the functionality of so-called checkpoints, which are placed on the tracks. The control system determines and picks one of the various paths depending on external criteria, it may assess whether more transport is required, or it can send an AGV command to the tractor to return to the starting place.
3.1. Creating a Virtual Test Site Simulation Model
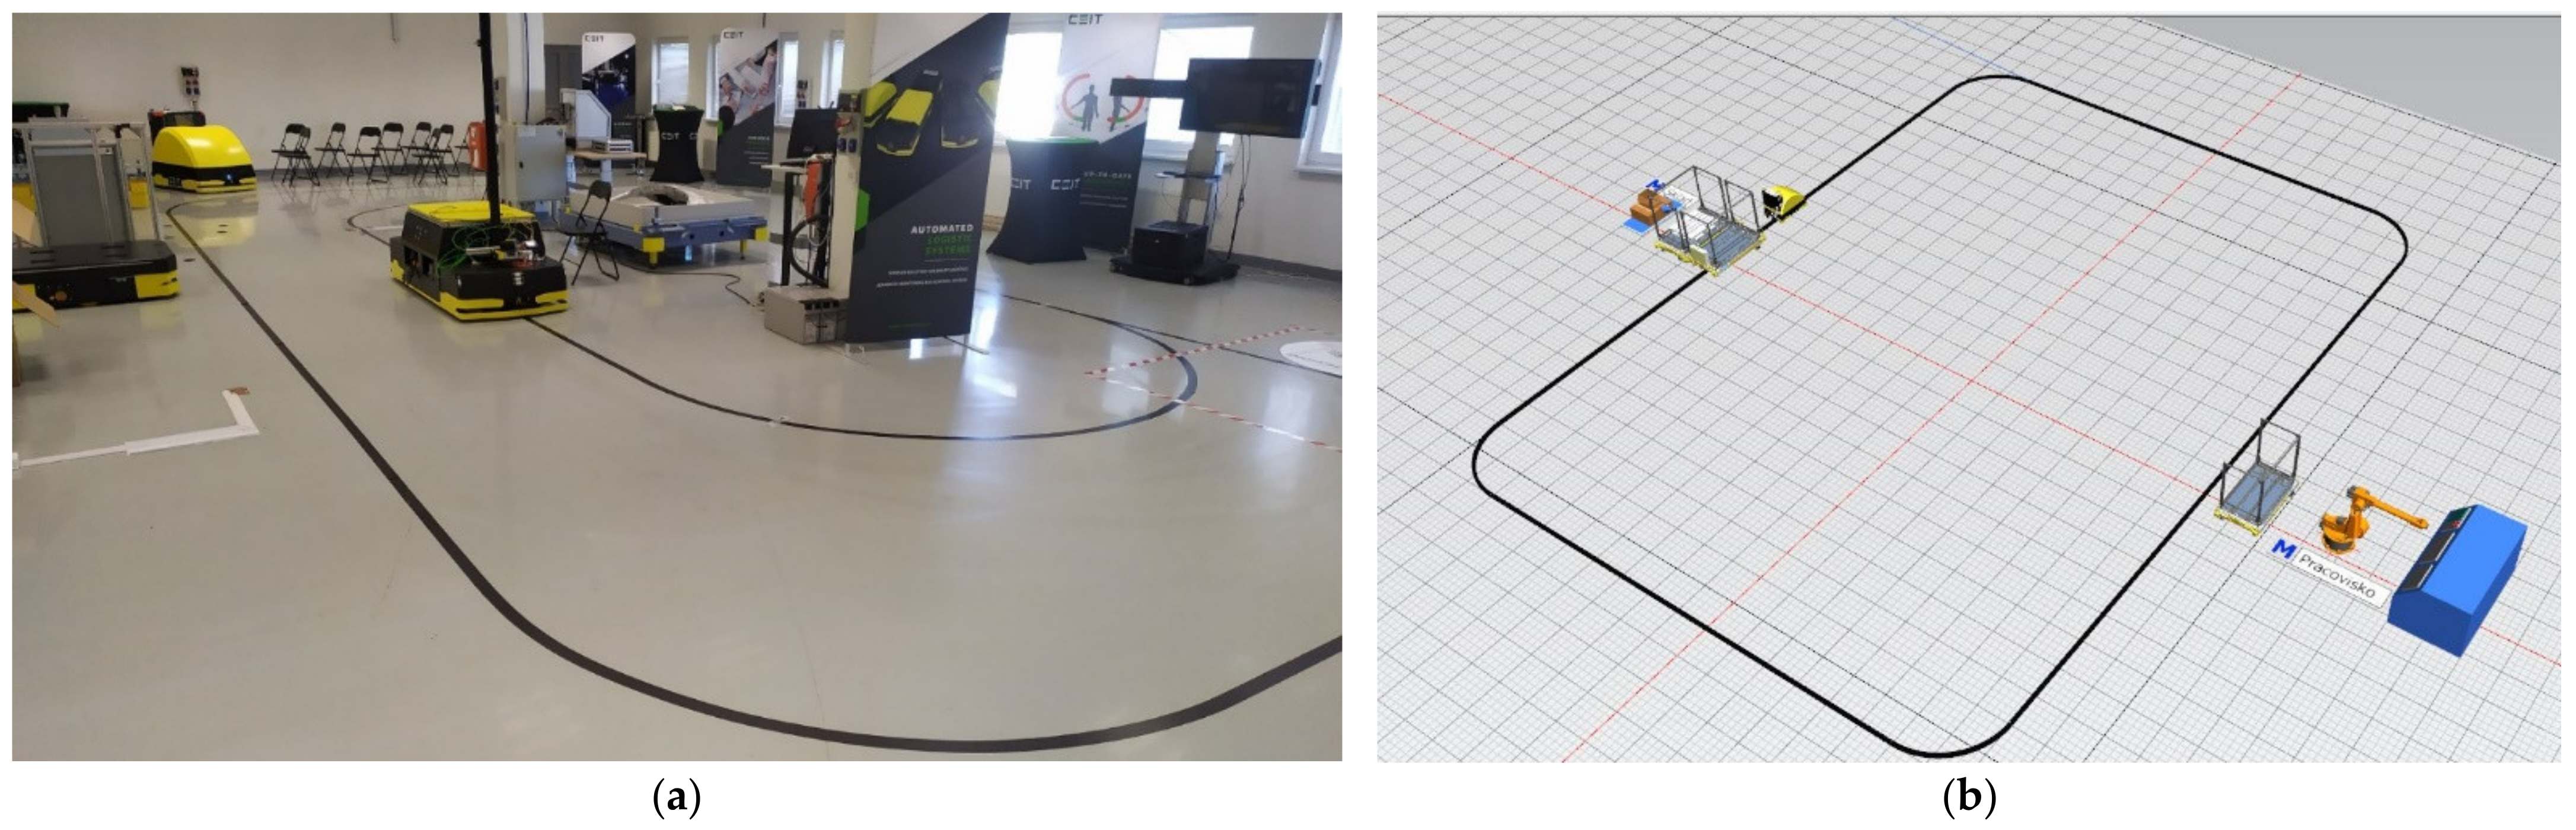
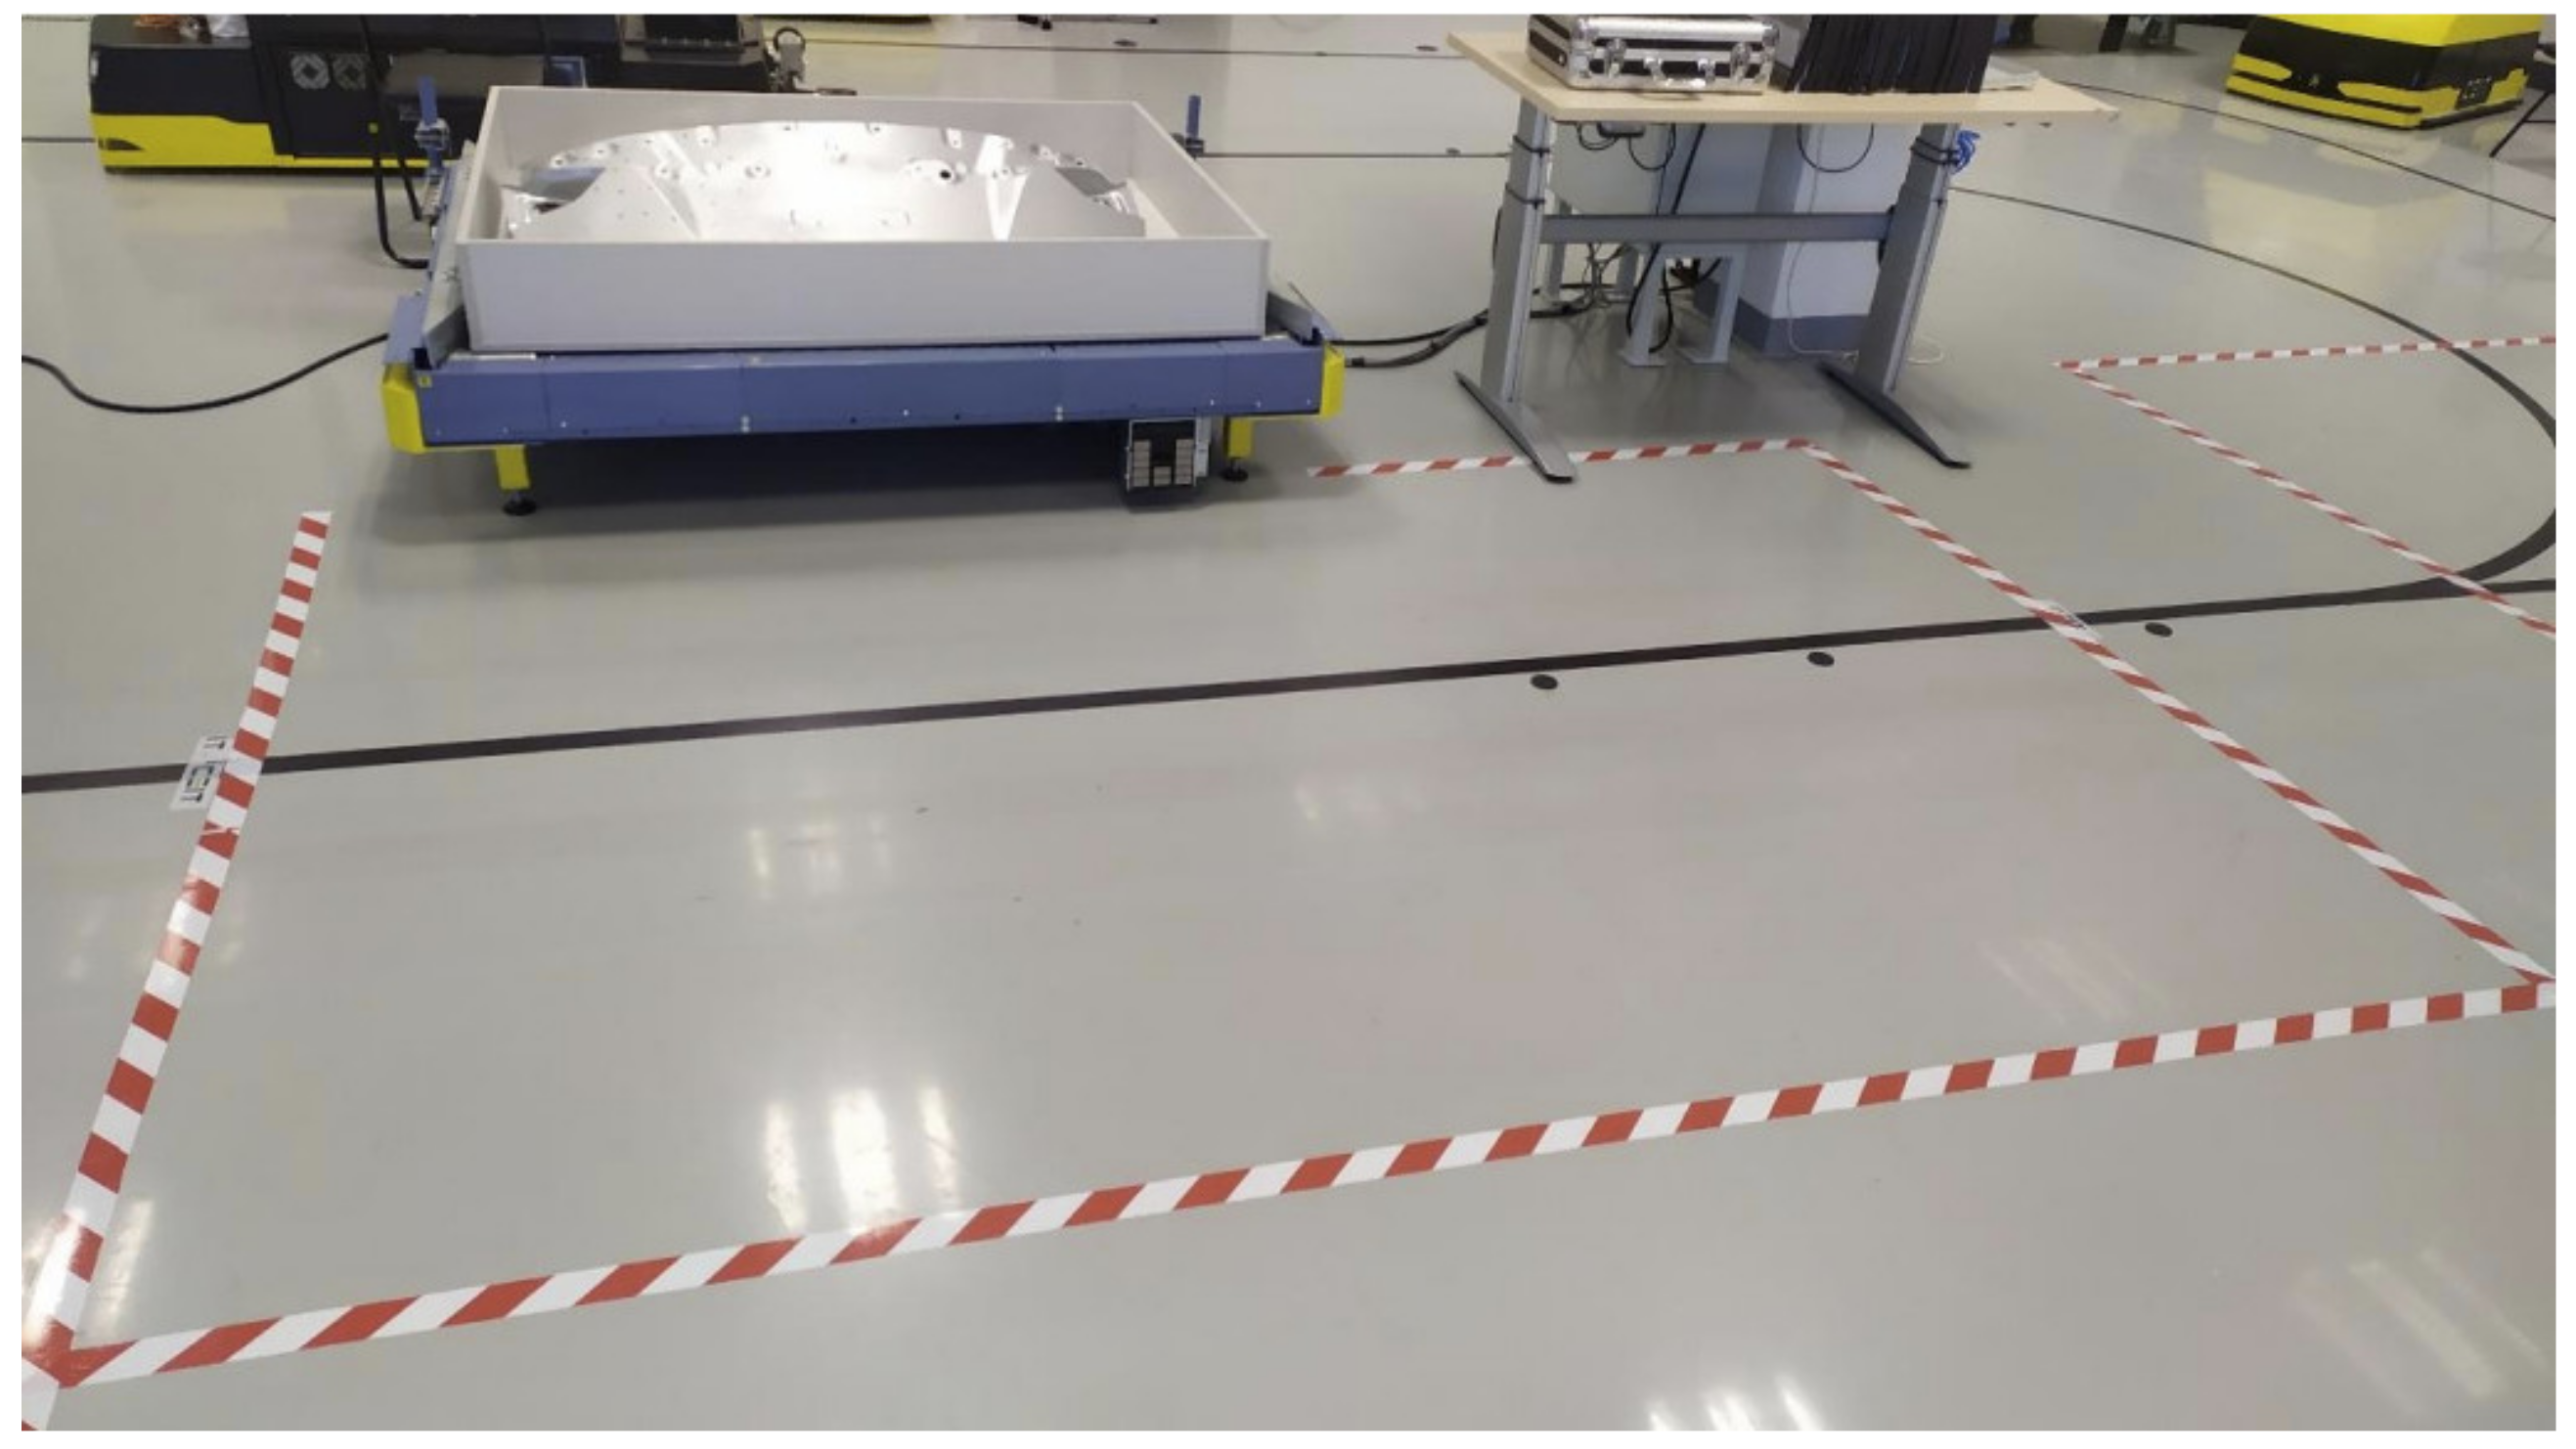
A virtual test site model created in the environment of a computer application developed by Siemens, Tecnomatix Plant Simulation, is displayed in Figure 10. The tested system represents manufacturing that does not have real manufacturing facilities, or new equipment that will be added to existing manufacturing. The proposed system can test the behaviour of real logistics using virtually created manufacturing equipment, which is replaced using simulation software based on logic described in Section 2.1.4. Control of AGVs as a part of a logistic system is realised based on the algorithm described in Section 2.1.1. The model that includes manufacturing facilities is created, verified, and validated based on the algorithm describe in Section 2.1.3. Facilities are not part of the real test site (see Figure 11).
The set process time of the machine is 15 seconds. A container for imported material is placed in front of the device. The capacity of the magazine is 50 pieces. Based on the process time of the manufacturing facility and the current storage capacity, it is necessary to import material in a tact of 12.5 minutes. In the simulation model, we monitor the amount of stock in front of the machine. The set AGV speed was 0.5 m/s on average. Based on these inputs, the signalling level of stocks in the simulation model was set to 5 pieces. When the signal level is reached, the signal is sent via the created DPS-Bridge application. This application writes a change of parameters in the internal AGV database, on the basis of which the AGV is instructed to perform the logistical task where the whole process is described in (Section 2.1.2). The simulation model includes methods and dialogue boxes to ensure communication with real logistical elements via the DPS Bridge communication application. These methods are created in a separate folder that is placed in the object library. Called “Frame”, it is used to group objects and create hierarchically structured models with the possibility of inserting any objects, whether from a library or new objects created by the user.
The main objects of which the Frame is composed are:
- The StartAGV method— a method that triggers communication with the BRIDGE PCB application. Through this method, starter settings are sent with which the DPS Bridge works;
- Setting dialogue box—provides the user with a simple user interface. The dialogue box shows the set input parameters. The dialogue box contains the parameters that follow;
- An Error Message—a dialogue box providing information in the event of a communication failure between the AGV and the simulation model;
- Error Message Handler/Setting Handler—methods required for dialogue box execution;
- Setting Table—the setting table in which the parameters described in the Setting dialogue box are inserted.
3.2. Creating a Communication Interface via the DPS Bridge App
Based on the approach described in Section 2.2 to ensure communication between the real elements of the system, its own DPS Bridge application was created. The basis of the created application is the programming language C. The DPS Bridge application bridges the connection between the Tecnomatix Plant Simulation and the SQL database systems, which are filled with real-world data through online automatic data collection from the RTLS system. The DPS Bridge is able to connect to the database from which it reads and subsequently processes data. The processed data are sent back via the virtual Component Object Model (COM) interface to the Plant Simulation software environment. COM objects allow for control simulation from other applications that are able to process COM objects.
The application was created on the Windows desktop platform. The functionality of the DPS Bridge after running the application reviews the channels providing inter-process communication between the server and one or more clients. These channels provide complete duplex communication in the retina, based on client messages and impersonation, allowing connected processes to use their own set of permissions on remote servers. When browsing, the application detects whether a channel with a DPS Bridge server is available. Based on this, there may be two states of application startup:
- Server mode—is running if a channel with a DPS Bridge server is not available. After establishing communication, the application triggers a thread through which it is waiting for a request from the client. If a message called “START_AGV” is received through the thread server, the server runs the AGV by writing a value of 1 in its internal database called “Decide_parameters”. After the value is entered into the internal database, the AGV is set in motion. Verification that the AGV is in motion is done by reading from the internal AGV database, into which the values are written after passing the RFID tag. After going through the tag, this information is sent to the simulation model created in Plant Simulation. After the client sends a request or the plant simulation contact with the server is stopped, the application is disabled.
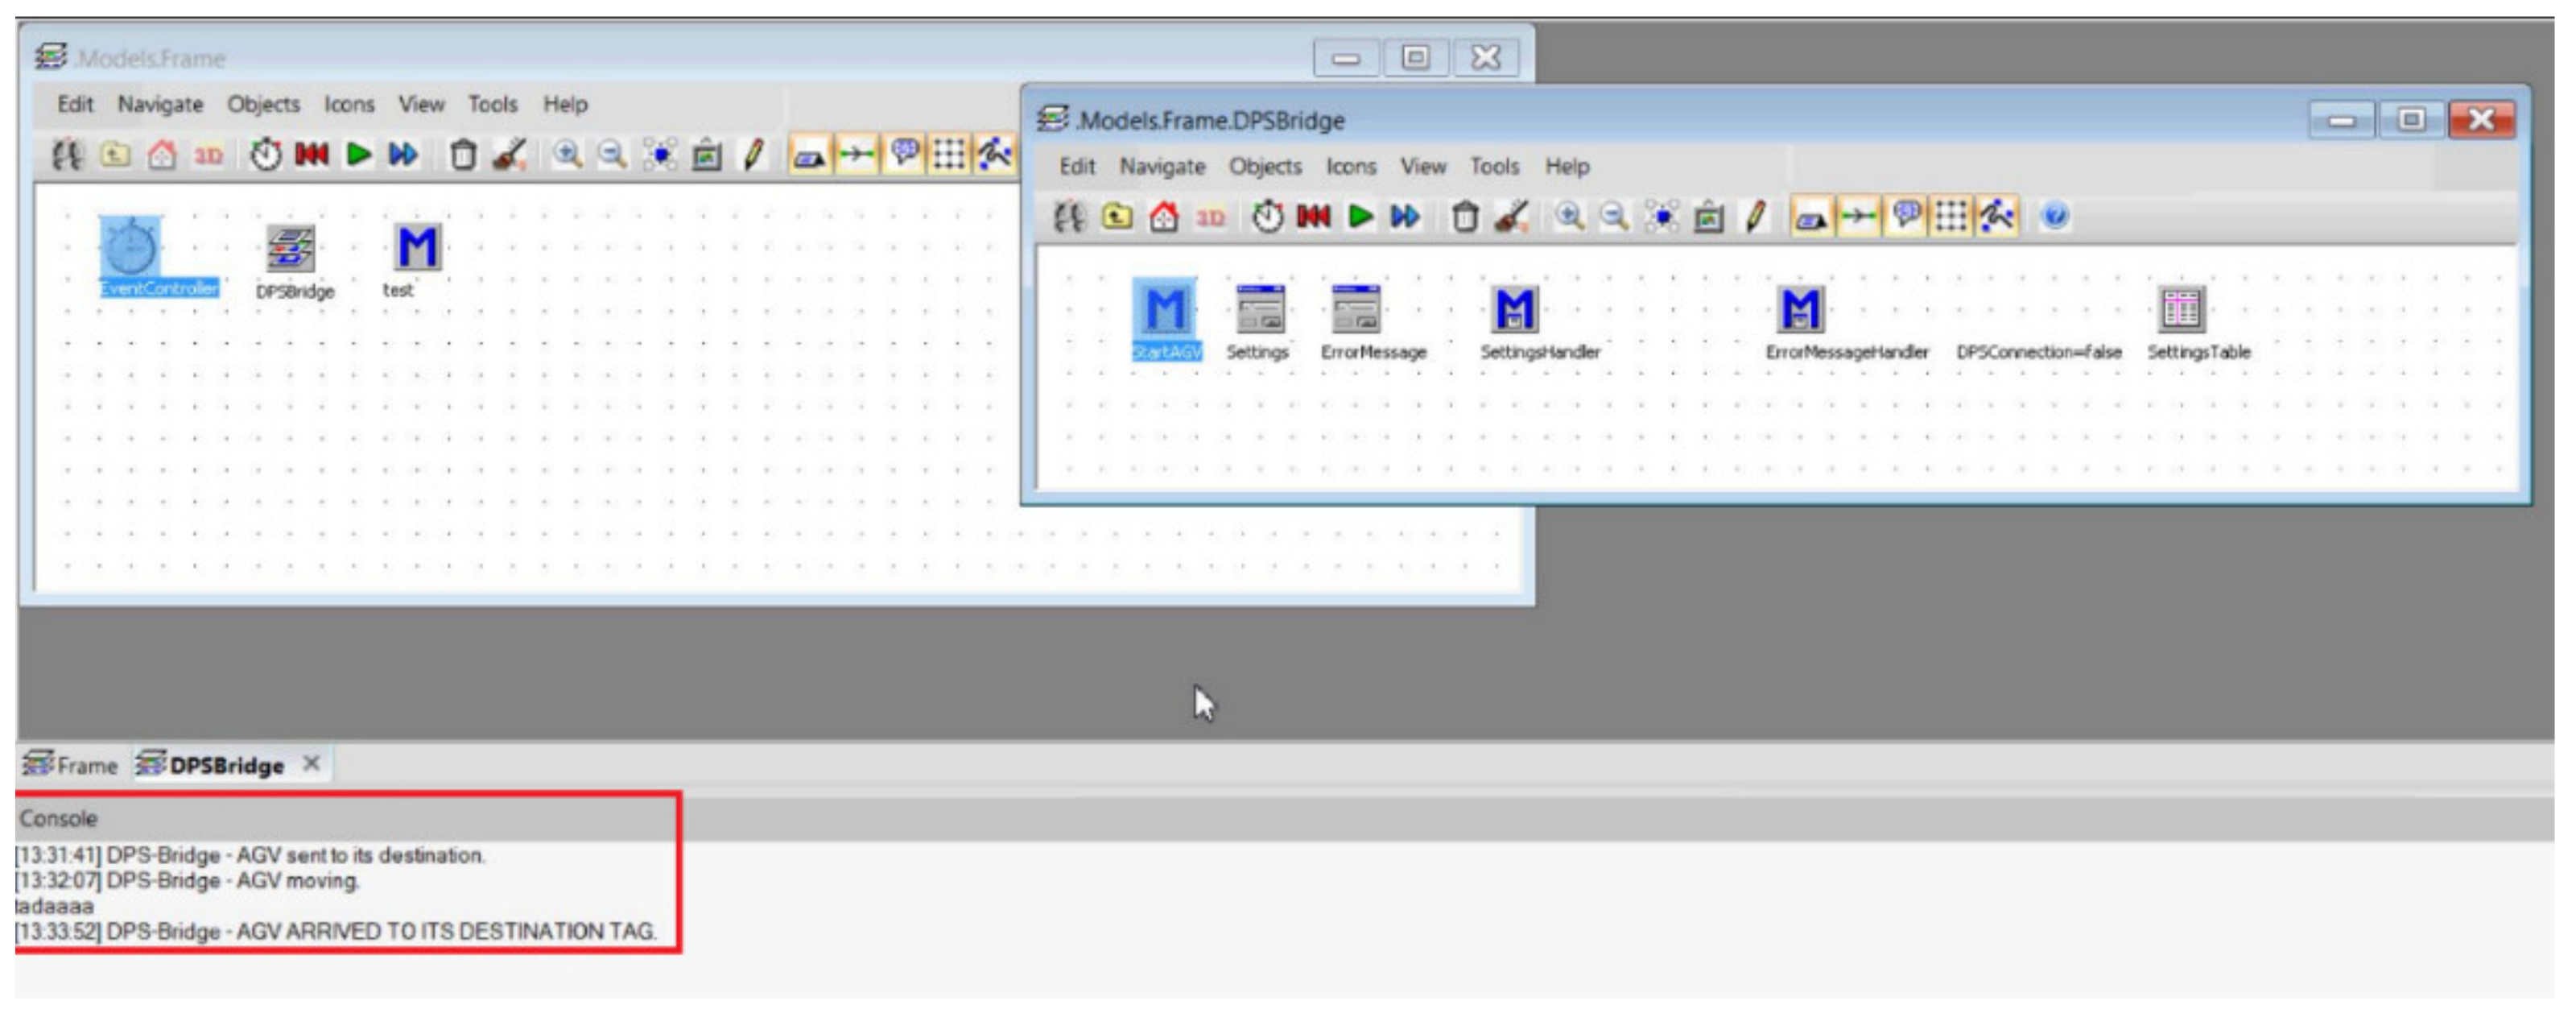
- Client mode—in this mode, the application can communicate with the DPS Bridge server. The mode is necessary to identify status information from the AGV. At the same time, DPS Bridge is running in the background, so the server is available. That was created in casee the application was launched via Server mode and, at the same time, Client mode was running in the background (see Figure 12). The DPS Bridge connects directly to the server via communication channels, eliminating the need to recreate the communication channels via which messages are delivered between the application and the server.
3.3. Statistical Evaluation of the Experimental Test
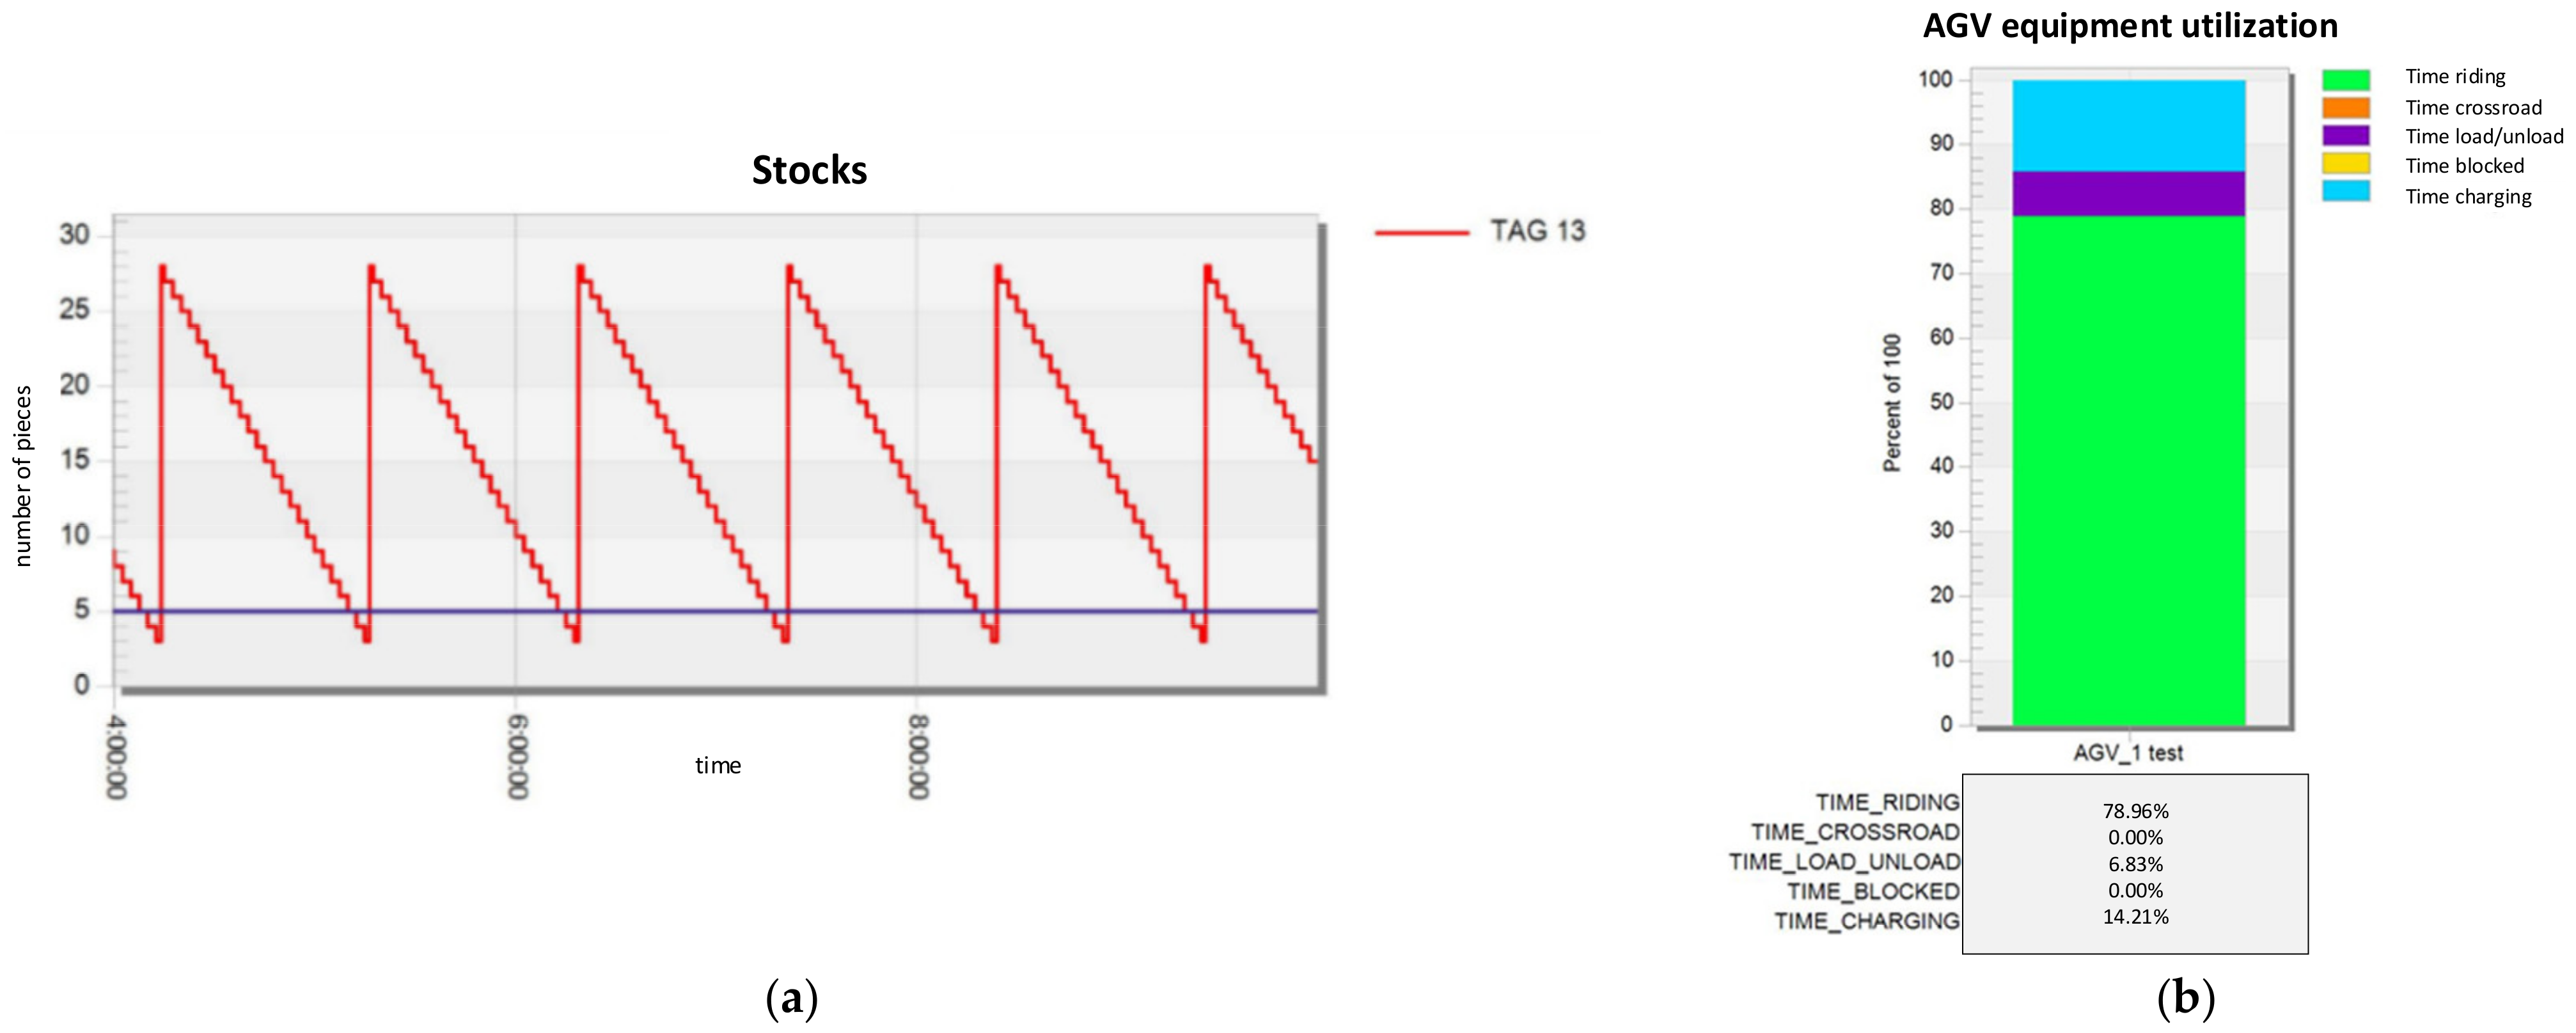
With the use of the created model and system described in Section 2.2.2, several experiments were realised. The first experimental test was a generated normal supply situation in which the operation of the workplace on tag 13 was tested. When the material dropped below the signal level, which was set to 5 pieces, a request was sent via the DPS Bridge communication application to the AGV tractor. The AGV tractor was set in motion, and after arriving at tag 13, the arrival of the material was recorded in the simulation model. In the experimental test, no material failure was detected in the workplace, and the minimum stock in the workplace was 3 pieces. The progress of the inventory at the workplace and the AGV-load of the tractor are shown in Figure 13.
The AGV-load of the tractor is shown in Figure 13. The time spent riding was 78.96% of the total time. The lack of charging time proved to be problematic in the experimental test. The charging time for continuous operation on the tested AGV tractor should be at least 20.00% of the total operating time. The charging time for this variant was 14.21% of the total time. With prolonged operation, the AGV would shut down due to low battery capacity, which would result in a stock outage at the workplace. The next experiment was the generated occurrence of random events on the AGV circuit of the tractor and testing the behaviour of the system with the different factors. Statistics from these experiments are listed in Table 1.
The second experiment was the generated occurrence of random events on the AGV circuit of the tractor. Delays in the supply of materials to the workplace were caused by obstacles along the route. Subsequently, by monitoring the progress of the stock situation through the simulation model, the delay in the AGV of the tractor was manifested by a lack of materials in the workplace. The missing material was reflected in the downtime of the device. Driving time was 66.27% of the total time. The time needed for loading and unloading of material was 5.91% of the total time. The addition of obstacles to the towing route in capacity utilisation added a blocking component, which represented a share of 15.87% of the total test time. Blocking reduced the charging time to level 11.95%.
The third experimental test was to test the behaviour of the system with the factors described below. In the experiment, a standard defined circuit for the AGV tractor was used, as in the first and second experimental tests. Random blocking in the form of obstacles was generated on the circuit, as in the second experimental test. The transport capacity of the tractor was increased from the original 25 to 35 pieces. The signal level of the virtual device on tag 13 was also changed from the original 5 pieces to 10. Stocks in the workplace in this variant did not fall to the level at which the downtime of the equipment would be caused. Driving time was 56.94% of the total time. The time required for loading and unloading material increased to 7.69% of the total time. This increase was due to the need to load and unload several pieces as the transport capacity of the equipment changed. By adding obstacles to the towing route, the blocking component represented a share of 14.96% of the total test time. The time of charge was 20.41%. The charging time was sufficient to ensure the continuous operation of the equipment in the test circuit.
4. Discussion
Based on the results of the use of computer emulation in logistics processes, certain conclusions resulting from the application can be defined.
- In a mixed environment of the real and virtual worlds, emulation can be used as a tool for optimising logistics systems, including AGVs. Based on results, it can confirm the conclusions of research work [20]. Through the mixed environment of the real and virtual worlds, it is possible to test several alternatives, which, using data that are sent to the simulation system in real time, allows one to find the optimal solution for a defined task. Such a solution uses data collected by the physical device to create a digital twin in the virtual world. By combining simulation, emulation, and the digital twin, it is possible to avoid specific problems associated with the definition of the suitability of the AGV system and the size of the AGV battery cell used, production volumes and batches, or the suitability of the track layout, including the location of the charging stations.
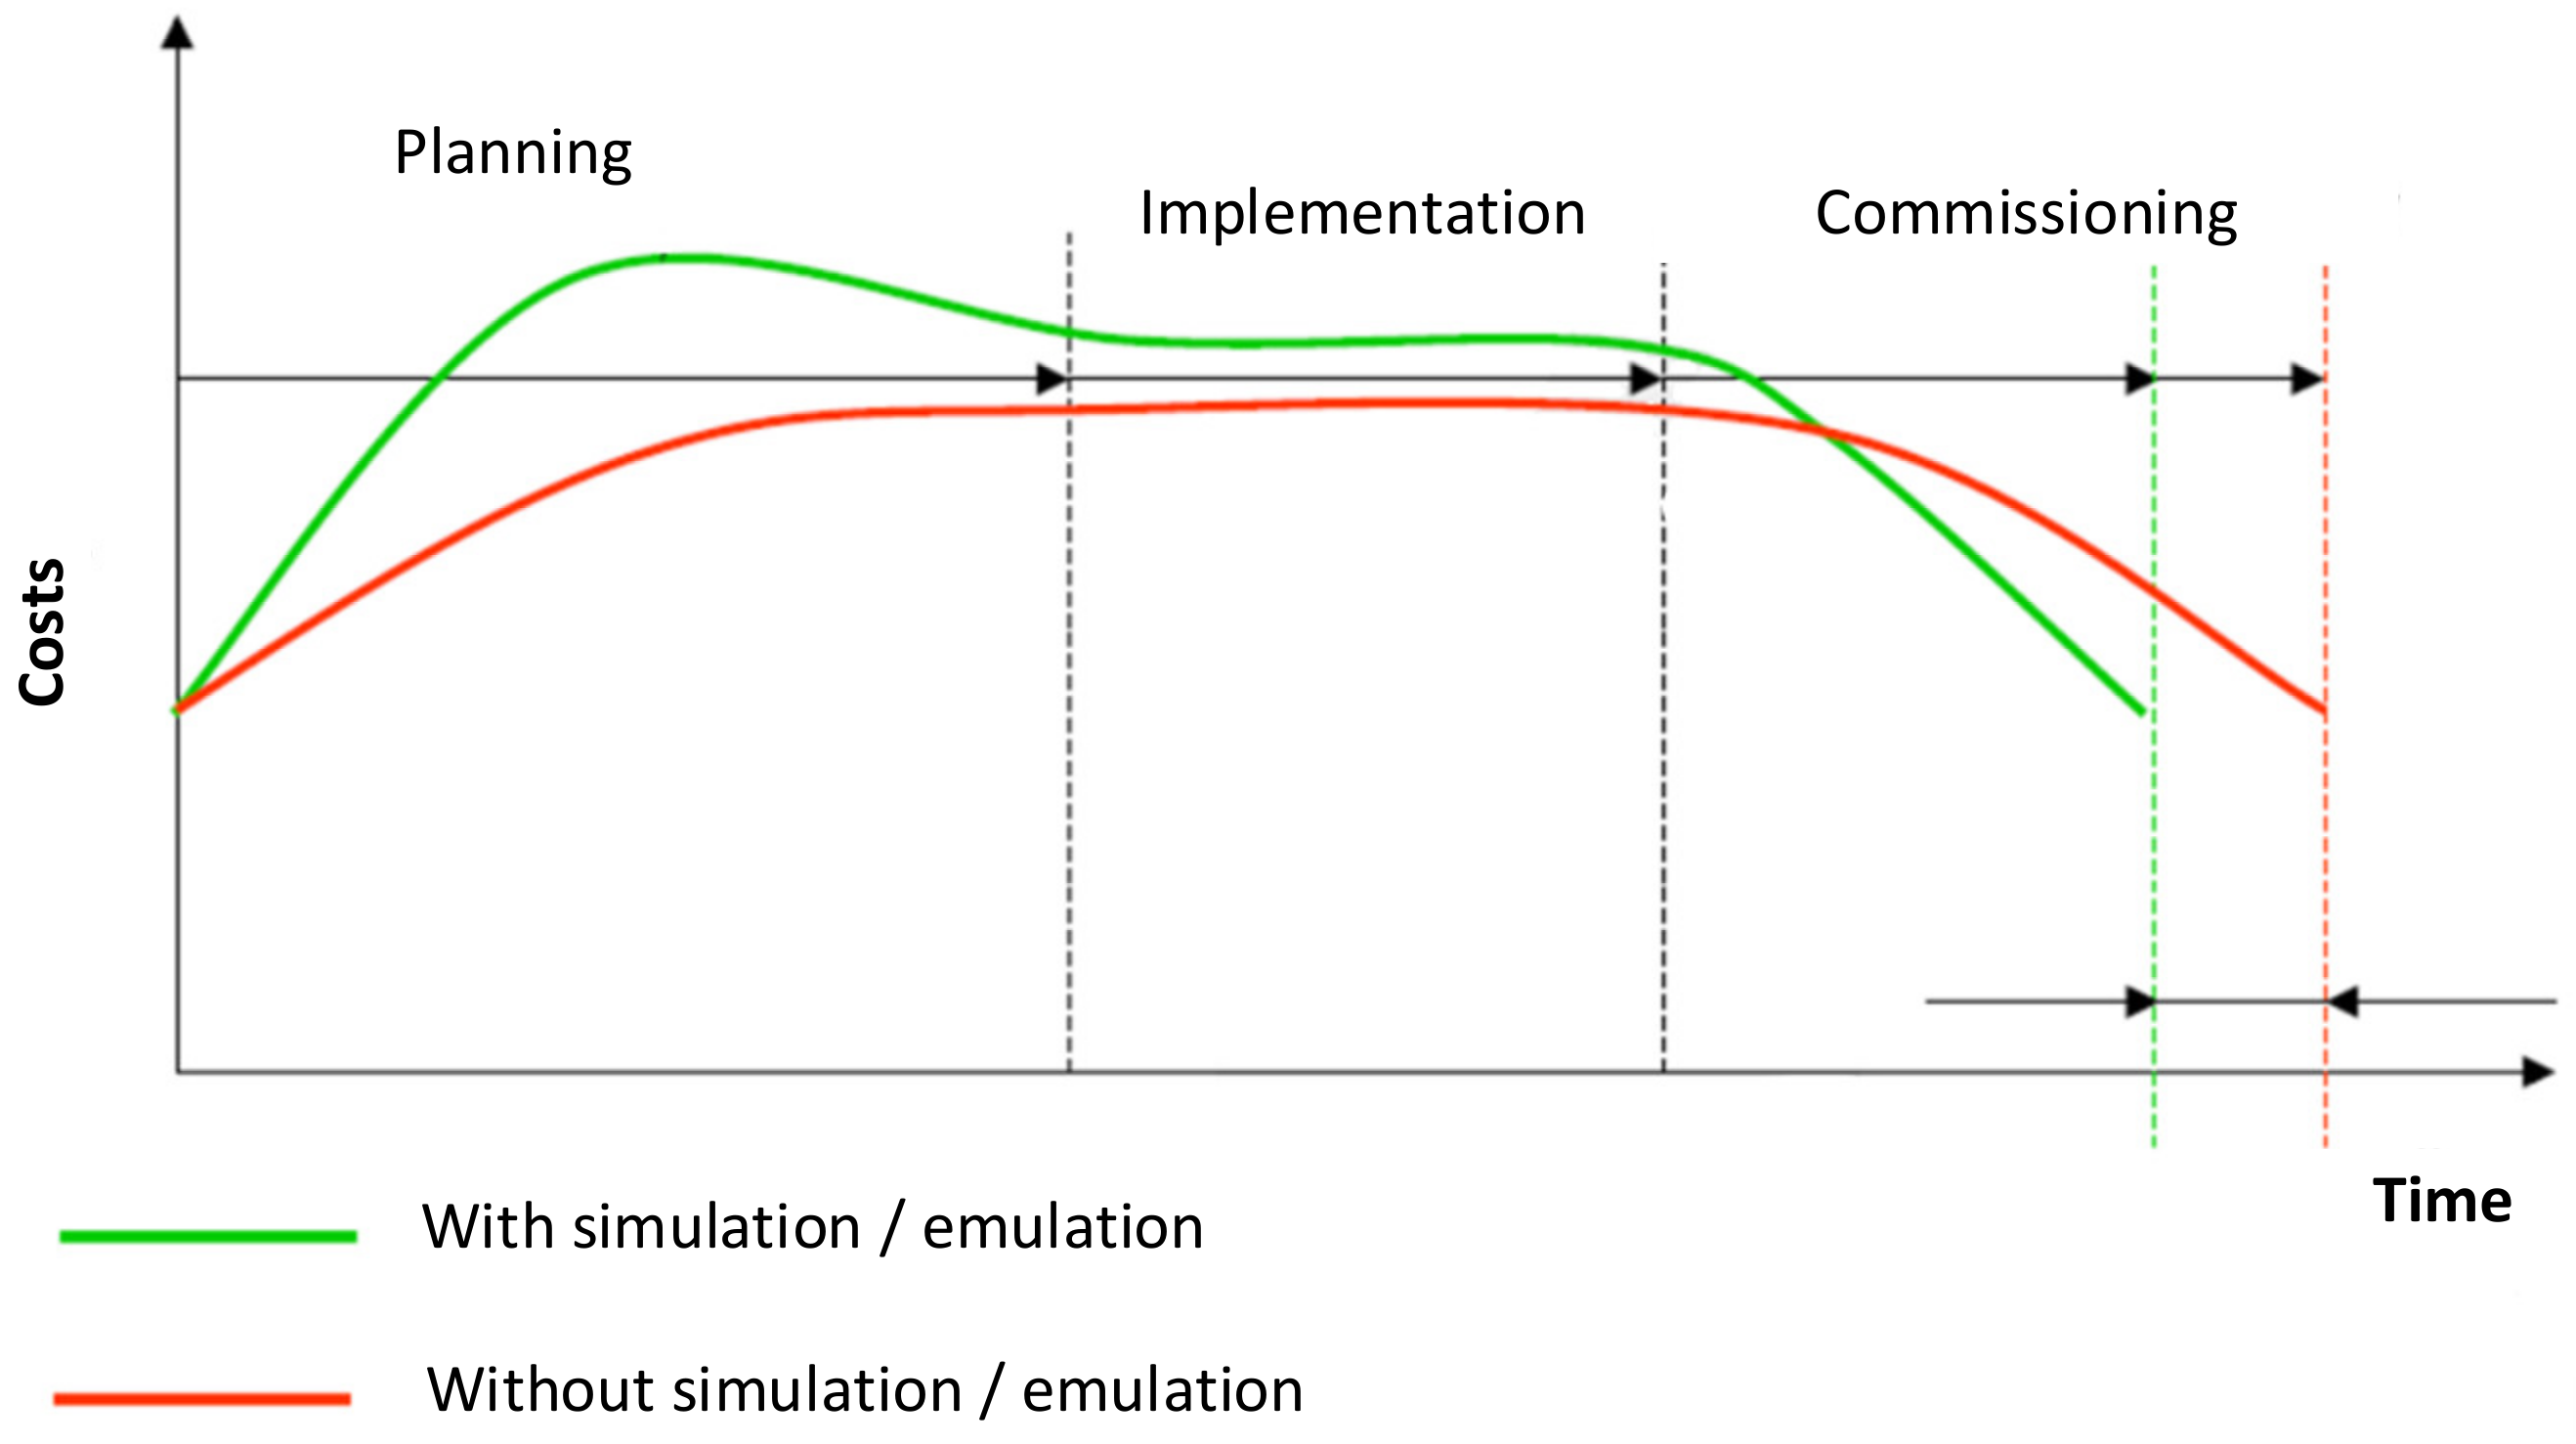
- Computer emulation helps to reduce the time spent on designing processes as well as make changes in real logistics. The time required to carry out these actions can be decreased when employing computer emulation for planning and implementing improvements in logistics processes (see Figure 14). This reduction is mostly due to the usage of software tools that, by utilising optimisation functions, will allow the verification process of various scenarios to be reduced while also assisting in the identification of possible future states of the system. From a time point of view, based on experimental results and the opinions of experts for manufacturing system design, it can be said that the portion of saved time is 27%. The difference between the results of the authors [21,22] is based on the methodology used for classic manufacturing design in the commissioning part, the experience of the designer, and the system size.
The constraints of the implementation of such a solution have been highlighted during study and testing. The basic limiting factor is access to a sufficiently fast full-hall Ethernet network. If a factory does not have such a network, then there will be no data transmission on the basis of which the simulation is carried out. RFID tags and RTLS were used in the research described here. An important prerequisite is the use of simulation software that can create a link to data collected in real time. This research was carried out on the Tecnomatix Plant Simulation platform, which allows for such a connection. No less important factor is the sufficient autonomy of the logistical element for which emulation is carried out. It should include appropriate hardware and software equipment so that it is capable of communicating. The main research limitation of the study was the high cost of the realised emulation system for the verification of AGV routes (Table 2) that limits research to a single test circuit with one AGV system.
The field of computer simulation is a prospective area, but there are still issues that can be addressed in future research. These include the development of automated data collection from manufacturing and logistics facilities in real time and the creation of communication channels with a system for planning and managing manufacturing. Based on such data, it will be possible to ensure continuous manufacturing in accordance with the customer requirements and capacities of the company. Furthermore, it is an area of creating a communication interface for linking the source codes of simulation models with the PLC of automatic logistics tractors. Such a link removes duplication when programming the logic of the proposed system. In the field of simulation software itself, a module can be created that, based on online data from the factory, will respond to events that have arisen by conducting simulation experiments in order to find an alternative manufacturing plan. These skills will become increasingly vital as navigation advances in-line with decentralised control and the concept of adaptive logistics systems.
5. Conclusions
The flexible response of the company to customer requirements and the changes in manufacturing programs nowadays decide on successful and unsuccessful factories. When modifying manufacturing, the system for testing logistics processes in real conditions provides a competitive advantage. This system is primarily designed for AGV as a part of logistics processes, through which it is possible to improve the utilisation and increase the efficiency of AGVs systems. However, it can be used in addition to testing the implementation of robots, robotic lines, and other systems using artificial intelligence.
The solution proposed a link between the simulation platform and the AGV logistics system. Computer emulation considers the stimuli from the real elements of the logistics system, and through the communication module, an input generator is created for the simulation model of the manufacturing system. This makes it possible to carry out computer emulation for logistics processes carried out by AGV. The research results fill a gap in the design of systems designed for verifying AGV routes or logistics and manufacturing systems through the process of emulation. The created application shows that in the environment of the Tecnomatix Plant Simulation software, it is possible to create an emulation environment for such verification runs.
The results show that, through computer emulation, logistics can be tested without the need to deploy all manufacturing facilities to prevent errors before they are physically deployed and start manufacturing. Other advantages of emulation include reduced design time and modifications in actual logistics, increased labour productivity in logistics planning, and the use of the emulation system as a support tool for reviewing suggested logistics system measures.
The functionality itself has been verified by experimental tests in laboratory conditions and on a circuit composed of a workplace tag, loading and unloading, an intersection, and a charging point. This system was created for the verification and validation of AGV routes using elements of automated logistics in industrial organisations, based on the interconnection of the real and virtual worlds using computer simulation and emulation.
Author Contributions
Conceptualization, M.G.; methodology, R.H.; software, Š.M.; formal analysis, R.H.; investigation, R.H.; resources, Š.M.; data curation, R.H.; writing—review and editing, M.G. and P.G.; visualization, Š.M.; supervision, M.G.; project administration, P.G.; funding acquisition, P.G. All authors have read and agreed to the published version of the manuscript.
Funding
Scientific Grant Agency under contract no. VEGA 1/0225/21.
Institutional Review Board Statement
Not applicable.
Informed Consent Statement
Not applicable.
Data Availability Statement
The data presented in this study are available on request from the corresponding author. Due to company privacy, the full text of the data is not publicly available.
Acknowledgments
This article was created with the support of the VEGA project: VEGA 1/0225/21.
Conflicts of Interest
The authors declare no conflict of interest.
References
- Worobel, R.; Capek, J.; Kovacova, L.; Bubenik, P.; Krajcovic, M. Improving Business Processes Using Simulation Tools. MM Sci. J. 2018, 2018, 2244–2251. [Google Scholar] [CrossRef]
- Wiecek, D.; Wiecek, D.; Kuric, I.; Buckova, M.; Krajcovic, M. Evaluation of the Effectiveness of Implementing Production Logistics Automation Systems Supported by Computer Simulation Tools. In Proceedings of the Modern Technologies in Manufacturing (MTEM 2019), Cluj, Romania, 9–12 October 2019; Balc, N., Leordean, D., Eds.; EDP Sciences: Les Ulis, France, 2019; Volume 299, p. 02007. [Google Scholar] [CrossRef] [Green Version]
- Petrikova, A.; Trebuna, P. Application of Selected Logistic Methods in the Area of Supply Logistics. Acta Montan. Slovaca 2017, 22, 323–334. [Google Scholar]
- Nielsen, I.; Dang, Q.-V.; Nielsen, P.; Pawlewski, P. Scheduling of Mobile Robots with Preemptive Tasks. In Proceedings of the Distributed Computing and Artificial Intelligence: 11th International Conference, Salamanca, Spain, 4–6 June 2014; Omatu, S., Bersini, H., Corchado, J.M., Rodriguez, S., Pawlewski, P., Bucciarelli, E., Eds.; Springer: Berlin/Heidelberg, Germany, 2014; Volume 290, pp. 19–27. [Google Scholar] [CrossRef]
- Krajcovic, M.; Plinta, D. Comprehensive Approach to the Inventory Control System Improvement. Manag. Prod. Eng. Rev. 2012, 3, 34–44. [Google Scholar] [CrossRef]
- Pekarcikova, M.; Trebuna, P.; Kliment, M.; Trojan, J. Demand Driven Material Requirements Planning. Some Methodical and Practical Comments. Manag. Prod. Eng. Rev. 2019, 10, 50–59. [Google Scholar] [CrossRef]
- Buckova, M.; Krajcovic, M.; Plinta, D. Use of Dynamic Simulation in Warehouse Designing. In Proceedings of the Intelligent Systems in Manufacturing Engineering and Maintenance, Wrocław, Poland, 17–18 September 2018; Burduk, A., Chlebus, E., Nowakowski, T., Tubis, A., Eds.; Springer International Publishing: Cham, Switzerland, 2019; Volume 835, pp. 485–498. [Google Scholar] [CrossRef]
- Grznar, P.; Gregor, M.; Krajcovic, M.; Mozol, S.; Schickerle, M.; Vavrik, V.; Durica, L.; Marschall, M.; Bielik, T. Modeling and Simulation of Processes in a Factory of the Future. Appl. Sci. 2020, 10, 4503. [Google Scholar] [CrossRef]
- Banks, J.; Carson, J.S.; Nelson, B.; Nicol, D.M. Discrete-Event System Simulation, 5th ed.; Pearson: London, UK, 2013; p. 568. ISBN 9781292037264. [Google Scholar]
- Micieta, B.; Fusko, M.; Binasova, V.; Furmannova, B. Business Model Canvas in Global Enterprises. In Sustainability in the Global-Knowledge Economy, Proceedings of the 19th International Scientific Conference Globalization and Its Socio-Economic Consequences, Rajecké Teplice, Slovakia, 21–22 October 2020; Kliestik, T., Ed.; EDP Sciences: Les Ulis, France, 2020; Volume 74, p. 02010. [Google Scholar] [CrossRef]
- Bisták, M.B.; Brumerčík, F.B.; Lukáč, M.L. Weighing Systems in Traffic. Sci. J. Sil. Univ. Technol. Ser. Transp. 2017, 97, 5–15. [Google Scholar] [CrossRef]
- Gregor, M.; Spalek, J. Novelty Detector for Reinforcement Learning Based on Forecasting. In Proceedings of the 2014 IEEE 12th International Symposium on Applied Machine Intelligence and Informatics (SAMI), Herl’any, Slovakia, 23–25 January 2014; IEEE: New York, NY, USA, 2014; pp. 73–78. [Google Scholar]
- Pekarcikova, M.; Trebuna, P.; Kliment, M.; Dic, M. Solution of Bottlenecks in the Logistics Flow by Applying the Kanban Module in the Tecnomatix Plant Simulation Software. Sustainability 2021, 13, 7989. [Google Scholar] [CrossRef]
- Michna, Z.; Disney, S.M.; Nielsen, P. The Impact of Stochastic Lead Times on the Bullwhip Effect under Correlated Demand and Moving Average Forecasts. Omega Int. J. Manag. Sci. 2020, 93, 102033. [Google Scholar] [CrossRef] [Green Version]
- Klosowski, G.; Gola, A.; Amila, T. Computational Intelligence in Control of AGV Multimodal Systems. IFAC-PapersOnLine 2018, 51, 1421–1427. [Google Scholar] [CrossRef]
- Palajová, S. Simulačné Metamodelovanie Výrobných Systémov. Ph.D. Thesis, University of Žilina, Žilina, Slovakia, 2012. [Google Scholar]
- Hodoň, R.; Gregor, M.; Grznár, P. Rozvrhovanie výroby využitím dynamickej simulácie. In Industrial Engineering-Invention for Enterprise, Proceedings of the InvEnt 2018, Žilina, Slovakia, 14–15 June 2018; Wydawnictwo Fundacji Centrum Nowych Technologii: Žilina, Slovakia; ISBN 978-80-89865-07-9.
- Hodoň, R. Design of logistic processes using computer emulation. In Advanced Industrial Engineering; Wydawnictwo Naukowe Akademii Techniczno-Humanistycznej: Bielsko-Biała, Poland, 2019; pp. 105–122. ISBN 978-83-66249-29-5. [Google Scholar]
- LeBaron, T.; Thompson, K. Emulation of a Material Delivery System. In Proceedings of the 1998 Winter Simulation Conference; Proceedings (Cat. No.98CH36274), Washington, DC, USA, 13–16 December 1998; Volume 2, pp. 1055–1060. [Google Scholar] [CrossRef] [Green Version]
- Hibino, H.; Fukuda, Y. Emulation in Manufacturing Engineering Processes. In Proceedings of the 2008 Winter Simulation Conference, Miami, FL, USA, 7–10 December 2008; pp. 1785–1793. [Google Scholar] [CrossRef] [Green Version]
- Koflanovich, N.; Hartman, P. Live Modernizations of Automated Material Handling Systems: Bridging the Gap between Design and Startup Using Emulation. In Proceedings of the 2010 Winter Simulation Conference, Baltimore, MD, USA, 5–8 December 2010; pp. 1716–1726. [Google Scholar] [CrossRef]
- Starner, C.; Chessin, M. Using Emulation to Enhance Simulation. In Proceedings of the 2010 Winter Simulation Conference, Baltimore, MD, USA, 5–8 December 2010; pp. 1711–1715. [Google Scholar] [CrossRef] [Green Version]
- Yuhua, C.; Yun, Z.; Hongguang, P.; Yunxia, L. The Application of the FLEXSIM in the Emulation of the Logistics System in the Manufacturing Enterprises. In Proceedings of the 14th International Conference on Industrial Engineering and Engineering Management, Volumes A and B: Building Core Competencies through Ie&em, Tianjin, China, 20–22 October 2007; Qi, E., Ed.; China Machine Press: Beijing, China, 2007; pp. 293–298. [Google Scholar]
- Kong, X.T.R.; Huang, G.Q.; Du, M.L. A Physical Emulation Model of Cellular Warehousing for E-Commerce Logistics. In Proceedings of the 11th CIRP Conference on Industrial Product-Service Systems, Zhuhai, China, 29–31 May 2019; Huang, G.Q., Qu, T., Thurer, M., Xu, S., Khalgui, M., Eds.; Elsevier: Amsterdam, The Netherlands, 2019; Volume 83, pp. 339–344. [Google Scholar] [CrossRef]
- Hofmann, W.; Langer, S.; Lang, S.; Reggelin, T. Integrating Virtual Commissioning Based on High Level Emulation into Logistics Education. In Proceedings of the 16th International Scientific Conference Reliability and Statistics in Transportation and Communication (RELSTAT-2016), Riga, Latvia, 19–22 October 2016; Kabashkin, I., Yatskiv, I., Prentkovskis, O., Eds.; Elsevier Science: Amsterdam, The Netherlands, 2017; Volume 178, pp. 24–32. [Google Scholar] [CrossRef]
- Krajcovic, M.; Gabajova, G.; Furmannova, B.; Vavrik, V.; Gaso, M.; Matys, M. A Case Study of Educational Games in Virtual Reality as a Teaching Method of Lean Management. Electronics 2021, 10, 838. [Google Scholar] [CrossRef]
Figure 1.
Design of system structure for verification of logistics processes using emulation.

Figure 2.
The algorithm of the control system for AGVs.

Figure 3.
The production planning and control process.

Figure 4.
The virtual part of the system for verification of logistics processes.

Figure 5.
The simulation-model creation algorithm.

Figure 6.
The emulation-simulation modelling algorithm.

Figure 7.
The principle of the communication interface in AGV—Simulation software.

Figure 8.
Illustration: (a) automatic data collection module architecture; (b) tag distribution on the AGV path.
Figure 8.
Illustration: (a) automatic data collection module architecture; (b) tag distribution on the AGV path.

Figure 9.
AGV monitor application (processed in the AGV Monitor 3.0 software application).

Figure 10.
Illustration: (a) physical test site; (b) simulation-software-created testing centre.

Figure 11.
Position of the future workplace located on the defined tag 13.

Figure 12.
Information Window on AGV Activities in the Simulation Model (processed in Tecnomatix Plant Simulation).
Figure 12.
Information Window on AGV Activities in the Simulation Model (processed in Tecnomatix Plant Simulation).

Figure 13.
Illustration: (a) Stock status at the workplace during normal operation; (b) AGV use during normal operation.
Figure 13.
Illustration: (a) Stock status at the workplace during normal operation; (b) AGV use during normal operation.

Figure 14.
Cost during the project with and without the use of simulation and emulation.


Table 1.
Results of experiments.
| Parameter | Experiment 2 | Experiment 3 |
|---|---|---|
| driving time | 66.27 | 56.94 |
| crossroad time | 0.00 | 0.00 |
| load/unload time | 5.91 | 7.69 |
| blocked time | 15.87 | 14.96 |
| charging time | 11.95 | 20.41 |
Table 2.
Estimation of the economic complexity of deploying a system for verification of AGV routes using computer emulation.
Table 2.
Estimation of the economic complexity of deploying a system for verification of AGV routes using computer emulation.
| Parts of the Proposed System Concept | Contents of Individual Parts of the System | Estimated Costs Incurred |
|---|---|---|
| Real logistics elements | Hardware elements of the system | 15,000–50,000 EUR |
| AGV control system | 5000–60,000 EUR | |
| Virtual model | Creating a simulation model for trained workers and purchasing a professional license | 50,000–130,000 EUR |
| Creation of a simulation model by an external company with the purchase of a basic simulation software license | 5000–7000 EUR + 550–700 EUR/man-days | |
| Communication module | Application programming for communication between real and virtual elements | 450–750 EUR/man-days |
| Module for automatic data collection | Hardware elements of the system | 1000 EUR/pcs. |
| Software elements of the system | 10,000–18,000 EUR | |
| Additional parts of the proposed system concept | ||
| System support and maintenance | Implementation, maintenance, and technical support of the deployed system | 30,000–150,000 EUR |
Publisher’s Note: MDPI stays neutral with regard to jurisdictional claims in published maps and institutional affiliations. |
© 2022 by the authors. Licensee MDPI, Basel, Switzerland. This article is an open access article distributed under the terms and conditions of the Creative Commons Attribution (CC BY) license (https://creativecommons.org/licenses/by/4.0/).
Share and Cite
MDPI and ACS Style
Gregor, M.; Hodoň, R.; Grznár, P.; Mozol, Š. Design of a System for Verification of Automatic Guided Vehicle Routes Using Computer Emulation. Appl. Sci. 2022, 12, 3397. https://doi.org/10.3390/app12073397
AMA Style
Gregor M, Hodoň R, Grznár P, Mozol Š. Design of a System for Verification of Automatic Guided Vehicle Routes Using Computer Emulation. Applied Sciences. 2022; 12(7):3397. https://doi.org/10.3390/app12073397
Chicago/Turabian StyleGregor, Milan, Róbert Hodoň, Patrik Grznár, and Štefan Mozol. 2022. "Design of a System for Verification of Automatic Guided Vehicle Routes Using Computer Emulation" Applied Sciences 12, no. 7: 3397. https://doi.org/10.3390/app12073397
Note that from the first issue of 2016, this journal uses article numbers instead of page numbers. See further details here.