
A Satellite Data Mining Approach Based on Self-Organized Maps for the Early Warning of Ground Settlements in Urban Areas


1
Department of Electrical and Electronical Engineering, University of Cagliari, 09123 Cagliari, Italy
2
Department of Civil and Environmental Engineering and Architecture, University of Cagliari, 09123 Cagliari, Italy
*
Author to whom correspondence should be addressed.
Appl. Sci. 2022, 12(5), 2679; https://doi.org/10.3390/app12052679
Submission received: 17 December 2021
/
Revised: 15 February 2022
/
Accepted: 1 March 2022
/
Published: 4 March 2022
(This article belongs to the Section Computing and Artificial Intelligence)
Abstract
:Featured Application
The proposed method is a neural-network-based tool for the early warning of ground settlement hazard in urban areas. On the basis of the analysis of MT-InSAR data through an unsupervised learning, the method can find precursors of similar time-evolving phenomena. The method can be applied under different warning criteria and for different hyper-parameters of the monitoring system.
Abstract
Structural failure prevention is a crucial issue in civil engineering. The causes of structure or infrastructure collapse include phenomena that slowly deform the ground and could affect the stability of foundations such as differential settlements, subsidence, groundwater changes, slope failure, or landslides. When large urban areas need to be monitored, such phenomena are hard to be mapped by means of classical structural health monitoring methods due to the unaffordable quantity of in situ measurements these methods would entail. A very effective alternative is exploiting multitemporal interferometric synthetic aperture radar (MT-InSAR) displacement timeseries which would enable the monitoring of wide geographical areas over a weekly basis and extended spatial coverage. Analyzing the enormous amount of data produced by MT-InSAR may help to assess the time evolution of phenomena but can barely highlight “anomalous” ground deformations in time, to prevent likely structural failure. This paper proposes a method which analyzes the InSAR data through an unsupervised learning paradigm with the purpose of detecting critical events at their early stage. On the basis of similarities among time sequences, this method allows the finding of precursors of anomalous ground settlement behaviors, the correct framing of which should be directed to specialist evaluation and in situ inspections.
1. Introduction
Structural integrity and collapse prevention are very important aspects of civil engineering. A crucial goal in this field is to mitigate the risk of foundation downfalls which may entail loss of stability and even sudden failures of structures and infrastructures [1,2,3]. Different causes may trigger the progressive collapse of a building, the downfall of a bridge pile, or sinkholes. Ground subsidence [4], debris flow, excavation and tunneling activities [5], groundwater changes, slope failure, problematic foundation soils [6], bad interaction between soil and foundation, landslide due to volcanic activity or to pipes that burst, and liquefaction of soil after strong ground motions [7] are just some instances of phenomena that may affect the stability of structures and infrastructures.
Assessing the causes of structural failures is generally a hard task, which requires the knowledge of a great amount of information (i.e., structural characteristics, soil properties, soil–structure interaction, rainfall, and climatic data), hardly available during the monitoring phase. Regardless of the causes and the likely solutions of a given critical phenomenon, however, a preliminary monitoring stage is essential to prevent catastrophic events. For this purpose, a largescale continuous monitoring of time-evolving phenomena that might affect the stability of engineering facilities in urban areas would be very useful. Health monitoring of civil structures and infrastructures is typically conducted through in situ nondestructive techniques [8,9,10,11]. However, when very long structures or blocks of many buildings are to be monitored, classical methods may become overly expensive and difficult to apply in practice. In such cases, global positioning system (GPS) techniques can be profitably used [12,13], even combined with traditional local measurements [14] and remote sensing techniques [15].
Very effective remote sensing techniques are based on exploiting multitemporal interferometric synthetic aperture radar (MT-InSAR) displacement timeseries, which enable the monitoring of wide geographical areas over a weekly basis and extended spatial coverage. In fact, they are widely used for hazard assessment of very large or not accessible zones (due, for instance, to military conflicts or extreme climate conditions) [16,17]. The fields where MT-InSAR techniques can be applied are several, ranging from archaeological detection [18], glacier dynamic assessment [19], and environmental impact monitoring [20] to several civil engineering applications [21,22,23,24,25,26,27].
The potential of MT-InSAR techniques can be amplified by their combination with advanced methods of data analysis. The use of computational algorithms to analyze remote sensing data has been expanding for over half a century [28], since crop identification based on the Apollo satellite spectral data was produced in the 1970s [29]. More recently, neural-network-based algorithms were used to analyze geological data for different purposes, including detection of hydrocarbon resources, pollution, and oil spills [30], classification of complex natural ecosystems [31,32], creating hazard survey maps in earthquake-prone areas [33], and assessment of some properties of soils [34,35]. In the civil engineering field, neural-network-based methods are currently used, for instance, to predict blast-induced ground vibrations [36], to control the behavior of buildings subjected to ground motion [37], to improve the features extraction under ultrasonic tests [38], or to optimize the structural design [39].
Neural-network-based algorithms have also been applied to analyze InSAR data in urban or suburban areas [25,40,41,42]. The present paper aims to contribute to move toward an automatized method for monitoring ground settlements in urban areas, with the purpose of highlighting hazardous events at their early stage.
The proposed method is based on the combination of MT-InSAR techniques, which allow continuously collecting timeseries of surface deformations at a high-density grid of geographical points, and an artificial neural-network-based algorithm, which enables processing big data in real time, leading to an automatized alert system. On the basis of similarities between timeseries, the method aims to find precursors of likely ongoing critical surface deformations at their early stage. Empirical and analytical studies, in fact, showed that precursors may typically help to forecast some phenomena such as ground high stress in tunnels [43] or landslides [44]. The method here presented is based on the preliminary choice of a warning criterion that leads to finding the precursors of similar phenomena. To test the ability of the method, two warning criteria are assumed in the paper and, accordingly, two monitoring strategies are applied to a dataset of MT-InSAR timeseries relevant to a large urban area. It is to note, however, that the method can be applied under different warning criteria and monitoring strategies, with those considered in the present study being just two of the many conceivable. It is also to note that the considered dataset is only used to show the ability of the method to generate early-stage warnings accordingly to the assumed warning criterion and monitoring strategy. Any consideration about the geological phenomena detected while testing the efficacy of the method in the considered area is beyond the purpose of the present study.
Lastly, it should be mentioned that several early-warning systems have been developed in the last decades to forecast various kinds of hazards. In civil engineering, optimized structural health monitoring technologies and data processing techniques have been adopted for early warning in seismic-prone zones, [45,46]. The method presented in this paper fits into this line of research, its novelty lying in the capability to forecast events related to early-stage ground settlements in urban areas by analyzing InSAR data through an unsupervised learning paradigm.
2. Description of the Method
The warning system proposed in this work is based on a model-free approach. According to this paradigm, forecasting a critical event does not require an analytical model of the soil behavior, but rather the identification of similarities between series of measurements acquired at different times and locations. Basically, it is assumed that a critical event is preceded by precursors, which may lead to detecting an ongoing event at its early stage. Leveraging a proper metric in the space of the considered behaviors, the model-free approach is able to recognize such precursors. This type of approach has two main advantages over the conventional model-based approach. The first one is that it also allows identifying phenomena never studied before. The second advantage is that the recorded data are handled regardless of their physical meaning, reducing the need for preprocessing raw data.
A brief description of the neural techniques used to identify similarities between data series is firstly discussed in Section 2.1, while a detailed description of the proposed approach is provided in Section 2.2.
2.1. Clustering of Data
Artificial neural networks (ANNs) are mathematical tools based on the so-called “connectionist paradigm” [47,48], which stores information by means of the connections of a structure rather than through a set of memory cells. ANNs are made of networks of elementary processors linked together by weighted connections. This is, in fact, the typical paradigm adopted by the human brain, where the knowledge is built by processing data through the synapse network rather than by simply storing information in neurons. Although much less complex than the human brain, ANNs derive their name just from the paradigm similarity with it. Among the brain processes that ANNs can imitate, the most appealing is that of “learning” from experience, i.e., building functional relations on the basis of sets of learning examples.
A wide variety of techniques may be adopted to train ANNs, all of them being based on two essential elements: a training set and a training rule. The training rule establishes how the weights of the synapses should be modified to adapt the network to the training set. Since this rule mostly does not lead explicitly to a complete learning, iterative algorithms are usually needed. In general, ANNs can be based on supervised [49] or on unsupervised learning [50,51]. In the supervised learning, the neural network is exploited to reproduce a functional connection between input and output variables, the values of which are known for all the learning examples. A target value must be set for each learning example, which is taken as the expected output. Because the discrepancy between calculated and expected output values depends on the connection weights, the learning strategy tries to modify such weights in order to minimize the error. Should the learning process be successfully performed, the network can generalize the acquired information, being able even to associate outputs to inputs not belonging to the training set. The supervised learning has been the most adopted, and it is responsible for the widespread success that ANNs had in a lot of scientific fields.
However, neither target values nor strategies to minimize the errors are adopted by the human brain, the learning of which is in fact unsupervised. Inspired by the brain’s learning strategy, the ANNs originally used unsupervised approaches, where the weights of the synapses continuously change in response to both external stresses (electrical impulses in the brain) and neuron replies. According to the information given by the inputs, the unsupervised learning can handle properties of a set of patterns and map its distribution in the input space. Analogies between different patterns can also be put in evidence, thus leading to a subdivision of a population into aggregates (clusters). The connection weights that are linked to the same neuron represent a prototype of the cluster, generally not coinciding with any example of the training set, even if it would have all the properties to be one of them. The learning process tries to make the prototype as similar as possible to the network input. One of the main activities of unsupervised ANNs is the clustering, which is usually based on a competitive learning (self-organized map, SOM) [51], where the different prototypes compete to win the learning step, i.e., the possibility to change their weights.
The most known rule is “the winner takes all” [52], which results in an iterative process of changing the prototype to make it to be more like the input and to increase such a likeness as much as possible. Thus, the distribution can be divided into clusters, each cluster being defined by a prototype which is the winner of the points belonging to that cluster. At the end of the process, each prototype tends to converge to the barycenter of the relevant cluster. Once the positions of the prototypes are stabilized, i.e., once the weights have converged to a stable value, they are frozen, and the training phase is concluded. At this point, the network can be used to perform a classification of new patterns, by associating them to one of the individuated clusters. The recall of the network is performed by feeding the patterns to be analyzed to the trained network.
It is worth noting that unsupervised learning can highlight properties of the distribution that are difficult to be estimated a priori, especially when the elements are defined by many variables. In the present study, the clustering process is exploited to find analogies between ground displacement behaviors occurring in different geographical locations and temporal occurrences. In particular, the analogy between behaviors preceding past anomalous events and similar actual behaviors can be exploited to generate alerts during the monitoring phase, calling for further in situ investigations.
2.2. Development of the Warning System
The proposed method entails the analysis of MT-InSAR timeseries to reveal analogies among reference behaviors that are assumed to be precursors of critical events, at different times and geographical positions. To this end, the capability of self-organizing maps to cluster the distribution of patterns on the basis of their similitude is exploited. In this method, the patterns are MT-InSAR displacement timeseries of preset duration. The historical data of the examined area are mapped by the self-organized map (SOM), and the clusters containing patterns that precede critical events are labeled as warning clusters. During the monitoring phase, the current timeseries acquired in the whole area are mapped by the trained SOM, and those falling within the warning clusters are taken to be further enquired by means of in situ inspections. It is to note in fact that the method assumes that similar critical events have similarly featured precursors. Although being reasonable and generally confirmed by the literature [43,44], this assumption is of course an empirical one, which may also lead to false warnings.
The criticalness of an event could be assessed on the basis of a feature of the timeseries (velocity, range, maximum/minimum value, etc.) or by referring to a reference record (an event occurred in the past). The assessment based on a feature of the timeseries (feature-based assessment) can be applied automatically to an available database of sequences, without the need for reference records. The assessment based on a reference record (record-based assessment) carries out the monitoring of the area referring to a past event, requiring a preliminary analysis of the historical data by an expert.
Regardless of which criterion is adopted for stating the criticalness of an event, the observation time adopted in the analysis is crucial for the suitability of the method. In general, the phenomena involving soil movements may be characterized by different evolution in time. A too short observation time makes it difficult to detect precursors of warning trends, since the phenomena of interest may not yet have completely developed; on the other hand, a too long observation time may mask the warning trend. Therefore, the best approach is to run in parallel several monitoring systems with different observation times. The choice of the most suitable set of observation times may be led by the manager of the monitoring system.
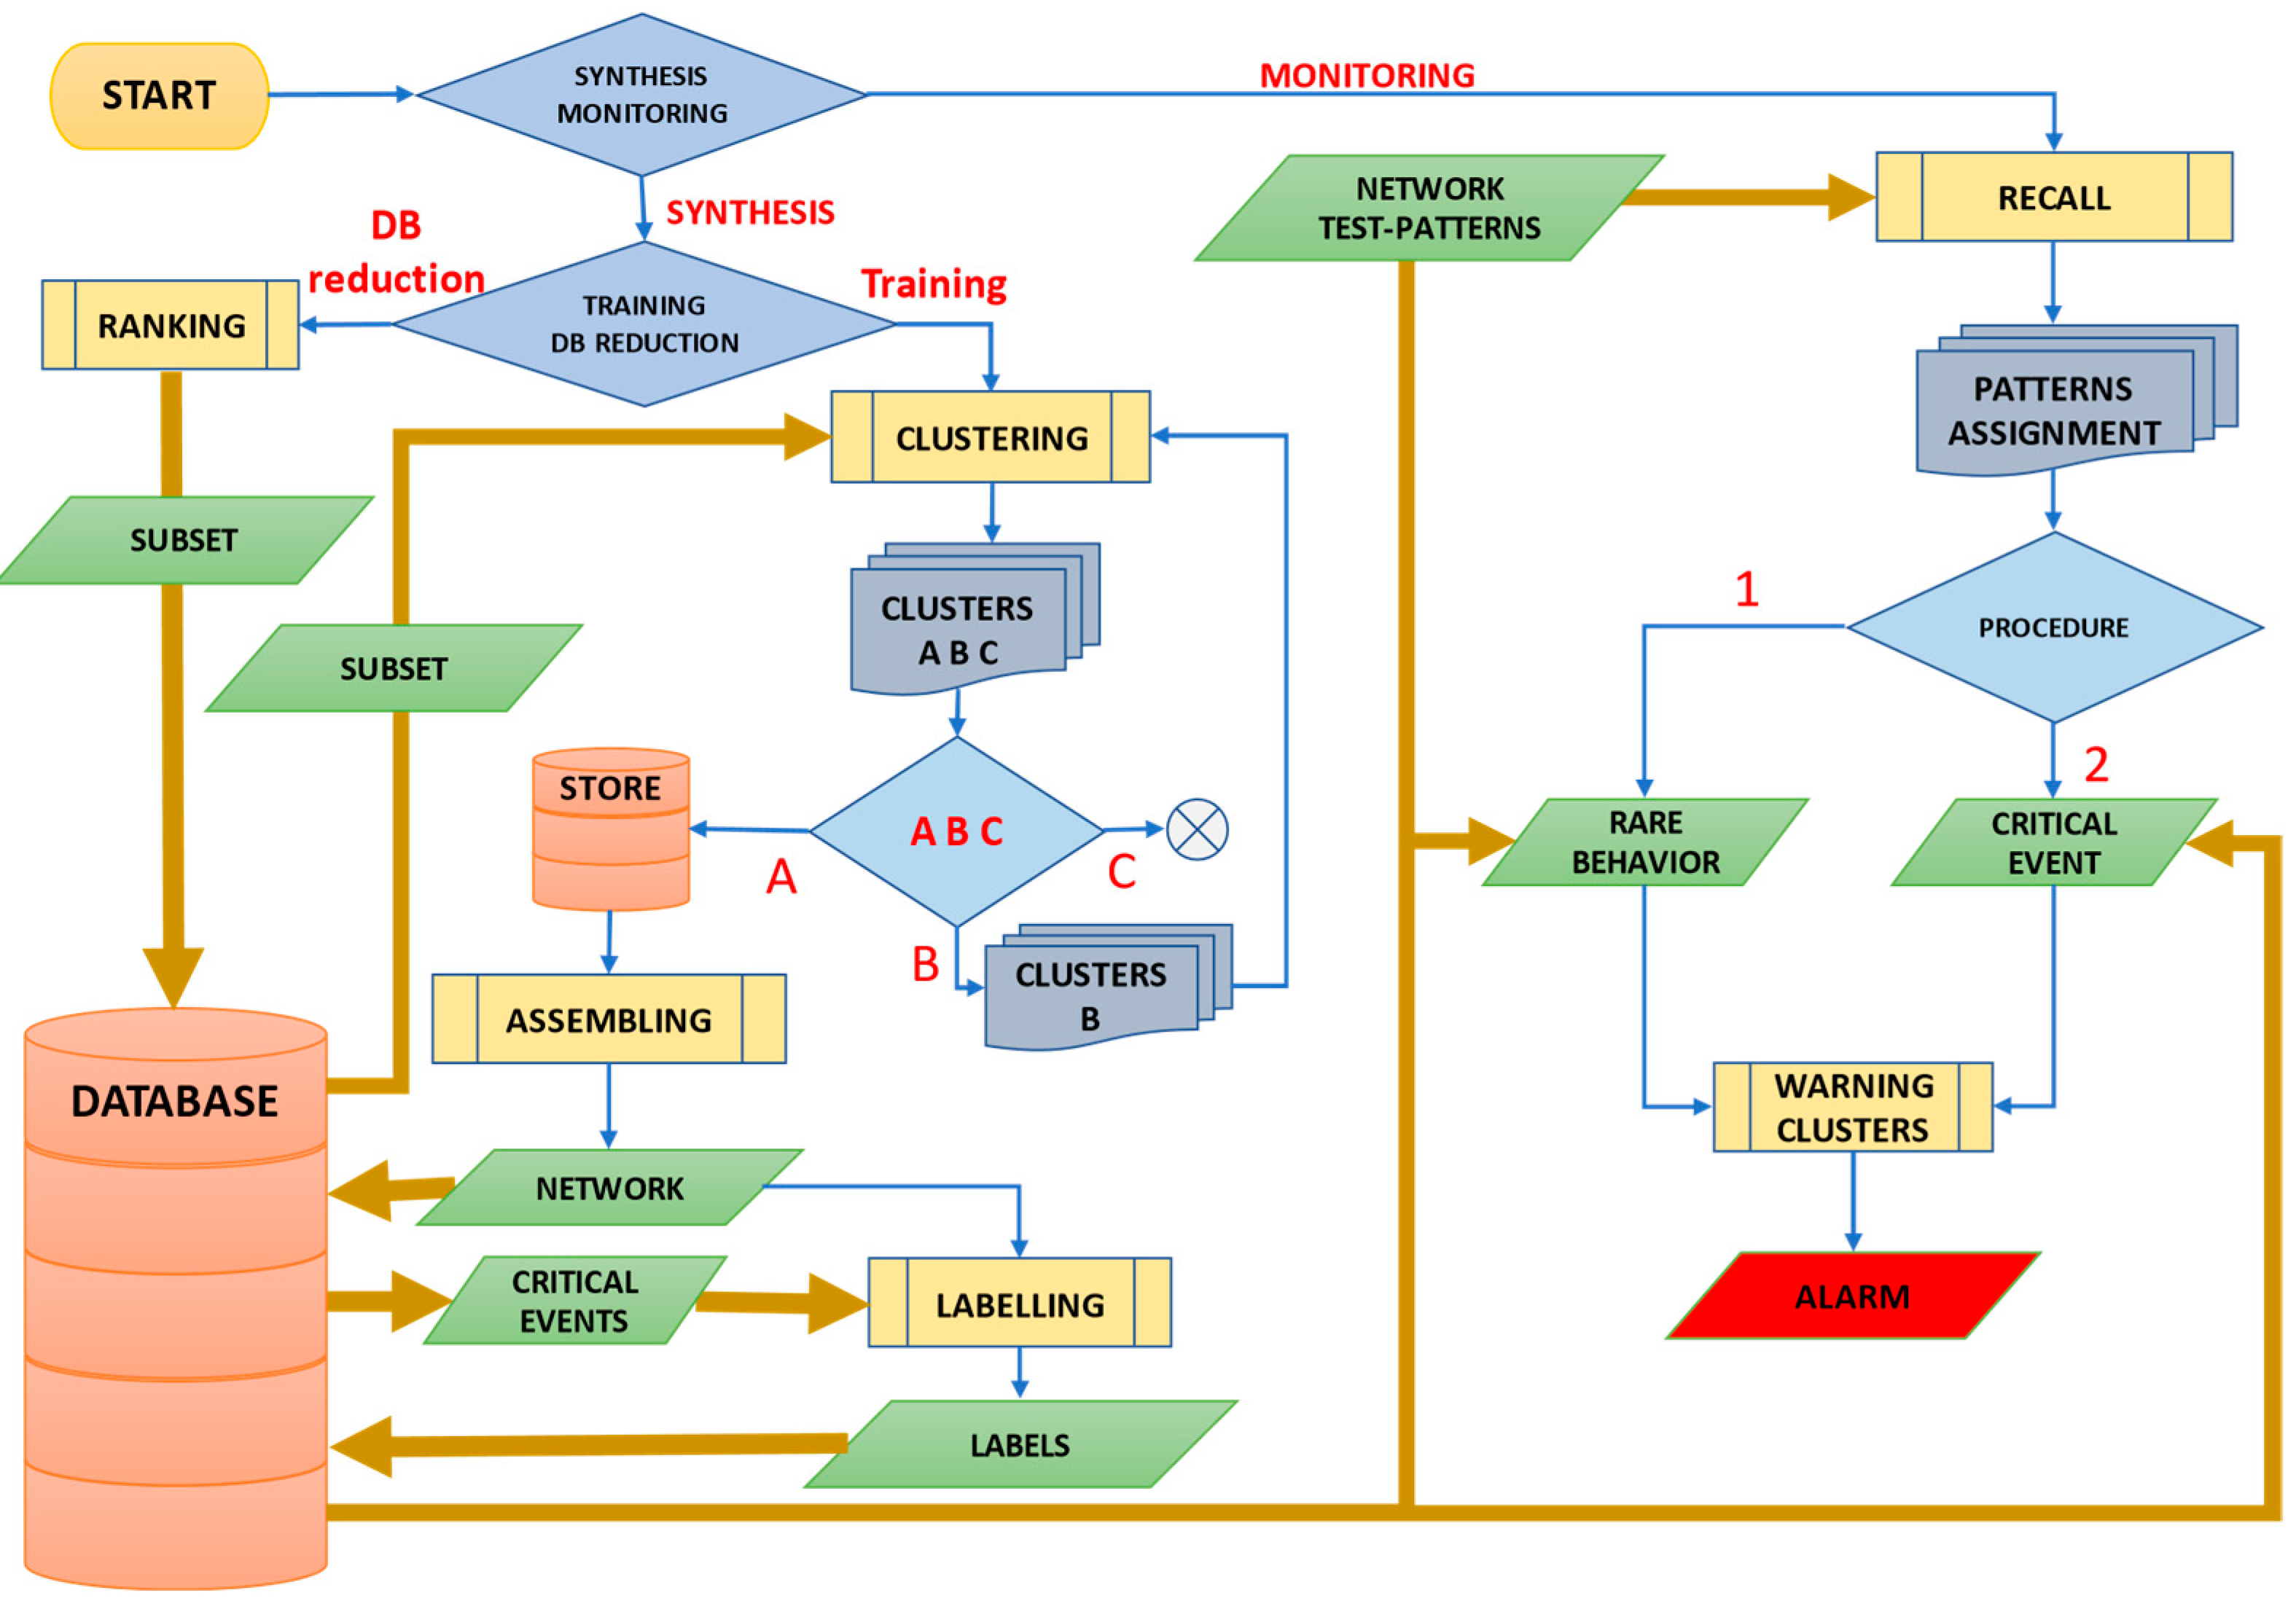
The flowchart diagram of the warning system is depicted in Figure 1. An observation time is assumed to be initially preset. The diagram describes the procedures of both training (synthesis) and recall (monitoring). In the synthesis step, an SOM neural network is trained to cluster the timeseries on the basis of their similitude. In the monitoring step, the timeseries are fed to the trained SOM, which assigns each one to the corresponding cluster. An alarm is raised when a timeseries is assigned to a warning cluster. The synthesis and monitoring procedures are described below in detail.
2.2.1. Synthesis
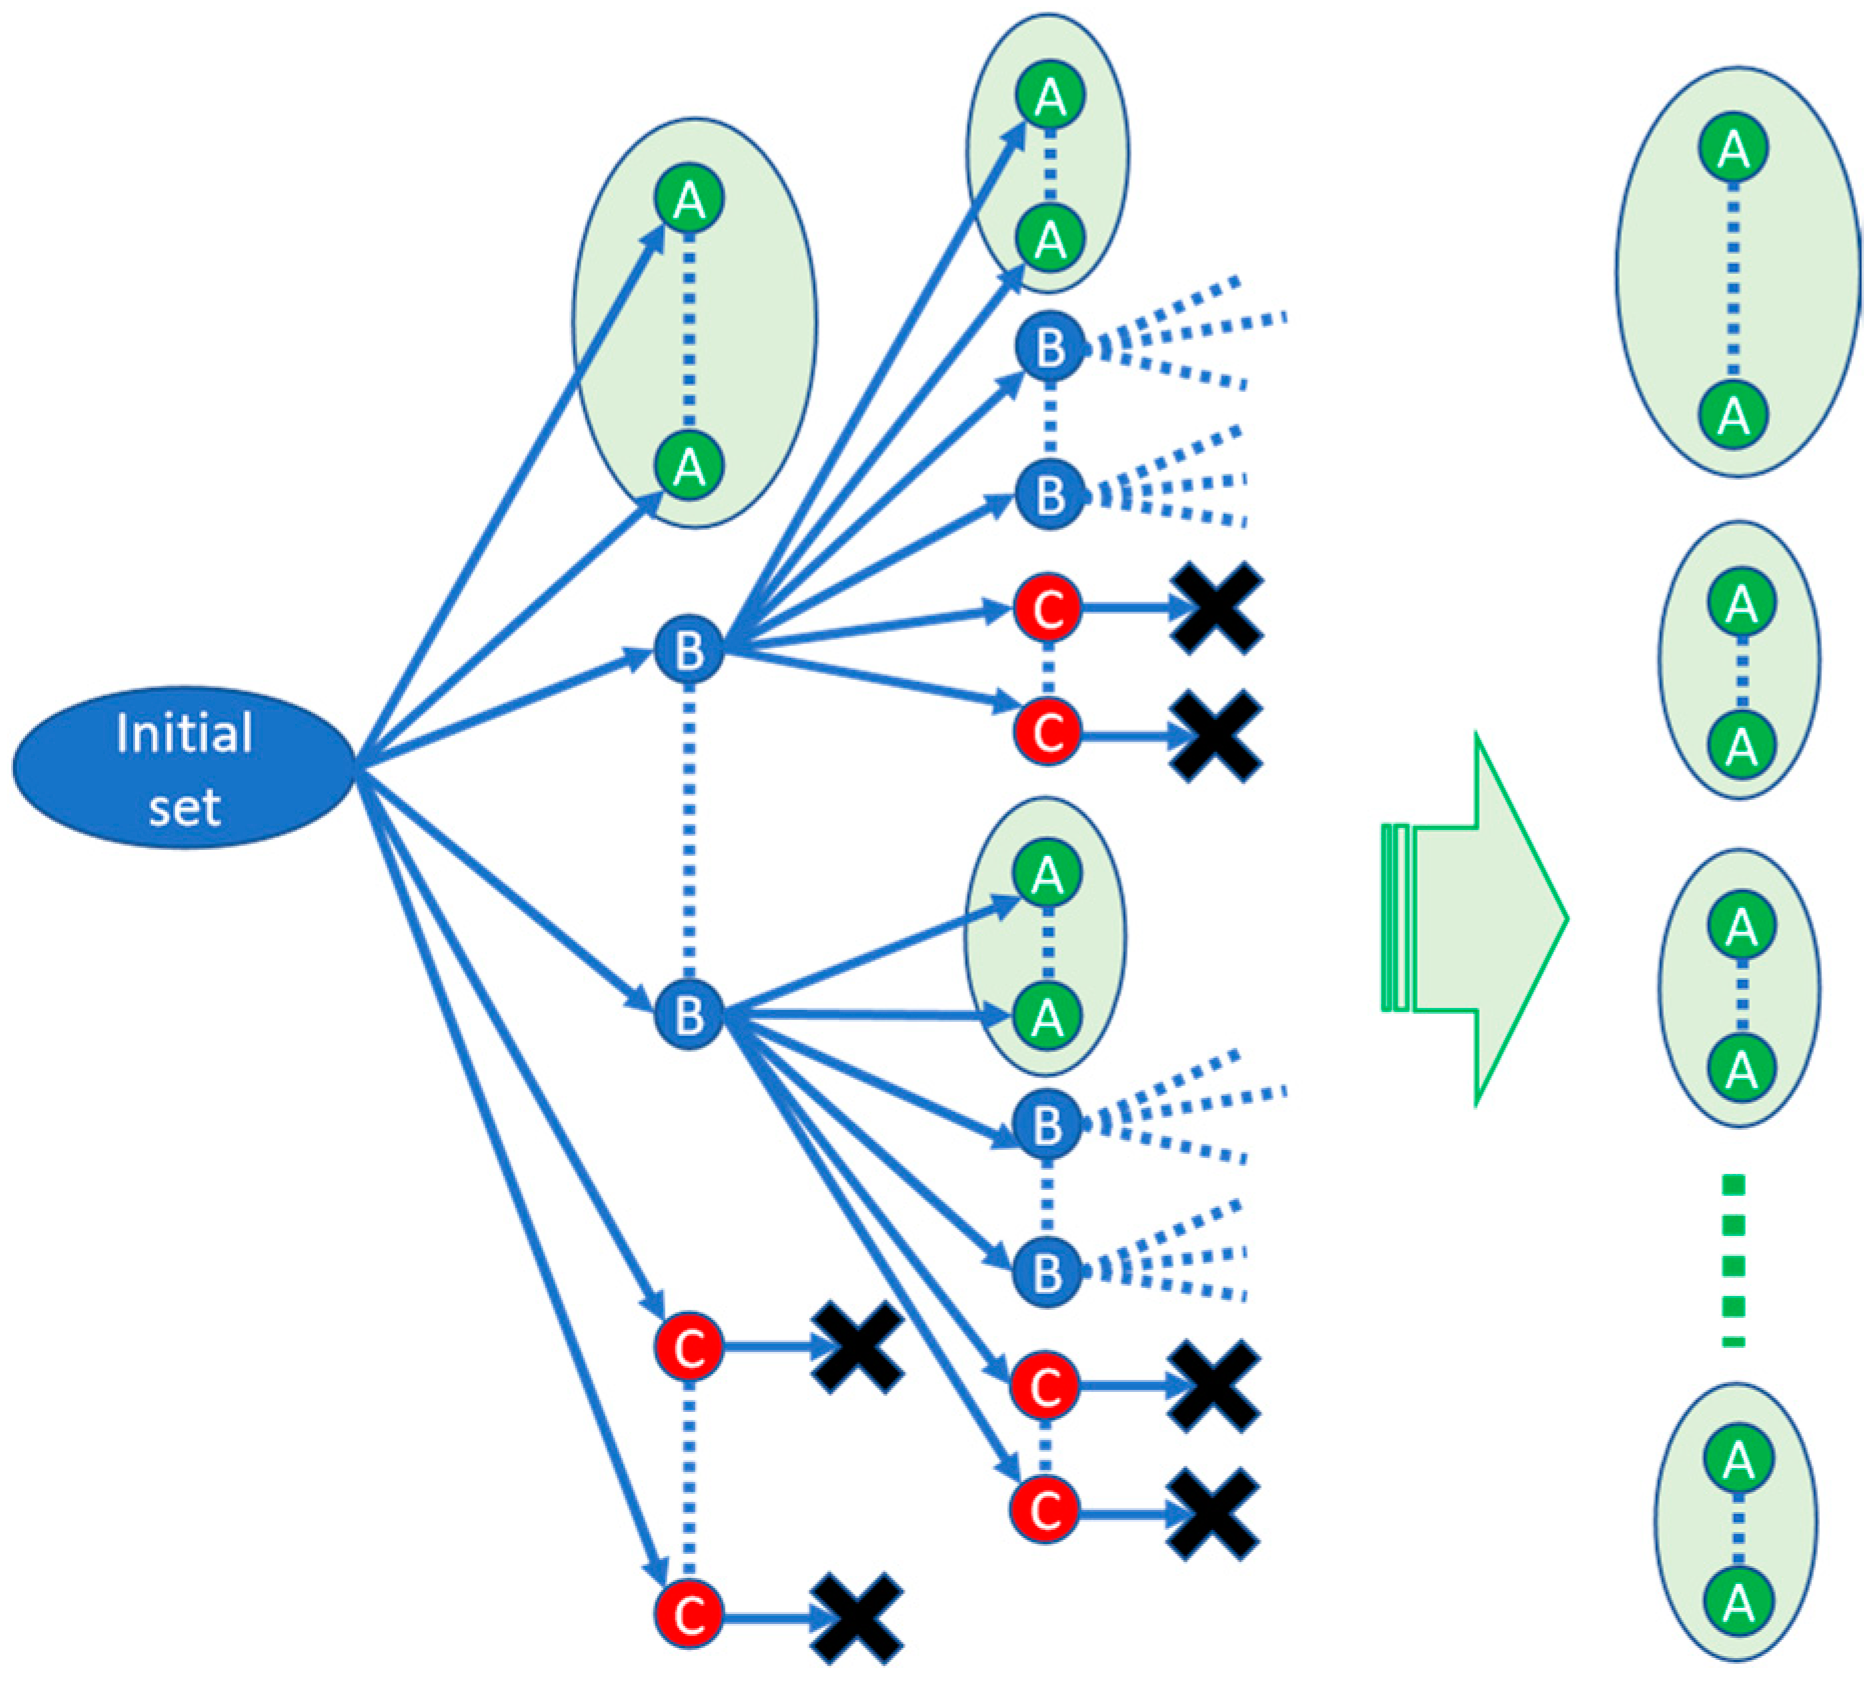
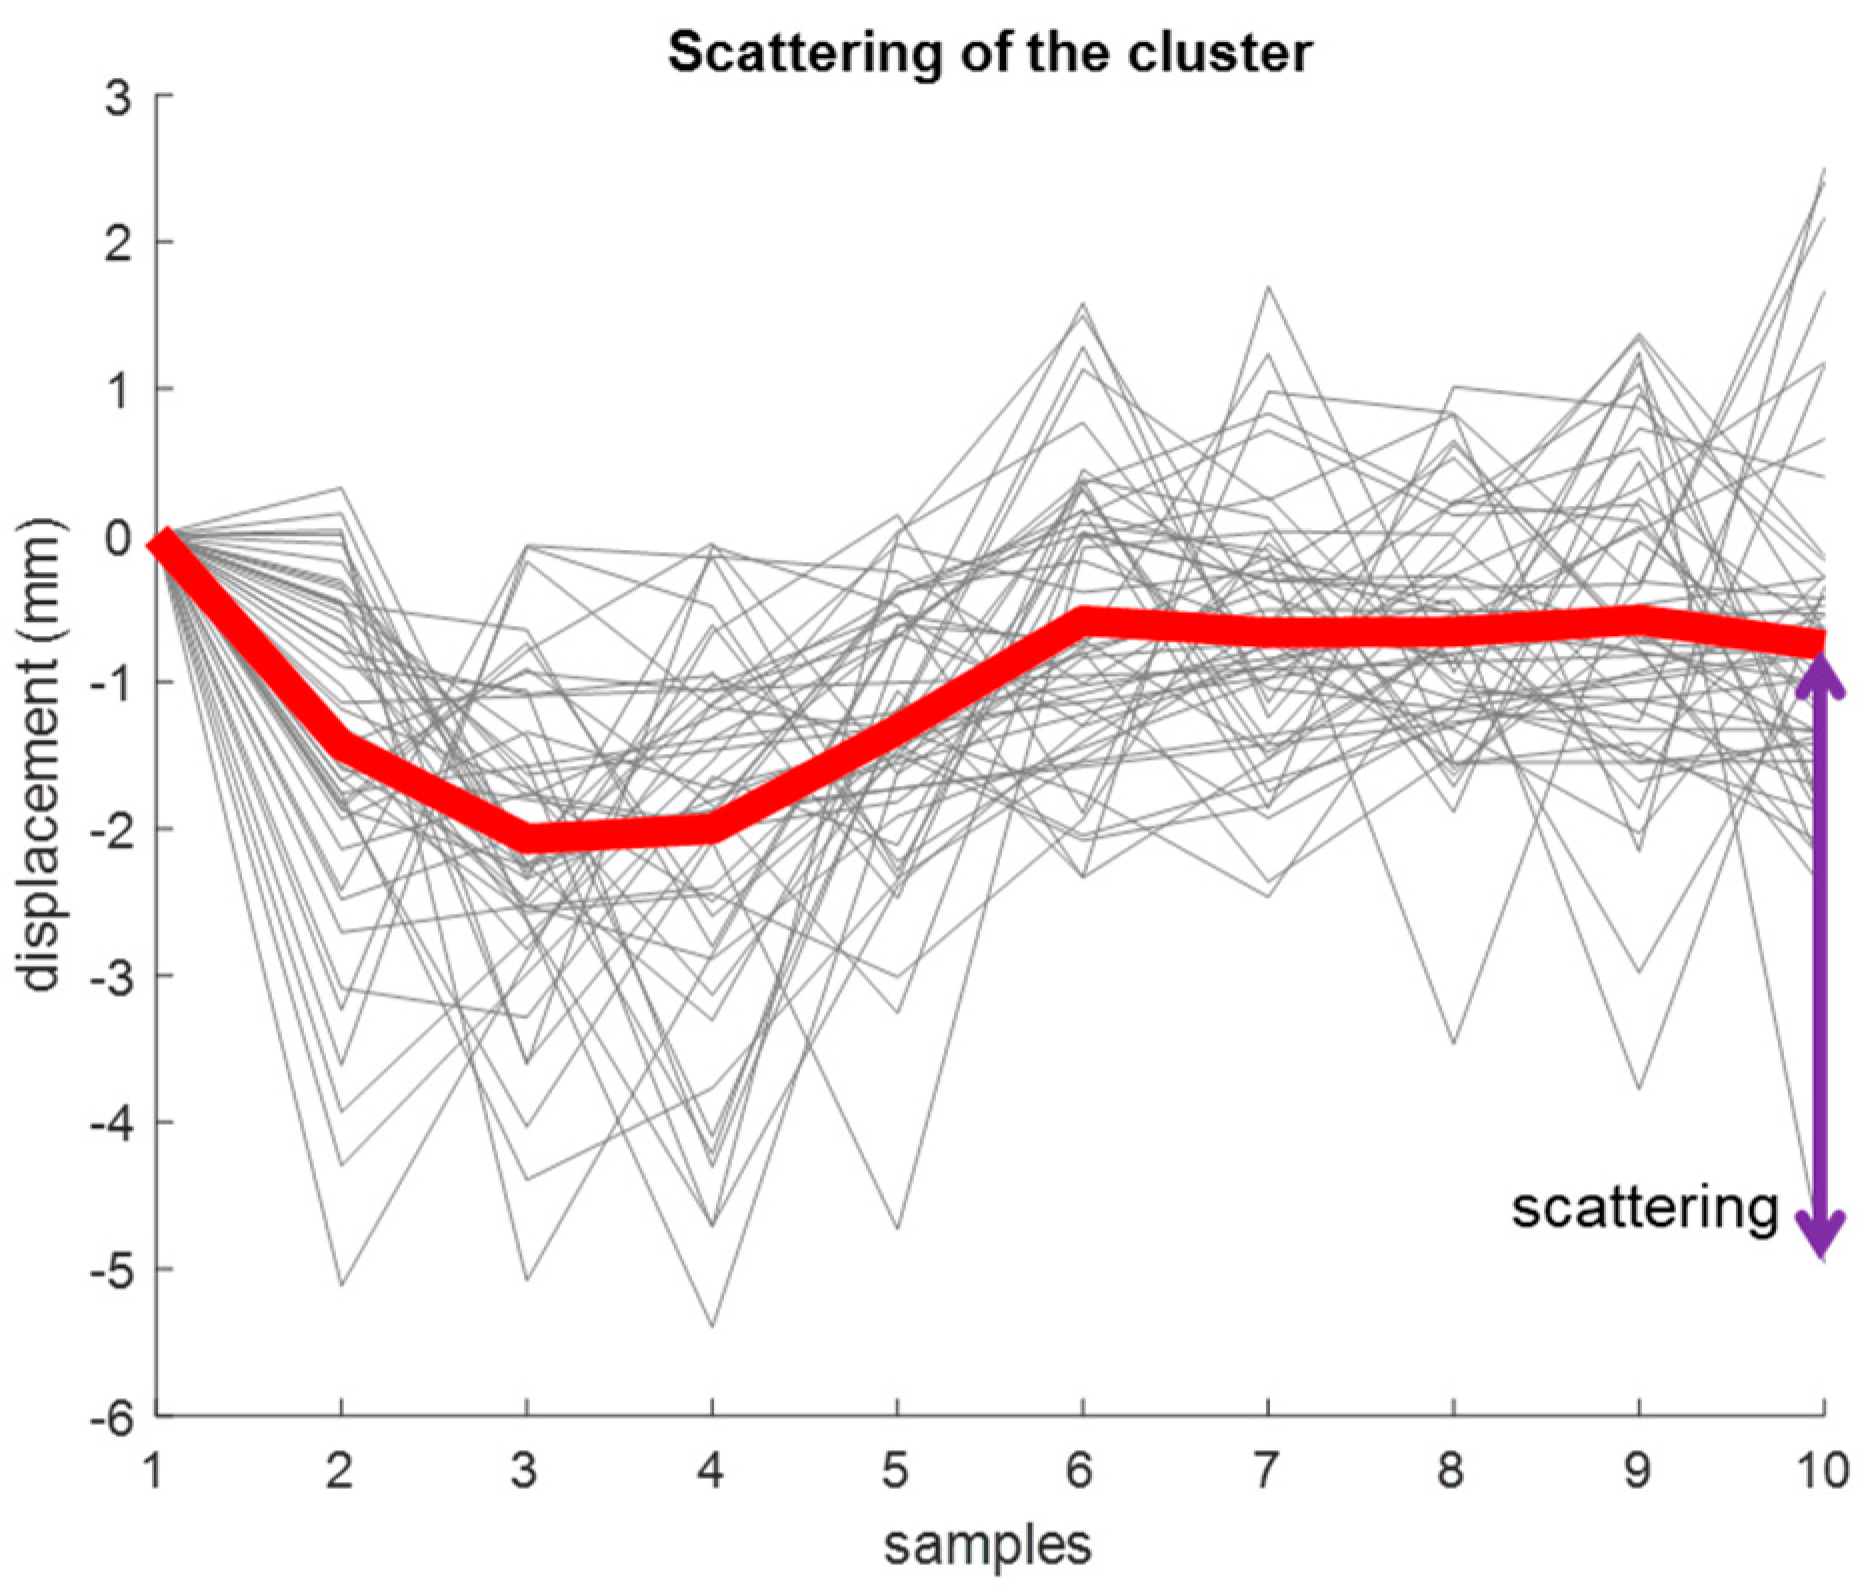
At first, the user decides whether to feed the network the entire database or a selected subset of sequences. Often, the whole database is very large, which would make it affordable to perform several training subsets with a growing number of elements, until the last added sequences do not significantly modify the resulting SOM. The final subset is used as the training set. The training is performed by means of a hierarchical clustering procedure (Figure 2). At the root of the procedure, an SOM is trained on the whole training set, which is split into a set of clusters. The coordinates of the barycenter of the cluster are the connection weights linked to the corresponding output. The vector of such weights is referred to as a prototype. The training process moves the prototypes toward the barycenter of different clusters. In general, the patterns belonging to different clusters are differently scattered (see Figure 3). As a measure of the scattering of a cluster, the maximum difference between patterns and prototype is assumed.
The aim of the hierarchical clustering procedure (see Figure 2) is to split the clusters until their scattering is lower than a preset threshold. To this purpose, clustering is preliminarily performed on the entire training set, and the obtained clusters are subdivided into three subsets, as follows:
- Clusters A: the scattering is lower than the threshold;
- Clusters B: the scattering is larger than the threshold;
- Clusters C: empty.
Clusters A and their related prototypes are stored for successive assembly in the final network (assembling). Each Cluster B is reprocessed separately, giving rise, in general, to A, B, and C new clusters. Clusters C are eliminated. The procedure ends when no more Clusters B are found, such that only Clusters A remain. The prototypes of Clusters A are collected into a final unique SOM, which is the core of the monitoring system.
A preliminary choice of a warning criterion is required before entering the monitoring phase. The present method may be applied regardless of the warning criteria assumed. To assess the effectiveness of the method in the present work, two warning criteria are considered and used in the application example of Section 3. The first one is based on the incidence of patterns within the clusters, with the low-incidence clusters being labeled warning clusters. In fact, the rare occurrence of a behavior can be assumed as an index of anomaly. The second criterion refers to a past noticeable event that labels as warning the cluster which it belongs to. The monitoring strategy based on the rare behavior criterion is referred to as Strategy 1, while that based on an event classified as noticeable is referred to as Strategy 2.
The labeling procedure of the clusters is performed before the monitoring phase. The labels are stored in the database.
2.2.2. Monitoring
The monitoring procedure retrieves the trained SOM network, the labels of the clusters, and the sequences acquired at the geographical points to be monitored. The SOM associates each sequence under test with one of the learned clusters, and, if the switched-on cluster is labeled as “warn”, an alarm is generated.
3. Explanatory Application of the Method
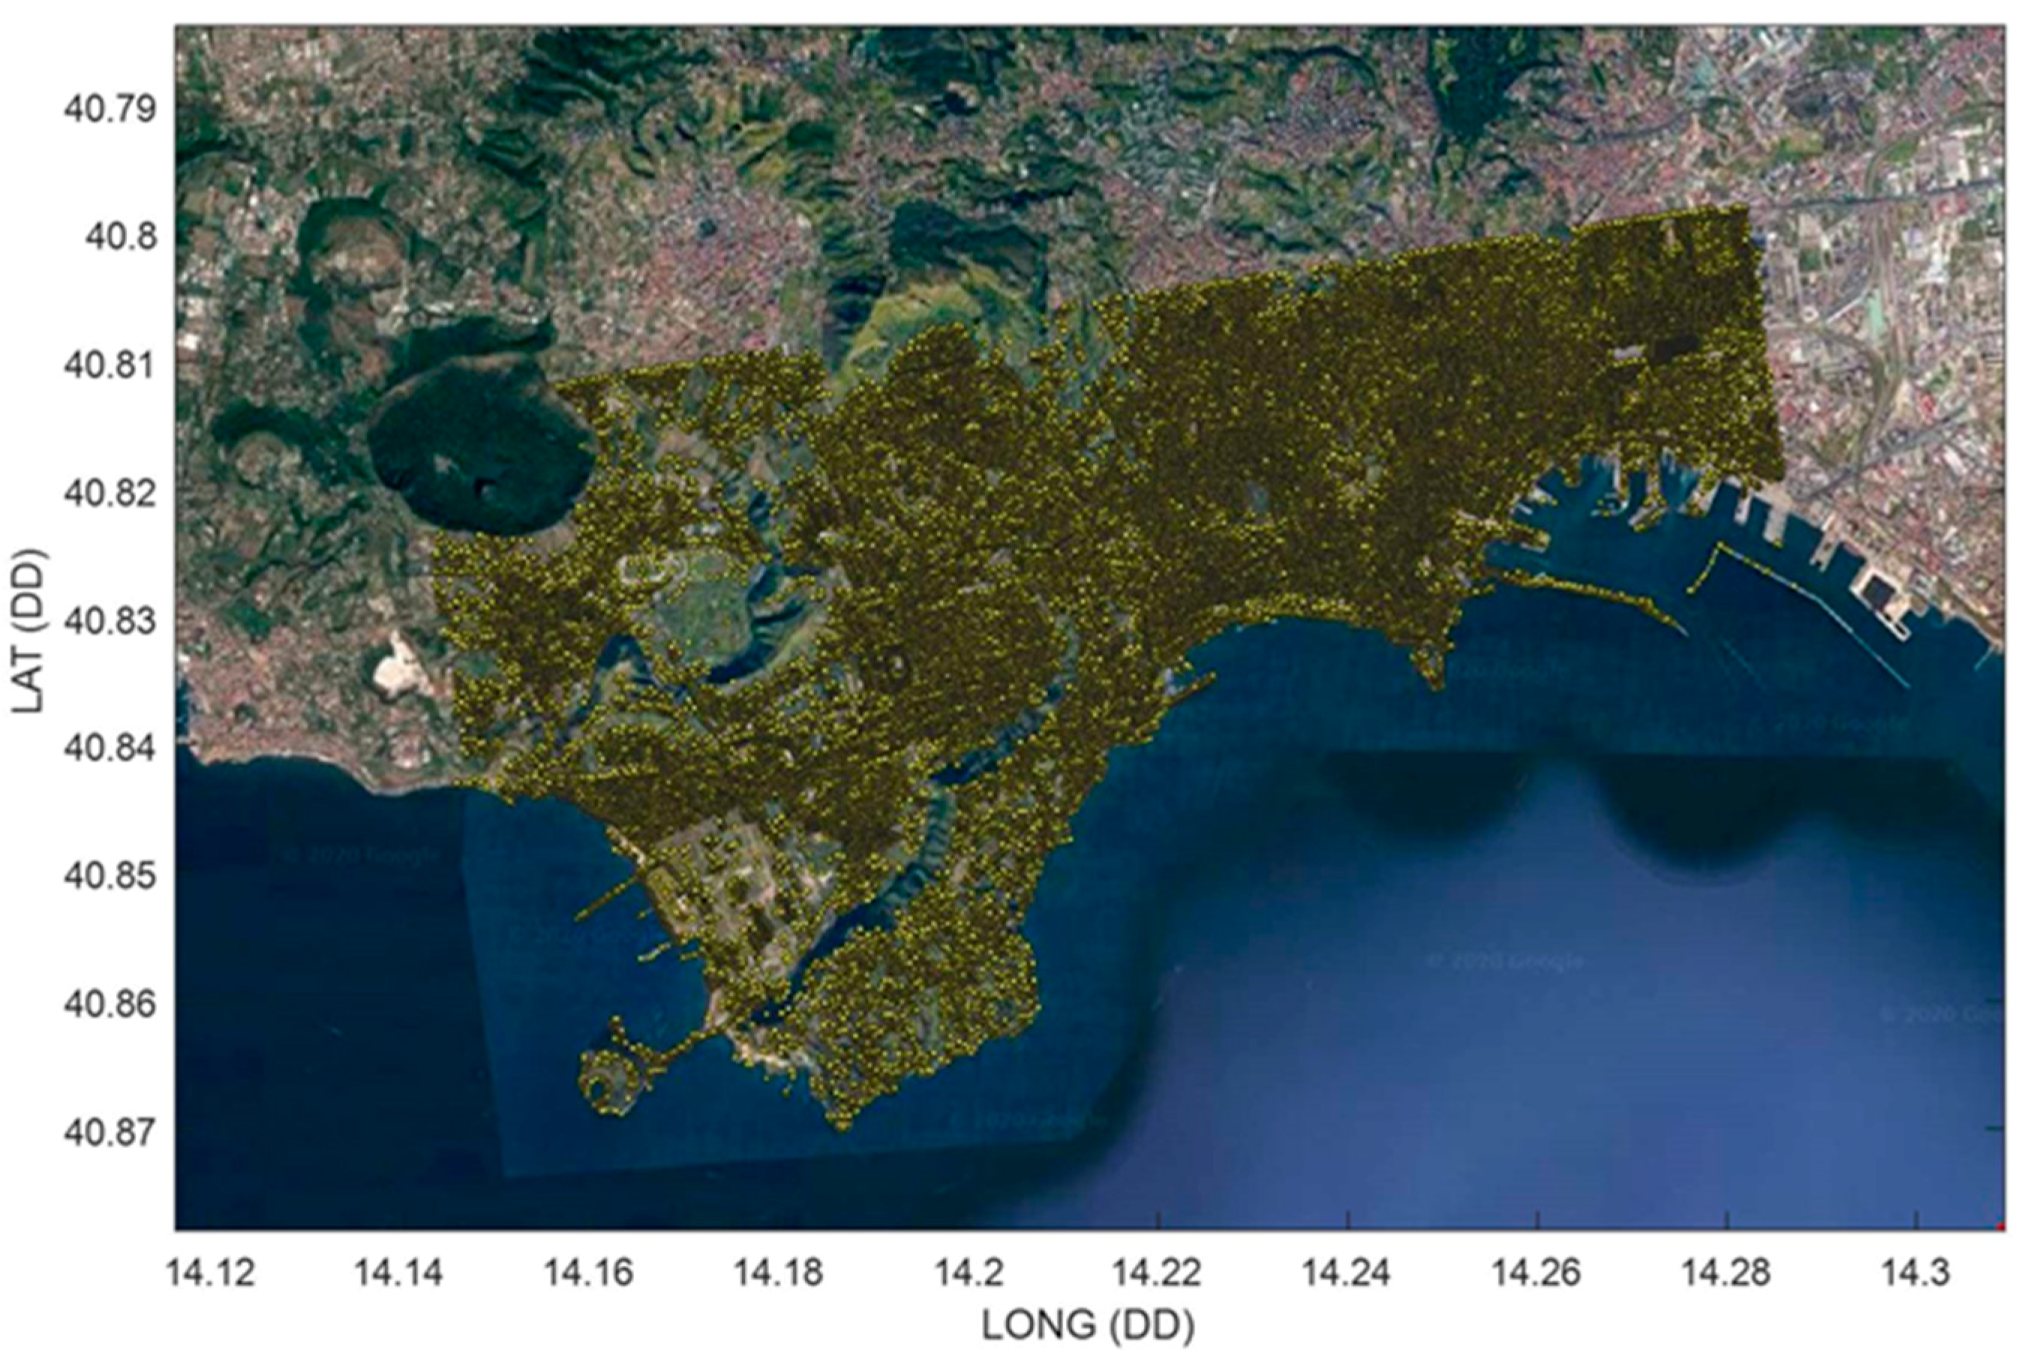
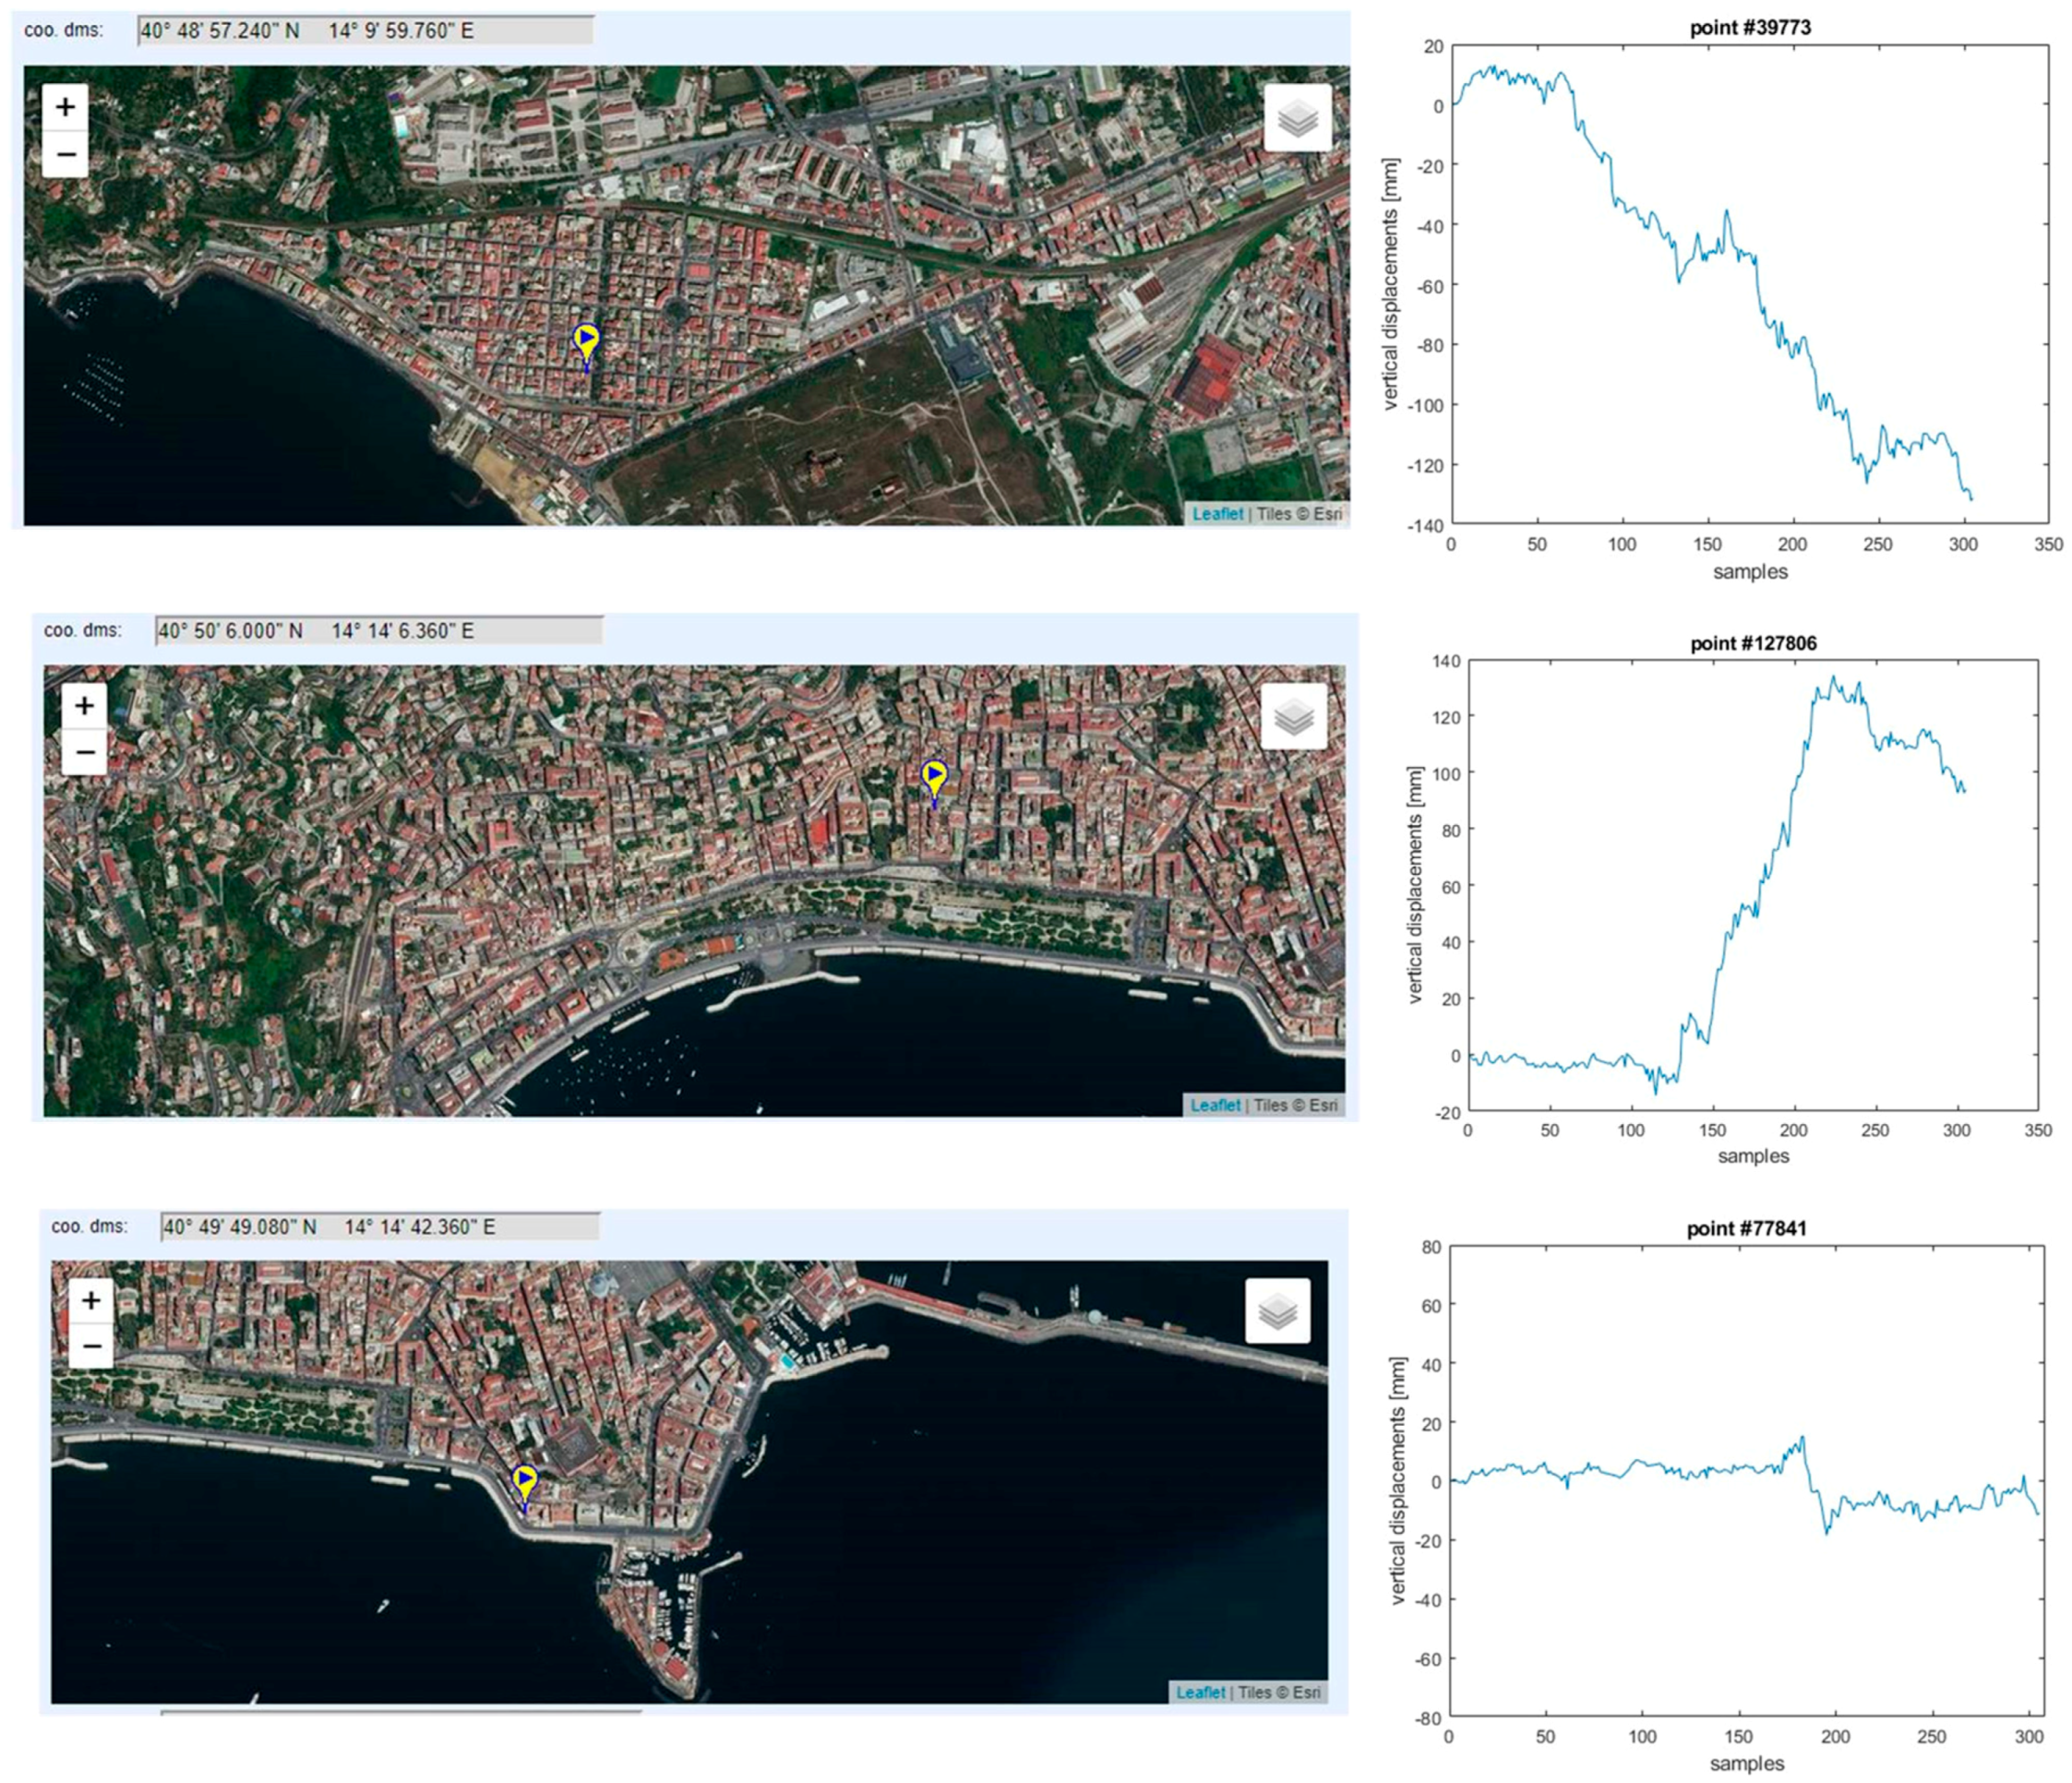
As an example, the method described in the previous sections is applied to a database relevant to the urban area of Naples (Italy). A COSMO-SkyMed dataset [53] of MT-InSAR displacement timeseries (persistent scatterers [54]) relevant to 411,582 target geographical points, recorded from December 2008 to August 2014, was used as a work set. The dataset is a matrix of as many rows as the target geographical points, and 319 columns, collecting ID label, latitude, and longitude of each geographical point, as well as a sequence of 316 displacement samples. The raw data are processed to calculate the vertical component of the displacement by projecting the line of sight (LOS) [55]. Figure 4 shows the QGIS map of the whole set of sampling points. Some instances of displacement time sequences are shown in Figure 5 together with the satellite image highlighting the geographical points where the displacements were remotely recorded.
An application of the proposed method to the dataset of Naples is described below. Section 3.1 illustrates the preprocessing of data and the training phase. Section 3.2 and Section 3.3 provide instances of the monitoring done through Strategy 1 (rare behavior) and Strategy 2 (noticeable event), respectively (see Section 2.2.1).
To test the ability of the method to detect the early stage of critical events on the basis of similarities among timeseries, the monitoring procedure was applied with reference to past instances of the considered database.
3.1. Data Preprocessing and Training
Preprocessing is needed to allow the network to handle the timeseries. In general, the monitoring process should be carried out by choosing time windows consistent with the time constants that characterize the considered phenomena. Since the duration of all recorded sequences is usually much longer than the time windows, many instances are typically obtained from each sequence. Furthermore, a suitable limited number of instances must be extracted from the significant sequences of the whole database. Sequences are assumed to be significant when behaviors typical of the investigated phenomena occur within them.
The preprocessing procedure was here applied through the following steps:
- Since the MT-InSAR timeseries are sampled with variable time steps, a preliminary linear spline was used to resample all the series, by adopting a 6 day timestep, which is also roughly referred to as a “week” hereafter. Overall, the duration of each timeseries was 305 samples, corresponding to about 61 months.
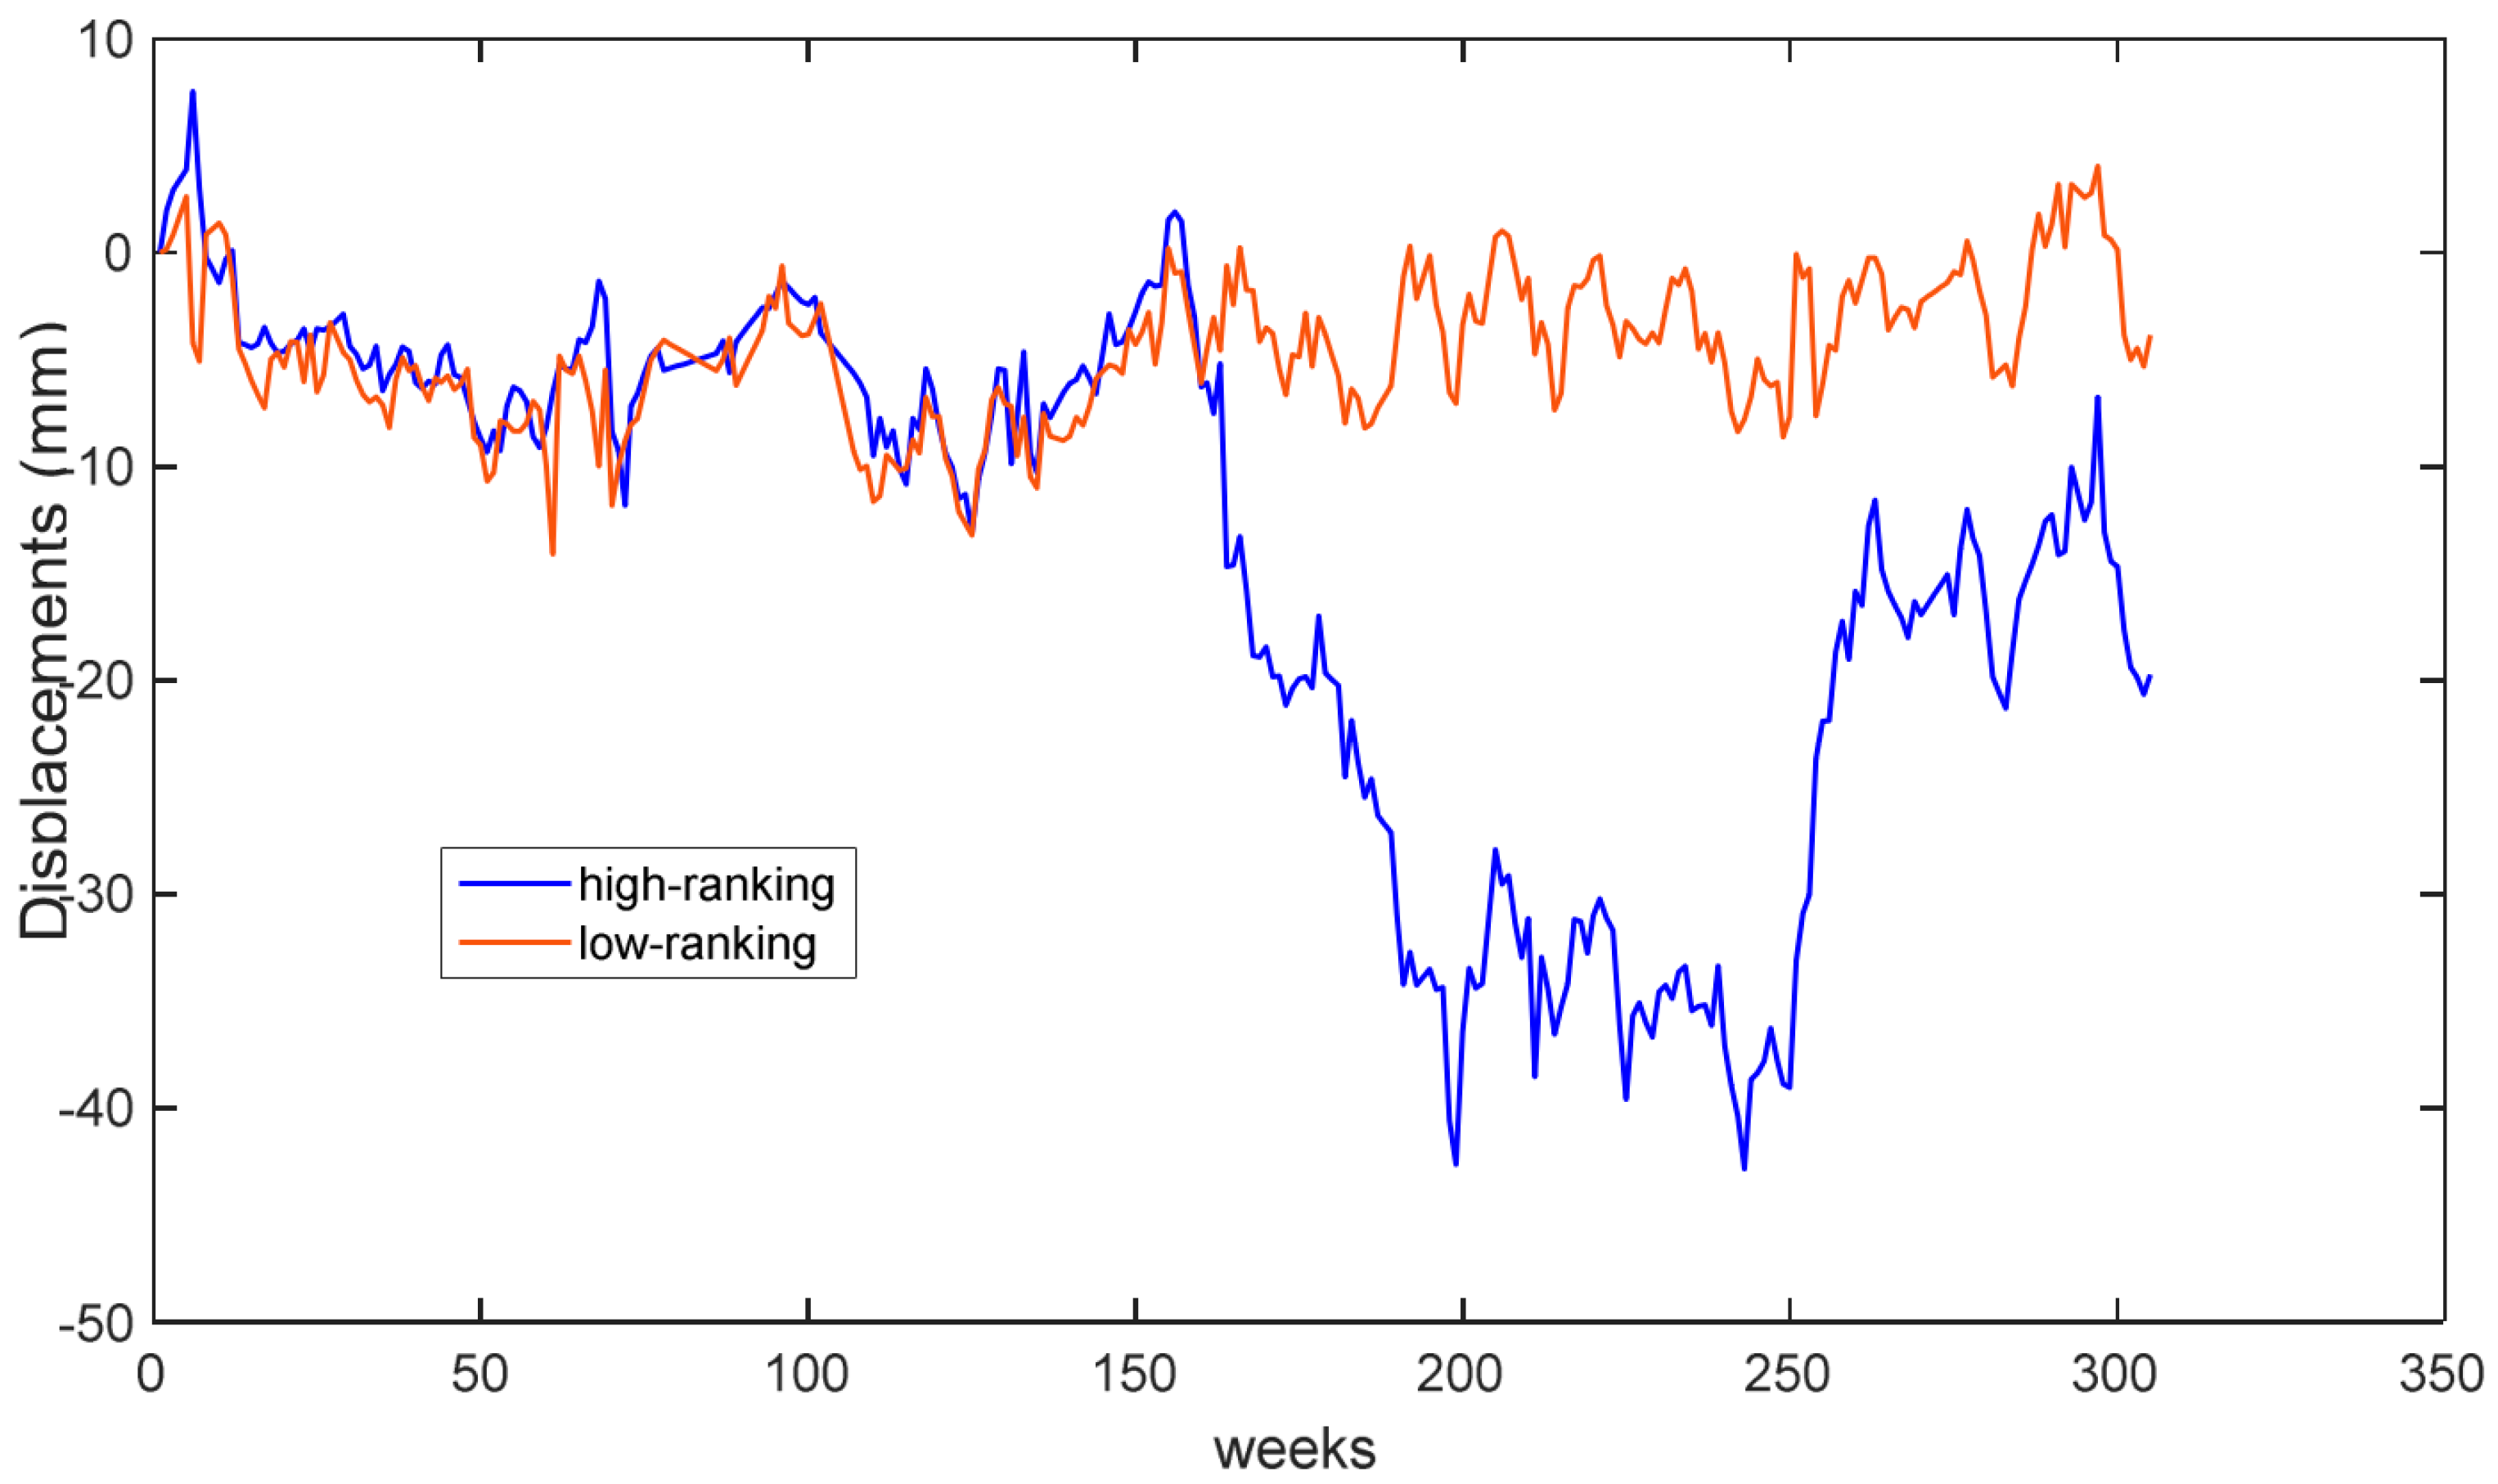
- On the basis of a ranking criterion, a training subset was extracted from the whole database. The displacement rate along the sequence was used as the ranking criterion. Only the timeseries overcoming a preset level of displacement rate were selected to train the SOM network. In the present example, 50,000 timeseries constituted the training set. In Figure 6, examples of a high-ranking and a low-ranking series are shown.
- Time windows of preset duration were extracted from each timeseries. Considering L = 305 as the duration of a timeseries and N = 10 as the preset duration of the time window, (L − N + 1) = 296 time windows were extracted from each timeseries. In total, 7,400,000 time windows constituted the training set, while 121,827,976 time windows formed the whole dataset.
- A feature extraction was performed to reduce the sensitivity of the patterns to noise. The fast Fourier transform (FFT) was calculated for each time window, obtaining 10 complex frequencies and finally a pattern of 19 real components. Principal component analysis (PCA) was performed to reduce the size of the patterns. The final dimension of the patterns was 3.
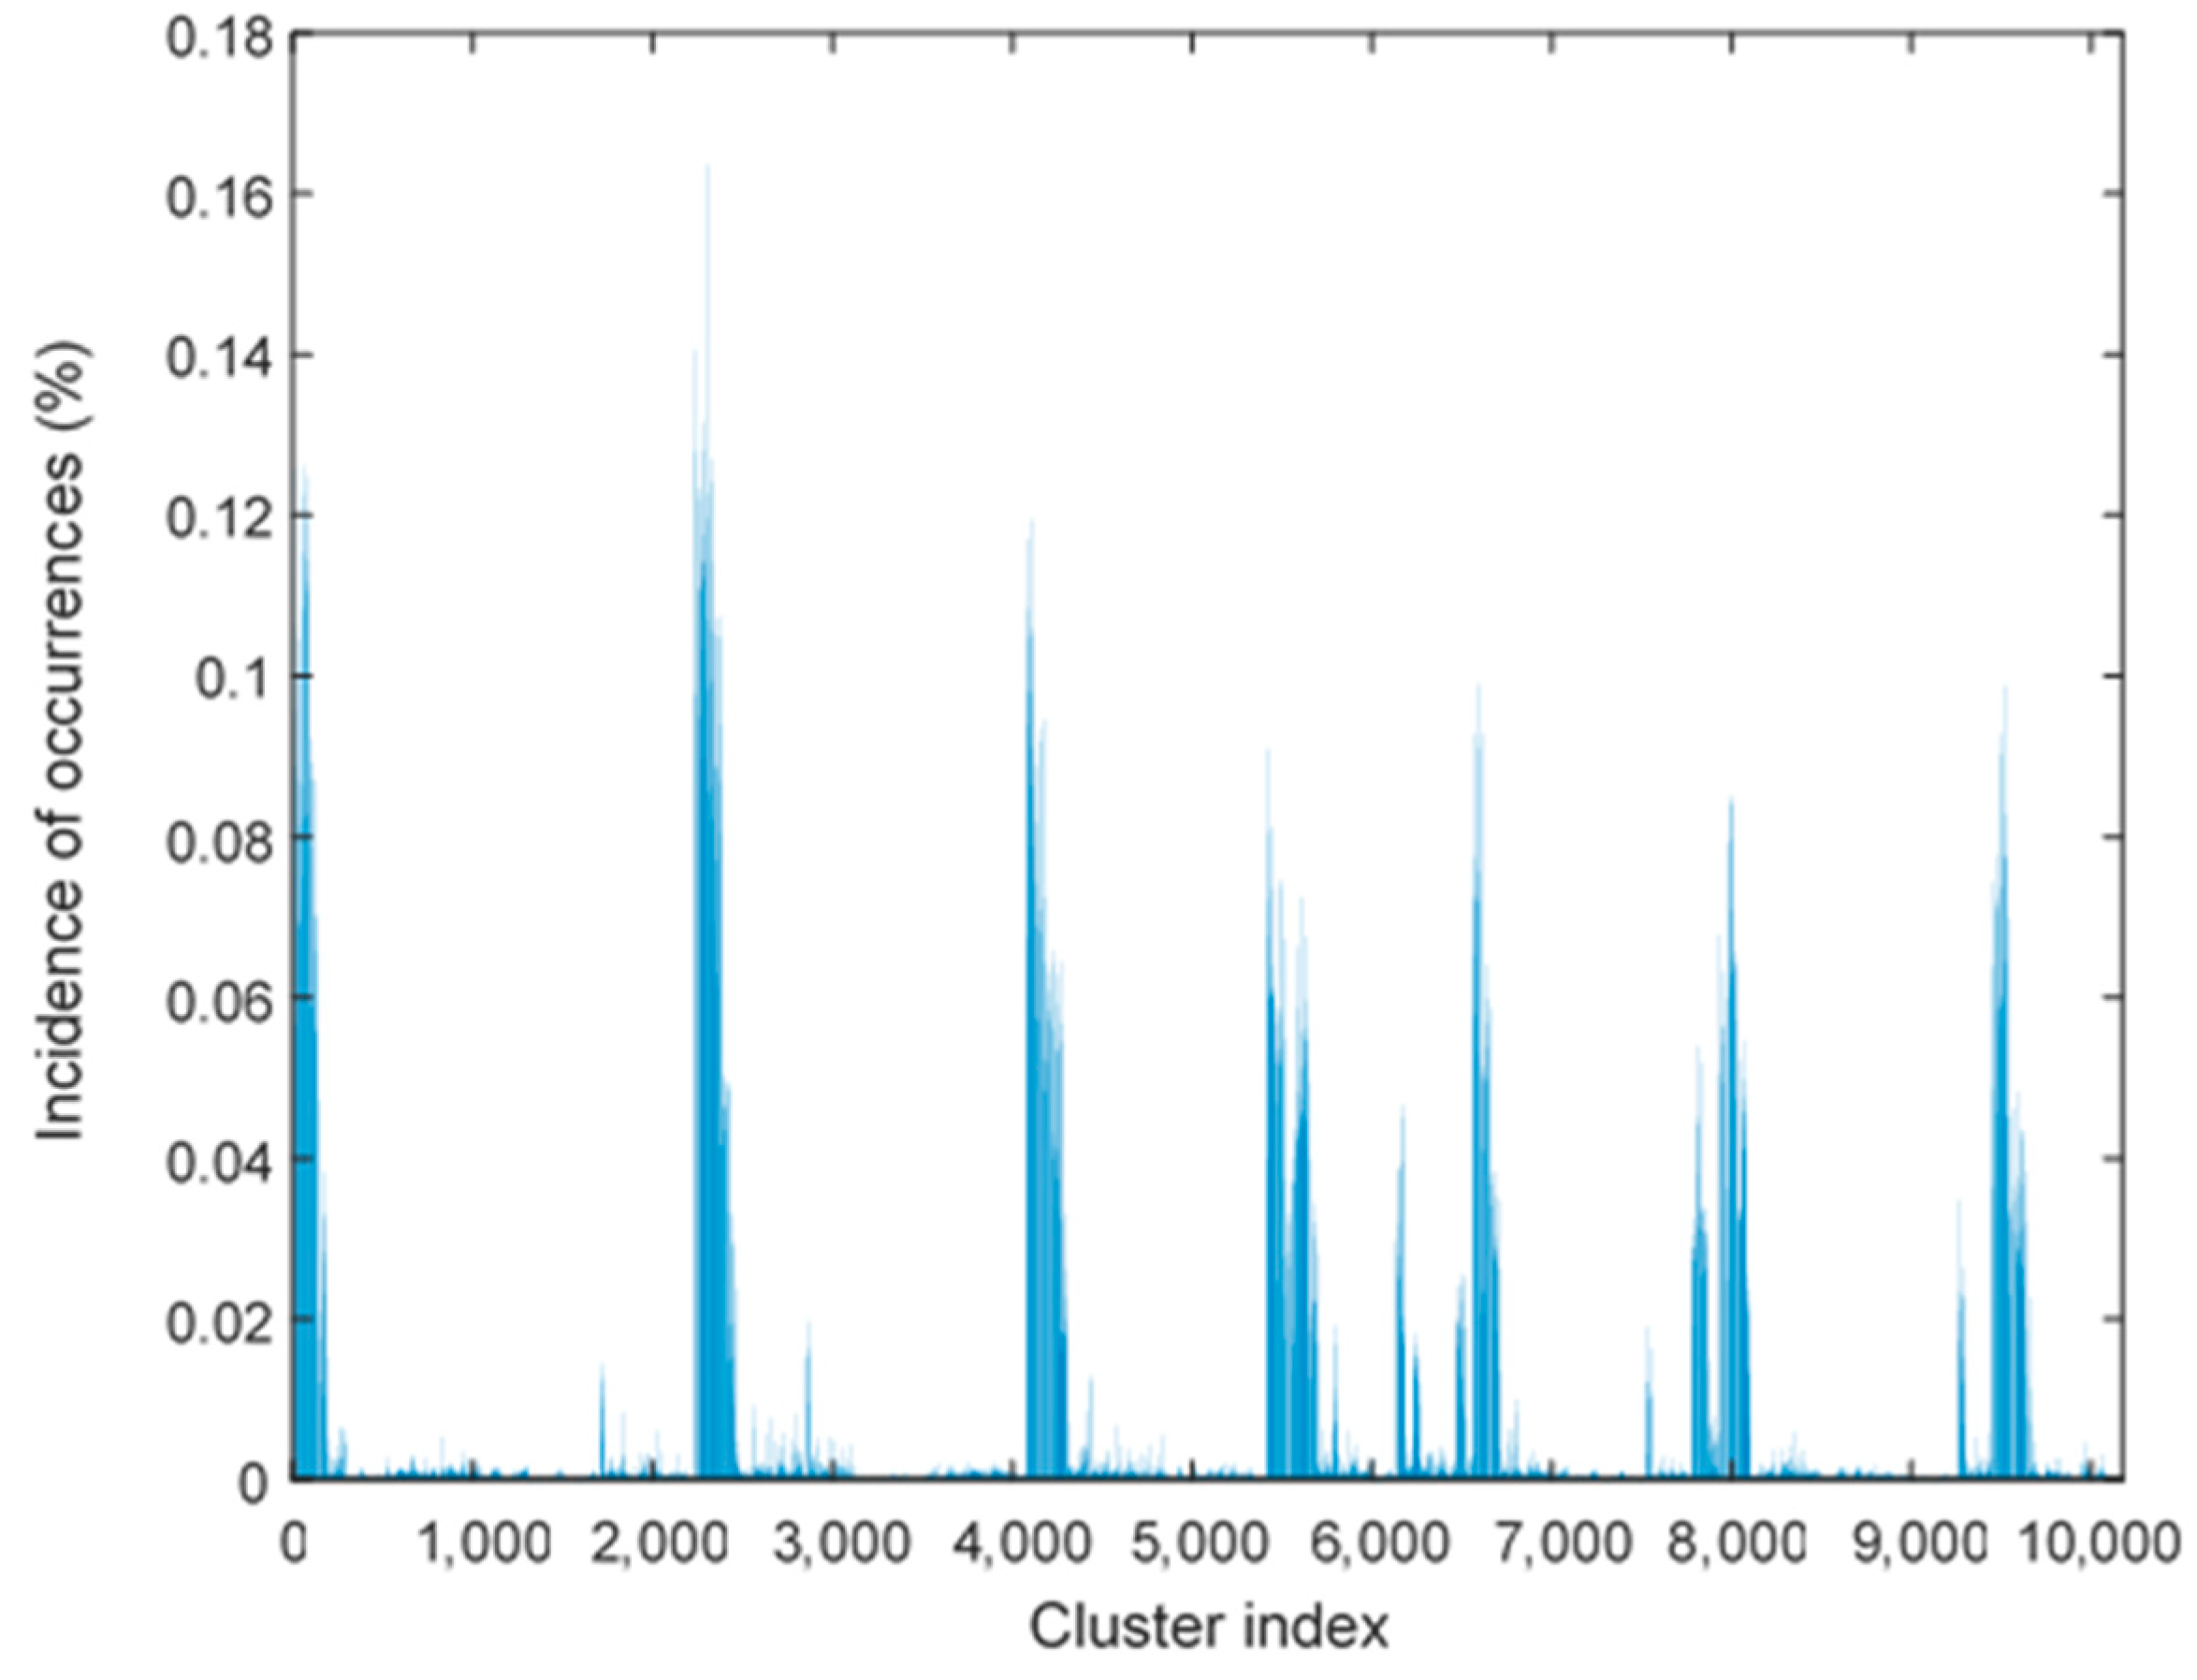
An SOM was trained on the set of patterns by means of the hierarchical clustering procedure illustrated in Section 2.2.1. This procedure yielded a global SOM which could cluster the entire dataset of patterns. In total, we found 10,171 clusters. A histogram plotting the incidence of the occurrences in the clusters is shown in Figure 7.
3.2. Monitoring Strategy 1 (Rare Behavior)
The obtained SOM could then be applied to the whole database with the aim of detecting rare behaviors, according to the following steps:
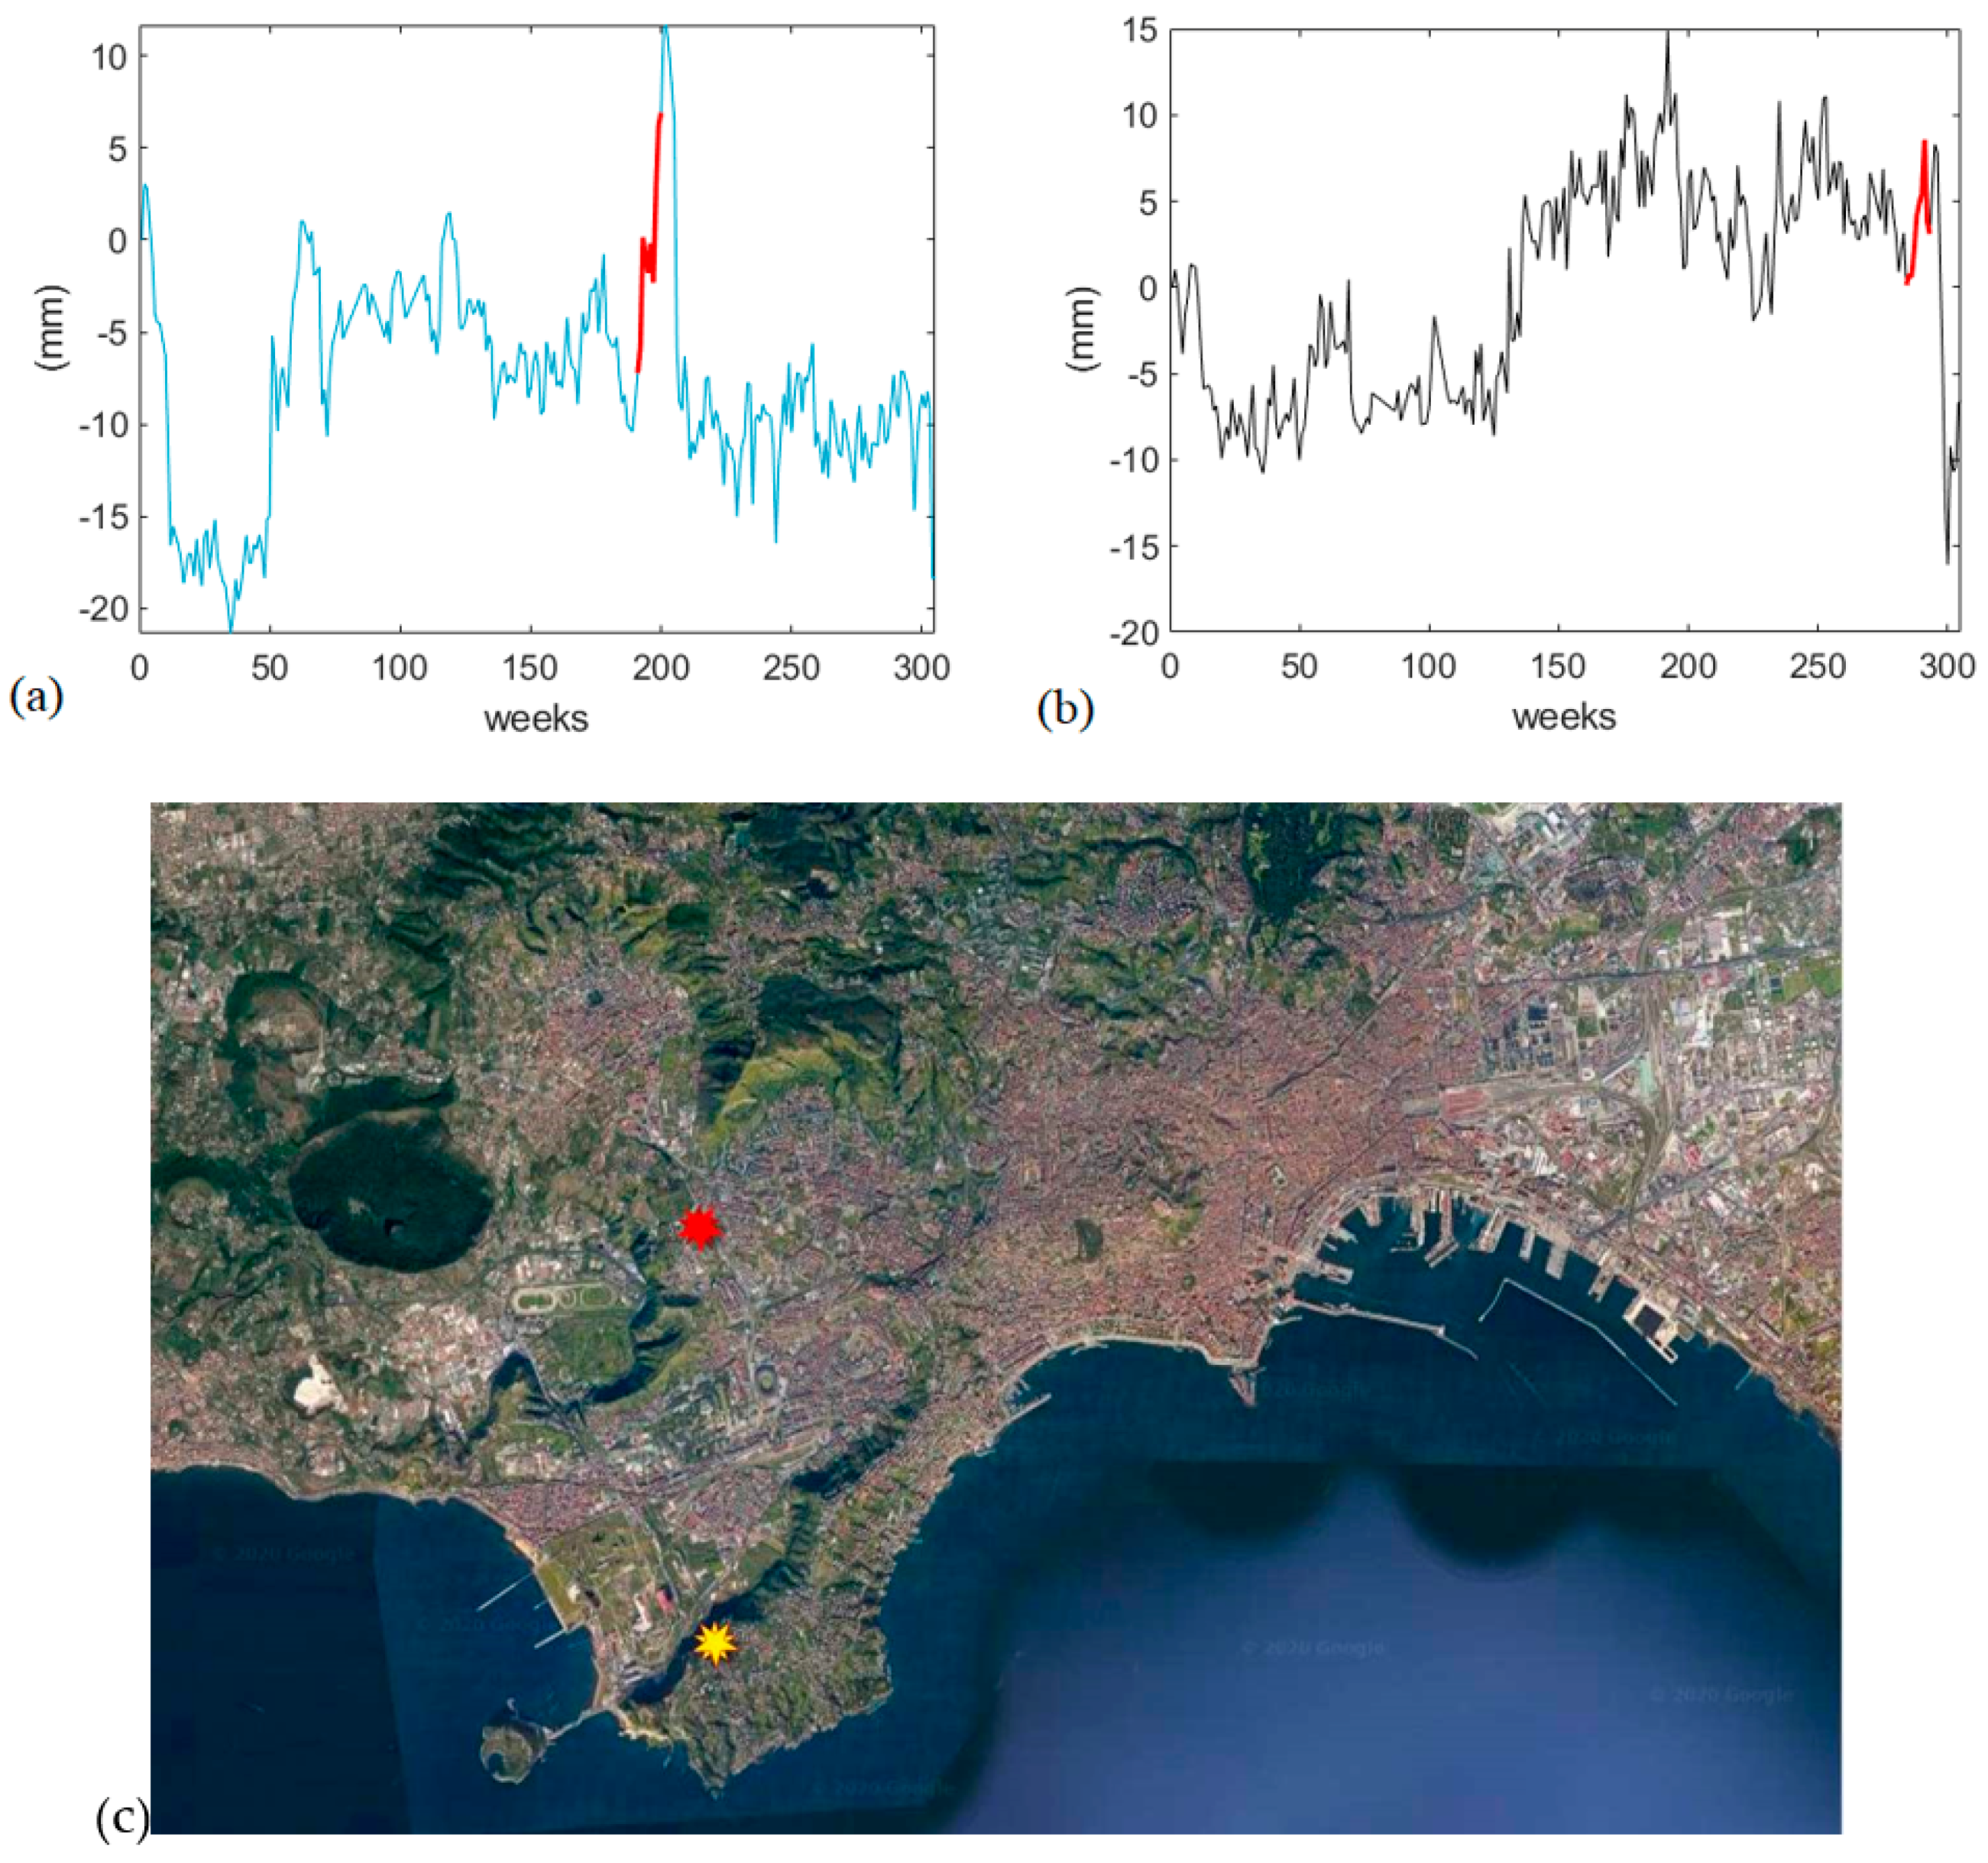
- Among the clusters obtained from the trained SOM, one of those to which few examples belong was chosen. This was assumed as an index of anomalous behavior, and then the patterns falling in this cluster were labeled as “warning”. Cluster no. 291 having only one occurrence was set as the “reference cluster”, as an example. Figure 8a plots the time diagram relevant to the point of the training set to which the window falling in the reference cluster 291 (in red) belonged. Such a window was expected to precede an anomalous event.
- To test the method, we assumed the 280th week of 305 as the monitoring instant, allowing an investigation of how the series evolved in the successive weeks. Monitoring considered the windows that closed at the monitoring instant. The Monitoring was applied to the geographical points of the whole dataset.
- The preprocessing applied to the training set (see point iv of Section 3.1) was also applied to the monitoring set, taking care to refer to the same parameters adopted in the training (average, ranges, normalization, principal components, etc.).
- The monitoring patterns were fed to the SOM, which assigned them to different clusters. The “warning” patterns falling into the reference cluster were given attention for a more in-depth study.
By applying this monitoring strategy, we found only one warning over 411,581 points. The time diagram relevant to this warning point is plotted in Figure 8b, where the red line indicates the monitoring window (which is assumed to precede the anomalous event). The points which Figure 8a,b refers to are shown in the map of Figure 8c, with this figure having just an illustrative purpose. It can be noted that Strategy 1 was able to put in evidence an anomalous phenomenon (a rather high vertical displacement which developed in a very short time) at its very early stage. It is to be stressed that the method is simply aimed at warning against possible anomalous behaviors at their early stage, while the most accurate study of them should be entrusted to specialistic assessments and in situ inspections.
3.3. Monitoring Strategy 2 (Noticeable Event)
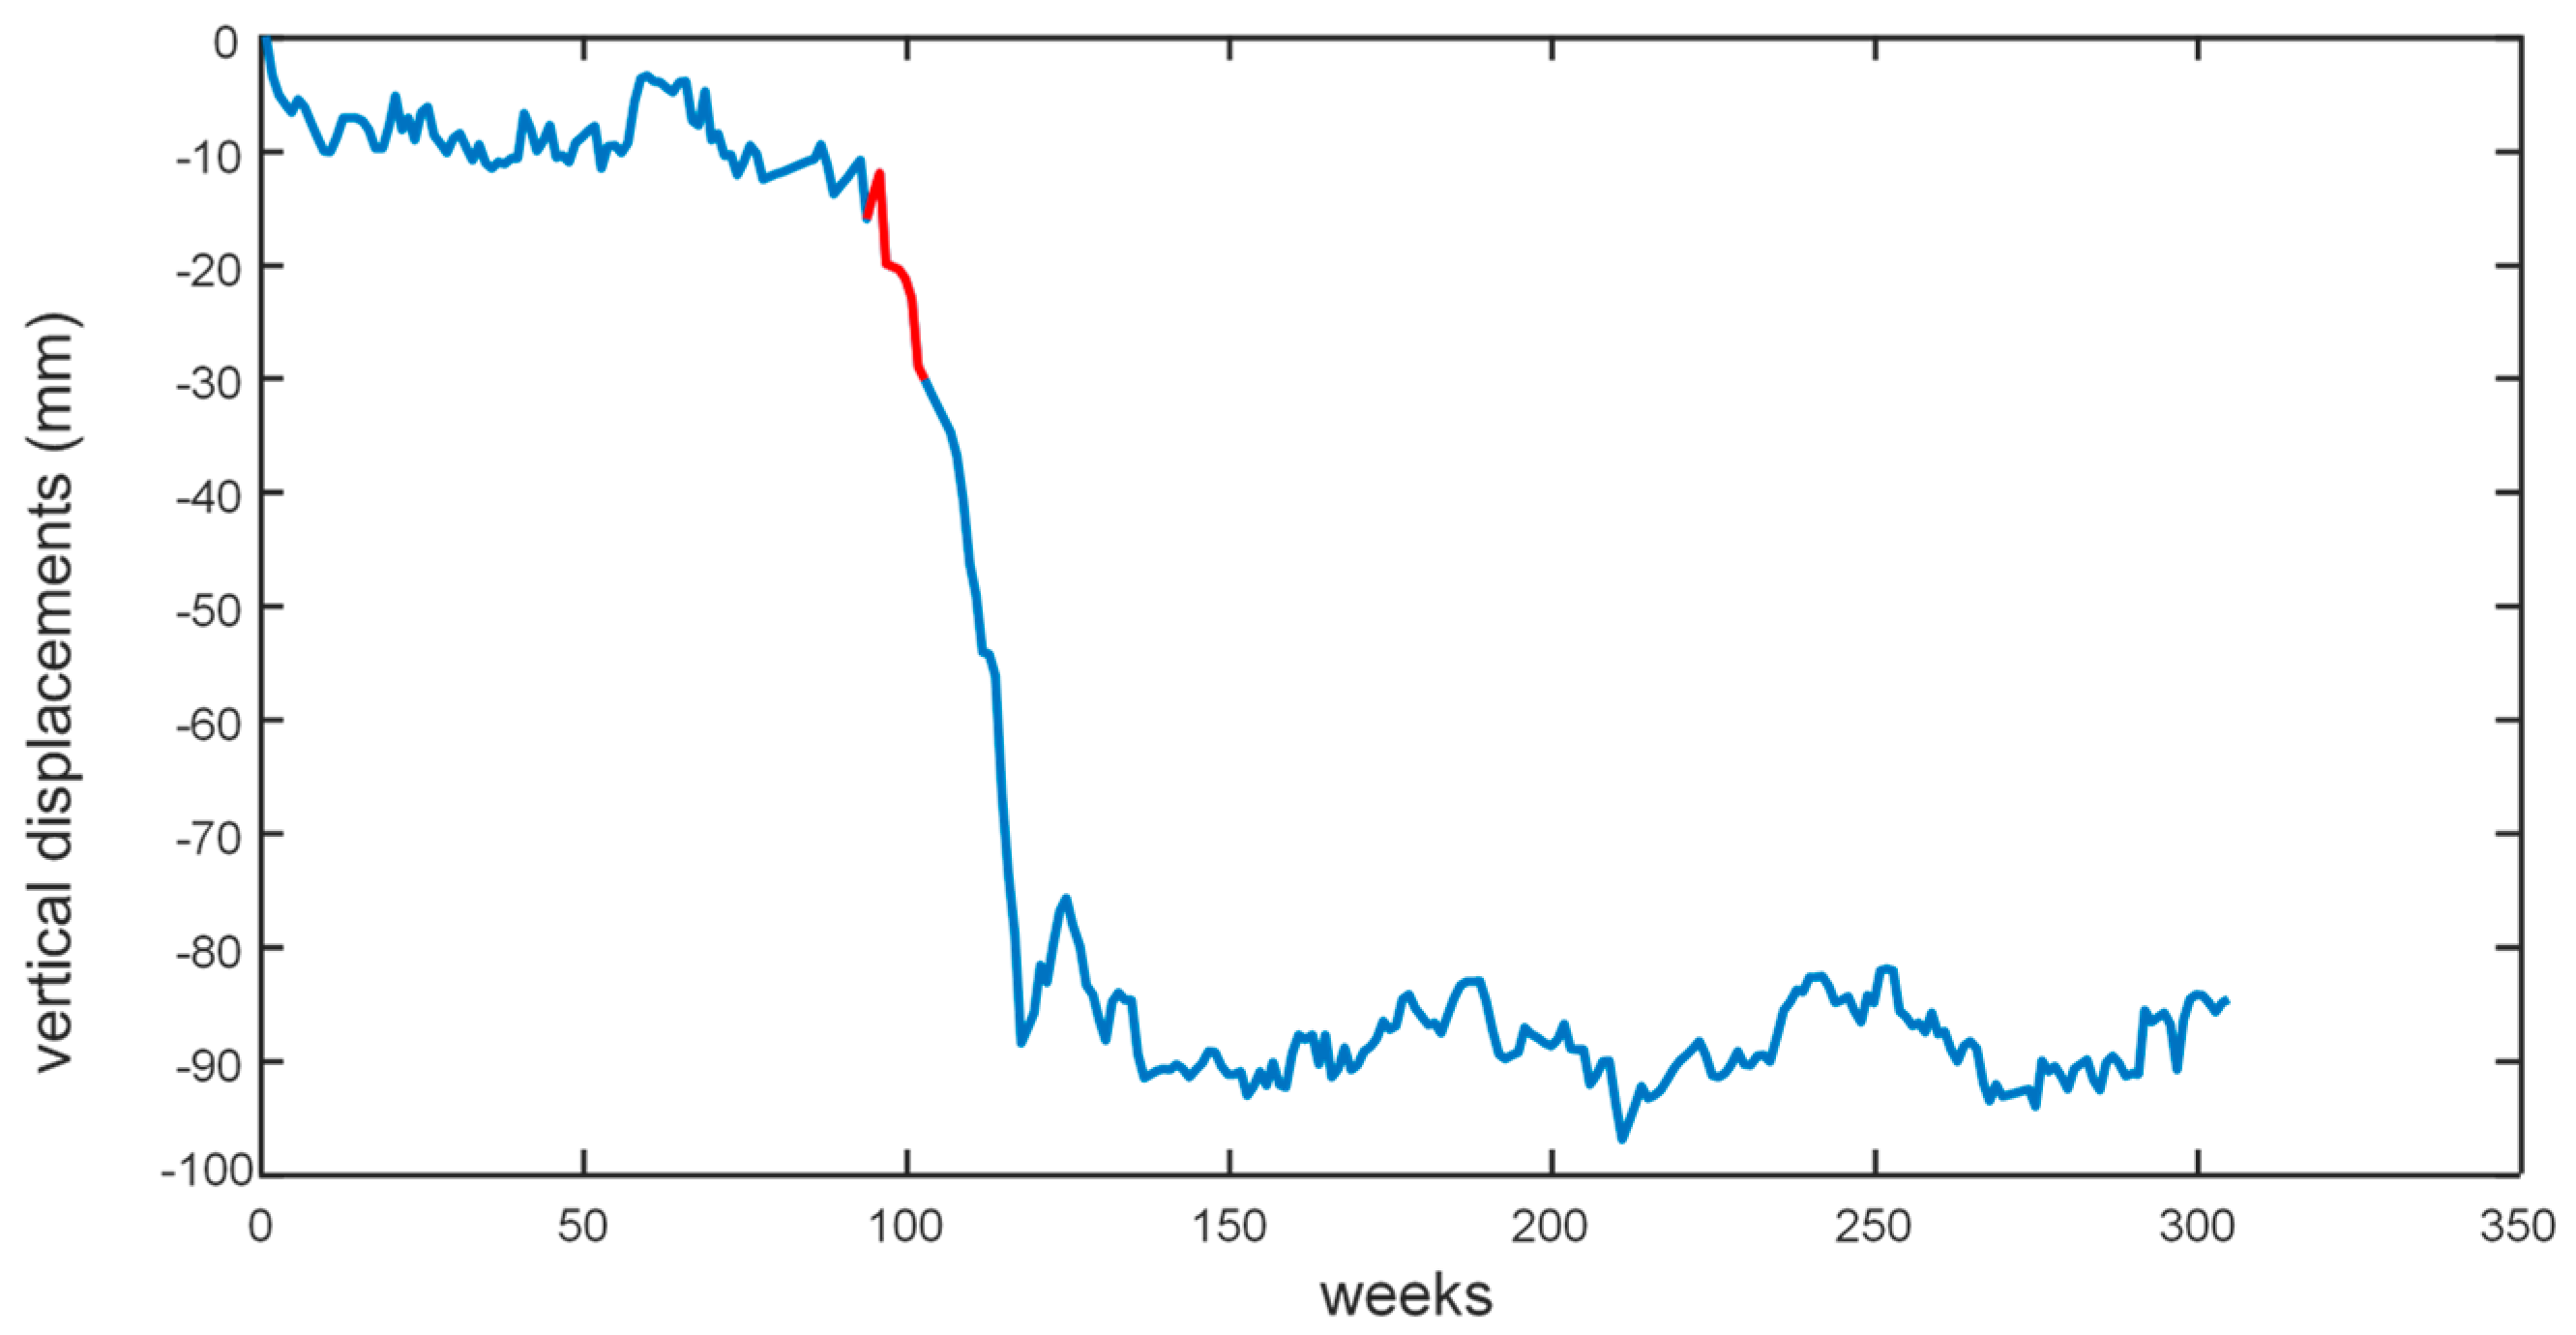
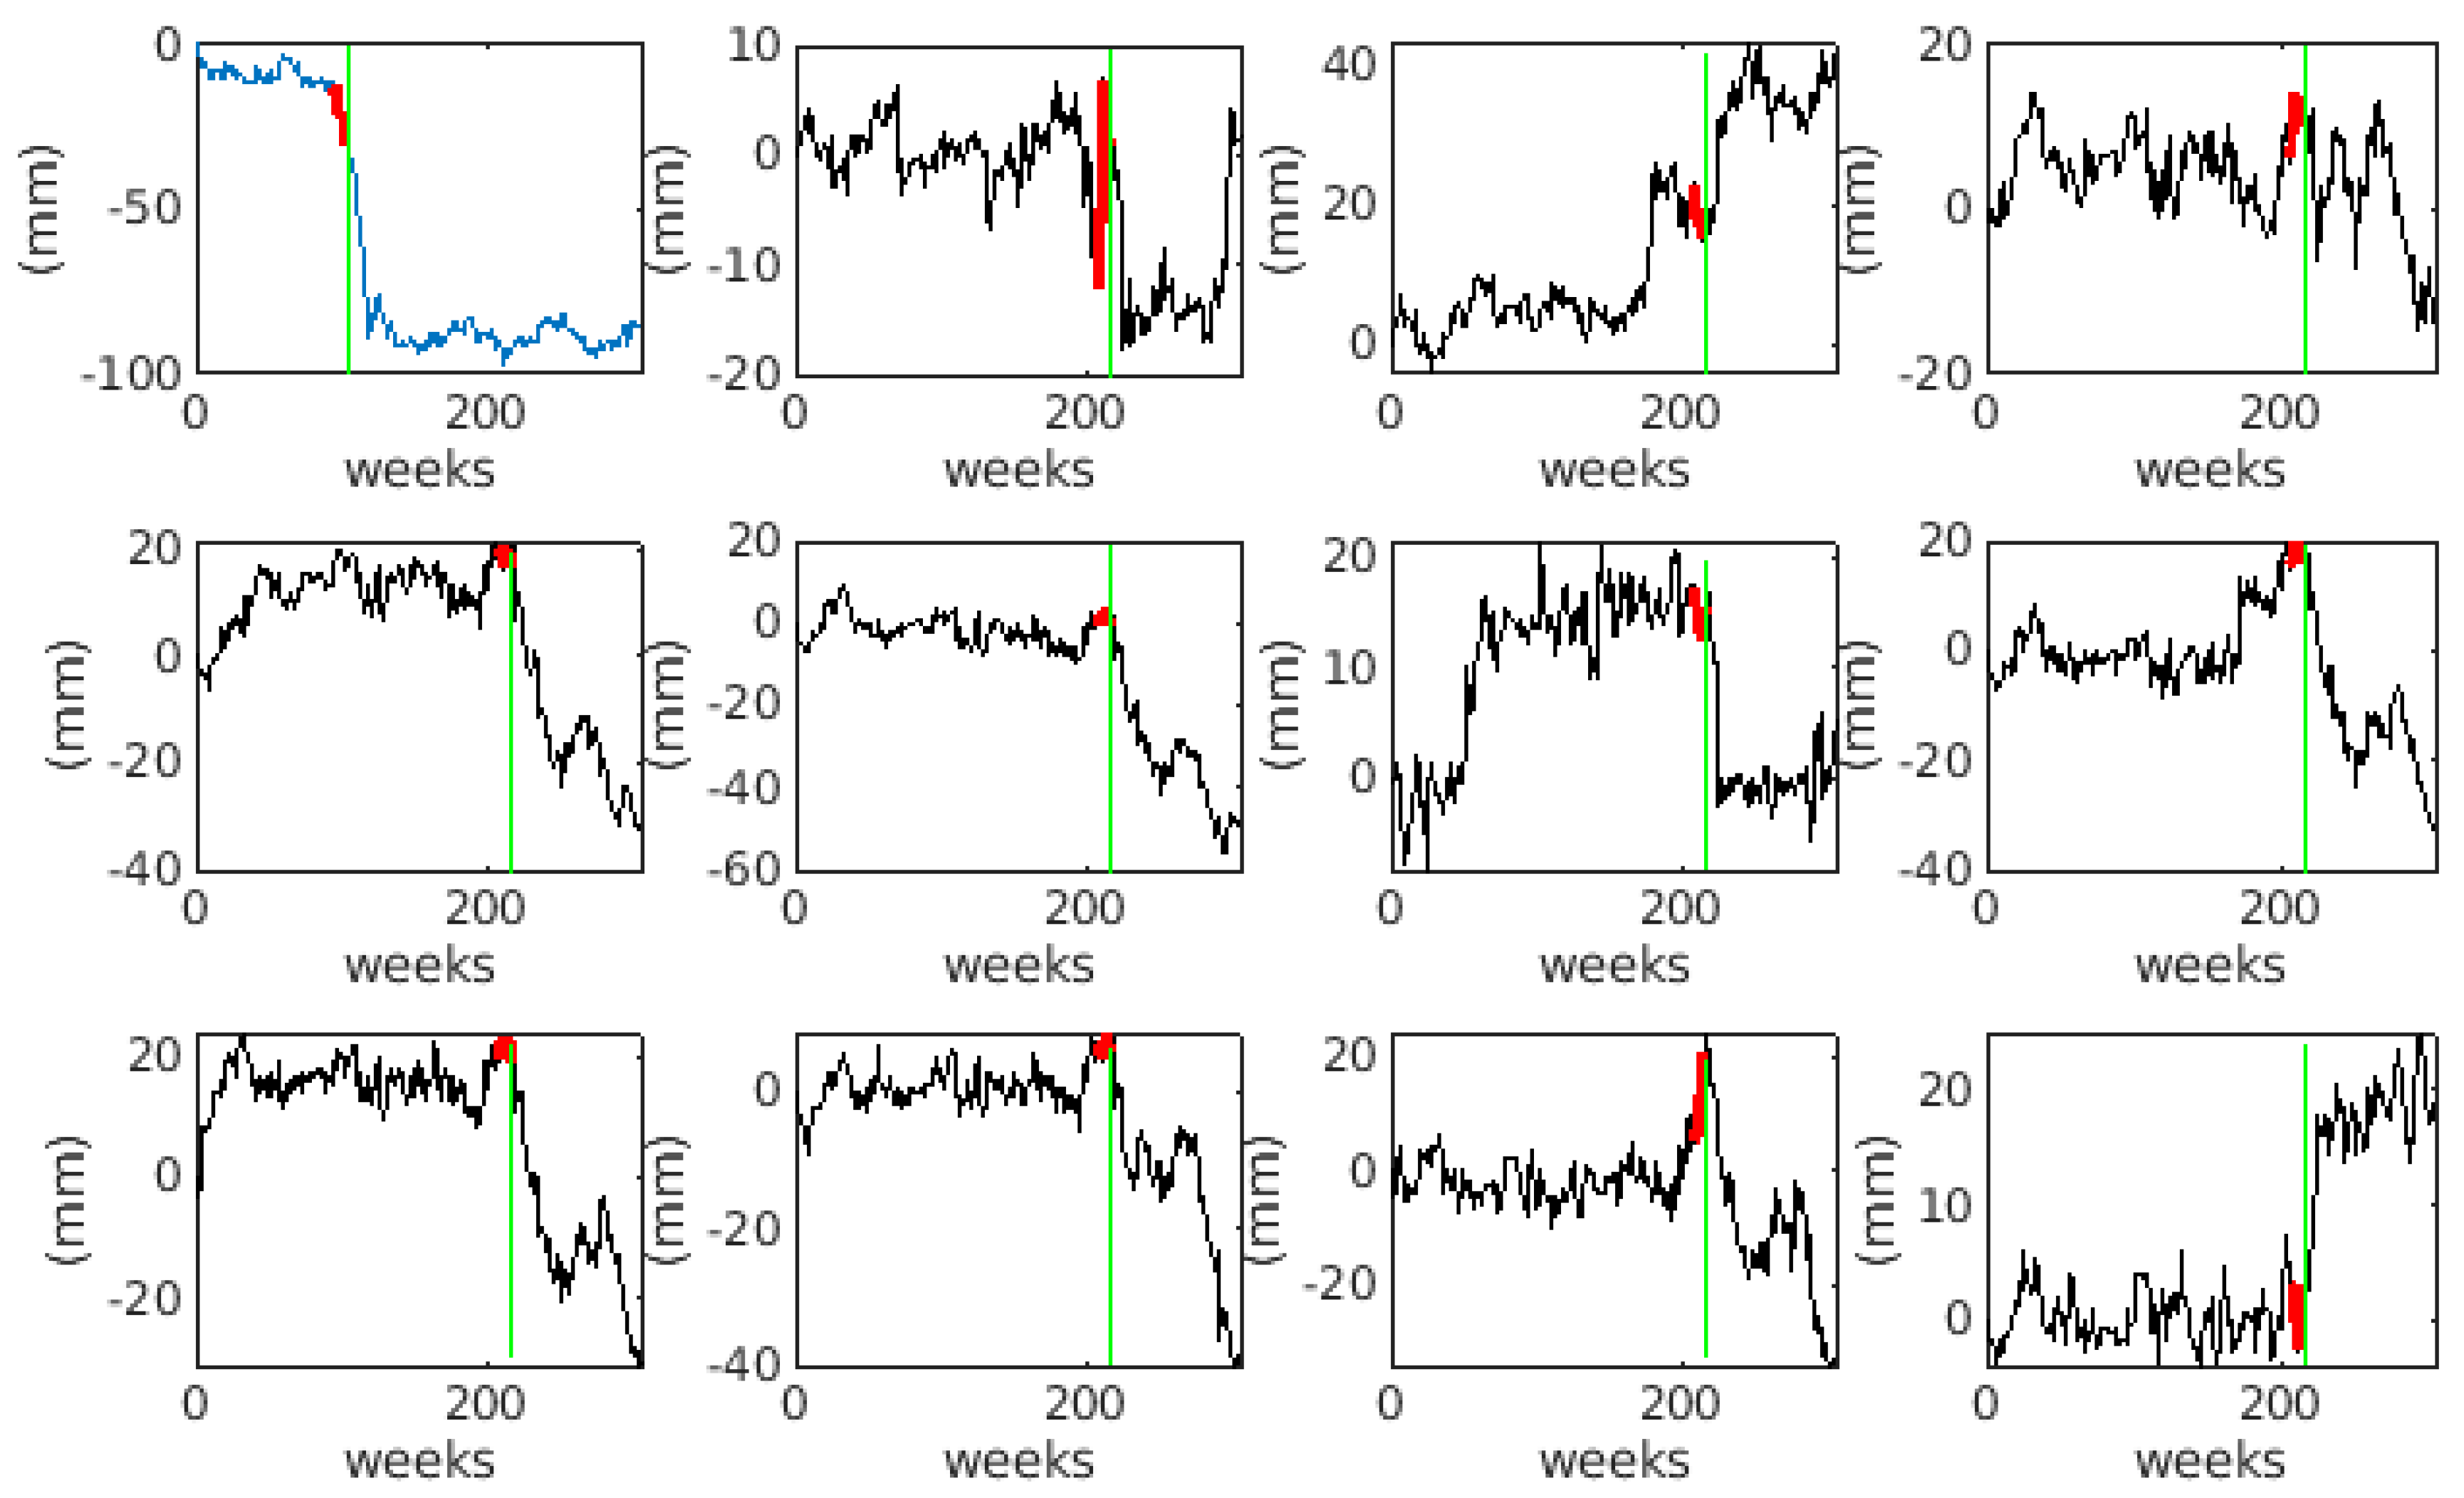
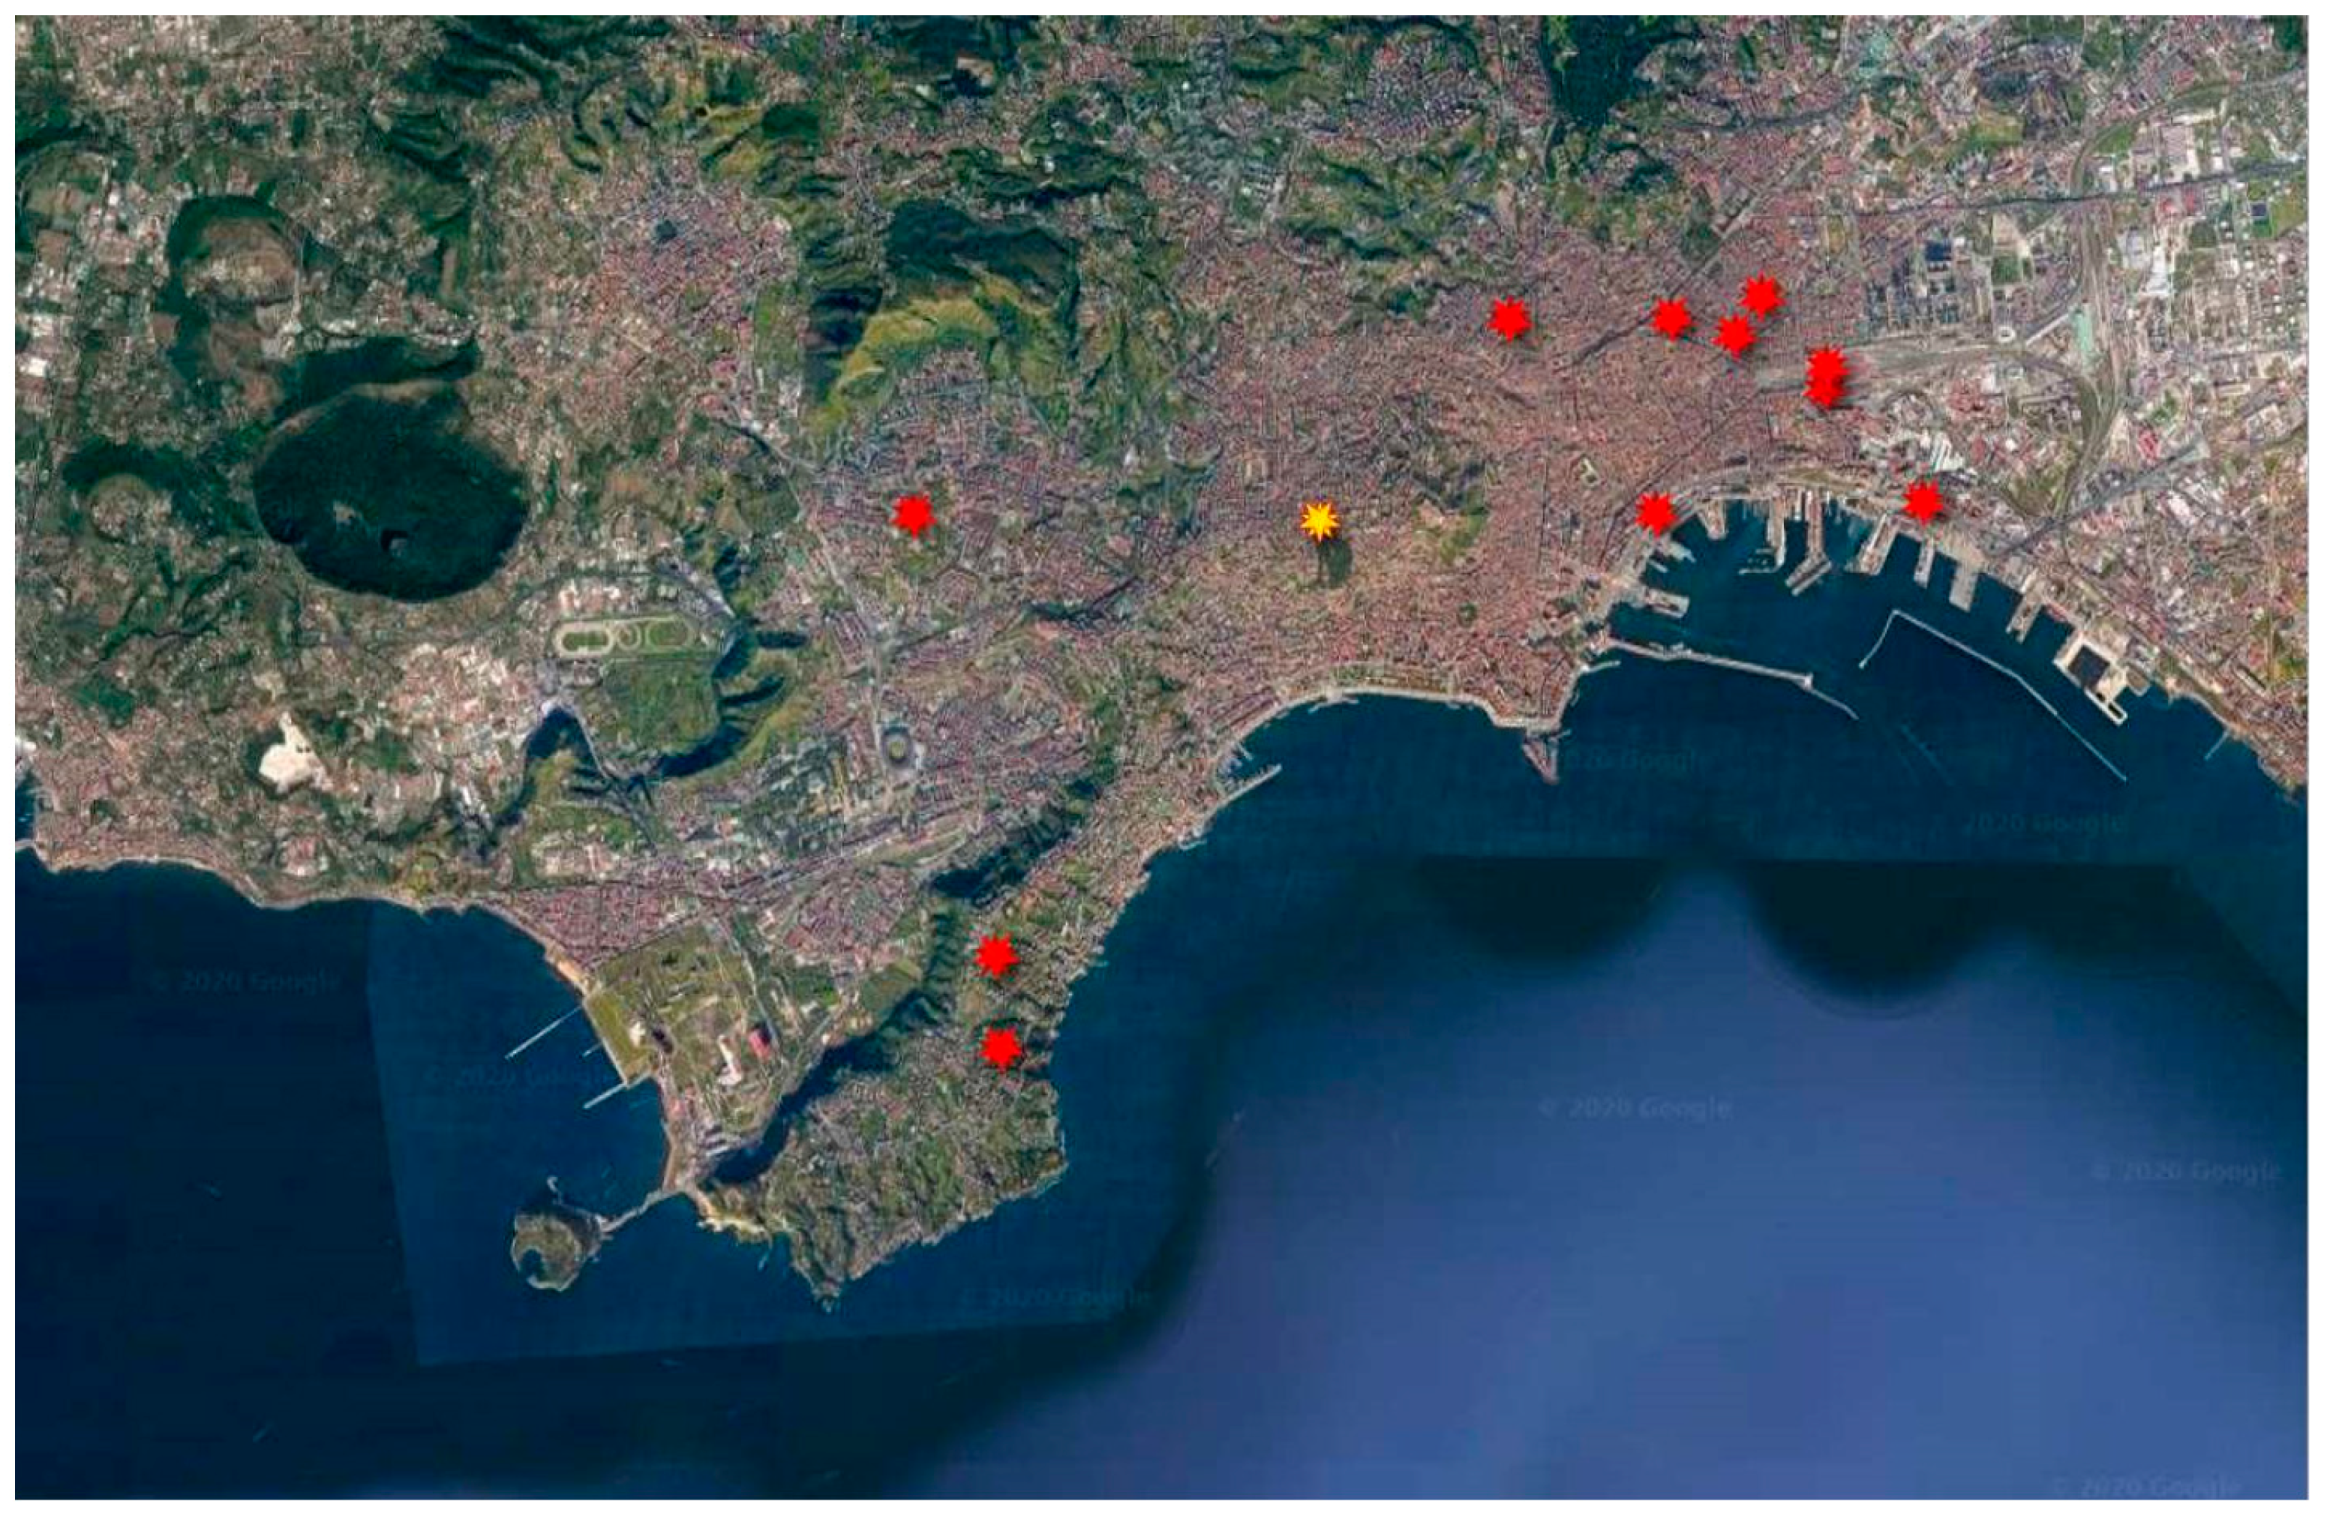
Strategy 2 followed the same steps of Strategy 1, apart from the choice of the warning cluster. In fact, in this case, a recorded noticeable event was chosen as the reference behavior, and the cluster which it belonged to was referred to as “warning”. As an example, the event shown in Figure 9 characterized by a comparatively high displacement in a short time was taken as a noticeable behavior (the representative early-stage pattern is shown in red). The 216th week was assumed as the monitoring instant. In total, we found 11 warnings over 411,581 target points. Figure 10 displays the 11 warnings (black) and the noticeable behavior (blue). In red are plotted the monitoring windows, while the monitoring instant (216) is highlighted by a green vertical line. Figure 10 shows that all the points belonging to the warning cluster exhibited an anomalous behavior after the monitoring instant. This shows the ability of the proposed method to detect likely critical events at their early stage. The 11 warning points are shown in the map of Figure 11. It is to be stressed again that a more in-depth study of the geological nature of the detected phenomena is beyond the purpose of the present study.
4. Discussion
On the basis of the applicative examples provided in Section 3, some comments are drawn on the proposed monitoring procedure.
- Strategy 1 assumed that a rare behavior precedes a critical event, which is a strong assumption indeed. Figure 8 shows, however, that this strategy successfully found one warning point at the chosen monitoring time. It is interesting to note that, as in the reference case (Figure 8a), a large ground settlement also occurred after the precursor window in the warning point (Figure 8b). It can also be observed that the rarity of the reference behavior led the trained SOM network to find only one similar event, which is an index of the selectivity of the monitoring system.
- Strategy 2 assumes that analogous events have similar timeseries precursors. A reference window was chosen in this case on the basis of the anomalous trend of the timeseries that followed. This strategy highlighted 11 warning points, all of them experiencing a comparatively large displacement developed in a short time after the precursor window. Again, it is to note that a limited number of warning points were detected by the monitoring system.
- The similarity between timeseries depends on the monitoring hyperparameters (e.g., length of the time window, scattering threshold). On the other hand, the choice of the hyperparameters can be calibrated according to the phenomenon to be monitored, provided that the main characteristics of the latter are known. It is expected in fact that different initial development times characterize different geological phenomena. In light of this, the monitoring system could even be carried out in parallel with different hyperparameters (e.g., the length of the time window) to forecast different geological events at their beginning.
- The early-warning procedure here proposed is flexible in the application under different monitoring strategies, as well as different hyperparameters.
- In any case, in situ inspections are always needed to better check the situation in real time at the warning points under expert geotechnical guidance.
- An unsupervised learning of the artificial neural network may produce false or missed alarms. One of the purposes of the present monitoring procedure is to reduce both of these. To this purpose, the ability of the monitoring system can be improved through different actions (e.g., increasing the number of clusters, suitably choosing the training set, and setting the length of the time windows), by exploiting any useful information taken from geological and historical studies in the considered area. In fact, as the monitoring system improves its knowledge, the number of detected anomalous or uncoded behaviors will be reduced.
- Despite showing a good ability to detect by similarity anomalous surface movements at their early stage, the procedure was tested in this preliminary study regardless of more strictly geological analyses or in situ inspections. Geological features, which are likely to affect even the choice of the training set, cannot be ignored when applying the monitoring procedure to real cases.
- The effectiveness of the proposed monitoring procedure is susceptible to some improvements: (i) considering patterns of geographical points relevant to urban sub-areas either in the training or in the monitoring phase to focus on specific phenomena; (ii) exploiting data relevant to multiple geographical areas to better calibrate the monitoring system; (iii) carrying out in parallel the procedure with different time window lengths and/or scattering thresholds, to forecast different kinds of events.
Lastly, some brief notes can be added on the advantages and limitations of the present monitoring system compared to other methods already available in the literature. Very powerful approaches based on cumulative displacement maps of InSAR data, have in fact been successfully used to monitor ongoing phenomena, which are typically in their overt phase [21,22]. The present method aims to be an early-stage monitoring system instead, able to forecast the incipit of potential ground instability phenomena.
On the other hand, the early-warning monitoring techniques available in the literature are generally aimed at predicting specific events for which an analytical or semi-empirical model is known. For example, the instant in which a landslide will occur was predicted in [56] through the inverse speed method, while the failure mechanism of a cataloged landslide event was studied in [57] to forecast the occurrence of similar events in different geographical areas according to some influencing factors. An attempt to predict the collapse of large infrastructures was also made in [28] using deformation outliers. These approaches were shown to be effective albeit dependent on the assumed physical model and focused on monitoring a particular phenomenon. Unlike these examples, the method here proposed is independent of any preliminary theoretical model of the involved geological phenomena. It generates an alarm on the basis of the analogy of the monitored timeseries with a reference timeseries, which has already been classified or chosen for the rarity of the event. In practice, the monitoring can be broad-spectrum and not limited to a specific type of event, while the analysis of the detected potentially critical events is assumed to take place after the alarm generation. Nevertheless, the method can even be calibrated to forecast specific geological phenomena (incipit of landslides, activation of faults, foundation settlements due to human underground activities or to the variation of groundwater levels) by duly setting the monitoring criteria and hyperparameters.
It is worth noting that the proposed method is still at a preliminary stage of development and its potential can be highlighted only after its application to real cases. In any case, even at an advantaged stage of development and application, the method is not autonomous since it requires a post-monitoring phase with in situ inspections. The abovementioned techniques available in the literature can be helpfully combined with the present method for a more comprehensive monitoring.
5. Conclusions
This paper presented a method to monitor ground surface displacements in urban areas with the purpose of forecasting anomalous behaviors from their early occurrence. Through training an SOM neural network, which highlights similarities among recorded timeseries, the method analyzes datasets of MT-InSAR timeseries recorded at hundreds of thousands of geographical points and provides warning signals according to a preset alert criterion. The method applies an unsupervised learning to yield a hierarchical clustering of the training set. An SOM is so obtained, representing the core of the monitoring system, which is able to highlight ground movements preluding the development of critical events. The method was tested on a dataset of InSAR timeseries relevant to a large Italian urban area. By way of example, two different strategies of monitoring were applied, one based on rare behaviors and the other one referring to a recorded noticeable event. The results obtained for both strategies show the capability of the method to highlight ground settlement phenomena at their early stage. This may lead to an automatized system of structural health monitoring in urban areas.
It should be stressed that, although realistic, the timeseries dataset and the warning criteria here adopted have only an explanatory intent, while the practical application of the method is expected to be carried out with the advice of geotechnical experts. Different critical soil phenomena could be, in fact, put in evidence by the present method, provided that the hyperparameters of the monitoring system are suitably set. Investigating in-depth on such phenomena is, however, outside of the scope of the present study, the main aim of which was to provide a general-purpose tool for the early warning of the foundation-related safety risk of civil structures and infrastructures in urban areas.
Although being model-independent and broad-spectrum, the present method is expected to be successful even in detecting the starting stage of specific geological phenomena, provided that it is duly calibrated. Calibration of the system and improvement of its selectivity (to avoid false or missed alarms) could be achieved through some strategical actions, for instance, referring to localized patterns of geographical points, considering multiple geographical areas to extract the training set, or carrying out the monitoring system in parallel with different warning criteria and hyperparameters. These issues will be addressed in future lines of research.
Author Contributions
Conceptualization, A.M. and M.C.P.; data curation, A.M. and M.C.P.; investigation, A.M. and M.C.P.; methodology, A.M. and M.C.P.; software, A.M.; supervision, M.C.P.; validation, A.M. and M.C.P.; writing—original draft, A.M. and M.C.P. All authors have read and agreed to the published version of the manuscript.
Funding
This research received no external funding.
Institutional Review Board Statement
Not applicable.
Informed Consent Statement
Not applicable.
Data Availability Statement
Data are available on request.
Acknowledgments
The Globus Mobility Program of the University of Cagliari (Italy) is acknowledged. Pietro Milillo (University of Houston, Texas) is gratefully acknowledged for his useful insights and for kindly providing the MT-InSAR data used in the study.
Conflicts of Interest
The authors declare no conflict of interest.
References
- Gayarre, F.L.; González-Nicieza, C.; Alvarez-Fernández, M.I.; Álvarez-Vigil, A.E. Forensic analysis of a pile foundation failure. Eng. Fail. Anal. 2010, 17, 486–497. [Google Scholar] [CrossRef]
- Michael, A.O.; Razak, A.R. The study of claims arising from building collapses: Case studies from Malaysia, Nigeria, Singapore and Thailand. Civ. Environ. Res. 2013, 3, 113–129. [Google Scholar]
- Sousa, J.J.; Bastos, L. Multi-temporal SAR interferometry reveals acceleration of bridge sinking before collapse. Nat. Hazards Earth Syst. Sci. 2013, 13, 659–667. [Google Scholar] [CrossRef]
- Kontogianni, V.; Pytharouli, S.; Stiros, S. Ground subsidence, Quaternary faults and vulnerability of utilities and transportation networks in Thessaly, Greece. Environ. Geol. 2007, 52, 1085–1095. [Google Scholar] [CrossRef]
- Ghorbani, M.; Sharifzadeh, M.; Yasrobi, S.; Daiyan, M. Geotechnical, structural and geodetic measurements for conventional tunnelling hazards in urban areas–The case of Niayesh road tunnel project. Tunn. Undergr. Space Technol. 2012, 31, 1–8. [Google Scholar] [CrossRef]
- Kong, T.B.; Komoo, I. Urban geology: Case study of Kuala Lumpur, Malaysia. Eng. Geol. 1990, 28, 71–94. [Google Scholar] [CrossRef]
- Cubrinovski, M.; Robinson, K.; Taylor, M.; Hughes, M.; Orense, R. Lateral spreading and its impacts in urban areas in the 2010–2011 Christchurch earthquakes. N. Z. J. Geol. Geophys. 2012, 55, 255–269. [Google Scholar] [CrossRef]
- Brownjohn, J.M. Structural health monitoring of civil infrastructure. Philos. Trans. R. Soc. A Math. Phys. Eng. Sci. 2006, 365, 589–622. [Google Scholar] [CrossRef] [Green Version]
- Floris, I.; Adam, J.M.; Calderón, P.A.; Sales, S. Fiber optic shape sensors: A comprehensive review. Opt. Lasers Eng. 2021, 139, 106508. [Google Scholar] [CrossRef]
- Porcu, M.C.; Pieczonka, L.; Frau, A.; Staszewski, W.J.; Aymerich, F. Assessing the Scaling Subtraction Method for Impact Damage Detection in Composite Plates. J. Nondestruct. Eval. 2017, 36, 33. [Google Scholar] [CrossRef]
- Porcu MCPatteri, D.M.; Melis, S.; Aymerich, F. Effectiveness of the FRF curvature technique for structural health monitoring. Constr. Build. Mater. 2019, 226, 173–187. [Google Scholar] [CrossRef]
- Celebi, M. GPS in dynamic monitoring of long-period structures. Soil Dyn. Earthq. Eng. 2000, 20, 477–483. [Google Scholar] [CrossRef]
- Gili, J.A.; Corominas, J.; Rius, J. Using Global Positioning System techniques in landslide monitoring. Eng. Geol. 2000, 55, 167–192. [Google Scholar] [CrossRef]
- Yi, T.H.; Li, H.N.; Gu, M. Wavelet based multi-step filtering method for bridge health monitoring using GPS and accelerometer. Smart Struct. Syst. 2013, 11, 331–348. [Google Scholar] [CrossRef]
- Lu, Z.; Miyagi, Y. Comparison of GPS and InSAR deformation measurements at Okmok volcano, Alaska. Alsk. Satell. Facil. News Notes 2005, 2, 1–4. [Google Scholar]
- Raucoules, D.; Colesanti, C.; Carnec, C. Use of SAR interferometry for detecting and assessing ground subsidence. Comptes Rendus Geosci. 2007, 339, 289–302. [Google Scholar] [CrossRef]
- Milillo, P.; Riel, B.; Minchew, B.; Yun, S.H.; Simons, M.; Lundgren, P. On the synergistic use of SAR constellations’ data exploitation for earth science and natural hazard response. IEEE J. Sel. Top. Appl. Earth Obs. Remote Sens. 2015, 9, 1095–1100. [Google Scholar] [CrossRef]
- Chen, F.; Masini, N.; Yang, R.; Milillo, P.; Feng, D.; Lasaponara, R. A space view of radar archaeological marks: First applications of COSMO-SkyMed X-band data. Remote Sens. 2015, 7, 24–50. [Google Scholar] [CrossRef] [Green Version]
- Milillo, P.; Rignot, E.; Rizzoli, P.; Scheuchl, B.; Mouginot, J.; Bueso-Bello, J.; Prats-Iraola, P. Heterogeneous retreat and ice melt of Thwaites Glacier, West Antarctica. Sci. Adv. 2019, 5, eaau3433. [Google Scholar] [CrossRef] [Green Version]
- Yang, L.; Feng, X.; Liu, F.; Liu, J.; Sun, X. Potential of soil moisture estimation using C-band polarimetric SAR data in arid regions. Int. J. Remote Sens. 2019, 40, 2138–2150. [Google Scholar] [CrossRef]
- Milillo, P.; Porcu, M.C.; Lundgren, P.; Soccodato, F.; Salzer, J.; Fielding, E.; Burgmann, R.; Milillo, G.; Perissin, D.; Biondi, F. The ongoing destabilization of the Mosul dam as observed by synthetic aperture radar interferometry. In Proceedings of the 2017 IEEE International Geoscience and Remote Sensing Symposium (IGARSS), Fort Worth, TX, USA, 23–28 July 2017; pp. 6279–6282. [Google Scholar]
- Milillo, P.; Giardina, G.; DeJong, M.; Perissin, D.; Milillo, G. Multi-temporal InSAR structural damage assessment: The London crossrail case study. Remote Sens. 2018, 10, 287. [Google Scholar] [CrossRef] [Green Version]
- Kadhim, N.; Mourshed, M.; Bray, M. Advances in remote sensing applications for urban sustainability. Euro-Mediterr. J. Environ. Integr. 2016, 1, 7. [Google Scholar] [CrossRef] [Green Version]
- Sun, W.; Shi, L.; Yang, J.; Li, P. Building collapse assessment in urban areas using texture information from postevent SAR data. IEEE J. Sel. Top. Appl. Earth Obs. Remote Sens. 2016, 9, 3792–3808. [Google Scholar] [CrossRef]
- Montisci, A.; Porcu, M.C. Self-organizing-Map Analysis of InSAR Time Series for the Early Warning of Structural Safety in Urban Areas. In International Conference on Computational Science and Its Applications; Springer: Cham, Switzerland, 2020; pp. 864–876. [Google Scholar]
- Reale, D.; Fornaro, G.; Pauciullo, A.; Zhu, X.; Bamler, R. Tomographic imaging and monitoring of buildings with very high-resolution SAR data. IEEE Geosci. Remote Sens. Lett. 2011, 8, 661665. [Google Scholar] [CrossRef] [Green Version]
- Milillo, P.; Giardina, G.; Perissin, D.; Milillo, G.; Coletta, A.; Terranova, C. Pre-Collapse Space Geodetic Observations of Critical Infrastructure: The Morandi Bridge, Genoa, Italy. Remote Sens. 2019, 11, 1403. [Google Scholar] [CrossRef] [Green Version]
- Holloway, J.; Mengersen, K. Statistical machine learning methods and remote sensing for sustainable development goals: A review. Remote Sens. 2018, 10, 1365. [Google Scholar] [CrossRef] [Green Version]
- Anuta, P.E.; MacDonald, R.B. Crop surveys from multiband satellite photography using digital techniques. Remote Sens. Environ. 1971, 2, 53–67. [Google Scholar] [CrossRef]
- Garcia-Pineda, O.; Zimmer, B.; Howard, M.; Pichel, W.; Li, X.; MacDonald, I.R. Using SAR images to delineate ocean oil slicks with a texture-classifying neural network algorithm (TCNNA). Can. J. Remote Sens. 2009, 35, 411–421. [Google Scholar] [CrossRef]
- Mahdianpari, M.; Salehi, B.; Rezaee, M.; Mohammadimanesh, F.; Zhang, Y. Very deep convolutional neural networks for complex land cover mapping using multispectral remote sensing imagery. Remote Sens. 2018, 10, 1119. [Google Scholar] [CrossRef] [Green Version]
- Foddis, M.L.; Ackerer, P.; Montisci, A.; Uras, G. ANN-based approach for the estimation of aquifer pollutant source behavior. Water Sci. Technol. Water Supply 2015, 15, 1285–1294. [Google Scholar] [CrossRef] [Green Version]
- Ito, Y.; Hosokawa, M.; Lee, H.; Liu, J.G. Extraction of damaged regions using SAR data and neural networks. Int. Arch. Photogramm. Remote Sens. 2000, 33, 156163. [Google Scholar]
- Baghdadi, N.; Gaultier, S.; King, C. Retrieving surface roughness and soil moisture from synthetic aperture radar (SAR) data using neural networks. Can. J. Remote Sens. 2002, 28, 701–711. [Google Scholar] [CrossRef]
- Secci, R.; Foddis, M.L.; Mazzella, A.; Montisci, A.; Uras, G. Artificial Neural Networks and Kriging method for slope geomechanical characterization. In Proceedings of the 12th International Association of Engineering Geology and the Environment (IAEG) Congress, Torino, Italy, 13–19 September 2014; pp. 1357–1361. [Google Scholar]
- Monjezi, M.; Hasanipanah, M.; Khandelwal, M. Evaluation and prediction of blast-induced ground vibration at Shur River Dam, Iran, by artificial neural network. Neural Comput. Appl. 2013, 22, 1637–1643. [Google Scholar] [CrossRef]
- Ghaboussi, J.; Joghataie, A. Active control of structures using neural networks. J. Eng. Mech. 1995, 121, 555–567. [Google Scholar] [CrossRef]
- Cannas, B.; Carcangiu, S.; Fanni, A.; Forcinetti, R.; Montisci, A.; Sias, G.; Usai, M.; Trulli, N.; Concu, G. Ultrasonic testing of masonry structures by features extraction and self-organising maps. Int. J. Civ. Eng. Build. Mater. 2013, 3, 166–215. [Google Scholar]
- Calledda, C.; Montisci, A.; Porcu, M.C. Optimal design of earthquake-resistant buildings based on neural network inversion. Appl. Sci. 2021, 11, 4654. [Google Scholar] [CrossRef]
- Pratola, C.; Del Frate, F.; Schiavon, G.; Solimini, D. Toward fully automatic detection of changes in suburban areas from VHR SAR images by combining multiple neural-network models. IEEE Trans. Geosci. Remote Sens. 2013, 51, 2055–2066. [Google Scholar] [CrossRef]
- Anantrasirichai, N.; Biggs, J.; Albino, F.; Bull, D. The application of convolutional neural networks to detect slow, sustained deformation in InSAR time series. Geophys. Res. Lett. 2019, 46, 11850–11858. [Google Scholar] [CrossRef] [Green Version]
- Mukherjee, S.; Zimmer, A.; Sun, X.; Ghuman, P.; Cheng, I. An unsupervised generative neural approach for InSAR phase filtering and coherence estimation. IEEE Geosci. Remote Sens. Lett. 2020, 18, 1971–1975. [Google Scholar] [CrossRef]
- Ma, C.; Li, T.; Zhang, H. Microseismic and precursor analysis of high-stress hazards in tunnels: A case comparison of rockburst and fall of ground. Eng. Geol. 2020, 265, 105435. [Google Scholar] [CrossRef]
- Carlà, T.; Intrieri, E.; Di Traglia, F.; Nolesini, T.; Gigli, G.; Casagli, N. Guidelines on the use of inverse velocity method as a tool for setting alarm thresholds and forecasting landslides and structure collapses. Landslides 2017, 14, 517–534. [Google Scholar] [CrossRef] [Green Version]
- Rainieri, C.; Fabbrocino, G.; Cosenza, E. Integrated seismic early warning and structural health monitoring of critical civil infrastructures in seismically prone areas. Struct. Health Monit. 2011, 10, 291–308. [Google Scholar] [CrossRef]
- Zollo, A.; Iannaccone, G.; Convertito, V.; Elia, L.; Iervolino, I.; Lancieri, M.; Gasparini, P. Earthquake early warning system in southern Italy. Encycl. Complex. Syst. Sci. 2009, 36, 2395–2421. [Google Scholar]
- Da Silva, I.N.; Spatti, D.H.; Flauzino, R.A.; Liboni, L.H.B.; dos Reis Alves, S.F. Artificial Neural Networks; Springer International Publishing: Cham, Switzerland, 2017. [Google Scholar]
- Wang, J. Artificial neural networks versus natural neural networks: A connectionist paradigm for preference assessment. Decis. Support Syst. 1994, 11, 415–429. [Google Scholar] [CrossRef]
- Sutton, R.S. Learning to predict by the methods of temporal differences. Mach. Learn. 1988, 3, 9–44. [Google Scholar] [CrossRef]
- Sanger, T.D. Optimal unsupervised learning in a single-layer linear feedforward neural network. Neural Netw. 1989, 2, 459–473. [Google Scholar] [CrossRef]
- Kohonen, T. Self-organized formation of topologically correct feature maps. Biol. Cybern. 1982, 43, 59–69. [Google Scholar] [CrossRef]
- Maass, W. On the computational power of winner-take-all. Neural Comput. 2000, 12, 25192535. [Google Scholar] [CrossRef]
- Available online: https://earth.esa.int/eogateway/catalog/cosmo-skymed-esa-archive (accessed on 1 December 2021).
- Chang, L.; Hanssen, R.F. Near real-time, semi-recursive, deformation monitoring of infrastructure using satellite radar interferometry. In Proceedings of the 2012 IEEE International Geoscience and Remote Sensing Symposium, Munich, Germany, 22–27 July 2012; pp. 1876–1879. [Google Scholar]
- Fuhrmann, T.; Garthwaite, M.C. Resolving three-dimensional surface motion with InSAR: Constraints from multi-geometry data fusion. Remote Sens. 2019, 11, 241. [Google Scholar] [CrossRef] [Green Version]
- Roy, P.; Martha, T.R.; Khanna, K.; Jain, N.; Kumar, K.V. Time and path prediction of landslides using InSAR and flow model. Remote Sens. Environ. 2022, 271, 112899. [Google Scholar] [CrossRef]
- Jiao, Q.; Jiang, W.; Qian, H.; Li, Q. Research on characteristics and failure mechanism of Guizhou Shuicheng landslide based on InSAR and UAV data. Nat. Hazards Res. 2021. [Google Scholar] [CrossRef]
Figure 1.
Schematic flowchart of the warning system.

Figure 2.
Hierarchical clustering procedure.

Figure 3.
Scattering of patterns belonging to a cluster.

Figure 4.
QGIS map of the considered Naples dataset.

Figure 5.
Some instances of In SAR displacement timeseries at geographical points in the urban area of Naples.
Figure 5.
Some instances of In SAR displacement timeseries at geographical points in the urban area of Naples.

Figure 6.
High-ranking and low-ranking examples.

Figure 7.
Histogram of occurrences’ incidence in the clusters.

Figure 8.
(a) Time diagram with the window (in red) belonging to the reference cluster; (b) time diagram of the warning point found though monitoring Strategy 1 (monitoring window in red); (c) position of the two points in the map.
Figure 8.
(a) Time diagram with the window (in red) belonging to the reference cluster; (b) time diagram of the warning point found though monitoring Strategy 1 (monitoring window in red); (c) position of the two points in the map.

Figure 9.
Noticeable behavior (early stage in red).

Figure 10.
Noticeable behavior (diagram at the top left, see Figure 8) and corresponding warnings (in black) at the monitoring instant (216th week; green line). The monitoring windows are displayed in red.
Figure 10.
Noticeable behavior (diagram at the top left, see Figure 8) and corresponding warnings (in black) at the monitoring instant (216th week; green line). The monitoring windows are displayed in red.

Figure 11.
Map of warnings (the point with the reference behavior is shown in yellow while the warning points are in red).
Figure 11.
Map of warnings (the point with the reference behavior is shown in yellow while the warning points are in red).

Publisher’s Note: MDPI stays neutral with regard to jurisdictional claims in published maps and institutional affiliations. |
© 2022 by the authors. Licensee MDPI, Basel, Switzerland. This article is an open access article distributed under the terms and conditions of the Creative Commons Attribution (CC BY) license (https://creativecommons.org/licenses/by/4.0/).
Share and Cite
MDPI and ACS Style
Montisci, A.; Porcu, M.C. A Satellite Data Mining Approach Based on Self-Organized Maps for the Early Warning of Ground Settlements in Urban Areas. Appl. Sci. 2022, 12, 2679. https://doi.org/10.3390/app12052679
AMA Style
Montisci A, Porcu MC. A Satellite Data Mining Approach Based on Self-Organized Maps for the Early Warning of Ground Settlements in Urban Areas. Applied Sciences. 2022; 12(5):2679. https://doi.org/10.3390/app12052679
Chicago/Turabian StyleMontisci, Augusto, and Maria Cristina Porcu. 2022. "A Satellite Data Mining Approach Based on Self-Organized Maps for the Early Warning of Ground Settlements in Urban Areas" Applied Sciences 12, no. 5: 2679. https://doi.org/10.3390/app12052679
Note that from the first issue of 2016, this journal uses article numbers instead of page numbers. See further details here.