Article

Project Risk in the Context of Construction Schedules—Combined Monte Carlo Simulation and Time at Risk (TaR) Approach: Insights from the Fort Bema Housing Estate Complex

by
Janusz Sobieraj
1 and
Dominik Metelski
2,*
1
Department of Building Engineering, Warsaw University of Technology, 00-637 Warsaw, Poland
2
Faculty of Economics and Management Sciences, University of Granada, 18071 Granada, Spain
*
Author to whom correspondence should be addressed.
Appl. Sci. 2022, 12(3), 1044; https://doi.org/10.3390/app12031044
Submission received: 16 December 2021 / Revised: 11 January 2022 / Accepted: 17 January 2022 / Published: 20 January 2022

Abstract

:
In this article, we present our own construction process model consisting of 16 stages and eight phases, which is particularly applicable to large investment projects. In the context of each project phase, we examine how the appropriate way of scheduling construction processes affects the problem of the risk of prolonging individual phases and the whole project, as well as of not meeting deadlines (which is one of the main problems faced by management practitioners in the construction industry). There are many methods for assessing risk in this context, but they tend to be overly complex and rarely used by construction practitioners. On the other hand, the risks associated with potential schedule delays can be considered holistically. One tool that can serve this purpose is the combined Monte Carlo simulation and Time-at-Risk (TaR) approach, which originates from the world of finance. We show how the implementation of the process model (individual phases) and the whole project can be considered in the context of the covariance matrix between all its phases and how changes in the arrangement of these phases can affect the risk of time extension of the whole project. Our study is based on simulation data for a large development project (Fort Bema/Parkowo-Leśne housing estate complex) in Bemowo, a district of Warsaw, carried out between 1999 and 2012. The entire investment project involved the construction of almost 120,000 m2 of floor space.

1. Introduction

Time uncertainty is ubiquitous in all disciplines of project planning and scheduling, yet in the construction industry it is of particular importance [1,2,3,4,5,6]. In particular, the uncertainty and risk associated with scheduling is an important aspect of large and complex construction projects [7,8,9,10]. In fact, successful project completion is mainly the result of a variety of multidirectional and comprehensive activities in the area of the creation of companies’ intellectual capital, preparation of flexible plans and schedules, and their posterior implementation [3]. The analysis of completion times for individual activity tasks as well as entire phases/stages of the construction process should help project managers understand the factors that influence the final estimate of project duration [1,10].
Among the methods used for project scheduling, the best known (and most commonly used) are the critical path method (CPM) [11,12] and the programme evaluation and review technique (PERT) [10]. These methods are based on the determination of minimum times assigned to individual tasks/activities of the project, without which its realisation is not possible. More precisely, these tasks are critical activities that have a direct impact on the overall duration of the project completion. In other words, any change in the duration of the critical activities affects the project deadline. However, schedules developed with the use of these classical deterministic methods represent completely unrealistic expected project deadlines that are very likely to be exceeded [8]. Methods like CPM and PERT were criticised by a number of researchers for being not true models of the construction process. These methods lack the adequacy to model complex logic and resource constraints in a construction process [13,14,15,16,17,18,19]. This form of scheduling seems to be particularly unsatisfactory for construction projects, where exceeding completion dates carries heavy penalties [9]. In any project there is also a whole range of activities whose possible disruption does not always affect the project’s target completion date (in this sense they are non-critical activities); in such cases there are some flows or slacks, providing a certain degree of execution flexibility in terms of time buffers. In other words, a float, or slack is the amount of time by which a project or activity can be delayed without extending the completion time of the entire project; while the total slack is the amount of time by which the entire project can be delayed without postponing the ending date of the project. To some extent the shortcomings of the deterministic methods can be solved with the Critical Chain Project Management (CCPM) method, which addresses resource alignment (and resource constraints), requiring some flexibility in resource allocation and individual stages’ starting dates [20]. In other words, an appropriate use of resources plays a key role in the CCPM method. The results confirm that CCPM can perform better than the traditional CPM method, which translates into significantly shorter construction times combined with accurate resource levelling at the early stages [20]. The application of CCPM leads to a reduction in indirect costs due to shorter project implementation times and a reduction in direct costs as a result of better allocation of resources and ensuring their timely availability.
Also, many problems related to project implementation and project management can be solved with the use of game theory, which allows for the shifting (and appropriate allocation) of resources between specific activities (and phases/stages) of a project. This requires some trade-off between the execution times and costs of each activity [21]. That is, it is possible to reduce the time for a given task by allocating more resources to its execution; this depletion of resources is later compensated at the expense of the execution times of some non-critical tasks. It is obviously a good idea to conduct an appropriate cost-benefit analysis in this context.
In addition to the aforementioned CPM, PERT or CCPM scheduling methods, there are many others that also find practical application, such as Line of Balance (LOB) [22,23,24,25,26], Q Scheduling [27,28], Resource Oriented Scheduling [29,30], Last Planner System [31], or a widespread schedule visualisation method such as Gantt Charts [32,33]. There are also numerous studies that facilitate accurate analysis and prediction of project delay risks. These include Bayesian networks [34,35], decision trees and Bayesian classification algorithms [36], Naïve Bayesian (machine learning models) [36], Bayesian Belief Network [37], logistic regression [38], Markov Dynamic PERT Model [39] and Correlated Schedule Risk Analysis (CSRA) [20]. It should be noted here that understanding schedules is an important thing that often determines project success [2,3,40], therefore the more tools and research findings to help understanding in the area of project scheduling, the better.
Thus, in the context of some studies mentioned above, it is possible to determine/quantify/model the probability of project schedule delays using various research methods [36,37,38]. On the other hand, when analysing the literature on the subject, it is hard not to notice the lack of appropriate methods that would allow a comprehensive (from the risk control perspective) assessment of the risk of delays of a construction project, taking particular account of individual stages of the project. It would be good if such a method accounted for dependencies between individual stages of the project, and even allowed for conducting appropriate stress-tests in the context of potential results of changes in the schedules. A method of this kind exists and works very well in the financial world. It is known as the Value at Risk (VaR) measure. VaR is a statistic that quantifies the extent of possible financial losses in a firm, portfolio or position over a specified time period. It is a measure that allows to assess the probability of losing a specific value of an investment portfolio and to simulate the impact of changes in the external environment on the value of the entire portfolio. In addition, since many interesting solutions are created by transferring already existing solutions from other fields, it is very likely that applying a solution similar to VaR would work well with construction projects. To this end, individual stages of the project can be perceived as a set/collection of stages/activities and can be treated similarly to an investment portfolio. Instead of VaR in this study we will use Time-at-Risk (TaR), which is constructed similarly to VaR, although its interpretation is slightly different. TaR represents a certain quantile for a given probability distribution, so it is similar to VaR; however, TaR measures the magnitude of risk as time (the time until an adverse event occurs) rather than value (loss amount). This measure has already been analysed in other research papers, but in a slightly different context [41,42].
TaR can potentially allow construction practitioners not only to understand the impact of postponing activities/stages/phases, but also to visualise how frequently such changes are likely to occur. More importantly, the Time-at-Risk approach applied in construction projects can potentially give construction firms and project managers a high degree of confidence that they are adequately equipped to withstand schedule changes with minimal losses.
In this study, we present a proprietary model of the investment process and show how the implementation of its individual stages/phases, as well as the entire project, can be evaluated in the context of the covariance matrix between time schedules of all its stages and how their appropriate schedule timing can affect the risk of extending the implementation time of the entire project. Our study is based on both real and simulation data for a large development project, Fort Bema in Warsaw (Parkowo-Leśne housing estate complex), which was implemented in 1999–2012 and involved the construction of almost 120,000 m2 of floor usable space area.
We also review the literature and point out the most important aspects of project scheduling, describe the research methodology and finally present the results, discussion and conclusions. The rest of the paper is organised as follows. In the following part, we discuss some theoretical aspects related to the topic of our study. In the empirical part that follows, we focus on the analytical aspects, presentation of data and models, and methodology to better understand the intricacies of scheduling in construction and the aspects of the Time-at-Risk concept. The paper ends with the discussion and final conclusions.

2. Literature Review

One of the most important elements of every construction project management is the preparation of an appropriate schedule [10,43]. It should be detailed and realistic so that it reflects all the assumed (planned) activities, stages and whole phases of the project and facilitates their proper coordination. It is good when the schedule itself is understandable for all stakeholders involved in the project [32]. Research has clearly shown that Gantt Charts are the best tool to increase schedule comprehensibility [32]. A well-developed schedule should indicate important milestones against a timeline, and these can be considered as starting and ending dates for individual stages and phases. However, no matter what the project schedule is, it is usually difficult to implement and manage, and there are many reasons for this, but in general they can all be grouped under the category of uncertainty around the duration of activities and whole project phases [18]. To begin with, each construction project has very complex characteristics and consists of thousands of different activities [10], each of which is different. Even when assuming that these activities/stages are similar to the ones known from previously executed construction projects it is still difficult to accurately reproduce them in each subsequent project. In other words, it is difficult to standardise certain activities (in this respect every activity is project-specific). Therefore, it is difficult to estimate precisely the completion times of most activities, stages, not to mention the whole projects [18]. In general, there are many reasons why the majority of construction projects fail to achieve their objectives, exceeding the assumed completion times [44].
There is a group of researchers and scientists who attribute the highest proportion of the total uncertainty associated with a construction project to its early stages [10,45,46,47,48]. Adequate risk control related to project scheduling can help to mitigate the uncertainty that accompanies many construction projects. Therefore, risk management is becoming more and more important in projects.
The common practise in analysing the uncertainty of times for individual tasks is to divide the project into several construction processes and to capture the uncertainty of individual components (elements) probabilistically [1,16].
It is also worth remembering that risk is defined as any change (also positive) with respect to the assumed objectives [49]. Risk is always seen in the context of both the aforementioned deviations from expectations (both positive and negative) and is quantified by its probability of occurrence. In any case, in order to manage risks appropriately, they must first be adequately recognised and quantified by means of an appropriate model [50]. In the past, network diagram techniques were used for this purpose. Conventional deterministic methods such as CPM do not address the problem of project uncertainty. The opposite is true, i.e., these methods imply certainty about the successful completion of each of the activities under consideration. They indicate certain rigid values for the duration of each activity and do not take into account different scenarios. As it turns out, however, the effectiveness of the CPM method is very low, and the probability that it correctly indicates the duration of any activity does not even exceed 25% [16]. The situation does not look better when it comes to the PERT method [17,18,19], which typically underestimates schedule times in majority of cases [17,19].
According to Kong et al. [16], in order to develop a more realistic schedule, a formal identification and assessment of project uncertainty is essential. They list a number of different methods used in project risk analysis (e.g., sensitivity analysis, decision tree analysis and the Delphi method), accentuating the superiority of Monte Carlo simulations, which, in their opinion, offer the greatest potential [51,52].
Lindkvist and Soderlund [53] point out the importance of meeting deadlines in the form of a schedule as a key component of any project. In the same vein, the importance of the schedule in project development is further underpinned by Dille and Söderlund [54], who attribute a fundamental importance to the time component in the context of integrating all stakeholders in the project. In this sense, the Gantt method enables what Dille and Söderlund [54] call isochronism by addressing the temporal positioning of certain tasks/activities and thus emphasising the importance of timely project completion.
An interesting perspective seems to be that of Yakura [55], who perceives the Gantt method as a boundary object in the context of time, which leads the parties involved to perceive the project in concrete (rather than abstract) terms, subject to a common understanding that is appropriately communicated between project participants. According to Geraldi and Lechter [32], while supporting the Gantt method in projects is good, it is important that it does not override management efforts, as an excessive focus on time can neglect other aspects of project management such as project quality, value creation, maintaining appropriate relationships with other project stakeholders, etc. In this context, Maylor [33] warns in his work that project management should not be reduced to time management, especially since time is not necessarily always the decisive criterion for success. There are many examples where excessive time pressure to complete a project on time has led to a failure of the project [10,56,57]. The following are examples of such projects [10]: in Germany, the construction of a railway tunnel in Cologne, the construction of a bypass around Munich, the destruction caused by underground works that led to the collapse of the municipal archives building, etc.; in China, the construction of a railway line from Qinghai province to the Tibetan capital; in the USA, the World Trade Center reconstruction project; in Brazil, the construction of the Belo Monte dam; in the UK, a delay of more than 2 years in the construction of Terminal 5 of London Heathrow Airport; in Poland, delays in the construction of stadiums and road investments, such as the famous extension of the bridge in Mszana by more than 4.5 years, as well as the construction of a housing estate in Warsaw’s Wilanów district, which has been dragging on for years, and many others.
Jugdev and Müller [58] point out that increasing pressure for sustainable development, as well as the customisation of certain solutions (customers expect products and services tailored to their needs), ensure that the focus on the time component of a project and performance is not the only important project criteria. According to Geraldi and Lechter [32], wherever non-time-related project performance criteria are more important than those in which time plays a key role—placing great emphasis on the use of Gantt charts will not be justified; the authors point to many projects that are perceived as very successful, although they did not meet time-related criteria.
According to Flyvbjerg et al. [59,60] and Beckers et al. [61], any negative changes in project scheduling are among the most important factors undermining successful completion of construction investments. Therefore, time schedule constraints are a key issue for every construction company. Sobieraj [10] argues that time overruns are so common these days that they need to be reflected in project implementation procedures [9,10]. Flyvbjerg et al. [60] see the reasons for this in the (systematically reproduced) overly optimistic assumptions (i.e., time, cost and benefit forecasts for such projects) made in the planning phase. In this respect, the observations of Flyvbjerg et al. [59,60] are in line with the findings of the studies presented by Bliński [45] and Obolewicz [46], namely that the conceptual and planning phases are the most important in terms of possible delays and costs overruns for the entire project. Sobieraj [48] notes that most of the project management methodologies applied in construction focus on implementation phases, while neglecting the phases and stages determining the success and quality of the project, i.e., preparation and adoption of the feasibility study and directions of the local spatial development plan in cooperation with urban planners, architects and investors [10,48].
Various types of risks with construction project time schedules were analysed with the use of such methods as naïve Bayesian classifiers [36], Bayesian belief networks [37], the logit and probit models [38], robustness [62,63,64,65], Monte Carlo simulation [66], etc.
Table 1 shows different methods addressing time schedule management in construction projects.
Different schedule management techniques viewed from construction practitioners’ perspective are presented in Table A2 in Appendix A.
Moreover, Gondia [36] emphasises that many schedule management problems can be solved thanks to machine learning (a relatively young but rapidly developing method), which offers an ideal set of techniques that can deal with such complex systems. However, it must be stressed that the implementation of such techniques is not an easy task, especially in a sector such as construction; development in this area is still at an early stage. Nevertheless, Gondia [36] has developed two such models using decision tree and naïve Bayesian classification algorithms. These algorithms were identified and trained using a dataset, predicting the extent of project delays. However, it is important to note that the development of such complex models requires not only the identification of relevant sources and risk factors of a delay, but also the use of a multidimensional dataset of past project time performances and risk sources leading to the delays [36]. Risk factors are active, interdependent, and dynamic, but naïve Bayesian models leverage machine learning capabilities to facilitate evidence-based decision making to enable proactive project risk management strategies [36].
A number of different factors need to be taken into account when developing construction projects schedules, including weather [71,72] and macroeconomic factors/conditions (external factors are unpredictable and cannot be controlled) [73]. Bragadin and Kähkönen [74] emphasise the importance of a quality schedule and attribute to it an important role in reducing delays in project implementation and achieving agreed outcomes and benefits (deliverables) [75]. A high-quality schedule is interpreted by the above authors as an optimal and feasible plan of activities. The quality of a schedule can be improved by contrasting expected results with resource and spatial constraints and technical knowledge, avoiding subjectivity and uncertainty by optimising all activities (groups of activities) to produce an achievable schedule/action plan [74].
Good scheduling technique aims to minimise the possibility of project delays [10]. This includes taking time risk into account when planning construction projects and factoring in adequate time reserves (i.e., slacks) for activities or whole groups of activities that carry relatively high risks of delays/disturbances.
Also, Ortiz-González et al. [76] highlight the gap between construction theorists and practitioners and the low willingness of construction practitioners to utilise theoretical solutions/methods, resulting in a high degree of subjectivity in the assessment of time risk in construction projects [76].
The fact is that the vast majority of errors in investment projects can be avoided, or at least their impact on the whole process reduced, if appropriate tools are used to create, visualise and manage schedules. Appropriate mathematical (statistical) models can be helpful in this regard. One such approach is robustness [62,64,65] and predictive scheduling with a proactive approach [63].
According to Mubarak [77], the uncertainty surrounding a construction project makes scheduling an extremely difficult task. In order to better understand the problems associated with the time element in the preparation of schedules, it is necessary to understand detailed historical records and make appropriate calculations.
The paper focuses on schedules, however, in the empirical part (case study analysis) there are many references to individual stages and phases of the investment process, therefore this issue cannot remain unaddressed also in the theoretical part. A review of the literature on this topic reveals significant differences in the approach to defining and representing construction investment processes. The discrepancies concern the nomenclature itself, the individual stages and phases of an investment project, and the list of specific activities and measures that make up each stage/phase [46]. It should also be remembered that the discrepancies are due to the fact that every investment project is different. This is why practitioners and scholars often argue about how to present individual stages and phases/activities of a construction investment process. For example, Biliński [45] divides each investment-construction process into three stages, i.e., preparation of the investment project (stage A), activities preceding the commencement of works (stage B) and construction works, followed by maintenance of the building facility (stage C). Grzywiński [78] describes four stages of the construction process and, within each of them, outlines the activities to be performed from the investor’s perspective. The stages of the investment process that he distinguishes pursuant to the construction legal framework are determination of the legal status and purpose of the property (stage 1), elaboration of the development conditions and preparation of the construction works (stage 2), obtainment of the construction permit and execution of construction works (stage 3) as well as obtainment of the operation permit and commencement of operation/exploitation of the building facility (stage 4). Zabielski [79] distinguishes four project phases, namely determination of the location conditions for a given investment, preparation of appropriate documentation, execution of construction works and exploitation of construction facilities. In each of these phases he identifies appropriate actions of legal, administrative and factual character. In turn, Dzierżewicz and Dylewski [80] describe an investment process through the prism of legal norms and provide a detailed description of its four phases and stages, i.e., stage 1, in which the conditions for the development and land use are established, stage 2, which consists in preparing the investment for its realisation, stage 3, which involves the implementation of the investment itself, and stage 4, which relates to the maintenance of the completed construction facility [80]. Strzelecka et al. [81] introduce five phases of the construction investment process, i.e., formulation of the project (pre-investment phase), analytical and research activities (divided into two phases), execution of construction works (execution phase) and the use (exploitation phase). Połoński [82] describes the construction investment process as consisting of three stages, i.e., investment preparation for realisation (phase 1), investment execution (phase 2) and operation of completed construction facilities (phase 3, otherwise known as the exploitation phase) [80]. He defines the investment process as a sequence of coordinated activities and actions of legal, organisational, technical, technological and financial nature, which as a whole lead to the realisation and subsequent use (exploitation) of the planned construction investment within a specified period of time and within certain limited financial resources. Baryłka and Baryłka’s [83] approach differs from those described above in that it clearly separates the part of the construction process associated with the preparation and implementation of the investment process from the use and decommissioning part. In total, they identify four stages of the investment process. Obolewicz [46] points to a wide variety of interpretations of the elements of the investment process in construction and makes an effort to systematise them [46]. As a result, each construction object (investment) is created based on a different set of activities that make up the whole investment process. This is due to the fact that many different factors determine the final outcome of the investment completion. For investors and practitioners in the construction industry, however, it is not so much the process itself that is important as the ratio of implementation costs to the original investor cost estimates. To understand the structure of such costs, it is worth reaching for the Dutch experience described by Biliński [45]. Namely, on its basis we know that the very conceptual phase of a construction investment has the greatest impact on its overall cost (up to 200–300%) [45]. It is followed by the preliminary design phase, the influence of which on the total cost of the project is estimated to be between 40% and 80%. On the other hand, the influences of the executive project and the implementation phase are much smaller and amount to 15–30% and 5–10%, respectively. Although these studies are not new, the sense of these experiences—as Biliński aptly notes—is meaningful [45]. Put another way, it is the conceptual phase that should receive the most attention, as its impact on the subsequent total cost of the project is the greatest. Unfortunately, as Obolewicz [46] notices, in the Polish reality, investors are particularly keen on reducing the investment implementation time as much as possible, which in practice results in limiting the time that is devoted specifically for preparation of an investment [46]. In an attempt to find a recipe for keeping the investment budget in check and completing it according to the original timeline, Obolewicz [46] points to the need for careful execution of the investment preparation stage, and for shortening as much as possible the execution stage of the investment itself (as this is when the accumulation of resources takes place) and maintaining integration and coherence of all stages of the investment process. In the latter respect, the institution of the substitute investor is of key importance, as it makes it possible to coordinate all activities and actions that are part of the construction investment process (e.g., civil-legal, administrative-legal, design, consultation, financial, and those related to construction works or operation of the completed building facility itself).
The use of an appropriate investment process model is essential in this study, as scheduling involves potential shifts between individual stages of such a process. In this sense, it constitutes a certain framework with which it is possible to describe and encapsulate every investment project. At the same time, an appropriate timing of individual stages of the investment process and any changes with regards to their synchronisation can be viewed as schedule management.

3. Materials and Methods

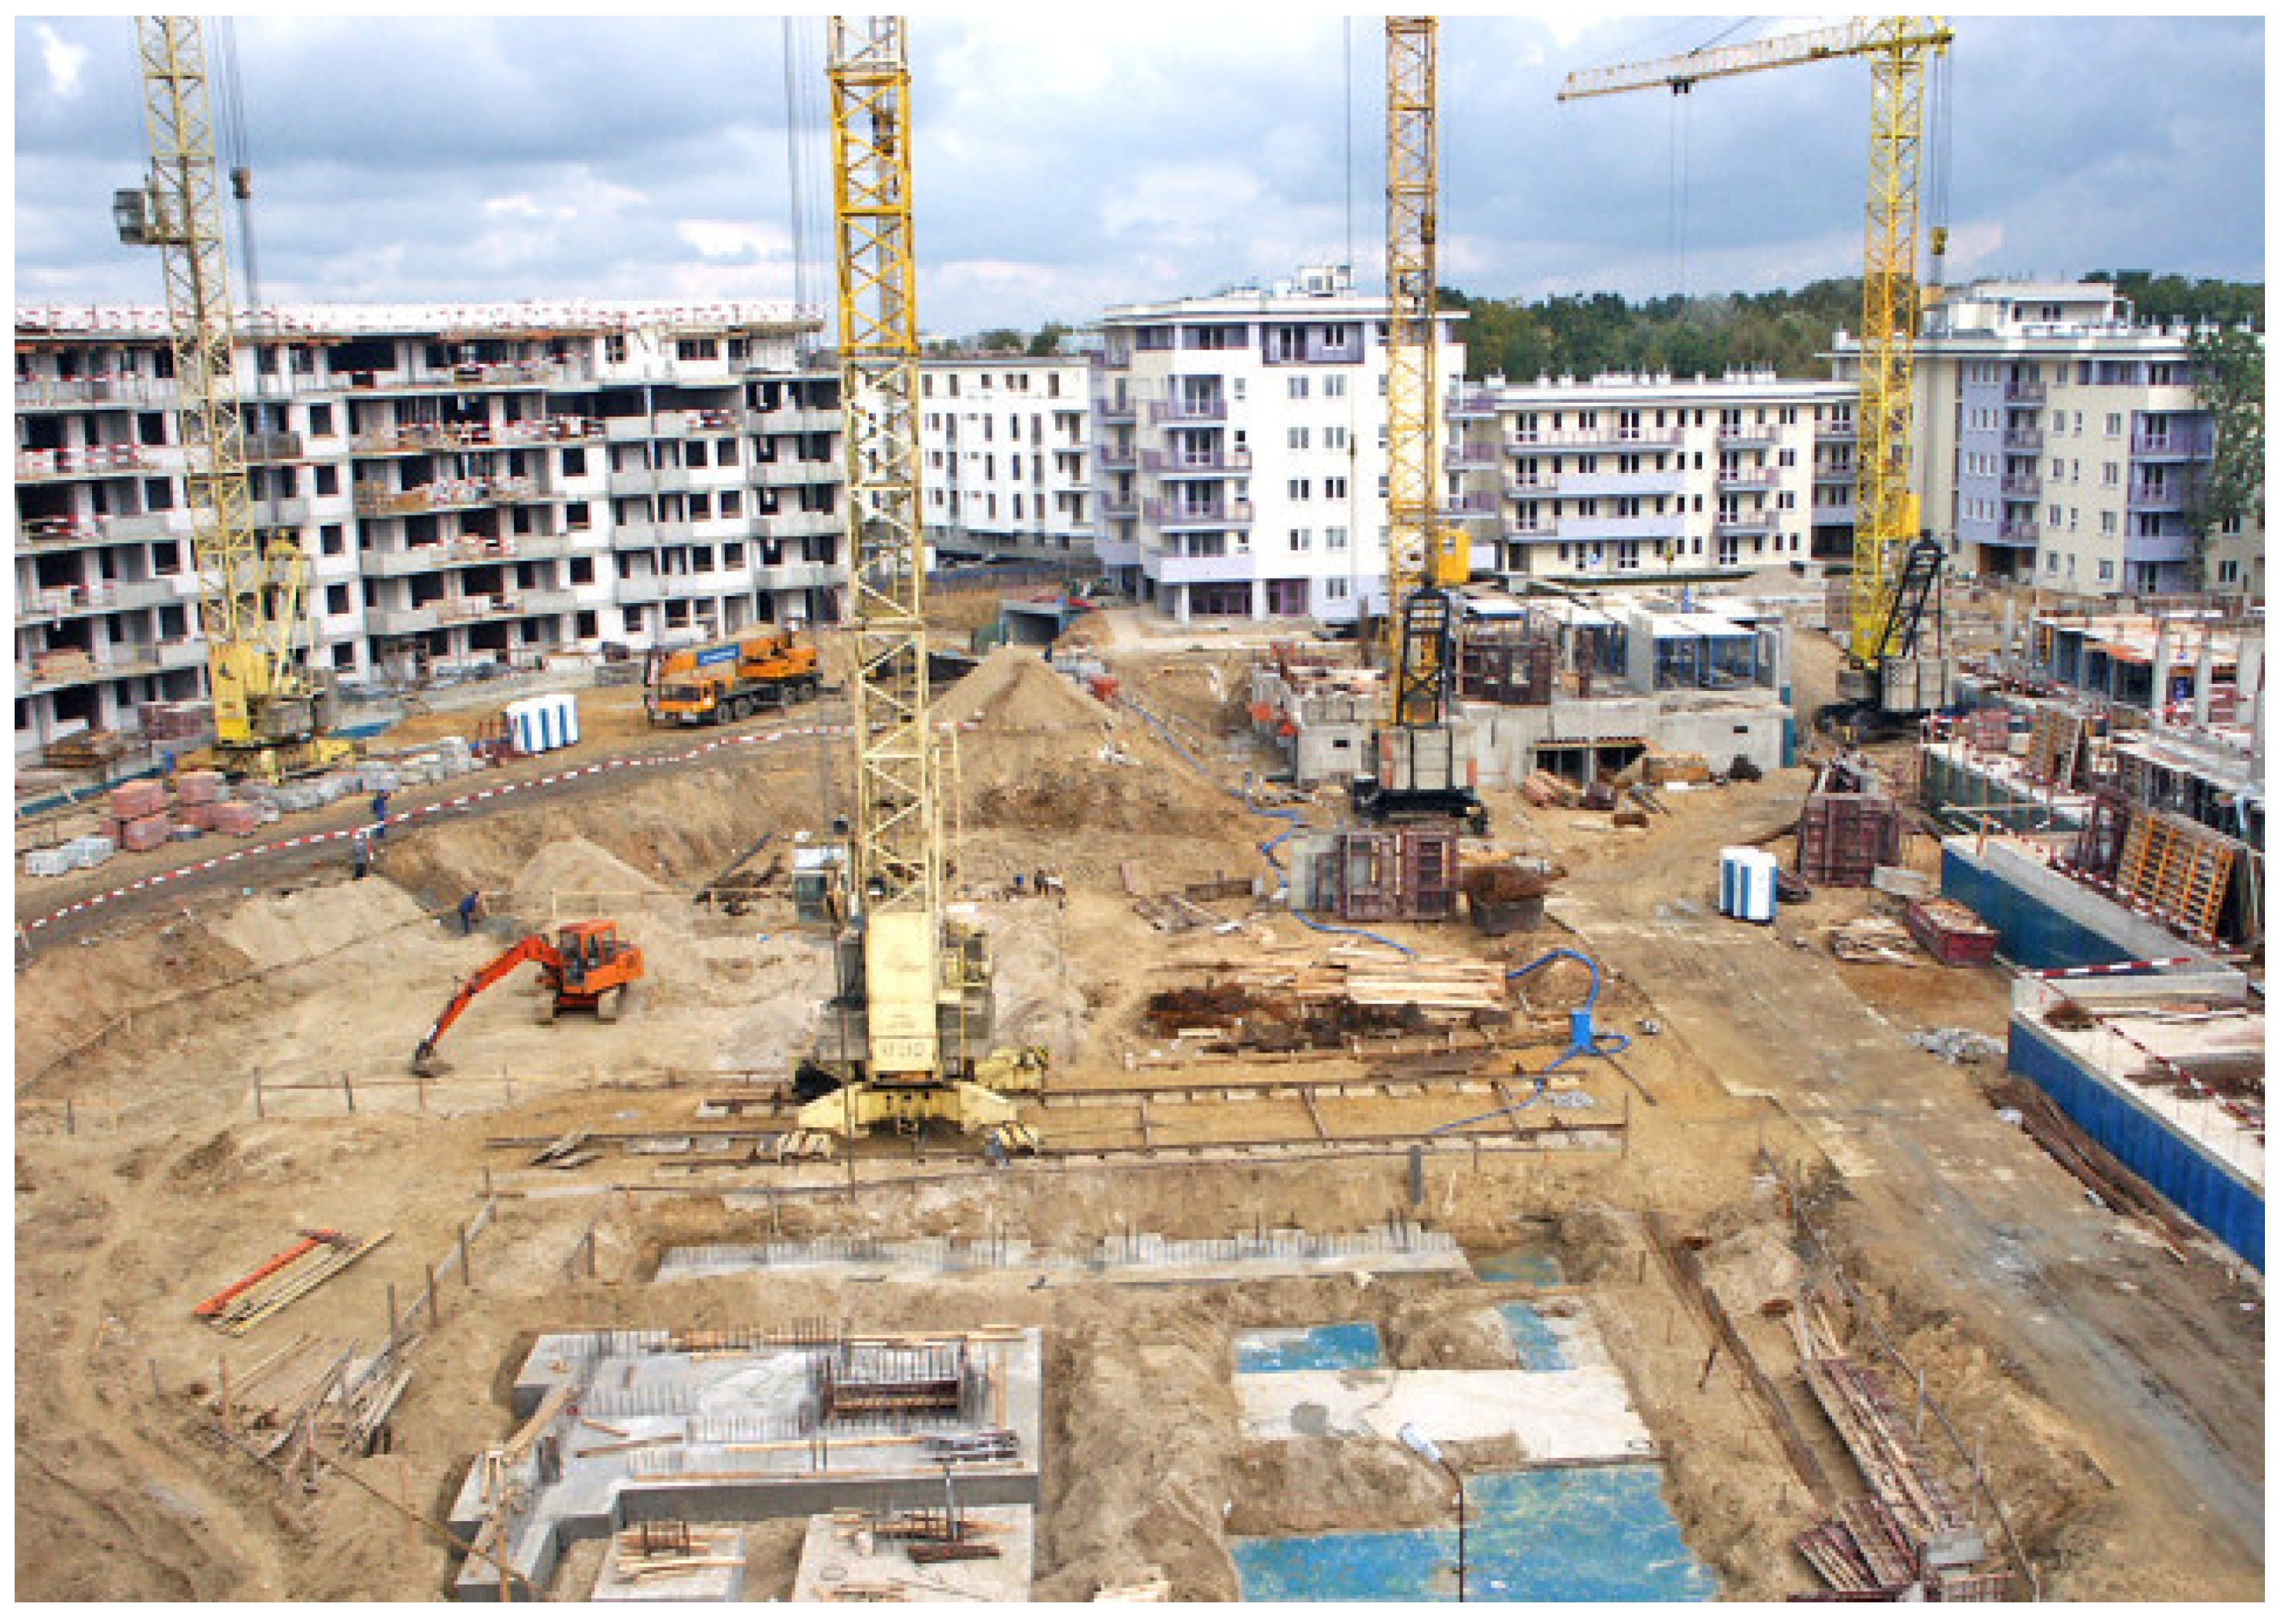
3.1. Fort Bema Housing Estate Complex (Parkowo-Leśne Housing Estate)

The project included the design and construction of a large residential complex in Warsaw-Bemowo, the modernisation of the Bemowo Sports and Recreation Centre, the relocation of the burdensome WZL-4 military production unit, the rehabilitation of 140 hectares of neglected military land acquired from the municipality and located in the immediate vicinity of Fort Bemowo, the replacement of the worn-out, highly inefficient technical infrastructure with new infrastructure with parameters that allowed the use of the site, the elimination of the particularly dangerous railway crossing at Księcia Bolesława street and the construction of a viaduct in this place, a functional connection of the residential areas of the Bemowo district with the recreational and sports area.
More precisely, the whole project was implemented in the period 1999–2012 and included eight parts, namely, the construction of (1) housing complexes at Osmańczyka Street, (2) infrastructure (networks, roads), (3) buildings of Acciona Real Estate, (4) buildings of Dom Development, (5) buildings of SBM “Idealne Mieszkanie” housing cooperative, (6) buildings of PBM Południe Development, (7) a multi-storey car park and (8) accompanying facilities (flyovers, sports facilities, communal infrastructure, etc.). Figure 1 illustrates the construction site of the Parkowo-Leśne housing estate complex (the picture of the site was taken in October of 2004).

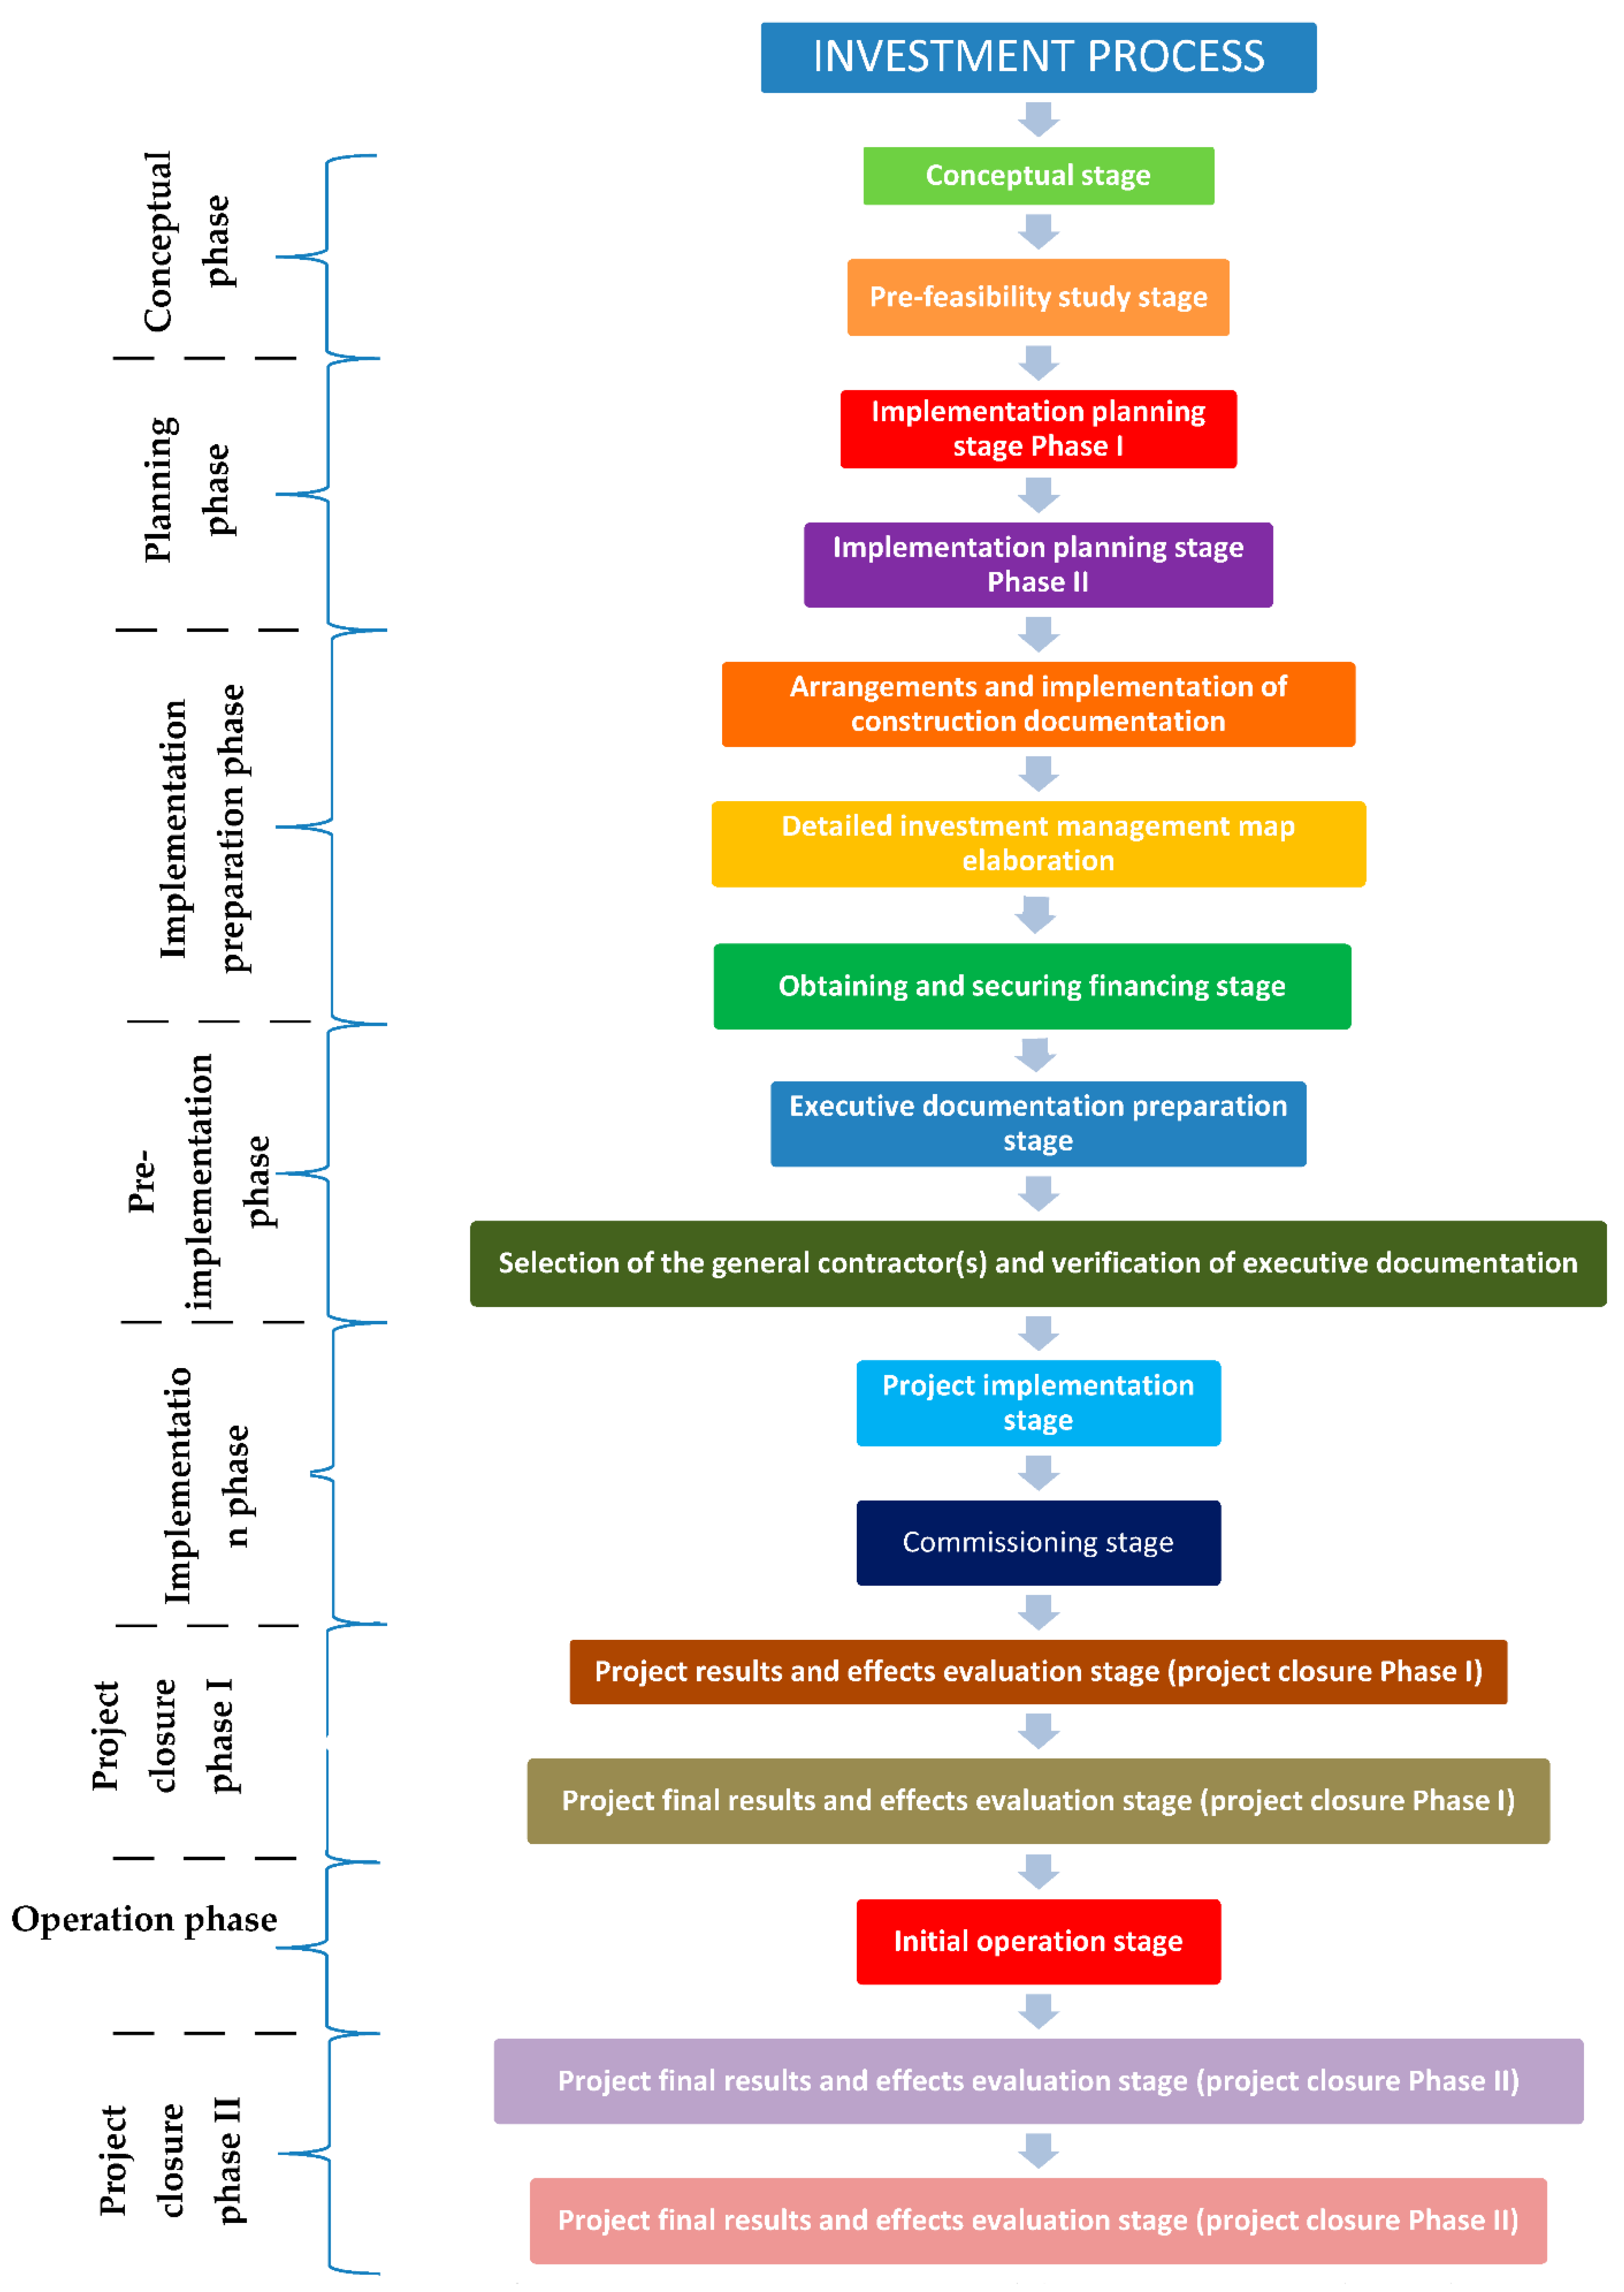
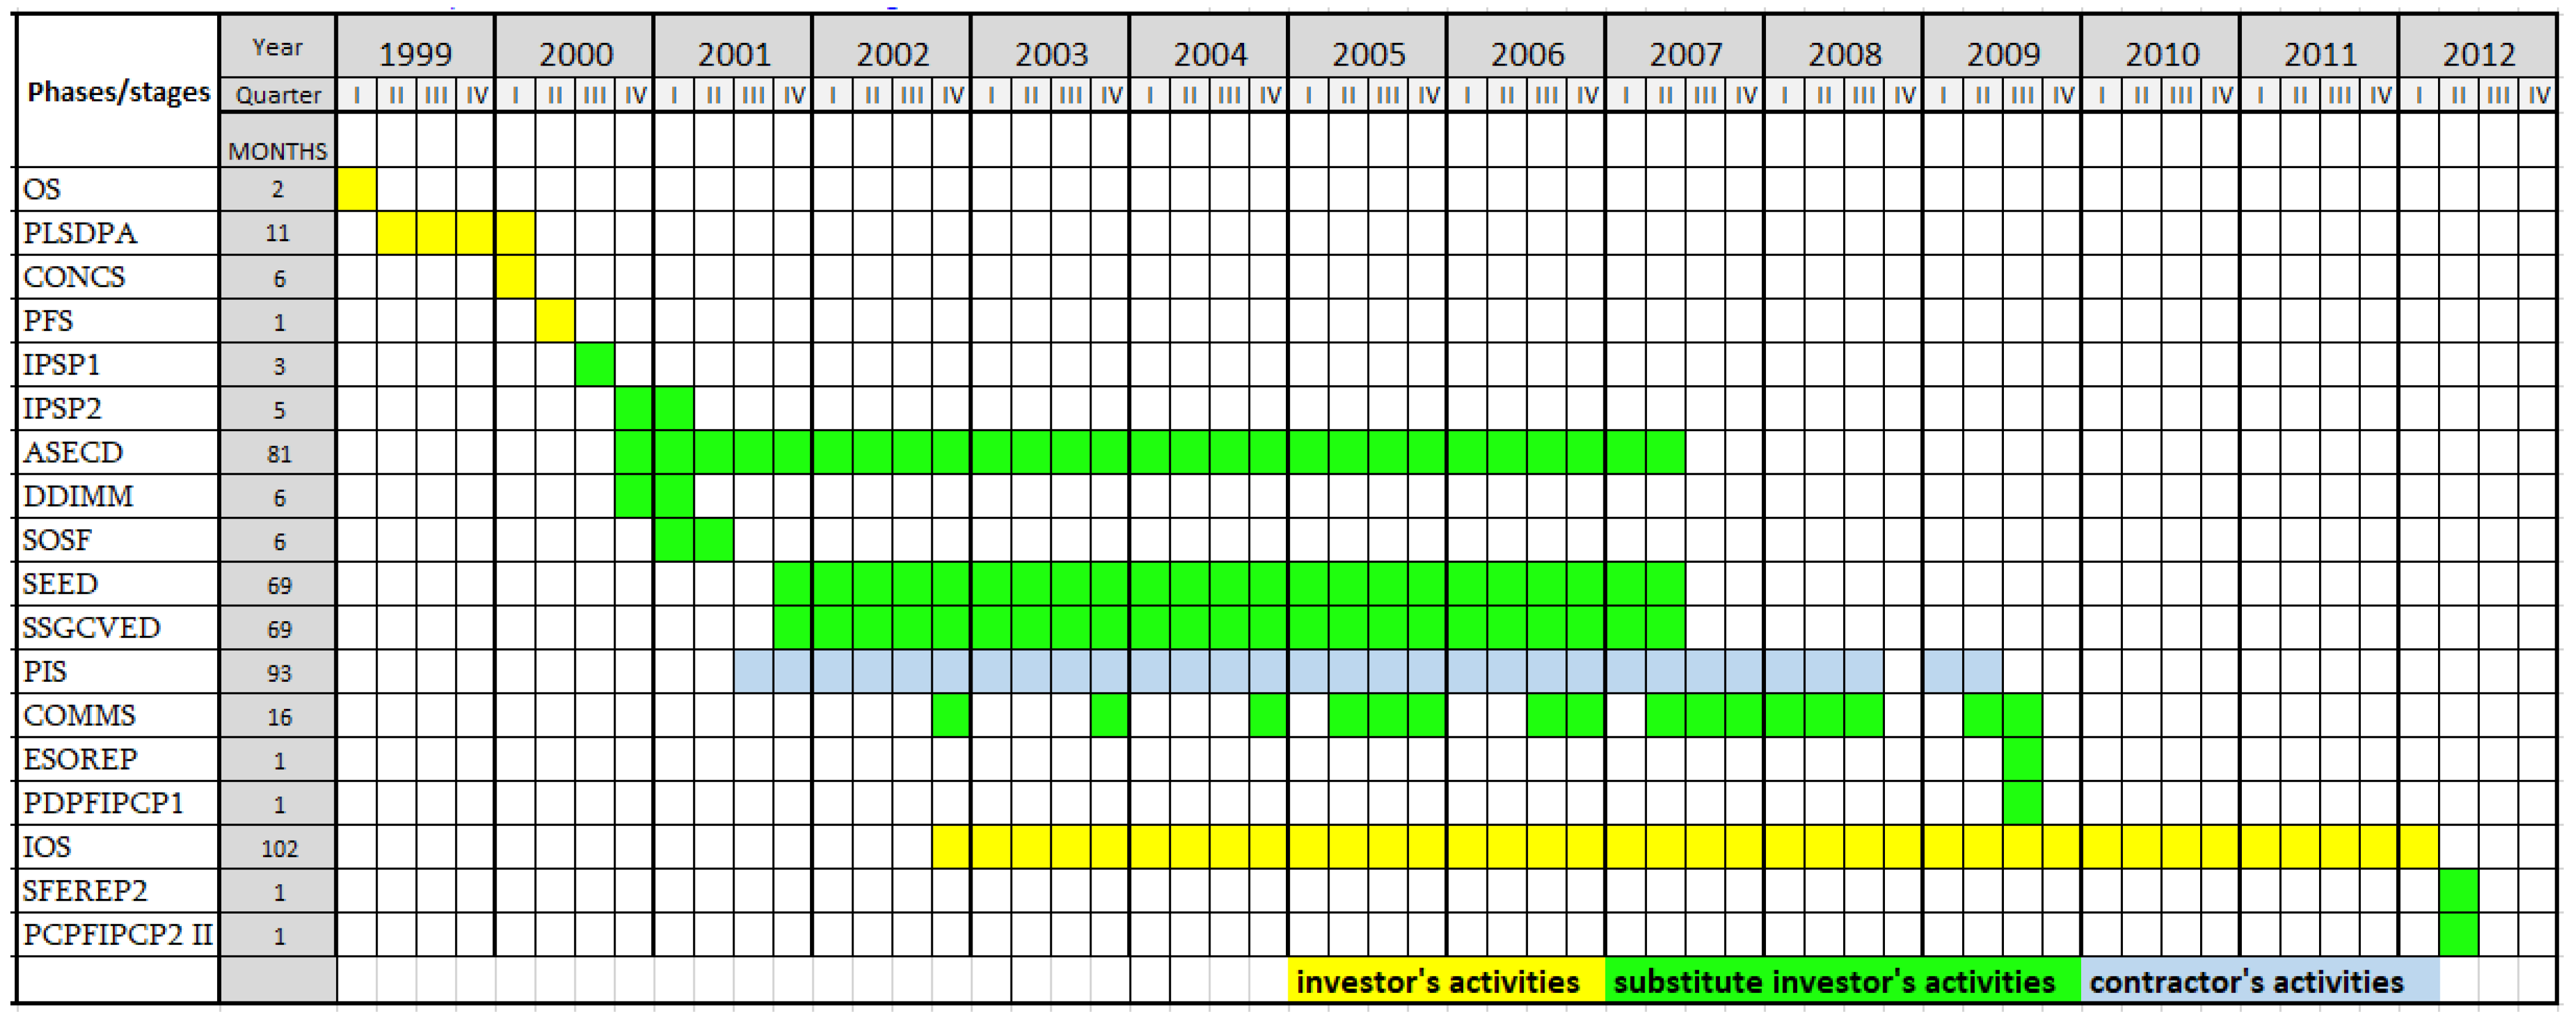
3.2. Construction Process Model and Time Schedules

The literature on the subject lacks a comprehensive investment–construction process management model encompassing many specific stages of the whole investment process, i.e., from the idea of the project itself, through its forecasting, development of a spatial development study, adoption of local spatial plans (with the participation of architects and developers) [48], planning, scheduling, execution and commissioning for operation, closing with the removal of all defects and imperfections after 3 years of exploitation and assessing as to whether the assumptions concerning the parameters of use have been achieved after this period. The lack of such a model often results in numerous implementation problems, leading to longer investment execution times and, ultimately, higher than expected construction costs (sometimes even a few times higher than anticipated).
Based on the literature on the subject, as well as by analysing a case study of the implementation of a large complex of housing estates in the Warsaw agglomeration (comprising eight smaller project parts executed in the period 1999–2012), 16 stages of the investment process have been identified. The model consists of 16 stages, grouped into eight phases of the investment process: conceptual phase (project initiation), planning phase (design), preparation phase (design), execution phase (construction), exploitation phase (operation), two project completion phases (investment efficiency evaluation)—evaluation just after project completion and second evaluation after initial operation period.
In conclusion, the paper uses a proprietary investment process model, which addresses the deficiencies of the construction process model outlined in the Literature Review section. Different stages and phases of the investment process are illustrated in Figure 2 and their detailed description is presented in Table A1 in Appendix A.
Individual stages of the entire investment process (that was used for the realisation of Fort Bema housing estate complex) and the execution times of its all stages/phases are shown in Table 2.
To better illustrate the durations of the individual construction stages in the context of a timeline, a typical Gantt chart used to reflect time schedules in various types of projects is presented below (see Figure 3).
In the following Section 3.3 we will also show how to visualise the layout of individual stages of the project, which is best illustrated by Gantt charts widely used in investment projects, and activity-on-node (AON) graphs.

3.3. Research Method

In order to explain the research method used in this paper, in addition to the investment process model described above, we need to characterise the interdependencies between individual stages/phases of the project. These will later form the basis for determining the covariance matrix. Finally, we discuss the Time-at-Risk (TaR) method and the PERT distributions used in the Monte Carlo simulation, which were employed to simulate schedule changes in the context of the most likely values.

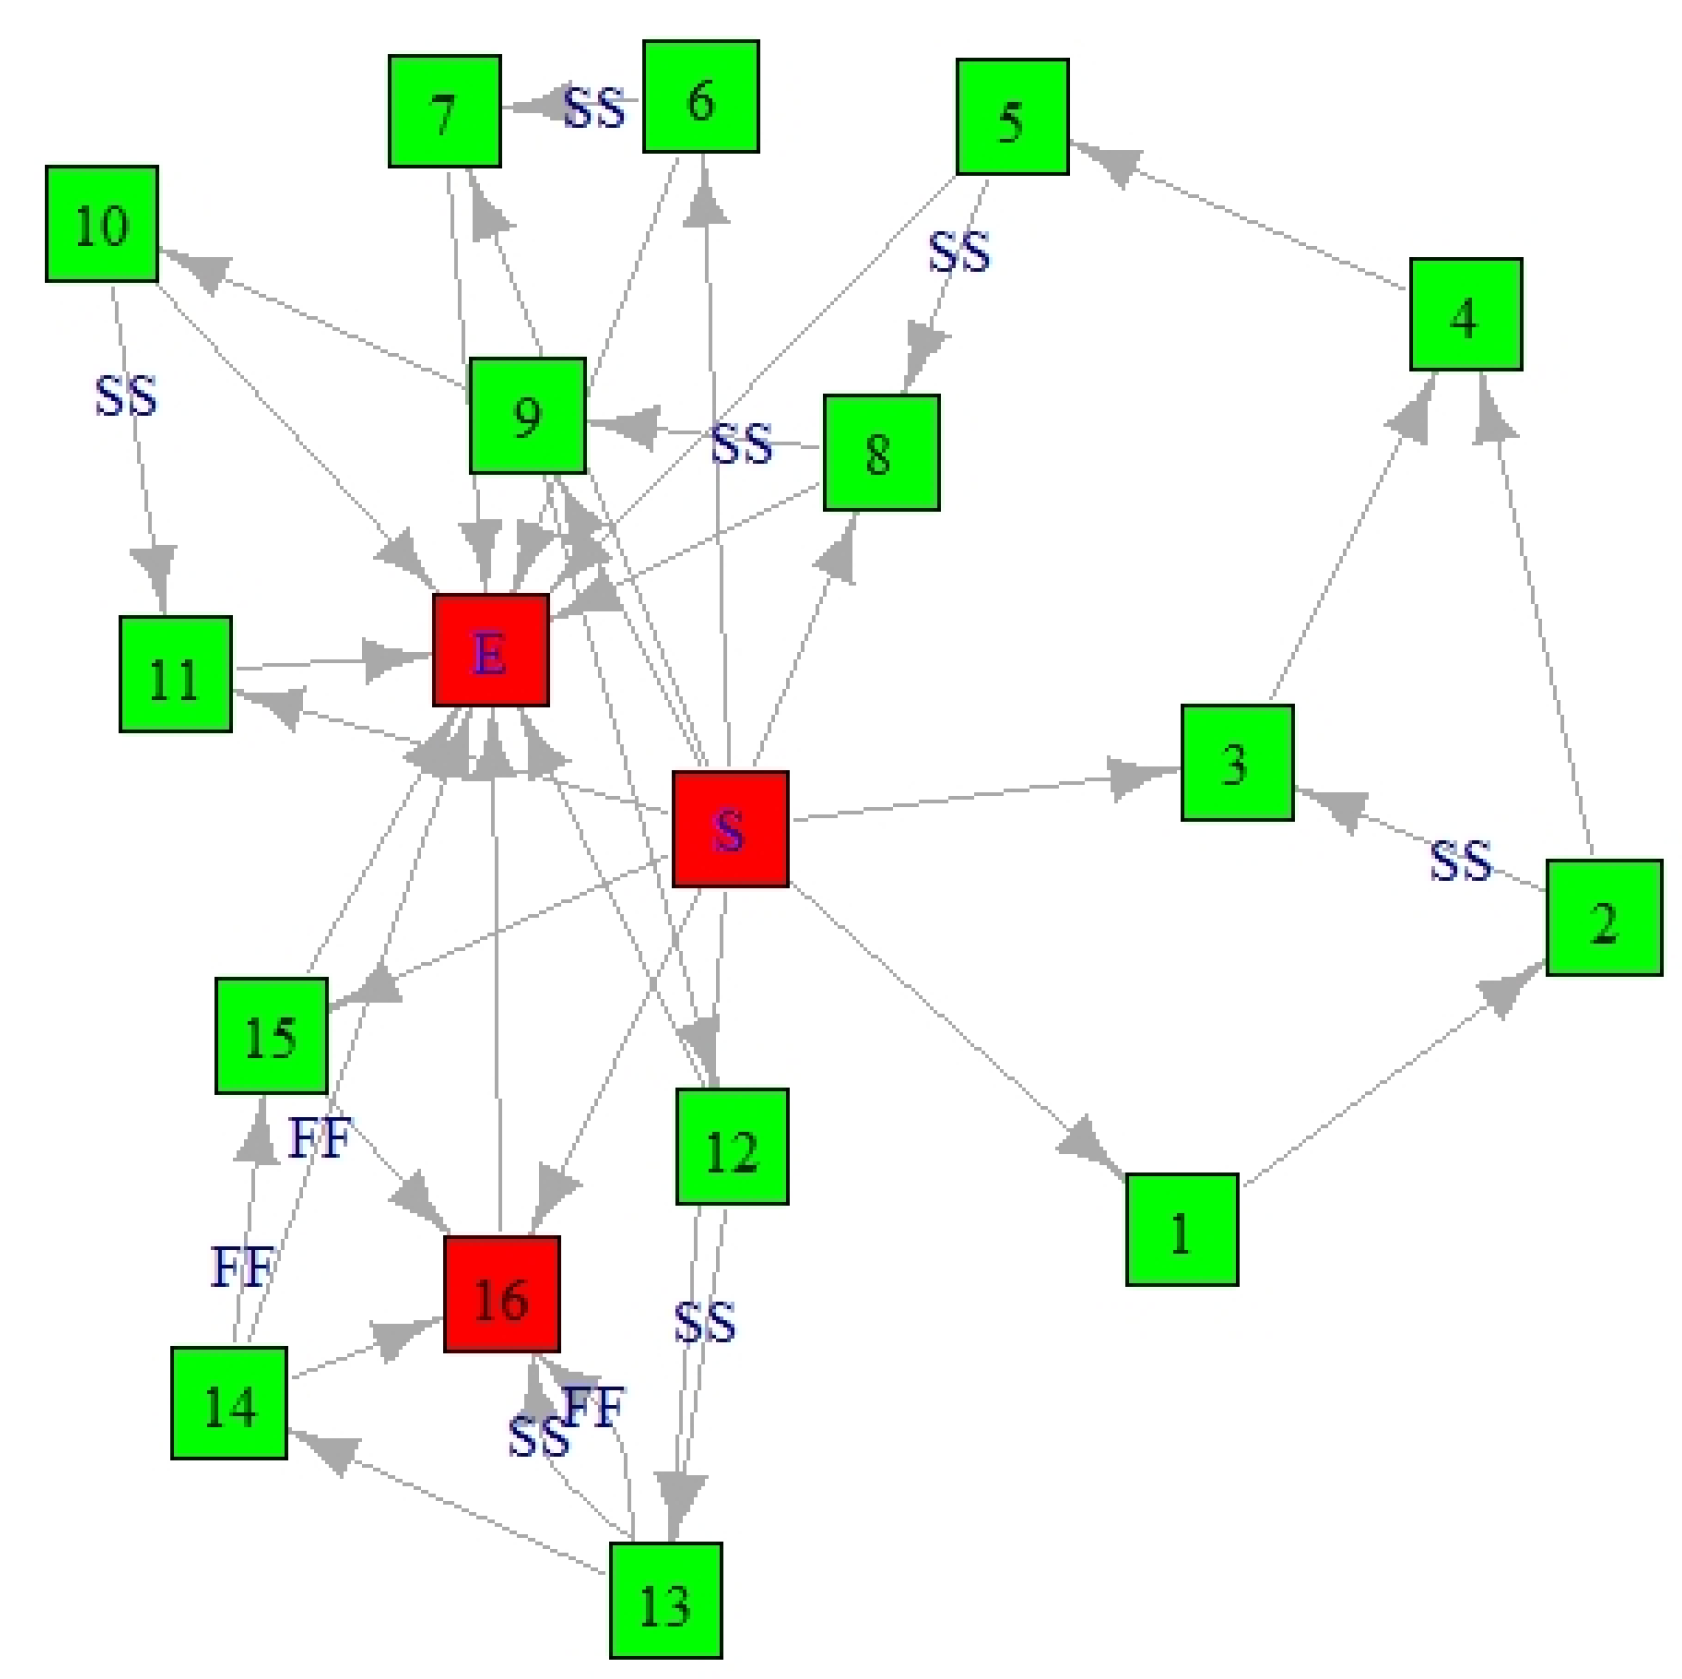
3.3.1. Relationships between Individual Stages of the Project

To better illustrate the dependencies between individual project stages, we use the method described in the paper by Gonçalves-Dosantos et al. [21]. There are four types of relationships between the activities undertaken in a project (the different stages are subject to the same principle), namely finish–start (FS), start–start (SS), finish–finish (FF), and start–finish (SF):
FS type: If an activity i N precedes FS type to j N , then j cannot start until activity i has finished.
SS type: If an activity i N precedes SS type to j N , then j cannot start until activity i has started.
FF type: Finish to finish (FF). If an activity i N precedes FF type to j N , then j cannot finish until activity i has finished.
SF type: Start to finish (SF). If an activity i N precedes SF type to j N , then j cannot finish until activity i has started.
In principle, not all types of relationships need to find their representation in every project, but usually at least the first two types of precedence (i.e., FS and SS) exist in all of them. The following is a schematic of the precedences occurring between the individual stages of Parkowo-Leśne Housing Estate Complex Project (see Table 3).
The relationships between different stages of the construction process can be better illustrated with the use of the activity-on-node (AON) graph (see Figure 4). Individual activities carried out in a project can be represented in a similar way.

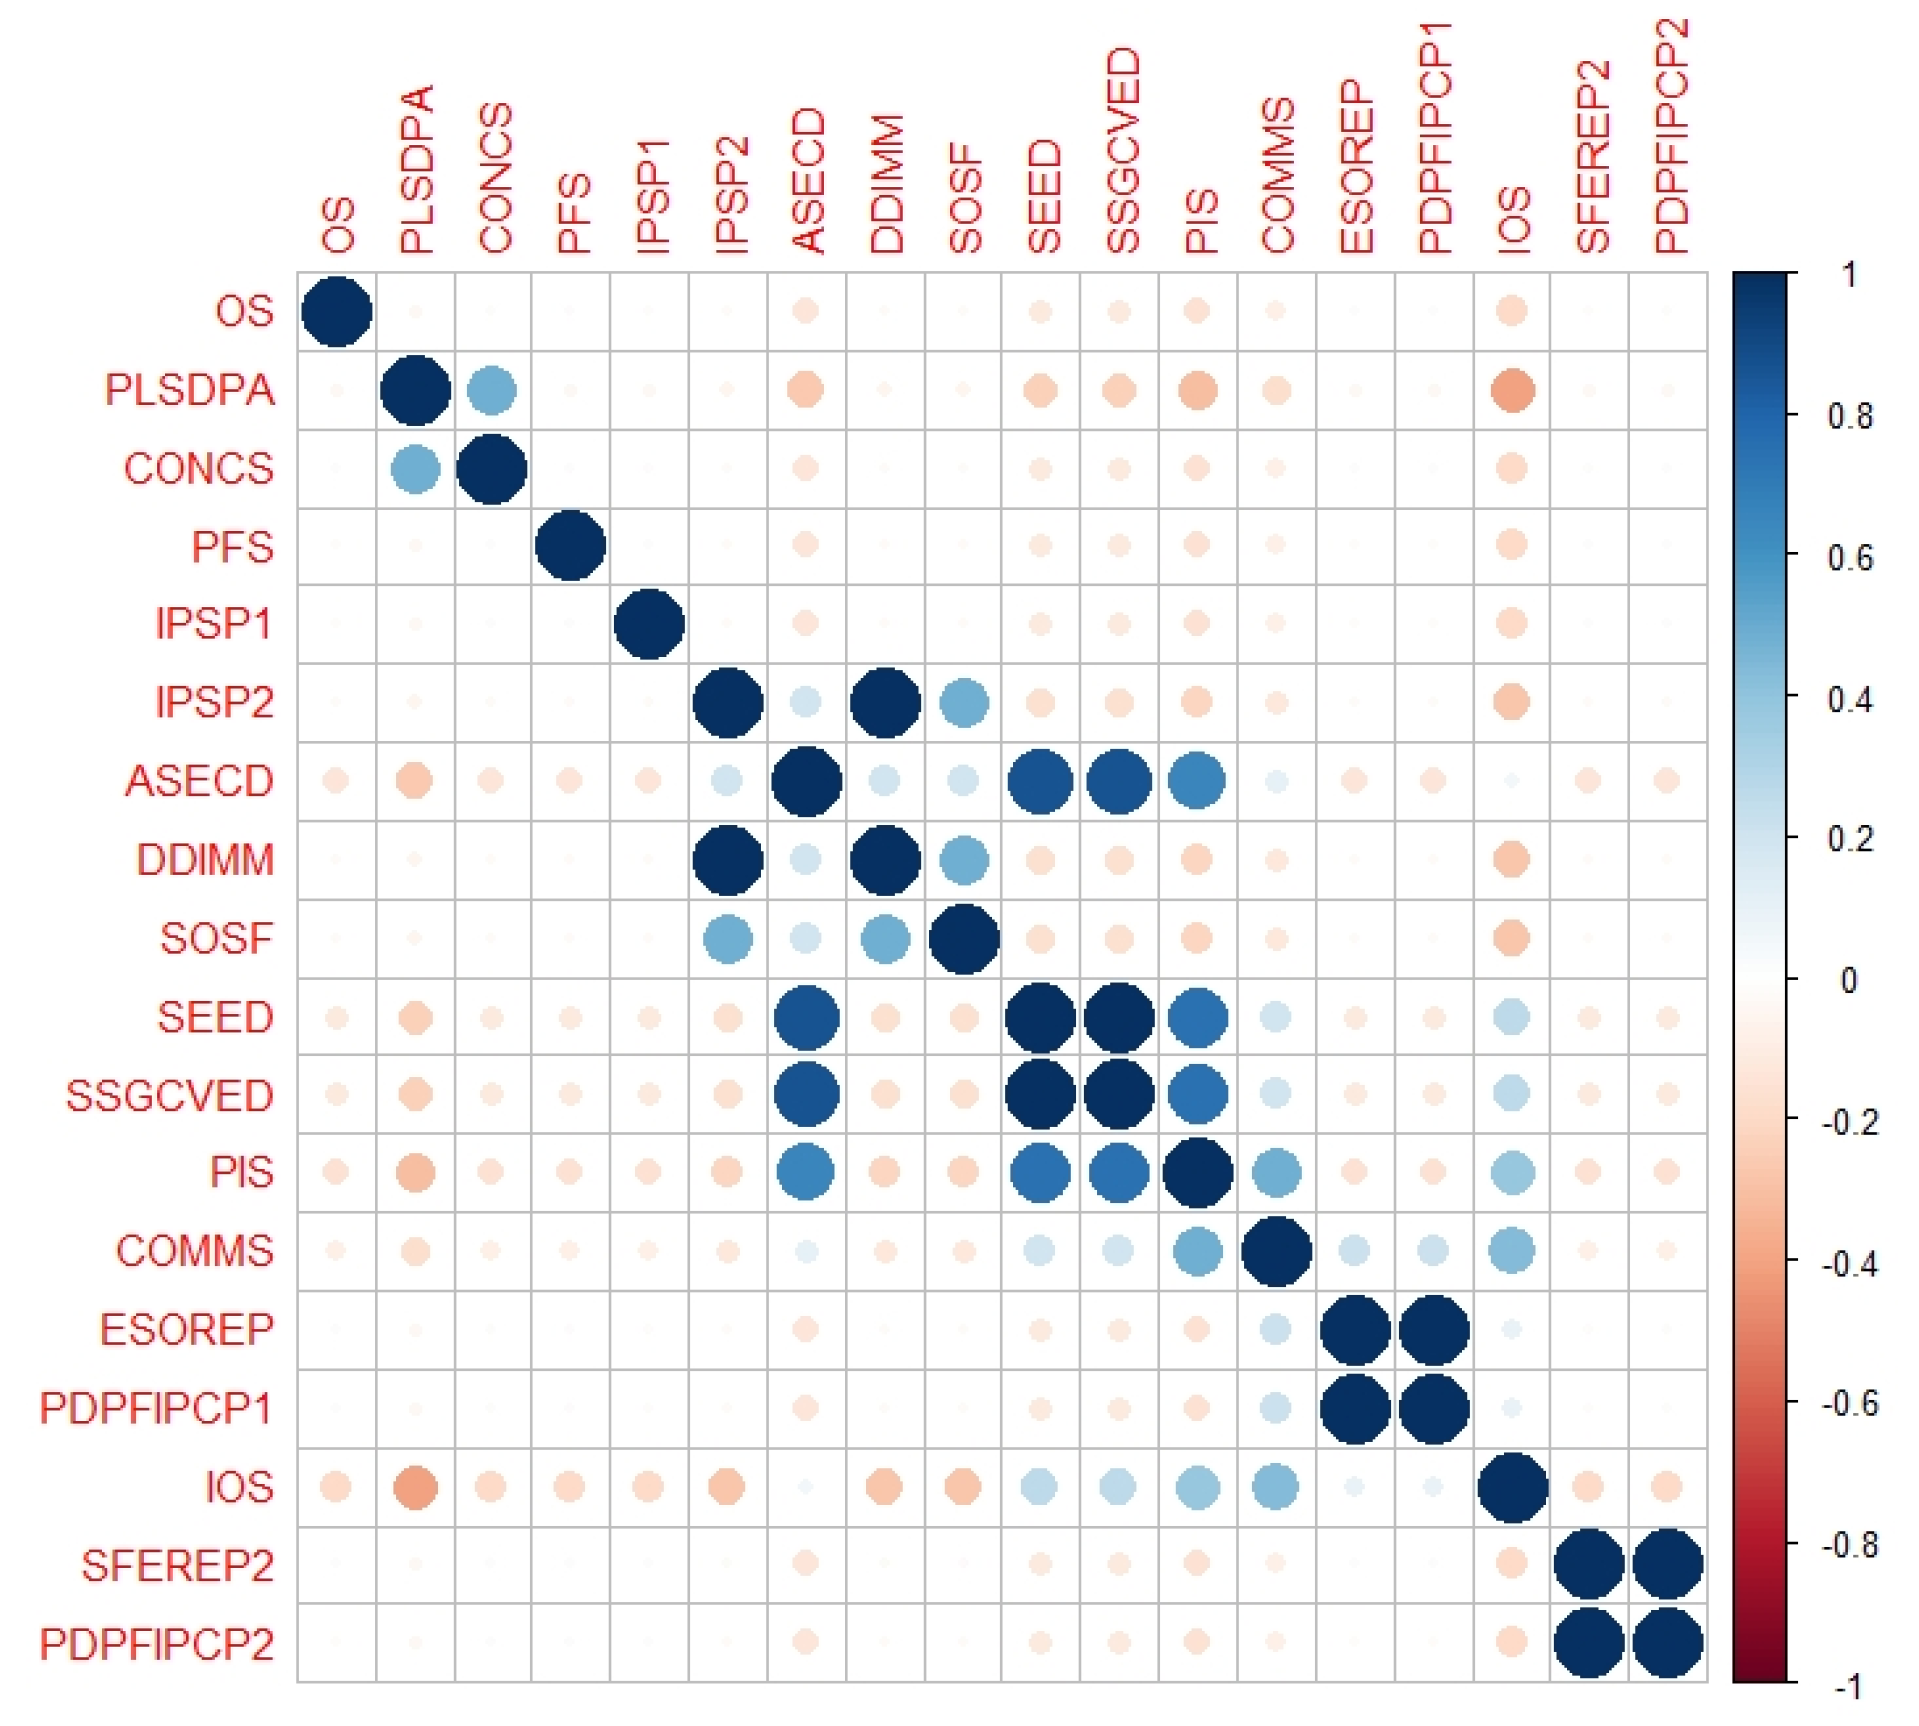
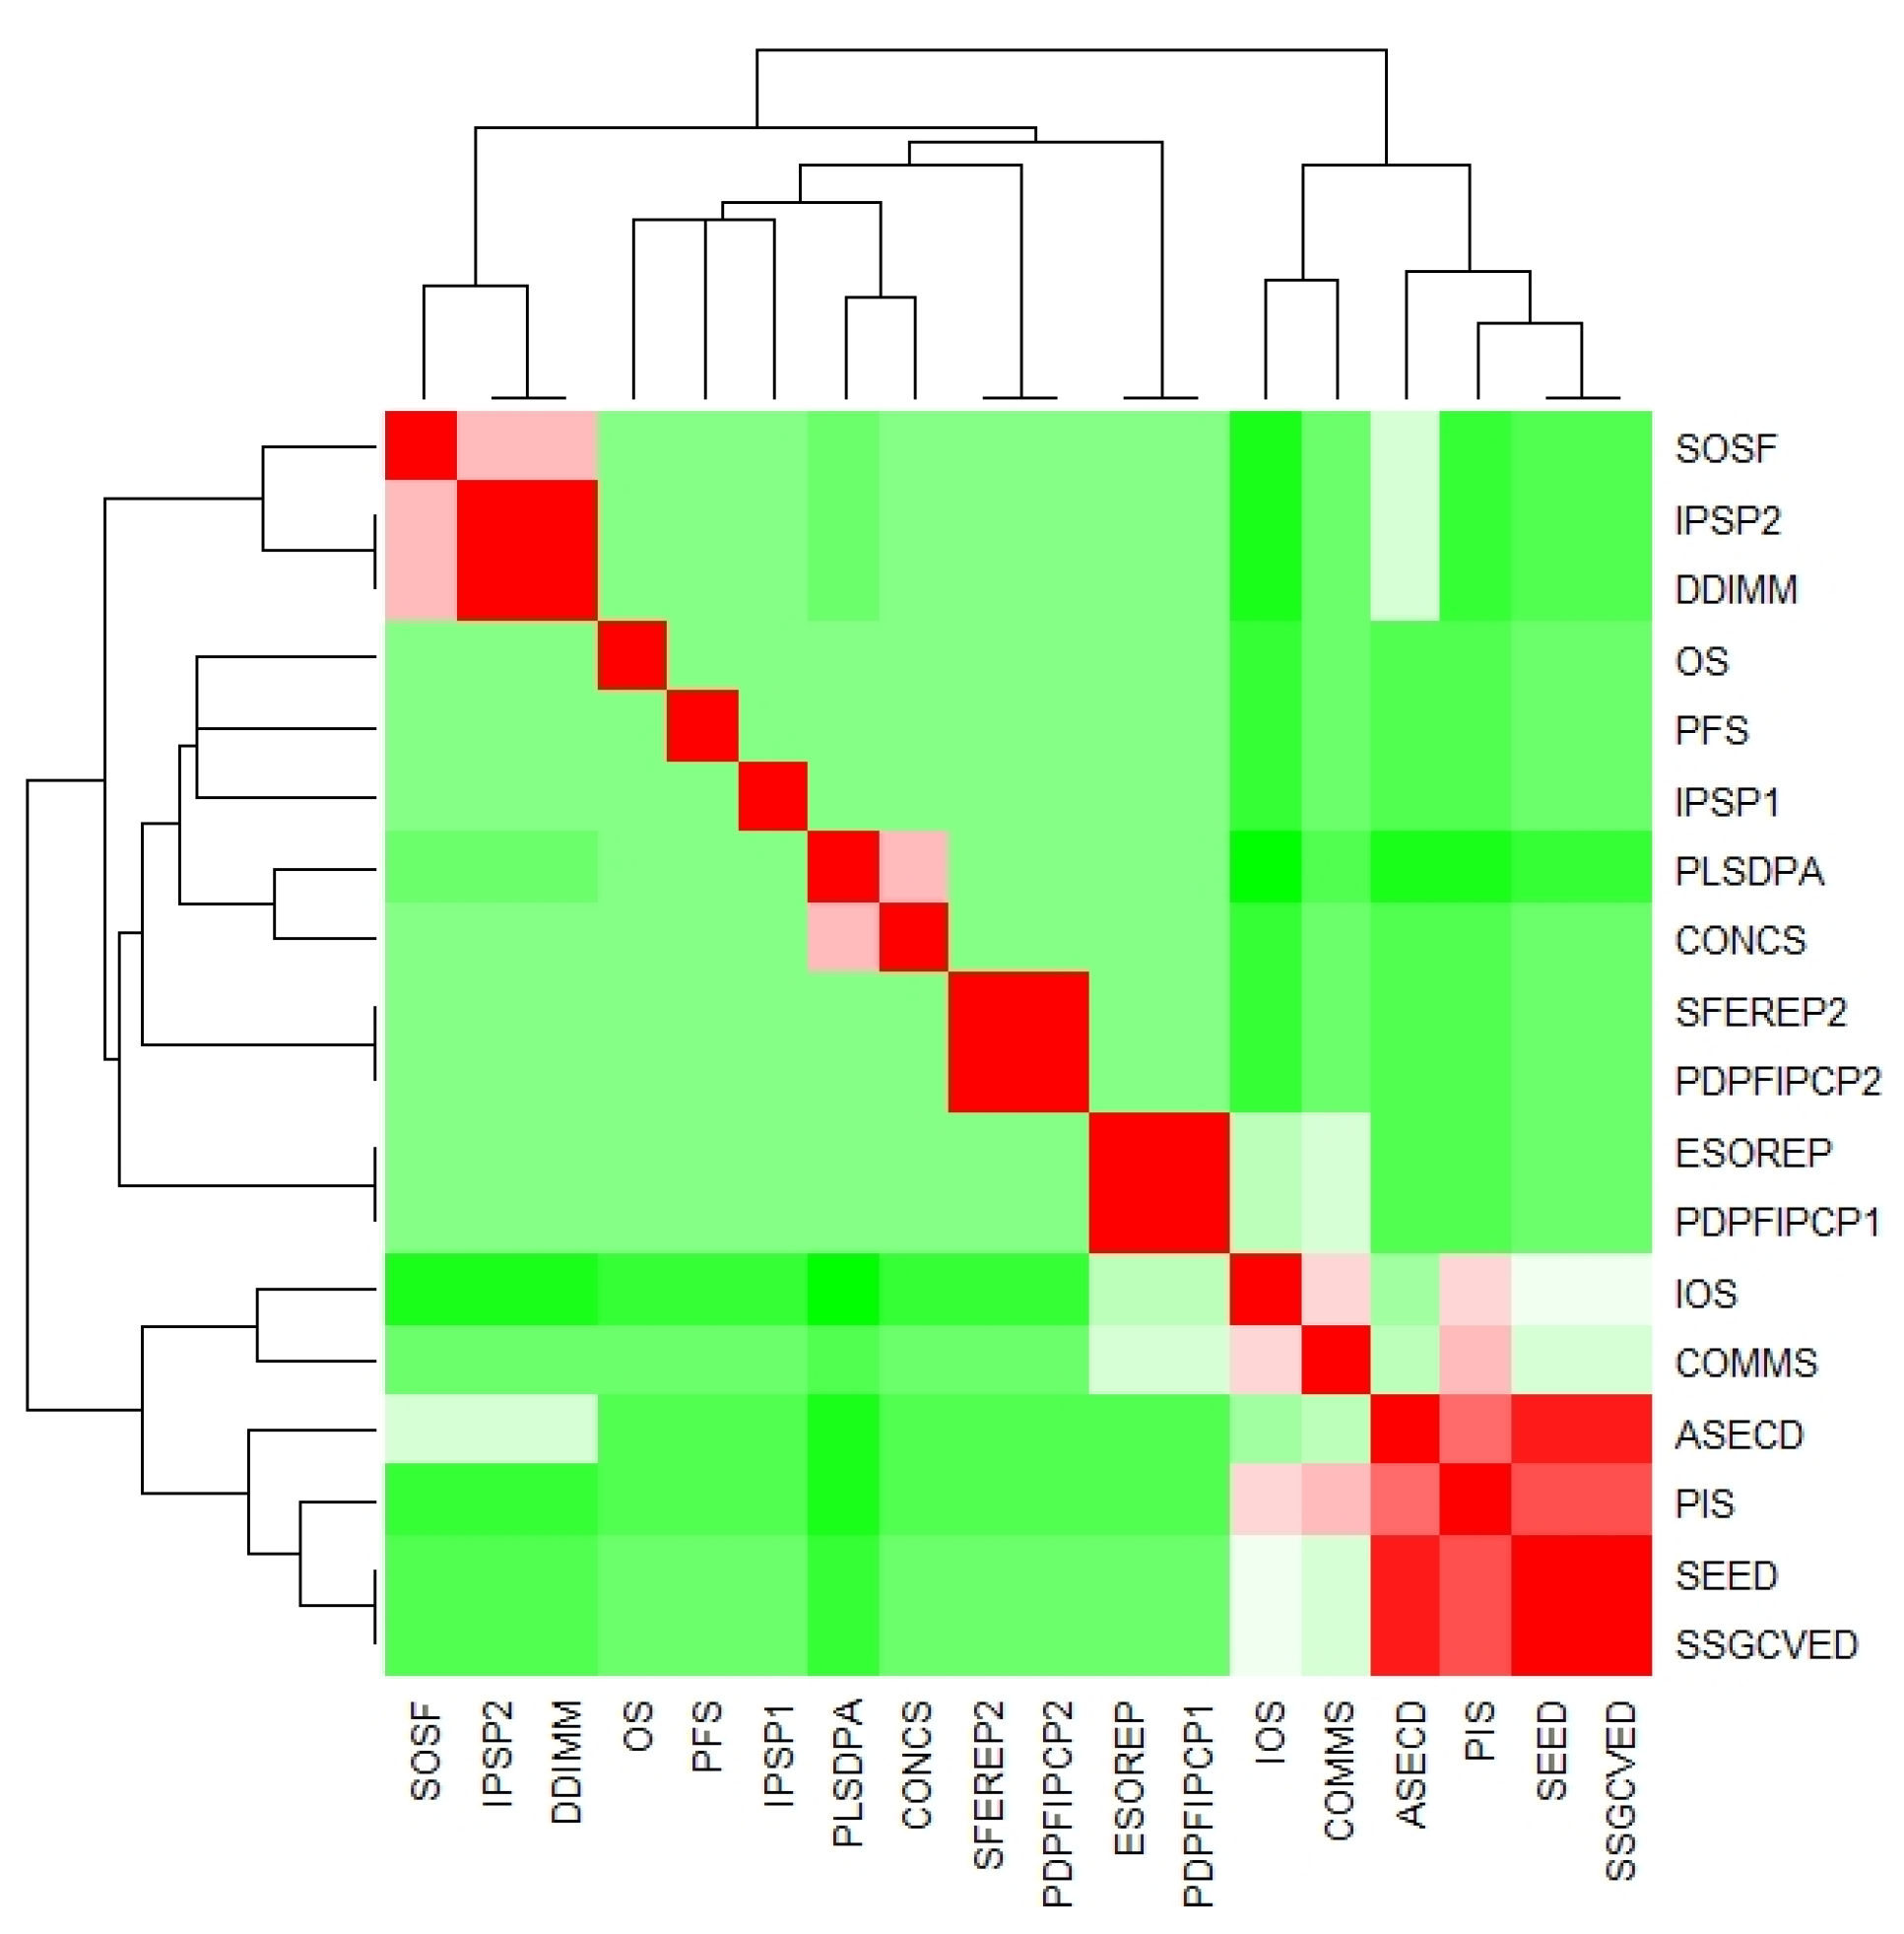
3.3.2. Correlation Matrix

The relationships between different project stages are important and should be adequately reflected in the risk analytic tools, as they affect the accuracy of duration estimates for the whole investment process. However, these correlations are rarely studied and there are theoretical and practical obstacles when modelling them. For the sake of this study, a correlation matrix was created taking into account the individual phases/stages and their expected completion times over the entire project duration (see Figure 5).
A correlation heatmap is yet another graphical representation of the correlation matrix (see Figure 6).

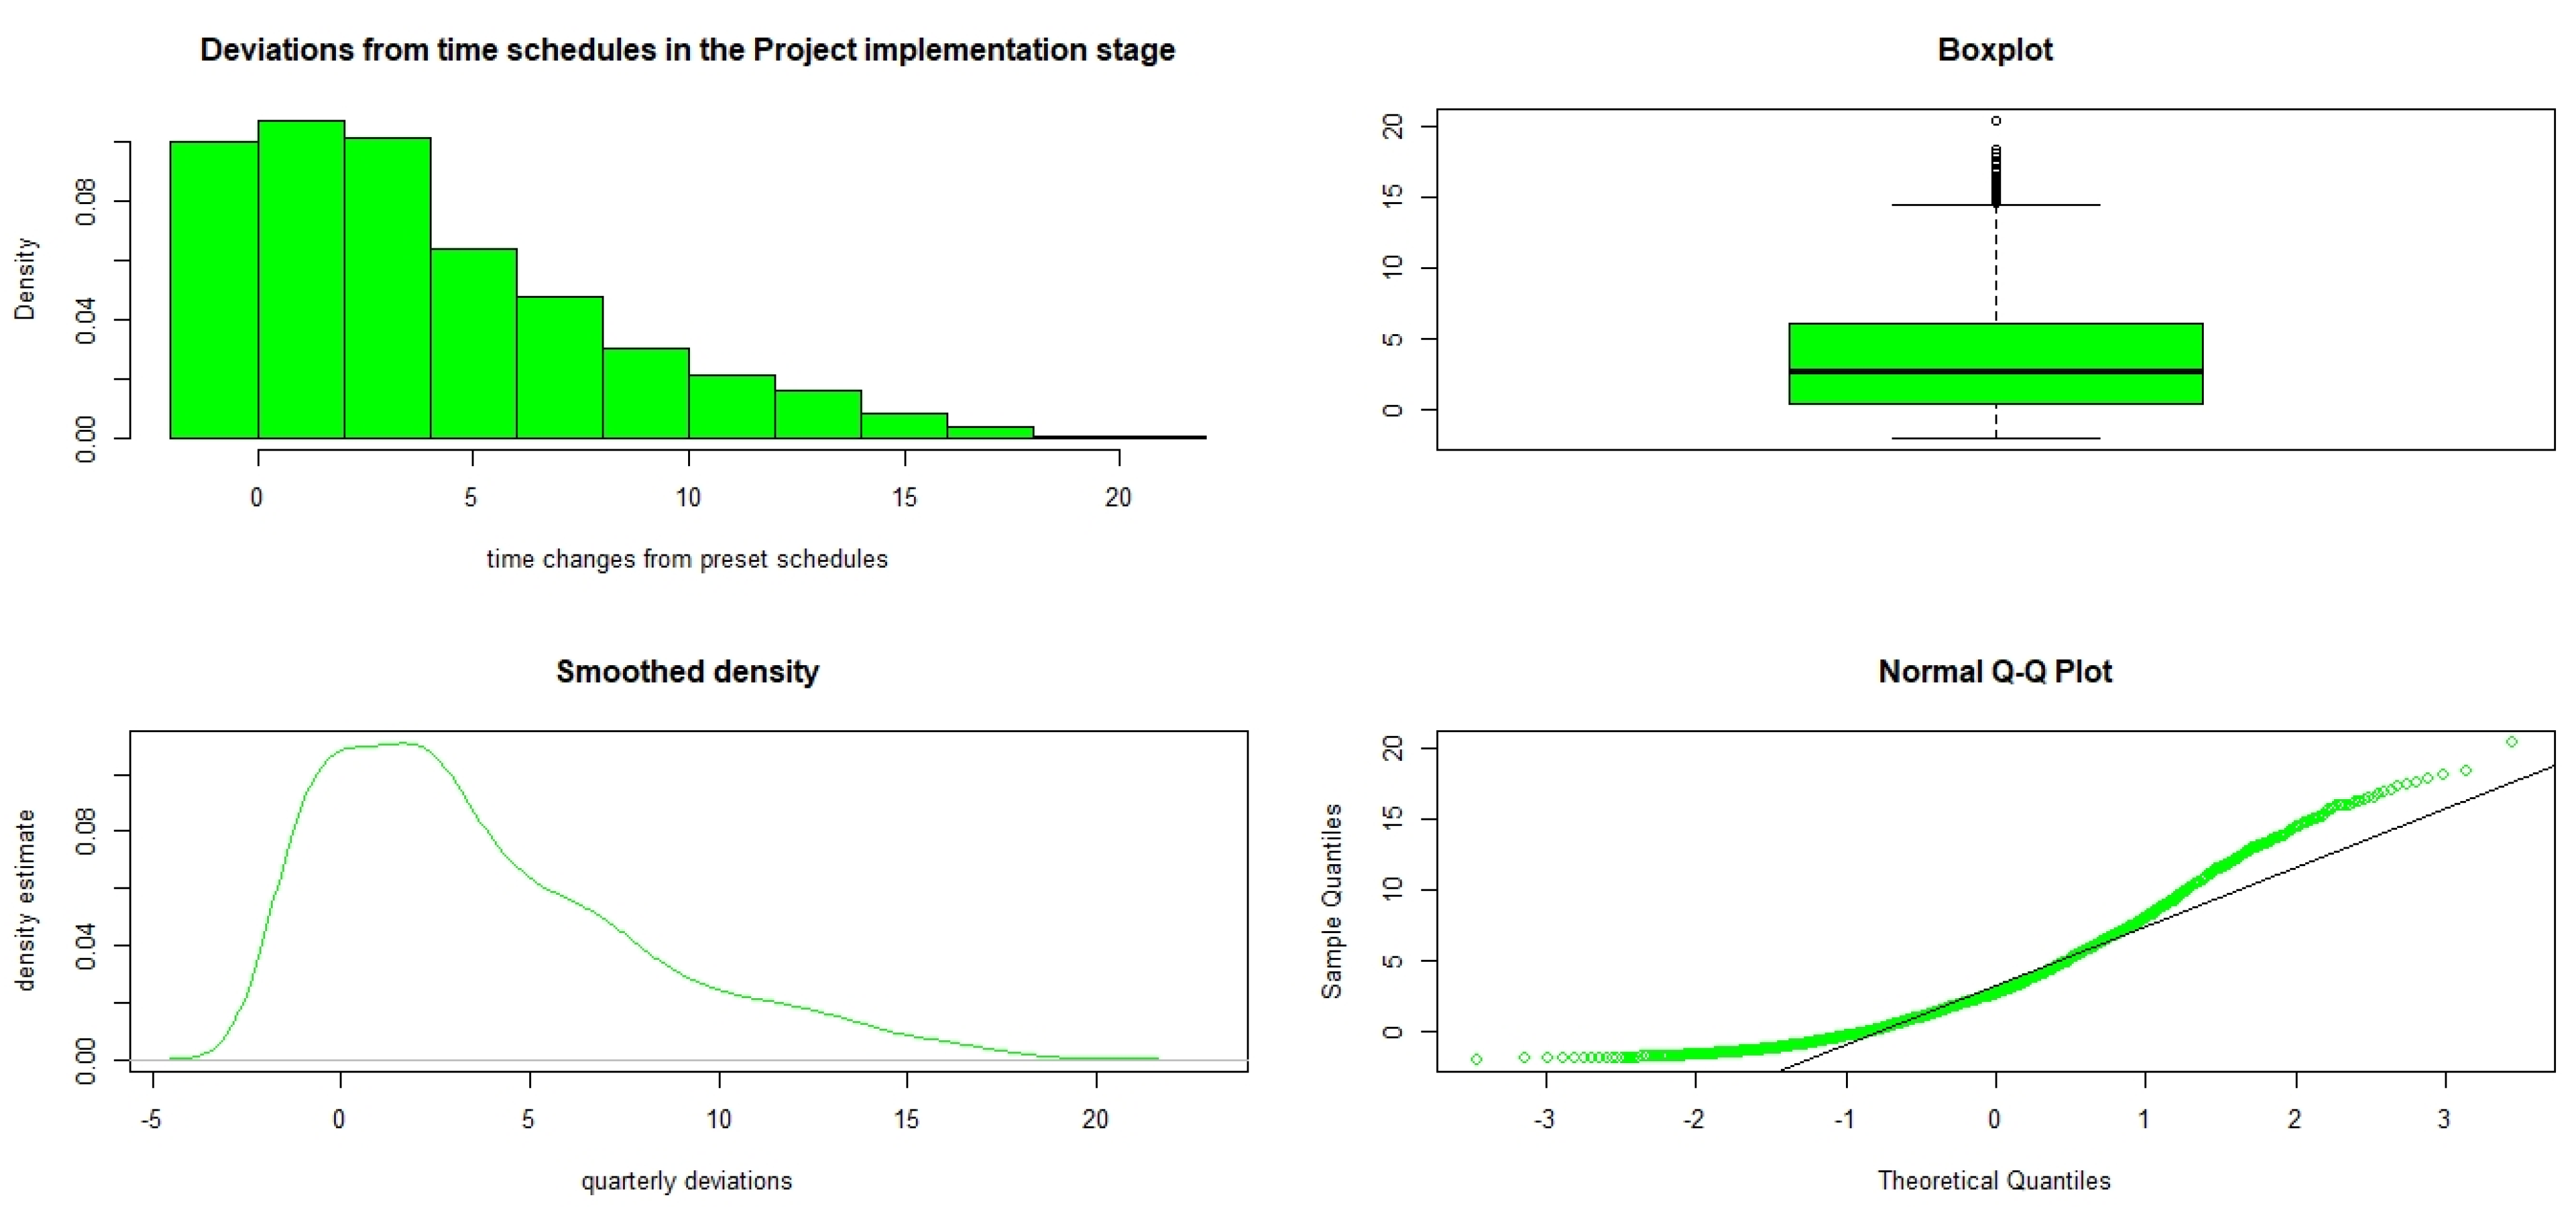
3.3.3. Time-at-Risk (TaR) and Monte Carlo Simulation

As for the Time-at-Risk, Kovalenko and Sornette [42] proposed the concept of time@risk in the context of building a particular diagnostic system that provides continuous updates of possible scenarios and their probabilistic weights reflecting the diagnosis of hazardous regimes to target different types of instabilities. Such a system, based on the time@risk approach, could be used in many areas, e.g., to signal the possible occurrence of a crisis, provide insights for the adoption of appropriate policy measures and allow the assessment of future scenarios according to the chosen policy.
The Time-at-Risk (TaR) concept proposed by Bolgorian and Raei [41] differs from the concept proposed by Kovalenko and Sornette [42]. It is a quantile-based approach that refers to the Value-at-Risk (VaR) concept known from the financial world and is based on a probability distribution function (PDF) of the return times of peaks above the threshold value.
The method on which the study is based uses a function that simulates random variables with a PERT distribution (where each project stage has an assumed duration given in the original project documentation). The appropriateness of the use of PERT distributions, which are a special case of beta distributions, has already been addressed in other studies [16,84,85]. Naturally, researchers polemicize on this issue. Some justify the superiority of Weibull distributions [67,86]. Without going into special details, we choose PERT-distributions since they are easier to implement in the R package and they give the possibility to individually define the extremes and the most likely value (i.e., mode), which has already been defined for the Fort Bema project (see Table 2 and Table 3).
PERT belongs to the group of continuous probability distributions that are characterised by its minimum (a), most likely (b) and maximum (c) values that a variable can take. PERT is derived from the transformation of a four-parameter beta distribution for which the expected value is: E [ X ] = a + 4 b + c 6 = μ . The PERT distribution has the characteristic property that its mean (of the distribution) is weighted by the (minimum and maximum) extrema values and the most likely value (mode), with the latter weighted (four times) more heavily than the former [87]. The original rationale for applying this distribution was to address the impact of the uncertainty surrounding the duration of tasks on the performance of a project schedule evaluated using the Programme Evaluation and Review Technique (PERT), one of the most popular methods for scheduling [87].
Unlike the triangular distribution, the PERT distribution uses the minimum, maximum and most likely parameters to create a smooth curve (Figure 7).
From a mathematical perspective, the standard deviation of PERT distribution is equal to about 1/6 of a range [87,88]. It is well suited for any risk assessment that seeks to address (reflect) uncertainties in the value of some measure, specifically when one relies on some subjective estimates to quantify such a measure. In this regard, the minimum, maximum and most likely (mode) values are somehow intuitive, and they enable definition of the distribution at the researcher’s discretion. To simulate the PERT distributions in the study, we use R packages (such distributional and ggdist) [89], and the simulation itself is performed with the rpert function.
The PERT distribution is also often compared with the triangular distribution (since it relies on the same parameters), but in contrast to the latter, the former is characterised by a smoother curve shape. In the case of a triangular distribution, the most likely value is not weighted in any particular way. Hence its mean μ can be expressed as: μ = a + b + c 3 .
The triangular distribution features with an angular shape, while the PERT distribution with a smoother shape (the difference is characteristic for subjective knowledge-type distributions). However, if the PERT distribution is strongly skewed, the extreme values may be underestimated [90]. One solution for controlling the risk specifically for construction schedules can be obtained with the use a modified PERT distribution [91], whereby the there is more control over tail values. Such a modified PERT distribution has an additional parameter by which the weight of the most likely value can be arbitrarily determined (the mean of this distribution can be expressed as: μ = a + γ b + c γ + 2 ).
As for the Monte Carlo simulation method, there are numerous studies based on this approach. Barraza [92], for example, used Monte Carlo simulation to estimate the time unpredictability of project activities. Tokdemir et al. [23] proposed a method to assess the risk of delay in projects planned according to the line-of-balance method (LOB) and used Monte Carlo simulation to quantify the risk. Kirytopoulos et al. [93] investigated the importance of using historical information and the correct choice of distribution when estimating activity duration for the Monte Carlo simulation process. Vanhoucke [94] used Monte Carlo simulation and empirical project data from schedule risk analysis and earned value management process and proposed measures of project control efficiency. Additionally, Kong et al. [16] show explicitly the benefits of using Monte Carlo simulation to assess risk in practical scheduling. These are just a few examples, of which there are many more. A very thorough overview of many construction-related studies based on Monte Carlo simulations can be found in the paper by Koulinas et al. [95].
The method that we use yielded the deviations from the expected (most likely) completion times for each stage of the construction process. For this purpose, the Monte Carlo method was used (with 10,000 repetitions). In the next step, a covariance matrix was obtained taking into account the dependencies between schedules of individual project stages. Subsequently, the TaR of the entire project was calculated, i.e., for the entire “portfolio of stages”, assuming that the weights of all project phases add up to 100%. The weights were calculated based on the durations and investment levels of each stage of the entire project.
Given a confidence level of p ( 0 , 1 ) and assuming that the number of random samples s (of deviations from the estimated schedules) with α equal to a certain quantile of the distribution, we would like to determine the change in Δ T ( α ) over time for the whole project (schedules).
Let G α ( x ) be the cumulative distribution function ( CDF ) of Δ T ( α ) . Since the time change is Δ T ( α ) 0 , then we can define the TaR as a quantile of the CDF for a given p as p = [ Δ T ( α ) TaR ] = G α ( TaR ) .
Assuming that the project developer expects to complete all project phases in a period shorter than TaR, with a given α and probability p, which means that time, T, changes Δ T ( α ) 0 , the probability p with respect to TaR can be expressed as follows:
p = [ Δ T ( α ) TaR ] = 1 [ Δ T ( α ) TaR ] = 1 G α ( TaR )
Consequently the p q u a n t i l e of G α ( x ) for the CDF of G α ( x ) and a given confidence level of p ( 0 , 1 ) is TaR p = x p = i n f { x | G a ( x ) p } , where inf denotes the lowest real number. Therefore, the tail behaviour of the CDF of G α or its quantile is a condition necessary for approaching TaR calculation.
In summary, the combined Monte Carlo simulation and TaR calculation is based on certain assumptions, some of which may change depending on project expectations:
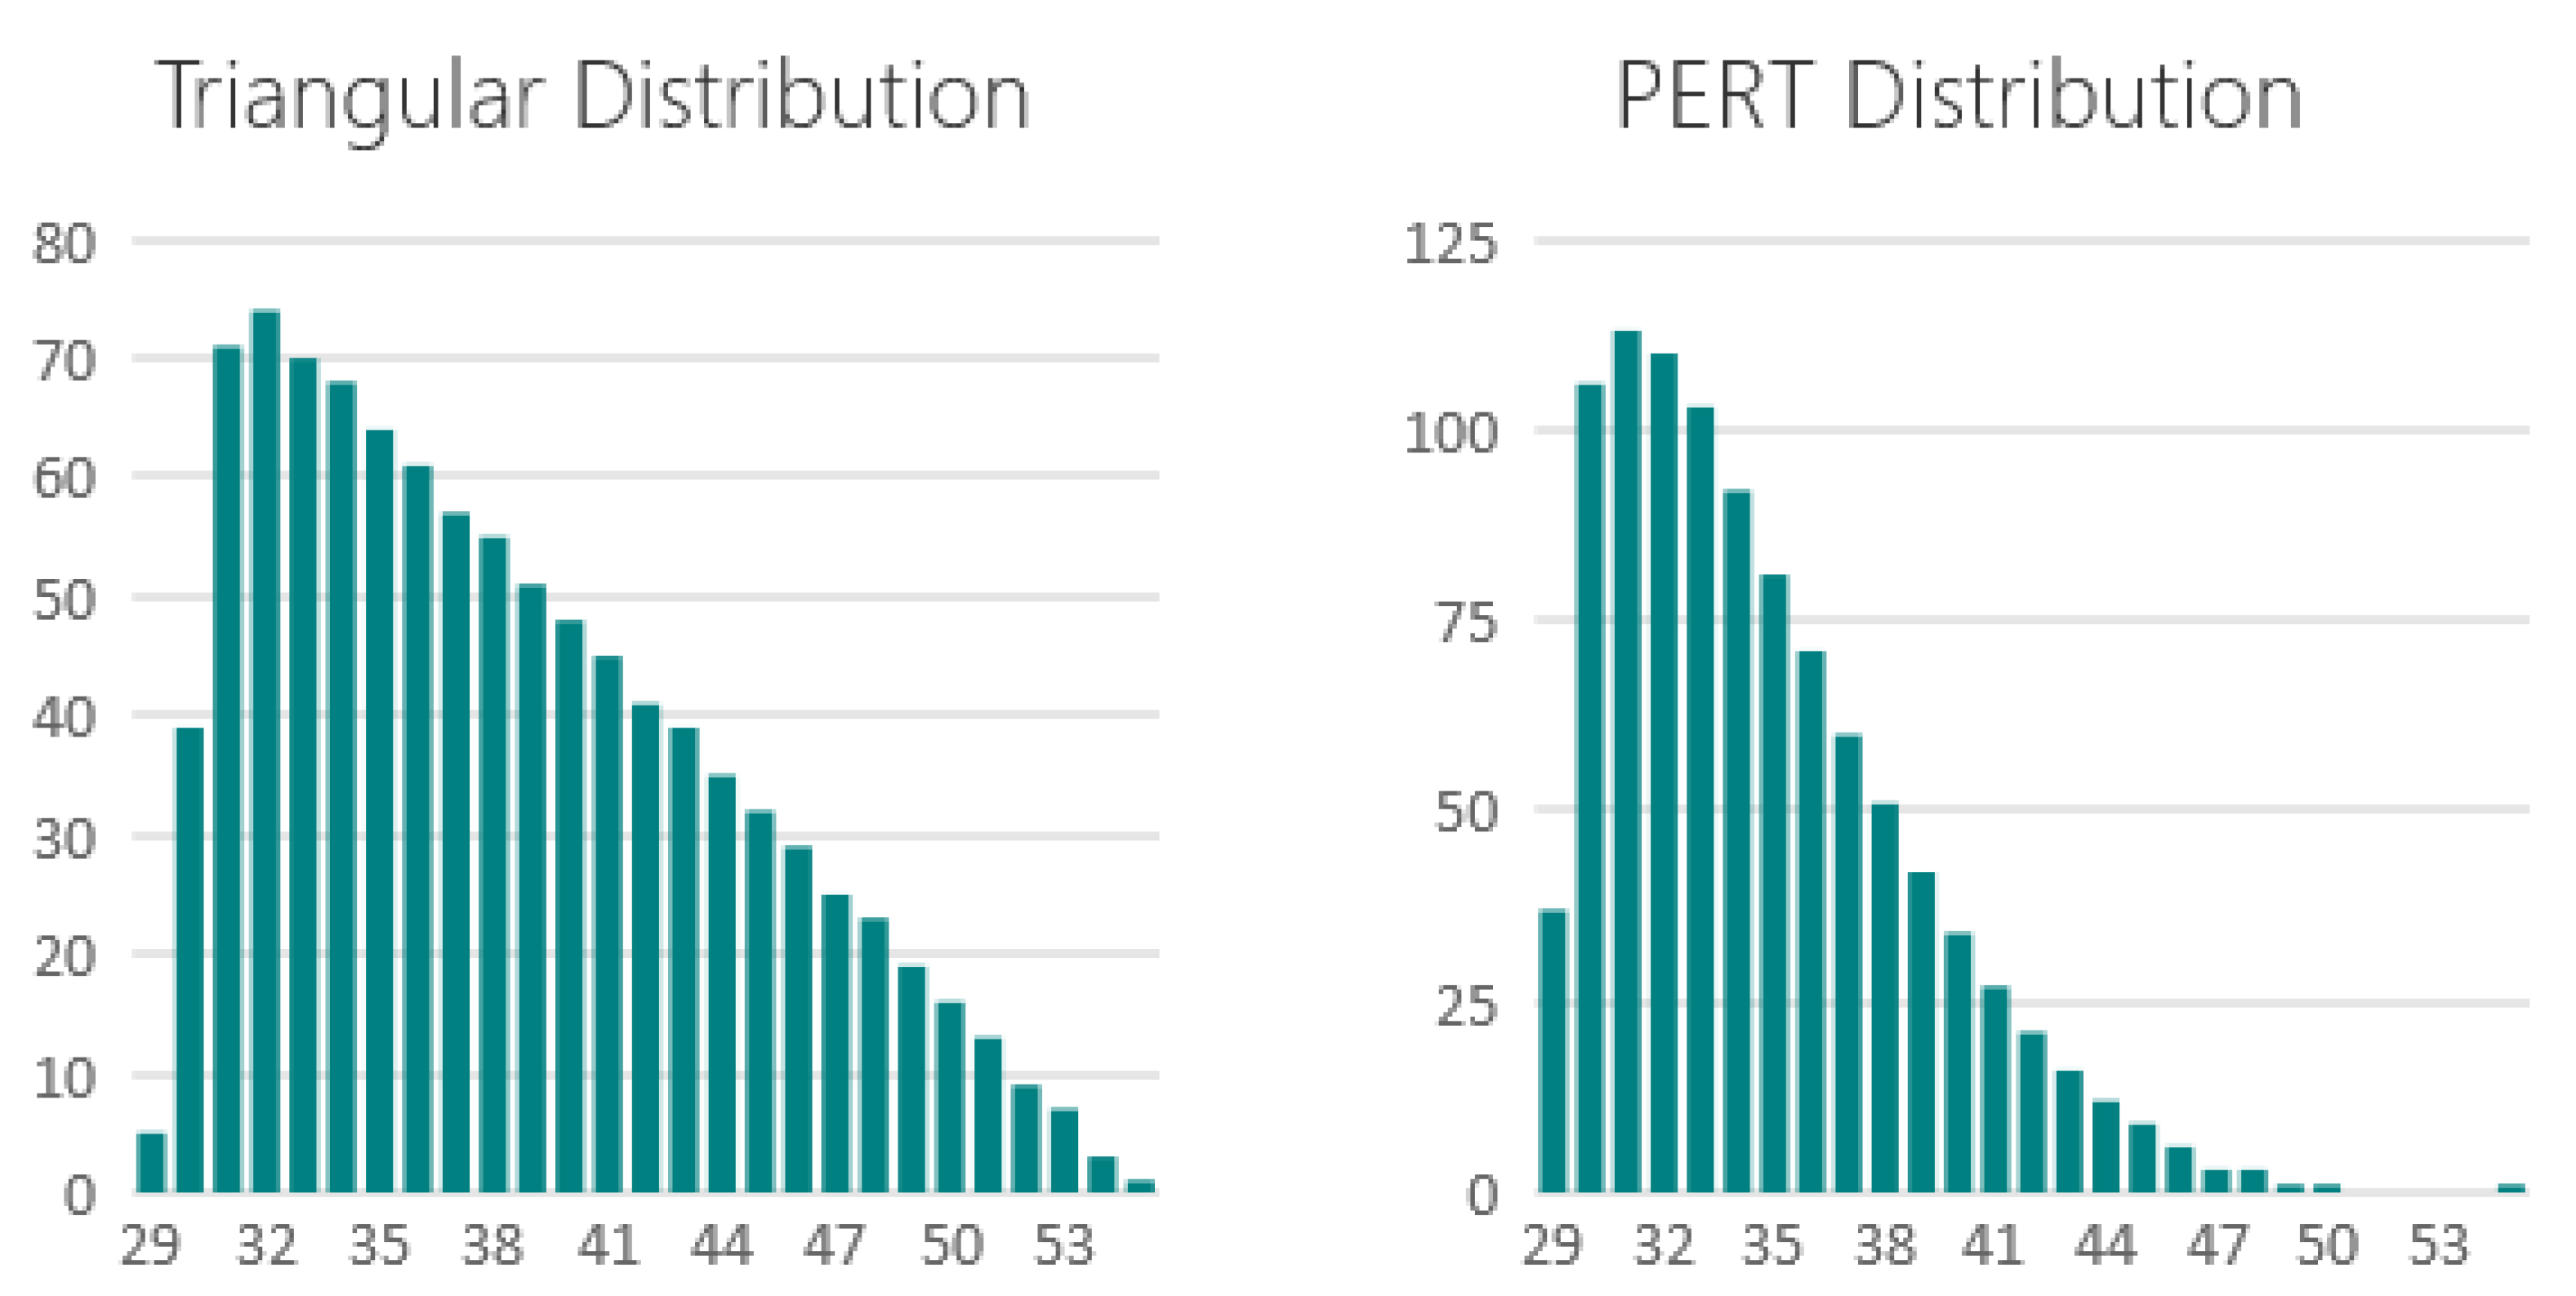
  • Time deviations from the expected project stages’ completion times, simulated with different type of a distribution, e.g., PERT, triangular or Weibull.
  • Covariance matrix reflecting the relationship between different project stages.
  • Monte Carlo simulation with a certain number of repetitions (e.g., 10,000).
  • A given confidence level of p ( 0 , 1 ) , and quantile of the distribution, for which the TaR value is determined.

4. Results

The method described in Section 3.3 allows the calculation of the Time-at-Risk for the entire project. Table 4 shows the TaR results for the 95 and 99 quantiles. Scenario A is the baseline scenario, assuming no changes to the schedule. The simulation was performed using the Monte Carlo technique with 10,000 repetitions. A PERT distribution of times for each stage of the investment process was assumed, with the most likely duration defined in the project documents and shown in Table 2 and Table 3. The results show that project managers have to allow for a time delay of up to 4.47 and 6.35 quarters, resulting from the 95 and 99 quantiles, respectively. Of course, these are extreme values, which in fact represent the fifth and first percentiles of the least favourable trajectories of the investment process (when arranged in order from 1 to 10,000, i.e., from least favourable to most favourable). Such a view of the project and its associated schedule is the essence of the Time-at-Risk method. While managers do not have to expect such an extremely unfavourable development during the implementation of the entire process as indicated by the Time-at-Risk times shown in Table 4, they cannot rule out the worst-case scenario. Knowing these times allows them to be aware of what to expect if many elements of the project implementation fail.
All calculations were done in R-Studio using the packages Distributional and PerformanceAnalytics. In the case of Scenarios B and C, some changes in the timing of some stages of the investment project were assumed. In the case of Scenario B, Stages 7 and 11 were postponed by 3 months (in line with previous slack assumptions). Scenario C results in a slightly lower TaR as it assumes a one month earlier start of four phases (10th, 11th, 13th and 16th), which slightly reduces the risk of project extension.
The use of PerformanceAnalytics package allows for reflecting the contribution of each stage to the overall TaR measure. For example, one of the stages with the largest contribution to TaR is the project implementation stage (PIS) whose deviations from assumed time schedules are shown in Figure 8. The histograms and Q–Q plot shows that PERT distribution was used to simulate changes from the assumed time schedules.
More importantly, different project stages can also be visualised in the context of their time completion distribution across the timeline of the whole project (see Figure 9). The individual distributions of changes in time schedules are based on the PERT distribution (more outliers in its right tail).

5. Discussion

In a construction project where time really means money, schedule management is crucial. Therefore, predicting the probability of time overruns plays a key role in project success or failure. It is also much easier to manage what can be quantified. Therefore, project managers should know the probability of time overruns so that they can take the necessary preventive or corrective actions.
Researchers have developed various quantitative methods for assessing time schedules in construction projects. The aim is to examine the reliability of the project schedule taking into account available probabilistic information accounting for potential disruptions that may occur during project execution. We use the Time-at-Risk (TaR) metric, which is a static measure of risk. More specifically, it is a quantile that reflects a particular feature of the probability distribution of the underlying value, i.e., time changes of the whole project and the contributions of its individual stages. In this respect, a quantile represents a certain part of the data set (time duration of all project stages) and indicates how many values in its distribution are above a certain threshold value. This paper shows a practical application of the TaR approach, which provides a realistic view of the feasibility of project schedules within anticipated time windows. In short, we used this approach to assess the reliability of performing a project according to the anticipated schedule time span. The analysed case was the construction of a residential complex (Fort Bema, situated in the Warsaw-Bemowo district), realised on 148 hectares of land and comprising almost 120,000 m2 of usable floor area of residential units. The construction of such a large residential complex took a total of 128 months. In particular, TaR allows visualising the risk of time changes related to the project as a whole, as well as to each individual stage. TaR enables the assessment of the uncertainty surrounding each project. It is a tool that helps managers create a realistic project plan that can be used as a guide to manage individual project stages/phases or even specific tasks, as well as to monitor the entire project and its expected completion time. This method, in combination with Monte Carlo simulation, where time lags (i.e., deviations in the execution times of specific stages or even tasks/activities themselves) are sampled, allows for arbitrary assumptions tailored to the specifics of each stage/task. The MC method allows for certain assumptions about the distribution of time offsets in specific stages of the project. For example, triangular distributions can be assumed instead of PERT distributions for short phases such as the realisation of the opportunity study (OS) or for the conceptual phase (CONC), while Weibull distributions can be used for the other longer implementation stages (such as the arrangement stage and execution of construction documentation [ASECD], or the project implementation stage [PIS]), as they are inherently characterised by fat tails on the right (and thin tails on the left) side of their distributions [67,86]. According to Abdelkader [86], the variation in the duration of activities/processes is best described by a Weibull distribution. However, we use PERT-distributions since they are easier to implement in the R package and they give the possibility to individually define the extremes and the most likely value, which has already been defined for the project under study.
Viewing a construction project through the prism of a series of sequential or parallel stages of the investment process makes it possible to improve the quality of implementation of the entire project. From the perspective of the risks associated with the project (assessed a priori), postponing the implementation of some stages, e.g., stage 7 and 11, by three quarters does not necessarily imply the risk of not meeting the final completion date of the project, provided, of course, that such postponements occur within a given timeframe of the project. In the case of the Parkowo-Leśne housing estate in Warsaw, this time span totalled 128 months (or 54 quarters). More precisely, if postponements of certain phases (in accordance with the original assumptions of the project) take place within a given time horizon, the quantified risk of delays in implementation is negligible. In the case of Scenario B (Table 4), it increased merely 0.42 of a quarter (99-quantile). However, if the individual stages were implemented one after the other, the risks in realising the entire project would be much higher. In this context, much depends on the synchronisation of the realisation of the individual project phases and the covariance matrix, which reflects the dependencies between the different phases and stages of the project. It is advisable to carry out these stages/activities in parallel, of course only if this is possible. For this purpose, it is advisable to develop a suitable implementation strategy, e.g., the formation of different teams that work in parallel and independently of each other. At the same time, the work of all teams should be coordinated by one person who has supervision over all teams. A similar method is used by some Silicon Valley technology companies that are leaders in bringing new technological solutions to market. Their aim is to significantly shorten their project schedules when working on new innovative technologies. One such technology company has established for this purpose three independent project teams that work independently in parallel [57,96]. The overlapping work schedules of all the teams is supposed to ensure that the final product is released to the market three times faster than it would be if a single team had worked alone. The difference, however, is that in the case of these technology giants, it is important to compete with the biggest competitors to see which one of them manages to deliver the new technology first (because the first usually skims the cream of the market) [97]. For construction companies, the situation is somewhat different. Nevertheless, the very idea of treating individual project phases (and the project as a whole) as a portfolio of certain stages or activities, while paying attention to their diversification wherever possible, seems to be reasonable. To understand this better, it is useful to use an analogy to the financial world, and more specifically, to the measure of value-at-risk (VaR) used by financial institutions for stress-testing and risk control. Stress tests are risk management tools widely used by both institutional investment managers and regulatory authorities. Value-at-risk calculates the worst case loss over a given time period that won’t be exceeded with a given level of confidence.
The TaR we describe in this article plays a similar role to VaR’s in evaluating a portfolio of assets for some investment fund or other financial institutions. In the case of a construction project, the portfolio comprises the phases/stages of the project, which, like the assets in an investment portfolio, may be subject to a certain diversification (thanks to time buffers), while the equivalent of value-at-risk in this case is Time-at-Risk. Looking at a project in this way can also allow the efficiency of entire projects to be improved. Similarly to VaRs in the investment portfolio of an investment fund, TaRs for construction companies with large investment projects can be used to perform stress tests in the context of the final completion times of such projects. Stress tests can be used to test changes in individual stages of a project to see how this affects the overall schedule. This type of method seems to be a good tool for controlling risks in a project.
It should also be noted that as new technologies are developed, the perception of the investment process is changing. There is an increasingly noticeable trend towards structuring the entire investment process [98]. It consists in the standardisation of all processes, the development of rules to ensure that each phase is carried out in an identical or similar way for each type of project, and the identification of sequences of repetitive activities aimed at standardising management processes with regard to planning and execution activities.
The standardisation and unification of all procedures, which has been taking place for some time, aims to minimise the impact of random events that cannot be excluded in the forward planning and scheduling of an investment. This manifests itself in the implementation of clearly defined regulations and specific rules, but also in the dissemination of knowledge in the field of project management, e.g., through management methodologies such as PMBoK or PRINCE2 [99], and more effective methods of achieving objectives, such as the control of construction progress or the application of standard contract terms, e.g., FIDIC [9,10,100].
It should also be emphasised that in the course of preparation and implementation of any investment project, disruptions will always occur. They are caused by the accumulation of various processes and factors and their interaction with each other. Project managers should also pay close attention to how logistics management activities are affected. Last but not least, all phases and activities of an investment project should be addressed and formulated in a comprehensive manner. They should be appropriately arranged and the relationships between them and the order in which they should be carried out should be defined. For this purpose, it is recommended to use Gantt charts, table of precedences and AON graphs such as the ones presented in this paper. In other words, the realisation of the investment project requires an appropriate arrangement of all stages/phases of the investment process and its individual activities. Against this background, the authors have developed their own model of the investment process, which is presented in this study (consisting of 16 stages grouped into eight phases).
Finally, it is worth highlighting one important limitation of one particular case study. It is rather problematic and impractical to make generalisations on the basis of one case study. Obviously, the best solution would be to collect relevant data for hundreds or even thousands of projects (preferably similar ones) and use historical distributions. It would then be possible to arrive at some generalisations. However, this is extremely difficult to achieve. Besides not all investors (and substitute investors) would have a motive to share such information (for some, possible disclosure of data on delays could have a very negative impact on their reputation), even if they were willing to provide such information (subject to anonymity), it would still be an extremely big logistical challenge to collect such data. For all intents and purposes, the case study and risk analysis that we present is aimed at providing a certain way of looking at the project and the risks that accompany the schedules. This was inspired by seeking analogies to the methods used in the capital markets and the VaRs. Drawing other analogies from the financial world, construction stakeholders wishing to adopt some more practical risk management models may seek to identify some of the largest realised historical outliers. To put it another way, they can create databases of the largest delays in other similar projects and these outliers (the most severe historical delays in schedules) can be taken as a reference point (i.e., the worst plausible scenario). To use an example from the capital markets, risk managers often use models in which the worst possible scenario is the worst loss amount that has materialised in the past (over a certain period of time).
Also, the validity of the approach used in this study is somehow strengthened by the Monte Carlo simulation, which, according to some researchers, offers the greatest potential in comparison to other methods, such as, e.g., sensitivity analysis, decision tree analysis or the Delphi method [16,51,84].

6. Conclusions

Scheduling of construction projects has attracted much attention in academic research, leading to numerous publications in the field. Authors have proposed various solutions to create effective schedules for construction projects. However, many of the current solutions are purely theoretical and often impractical for existing construction projects.
The paper presents a practical application of the combined Monte Carlo and Time-at-Risk (TaR) methods, which, under certain assumptions, can be used to estimate the risks associated with scheduling a construction project conducted in conditions of uncertainty. TaR is defined here as the maximum time deviations expected to be experienced within a given time window, at a pre-defined confidence level. For example, if the 95-quantile TaR is 4.477 quarters (as was the case for the Fort Bema project analysed in the study), it means that there is 5% confidence that over the course of the entire project there is going to be a delay of that magnitude. In other words, TaR is the time corresponding to a certain percentile of the most extreme deviations from the assumed duration of the entire project (from the right tail of the distribution, which is the product of a Monte Carlo simulation for 10,000 trials; the MC procedure simulates the distributions of deviations from the assumed durations of all the stages within the overall investment process). As some of the stages are carried out in a sequential order and some in parallel (they are associated with so-called slacks), the total duration of the project is not the sum of the durations of its individual stages. The final result also depends on the covariance matrix between the schedules of individual stages of the entire project, which can be well illustrated by a Gantt chart. In turn, the type of relationship between individual project stages can be best illustrated with an activity-on-node (AON) graph and a correlation (or covariance) matrix. To put things in another way, the final project completion times, i.e., the deviations of the project duration from the time assumed in the documentation, simulated with the use of the Monte Carlo method, are not linear combinations of sampled deviations of the duration of individual project stages.
The final conclusion is that the method presented makes it possible to quantify the risk involved in carrying out a construction project. To do this, one needs a good model of the investment process (which we present in this study) and certain assumptions with regards to the duration of individual stages of the investment process. In addition, certain assumptions must be made about possible deviations from the assumed durations of the individual stages (which can be described with a suitable distribution, e.g., a PERT or triangular distribution or even a Weibull distribution). A Monte Carlo simulation is then performed, and a new distribution is created from which the TaR can be determined.
On the other hand, the risk of time lags associated with any project can be considered from a qualitative perspective by running parallel activities wherever possible. It is also important to model the investment process itself, where great importance should be attached to both the conceptual and planning phases, as this is where the seeds are sown for future chains of events that both extend project duration and lead to excessive costs. In this regard it is obviously a good idea to conduct an appropriate cost–benefit analysis. Such a conclusion is also in line with the research findings discussed by Bilinski [45] and Obolewicz [46] in their papers.
All in all, this paper proposes a framework for quantifying the risk of time variation in a project based on Monte Carlo simulation and a probabilistic Time-at-risk analysis. It is an approach that explicitly quantifies the uncertainty in the duration of the whole project as well as its individual stages. The possibilities of the proposed approach are explained using a simple example of the construction of a housing estate in Warsaw-Bemowo, which was carried out in the period 1999–2012.

7. Patents

Another important practical contribution of this paper is the proprietary investment project management model (extended by a comprehensive map of investment process management). On 28 December 2012 it was granted a patent protection in the Patent Office of the Republic of Poland under the number P-402301, entitled Method of managing a technical project, particularly a construction investment project. It describes in detail the development phases of the project life cycle and is an alternative to other models known from the literature on the subject. The model constitutes an important practical contribution to the field of construction project management (the model was also elaborated in a digital version).

Author Contributions

Conceptualization, J.S.; methodology, J.S. and D.M.; validation, J.S.; investigation, J.S. and D.M.; resources, J.S.; data curation, D.M.; writing—original draft preparation, J.S. and D.M.; writing—review and editing J.S. and D.M.; visualization, D.M.; supervision, J.S. All authors have read and agreed to the published version of the manuscript.

Funding

This research received no external funding.

Institutional Review Board Statement

Not applicable.

Informed Consent Statement

Not applicable.

Data Availability Statement

Raw data were generated from the Department of Building Engineering (Warsaw University of Technology). We confirm that the data, models and methodology used in the research are proprietary, and the derived data supporting the findings of this study are available from the first author on request.

Conflicts of Interest

The authors declare no conflict of interest.

Appendix A

In this section, we provide a more detailed rationale for the relevance of the stages of investment process.
Table A1. Proprietary investment process model. Description of all its stages.
Phases/Stages of the Investment ProjectDescriptionCited by Authors
Opportunity studyFirst, an investment opportunity study and a preliminary economic assessment must be carried out, considering various investment opportunities and project proposals, which will then be pursued in further steps. An opportunity study is carried out at the earliest stage of a project. The scope of the study includes an initial exploration of a project idea or identification of opportunities. Project ideas in a specific region, for a specific industry or based on available raw materials are explored.Behrens and Hawranek [101]; Armaneri [102]; Tamošiūnienė and Angelov [103].
Participation in local spatial development plan approvals As part of this stage, the possibilities of preparing, approving and adopting a local spatial development plan are examined. It is considered that the adoption of a local spatial development plan should be the starting point for further investment activities. The next step is to elaborate a number of urban and architectural concepts, preliminary conceptual studies, as well as provisional, alternative media requirements for the entire area and for individual investment tasks. Leśniak et al. [104];
Sobieraj [9,10,48]
Conceptual stageThe conceptual stage is about conceptualising and institutionalising the project’s design processes. It boils down to the following activities:
-
Conceptualisation of the idea behind the project;
-
Elaboration of the main goals/objectives and expectations of the initiators;
-
Formation of a team of initiators (finding a compromise between the initiators);
-
Identification of the project participants;
-
Building the tree of goals of the initiators;
-
Formation of the team of initiators;
-
Creation of the project charter;
-
Elaboration of a detailed project definition and its alternatives;
-
Definition of the understanding of project success;
-
Definition of the rules for communication and information transfer;
-
Search for partners for project implementation (for large projects);
-
Elaboration of the concept for a general investment plan.
Tizani [105]; Biliński [45]; Obolewicz [46], Sobieraj [9,10]
Pre-feasibility studyFor each project, a pre-feasibility study must be carried out specifying how the project will be implemented, which allows the selection of the final version of the project. The study ends with the formulation of the final version of the project feasibility study, covering all technical, economic, commercial and financial aspects of the investment process. The final version of the project (feasibility study) is then submitted to banks, potential foreign contractors, developers and investors to assure them of the future success and expediency of the intended project. When acquiring the information necessary to prepare both the feasibility study and the prefeasibility study, particular attention should be paid to its reliability, timeliness, completeness and usefulness. At this stage the experience and assistance of the most reputable experts is used, relying on their specialist knowledge. Therefore, in this phase of the investment process, the following activities should be carried out:
-
Preliminary concept of the functional and utilisation programme;
-
Gathering general information for feasibility studies;
-
Preparation of the sketches of the investment plan;
-
Preparation of the pre-feasibility study;
-
Report on the pre-feasibility study;
-
Decision on the part of project initiators (after evaluation of the analysis results) with regard to the commencement of the project implementation;
-
Development of a general investment programme;
-
Preliminary identification of financing methods for the investment process;
-
Initiation of negotiations with financial institutions on the terms of financing;
-
Obtainment of a financing commitment for the investment activity under conditions specified in the pre-feasibility study or securing a financing option after meeting the conditions of the financial institutions.
Escobar-García et al. [106]; Sobieraj [48]; Kim et al. [107]
Implementation planning stage—phase IInvestment planning is such an important element of each investment process that mistakes made at this stage/phase determine the final project costs (those that will be known retrospectively when the project is completed) to a greater extent than those made during project implementation [45,46]. Therefore, each project should include a separate planning phase, preferably consisting of two stages, each of which should integrate a number of different activities that significantly facilitate the implementation of the preparation phase, followed by the pre-implementation, implementation and investment closure phases [9,10].
The implementation planning stage (phase I) entails:
-
Obtainment of necessary approval documents that will allow the investment process to proceed;
-
Initiation of the process of adopting the local spatial development plan (LSDP); optional solution, provided that more favourable construction parameters are obtained than in the decision on construction conditions (also known as individual construction permit);
-
Carrying out the procedure for obtaining a decision on building conditions if the LSDP has not been adopted and it is possible to obtain more favourable building conditions than those set out in the LSDP;
-
Signing memorandum of understanding (MoU) with selected partners (option);
-
Acquisition of property rights if a decision on construction conditions has been reached or the LSDP is in force and a decision is made on the implementation of the project. Otherwise, the decision to acquire the title can be made at a later date, or instead of acquiring the title, a commitment agreement for the sale of the title may be entered into in the form of a notarial deed;
-
Determination of required qualifications and skills of the project manager and project team;
-
Selection of the project manager responsible for the phase prior to the implementation of the investment;
-
Decision on the method of implementation of the investment process based on the analysis of the scope and difficulty of the project;
-
If necessary, when new information becomes known, possible correction of the master plan.
Biliński [45]; Ebi [108] Obolewicz [46]; Sobieraj [9,10,48]
Implementation planning stage—phase IIThe implementation planning stage (phase II) entails:
-
Appointment of the project team managers dealing with the project in the structures of an investor or a substitutive investor;
-
Development of a functional-utility programme (final version);
-
Decision on the preparation and implementation of a tender;
-
Elaboration of the procedure of conducting the competition for an architectural office (open or restricted call for proposals);
-
Preparation and approval of the competition documentation including a draft contract;
-
Selection of the design office (signing a contract);
-
Elaboration of detailed architectural concepts as an element of the tender/competition;
-
Selection and approval of the final architectural concept (for the whole project or its part, if there are several investors);
-
Preparation of the land development design;
-
Elaboration of the preliminary budget;
-
Development of a detailed investment programme.
Biliński [45]; Obolewicz [46]; Sobieraj [9,10,48]
Arrangements stage and execution of construction documentationIn the realisation of every project, a strong emphasis should be placed on the design and execution of construction documentation including a description, calculations and construction drawings [9,109]. The list of individual tasks to be completed during this stage is as follows:
-
Analysis of the possibility to choose the methods of obtaining permits for construction works (decision with regards to a building permit or notification procedure);
-
Obtainment of a decision on the conditions for connecting the investment facility to the existing infrastructure;
-
Preparation of a multi-sectoral construction design and accompanying studies;
-
Review of project documentation and submission of comments;
-
Preliminary acceptance of the project documentation (construction design) for filing an application for its approval with the competent authority (in accordance with the procedure for obtaining a building permit);
-
Notification and approval of demolitions;
-
Commencement of the procedure for obtaining a building permit;
-
Obtainment of a valid building permit decision;
-
Preparation of the feasibility study;
-
Continuation of talks with financial institutions, funds and exploration of the possibilities of obtaining funds from the EU, Provincial Fund for Environmental Protection, National Fund for Environmental Protection, etc.;
-
Verification and updating of the feasibility study.
Elnagar and Yates [98];
Roy et al. [110]; Adriańczyk [109]; Levy [111]; Sobieraj [9,10]
Developing a detailed investment management mapThe list of individual tasks to be completed during this stage is as follows:
-
Approval of the final composition of the project team and supplementary training for individual team members;
-
Approval of the list of key experts who agreed to cooperate with the project manager;
-
Approval of the building documentation and, if necessary (e.g., new information emerges, introduction of new requirements, etc.) preparation of an alternative building documentation—a return to stage 5;
-
Verification, updating and approval of a detailed plan for the implementation of the project (directive schedules, preferably in the form of a Gantt diagram, bills of quantities, in the form of an annex attached to the materials supplementing the tender documentation)
-
Final assessment of the project manager before starting an implementation of the project.
Yakura [55]; Kim et al. [112]; Maya [113]; Houston [114]; Sobieraj [9,10]
Obtaining and securing financing (feasibility study)The obtaining and securing financing stage entails:
-
Submission of the feasibility study documentation to financial institutions (after its verification);
-
Negotiations with financial institutions on final funding terms;
-
Approval of the final feasibility study;
-
Conclusion of investment financing agreements or obtainment of investment financing stand-by agreements.
Strzelecka et al. [81]; Sobieraj [48]
Executing executive documentation
-
Elaboration on an executive design by the design office or, possibly at a later stage, by the general contractor (after its selection);
-
Submission of comments and amendments with regards to the executive documentation;
-
Incorporation of the observations and amendments to the project documentation by the project office (design office).
Biliński [45]; Sobieraj [9,10]
Selecting of general contractor(s) and verification of executive documentationThis stage involves:
-
Selection of the method of conducting the competition for the general contractor of construction works (open or closed competition);
-
Preparation and approval of competition materials together with a detailed contract draft(s);
-
Multi-stage tender (competition) for the selection of a general contractor (or general contractors), under the conditions—enabling the elimination of poor companies with bad financial condition (every candidate entity is obliged to prepare a substantive and financial schedule of the project or part of the project consistent with the tender specifications);
-
Multiple comments on the documentation and proposals for replacement solutions submitted by tender participants and replies to them made by the project design office
-
Negotiation of the contract with potential general contractors and obtainment of bank guarantee promises by the finalists of the tender;
-
Selection of the general contractor or, in the case of larger projects, more than one or even several general contractors;
-
Signing a contract with the general contractor(s);
-
Approval of the executive project plans or individual stages of the project if partial acceptance of the executive documentation is stipulated in the contract terms (for all sectors according to the time schedule).
Sobieraj [9,10]
Project implementation stageAt this stage, the efficiency of project (contract) management directly influences the smooth implementation of each objective [115,116]. Project implementation stage includes:
-
Appointment of a team of supervisors for the whole undertaking;
-
Appointment of site manager(s);
-
Establishment of the site’s organisational structure by the site manager;
-
Preparation of the Health and Safety Plan (HSP) for each construction site;
-
Submitting a declaration of taking up the site manager’s position to the District Construction Supervision Inspectorate;
-
Notification about demolition (construction site) to the National Construction Supervision Inspectorate;
-
Establishment of the demolition log (development of a technology and organisation scheme for dismantling/demolition, if required);
-
Establishment of the construction log;
-
Filing a declaration by the head of the team of supervision inspectors on undertaking supervision to the District Construction Supervision Inspectorate;
-
Registration of the construction log in the municipality’s local architecture and construction department;
-
Registration of the functions of site manager and investor’s supervision inspectors in the construction logbook;
-
Commencement of declared demolition/construction works;
-
Geodetic demarcation of the facility/construction site including surveyor’s entry in the construction log with a graphic attachment;
-
Indication of the place of supply of the utilities (by the investor) for the entire duration of the construction works;
-
Protocolar introduction of the contractor to the construction site;
-
Preparatory work for the demolition/construction process according to the approved site development plan;
-
Development by the occupational health and safety (OHS) coordinator of a detailed safety plan for construction site works (for each construction site);
-
Implementation of a detailed OHS plan;
-
Approval by the health and safety coordinator of the compliance of the site preparation/demolition work with regard to occupational health and safety (OHS);
-
Acceptance of preparatory works by the site manager and investor’s supervision;
-
Implementation of organisational, technological and workshop projects by professional contractors;
-
Approval of organisational, technological designs and acceptance of them for implementation by the site manager and investor supervision;
-
Verification of the completeness and validity of the project documentation forwarded to the general contractor;
-
Development by the general contractor of a comprehensive organisational and technological approach to construction processes;
-
Launch of the project implementation and common parts of the project infrastructure as a whole;
-
Implementation processes of the demolition/construction/works;
-
Updates of the time schedules during the implementation of works;
-
Project Implementation Management involving: strategic project management (for projects lasting more than 5 years), operational project management (for projects lasting between 3 and 5 years), scope management, project documentation management, value management, quality management, cost management, financial management, risk management, time management, site management, change management, procurement management, resource management, communication management, human resources management, stakeholder management, graphic design management, safety management (OSH), environmental and sustainable development management, configuration management, knowledge management, and integration management.;
-
Monitoring, control and coordination of the entire project.
Zhao-xia [115]; Yan and Chen [116]; Sobieraj [9,10]
Commissioning stageMany projects go well until they enter the commissioning phase and then even comparatively minor problems can cause a disproportionate amount of trouble and delay [117]. This stage involves the following steps:
-
Notification of subcontractors/suppliers about their readiness for technical acceptance of works/services performed;
-
Preparation of technical acceptance protocol(s);
-
Signing of the final acceptance of works protocol between the general contractor and subcontractors with a clause on the conditions of final acceptance of all construction works by the investor/substitute investor;
-
Procedures for notification by the general contractor towards final acceptance by the investor;
-
Examination by the general contractor of the completeness of the work performed and the correctness/completeness of the collected acceptance documents;
-
Site manager’s entry in the construction log indicating preparedness of commissioned works for final acceptance;
-
Confirmation in the form of an official entry into the construction logbook with regards to the preparedness of the commissioned works for acceptance by the investor’s supervision inspectors;
-
Establishment of the final acceptance committee;
-
Activities performed by the final acceptance committee;
-
Establishment of a deadline for the removal of defects by the general contractor;
-
Preparation of the list of errors/defects/faults encountered during the investment process;
-
Final settlement between the general contractor and subcontractors/suppliers;
-
Final financial settlement of the contract;
-
Completion of the documentation for the operation permit application or, if such a permit is not required—notification to the District Construction Supervision Inspectorate about the completion of construction works;
-
Verification of the completeness of collected documents and submission of the application (with a set of annexes) for an operation permit;
-
Analysis of the application and attached documents by the District Construction Supervision Inspectorate;
-
Construction site inspection (or its lack) by the District Construction Supervision Inspectorate;
-
Issuance of the operation permit;
-
Legal validity of the operation permit decision.
Barnes [118]; Covey et al. [117]; Połoński [82]; Baryłka and Baryłka [83]; Sobieraj [9,10]
Evaluation stage of obtaining results and effects of the project (1st phase of project closing)This stage addresses the following activities:
-
General contractor’s analysis of the parameters/results established by the investor following project launch;
-
Measurements, analyses and results achieved during this stage;
-
Evaluation of the achieved results;
-
Comparison of the achieved results with the parameters established in the conceptual stage and approved in the final version of the project directed to implementation;
-
Conclusions and recommendations on the basis of the achieved results;
-
Analysis—verification of the results obtained by the investor (i.e., the type and quality of added value obtained);
-
Comments, suggestions and decisions made by the investor following the performance analysis;
-
In case of unsatisfactory results, an investigation should be initiated between the investor and the general contractor;
-
Where necessary, implementation of corrective procedures;
-
Re-examination of the results following corrective procedures;
-
In case of a satisfactory result, an application for the financial settlement of the completed stage (return of the contract performance bond and 50% of the quality/performance bond with regards to the construction works) or in case of a negative result, a legal action.
Trocki and Wyrozębski [119]; Sobieraj [9,10]
Phase of drawing up proposals for future implementation after Project Closure Phase IThis project closure (Phase I) involves:
-
Archiving of all analytical results;
-
Statistical analysis of the achieved results;
-
Preparation of the list of errors/defects/faults encountered during the investment process;
-
Preparation of the facility card containing all facility parameters, including financial parameters that can be used for comparisons when creating pre-feasibility studies for similar facilities;
-
Implementation of investment process correction procedures for similar facilities.
Trocki and Wyrozębski [119]; Sobieraj [9,10]
Initial operation stage (usually 3 years of warranty and guarantee)The initial operation stage requires:
-
Inspection of the general contractor’s compliance with the instructions for the use and operation of the facility
-
Approval of the instructions by the investor and application of any changes/amendments that have occurred during 3 years of operation;
-
Investor’s decision as to how to administer the undertaking (sale of the facility, lease/rental, own investment)
-
Appointment of the facility administrator;
-
Establishment of the facility logbook;
-
Instructions for the facility administrator;
-
Implementation of the facility operation procedures;
-
Periodic reports prepared by the facility administrator;
-
Report verification.
Biliński [45]; Zabielski [79]; Grzywiński [78]; Sobieraj [9,10]
The stage of final evaluation of the results and effects of the project (II stage of project closing)This stage involves the following activities:
-
General contractor’s analysis of the parameters/results established by the investor when launching the project (assuming full production capacity);
-
Update of the schedule for achieving the target indicators;
-
Detailed plan of the nodal points, whose passage will be followed by measurements and analyses, i.e., after 3, 5, 7, 10 years;
-
Re-audit which should be conducted by the investor;
-
Projections concerning target results, performed on the basis of the stage results;
-
Measurements and analysis of the completed production/service process;
-
Evaluation of the achieved results;
-
Comparison of the achieved results with the parameters established in the conceptual stage and approved in the final version of the project directed to implementation;
-
Conclusions and recommendations on the basis of the achieved results
-
Analysis-verification of the achieved results by the investor;
-
Investor’s decisions following results analysis;
-
In case of unsatisfactory results, an investigation should be initiated between the investor and the general contractor;
-
Where necessary, implementation of corrective procedures;
-
Re-examination of the results following corrective procedures;
-
In case of a satisfactory result, an application for the financial settlement of the completed stage or in case of a negative result, a court action (or a discount/compensation granted by the general contractor).
Trocki and Wyrozębski [119]; Sobieraj [9,10]
Phase of drawing up proposals for future implementation after Phase II of the project closureThis stage involves:
-
Archiving of all analytical results;
-
Statistical analysis of the achieved results;
-
Preparation of the list of errors/defects/faults encountered during the investment process;
-
Preparation of the facility card containing all facility parameters, including financial parameters that can be used for comparisons when creating pre-feasibility studies for similar facilities;
-
Implementation of the investment process correction procedures for similar facilities.
Trocki and Wyrozębski [119]; Sobieraj [9,10]
Table A2. Different schedule management techniques—practitioners’ perspective.
MethodDescriptionsAuthors
Critical Path Method (CPM)The planning method most commonly used in large construction projects is the critical path method (CPM). CPM is based on the assumption that the completion of each activity depends on a few critical resources or constraints. Because of the critical importance of boundary conditions, project managers study CPM as part of their project management certification (PMP). For this reason, it is also the legal standard for measuring delays when project-related disputes arise. CPM creates a graphical view of a project and calculates how much time and resources are needed to complete each activity. It also determines the critical activities that need attention to ensure the project is completed on time.Yamin and Harmelink [11]; East [12]; Galloway [120]
Program Evaluation and Review Technique (PERT) PERT is one of the most accessible tools for building design and scheduling. It provides a visual representation of the key project activities and the order in which they must be completed. Each of these steps represents the commitment of time or resources. The diagram can be thought of as a roadmap for the completion of the project; only when all milestones have been reached has the building project reached its final phase. PERT Diagrams are often built from back to front, as many projects have a pre-determined deadline, but contractors have some flexibility in the early phases and stages of the project [9,10].Kirytopoulos et al. [93]; Liu [121]; Sobieraj [9,10]; Galloway [120]
Critical Chain Project Management (CCPM)Critical Chain Project Management (CCPM) was developed by Goldratt [122]. This method emphasises the appropriate use of resources required to complete project tasks, i.e., people, equipment and physical space. In contrast to more traditional methods such as CPM or PERT (which take into account task sequencing and rigid scheduling), the CCPM method relies on resource alignment, which of course involves some flexibility in their allocation (as well as in start times). In other words, the appropriate use of resources plays a key role in the CCPM method.
With the critical chain method (CCM), one can perform an analysis of the scheduling network, addressing dependencies between tasks, resource availability and appropriate buffers. Thus, the CCM allows for better (more efficient) planning (scheduling) when the execution of project tasks is accompanied by some uncertainty related to resource management, namely to their availability or constraints.
Goldratt [122]
Line of Balance (LOB)LOB is a construction scheduling tool that relies on thoughtful planning of projects through repeated iterations. It is a management control process where the project contains blocks of repetitive work activities. LOB collects, measures and presents information in terms of time, cost and completion and compares it to a specific plan. It helps identify where projects are going off track by identifying the specific moments when deviations occur. It reflects project objectives as a single line on a chart in terms of completed activities/time that teams are expected to adhere to in order to stay on track.Arditi and Albulak [22]; Arditi et al. [24]; Soini et al. [26]; Tokdemir et al. [23]; Damci et al. [25]
Q SchedulingQ Scheduling Quantitative scheduling is a planning approach that uses a bar chart to indicate the quantities of materials that will be used at different locations and times during the project. This type of scheduling allows companies to clearly see the amount and type of material needed at different times and places. It also includes a hierarchical component so that staff and managers can see what materials they need at what time, order them accordingly, carry out the activities/tasks in the right order and not disrupt the work of others—all while controlling costs.Sulbaran and Ahmed [28]; Majumder et al. [27]
Resource Oriented SchedulingResource Oriented Scheduling method focuses on project resources, prioritising the most efficient use of those resources. As limited resources increase the likelihood of delays due to different teams fighting over them. Without a smart approach to determine who gets them and when, a construction company may be powerless to prioritise. A resource-driven schedule takes into account everyone who needs the resources in advance and then assigns them to an orderly use throughout the project.Trimble [29]; Venkatesh et al. [30]
Last Planner SystemThe Last Planner system is a short-term collaborative planning process, and in this sense, it is not a typical construction scheduling tool compared to other techniques. Even though it is not a stand-alone tool, it can be used well with planning techniques such as CPM. LPS brings together those who will do the work (the team) to plan when and how the work will be done through a series of conversational processes. This allows teams to assess and remove likely obstacles in advance, promoting the timely completion of each task.AlSehaimi et al. [31];
Gantt ChartA Gantt Chart is a type of bar chart that encourages stakeholders to structure the project with several levels of detail and consider dependencies between tasks [32]. Gant Charts help them estimate the duration of the project and identify the critical path to take during construction. A Gantt chart is a bar chart used to illustrate a project schedule, that includes some milestones, and it is not as detailed as a full CPM. It normally includes start/end dates of activities and a summary of activities of a project. However, it lacks the complexity of more comprehensive approaches and doesn’t include the resources or materials needed to complete it. Gantt Charts are excellent for creating a hierarchy among projects, showing which ones require immediate attention and which must be completed before other, dependent projects can follow.Maylor [33]; Geraldi and Lechter [32];

References

  1. Poh, P.; Lam, Y.M. Confidence based scheduling procedure (CBSP): A pragmatic approach to manage project schedule uncertainty. Int. J. Constr. Proj. Manag. 2014, 6, 119. [Google Scholar]
  2. Sobieraj, J.; Metelski, D. Identification of the key investment project management factors in the housing construction sector in Poland. Int. J. Constr. Manag. 2020, 1–12. [Google Scholar] [CrossRef]
  3. Sobieraj, J.; Metelski, D. Quantifying Critical Success Factors (CSFs) in Management of Investment-Construction Projects: Insights from Bayesian Model Averaging. Buildings 2021, 11, 360. [Google Scholar] [CrossRef]
  4. Pinto, J.K.; Slevin, D.P. Critical factors in successful project implementation. IEEE Trans. Eng. Manag. 1987, 34, 22–27. [Google Scholar] [CrossRef]
  5. Cleland, D.I.; King, W.R. Project Management Handbook, 3rd ed.; REI: New York, NY, USA, 1983. [Google Scholar]
  6. Sobieraj, J.; Metelski, D.; Nowak, P. The View of Construction Companies’ Managers on the Impact of Economic, Environmental and Legal Policies on Investment Process Management. Arch. Civ. Eng. 2021, 67, 111–129. [Google Scholar]
  7. Herroelen, W.; Leus, R. Project scheduling under uncertainty: Survey and research potentials. Eur. J. Oper. Res. 2005, 165, 289–306. [Google Scholar] [CrossRef] [Green Version]
  8. Bruni, M.E.; Beraldi, P.; Guerriero, F.; Pinto, E. A scheduling methodology for dealing with uncertainty in construction projects. Eng. Comput. 2011, 28, 1064–1078. [Google Scholar] [CrossRef]
  9. Sobieraj, J. Wpływ Polityki Gospodarczej, Srodowiskowej i Prawnej na Zarządzanie Procesem Inwestycyjnym w Budownictwie Przemysłowym; ITE-PIB: Radom, Poland, 2019. [Google Scholar]
  10. Sobieraj, J. Investment Project Management on the Housing Construction Market; Aurum Universitas Grupo Hespérides: Madrid, Spain, 2020. [Google Scholar]
  11. Yamin, R.A.; Harmelink, D.J. Comparison of linear scheduling model (LSM) and critical path method (CPM). J. Constr. Eng. Manag. 2001, 127, 374–381. [Google Scholar] [CrossRef] [Green Version]
  12. East, E. Critical Path Method (CPM) Tutor for Construction Planning and Scheduling; McGraw-Hill Education: New York, NY, USA, 2015. [Google Scholar]
  13. Mohamed, Y. A Framework for Systematic Improvement of Construction Systems. Ph.D. Thesis, University of Alberta, Edmonton, AB, Canada, 2002. [Google Scholar]
  14. Koskela, L. An Exploration Towards a Production Theory and Its Application to Construction; VTT Technical Research Centre of Finland: Espoo, Finland, 2000. [Google Scholar]
  15. Howell, G.; Ballard, G. Lean production theory: Moving beyond “Can-Do”. Lean Constr. 1997, 17–23. [Google Scholar]
  16. Kong, Z.; Zhang, J.; Li, C.; Zheng, X.; Guan, Q. Risk assessment of plan schedule by Monte Carlo simulation. In Proceedings of the 4th International Conference on Information Technology and Management Innovation (ICITMI), Shenzhen, China, 12–13 September 2015; pp. 509–513. [Google Scholar]
  17. Frein, J. Handbook of Construction Management and Organization; Springer Science & Business Media: Berlin, Germany, 2012. [Google Scholar]
  18. Hulett, D. Practical Schedule Risk Analysis; Routledge: London, UK, 2016. [Google Scholar]
  19. Ruogang, L.; Guoxiang, W.; Yue, L.; Jialin, R. Study on uncertainty of activity duration in PERT. Syst. Eng. Electron. 1997, 19, 40–45. [Google Scholar]
  20. Petroutsatou, K. A proposal of project management practices in public institutions through a comparative analyses of critical path method and critical chain. Int. J. Constr. Manag. 2019, 1–10. [Google Scholar] [CrossRef]
  21. Gonçalves-Dosantos, J.C.; García-Jurado, I.; Costa, J. ProjectManagement: An R Package for Managing Projects. R J. 2020, 12, 419–436. [Google Scholar] [CrossRef]
  22. Arditi, D.; Albulak, M.Z. Line-of-balance scheduling in pavement construction. J. Constr. Eng. Manag. 1986, 112, 411–424. [Google Scholar] [CrossRef]
  23. Tokdemir, O.B.; Erol, H.; Dikmen, I. Delay Risk Assessment of Repetitive Construction Projects Using Line-of-Balance Scheduling and Monte Carlo Simulation. J. Constr. Eng. Manag. 2019, 145, 1–19. [Google Scholar] [CrossRef]
  24. Arditi, D.; Tokdemir, O.B.; Suh, K. Challenges in line-of-balance scheduling. J. Constr. Eng. Manag. 2002, 128, 545–556. [Google Scholar] [CrossRef]
  25. Damci, A.; Arditi, D.; Polat, G. Resource leveling in line-of-balance scheduling. Comput. -Aided Civ. Infrastruct. Eng. 2013, 28, 679–692. [Google Scholar] [CrossRef]
  26. Soini, M.; Leskelä, I.; Seppänen, O. Implementation of line-of-balance based scheduling and project control system in a large construction company. In Proceedings of the 12th Annual Conference of the International Group for Lean Construction, Helsingor, Denmark, 3–5 August 2004. [Google Scholar]
  27. Majumder, S.; Majumder, S.; Biswas, D. Impact of effective construction planning in project performance improvement. Qual. Quant. 2021, 1–12. [Google Scholar] [CrossRef]
  28. Sulbaran, T.; Ahmed, F. Expert System for Construction Scheduling Decision Support Based on Travelling Salesman Problem. In Proceedings of the 53rd ASC Annual International Conference Proceedings, Seattle, WA, USA, 5–8 April 2017. [Google Scholar]
  29. Trimble, G. Resource-oriented scheduling. Int. J. Proj. Manag. 1984, 2, 70–74. [Google Scholar] [CrossRef]
  30. Venkatesh, M.P.; Malathi, B.; Umarani, C. Factors Affecting Implementation of Resource Scheduling in Indian Construction Projects. Appl. Mech. Mater. 2012, 174, 2782–2786. [Google Scholar] [CrossRef]
  31. AlSehaimi, A.O.; Fazenda, P.T.; Koskela, L. Improving construction management practice with the Last Planner System: A case study. Eng. Constr. Archit. Manag. 2014, 21, 51–64. [Google Scholar] [CrossRef] [Green Version]
  32. Geraldi, J.; Lechter, T. Gantt charts revisited: A critical analysis of its roots and implications to the management of projects today. Int. J. Manag. Proj. Bus. 2012, 5, 578–594. [Google Scholar] [CrossRef]
  33. Maylor, H. Beyond the Gantt chart: Project management moving on. Eur. Manag. J. 2001, 19, 92–100. [Google Scholar] [CrossRef]
  34. Khodakarami, V.; Fenton, N.; Neil, M. Project Scheduling: Improved approach to incorporate uncertainty using Bayesian Networks. Proj. Manag. J. 2007, 38, 39–49. [Google Scholar] [CrossRef]
  35. Khodakarami, V.; Abdi, A. Project cost risk analysis: A Bayesian networks approach for modeling dependencies between cost items. Int. J. Proj. Manag. 2014, 32, 1233–1245. [Google Scholar] [CrossRef]
  36. Gondia, A.; Siam, A.; El-Dakhakhni, W.; Nassar, A.H. Machine learning algorithms for construction projects delay risk prediction. J. Constr. Eng. Manag. 2020, 146, 04019085. [Google Scholar] [CrossRef]
  37. Kim, S.Y.; Van Tuan, N.; Ogunlana, S.O. Quantifying schedule risk in construction projects using Bayesian belief networks. Int. J. Proj. Manag. 2009, 27, 39–50. [Google Scholar]
  38. Anastasopoulos, P.C.; Labi, S.; Bhargava, A.; Mannering, F.L. Empirical assessment of the likelihood and duration of highway project time delays. J. Constr. Eng. Manag. 2012, 138, 390–398. [Google Scholar] [CrossRef]
  39. Azaron, A.; Ghomi, S.F. Lower bound for the mean project completion time in dynamic PERT networks. Eur. J. Oper. Res. 2008, 186, 120–127. [Google Scholar] [CrossRef]
  40. Sobieraj, J.; Metelski, D.; Mihi Ramírez, A. Pivotal project management factors in the context of polish residential construction projects. In Proceedings of the International Conference on Industry, Business and Social Sciences (IBSS), Osaka, Japan, 28–30 August 2019. [Google Scholar]
  41. Bolgorian, M.; Raei, R. A quantile-based Time at Risk: A new approach for assessing risk in financial markets. Phys. A Stat. Mech. Appl. 2013, 392, 5673–5677. [Google Scholar] [CrossRef]
  42. Kovalenko, T.; Sornette, D. Dynamical Diagnosis and Solutions for Resilient Natural and Social Systems. arXiv 2012, arXiv:1211.1949. [Google Scholar]
  43. Sobieraj, J.; Metelski, D.; Mihi Ramírez, A. The view of SME construction companies’ managers on the impact of economic, environmental and legal policies on investment process management. Case of Polish Companies. In In Proceedings of the XXVIII AEDEM International Conference, Tokyo, Japan, 3–4 September 2019; pp. 1046–1069. [Google Scholar]
  44. Cooper, K.G. The $2000 hour: How managers influence project performance through the rework cycle. Proj. Manag. J. 1994, 25, 11–24. [Google Scholar]
  45. Biliński, T. Struktura i uwarunkowania współczesnego procesu inwestycyjno-budowlanego. Przegląd Bud. 2010, 81, 46–52. [Google Scholar]
  46. Obolewicz, J. Koordynacja budowlanego procesu inwestycyjnego. Bud. I Inżynieria Sr. 2016, 7, 153–163. [Google Scholar]
  47. Laufer, A.; Howell, G.A. Construction Planning: Revising the Paradigm; Project Management Institute: Newtown Square, PA, USA, 1993. [Google Scholar]
  48. Sobieraj, J. Impact of spatial planning on the pre-investment phase of the development process in the residential construction field. Arch. Civ. Eng. 2017, 63, 113–130. [Google Scholar] [CrossRef] [Green Version]
  49. Project Management Institute. A Guide to the Project Management Body of Knowledge; Project Management Institute: Newtown Square, PA, USA, 2004. [Google Scholar]
  50. Basu, A. Practical Risk Analysis in Scheduling; AACE International Transactions: Morgantown, WV, USA, 1998. [Google Scholar]
  51. Rubinstein, R.Y.; Kroese, D.P. Simulation and the Monte Carlo Method; John Wiley & Sons: New York, NY, USA, 2016. [Google Scholar]
  52. Sarma, M.; Thomas, S.; Shah, A. Selection of Value-at-Risk models. J. Forecast. 2003, 22, 337–358. [Google Scholar] [CrossRef]
  53. Lindkvist, L.; Soderlund, J. Managing product development projects: On the significance of fountains and deadlines. Organ. Stud. 1998, 19, 931–951. [Google Scholar] [CrossRef] [Green Version]
  54. Dille, T.; Söderlund, J. Managing inter-institutional projects: The significance of isochronism, timing norms and temporal misfits. Int. J. Proj. Manag. 2011, 29, 480–490. [Google Scholar] [CrossRef]
  55. Yakura, E.K. Charting time: Timelines as temporal boundary objects. Acad. Manag. J. 2002, 45, 956–970. [Google Scholar]
  56. Vaughan, D. The Challenger Launch Decision: Risky Technology, Culture, and Deviance at Nasa; University of Chicago Press: Chicago, IL, USA, 1996. [Google Scholar]
  57. Sobieraj, J. Review of Knowledge on Strategy Development, Strategic Management and Strategic Analysis; Wydawnictwo ITEE: Radom, Poland, 2017. [Google Scholar]
  58. Jugdev, K.; Müller, R. A retrospective look at our evolving understanding of project success. Proj. Manag. J. 2005, 36, 19–31. [Google Scholar] [CrossRef]
  59. Flyvbjerg, B.; Garbuio, M.; Lovallo, D. Delusion and deception in large infrastructure projects: Two models for explaining and preventing executive disaster. Calif. Manag. Rev. 2009, 51, 170–194. [Google Scholar] [CrossRef] [Green Version]
  60. Flyvbjerg, B.; Garbuio, M.; Lovallo, D. Delusion and deception in large infrastructure projects: Two models for explaining and preventing executive disaster. Def. AR J. 2017, 24, 583–585. [Google Scholar] [CrossRef] [Green Version]
  61. Beckers, F.; Chiara, N.; Flesch, A.; Maly, J.; Silva, E.; Stegemann, U. A risk-management approach to a successful infrastructure project. Mckinsey Work. Pap. Risk 2013, 52, 18. [Google Scholar]
  62. Bertsimas, D.; Sim, M. The price of robustness. Oper. Res. 2004, 52, 35–53. [Google Scholar] [CrossRef] [Green Version]
  63. Jaśkowski, P. Methodology for enhancing reliability of predictive project schedules in construction. Eksploat. I Niezawodn. 2015, 17, 470–479. [Google Scholar] [CrossRef]
  64. Al-Fawzan, M.A.; Haouari, M. A bi-objective model for robust resource-constrained project scheduling. Int. J. Prod. Econ. 2005, 96, 175–187. [Google Scholar] [CrossRef]
  65. Van de Vonder, S.; Demeulemeester, E.; Herroelen, W.; Leus, R. The use of buffers in project management: The trade-off between stability and makespan. Int. J. Prod. Econ. 2005, 97, 227–240. [Google Scholar] [CrossRef] [Green Version]
  66. Namazian, A.; Yakhchali, S.H.; Yousefi, V.; Tamošaitienė, J. Combining Monte Carlo simulation and Bayesian networks methods for assessing completion time of projects under risk. Int. J. Environ. Res. Public Health 2019, 16, 5024. [Google Scholar] [CrossRef] [Green Version]
  67. Fitzsimmons, J.; Hong, Y.; Brilakis, I. Improving Construction Project Schedules before Execution. In Proceedings of the 37th International Symposium on Automation and Robotics in Construction (ISARC), Aarhus, Denmark, 27–28 October 2020. [Google Scholar]
  68. Ökmen, Ö.; Öztaş, A. Construction project network evaluation with correlated schedule risk analysis model. J. Constr. Eng. Manag. 2008, 134, 49–63. [Google Scholar] [CrossRef]
  69. Levin, J. Relational incentive contracts. Am. Econ. Rev. 2003, 93, 835–857. [Google Scholar] [CrossRef] [Green Version]
  70. Mitkus, S.; Mitkus, T. Causes of conflicts in a construction industry: A communicational approach. Procedia-Soc. Behav. Sci. 2014, 110, 777–786. [Google Scholar] [CrossRef] [Green Version]
  71. Kaming, P.F.; Olomolaiye, P.O.; Holt, G.D.; Harris, F.C. Factors influencing construction time and cost overruns on high-rise projects in Indonesia. Constr. Manag. Econ. 1997, 15, 83–94. [Google Scholar] [CrossRef]
  72. Moselhi, O.; Gong, D.; El-Rayes, K. Estimating weather impact on the duration of construction activities. Can. J. Civ. Eng. 1997, 24, 359–366. [Google Scholar] [CrossRef]
  73. Honek, K.; Azar, E.; Menassa, C.C. Recession effects in United States public sector construction contracting: Focus on the American Recovery and Reinvestment Act of 2009. J. Manag. Eng. 2012, 28, 354–361. [Google Scholar] [CrossRef]
  74. Bragadin, M.A.; Kähkönen, K. Safety, space and structure quality requirements in construction scheduling. Procedia Econ. Financ. 2015, 21, 407–414. [Google Scholar] [CrossRef] [Green Version]
  75. ElZomor, M.; Burke, R.; Parrish, K.; Gibson, G.E., Jr. Front-end planning for large and small infrastructure projects: Comparison of project definition rating index tools. J. Manag. Eng. 2018, 34, 04018022. [Google Scholar] [CrossRef]
  76. Ortiz-González, J.I.; Pellicer, E.; Howell, G. Contingency management in construction projects: A survey of Spanish contractors. In Proceedings of the IGLC-22, Oslo, Norway, 25–27 June 2014; pp. 195–206. [Google Scholar]
  77. Mubarak, S.A. Construction Project Scheduling and Control; John Wiley & Sons: Hoboken, NJ, USA, 2015. [Google Scholar]
  78. Grzywiński, J. Proces Inwestycyjny Zgodnie z Polskim Prawem Budowlanym; Wyd. Kancelarii Furtek Komosa Aleksandrowicz: Warsaw, Poland, 2015. [Google Scholar]
  79. Zabielski, J. Proces Inwestycyjno-Budowlany. Materiały Dydaktyczne Wydziału Prawa i Administracji UW; Wyd. CRE Edukacja: Warsaw, Poland, 2014. [Google Scholar]
  80. Dzierżewicz, Z.; Dylewski, J. Proces Budowlany w Świetle Ustawy Prawo Budowlane; Wyd. Grupa APEXnet: Lublin, Poland, 2011. [Google Scholar]
  81. Strzelecka, E.; Glinkowska, B.; Maciejewska, M.; Wiażel-Sasin, B. Zarządzanie Przedsięwzięciami Budowlanymi. Podstawy, Procedury, Przykłady; Wyd. Politechniki Łódzkiej: Łódź, Poland, 2014. [Google Scholar]
  82. Połoński, M. Kierowanie Budowlanym Procesem Inwestycyjnym; Wyd. SGGW: Warsaw, Poland, 2009. [Google Scholar]
  83. Baryłka, A.; Baryłka, J. Funkcje Techniczne w Budownictwie. Przewodnik Po Inwestycyjnym i Eksploatacyjnym Procesie Budowlanym; Polcen: Warsaw, Poland, 2015. [Google Scholar]
  84. Liu, Y.; Li, Y. Risk management of construction schedule by PERT with Monte Carlo simulation. Appl. Mech. Mater. 2014, 548, 1646–1650. [Google Scholar] [CrossRef]
  85. Hendradewa, A.P. Schedule Risk Analysis by Different Phases of Construction Project Using CPM-PERT and Monte-Carlo Simulation. In Proceedings of the 11th International Seminar on Industrial Engineering & Management (ISIEM), Technology and Innovation Challenges towards Industry 4.0 Era, Makasar, Indonesia, 27–29 November 2018. [Google Scholar]
  86. Abdelkader, Y.H. Evaluating project completion times when activity times are Weibull distributed. Eur. J. Oper. Res. 2004, 157, 704–715. [Google Scholar] [CrossRef]
  87. Clark, C.E. Letter to the editor—The PERT model for the distribution of an activity time. Oper. Res. 1962, 10, 405–406. [Google Scholar] [CrossRef] [Green Version]
  88. Johnson, N.L.; Kotz, S.; Balakrishnan, N. Continuous Univariate Distributions; John Wiley & Sons: New York, NY, USA, 1995. [Google Scholar]
  89. Kay, M. ggdist: Visualizations of Distributions and Uncertainty. R Package Version 3.0.1. Available online: https://mjskay.github.io/ggdist/ (accessed on 18 January 2022).
  90. Vose, D. Risk Analysis: A Quantitative Guide; John Wiley & Sons: New York, NY, USA, 2008. [Google Scholar]
  91. Buchsbaum, P. Modified PERT Simulation; Great Solutions: Rio de Janeiro, Brazil, 2012. [Google Scholar]
  92. Barraza, G.A.; Bueno, R.A. Probabilistic control of project performance using control limit curves. J. Constr. Eng. Manag. 2007, 133, 957–965. [Google Scholar] [CrossRef]
  93. Kirytopoulos, K.A.; Leopoulos, V.N.; Diamantas, V.K. PERT vs. Monte Carlo Simulation along with the suitable distribution effect. Int. J. Proj. Organ. Manag. 2008, 1, 24–46. [Google Scholar] [CrossRef]
  94. Vanhoucke, M. Measuring the efficiency of project control using fictitious and empirical project data. Int. J. Proj. Manag. 2012, 30, 252–263. [Google Scholar] [CrossRef]
  95. Koulinas, G.K.; Xanthopoulos, A.S.; Tsilipiras, T.T.; Koulouriotis, D.E. Schedule delay risk analysis in construction projects with a simulation-based expert system. Buildings 2020, 10, 134. [Google Scholar] [CrossRef]
  96. Rumelt, R.P. Good Strategy/Bad Strategy: The Difference and Why It Matters. Strateg. Dir. 2012, 28, 8. [Google Scholar] [CrossRef]
  97. Metelski, D.; Mihi-Ramirez, A.; Arteaga-Ortiz, J. Research and development projects upon real options view. Eng. Econ. 2014, 25, 283–293. [Google Scholar] [CrossRef]
  98. Elnagar, H.; Yates, J.K. Construction documentation used as indicators of delays. Cost Eng. 1997, 39, 31. [Google Scholar]
  99. Sobieraj, J.; Metelski, D.; Nowak, P. PMBoK vs. PRINCE2 in the context of Polish construction projects: Structural Equation Modelling approach. Arch. Civil Eng. 2021, 67, 551–579. [Google Scholar]
  100. Kapliński, O.; Dziadosz, A.; Zioberski, J.L. Próba standaryzacji procesu zarządzania na etapie planowania i realizacji przedsięwzięć budowlanych. Zesz. Nauk. Politech. Rzesz. Bud. I Inżynieria Sr. 2011, 58, 11. [Google Scholar]
  101. Behrens, W.; Hawranek, P.M. Manual for the Preparation of Industrial Feasibility Studies; United Nations Industrial Development Organization: Vienna, Austria, 1991; pp. 176–181. [Google Scholar]
  102. Armaneri, Ö. An Integrated Multi-Criteria Decision Making Methodology for Risky Investment Projects Evaluation. Ph.D. Thesis, DEÜ Fen Bilimleri Enstitüsü, Buca/İZMİR, Turkey, 2009. [Google Scholar]
  103. Tamošiūnienė, R.; Angelov, K. Project and Programme Management and Evaluation; Publishing House of Technical University–Sofia: Sofia, Bulgraria, 2011. [Google Scholar]
  104. Leśniak, A.; Plebankiewicz, E.; Kozik, R.; Amanowicz-Marcinkowska, K. Impact of the current local spatial development plans on the activity of investor on the Polish residential real estate market. Earth Environ. Sci. 2021, 656, 012004. [Google Scholar] [CrossRef]
  105. Tizani, W. Collaborative Design in Virtual Environments at Conceptual Stage. In Collaborative Design in Virtual Environments, 2nd ed.; Wang, X., Tsai, J., Eds.; Springer: Dordrecht, The Netherlands, 2011; pp. 67–76. [Google Scholar]
  106. Escobar-García, D.A.; Younes-Velosa, C.; Moncada-Aristizábal, C.A. Application of a prefeasibility study methodology in the selection of road infrastructure projects: The case of Manizales (Colombia). Dyna 2015, 82, 204–213. [Google Scholar] [CrossRef]
  107. Kim, H.Y.; Shin, Y.H.; An, J.H.; Vinh, B.T.; Dung, T.Q. Prefeasibility Study on the Construction and the Operation of the Underground Cold Storage in Lam Dong Province, Vietnam. Tunn. Undergr. Space 2021, 31, 184–197. [Google Scholar]
  108. Ebi, U. Implementation of projects in the housing sector: A view of world bank assisted low income housing project in Aba and umuahia in retrospect. Sch. J. Sci. Res. Essay 2015, 6, 90–95. [Google Scholar]
  109. Adriańczyk, A.K. The Project Fire Water Storage Tank with a Capacity of 6000 m3. Ph.D. Thesis, Insitute of Civil Engineering, Warsaw University of Technology, Warsaw, Poland, 2016. [Google Scholar]
  110. Roy, R.; Low, M.; Waller, J. Documentation, standardization and improvement of the construction process in house building. Constr. Manag. Econ. 2005, 23, 57–67. [Google Scholar] [CrossRef]
  111. Levy, S.M. Project Management in Construction; McGraw-Hill Education: New York, NY, USA, 2018. [Google Scholar]
  112. Kim, N.; Park, M.; Lee, H.S.; Roh, S. Performance management method for construction companies. In Proceedings of the 24th International Symposium on Automation and Robotics in Construction Companies, Kochi, India, 19–21 September 2007; pp. 523–529. [Google Scholar]
  113. Maya, R.A. Performance management for Syrian construction projects. Int. J. Constr. Eng. Manag. 2016, 5, 65–78. [Google Scholar]
  114. Houston, D.A. Knowledge Management and Positive Deviance: A Study of Construction Project Outcomes. Ph.D. Thesis, Capella University, Minneapolis, MN, USA, 2019. [Google Scholar]
  115. Zhao-xia, M.A. Research on Contract Management in Project Implementation Stage. Nonferrous Met. Des. 2010, 2, 70–77. [Google Scholar]
  116. Yan, W.Z.; Chen, P. Based on the System Dynamics construction phase of the project cost control Study. Appl. Mech. Mater. 2014, 501, 2691–2694. [Google Scholar] [CrossRef]
  117. Covey, G.; Shore, D.; Harvey, R.; Faber, G. Preparing for commissioning. Appita Technol. Innov. Manuf. Environ. 2011, 64, 314–322. [Google Scholar]
  118. Barnes, M. Construction project management. Int. J. Proj. Manag. 1988, 6, 69–79. [Google Scholar] [CrossRef]
  119. Trocki, M.; Wyrozębski, P. Planowanie Przebiegu Projektów; Oficyna Wydawnicza SGH: Warsaw, Poland, 2015. [Google Scholar]
  120. Galloway, P.D. Survey of the construction industry relative to the use of CPM scheduling for construction projects. J. Constr. Eng. Manag. 2006, 132, 697–711. [Google Scholar] [CrossRef]
  121. Liu, M. Program evaluation and review technique (PERT) in construction risk analysis. Appl. Mech. Mater. 2013, 357, 2334–2337. [Google Scholar] [CrossRef]
  122. Goldratt, E.M. Critical Chain; The North River Press: Great Barrington, MA, USA, 1997. [Google Scholar]
Figure 1. Construction of the Parkowo-Leśne housing estate complex—view from the side of Osmańczyk 10 street (construction site, October 2004).
Applsci 12 01044 g001
Figure 2. Investment process model (16 stages grouped in eight phases).
Applsci 12 01044 g002
Figure 3. Gantt chart—Parkowo Leśne Housing Estate Project.
Applsci 12 01044 g003
Figure 4. AON graph of the project. In an AON graph the activities are embodied in the nodes (squares) and the precedences of the various types, FS, SS, FF, SF, in the arcs (arrows). Nodes in red indicate critical activities.
Applsci 12 01044 g004
Figure 5. Correlation matrix reflecting dependencies between different phases and stages of the Fort Bema (Parkowo-Leśne Housing Estate) project.
Applsci 12 01044 g005
Figure 6. Heatmap reflecting dependencies between different phases and stages of the Fort Bema project.
Applsci 12 01044 g006
Figure 7. Comparison of triangular and PERT distributions for the assumed “Project implementation stage” assumptions (i.e., minimum, maximum and mode values).
Applsci 12 01044 g007
Figure 8. Deviations in time schedules for the project implementation stage (PIS).
Applsci 12 01044 g008
Figure 9. Individual project stages can be visualised in terms of the distribution of changes in the assumed time schedule on the timeline of the entire project.
Applsci 12 01044 g009
Table 1. Different methods addressing time schedule management in construction projects.
MethodAuthorsContribution
Naïve Bayesian; machine learning models; decision tree and naive Bayesian classification algorithmsGondia [36]Machine learning models facilitate accurate analysis and prediction of project delay risks (time overruns). In the case of Gondia’s [36] study, the evaluation results show that the naïve Bayesian model provides better predictive performance for the data studied.
Bayesian networksKhodakarami et al. [34]; Khodakarami and Abdi [35]Khodakarami et al. [34] used Bayesian network modelling for project scheduling. They reflect the causal relationship between these sources of uncertainty and project parameters. This method has the advantage (over other methods) of considering both uncertainty and causality. Khodakarami and Abdi [35] studied project-related uncertainties by modelling different factors affecting project performance. In their study, they quantified different types of uncertainty by relying on a modelling method for complex project dependencies such as common causal factors, formal use of expert opinion, and learning from data to update prior beliefs and probabilities.
Bayesian Belief Network (BBNs)Kim et al. [37]Kim et al. [37] used BBNs as a tool for predicting the probability of schedule delays. It is a method that offers great flexibility in accepting inputs and providing outputs. In addition, BBNs have the ability to treat the value of a variable as a known input or to evaluate its probability as an output of the system. It is a very useful technique for calculating the probability of events before and after the entry of evidence and for making predictions with the use of expert opinions (BBNs do not necessarily require historical data). Kim et al. [37] quantified the probability of delays in construction projects using Bayesian belief networks. The top main causes of changes in time schedule construction projects turned out to be the owner’s financial difficulties, inadequate experience and financial difficulties of contractors, shortage of materials, slow site handover, inappropriate construction methods, defective works and reworks and a lack of management capacity by owners/project managers.
Logistic regressionAnastasopoulos et al. [38]The probability of a project having a time delay can be modelled as a binary outcome variable (1 if there was a time delay and 0 otherwise). Statistical approaches for such a model include the standard probit and logit models. To investigate the probability of a project delay, Anastasopoulos et al. [38] used a binary logit model with random parameters. The results of the model estimation show that the probability and duration of project delays are significantly influenced by factors such as project cost (bid amount), project type, planned project duration and the probability of bad weather.
Combination of Bayesian networks, support vector machines and Monte Carlo simulation to simulate project outcomesFitzsimmons et al. [67] To improve the performance of critical path (pre-project) activity scheduling, Fitzsimmons et al. [67] proposed a method that integrates Bayesian networks to estimate the conditional delay probability of an activity based on its predecessor. It yields much better results than the traditional Monte Carlo simulations (by 52%). The Fitzsimmons et al. [67] method relies on data that originates from 302 completed infrastructure construction projects; Fitzsimmons et al.’s [67] model was appropriately trained/calibrated and validated on a large infrastructure road construction project. It works well in predicting project delays.
Monte Carlo simulation and Bayesian networkNamazian et al. [66]Namazian et al. [66] brought together the Bayesian network and Monte Carlo simulation methods and presented the timing of a construction project in the context of a framework for assessing the overall impact of risks in such a project.
Confidence based scheduling procedure (CBSP)Poh and Lam [1]Poh and Lam [1] propose a method to determine the probability distribution of project completion times by estimating the duration of individual tasks/activities using confidence-based estimation.
RobustnessBertsimas and Sim [62]; Al-Fawzan and Haouari [64]; Van de Vonder et al. [65]; Jaśkowski [63]As one of the methods, Van de Vonder et al. [65] presented robustness, and more precisely, proactive heuristic methods for robust project scheduling. According to Al-Fawzan and Haouari [64], robustness of a schedule means that its validity is maintained despite small changes in the duration of processes (activities) and these changes are due to risks. The development of robust methods is described by Bertsimas and Sim [62]. Predictive scheduling with a proactive approach is about creating schedules that are robust to disturbances (hence the name—robust schedules).
Markov Dynamic PERT ModelAzaron and Ghomi [39]Refinement of project time duration uncertainty bounds; this approach estimates the influence of factors such as war, strikes and inflation that make activity durations non-static over time. This is an untested model, but it combines externalities, deterministic CPM, PERT and correlation in an interesting way.
Correlated Schedule Risk Analysis Model (CSRAM)Ökmen and Öztaş [68]CSRAM accounts for covariance and correlation effects with PERT and CPM; it uses simple subjective inputs for a number of project risks, including weather factors, soil conditions, labour productivity and material/resource availability. However, CSRAM does not address the key problem of subjectivity and opinion-based analysis, a factor commonly associated with contract disputes [69,70]. Furthermore, there is a lack of empirical evidence that this technique is scalable and works across different types of projects.
Table 2. Different stages of the Fort Bema investment process grouped in eight phases.
Activities/Phases/StagesAbbreviationExecution Time in Months
Opportunity studyOS2
Participation in local spatial development plan approvals PLSDPA11
Conceptual stageCONCS6
Pre-feasibility studyPFS1
Implementation planning stage—phase IIPSP13
Implementation planning stage—phase IIIPSP25
Arrangements stage and execution of construction documentationASECD81
Developing a detailed investment management mapDDIMM6
The stage of obtaining and securing financing (feasibility study)SOSF6
The stage of executing executive documentationSEED69
Stage of selecting general contractor(s) and verification of executive documentationSSGCVED69
Project implementation stagePIS93
Commissioning stageCOMMS16
Evaluation stage of obtaining results and effects of the project (1st phase of project closing)ESOREP1
Phase of drawing up proposals for future implementation after Project Closure Phase IPDPFIPCP11
Initial operation stage (usually 3 years of warranty and guarantee)IOS102
The stage of final evaluation of the results and effects of the project (II stage of project closing)SFEREP21
Phase of drawing up proposals for future implementation after Phase II of the project closurePCPFIPCP2 II1
Table 3. Case of “Parkowo-Leśne” estate complex project: Types of precedence between individual stages of the project.
N12345678910111213141516
Finish–start (FS) type of precedenceNA1NA2, 345NANANA9NA9NA12NANA
Start–start (SS) type of precedenceNANA2NANANA66,78NA10NA12NA1413
Finish–finish (FF) type of precedenceNANANANANANANANANANANANANANANA15
Start–finish (SF) type of precedenceNANANANANANANANANANANANANANANANA
Durations211613581666969931611102
Table 4. Different scenarios reflected in time schedules.
Time-at-Risk (TaR) (in Quantiles)Scenario AScenario B 1Scenario C 2
99% quantile6.358666.776386.15269
95% quantile4.477525.120264.40843
1 Shift in stages: ASECD/seven stage/(three quarters) and SSGCVED/11 stage/(four quarters). 2 Each of the following phases: SEED/10 stage/, SSGCVED/11 stage/, COMMS/13 stage/, and IOS/16 stage/started one quarter earlier and ended earlier.
Publisher’s Note: MDPI stays neutral with regard to jurisdictional claims in published maps and institutional affiliations.

