
Influence of the Weld Joint Position on the Mechanical Stress Concentration in the Construction of the Alternative Skid Car System’s Skid Chassis


Abstract
:1. Introduction
2. Materials and Methods
Load Determination on the ASC Frame Arms
3. Results
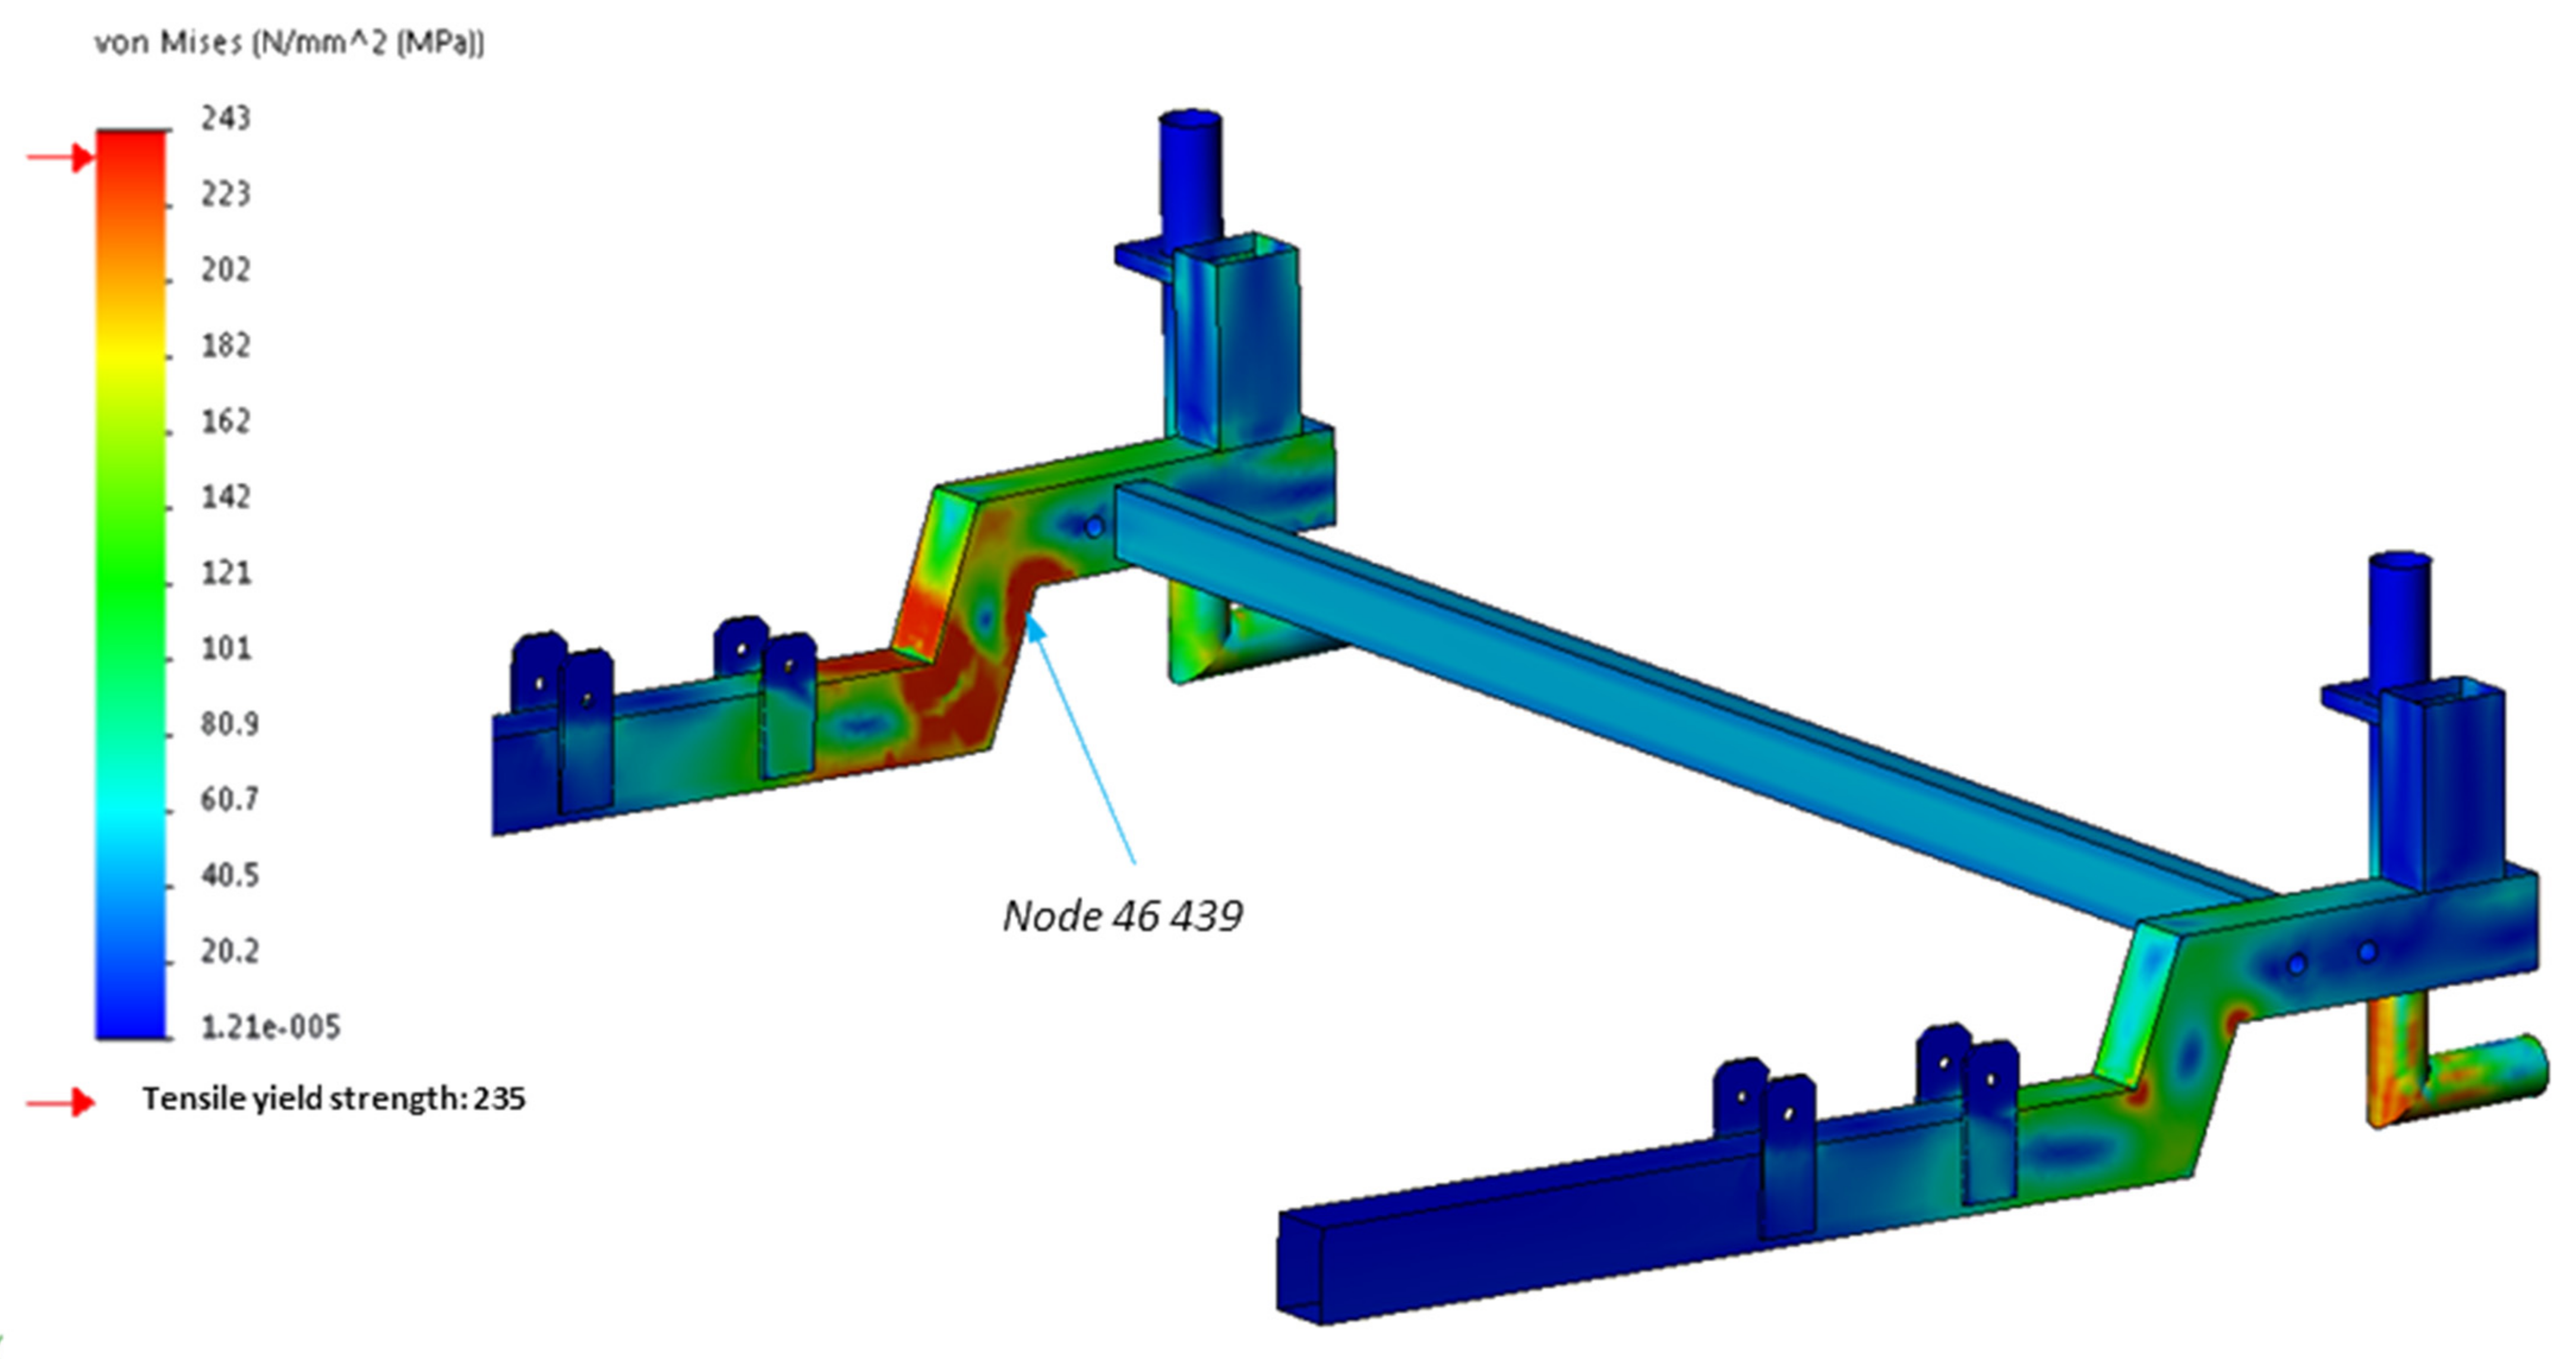
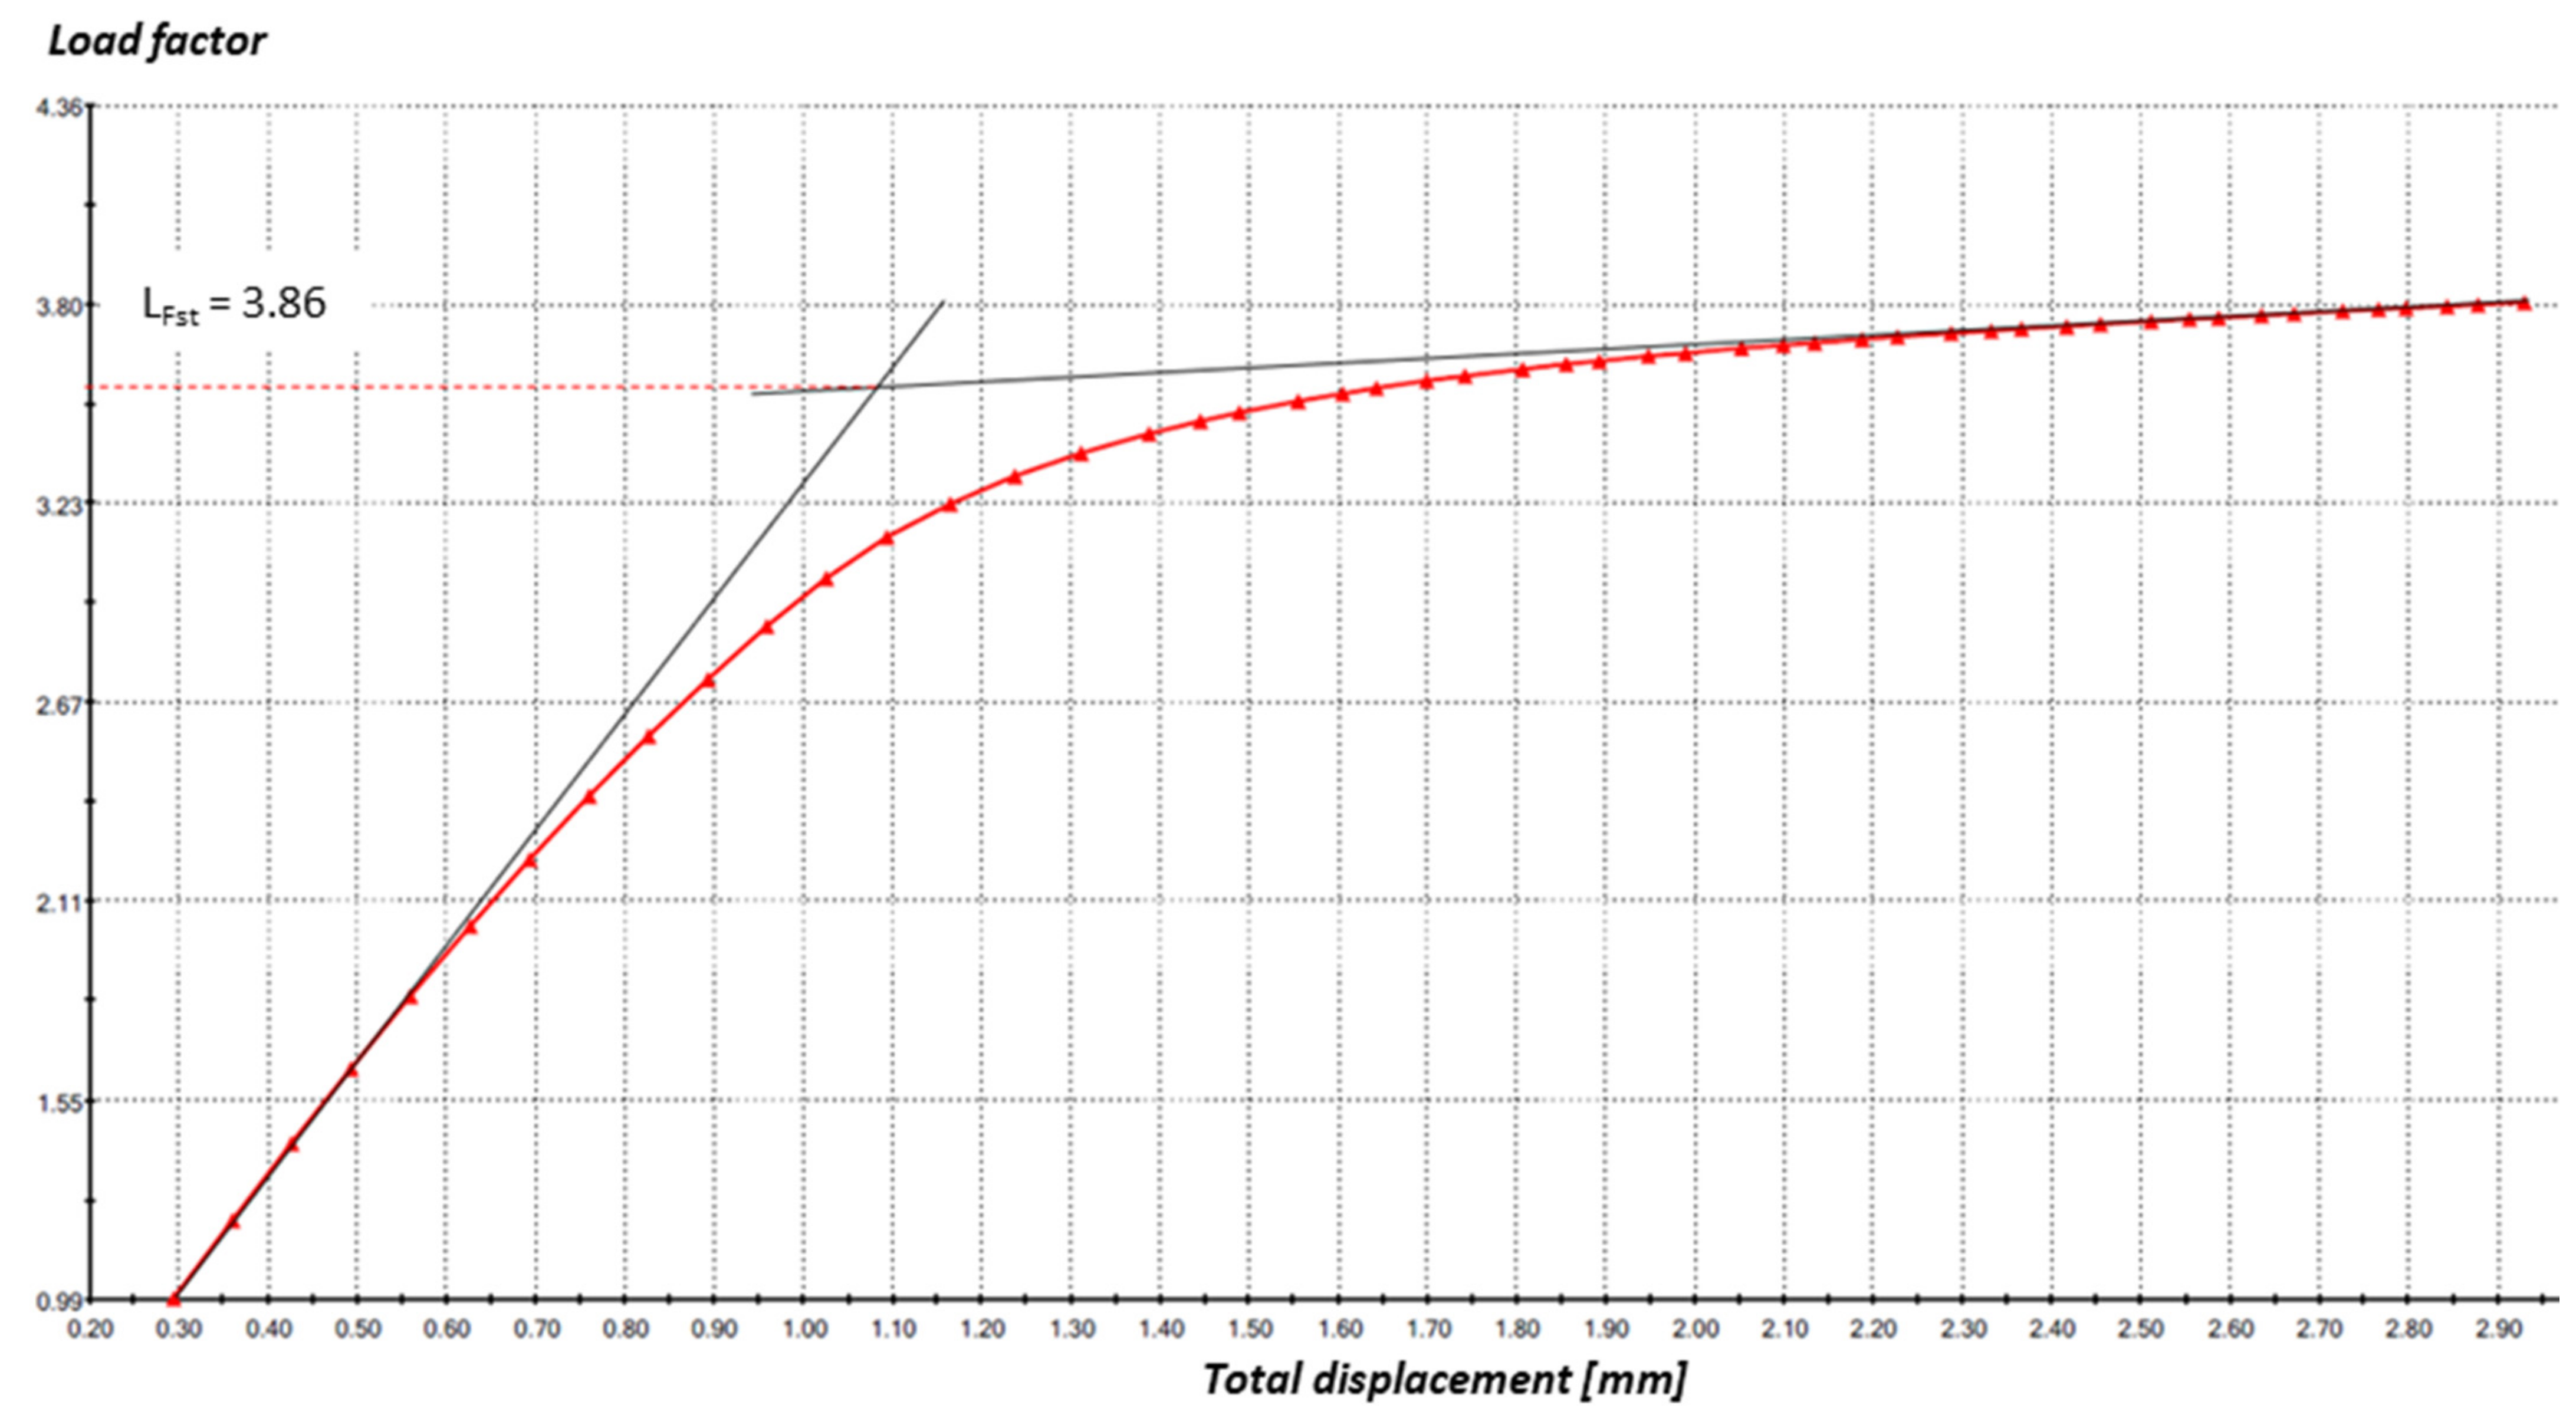
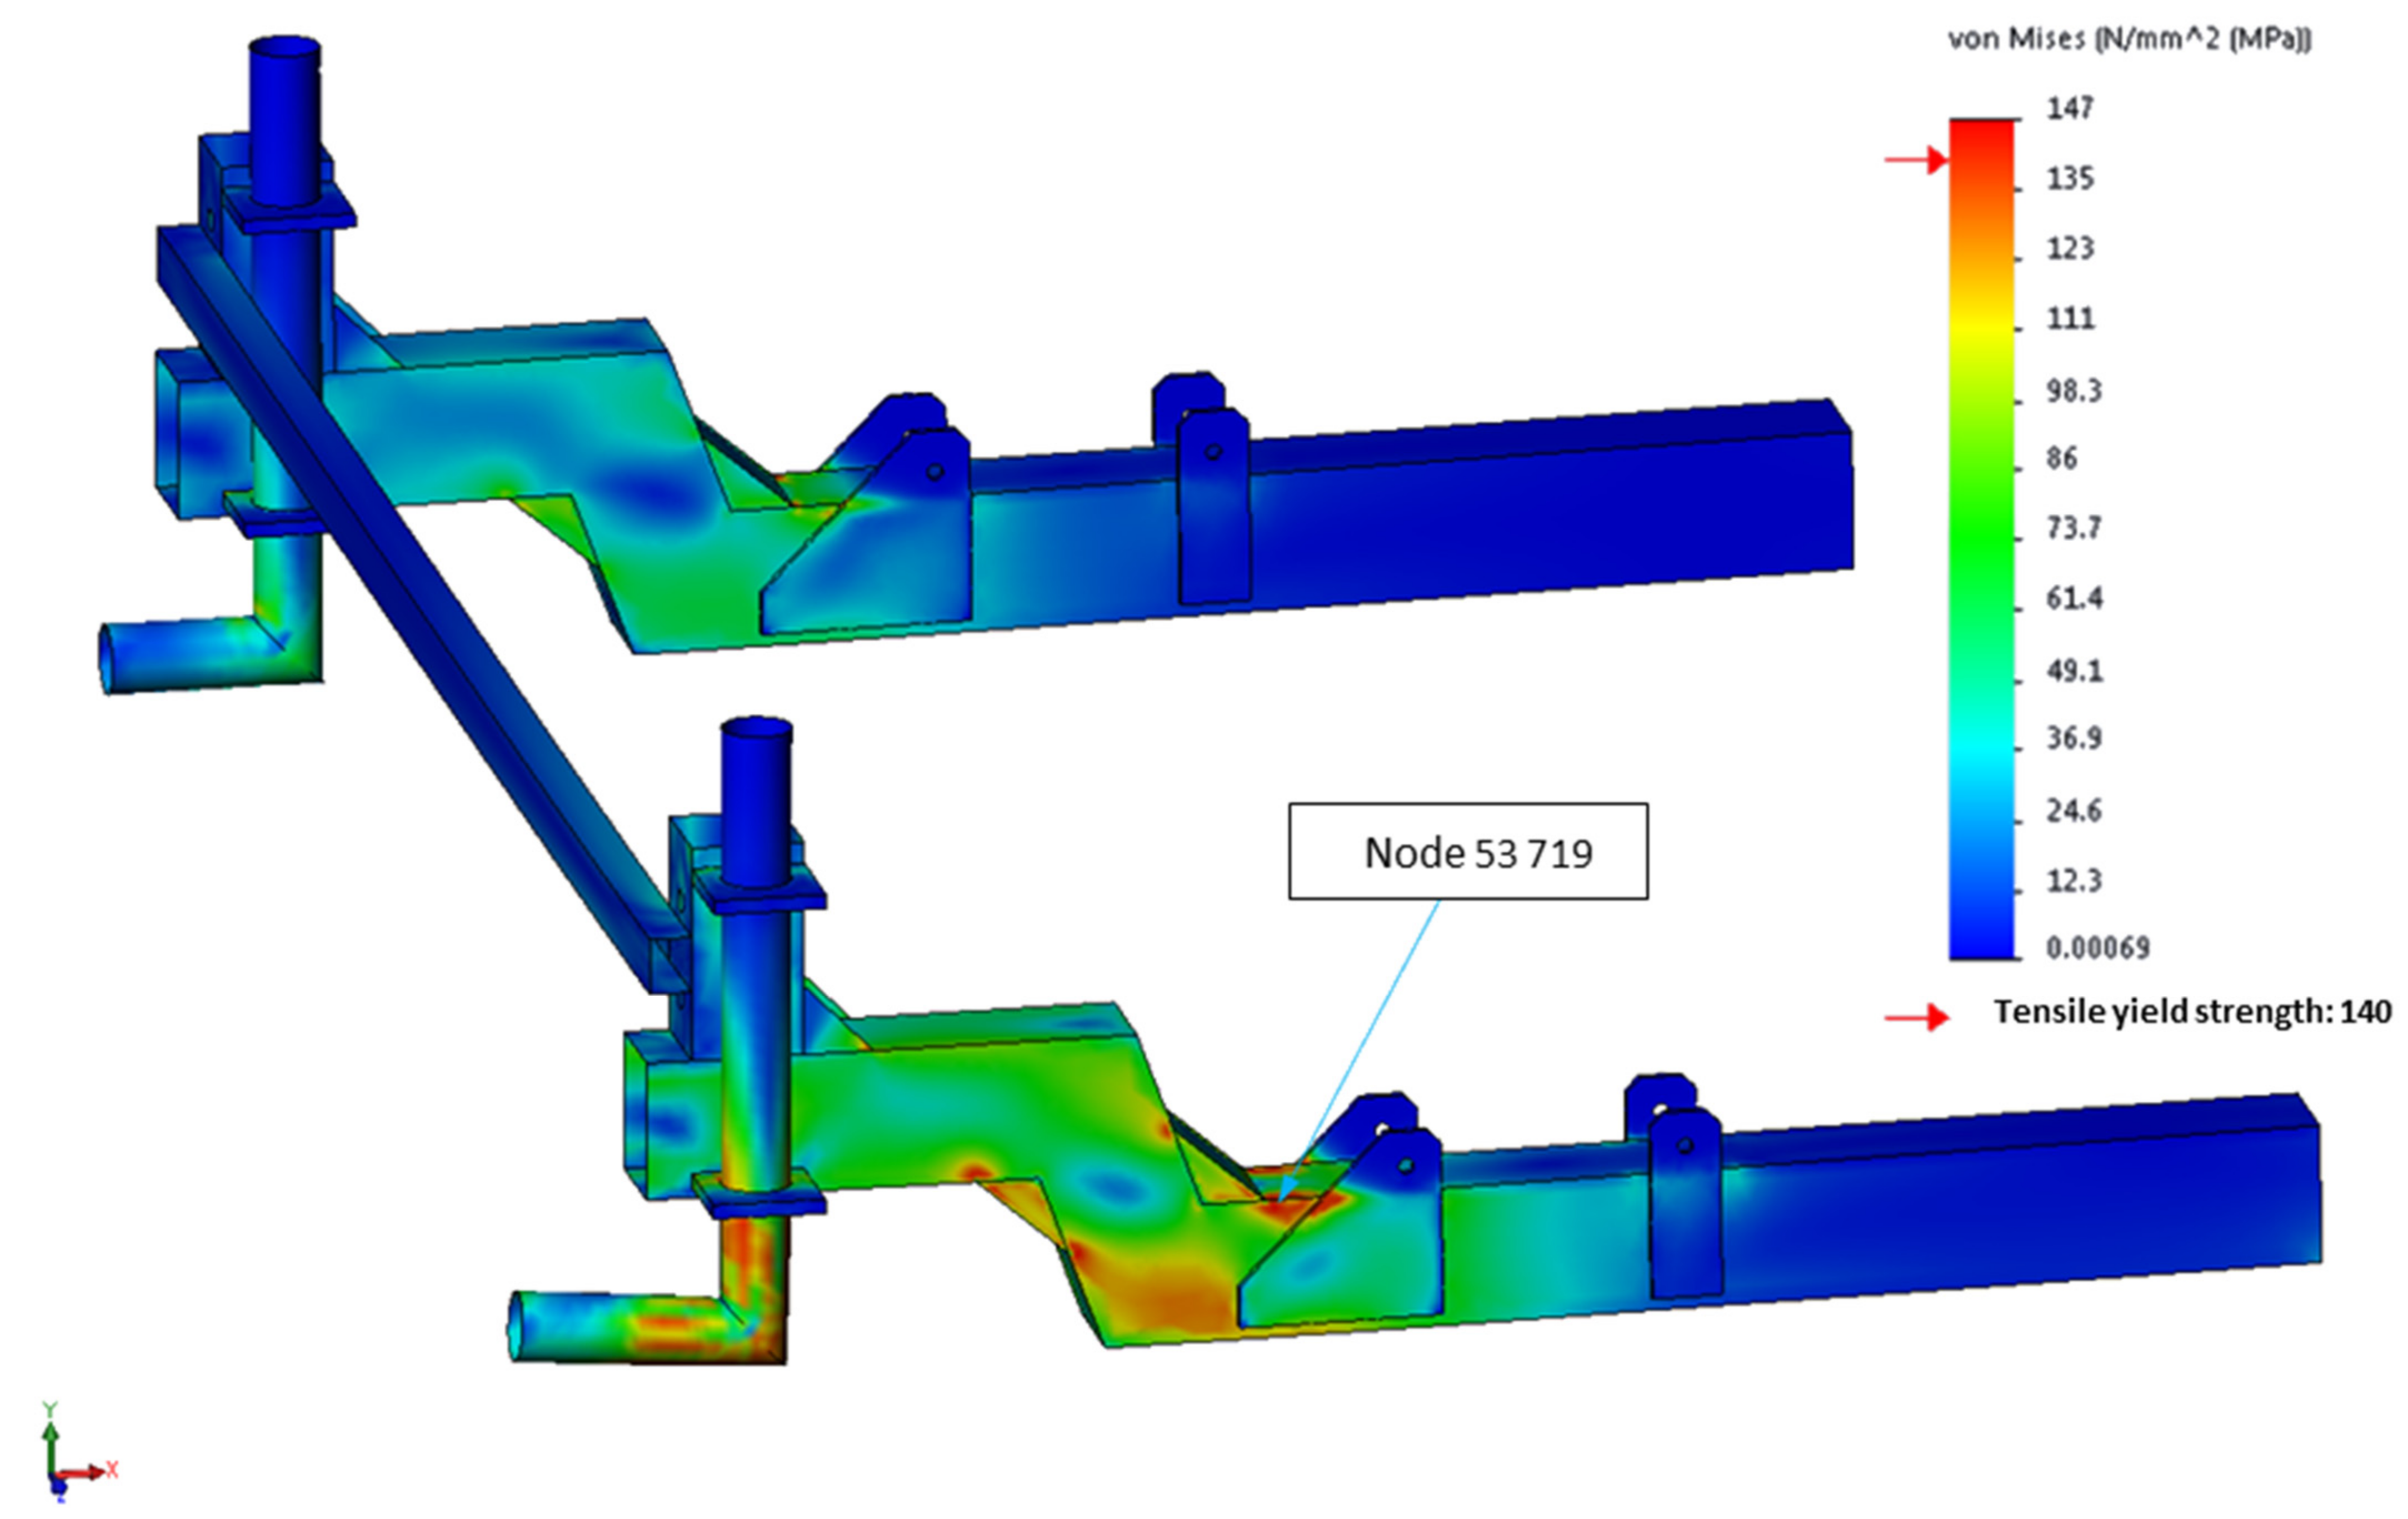
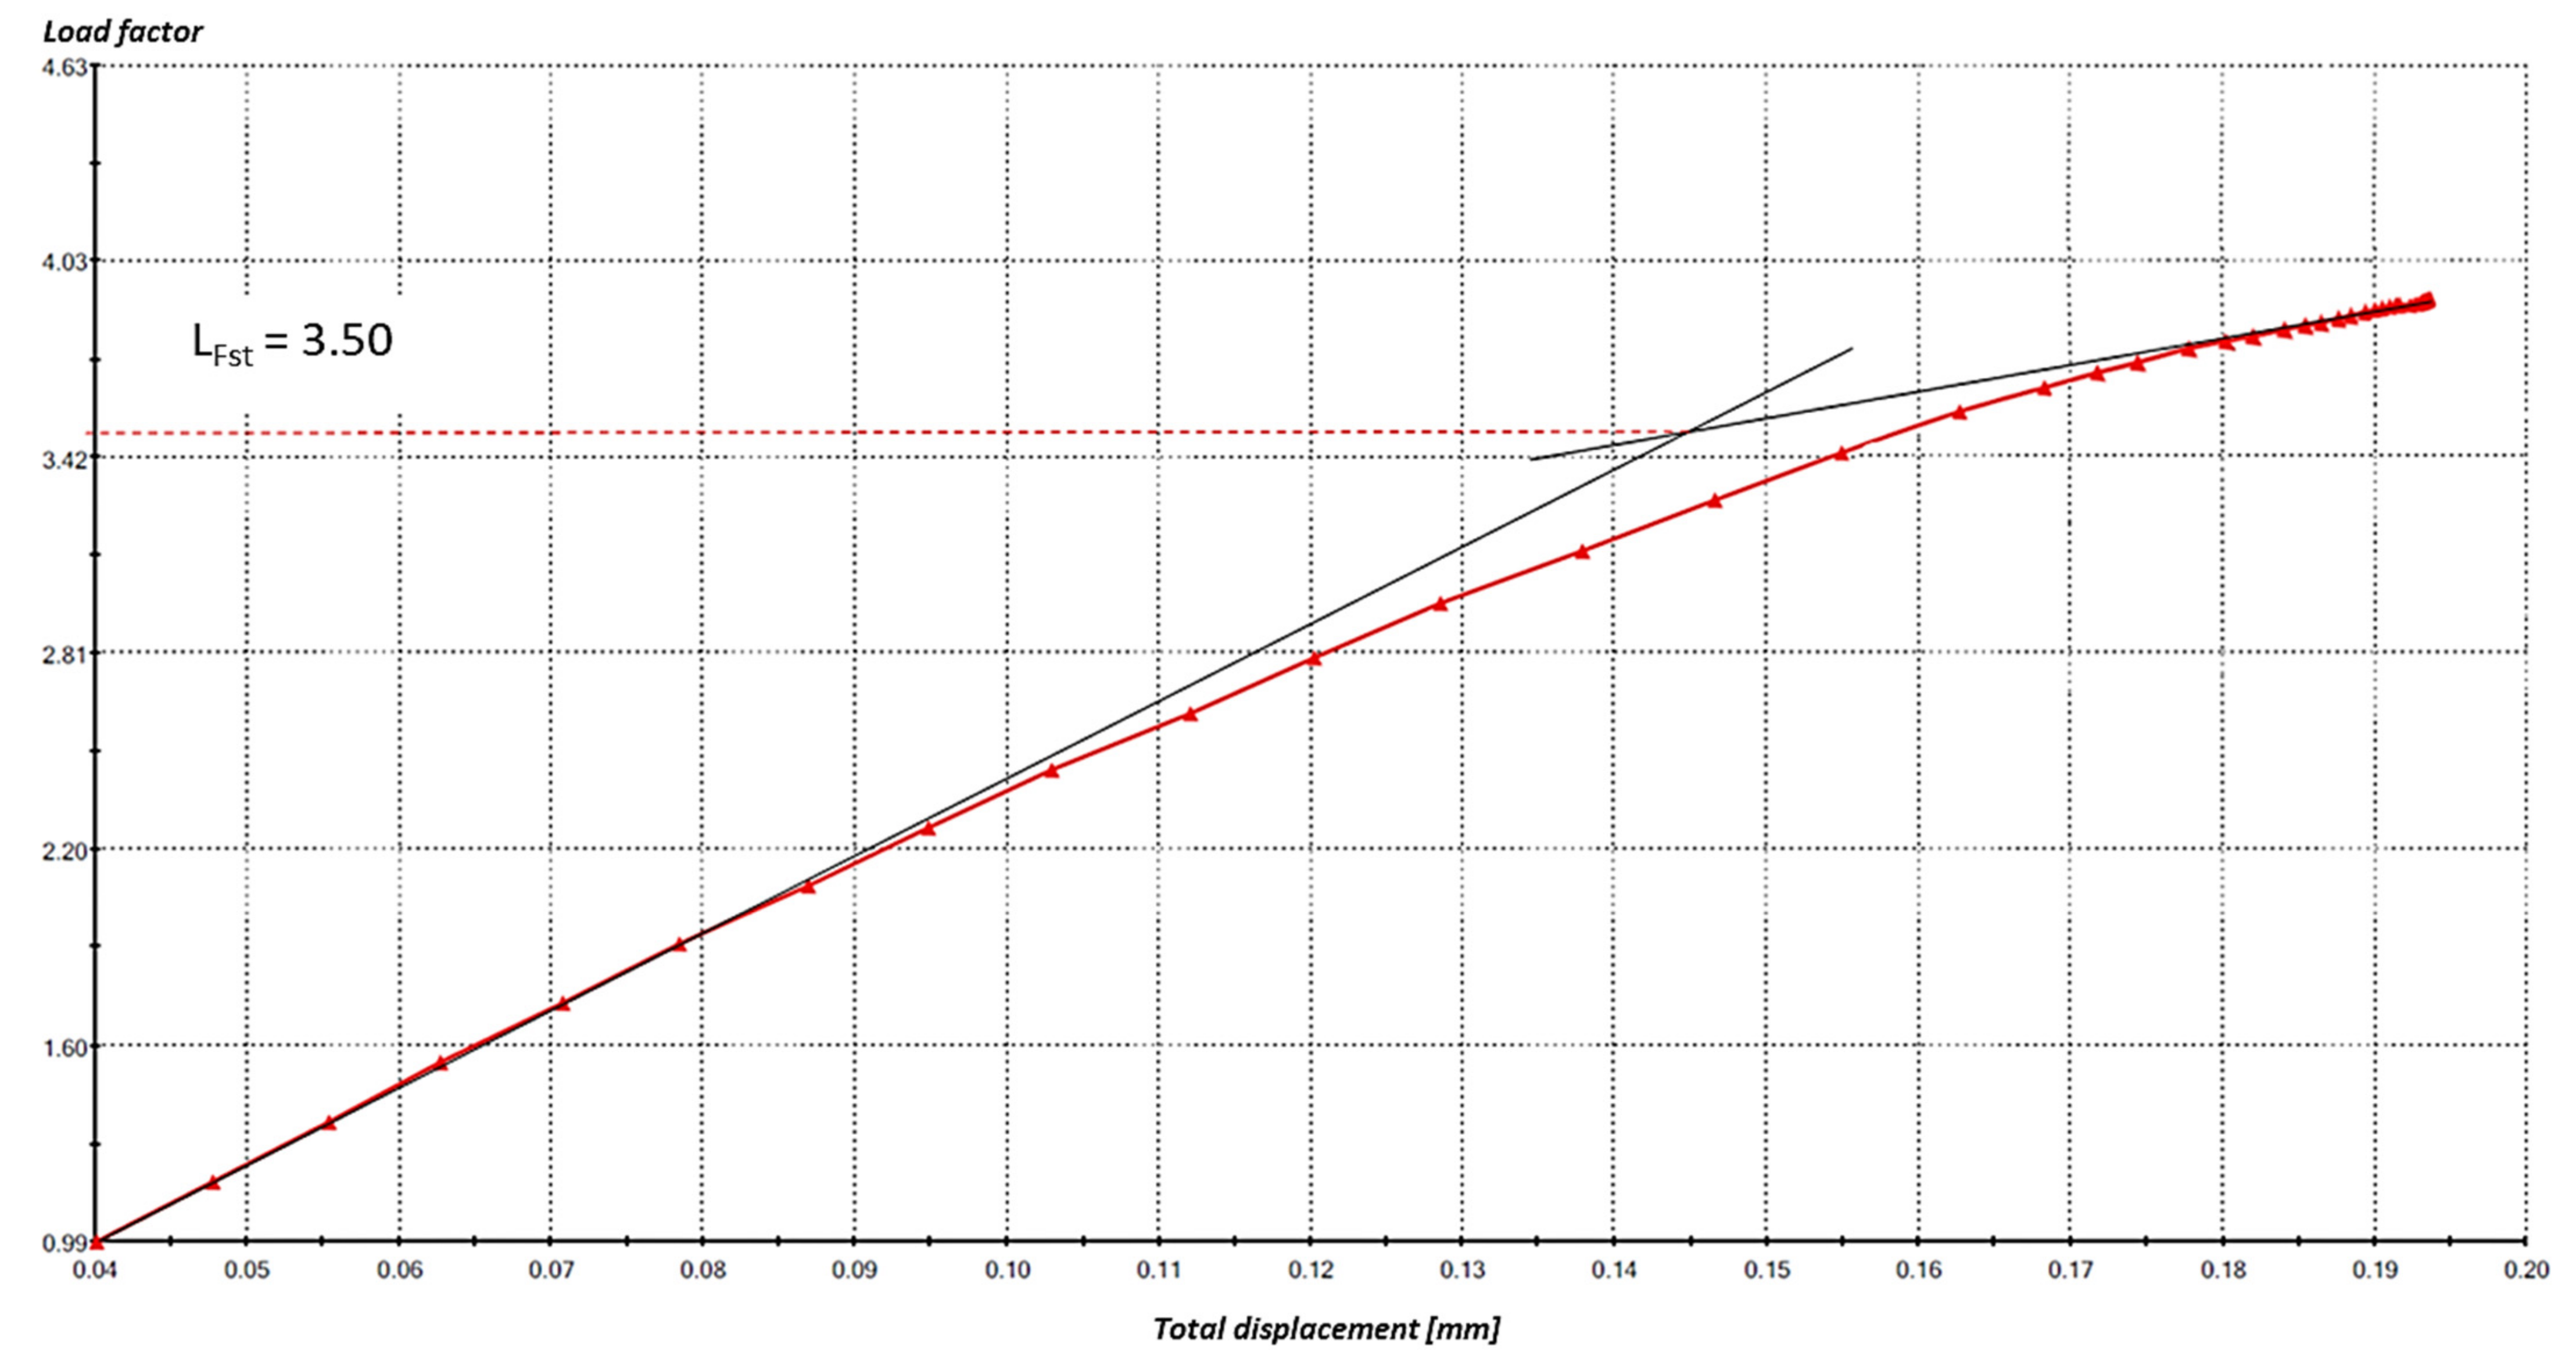
3.1. Strength Study of the Original Design of the ASC Crossbar
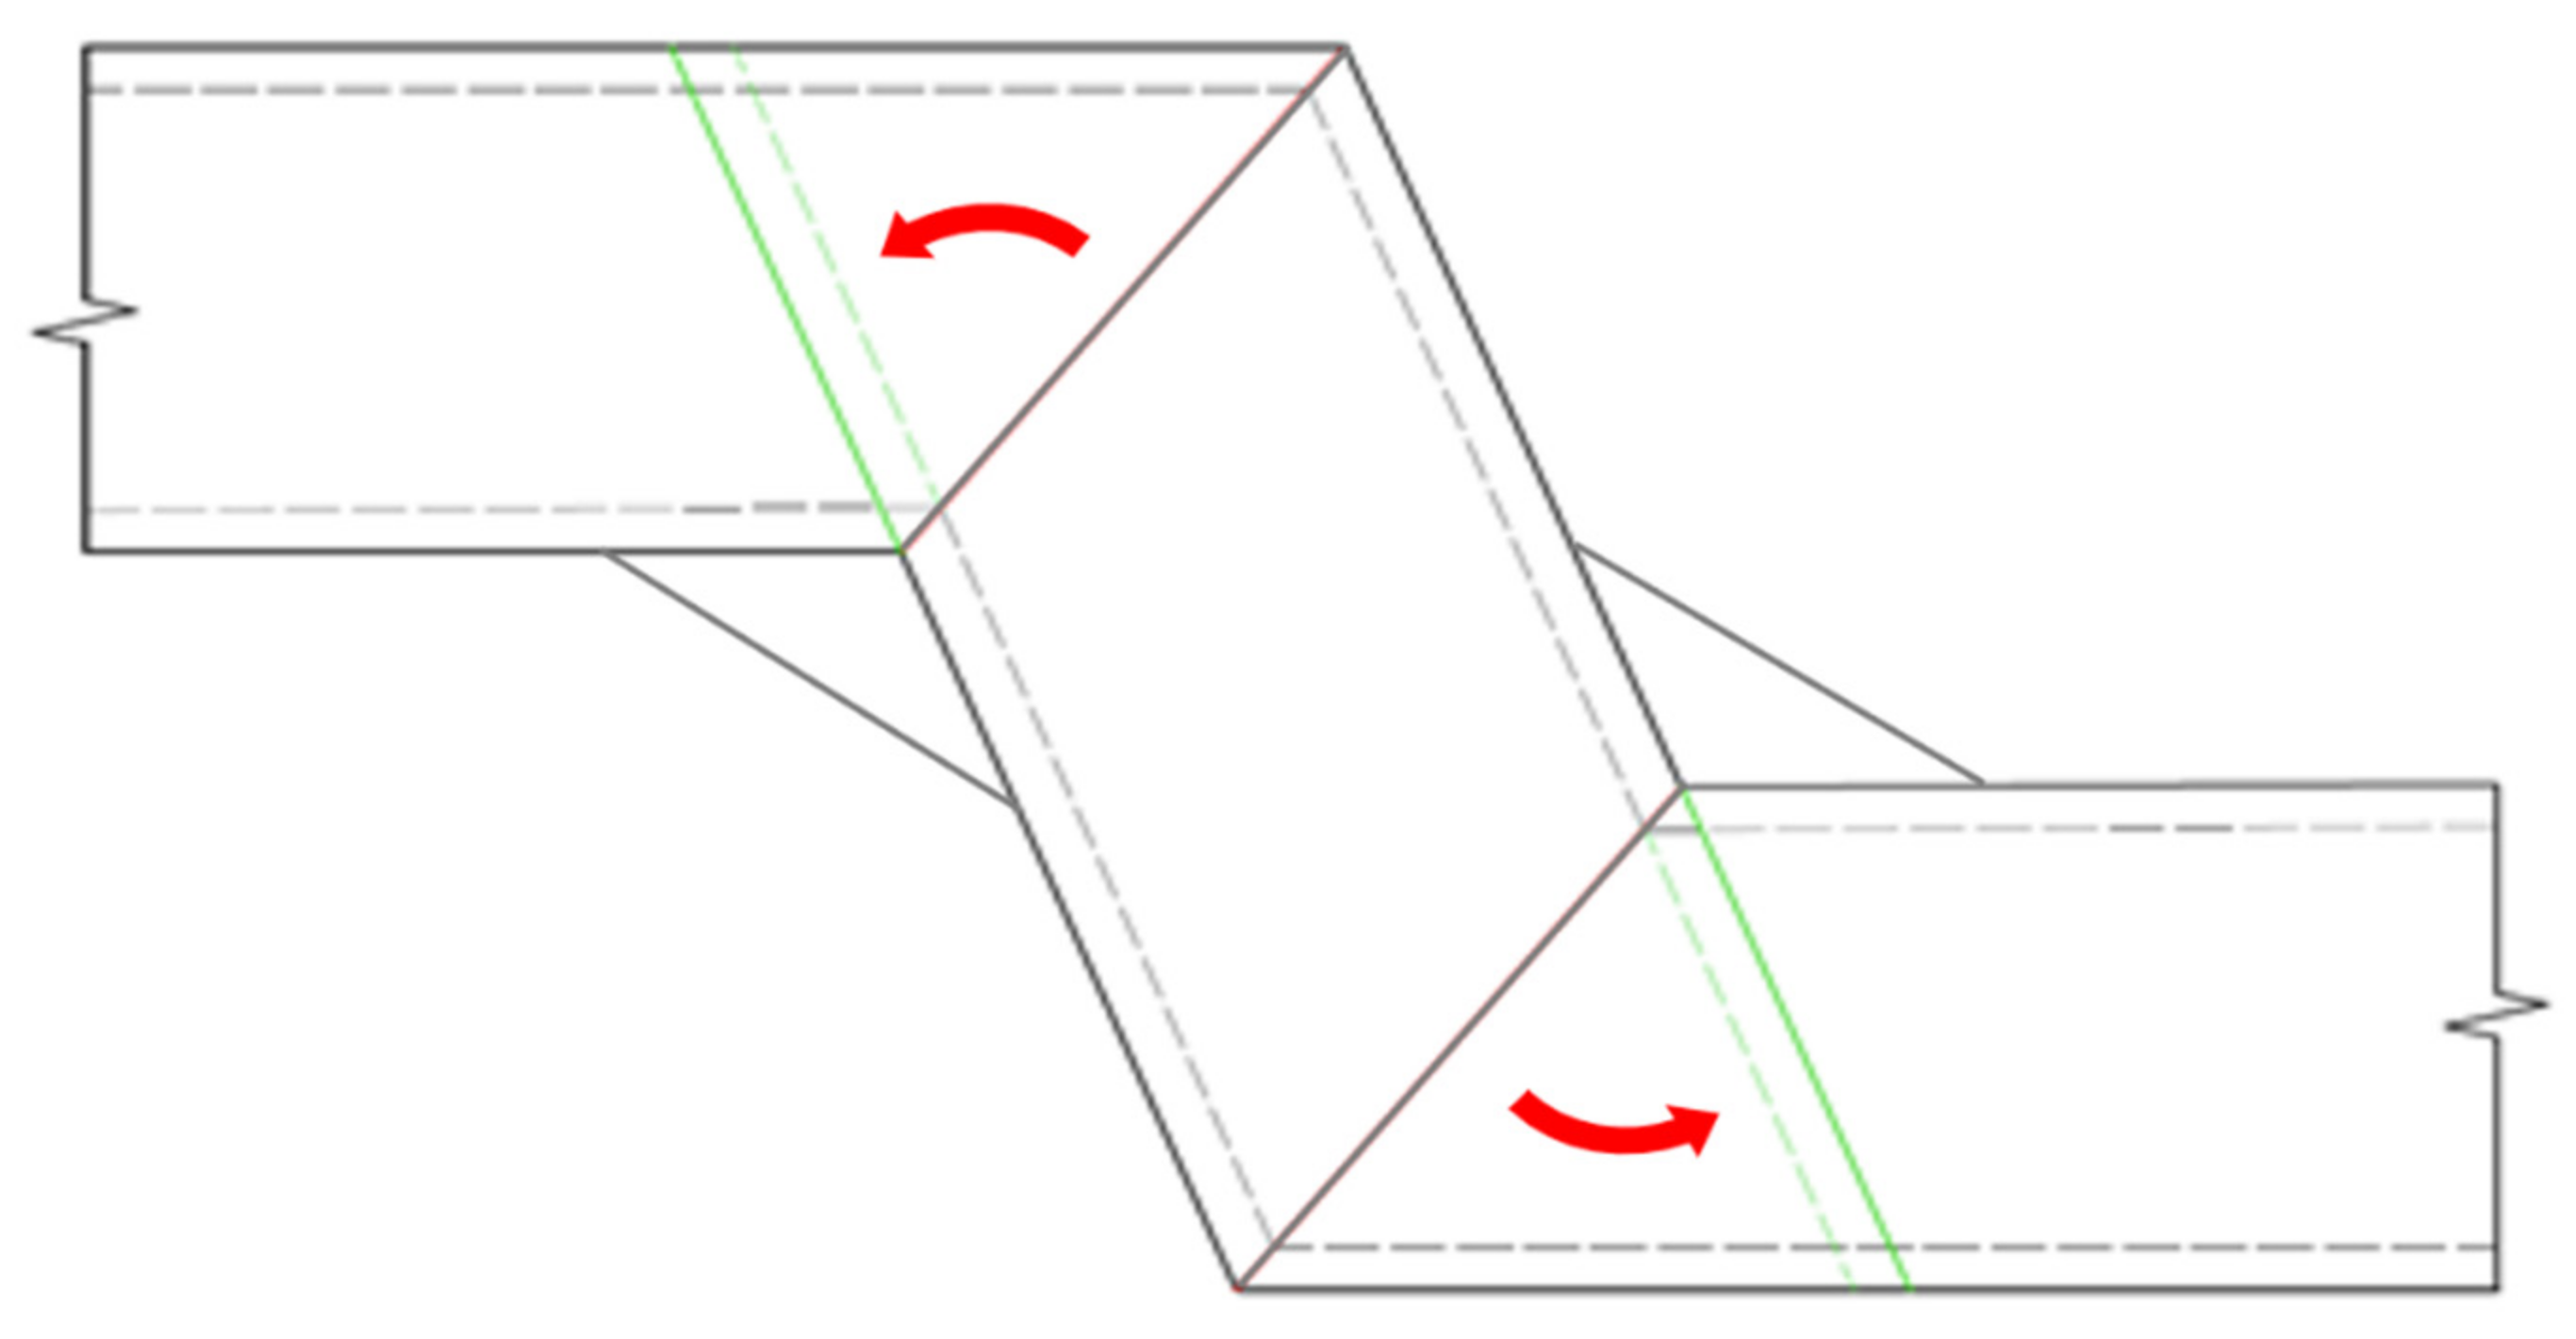
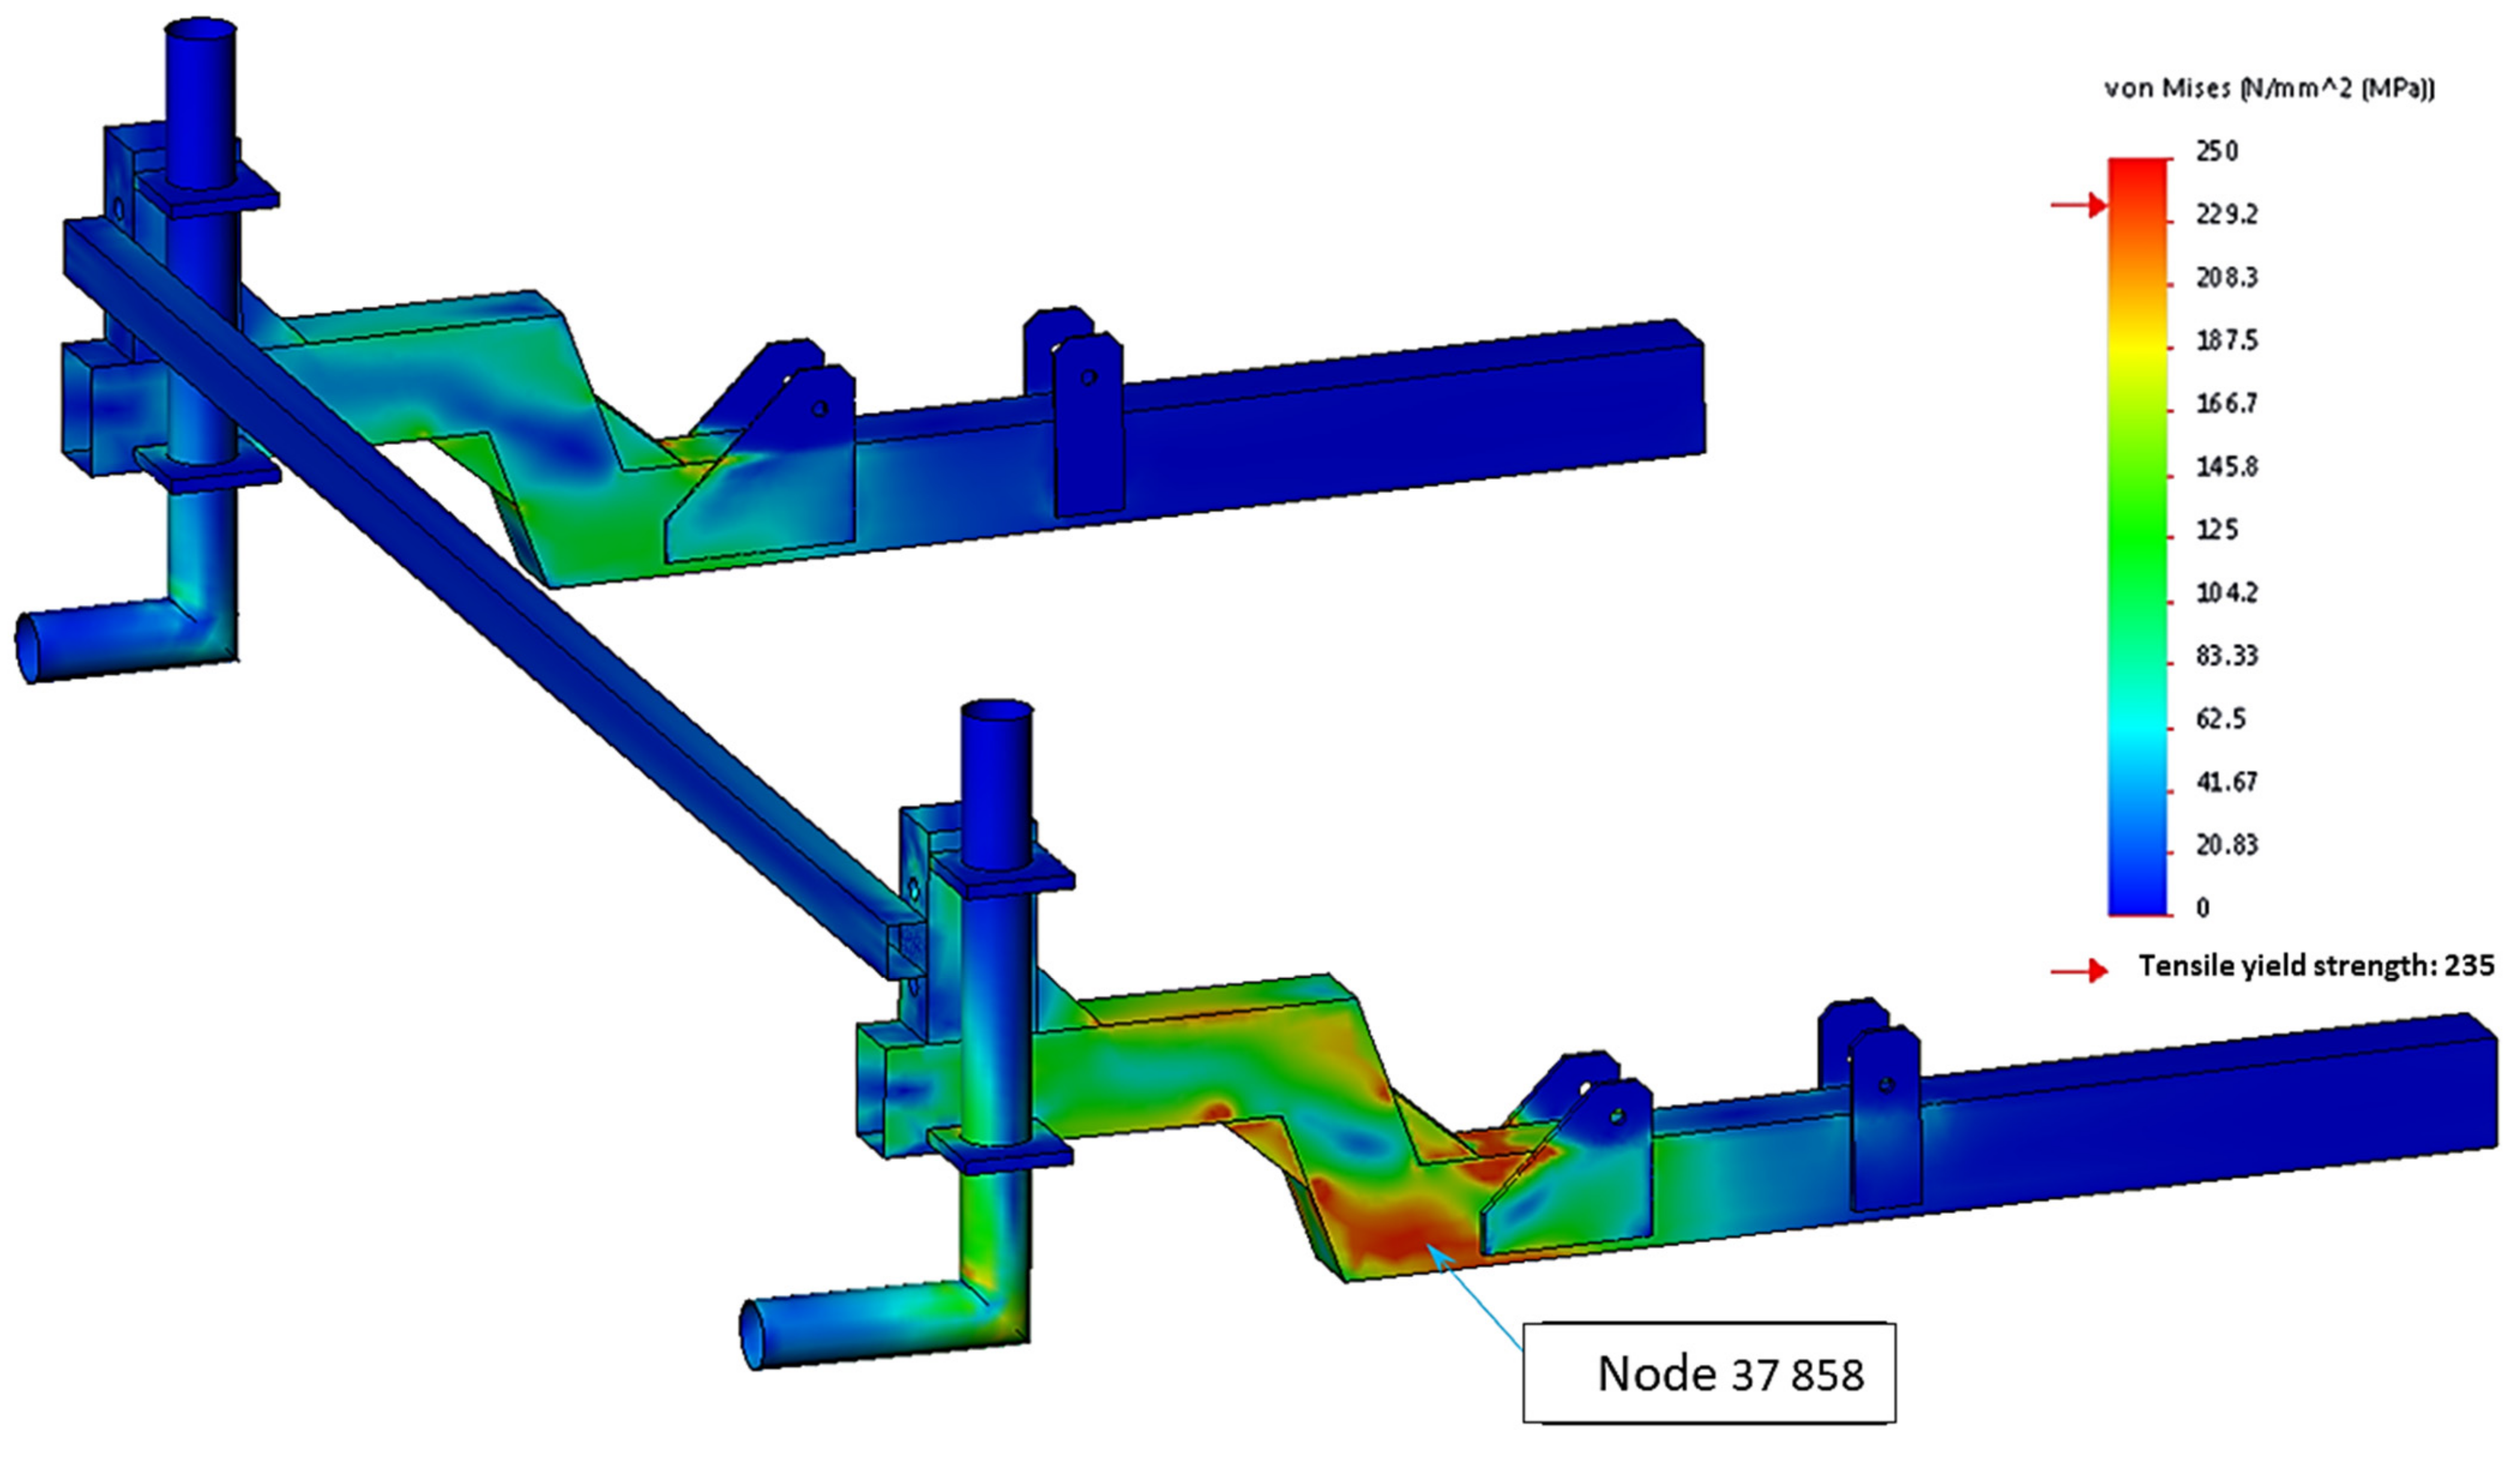
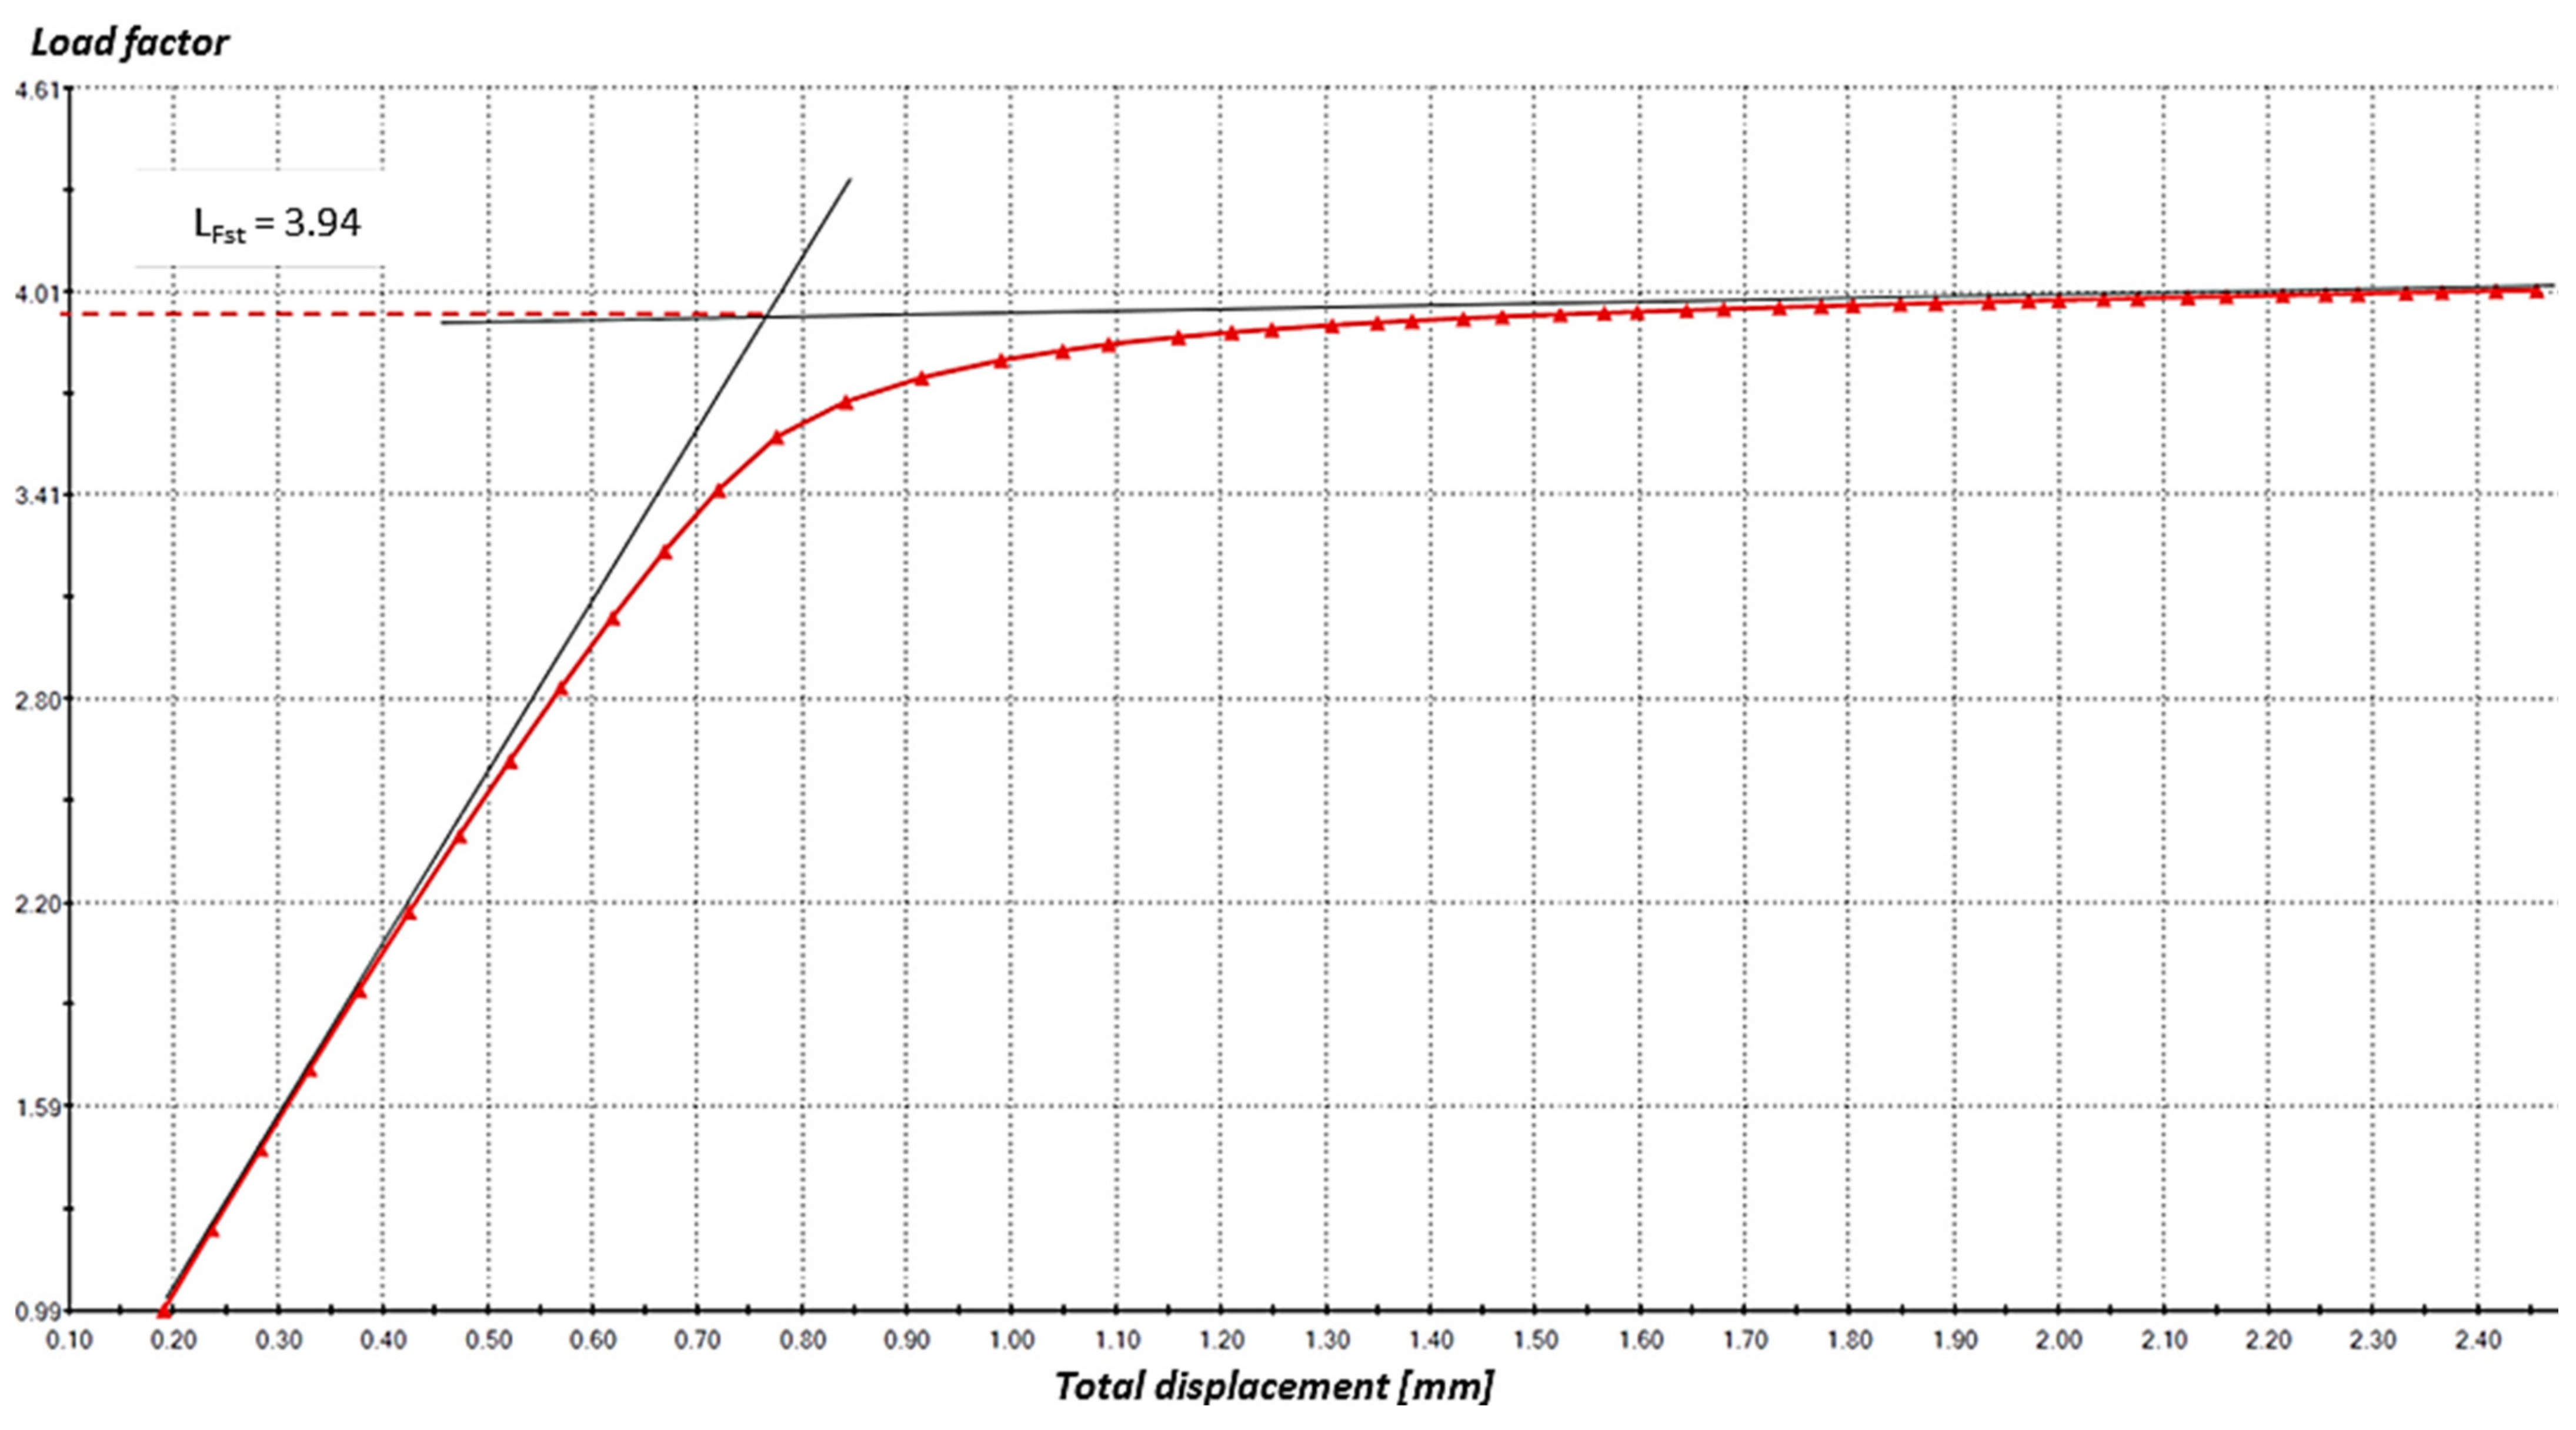
3.2. Optimization of the ASC Frame Crossbar
3.3. Optimization of the Material Used
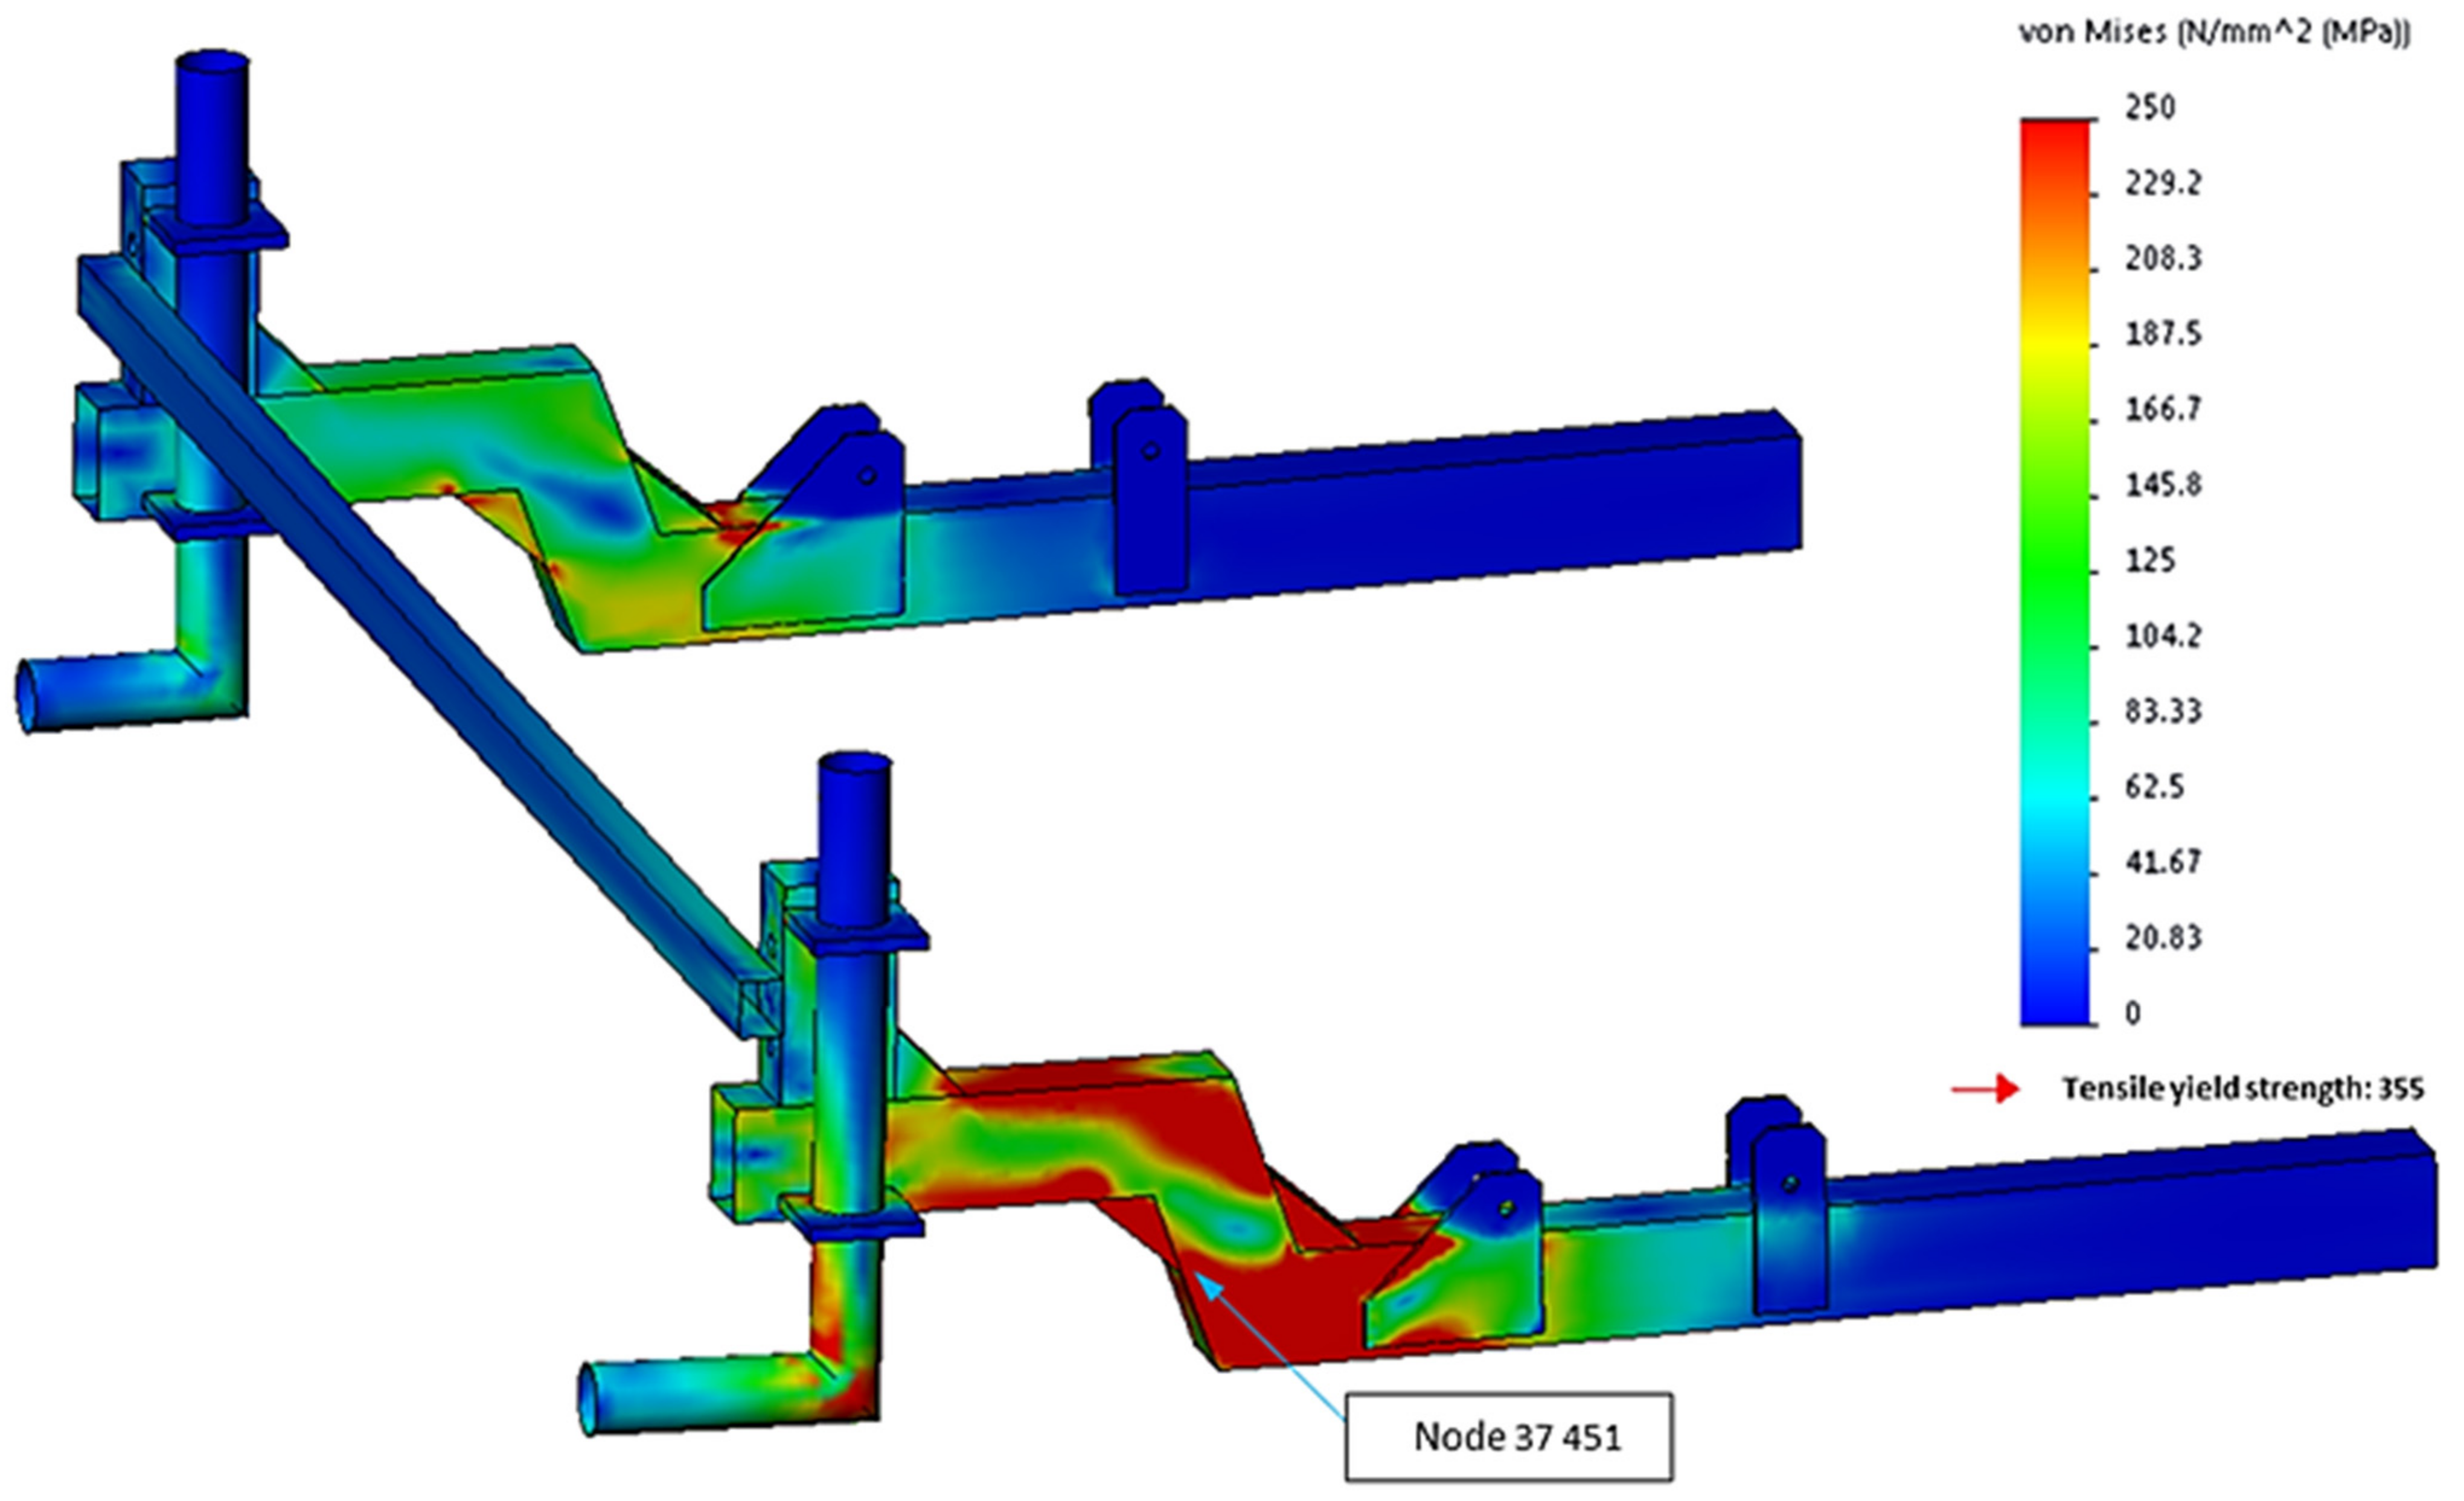
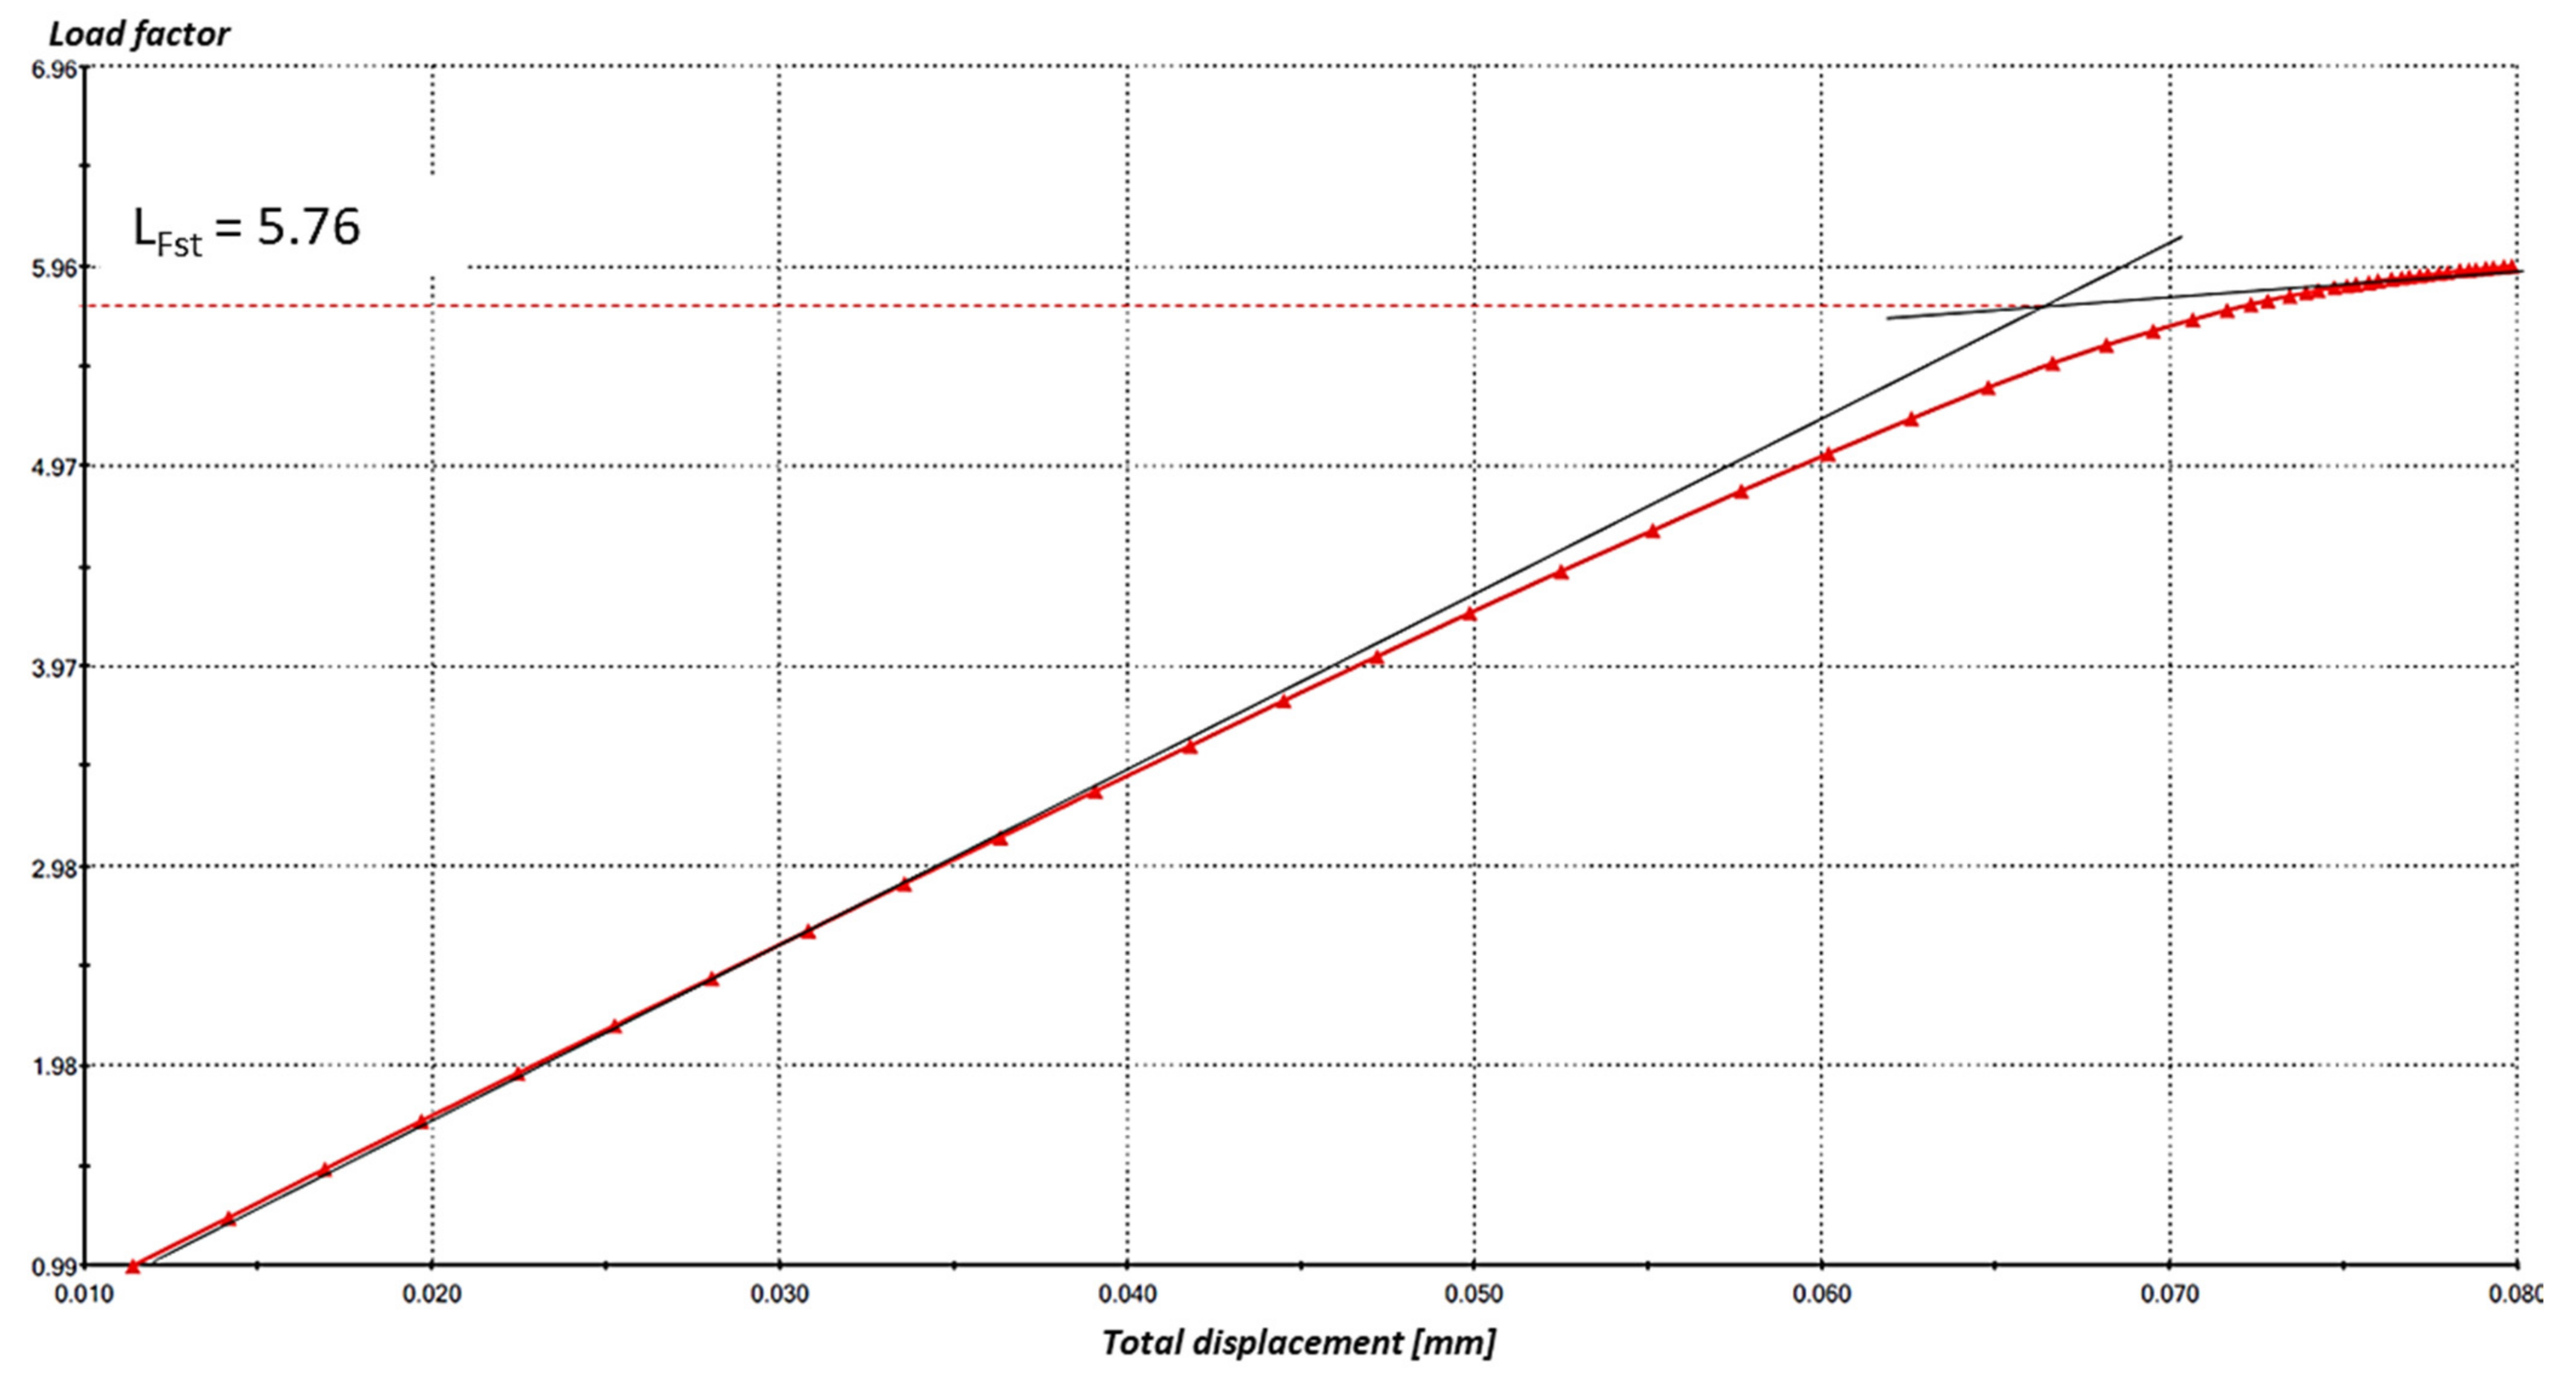
3.3.1. Steel S355J0
3.3.2. Aluminium Alloy EN AW-6060 T6
4. Discussion
5. Conclusions
- Weight reduction of the frame;
- A more uniform distribution of stress in the area of concentration;
- Increase the stiffness of the entire frame;
- Improve the stability of the frame.
- According to the [35] standard applied, all proposed optimization solutions are compliant in terms of strength—the design-modified frame using the original material, the steel of higher strength and the aluminium alloy;
- Significant weight savings have been recorded;
- The functionality and compatibility of the frame with the experimental car have not been limited or affected.
- The subject of further examination can be the evaluation of the fatigue and durability of the frame, detailed modeling and evaluation of the notches and welds of the structure;
- It would also be advisable to design a frame for composite material;
- The created model can be further developed, for example, by using a different type of SC wheel, considering the flexible behavior of the material or changing parameters for the use of the alternative SkidCar system on different cars;
- It would also be possible to build up a model of a car with an alternative SkidCar system that overcomes road irregularities, and feed this force impulse into the FEM analyses. Furthermore, it would be appropriate to deal with the dynamic analyses of the system.
Author Contributions
Funding
Institutional Review Board Statement
Informed Consent Statement
Data Availability Statement
Conflicts of Interest
References
- Li, X.; Oviedo-Trespalacios, O.; Rakotonirainy, A.; Ya, X. Collision risk management of cognitively distracted drivers in a car-following situation. Transp. Res. Part F Traffic Psychol. Behav. 2019, 60, 288–298. [Google Scholar] [CrossRef]
- Yoon, Y.; Kim, A. Resolving Persistent Packet Collisions through Broadcast Feedback in Cellular V2X Communication. Future Internet 2021, 13, 211. [Google Scholar] [CrossRef]
- Prochowski, L.; Ziubiński, M.; Szwajkowski, P.; Gidlewski, M.; Pusty, T.; Stańczyk, T.L. Impact of Control System Model Parameters on the Obstacle Avoidance by an Autonomous Car-Trailer Unit: Research Results. Energies 2021, 14, 2958. [Google Scholar] [CrossRef]
- Ameen, H.A.; Mahamad, A.K.; Saon, S.; Malik, R.S.; Kareem, Z.H.; Bin Ahmadon, M.A.; Yamaguchi, S. Identification of Driving Safety Profiles in Vehicle to Vehicle Communication System Based on Vehicle OBD Information. Information 2021, 12, 194. [Google Scholar] [CrossRef]
- Maldonado, J.; Giefer, L.A. A Comparison of Bottom-Up Models for Spatial Saliency Predictions in Autonomous Driving. Sensors 2021, 21, 6825. [Google Scholar] [CrossRef]
- Choi, Y.; Lee, W.; Kim, J.; Yoo, J. A Variable-Sampling Time Model Predictive Control Algorithm for Improving Path-Tracking Performance of a Vehicle. Sensors 2021, 21, 6845. [Google Scholar] [CrossRef]
- Ma, H.; Chu, L.; Guo, J.; Wang, J.; Guo, C. Cooperative Adaptive Cruise Control Strategy Optimization for Electric Vehicles Based on SA-PSO With Model Predictive Control. IEEE Access 2020, 8, 225745–225756. [Google Scholar] [CrossRef]
- Taherian, S.; Halder, K.; Dixit, S.; Fallah, S. Autonomous Collision Avoidance Using MPC with LQR-Based Weight Transformation. Sensors 2021, 21, 4296. [Google Scholar] [CrossRef]
- Dendaluce, M.; Iglesias, I.; Martin, A.; Prieto, P.; Pena, A. Race-track testing of a torque vectoring algorithm on a motor-in-wheel car using a model-based methodology with a HiL and multibody simulator setup. In Proceedings of the 2016 IEEE 19th International Conference on Intelligent Transportation Systems (ITSC), Rio de Janeiro, Brazil, 1–4 November 2016; pp. 2500–2505, ISBN 978-1-5090-1889-5.5. [Google Scholar] [CrossRef]
- Koylu, H.; Cinar, A. Experimental design of control strategy based on brake pressure changes on wet and slippery surfaces of rough road for variable damper setting during braking with activated anti-lock brake system. Proc. Inst. Mech. Eng. Part D J. Automob. Eng. 2012, 226, 1303–1324. [Google Scholar] [CrossRef]
- Jang, J. Wheel Slip-based Road Surface Slipperiness Detection. Open Transp. J. 2020, 14, 186–193. [Google Scholar] [CrossRef]
- Synák, F.; Kučera, M.; Skrúcaný, T. Assessing the Energy Efficiency of an Electric Car. Communications. Sci. Lett. Univ. Zilina 2021, 23, A1–A13. [Google Scholar]
- Jilek, P.; Němec, J. System for Changing Adhesion Conditions in Experimental Road Vehicle. Int. J. Automot. Technol. 2021, 22, 779–785. [Google Scholar] [CrossRef]
- Jilek, P.; Krmela, J.; Berg, J. Modification of the adhesive force by changing the radial reaction on vehicle wheels. Transp. Probl. 2021, 16, 179–186. [Google Scholar] [CrossRef]
- Jilek, P.; Šefčík, I.; Verner, J. Reducing the Adhesion Force of the Wheels of the Road Vehicles; Engineering Mechanics: Svratka, Czech Republic, 2019; pp. 173–176. [Google Scholar] [CrossRef] [Green Version]
- Barton, D.C.; Fieldhouse, J.D. Vehicle Structures and Materials. Barton, David C a John D Fieldhouse. In Automotive Chassis Engineering; Springer International Publishing: Cham, Switzerland, 2018; pp. 215–254. ISBN 978-3-319-72436-2. [Google Scholar] [CrossRef]
- Marek, V.; Čupera, J. Data Mining of Vehicle Control Units. In Proceedings of International PhD Students Conference; Faculty of AgriSciences Mendel University in Brno: Brno, Czech Republic, 2016; Volume 23, pp. 944–948. [Google Scholar]
- Ryazantsev, V.; Balabin, I.; Balsam, A. Improvement of the active safety of the vehicle for driving on the irregularities by the method of control of vertical reactions on wheels. In Proceedings of the IOP Conference Series: Materials Science and Engineering, Chennai, India, 5–9 October 2020; pp. 141–148. [Google Scholar]
- Qureshi, K. Robust Controller Design for Active Trailer Steering Systems of Articulated Vehicles Using Multi-objective Optimization. Master’s Thesis, University of Ontario Institute of Technology, Oshawa, ON, Canada, 2019. [Google Scholar]
- Kharrazi, S.; Lidberg, M.; Fredriksson, J. A generic controller for improving lateral performance of heavy vehicle combinations. In Proceedings of the Institution of Mechanical Engineers. Part D J. Automob. Eng. 2013, 227, 619–642. [Google Scholar] [CrossRef]
- He, Y.; Ren, J. A comparative study of car-trailer dynamics models. SAE Int. J. Passeng. Cars–Mech. Syst. 2013, 6, 177–186. [Google Scholar] [CrossRef]
- Onat, A.; Voltr, P. Particle swarm optimization based parametrization of adhesion and creep force models for simulation and modelling of railway vehicle systems with traction. Simul. Model. Pract. Theory 2020, 99, 102026. [Google Scholar] [CrossRef]
- Sikder, T. Design of Active Trailer Steering Systems for Long Combination Vehicles Using Robust Control Techniques. Master’s thesis, University of Ontario Institute of technology, Automotive Engineering, Oshawa, ON, Canada, 2017. [Google Scholar]
- Caban, J.; Turski, A.; Nieoczym, A.; Tarkowski, S.; Jereb, B. Impact of specific factors on the state of the tire pressure value. Arch. Automot. Eng.–Arch. Motoryz. 2019, 85, 137–148. [Google Scholar] [CrossRef]
- Sun, T.; He, Y. Phase-Plane Analysis for Evaluating the Lateral Stability of Articulated Vehicles. SAE Tech. Pap. 2015, 8, 63–73. [Google Scholar] [CrossRef]
- Cheng, S.; Chen-Feng, L.; Xiang, C. A hierarchical estimation scheme of tire-force based on random-walk SCKF for vehicle dynamics control. J. Frankl. Inst. 2020, 357, 13964–13985. [Google Scholar] [CrossRef]
- Koštial, P.; Krmela, J.; Frydrýšek, K. The Chosen Aspects of Materials and Construction Influence on the Tire Safety. In Composites and Their Properties; IntechOpen: Rijeka, Croatia, 2012; pp. 265–298. [Google Scholar] [CrossRef]
- Stoma, M.; Dudziak, A.; Caban, J.; Droździel, P. The future of autonomous vehicles in the opinion of automotive market users. Energies 2021, 14, 4777. [Google Scholar] [CrossRef]
- Lawoyin, S.; Fei, D.Y.; Bai, O. Accelerometer-based steering-wheel movement monitoring for drowsy-driving detection. In Proceedings of the Institution of Mechanical Engineers. Part D J. Automob. Eng. 2015, 229, 163–173. [Google Scholar] [CrossRef]
- Kemzuraite, K. Investigation of dynamic properties of vehicle in various friction condition simulated with use of skidcar sys-tem. In The Archives of Automotive Engineering; Kemzuraite, K., Zuraulis, V., Więckowski, D., Eds.; Łukasiewicz Research Network: Warszawa, Poland, 2014; pp. 82–102. [Google Scholar]
- Zhang, N.; Wu, J.H.; Li, T.; Zhao, Z.; Yin, G. Influence of braking on dynamic stability of car-trailer combinations. Proc. Institution Mech. Eng. Part D J. Automob. Eng. 2021, 235, 455–464. [Google Scholar] [CrossRef]
- Tesař, M.; Jilek, P.; Pokorný, J. Experimentální měření s využitím sklopné plošiny. In XI. Mezinárodní Konference Kateder Dopravních, Manipulačních, Stavebních a Zemědělských Strojů; Institute of Transport, Faculty of Mechanical Engineering, VŠB-TU Ostrava: Ostrava, Czech Republic, 2014; pp. 1–4. ISBN 978-80-248-3439-9. [Google Scholar]
- Krmela, J.; Beneš, L.; Krmelová, V. Tire Experiments on Static Adhesor for Obtaining the Radial Stiffness Value. Period. Polytech. Transp. Eng. 2014, 42, 125–129. [Google Scholar] [CrossRef] [Green Version]
- Jilek, P.; Šefčík, I.; Voltr, O.; Němec, J. The formation of car skid at a safe speed by reducing the radial response of car wheels. In Transport Means, Proceedings of the International Scientific Conference; Kaunas University of Technology: Kaunas, Lithuania, 2019; pp. 1185–1190. [Google Scholar]
- ČSN 69 0010-1-1 (690010). Tlakové Nádoby Stabilní. Technická Pravidla. Část 1.1: Základní část. Czech State Standard—General Provisions and Terminology. Available online: https://www.bmt.cz/data/files/legislativa/csn690010.pdf (accessed on 19 December 2021).
- European Steel and Alloy Grades. 2020. Available online: http://www.steelnumber.com/en/steel_composition_eu.php?name_id=331 (accessed on 19 December 2021).
- European Steel and Alloy Grades. 2020. Available online: http://www.steelnumber.com/en/steel_composition_eu.php?name_id=196 (accessed on 19 December 2021).
- European Steel and Alloy Grades. 2020. Available online: http://www.steelnumber.com/en/steel_alloy_composition_eu.php?name_id=1149 (accessed on 20 December 2021).


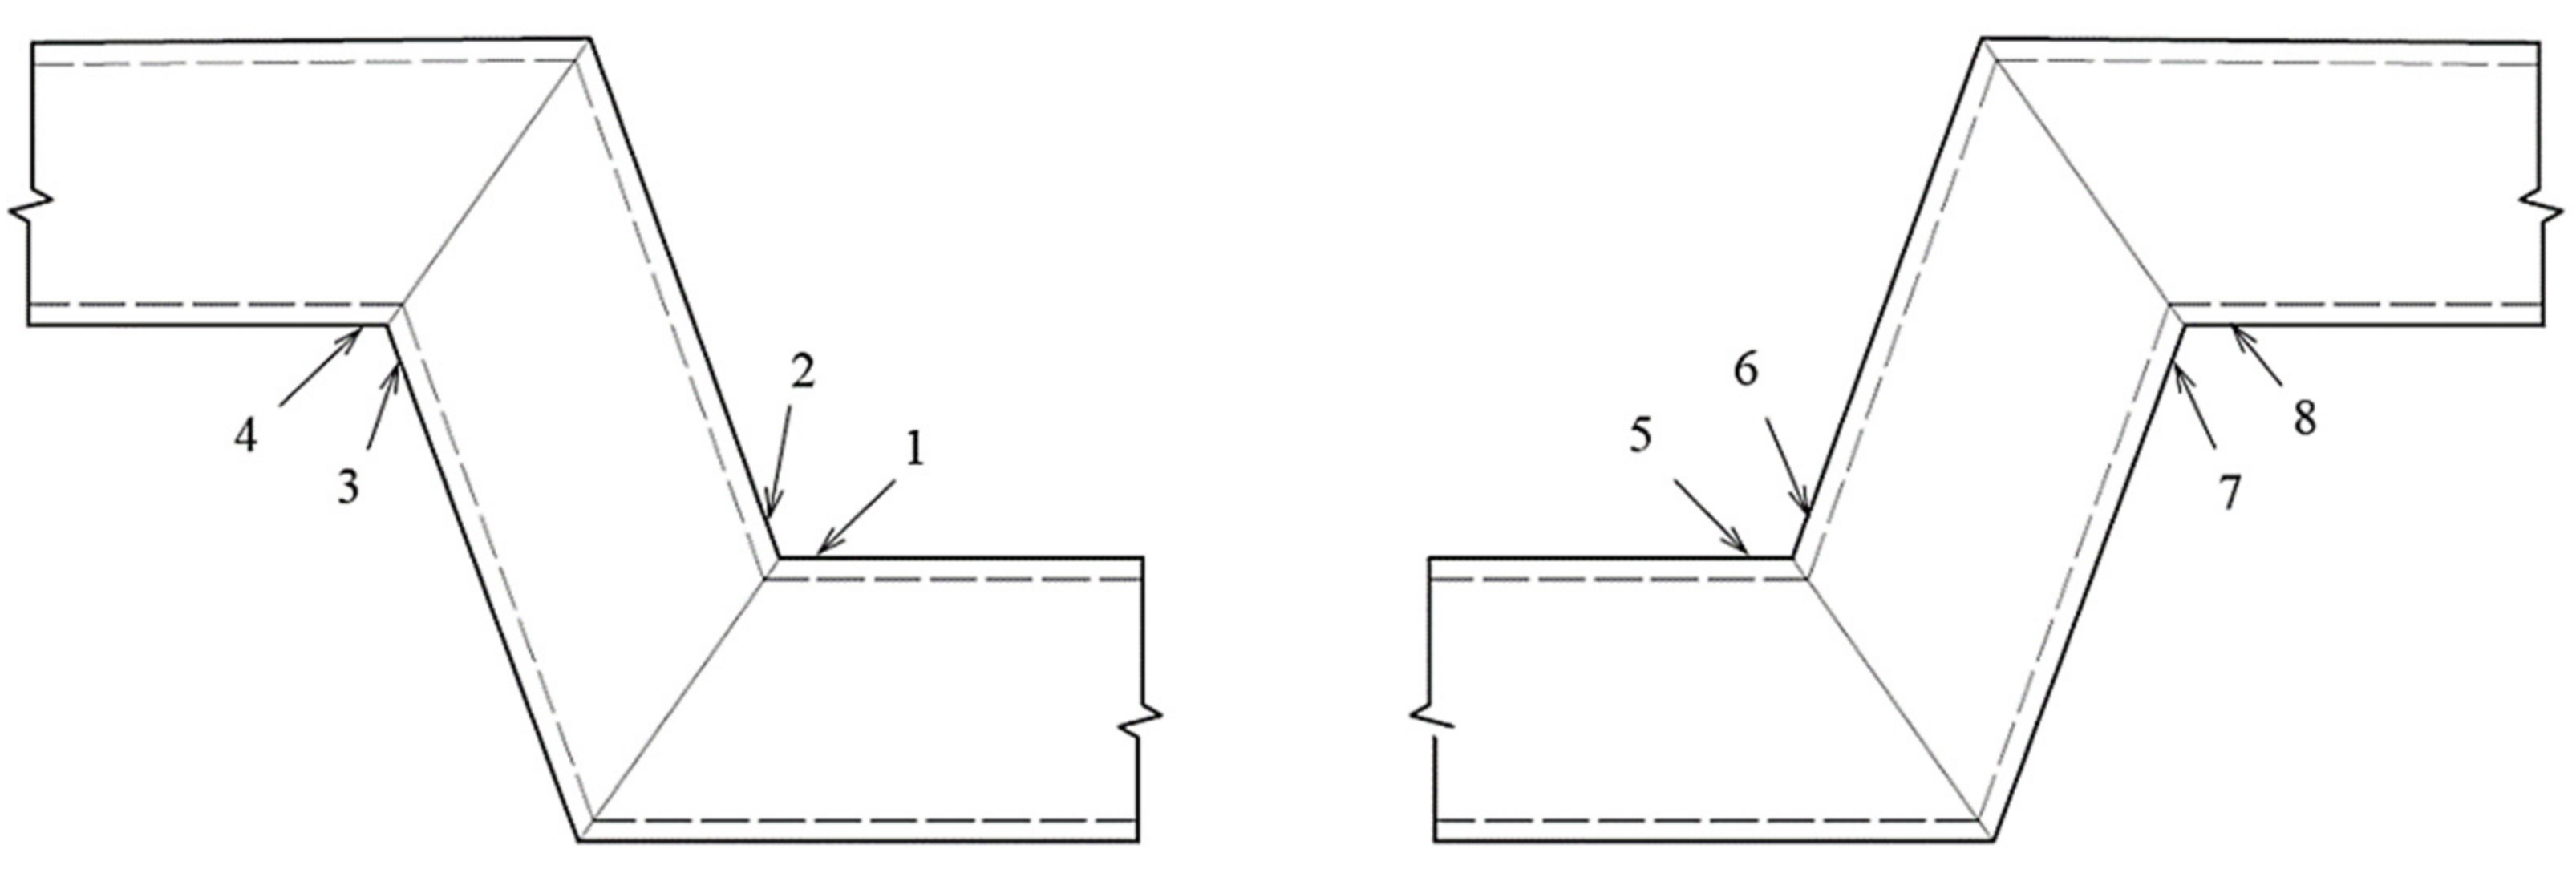
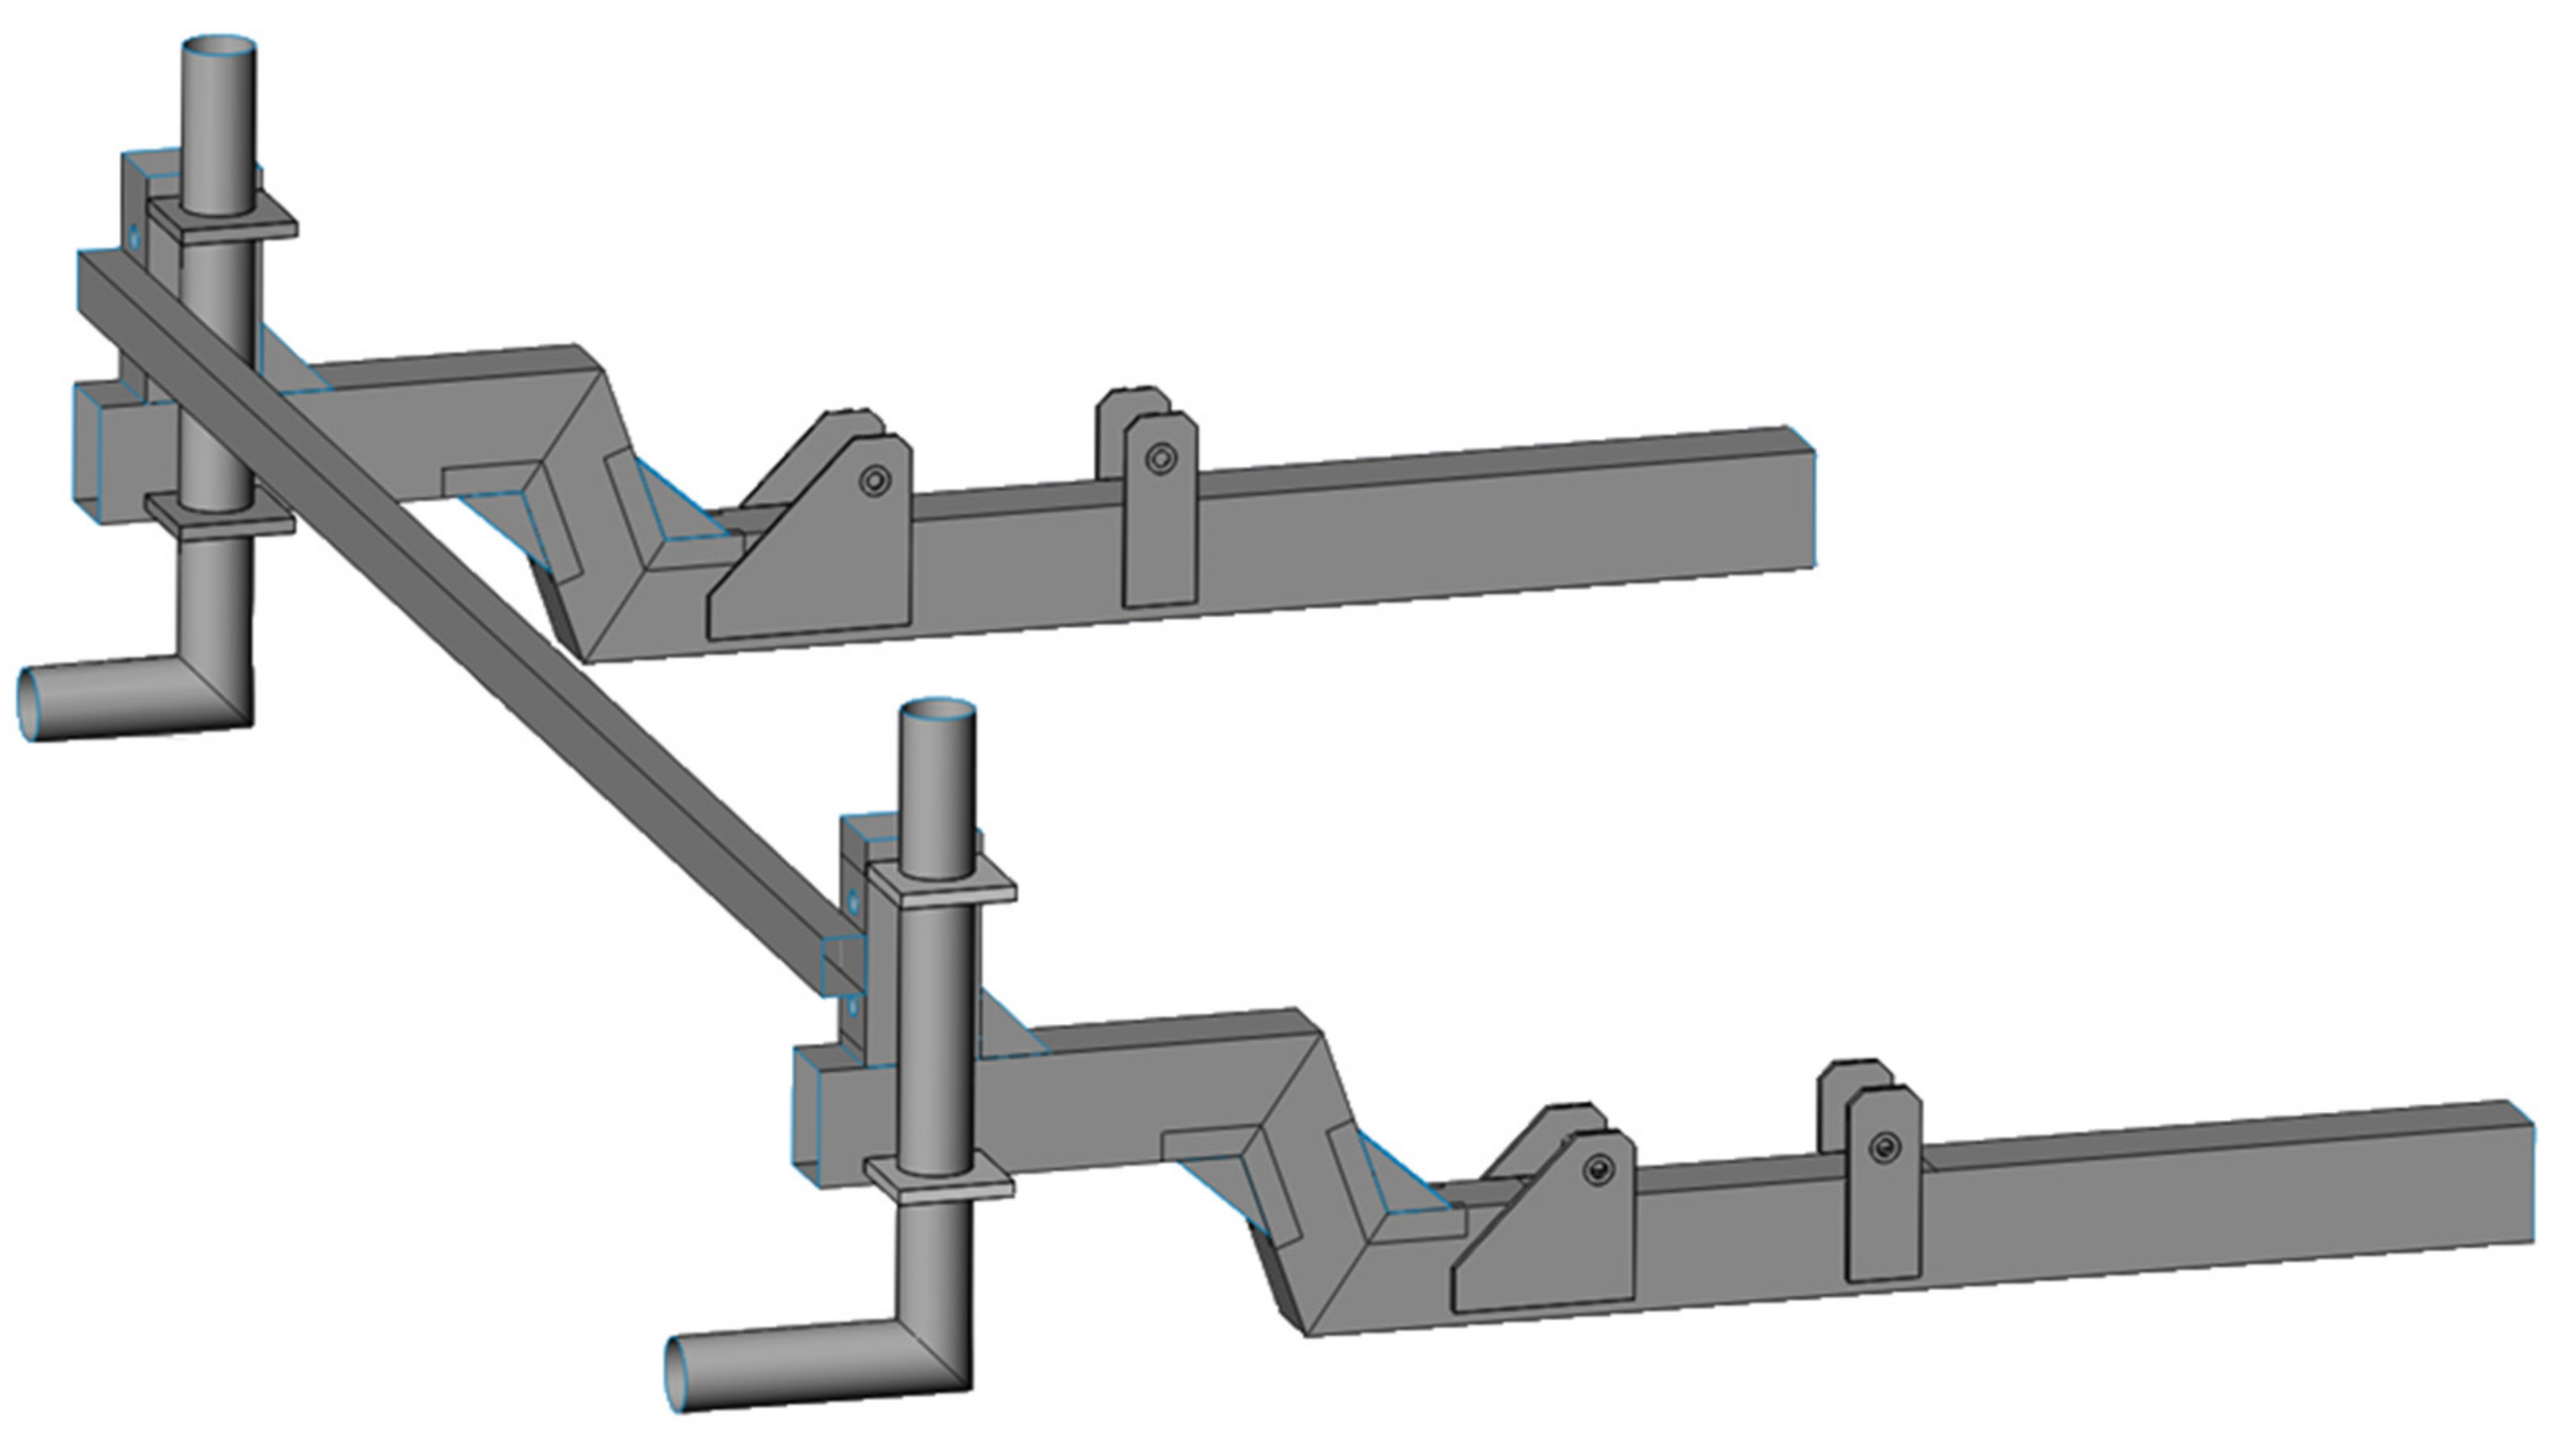
 the original state,
  a new state.


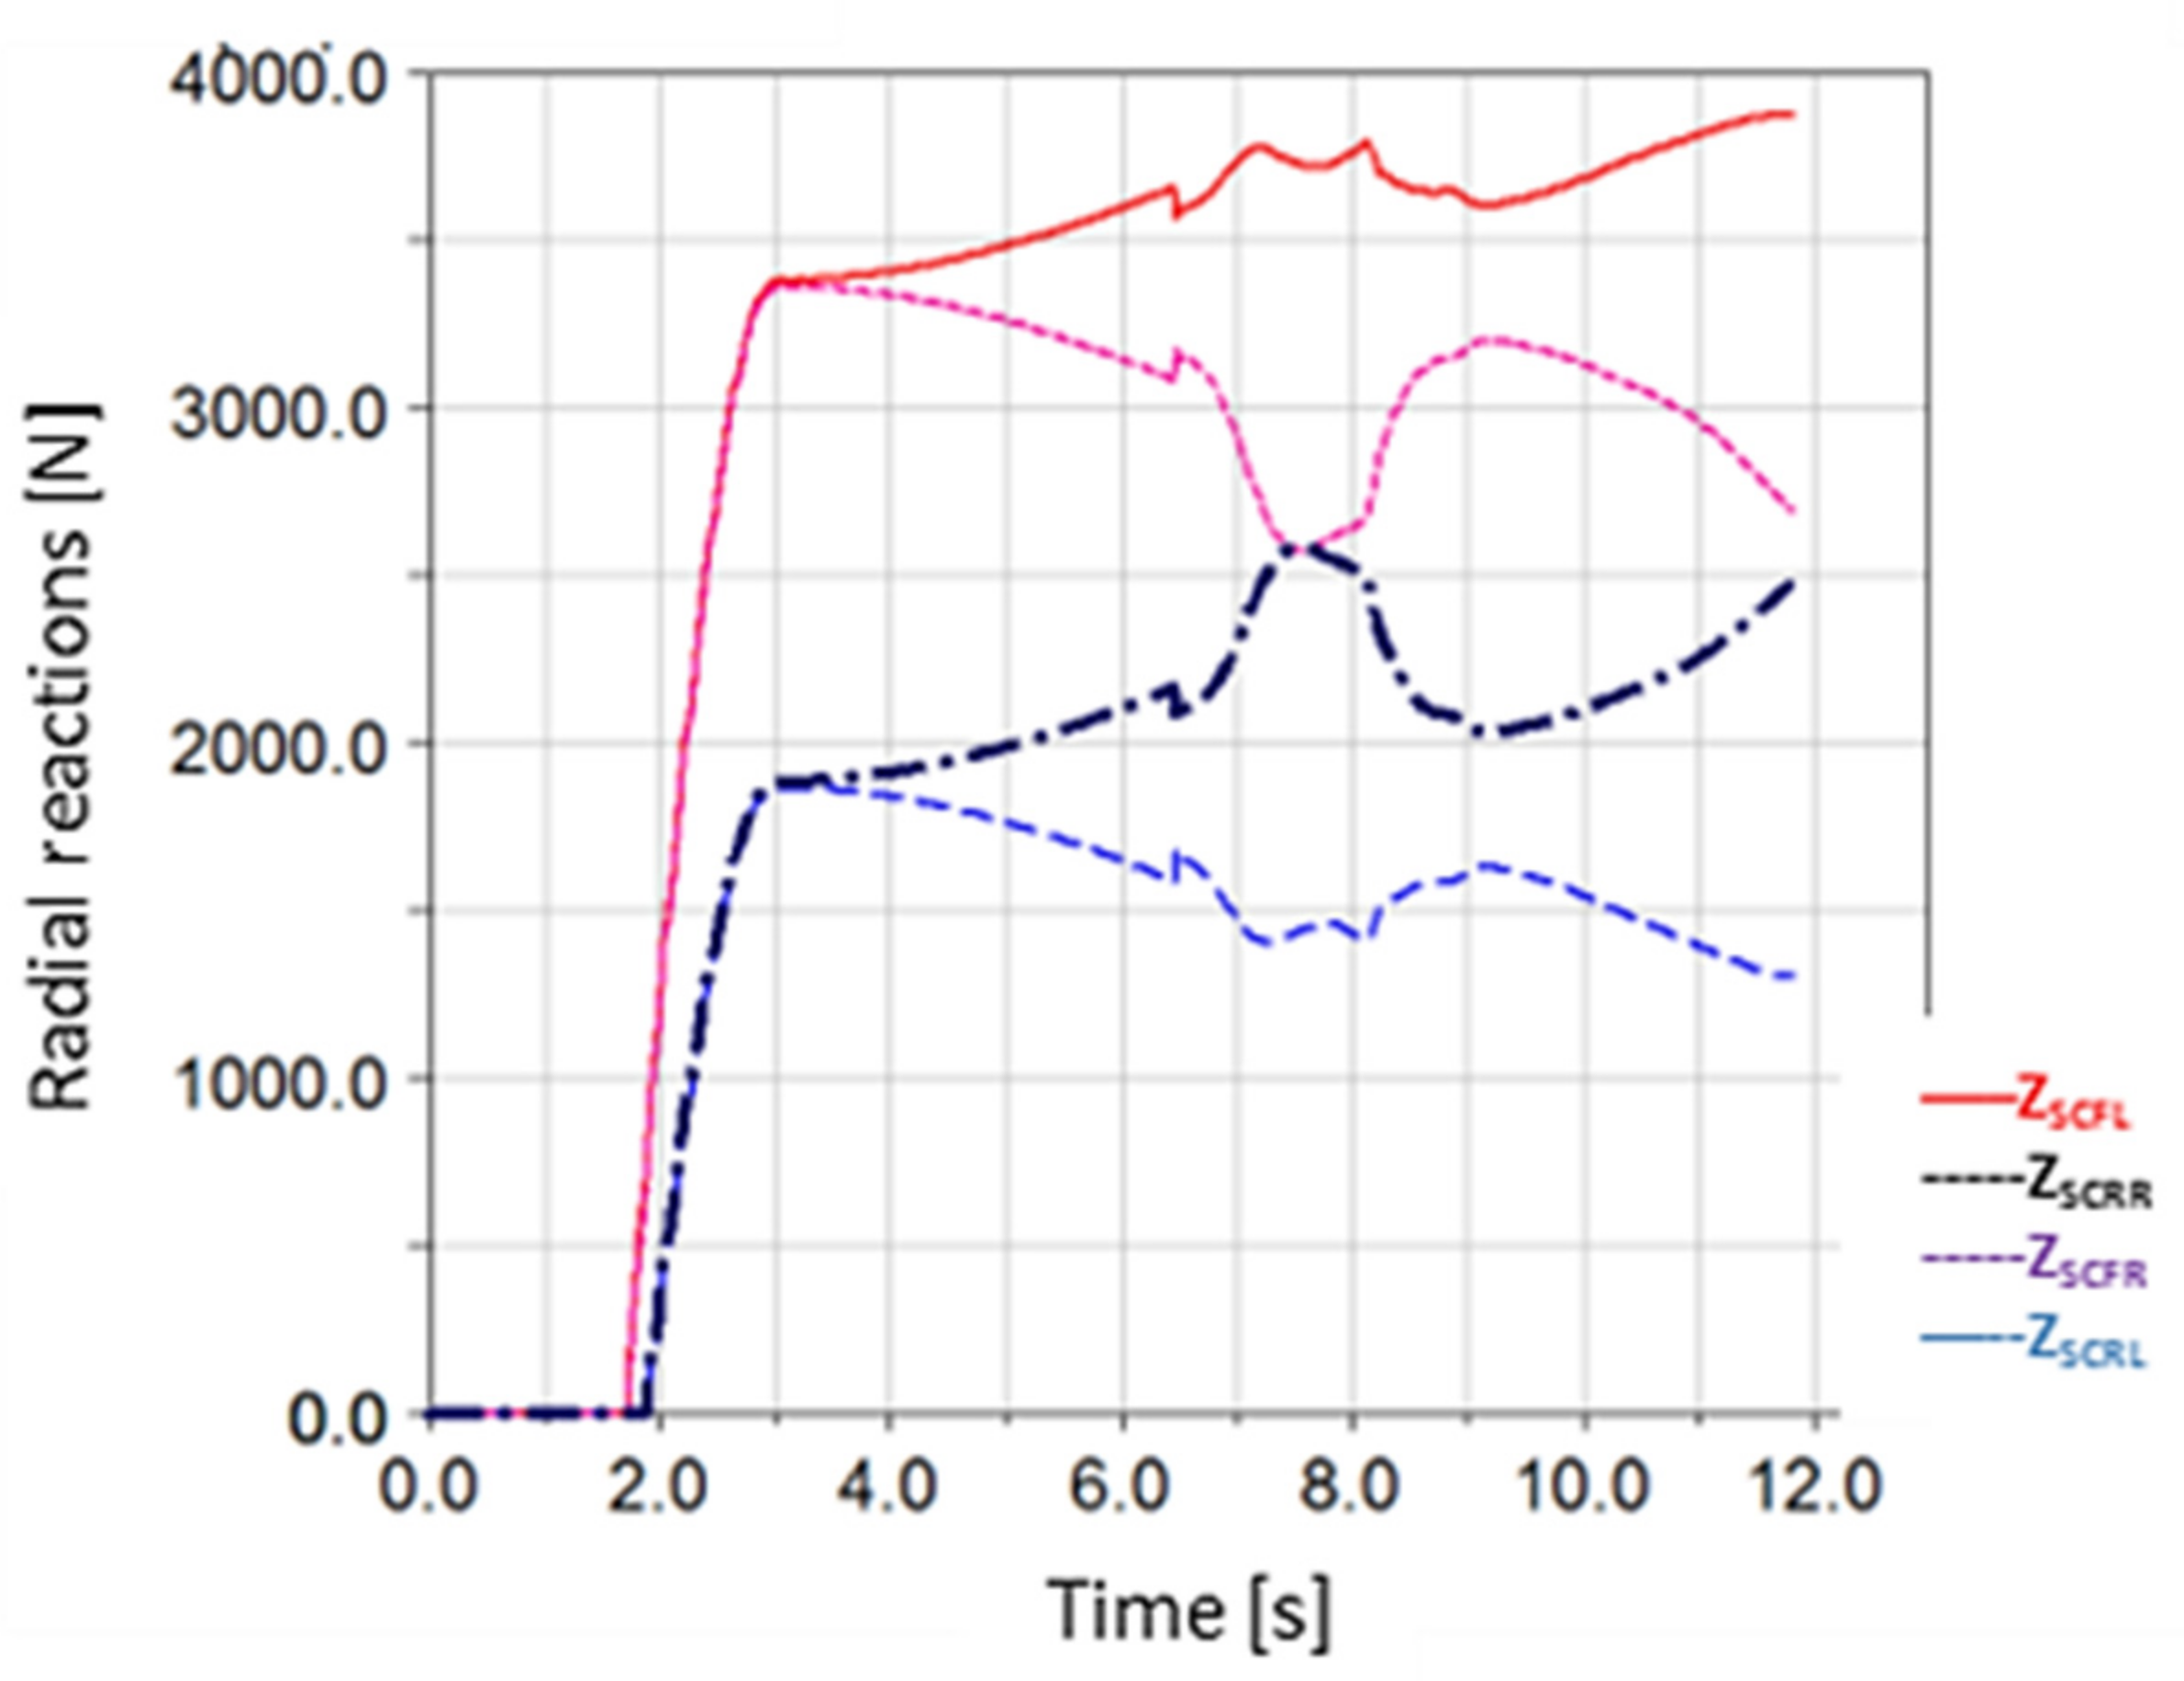
| ZSCFL (N) | Deviation (%) | ZSCFR (N) | Deviation (%) | |||
| k (-) | Experiment | Simulation | Experiment | Simulation | ||
| 1.0 | 0.0 | 0.0 | 0.0 | 0.0 | 0.0 | 0.0 |
| 0.8 | 848.0 | 834.0 | 1.7 | 839.0 | 831.0 | 0.9 |
| 0.6 | 1696.0 | 1677.0 | 1.1 | 1677.0 | 1658.0 | 1.1 |
| 0.4 | 2544.0 | 2516.0 | 1.1 | 2516.0 | 2498.0 | 0.7 |
| 0.2 | 3393.0 | 3439.0 | 1.4 | 3354.0 | 3422.0 | 2.0 |
| 0.0 | 4241.0 | 4227.0 | 0.3 | 4193.0 | 4143.0 | 1.2 |
| ZSCRL (N) | Deviation (%) | ZSCRR (N) | Deviation (%) | |||
| k (-) | Experiment | Simulation | Experiment | Simulation | ||
| 1.0 | 0.0 | 0.0 | 0.0 | 0.0 | 0.0 | 0.0 |
| 0.8 | 455.0 | 456.0 | 0.2 | 450.0 | 453.0 | 0.7 |
| 0.6 | 910.0 | 956.0 | 5.0 | 900.0 | 937.0 | 4.1 |
| 0.4 | 1365.0 | 1430.0 | 4.7 | 1350.0 | 1413.0 | 4.7 |
| 0.2 | 1821.0 | 1872.0 | 2.8 | 1800.0 | 1855.0 | 3.1 |
| 0.0 | 2276.0 | 2338.0 | 2.7 | 2250.0 | 2315.0 | 2.9 |
| Parameter | Value |
|---|---|
| Ultimate tensile strength (MPa) | 360 |
| Yield strength (MPa) | 235 |
| Density (kg.m−3) | 7850 |
| Ductility (%) | 26 |
| Poisson’s ratio (-) | 0.3 |
| Young’s modulus (MPa) | 210,000 |
| Critical Point | Rotation of Wheel Units | |||
|---|---|---|---|---|
| Forwards | Backwards | Outwards | Inwards | |
| 1 | 111 | 80 | 128 | 43 |
| 2 | 119 | 69 | 130 | 36 |
| 3 | 67 | 136 | 140 | 49 |
| 4 | 66 | 120 | 134 | 41 |
| 5 | 82 | 129 | 143 | 56 |
| 6 | 78 | 145 | 152 | 56 |
| 7 | 108 | 66 | 125 | 23 |
| 8 | 73 | 60 | 101 | 16 |
| Parameter | Value |
|---|---|
| Ultimate tensile strength (MPa) | 470 |
| Yield strength (MPa) | 355 |
| Density (kg.m−3) | 7850 |
| Ductility (%) | 22 |
| Poisson’s ratio (-) | 0.3 |
| Young’s modulus (MPa) | 210,000 |
| Parameter | Value |
|---|---|
| Ultimate tensile strength (MPa) | 170 |
| Yield strength (MPa) | 140 |
| Density (kg.m−3) | 2700 |
| Ductility (%) | 10 |
| Poisson’s ratio (-) | 0.33 |
| Young’s modulus (MPa) | 70,000 |
| Original Thickness (mm) | Thickness after the Optimization (mm) | Original Weight (kg) | Weight after the Optimization (kg) | Difference (%) |
|---|---|---|---|---|
| 5 | 4 | 32.6 | 29.1 | 10.5 |
| Original Thickness (mm) | Thickness after the Optimization (mm) | Original Weight (kg) | Weight after the Optimization (kg) | Difference (%) |
|---|---|---|---|---|
| 5 | 3 | 32.6 | 24.0 | 26.3 |
| Original Thickness (mm) | Thickness after the Optimization (mm) | Original Weight (kg) | Weight after the Optimization (kg) | Difference (%) |
|---|---|---|---|---|
| 5 | 6 | 32.6 | 17.8 | 45.4 |
Publisher’s Note: MDPI stays neutral with regard to jurisdictional claims in published maps and institutional affiliations. |
© 2021 by the authors. Licensee MDPI, Basel, Switzerland. This article is an open access article distributed under the terms and conditions of the Creative Commons Attribution (CC BY) license (https://creativecommons.org/licenses/by/4.0/).
Share and Cite
Jilek, P.; Berg, J.; Tchuigwa, B.S.S. Influence of the Weld Joint Position on the Mechanical Stress Concentration in the Construction of the Alternative Skid Car System’s Skid Chassis. Appl. Sci. 2022, 12, 397. https://doi.org/10.3390/app12010397
Jilek P, Berg J, Tchuigwa BSS. Influence of the Weld Joint Position on the Mechanical Stress Concentration in the Construction of the Alternative Skid Car System’s Skid Chassis. Applied Sciences. 2022; 12(1):397. https://doi.org/10.3390/app12010397
Chicago/Turabian StyleJilek, Petr, Jan Berg, and Baurice Sylvain Sadjiep Tchuigwa. 2022. "Influence of the Weld Joint Position on the Mechanical Stress Concentration in the Construction of the Alternative Skid Car System’s Skid Chassis" Applied Sciences 12, no. 1: 397. https://doi.org/10.3390/app12010397