Article

Accurate Estimation of Bicarbonate and Acetic Acid Concentrations with Wider Ranges in Anaerobic Media Using Classical FOS/TAC Titration Method

1
ESCOM, TIMR (Integrated Transformations of Renewable Matter), Centre de Recherches Royallieu, Université de Technologie de Compiègne, CS 60319, CEDEX, 60203 Compiègne, France
2
Institut Polytechnique UniLaSalle, Université d’Artois, ULR 7519, Rue Pierre Waguet, BP 30313, CEDEX, 60026 Beauvais, France
3
Cultimer France Producteurs Associés, ZA Les Rolandières, BP 52, 35120 Dol-de-Bretagne, France
*
Author to whom correspondence should be addressed.
Appl. Sci. 2021, 11(24), 11843; https://doi.org/10.3390/app112411843
Submission received: 9 November 2021 / Revised: 5 December 2021 / Accepted: 8 December 2021 / Published: 13 December 2021
(This article belongs to the Special Issue Anaerobic Digestion Processes for Wastewater Treatment)

Abstract

:
The determination of a volatile fatty acid content (FOS) and total alkalinity (TAC) can be carried out using Nordmann’s FOS/TAC titration method developed in the 1970s. This two-point titration (pH = 5 and 4.4) can be simply implemented and is widely employed by both the academic and industrial worlds. However, the present study proves that Nordmann’s method is only valid in limited ranges, since the titration of one FOS and TAC has an impact on the determination of the other, especially in extreme conditions. The present work develops a numerical tool with Scilab simulating the acid–base equilibria of titration. The program is efficient in predicting the experimental equivalent volumes obtained from Nordmann’s method with different combinations of sodium acetate and sodium bicarbonate contents. The mean absolute percentage errors (MAPE) between the simulation and experiment are below 7%. Two new formulas are developed, considering both equivalent volumes at pH = 5 and 4.4 to calibrate FOS and TAC values. The proposed formulas show their good performance in predicting various combinations of FOS and TAC contents in an anaerobic digestate at TAC ranging from 0 to 20,000 mg CaCO3·L−1 and FOS ranging from 0 to 31,000 mg HAc·L−1.

1. Introduction

Anaerobic digestion (AD) is attracting increasing attention due to its environmental benefits such as the production of renewable energy (biogas) and the valorization of organic biomass. Four key microbial transformation steps have been identified: hydrolysis, acidogenesis, acetogenesis and methanogenesis. During the acidogenesis stage, the molecules produced at the end of the hydrolysis stage are degraded by acidogenic microorganisms to produce volatile fatty acids (VFAs) such as acetic, propionic and butyric acids. The VFAs are then consumed by acetogenic and methanogenic microorganisms for the production of biogas and, thus, methane. The acidic nature of VFAs leads to the acidification of reactors by lowering the pH, which is a crucial parameter for the success of AD, particularly for methanogenic activities. As shown in Table S1 in the Supplementary Materials, the acidity constants (pKa) of the main VFAs found in a digester are relatively close to each other. For this reason, the VFA concentration is often expressed in an equivalent acetic acid content (usually expressed in g HAc·L−1). Depending on the digestion method and the nature of substrates, the VFA concentration can reach 3 g HAc·L−1 or much more [1].
When VFAs are not consumed and, therefore, accumulate in reactors, the alkalinity characterizing the buffering capacity of reactors becomes an important indicator for ensuring a stable and optimal pH (between 6.5 and 7.5) for AD processes. Theoretically, the term “total alkalinity” (TAC) is defined as the total proton acceptance capacity of an aqueous system by weak acids such as carbonic acid (H2CO3/HCO3/CO32−), phosphoric acid (H3PO4/H2PO4/HPO42−/PO43−), ammonia (NH4+/NH3) and OH ions. In an anaerobic digester, the buffering effect of H2CO3/HCO3, H3PO4/H2PO4, H2PO4/HPO42−, HPO42−/PO43− and NH4+/NH3 is generally negligible compared to that of HCO3/CO32− due to their low presence in the operational pH of AD [2]. This is justified by the pKa values of different compounds constituting alkalinity (see Table S1 in Supplementary Materials). Alkalinity is, thus, often presented in an equivalent carbonate alkalinity and usually expressed in g CaCO3·L−1.
Many methods for determining TAC and VFA concentration in a complex solution have been proposed since the 1960s. The simplest ones rely on the acid–base character of the compounds and are based on titration, a simple and inexpensive method. Since the pKa of the H2CO3/HCO3 couple differs from that of acetic acid, titration with a strong acid (HCl or H2SO4) by following the pH evolution is one of the methods developed and widely used. For a pH between 6 and 8, as shown in Figure 1, most protons are consumed by bicarbonate. However, at a pH less than 6, the VFAs (in most cases acetate) are titrated as well. A total of 36.5% of acetate is transformed into acetic acid at pH = 5, while more than 95% of bicarbonate is titrated. Between pH = 5 and pH = 4, acetate becomes the main target of titration—about 50% more acetate (i.e., 86.5% in total) is titrated. Since less than 5% of the inorganic carbon is consumed at this moment, bicarbonate has a limited effect on the determination of VFAs. Hence, the difficulty in interpreting the titration result arises from the fact that VFAs, mainly in their dissociated form (e.g., acetate) at a pH between 5 and 6, are also titrated and taken into account as the bicarbonate alkalinity. In summary, during the TAC titration, VFAs are strongly involved, whereas the effect of TAC on VFA determination exists but can be less significant.
Lili et al. (2011) [3] showed that the ratio of VFA concentration to the total alkalinity can be used to assess the adequacy of the organic load in anaerobic digesters. It should be noted that for a successful anaerobic digestion and process stability, the ratio should generally be less than 0.4. Consequently, a wrong result of VFA and TAC contents could lead to reactors being operated incorrectly. In the particular case of two-stage anaerobic digestion, the digestate at the outlet of hydrolysis digesters (55 °C) could have an extremely high VFA concentration and a disproportionately low alkalinity [4]. Conversely, the digestate at the outlet of the anaerobic digester could have a relatively low VFA concentration compared to the alkalinity, which would be very high [5]. This would likely distort the titration result. The accurate determination of VFAs and TAC by minimizing the interference between them becomes a crucial factor to ensure the right operation of anaerobic digesters.
The implementation of VFAs and alkalinity titration has been extensively studied over the past 60 years. Many studies focus on the direct titration of samples by looking for different pH turning points to minimize the effect of mutual interference.
The direct titration with two pH equivalent points was first developed by Nordmann (1977) [6]. It is called the “FOS/TAC” method, and is most widely used today. In this method, the VFA concentration is called the FOS for “Flüchtige Organische Säuren” in German. During FOS/TAC titration, the consumption of a strong acid up to pH = 5 (denoted A, in mL) reflects the buffering capacity of the system carried by bicarbonate, which is also called the TAC (see Figure 1). Between pH = 5 and pH = 4.4, protons are assumed to react exclusively with organic acids [7]. The volume of titrant consumed between these two pH values (denoted B, in mL) is used to calculate the FOS [8]. This method is only valid for a low FOS concentration because the latter could interfere with the TAC determination as mentioned above. The alkalinity determination at pH = 5 is inevitably biased in the case where VFA concentration is much higher. This simple, but partially inaccurate, approach is largely used, because it is easy to implement and allows for the evaluation of the adequacy of the organic loading in an anaerobic digester, especially if it is used to follow the relative evolution of one specific reactor. The Nordmann method can be implemented in Hach or METTLER TOLEDO titration devices. It is this Nordmann FOS/TAC method (1977) that the present paper proposes to optimize but keeping the simplicity of the experimental realization by correcting the calculation formulas, considering the reciprocal interferences between the FOS and TAC.
Besides Nordmann (1977), Jenkins et al. (1983) [9] proposed an alternative method of titrating the solution by a strong acid with a single stop at pH = 5.75. The method remains approximate and is only valid for a restricted range (TAC < 2000 mg CaCO3·L−1 and VFA < 500 mg HAc·L−1). The two-pH titration method has been modified or improved since the 1980s. Ripley et al. (1986) [10] proposed the distinction between partial alkalinity and intermediate alkalinity. Similarly, additional pH equivalent points have been added for a better evaluation of FOS/TAC such as the four-point [11], five-point [12] and eight-point [13,14] titration. The advantages and disadvantages of these different methods have been described by many authors [3,15,16,17,18,19]. In general, multi-point titration has a satisfactory accuracy for a VFA concentration below 5 g HAc·L−1, which covers the FOS content in most traditional anaerobic digesters. However, these methods require an unconventional experimental design and more complex calculations.
In addition, FOS/TAC titration can also be complemented by accurately determining one of the parameters involved (VFA or bicarbonate). DiLallo and Albertson (1961) [2] first developed the “back titration” method for the determination of VFA and TAC in an anaerobic digester. The solution is acidified to a low pH and then boiled to remove the CO2 gas produced by the carbonic acid. The solution is then titrated for the second time with a strong base (i.e., back titration) to obtain the VFA concentration. Different variant methods have been developed, such as the studies of O’Brien and Donlan (1977) [20] and Pauss et al. (1990) [21].
TAC is often calibrated by taking into account the concentration of VFAs. An accurate VFA determination could be achieved by physical separation technologies such as steam distillation, direct distillation, chromatography [22] and the total organic carbon (TOC) analysis [23].
Approaches to simulate titration phenomena have also been investigated. Mu et al. (2018) and Münch and Greenfield (1998) [24,25] have developed nonlinear models based on the acid–base equilibrium theory. Coupling the pH measurement with electrical conductivity [26], the dry matter content [27] and spectrometric property [28] of the titrated solution can give a better accuracy of VFA determination. The buffer intensity integral of different compounds allowed for a better determination of VFA content [26,29]. Møller et al. (2011) [4] gave a multiple linear model by considering the initial pH and the equivalent volumes of two pH points. This method showed a good efficiency of VFA content quantification with a very wide validation range between 38 and 30,056 mg HAc·L−1. TAC determination, however, has not been discussed.
The last 60 years of work have revealed the fact that: (1) The reciprocal impact of TAC and FOS is often omitted, especially for the “FOS/TAC” method proposed by Nordmann; (2) the different techniques developed are only effective for a limited range of FOS and TAC. The determination in reactors treating special substrates that are richer in bicarbonate and VFAs remains to be studied; (3) many studies focus on VFA determination, not on both VFAs and TAC and (4) direct titration techniques are generally easier to perform, but lack accuracy, while techniques that separately determine VFAs and TAC are more accurate, but more sophisticated and require additional equipment or complex experimental protocols.
The present study is based on the most common “FOS/TAC” method of Nordmann. It aims to develop a model for the determination of bicarbonate and VFAs that is both accurate and simple with a very wide validation range. The objectives of the present study are (1) the experimental demonstration of the impossibility to independently estimate FOS and TAC in high-loading samples by Nordmann’s FOS/TAC method; (2) the simulation of the FOS/TAC titration curve and the experimental validation of these simulations in different artificial mixtures of pure sodium bicarbonate and sodium acetate; (3) with the help of the simulation, the establishment of alternative formulas to the Nordmann formulas, allowing a more accurate estimation of bicarbonate and VFA concentration in wider ranges of FOS and TAC; (4) the experimental validation of the proposed formulas using real digestion samples.

2. Materials and Methods

2.1. Nordmann’s FOS/TAC Titration

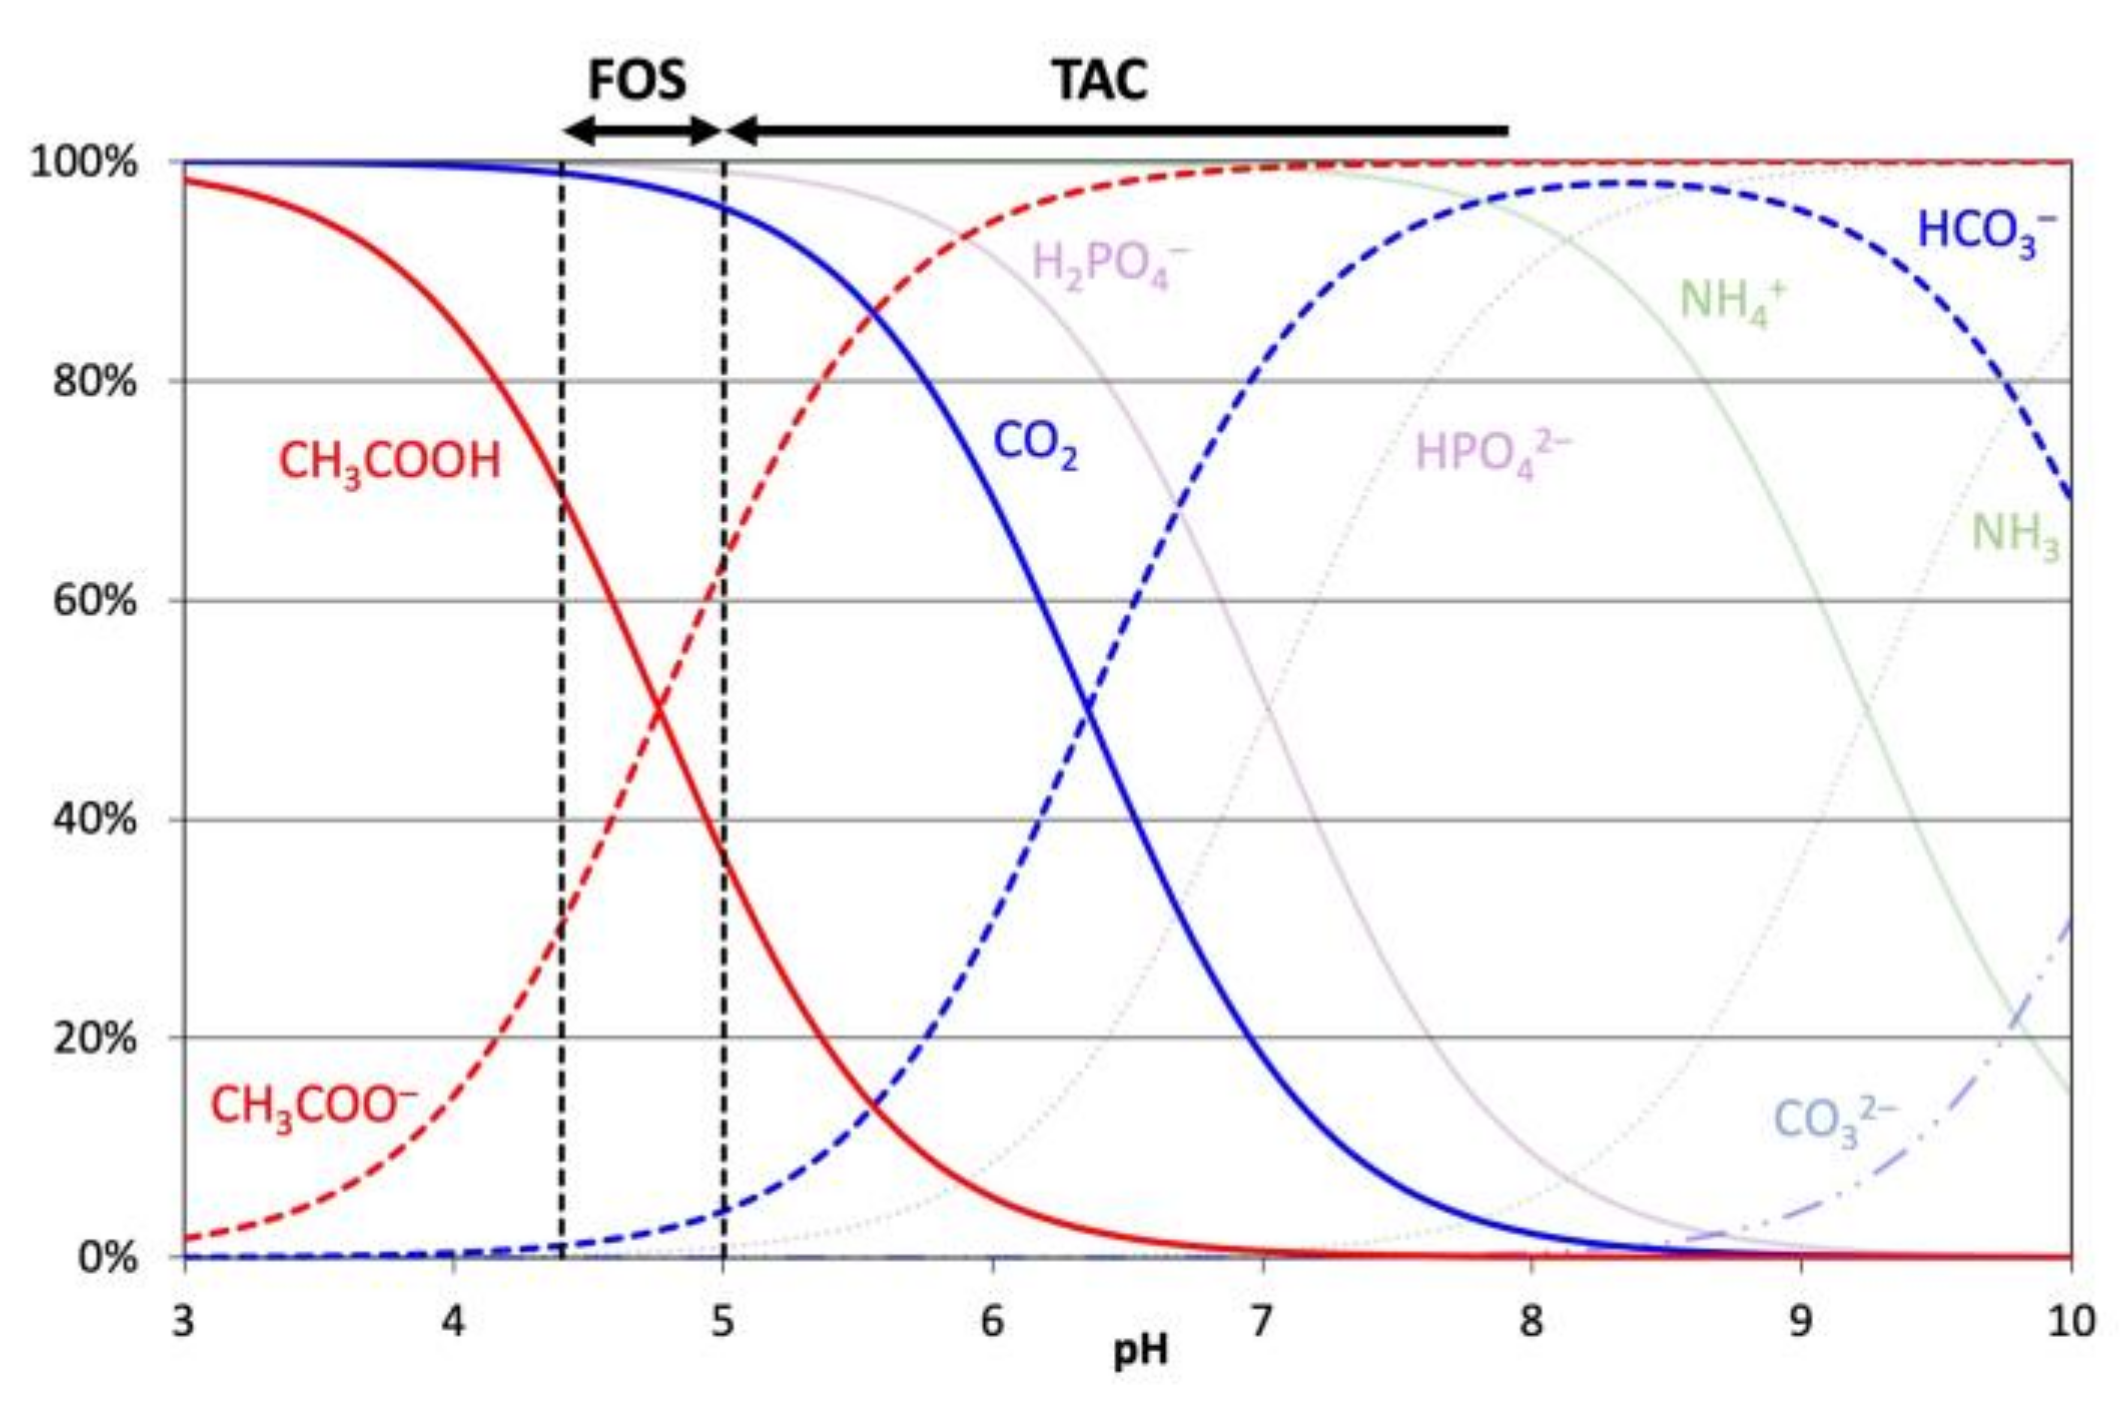
2.1.1. Presentation of the Method

Nordmann (1977) developed the titration technique for determining alkalinity and VFA content of sewage sludge. This method was introduced and adapted to samples from biogas plants by McGhee in 1968 [7,8].
The buffering capacity of the system (TAC) was determined by titrating the 20 mL samples from their initial pH to pH = 5 with sulfuric acid. The TAC could, thus, be calculated according to Equation (1).
TAC = A × 250
where TAC (mg CaCO3·L−1) is the total alkalinity and A (mL) is the equivalent volume of 0.1 N H2SO4 to reach pH = 5.
The determination of FOS (VFA concentration) was based on titration of the solution from pH = 5 to pH = 4.4. Equation (2) was then obtained by using the linear relationship of acid consumption versus FOS as described by McGhee (1968) [8].
FOS = ( B × 1.66 0.15 ) × 500
where FOS (mg HAc·L−1) is the VFAs content with regard to acetic acid; B (mL) is the equivalent volume difference of 0.1 N H2SO4 between pH = 5 and pH = 4.4.
It should be noted that Equations (1) and (2) are based on the titration of a 20 mL sample [7]. The coefficient values in these formulas may vary if a different titration volume is applied.

2.1.2. Preparation of Sodium Bicarbonate and Sodium Acetate Solutions for FOS/TAC Titration

To verify the accuracy of the method developed by Nordmann (1977), sodium acetate trihydrate (ASC, ISO, Reag. Ph. Eur., Merck, Darmstadt, Germany), sodium bicarbonate (99.5%, Sigma, St. Louis, MO, USA) and deionized water at 18 MΩ·cm were used to prepare the solutions of different combinations of FOS and TAC contents. Eight acetic acid concentrations (FOS = 0, 145, 536, 1126, 3138, 5044, 10,315 and 20,472 mg HAc·L−1) and nine alkalinity concentrations (TAC = 0, 510, 1487, 2517, 4010, 5999, 7523, 10,005 and 12,492 mg CaCO3·L−1) were selected. A total of 72 solutions was used for this work.

2.1.3. Experimental Realization

The HACH AT1102 potentiometric titrator with 1 syringe (HACH, Loveland, CO, USA) was used to perform the titration of the above 72 solutions. The pH electrode was calibrated at pH = 4, 7 and 10. The titrator application kit “FOS/TAC (BIOGAS)” (AP0006.AT1102) was used to obtain the FOS and TAC values using Nordmann’s method.
It should be noted that according to the HACH protocol, the titrator determines the FOS/TAC for a 5 mL sample instead of 20 mL. Thus, 5 mL of sample is diluted in 15 mL of deionized water in a specific beaker. A stirring rod and the pH electrode were introduced into the beaker. The 0.1 N standard sulfuric acid (0.05 mol H2SO4·L−1, Ref. 20253, HACH) was used as the titrant. At the end of the titration, the Nordmann’s FOS, TAC and equivalent volumes were displayed on the titrator screen. The formulas to calculate FOS and TAC were adapted to the 5 mL titration as shown in Equations (3) and (4).
TAC emp = A × C tit × 50045 V sample
FOS emp = ( B × 1.66 0.15 ) × 500
where TACemp (mg CaCO3·L−1) is the total empirical alkalinity content using Nordmann’s method; A (mL) is the equivalent volume of 0.1 N H2SO4 to obtain pH = 5; Ctit (moleq·L−1 or N) is the concentration of sulfuric acid as titrant (Ctit = 0.1 N); Vsample (mL) is the volume of titrated sample (Vsample = 5 mL); FOSemp (mg HAc·L−1) is the empirical VFA content using Nordmann’s method and B (mL) is the difference of two equivalent volumes at pH = 5 and pH = 4.4.
Sodium bicarbonate (NaHCO3) was used to simulate different alkalinity in the solutions. Its titrated concentration [NaHCO3] (mg NaHCO3·L−1) could, therefore, be recalculated from the TAC value given by the titrator:
NaHCO 3 = TAC × 84 × 2 100 = TAC 0.595
The titration results were recorded and then further treated using Scilab software (ESI Group, Rungis, France).

2.2. Simulation of FOS/TAC Titration Curve

It was possible to numerically simulate the titration curves based on the acid–base equilibrium theory. This allowed finding the relations that determined FOS and TAC accurately (see Section 2.3). The simulations were developed with the Scilab software (ESI Group, Rungis, France). The simulated results were validated experimentally with the titration of various solutions of pure sodium bicarbonate and sodium acetate mixture as presented in Section 2.1. The buffering effect of H2CO3/HCO3, H3PO4/H2PO4, H2PO4/HPO42−, HPO42−/PO43− and NH4+/NH3 was ignored since these acid/base couples were much less present at pH below 8 for most anaerobic digested samples.
The simulation code is available in Supplementary Materials, as well as the flowchart of programming (Figure S1).

2.3. Multiple Linear Regression of Simulated Results

In the Nordmann method, Equations (1) and (3) above show that TAC is a linear function of the first equivalent volume (i.e., A in mL). Equations (2) and (4) show that FOS is a linear function of the difference of the two equivalent volumes (i.e., B in mL). Since FOS and TAC interfere in the titration of each other, two new 3-parameter models were proposed in the present work to calibrate the determination of TAC and FOS. This was a multiple linear regression assuming that TAC and FOS depended on both A and B.
With the simulated data to be validated by experiments, and by using the Scilab solver for multiple linear regression, it was possible to identify the model coefficients to calculate the bicarbonate (or equivalent TAC) and acetic acid concentrations:
[ NaHCO 3 ] new = α 1 × A + α 2 × B + α 3
[ HAc ] new = FOS new = β 1 × A + β 2 × B + β 3
where [NaHCO3]new (mg NaHCO3·L−1) is the new sodium bicarbonate content; [HAc]new (mg HAc·L−1) is the new acetic acid content, namely, FOS; A (mL) is the equivalent volume of 0.1 N H2SO4 to obtain pH = 5; B (mL) is the difference of two equivalent volumes at pH = 5 and pH = 4.4; α 1 , α 2 and α 3 and β 1 , β 2 and β 3 are the model parameters for multiple linear regression.
The simulation range of sodium bicarbonate and acetic acid contents was both extended to 40,000 mg·L−1 equivalent to TAC = 23,800 mg CaCO3·L−1 and FOS = 40,000 mg HAc·L−1, since the simulation was proved to accurately predict the experimental results (see Section 3.1 and 3.2).
By applying Equation (5), [NaHCO3] could be converted to the equivalent alkalinity (TACnew). One could also use the FOS and TAC values calculated with the Nordmann formulas (i.e., TACemp and FOSemp), recalculate the values of “A” and “B” and then reinject these values into the above formulas in order to correct the initial FOS and TAC (see Section 3.3).

2.4. Experimental Validation of the Proposed New Formulas

The anaerobic digestate collected from a local biogas plant (Coudun, Oise, France) receiving agricultural waste was used as real medium for experimental validation of the proposed new FOS and TAC formulas. The digestate, after being filtered through a 1 mm sieve, had a total solids content (TS) of 6.5% and a volatile solids content (VS/TS) of 65%. The FOS/TAC titration was performed using the automatic titrator. Its empirical FOS and TAC with Nordmann’s method were, respectively, found at 11,009 ± 674 mg CaCO3·L−1 and 2452 ± 64 mg HAc·L−1.
In order to remove as much bicarbonate as possible, 200 mL of the digestate and a stirring rod were put into an Erlenmeyer flask. The initial pH of the digestate was measured (pH = 7.74). Sulfuric acid (40%w/w) was introduced dropwise to obtain pH = 4.03 on a magnetic stirrer. Two drops of anti-foaming agent were added to prevent foam production. The flask was then sealed and put in vacuum condition by a vacuum pump for 10 min (1.6 × 10⁴ Pa, Bioblock scientific, Illkirch-Graffenstaden, France). It is considered that a majority of the bicarbonate could be destroyed at pH = 4 and, therefore, transformed into CO2 that was extracted in vacuum condition [21]. The flask was then opened. NaOH (3 mol·L−1) was added dropwise into the digestate to bring the pH back to approximately its initial value (final pH = 7.86).
The degassed digestate was tested again in terms of its empirical TAC and FOS (denoted X and Y mg·L−1, respectively). Different combinations of total bicarbonate content (put as TAC) and total acetic acid content (put as FOS) were prepared using this degassed digestate by adding additional NaHCO3 and NaAc·3H2O. The tested FOS and TAC conditions are shown in Table 1. Each condition was realized by the Hach automatic titrator in duplicate. The empirical FOS and TAC values from Equations (3) and (4) were recorded and then converted into new FOS and TAC using Equations (6) and (7). All empirical and new FOS and TAC values were compared with the real FOS and TAC values to see the difference, interpreted by mean absolute percentage error (MAPE).

3. Results and Discussion

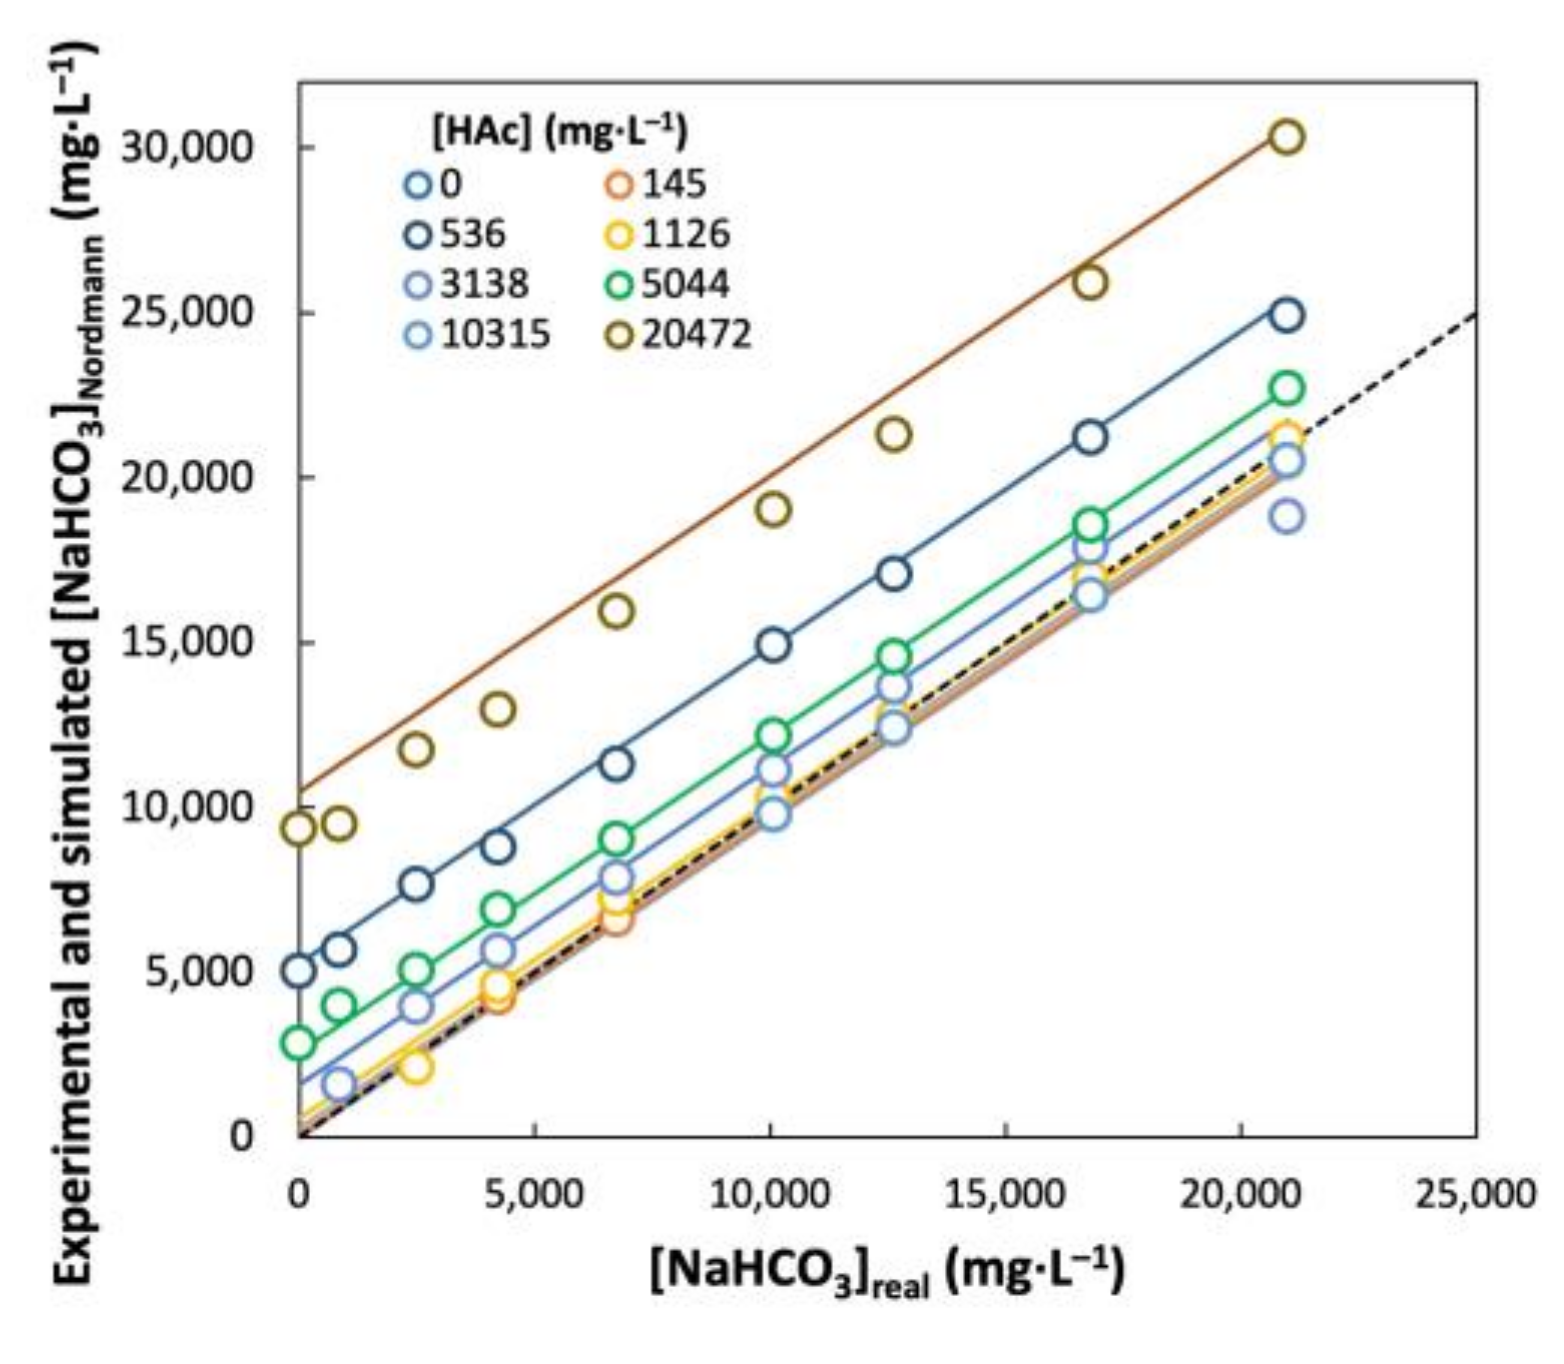
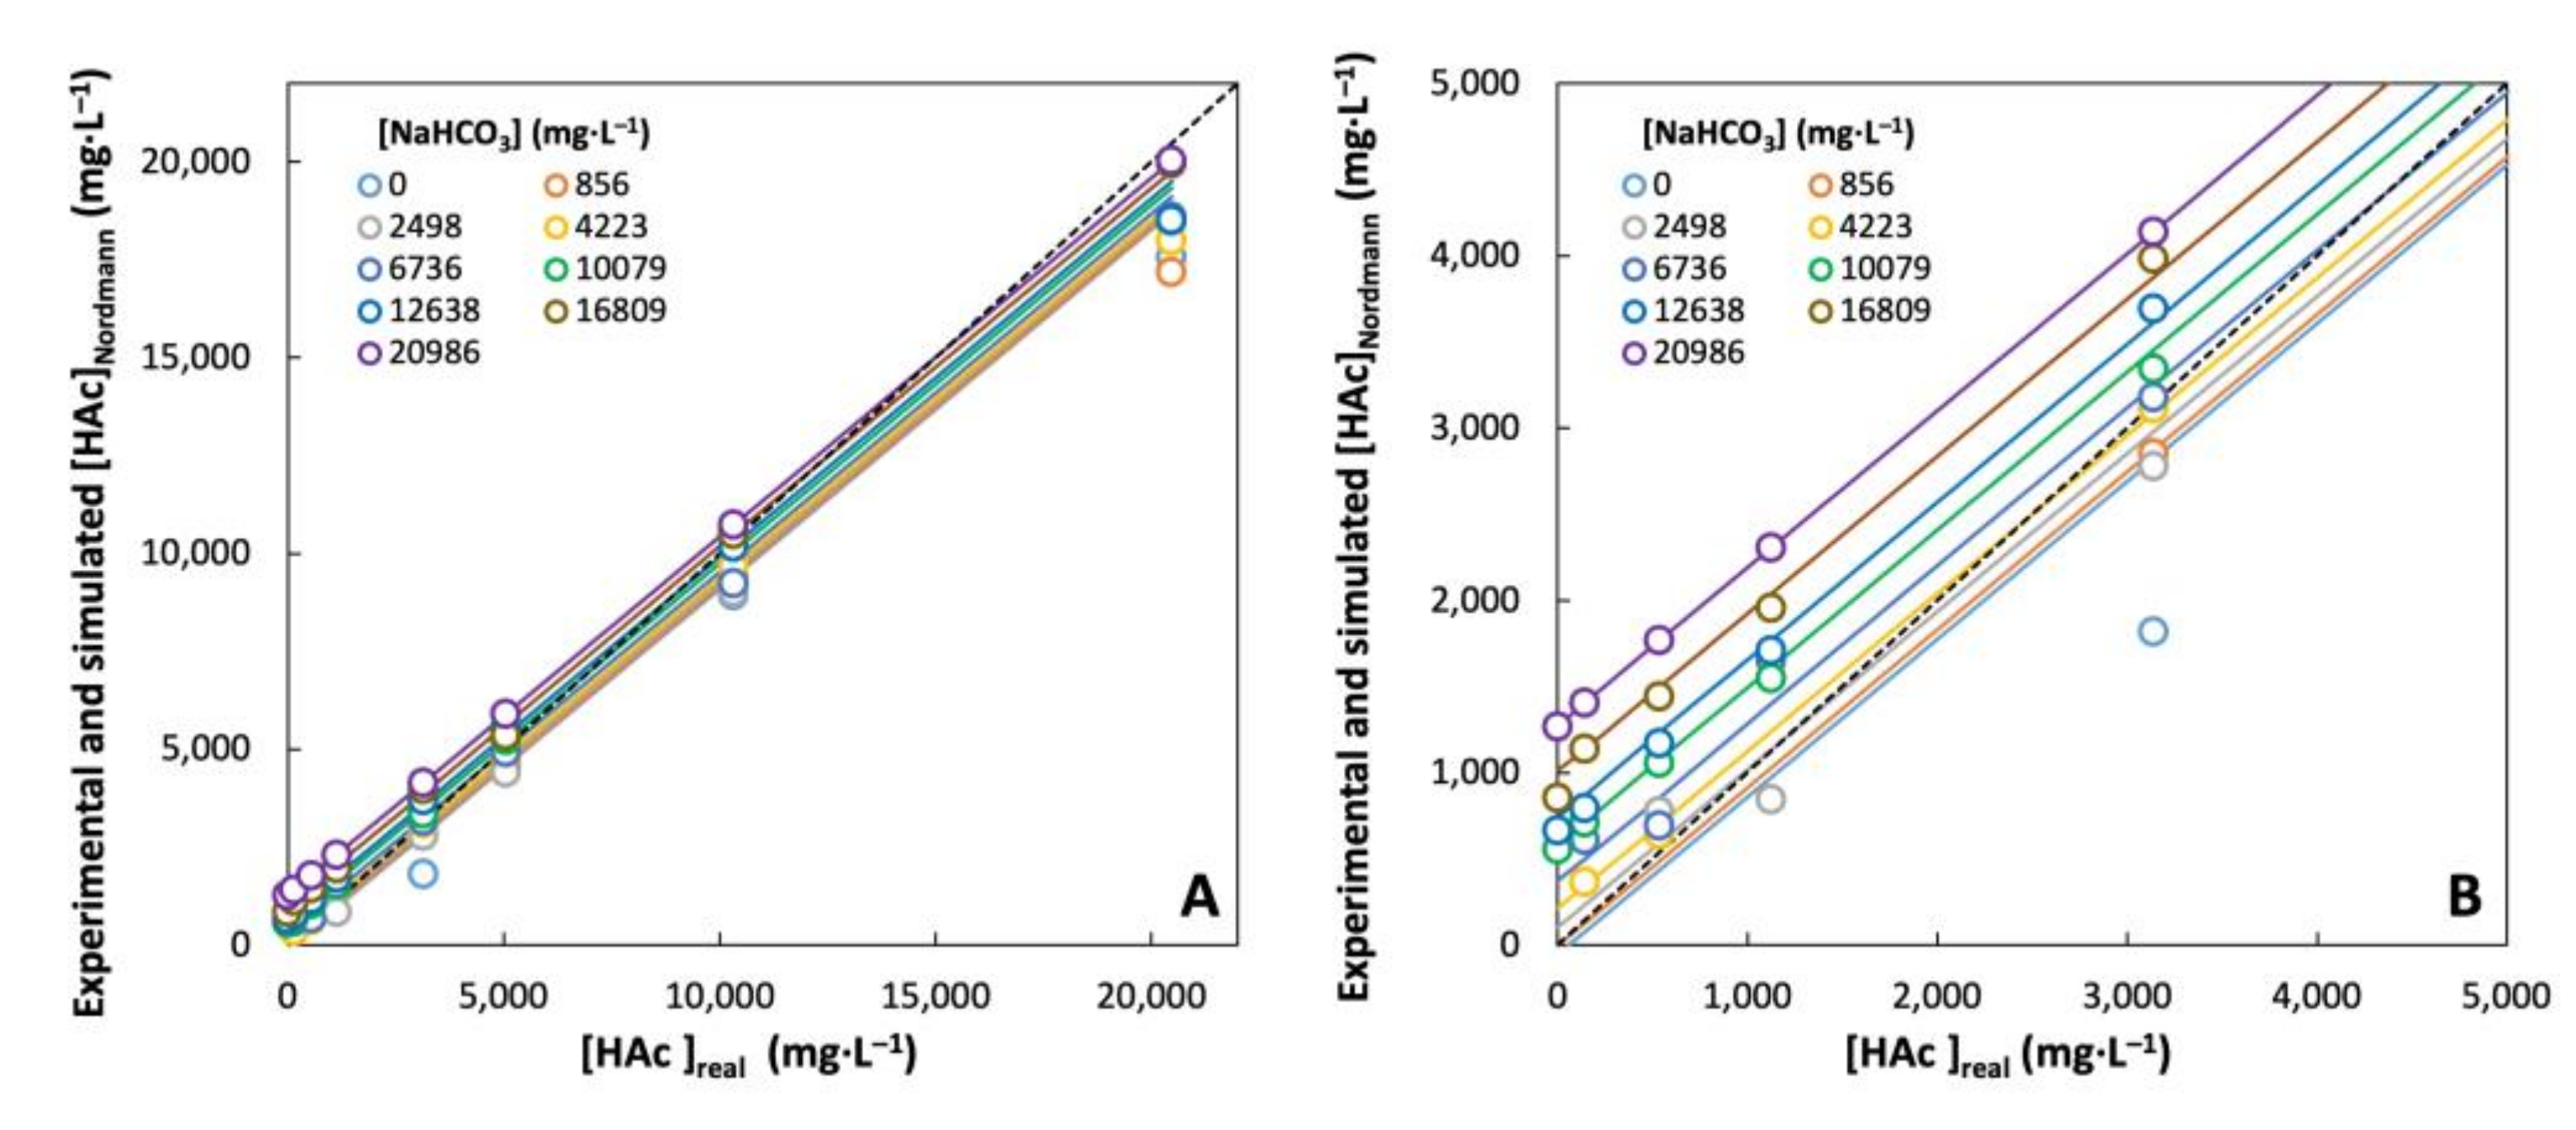
3.1. FOS/TAC Titration of Artificial Solutions with Pure NaHCO3 and NaAc

The accuracy of the “FOS/TAC” determination method developed by Nordmann (1977) [6] was studied. Solutions at eight equivalent acetic acid concentrations and nine alkalinity concentrations were prepared to simulate different true FOS and TAC concentrations. Some experimental values were missing at extremely low or high [HAc] due to the detection limits of the automatic titrator. The instrument did not allow the addition of more than 25 mL of the titrant as preset by the FOS/TAC titration program. Sometimes, even the addition of a small amount of titrant to a depleted FOS and TAC solution would cause the equivalent point to be exceeded, making the calculation of FOS or TAC impossible.
Figure 2 shows the experimental sodium bicarbonate concentration determined with Nordmann’s empirical formula (Equation (3)) at different acetic acid levels against its real concentration. The empirically calculated concentrations of bicarbonate obviously varied linearly with the real values, highly dependent on the acetic acid concentration. For low acetic acid concentrations (i.e., [HAc] = 0, 145, 536 and 1126 mg·L−1), the average error between the [NaHCO3] determined by the FOS/TAC method and the real [NaHCO3] was less than 3%, whereas for larger [HAc], it was 3138, 5044, 10,315 and 20,472 mg·L−1; this discrepancy increased from 26% to 247%. This meant that the higher the acetic acid concentration, the less accurate the bicarbonate determination. The bicarbonate concentration and, thus, the corresponding TAC were systematically overestimated by the Nordmann’s FOS/TAC formulas. This justified the remark in the previous section that the acetate reacts with the proton during the determination of the bicarbonate alkalinity. This additional consumption of the titrant was taken into account in the TAC calculation and, therefore, distorted the result, especially for the determination of TAC with a high FOS content.
Similarly, the [HAc] determined by Nordmann’s method at different bicarbonate concentrations was compared with the real [HAc] in the solutions. As illustrated in Figure 3A, the average error between the measured [HAc] and the true value in the solution was much smaller than that of the bicarbonate determination. This implied that the presence of bicarbonate had a less significant effect on the determination of [HAc]. Nevertheless, when zooming in on the [HAc] = 0 to 5000 mg HAc·L−1 part (see Figure 3B), one can note that a systematic overestimation of [HAc] could also be observed. The difference between the experiment and reality could be as high as 684%. It means bicarbonate concentration also interferes with the determination of FOS, especially when [HAc] (or FOS) is very low and [NaHCO3] (or TAC) is much higher.
The determination of the sodium bicarbonate and acetic acid concentration by the Nordmann method was highly dependent on each other. The results of FOS and TAC with Nordmann empirical formulas were only acceptable for a limited combination of moderate [HAc] and [NaHCO3], which meant both FOS and TAC must be neither too low nor too high. This reduces the applicability of Nordmann’s FOS/TAC method in determining the alkalinity and VFAs of a digester, especially for digesters with a high loading of organic matter (e.g., hydrolysis tank of two-stage anaerobic digestion) and bicarbonate (e.g., digestion of certain shellfish substrates).

3.2. Simulation of Titration Curves

It was possible to simulate the curves of FOS/TAC titration with Scilab, which then allowed finding the relationships to distinctly identify bicarbonate and acetic acid contents.
The lines in different colors in Figure 2 and Figure 3A,B represent the simulated concentrations of two compounds (sodium bicarbonate and acetic acid) using the FOS/TAC titration of Nordmann. Comparing them with the experimental results, it was shown that the simulation of the titration from the acid–base equilibria allowed a good prediction of the concentrations of bicarbonate and acetic acid when the Nordmann method was used. The R2 of 0.991 and 0.997 was, respectively, obtained. The mean absolute percentage errors (MAPE) were found at 5% and 7%, respectively. This indicated that by using the numerical tool, we could safely simulate the titration of the two compounds by avoiding the material and experimental constraints (e.g., detection limit of the titrator, uncertainties related to the preparation of solutions at low concentrations of FOS and TAC).
Consequently, the results of the simulation instead of the experiment were used to calibrate the Nordmann FOS/TAC method and, accordingly propose new formulas to calculate the FOS and TAC more precisely.

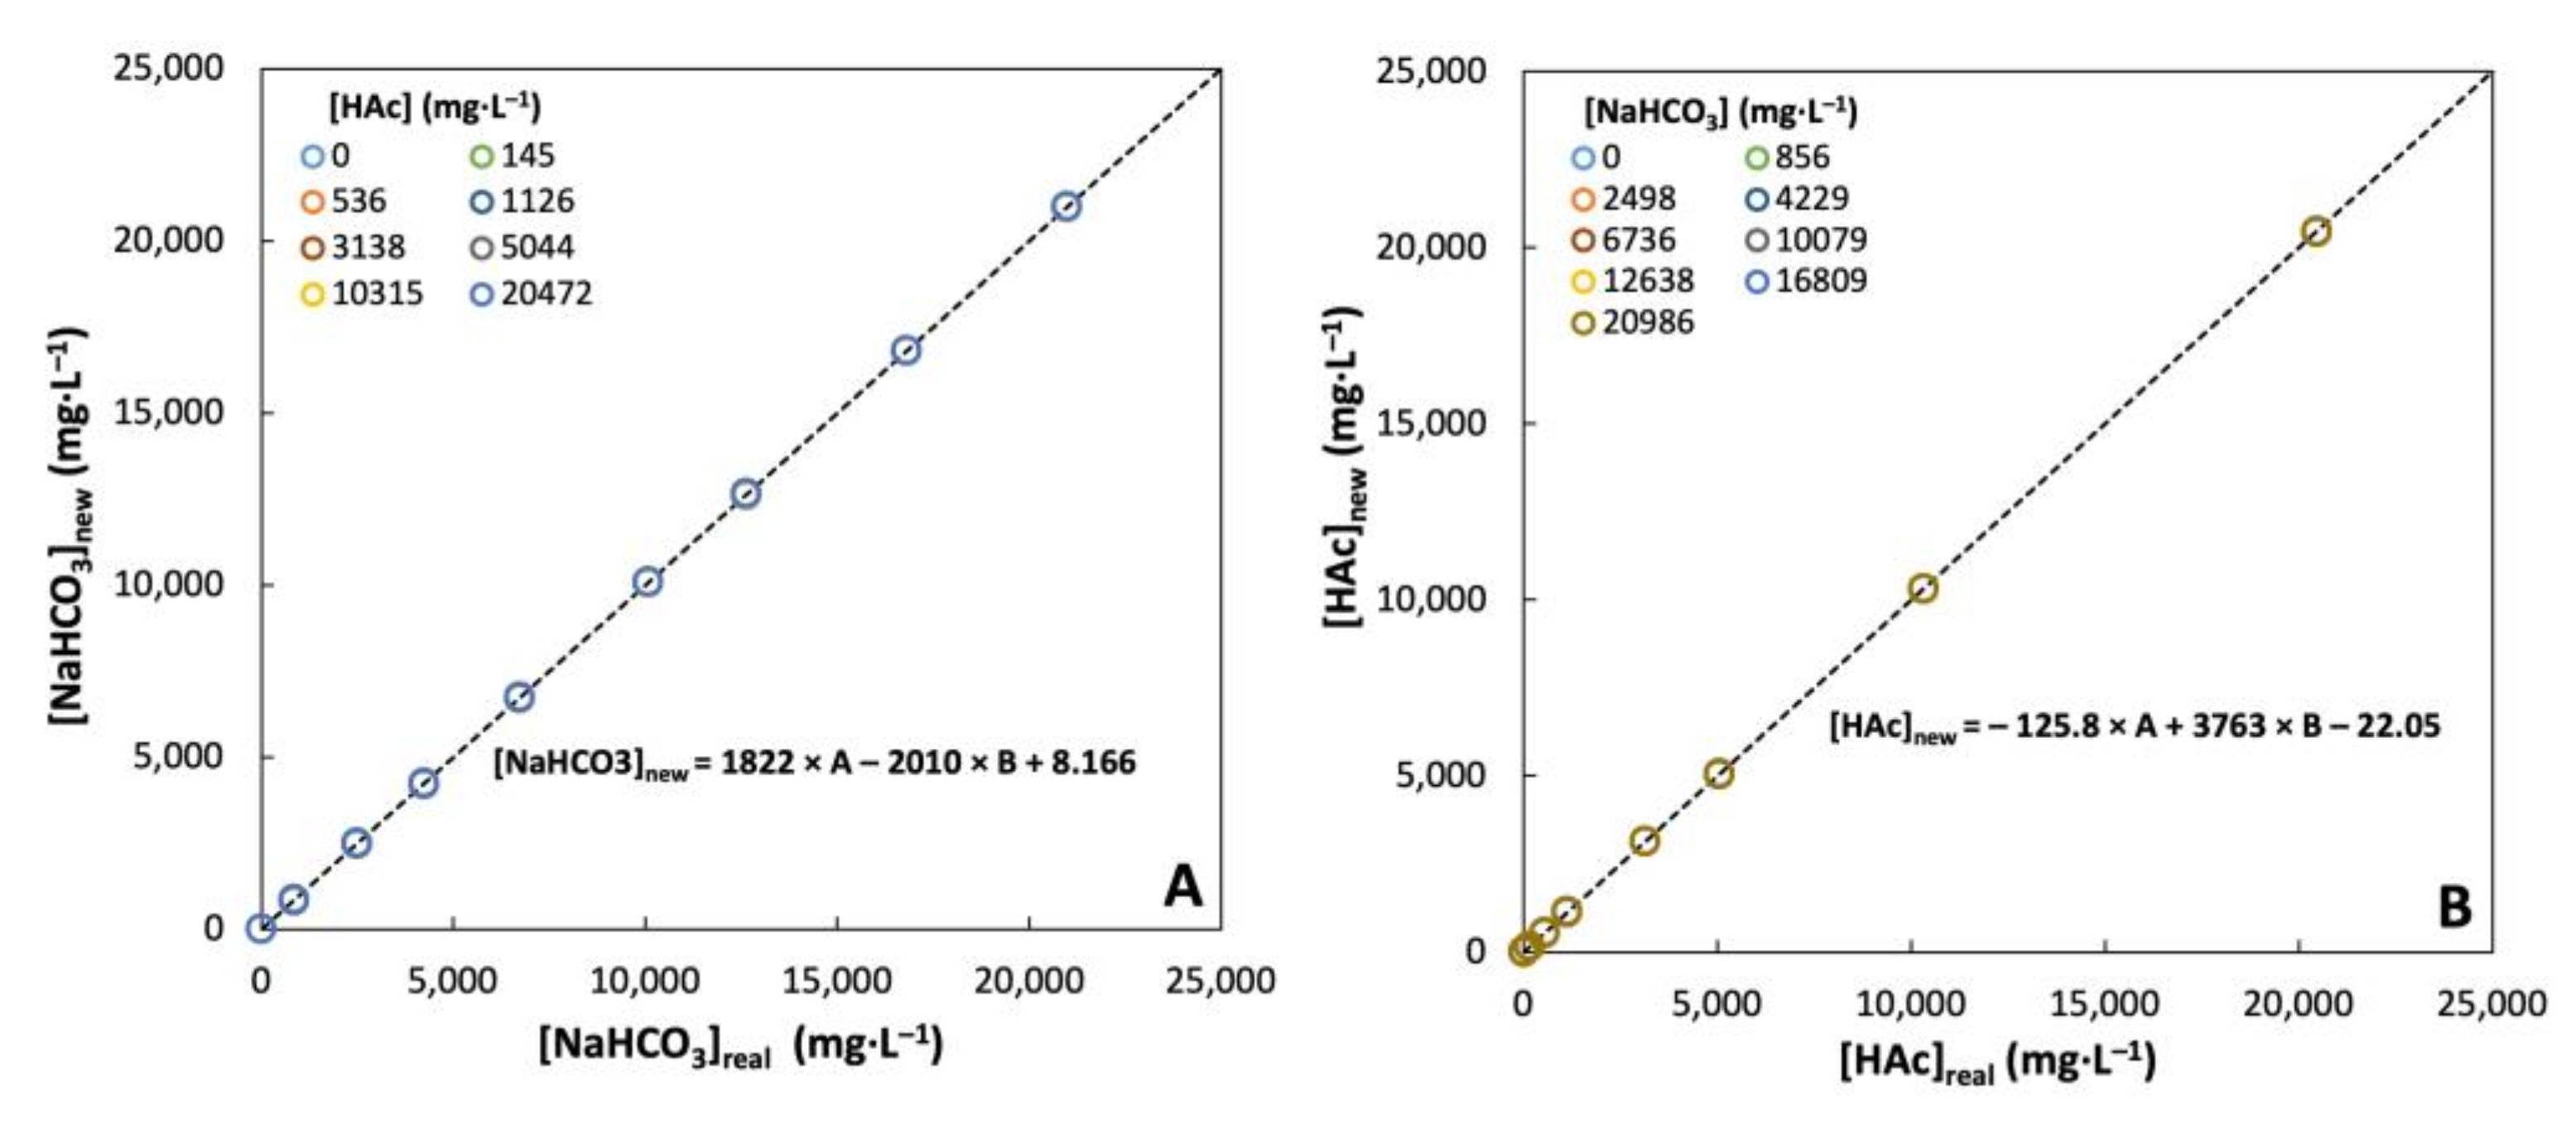
3.3. Proposing New Formulas for FOS and TAC Estimation

Since the determination of both [NaHCO3] and [HAc] depends on each other, it was found that the formulas according to the FOS/TAC method had a lower accuracy when the bicarbonate and/or VFAs concentration was in the average conditions (either low or high).
Two new formulas (Equations (6) and (7)) were proposed to recalculate FOS and TAC in a more accurate way. Using the equivalent volumes at pH = 5.0 and 4.4 obtained by the simulation at different conditions (12 × 12 = 144 datasets of [NaHCO3] and [HAc] ranging from 0 to 40 g·L−1), a multiple linear regression with Scilab was performed in search of their relationships with the true values of [NaHCO3] and [HAc]. The two new formulas with the identified model parameters are shown in Equations (8) and (9).
[ NaHCO 3 ] new = 1822 × A 2010 × B + 8.166
FOS new = [ HAc ] new = 125.8 × A + 3763 × B 22.05
Figure 4A,B shows the recalculated values, denoted [NaHCO3]new and [HAc]new, using the new formulas compared to the theoretical values. In these figures, all of the points at the same bicarbonate or acetic acid level were mixed up, superimposed and, thus, not visible. It appeared that the two proposed formulas made possible the accurate determination of bicarbonate and acetic acid concentrations by equivalent volumes at pH = 5.0 and 4.4. The mean absolute percentage error (MAPE) was reduced from 1346% to 0.33% for the bicarbonate content and from 159% to 0.37% for the acetic acid content in the simulation ranges concerned (see Table 2). This implied that without modifying the experimental protocol of the FOS/TAC method, it would be possible to more precisely estimate the concentration of bicarbonate and acetic acid and, therefore, FOS and TAC, for wider ranges (from 0 to 40 g·L−1) thanks to these two formulas.
We could also, from the empirical FOS and TAC calculated with the Nordmann equations, recalculate the equivalent volumes A and B from previous experiments and then reinject these values into Equations (8) and (9) so as to obtain the corresponding new FOS and TAC, as shown in Equations (10) and (11). This allowed us to correct previous values without repeating the experiments. The dilution level can change the acid–base equilibrium of acetate and bicarbonate. Therefore, it has to be noted that one should apply the same dilution protocol as we did (5 mL of sample + 15 mL of water) when using the new formulas.
[ NaHCO 3 ] corr = 1.820 × TAC Nordmann 0.606 × FOS Nordmann 37.24
TAC corr = 0.595 × [ NaHCO 3 ] corr = 1.083 × TAC Nordmann 0.360 × FOS Nordmann 22.16
FOS corr = 0.126 × TAC Nordmann + 1.133 × FOS Nordmann + 62.95
In Table 2, it is shown that very low MAPEs were obtained by correcting the Nordmann FOS and TAC values using our new formulas.
Knowing that the simulation with Scilab allowed a good prediction of the equivalent volumes of the two pH points and, thus, of the FOS and TAC values, it was possible to use the same program to estimate the equivalent volumes at the other pH points without doing the experiments (not shown). The developed Scilab code allowed to directly perform the multiple linear regression by finding the relations between [NaHCO3] or [HAc] and the equivalent volumes of the titrant. Thanks to the numerical tool, identifying the proper pH equivalent points would no longer be a main factor impacting the accuracy of the FOS and TAC determination.

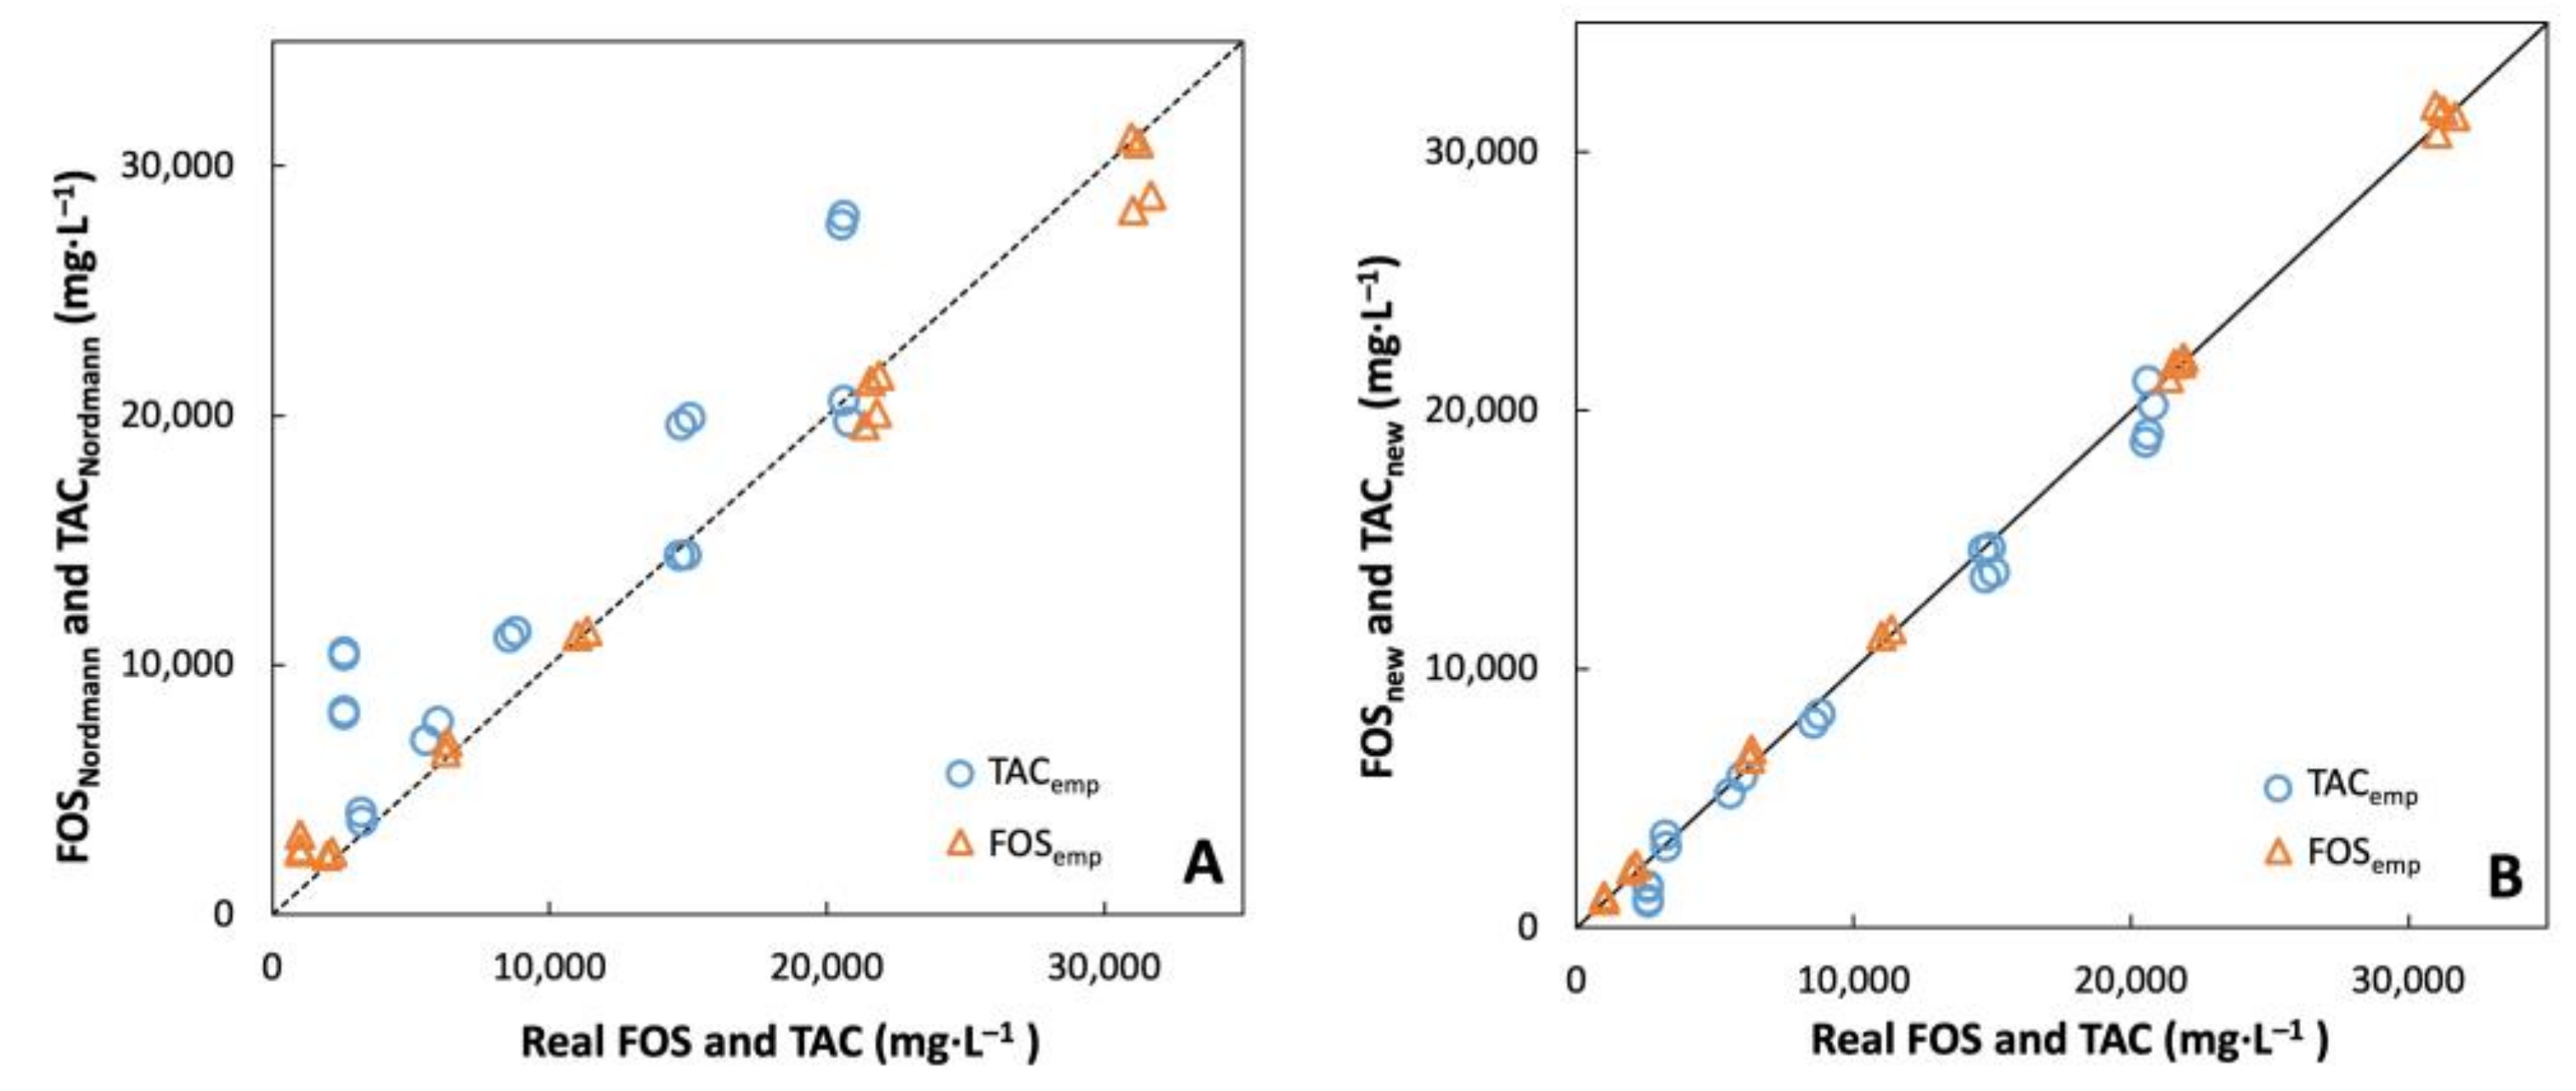
3.4. Experimental Validation of the Proposed Formulas

After acidification and degasification, the empirical TAC and FOS of the digestate were reduced from 11,009 mg CaCO3·L−1 to 2802 ± 181 mg CaCO3·L−1 in terms of TAC and from 2452 mg HAc·L−1 to 1152 mg HAc·L−1 in terms of FOS. These values were both put into new formulas (Equations (11) and (12)) to obtain the corresponding corrected TAC (2598 mg CaCO3·L−1) and FOS (1016 mg HAc·L−1). The latter was considered as the X and Y values that were explained in the Materials and Methods section, and taken into account in calculating different true TAC and FOS combinations shown in Table 1.
Ten conditions with different TAC and FOS combinations were tested using the real anaerobic digestate. Both the empirical FOS and TAC calculated with Nordmann’s method and the new values corrected with new formulas were recorded and put against their corresponding real concentrations in the digestate (see Figure 5).
Results show that by Nordmann’s method, the TAC was systematically overestimated as compared to the FOS, of which Nordmann’s equations showed a relevantly acceptable estimation (Figure 5A). As show in Table 3, the absolute relative errors of TAC and FOS with Nordmann’s formula varied from 1% to 302% and from 1% to 215% with MAPE of 74% and 46%, respectively.
When it came to the TAC and FOS values recalculated with the newly proposed formulas (see Figure 5B), the absolute relative error ranged from 1% to 61% and 1% to 13% for the estimation of TAC and FOS contents (Table 3). The global MAPE for TAC and FOS was, respectively, found at 15.6% and 6%. The major prediction errors for TAC came from the estimation of TAC in very extreme conditions (X/Y + 20,000 and X/Y + 30,000), where highly charged FOS interfered greatly with the determination of a very low TAC. Similarly, the major errors for FOS determination came from the extreme cases where TAC was very high but FOS was very low (X + 11,916/Y and X + 17,874/Y).
When these extreme conditions were not considered (X/Y + 20,000, X/Y + 30,000, X + 11,916/Y and X + 17,874/Y), the MAPE covering moderate conditions (still including digestate with a very high loading of both TAC and FOS) dropped to 5.6% for TAC and 3.7% for FOS. The major difference between the modeled and true values may be attributed to the presence of other impacting factors in the digestate, which could interfere with the titration process of bicarbonate and acetic acid (such as particulates and proteins, etc.). The presence of various types of fatty acids (short-chain and other long-chain acids) in complex media could also contribute to the performance of titration.
The experimental confrontation of both Nordmann’s formulas [6,7] and the newly proposed formulas in the present study confirmed the fact that the former would only be efficient and accurate in a very limited range, while the new formulas could give satisfactory estimation of both TAC and FOS up to, respectively, 20,000 mg CaCO3·L−1 and 31,000 HAc·L−1, except for certain very extreme conditions.
The experiments and the simulation were performed only with acetate. The inclusion of other VFA (propionic, butyric and valeric acids) in the simulation is possible. The original Scilab code is given in Supplementary Materials. One could vary the concentrations of these VFAs to see their respective impact on the final results.
The pKa values of propionic, butyric and valeric acids were so close (around 4.7–4.8, cf Table S1) that the consideration of these species in the titration process had a limited effect on the output results (i.e., A and B values). However, one should be fully conscious of the fact that there exist different calculation methods to report the total VFA content; VFA could be calculated at first in the molar concentration and converted to an equivalent acetic acid mass concentration; the total VFA content could also be a simple sum of all mass concentrations of the concerned acids. The first method did not modify the FOS calculation, for the original Nordmann’s method as well as the proposed model, while the effect of the second one could be significant.

4. Conclusions

The reciprocal impact of TAC and FOS on the determination of each other by the classical FOS/TAC method of Nordmann (1977) was experimentally confirmed both in a synthetic water solution and in anaerobic media. High loading in FOS could greatly impact the determination of TAC and vice versa (relative errors up to 35% in moderate conditions and over 300% in extreme conditions). The present paper proposed two new formulas with which this reciprocal effect was taken into account in order to calibrate the concentration of each. With the help of new formulas, the mean absolute percentage errors between the estimated and the real values were significantly reduced to less than 6% in real anaerobic medium, with a moderate loading of VFAs or bicarbonate.
Wrong FOS/TAC results may lead to an inappropriate operation and, thus, cause digestion failure. The question that arose is the interest and the importance of correcting FOS/TAC calculation formulas. In another word, if, in practice, the correction would be necessary. In Table S2 in the Supplementary Materials, two sets of literature FOS and TAC data of organic waste [16] were collected and recalculated using new formulas. Results showed that the calibration by new formulas could significantly change the judgement on the reactor state; thus, proving it is necessary. The newly proposed equations could allow a more accurate characterization of alkalinity and VFA content in anaerobic digesters, which contributes to a better monitoring of the reactor performance during anaerobic digestion.

Supplementary Materials

The following are available online at https://www.mdpi.com/article/10.3390/app112411843/s1, Figure S1: programming flowchart for the simulation of FOS/TAC titration curves, Table S1: pKa of main compounds in an anaerobic digester at 25 °C (data extracted from Sun et al., 2016 [18]), Table S2: TAC and FOS values reported in literature and calculated using Nordmann method versus the respective corrected values using new formulas (raw data collected from [16]), Scilab code 1: Scilab code for calculation of the sodium bicarbonate contents at different acetic acid concentrations, Scilab code 2: Scilab code for calculation of the acetic acid contents at different sodium bicarbonate concentrations.

Author Contributions

Conceptualization, X.L., A.P., L.A. and T.R.; methodology, X.L., A.P., L.A. and T.R.; software, A.P. and X.L.; validation, A.P. and T.R.; formal analysis, X.L.; investigation, X.L.; resources, M.M.-H. and J.-M.G.; writing—original draft preparation, X.L.; writing—review and editing, A.P., L.A. and T.R.; visualization, X.L. and A.P.; supervision, A.P. and T.R.; project administration, J.-M.G., A.P. and T.R.; funding acquisition, J.-M.G., A.P. and T.R. All authors have read and agreed to the published version of the manuscript.

Funding

This research was funded by the ANRT (Association Nationale de la Recherche et de la Technologie, France, CIFRE no. 2017/1298) and Cultimer France Producteurs Associés for the Ph.D. thesis of Maël Mercier-Huat.

Institutional Review Board Statement

Not applicable.

Informed Consent Statement

Not applicable.

Data Availability Statement

The data presented in this study are available on request from the corresponding author.

Acknowledgments

The authors would like to extend their thanks to Stéphane Mottelet (TIMR, université de technologie de Compiègne) for his valuable support on Scilab code realization.

Conflicts of Interest

The authors declare no conflict of interest.

References

  1. Amodeo, C.; Hattou, S.; Buffière, P.; Benbelkacem, H. Temperature Phased Anaerobic Digestion (TPAD) of Organic Fraction of Municipal Solid Waste (OFMSW) and Digested Sludge (DS): Effect of Different Hydrolysis Conditions. Waste Manag. 2021, 126, 21–29. [Google Scholar] [CrossRef] [PubMed]
  2. DiLallo, R.; Albertson, O.E. Volatile Acids by Direct Titration. J. Water Pollut. Control. Fed. 1961, 33, 356–365. [Google Scholar]
  3. Lili, M.; Biró, G.; Sulyok, E.; Petis, M.; Borbély, J.; Tamás, J. Novel Approach on the Basis of FOS/TAC Method. In Proceedings of the Analele Universităţii din Oradea, Fascicula Protecţia Mediului, Oradea, Romania, 4–5 November 2011; Volume 17, pp. 713–718. [Google Scholar]
  4. Møller, H.B.; Ward, A.J. Modeling Volatile Fatty Acid Concentration in Livestock Manure–Based Anaerobic Digesters by Simple Titration. Environ. Eng. Sci. 2011, 28, 507–513. [Google Scholar] [CrossRef]
  5. Wu, C.; Huang, Q.; Yu, M.; Ren, Y.; Wang, Q.; Sakai, K. Effects of Digestate Recirculation on a Two-Stage Anaerobic Digestion System, Particularly Focusing on Metabolite Correlation Analysis. Bioresour. Technol. 2018, 251, 40–48. [Google Scholar] [CrossRef]
  6. Nordmann, W. Die Überwachung Der Schlammfaulung. KA-Inf. Betr. Beil. Korresp. Abwasser 1977, 3, 77. [Google Scholar]
  7. Voß, E.; Weichgrebe, D.; Rosenwinkel, K. FOS/TAC–Deduction, Methods, Application and Significance. In Proceedings of the Internationale Wis-Senschaftstagung, Biogas Science, Erding, Germany, 2–4 December 2009. [Google Scholar]
  8. McGhee, T.J. A Method for Approximation of the Volatile Acid Concentrations in Anaerobic Digesters. Water Sew. Works 1968, 165, 162–166. [Google Scholar]
  9. Jenkins, S.R.; Morgan, J.M.; Sawyer, C.L. Measuring Anaerobic Sludge Digestion and Growth by a Simple Alkalimetric Titration. J. Water Pollut. Control. Fed. 1983, 55, 448–453. [Google Scholar]
  10. Ripley, L.E.; Boyle, W.C.; Converse, J.C. Improved Alkalimetric Monitoring for Anaerobic Digestion of High-Strength Wastes. J. Water Pollut. Control. Fed. 1986, 58, 406–411. [Google Scholar]
  11. Kapp, H. Schlammfaulung Mit Hohem Feststoffgehalt. Stuttgarter Berichte Zur Siedlungswasserwirtschaft; Kommissionsverlag Oldenbourg: München, Germany, 1984; p. 300. [Google Scholar]
  12. Moosbrugger, R.E.; Wentzel, M.C.; Ekama, G.A.; Marais, G.V.R. A 5 PH Point Titration Method for Determining the Carbonate and SCFA Weak Acid/Bases in Anaerobic Systems. Water Sci. Technol. 1993, 28, 237–245. [Google Scholar] [CrossRef]
  13. Lahav, O.; Shlafman, E.; Morgan, B.E.; Loewenthal, R.E.; Tarre, S. Accurate On-Site Volatile Fatty Acids (VFA) Measurement in Anaerobic Digestion—Verification of a New Titrative Method. In Proceedings of the VII Latin American Workshop and Symposium on Anaerobic Digestion, Merida, Mexico, 22–25 October 2002; pp. 118–125. [Google Scholar]
  14. Lahav, O.; Morgan, B.E.; Loewenthal, R.E. Rapid, Simple, and Accurate Method for Measurement of VFA and Carbonate Alkalinity in Anaerobic Reactors. Environ. Sci. Technol. 2002, 36, 2736–2741. [Google Scholar] [CrossRef]
  15. Buchauer, K. A comparison of two simple titration procedures to determine volatile fatty acids in influents to waste-water and sludge treatment processes. Water SA 1998, 24, 49–56. [Google Scholar]
  16. Jobling Purser, B.J.; Thai, S.-M.; Fritz, T.; Esteves, S.R.; Dinsdale, R.M.; Guwy, A.J. An Improved Titration Model Reducing over Estimation of Total Volatile Fatty Acids in Anaerobic Digestion of Energy Crop, Animal Slurry and Food Waste. Water Res. 2014, 61, 162–170. [Google Scholar] [CrossRef]
  17. Lahav, O.; Morgan, B. Titration Methodologies for Monitoring of Anaerobic Digestion in Developing Countries? A Review. J. Chem. Technol. Biotechnol. 2004, 79, 1331–1341. [Google Scholar] [CrossRef] [Green Version]
  18. Sun, H.; Wu, S.; Dong, R. Monitoring Volatile Fatty Acids and Carbonate Alkalinity in Anaerobic Digestion: Titration Methodologies. Chem. Eng. Technol. 2016, 39, 599–610. [Google Scholar] [CrossRef]
  19. Vannecke, T.P.W.; Lampens, D.R.A.; Ekama, G.A.; Volcke, E.I.P. Evaluation of the 5 and 8 PH Point Titration Methods for Monitoring Anaerobic Digesters Treating Solid Waste. Environ. Technol. 2015, 36, 861–869. [Google Scholar] [CrossRef] [PubMed]
  20. O’Brien, J.E.; Donlan, R.J. Direct Method for Differentiating Bicarbonate and Acetate in Digester Control. In Abstracts of Papers of the American Chemical Society; American Chemical Society 1155 16TH ST, NW: Washington, DC, USA, 1977; Volume 173, p. 121. [Google Scholar]
  21. Pauss, A.; Roza, A.; Ledrut, M.-J.; Naveau, H.; Nyns, E.-J. Bicarbonate Determination in Complex Acid-base Solutions by a Back-titration Method. Environ. Technol. 1990, 11, 469–476. [Google Scholar] [CrossRef]
  22. American Public Health Association. Standard Methods for the Examination of Water and Wastewater, 15th ed.; American Public Health Association: Washington, DC, USA, 1980. [Google Scholar]
  23. Nativ, P.; Gräber, Y.; Aviezer, Y.; Lahav, O. A Simple and Accurate Approach for Determining the VFA Concentration in Anaerobic Digestion Liquors, Relying on Two Titration Points and an External Inorganic Carbon Analysis. ChemEngineering 2021, 5, 15. [Google Scholar] [CrossRef]
  24. Mu, Z.-X.; He, C.-S.; Jiang, J.-K.; Zhang, J.; Yang, H.-Y.; Mu, Y. A Modified Two-Point Titration Method for the Determination of Volatile Fatty Acids in Anaerobic Systems. Chemosphere 2018, 204, 251–256. [Google Scholar] [CrossRef]
  25. Münch, E.V.; Greenfield, P.F. Estimating VFA Concentrations in Prefermenters by Measuring PH. Water Res. 1998, 32, 2431–2441. [Google Scholar] [CrossRef]
  26. Charnier, C.; Latrille, E.; Lardon, L.; Miroux, J.; Steyer, J.P. Combining PH and Electrical Conductivity Measurements to Improve Titrimetric Methods to Determine Ammonia Nitrogen, Volatile Fatty Acids and Inorganic Carbon Concentrations. Water Res. 2016, 95, 268–279. [Google Scholar] [CrossRef]
  27. Sun, H.; Guo, J.; Wu, S.; Liu, F.; Dong, R. Development and Validation of a Simplified Titration Method for Monitoring Volatile Fatty Acids in Anaerobic Digestion. Waste Manag. 2017, 67, 43–50. [Google Scholar] [CrossRef]
  28. Chatterjee, B.; Radhakrishnan, L.; Mazumder, D. New Approach for Determination of Volatile Fatty Acid in Anaerobic Digester Sample. Environ. Eng. Sci. 2018, 35, 333–351. [Google Scholar] [CrossRef]
  29. Zan, F.; Zeng, Q.; Chi, K.; Hao, T.; Ekama, G.A. A Novel Approach for Rapidly Measuring Volatile Fatty Acids in Anaerobic Process. Water Res. 2020, 182, 115960. [Google Scholar] [CrossRef] [PubMed]
Figure 1. Acid–base equilibria of different compounds as a function of pH at 25 °C.
Applsci 11 11843 g001
Figure 2. Experimental (points) and simulated (lines) sodium bicarbonate concentrations versus true sodium bicarbonate concentrations at different acetic acid concentration levels.
Applsci 11 11843 g002
Figure 3. (A) Experimental (points) and simulated (lines) acetic acid concentrations versus true acetic acid concentrations at different sodium bicarbonate concentrations; (B) Figure 3A zoomed for [HAc] between 0 and 5000 mg·L−1.
Applsci 11 11843 g003
Figure 4. (A) Recalculated sodium bicarbonate concentrations (points) using Equation (8) versus true sodium bicarbonate concentrations at different acetic acid levels; (B) recalculated acetic acid concentrations (points) using Equation (9) versus true acetic acid concentrations at different sodium bicarbonate levels.
Applsci 11 11843 g004
Figure 5. (A) Nordmann’s FOS and TAC versus real FOS and TAC values in the tested anaerobic digestate; (B) FOS and TAC calculated from new formulas versus real FOS and TAC values in the tested anaerobic digestate.
Applsci 11 11843 g005
Table 1. Tested conditions in degassed digestate for experimental validation of proposed new formulas.
Total TAC (mg CaCO3·L−1)
XX + 596X + 2979X + 5958X + 11,916X + 17,874
Total FOS
(mg HAc·L−1)
Y
Y + 1000
Y + 5000
Y + 10,000
Y + 20,000
Y + 30,000
Table 2. MAPE (mean absolute percentage error) of the simulated concentrations with Nordmann’s formulas versus respective real values and MAPE of the simulated concentrations with new formulas versus respective real values ([NaHCO3] and [HAc] ranging from 0 to 40,000 mg·L−1 in water solutions).
MAPE[NaHCO3]Nordmann[NaHCO3]new[NaHCO3]corr
[NaHCO3]real1346%0.33%0.33%
MAPE[HAc]Nordmann[HAc]new[HAc]corr
[HAc]real159%0.37%0.41%
Table 3. MAPE (mean absolute percentage errors) for TAC/FOS with Nordmann’s method (first line) and with new formulas (second line) for each sodium bicarbonate and sodium acetate condition in the digestate.
Total TAC (mg CaCO3·L−1)
X aX + 596X + 2979X + 5958X + 11,916X + 17,874
Total FOS
(mg HAc·L−1)
Y bNA c
NA
3%/153%
1%/14%
3%/215%
3%/13%
Y + 1000 22%/18% d
8%/13% e
Y + 5000 28%/7%
5%/7%
Y + 10,000 30%/1%
7%/2%
Y + 20,000211%/8%
40%/1%
33%/1%
9%/1%
Y + 30,000302%/9%
61%/1%
35%/1%
8%/2%
a Initial TAC value of degassed digestate using Equation (11), X = 2598 mg CaCO3·L−1. b Initial FOS value of degassed digestate using Equation (12), Y = 1016 mg HAc·L−1. c MAPE is not available since X and Y calculated with new formulas were considered as real values in degassed digestate. d MAPE for TACNordmann/MAPE for FOSNordmann. e MAPE for TACnew/MAPE for FOSnew.
Publisher’s Note: MDPI stays neutral with regard to jurisdictional claims in published maps and institutional affiliations.

