1. Introduction
In the current environmental and energy context, the industrial sector is being forced to reduce its energy consumption. This involves improving the energy efficiency of its systems [
1]. Indeed, energy efficiency is one of the pillars of the EU’s Energy Union strategy and has been proposed as a highly effective way to lower emissions, reduce energy dependency, and increase security of supply. Thanks to a Thermal Energy Storage (TES) system, the production and consumption of energy can be decoupled, as this is a powerful tool to optimize energy efficiency, valorizing energy that would otherwise be wasted. For these reasons, TES systems have received growing attention in recent years, as shown by Alva et al., whose review presents most of the applications, advances and scientific and technological challenges of this technology [
2]. Combining high storage capacities and possible energy restitution at almost constant temperature, the solution of TES using phase change materials, called PCMs, appears as a particularly attractive solution. However, the current implementation of these storage systems comes up against scientific and technological obstacles, regarding both the storage material and the system, but also as to its integration and management in industrial processes [
3].
To tackle these challenges, a collaborative project aiming at developing a solid–liquid PCM TES system has been carried out. The temperature range targeted is between 50 and 85 °C, and so this can be considered as a low-temperature TES system. Typical end uses in this temperature range are district heating systems [
4,
5], domestic heating systems [
6], or low-temperature waste heat recovery for industry [
7], including in mobile applications [
8]. Each TES is composed of a “storage material”, in our case a PCM, integrated into a “system”, and it can be interfaced with one or more applications using a heat transfer fluid (HTF). To integrate the TES in these applications, an envelope ensuring the interface between the HTF and the PCM must be designed. This envelop should show good thermal stability, corrosion resistance and mechanical resistance; guarantee an effective barrier while optimizing the heat transfer between the PCM and the HTF; allow easy implementation [
9]. Two routes are usually chosen: PCM addition to a jacketed heat exchanger [
10] or PCM encapsulation in spherical, cylindrical [
11] or parallelepipedal [
12] containers. The encapsulation technique is employed at the industrial scale [
13,
14,
15], and even at the micro-scale level [
16], and has been chosen for this project. The selected storage process consists of filling a cylindrical tank with plastic capsules that contain the PCM. An HTF flows through the tank and around the capsules at a low velocity. During the charge mode, the temperature of the HTF is higher than the melting temperature of the PCM, causing the encapsulated PCM to melt. To discharge the heat from the storage, the cold fluid coming from the load receives energy from the capsules, causing the PCM to crystallize. Once this design has been selected, some questions and technological barriers are still present at different levels.
First, regarding the materials, various PCMs applicable in this range of temperature (50–85 °C) are already known [
17]. Based on a previous literature screening [
18,
19,
20] and on technical requirements, an industrial-grade fatty acid mixture was selected. Indeed, both its melting temperature and its volume storage capacity enthalpy are in the targeted range. Furthermore, this material is not corrosive, nor is it flammable or toxic to humans and/or the environment. Finally, it is available in industrial quantities and its cost per kilogram does not exceed the price of EUR 5/kg to fulfil the industrial partner’s requirement. While the thermo-physical properties of pure or binary fatty acids are well-known, data regarding industrial-grade mixtures, especially aging and compatibility with the encapsulation material, are still missing.
Second, the PCM’s behavior should be studied while it is being implemented in a storage system to fulfill a technological scale-up. In the focused temperature range, some laboratory-scale experiments have been conducted in the context of encapsulated PCM for exhaust gas heat recovery [
21] or tubular heat exchange for domestic heat water supply [
22]. However, both the PCM and encapsulation material in these processes are different from those in this project. A set-up has to be built to study the specific experimental configurations of interest.
Third, those experimental works can demonstrate the technical solutions’ feasibility and provide information on their behavior at the system level. However, the extended investigation of the influence of variations in the operating conditions or dimensioning choices must be approached by a numerical model.
The following paper is divided into three parts that deal with the three aforementioned issues: PCM characterization and aging related to its use conditions; the system performance assessment through prototype development and running; parametric study by a numerical model of the operating conditions and sizing choices.
2. Calorimetric Analysis, Aging and Compatibility Studies on Industrial-Grade Fatty Acid Mixture
The PCM was supplied by the chemical product trading company Altichem
®. This product is an industrial-grade mixture of different fatty acids in the proportions listed in
Table 1, mainly stearic acid and palmitic acid.
Stearic acid (SA) or octadecanoic acid, CH
3(CH
2)
16COOH, is a fatty acid with interesting chemical characteristics (non-toxic, non-corrosive, MSDS with only one symbol: Xn). It is a white to yellowish-white amorphous waxy solid, with a tallow-like odor and taste, that is very slightly soluble in water but soluble in alcohol, ether and acetone. It is a combustible when exposed to heat or flame. Palmitic acid (PA) or hexadecanoic acid, CH
3(CH
2)
14COOH, has the same characteristics. PA is naturally present in palm oil and various animals or plants, and widely used in the food industry and soap fabrication. SA is used in a wide range of applications, such as in candles; in chemicals; in dispersants; as a softener in rubber compounds, food packaging and PVC lubricant; a direct food additive; a clarifying agent (wine); a textile auxiliary; an intermediate for paints; an emollient/superfatting agent in cosmetics; a paper sizing ingredient; a masticatory substance in chewing gum; in pharmaceuticals [
23]. SA’s latent heat of fusion is equal to 200 J/g and its density is 940 kg/m
3, thus, its volume storage capacity is about 52 kWh/m
3 [
24]. This value is quite close to that of PA, 51.5 kWh/m
3, with a latent heat of fusion equal to 206 J/g and a density of 900 kg/m
3 [
25]. Their melting temperatures are respectively 70 and 63 °C.
Although the properties of pure or binary fatty acid are well documented [
25], data regarding their industrial-grade use are missing, and a complete experimental characterization of the PCM mixture must be performed. Furthermore, the stability of the key thermo-physical properties over thermal cycling and extended temperature exposure periods must be studied.
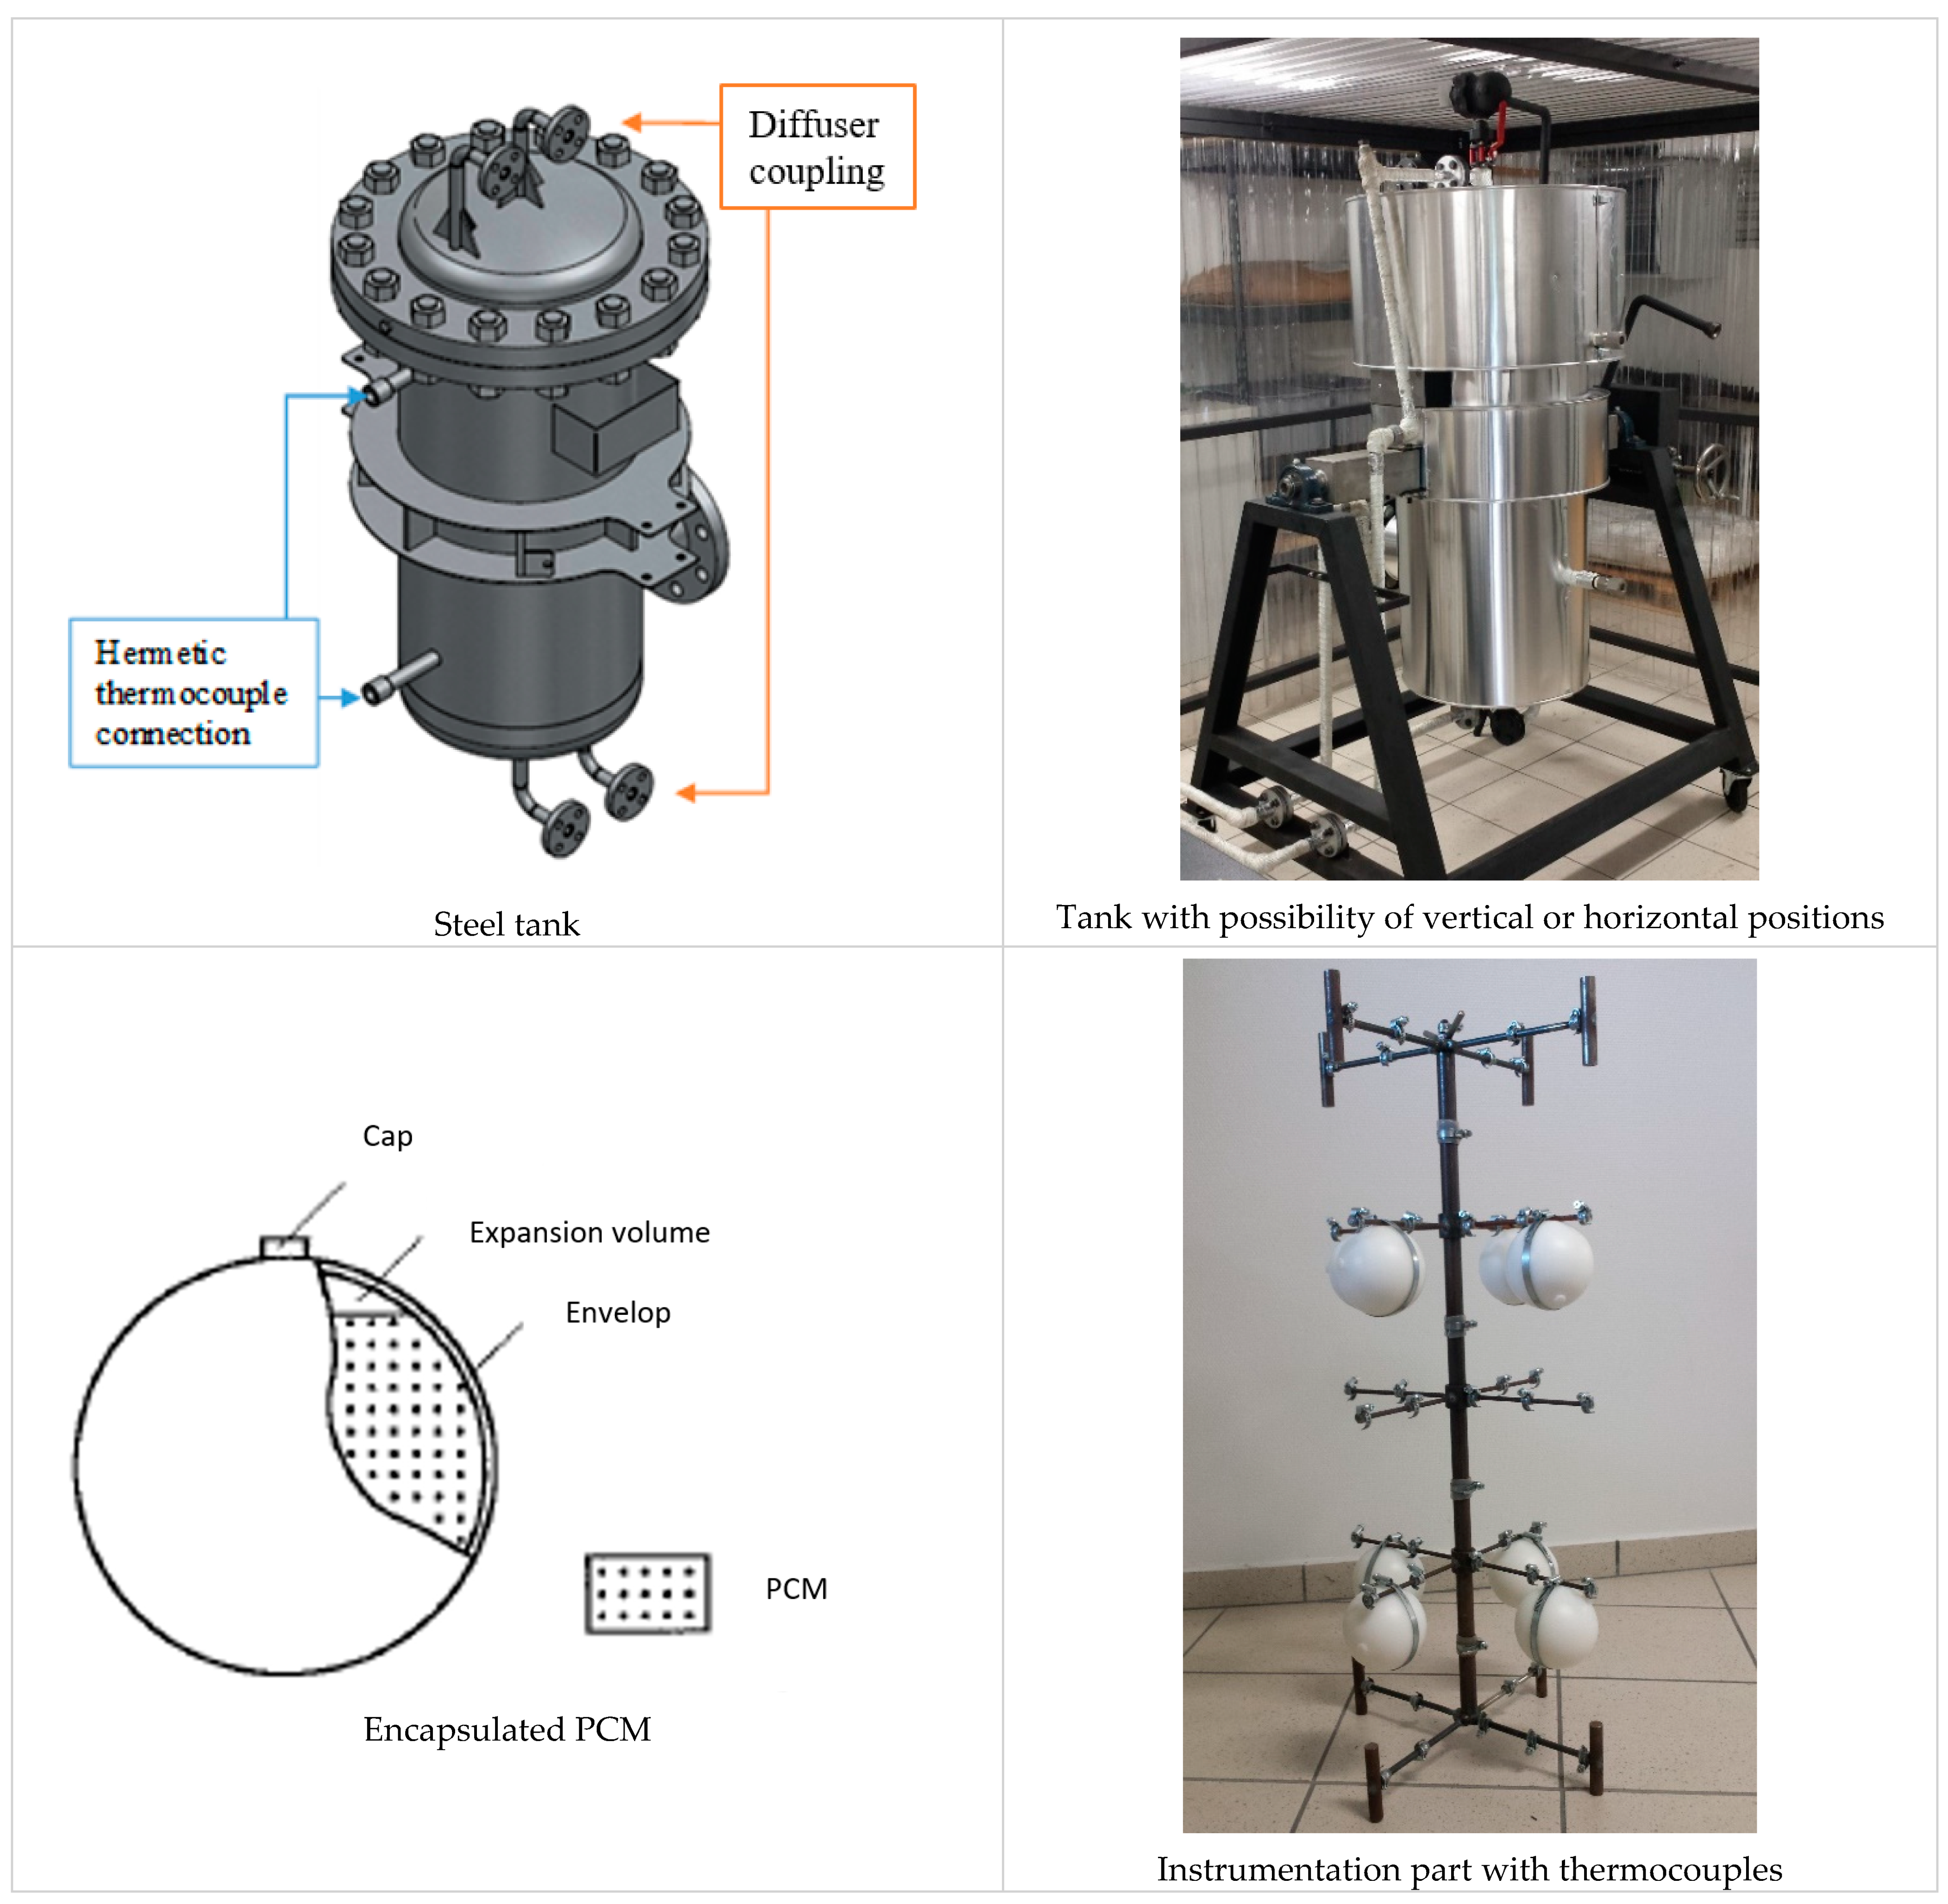
Moreover, as the encapsulation technique has been chosen to ensure the interface between the HTF and the PCM in the TES system, the design of the test bench (
Section 3) will include spherical polyolefin capsules filled with the PCM mixture. These capsules, provided by the industrial partner, are called nodules and are made of polyolefin (outer diameter 98 mm, width 2 mm). Thermal characterization, aging and compatibility studies of the industrial-grade SA–PA mixture with theses nodules are thus necessary.
2.1. Experimental Procedure
Two measurement devices were used: the differential scanning calorimetry (DSC) technique and thermogravimetric (TD) analysis.
The DSC technique is used to validate the basic parameters of the PCMs, namely, their melting temperature (
Tmp) and enthalpy variation (
L) during phase change. The melting point temperature is approximated by the onset technique if the PCM is pure, but if mixtures are analyzed, this onset refers only to the beginning of the transition. The latent heat is determined from the integration of the heat flow signal over the transition period [
26]. Both these steps were undertaken using the Setaram DSC131 in 120 µL cells. A melting/crystallization cycle is carried out at a heating rate of 2 °C/min, limiting the cells’ inner thermal gradients.
The stability of the PCM over thermal cycles is then characterized using the same technique but on a different equipment (Perkin-Elmer Pyris Diamond), reducing the experiment time as it works with higher heating rates (20 °C/min), thanks to a small crucible (60 µL) and a power compensation system.
Both measurements follow a similar temperature scan protocol, involving at least three melting/crystallization cycles around the melting temperature (+/−35 and 30 °C, respectively, for the parameters’ validation and the stability study), each cycle being separated by an isothermal plateau ensuring a complete phase change (5 min for the Setaram DSC131 and 1 min for the Perkin Elmer Pyris Diamond). The first thermal cycle melts the PCM and generates its homogeneous distribution at the bottom of the crucible to optimize its thermal contact with the walls. The second cycle, called the reference cycle, is used to measure the temperature and the change in enthalpy during the phase transition. Finally, the third cycle is used to check the thermo-physical properties measured during the second cycle. That third cycle is then compared to the 38th and 75th cycles in the case of the stability study.
The cell and sample masses were weighted before and after the DSC measurement using a Mettler Toledo XP26 (uncertainty ± 0.002 mg). Additionally, the two calorimeters were calibrated, for temperature and energy, using five standard materials whose properties are referenced in
Table 2.
Measurement uncertainties due to environmental conditions (temperature and humidity variations) and experimental conditions (related to the measuring devices during filling, packaging and weighting of the crucibles in the first instance, and then to the post-processing of the results in the second instance) were estimated via a repeatability study on a standard substance whose melting temperature is closest to our field of study, i.e., Naphthalene. Five strictly identical experiments were performed on each calorimeter to determine the standard deviation (
σ) of the
Tmp and
L distribution. The uncertainty (
δ) was then provided by Student’s Law (Equation (1)), which is particularly suitable when the number of experiments is small.
StN−1,γ is Student’s number, which depends on the number of experiments and the level of confidence, γ, desired (in our case N = 5 and γ = 99%, thus St4.99% = 4.604). The application of this method to the Setaram DSC131 apparatus leads us to consider an uncertainty of ±0.2 °C on the melting temperature and ±4.9% on the latent heat. As for the Perkin Elmer Pyris Diamond DSC, given our experimental conditions, with higher heating rates, these uncertainties are respectively ±0.5 °C and ±1.3%.
The TG analysis is used to observe the PCM mixture’s mass variations when it is subjected to a temperature rise in a controlled atmosphere. A mass loss above 1% of the initial mass would reveal a thermal degradation. The experiment is performed with Setaram SETSYS apparatus and begins with an isothermal plateau imposed at 20 °C. Then the temperature is raised at 2 °C/min up to 150 °C. The chosen carrier gas is air in respect to the technological target of this research work and the complications of conditioning a PCM within a spherical capsule under an inert atmosphere.
2.2. Thermal Characterization of Stearic Acid–Palmitic Acid Mixture
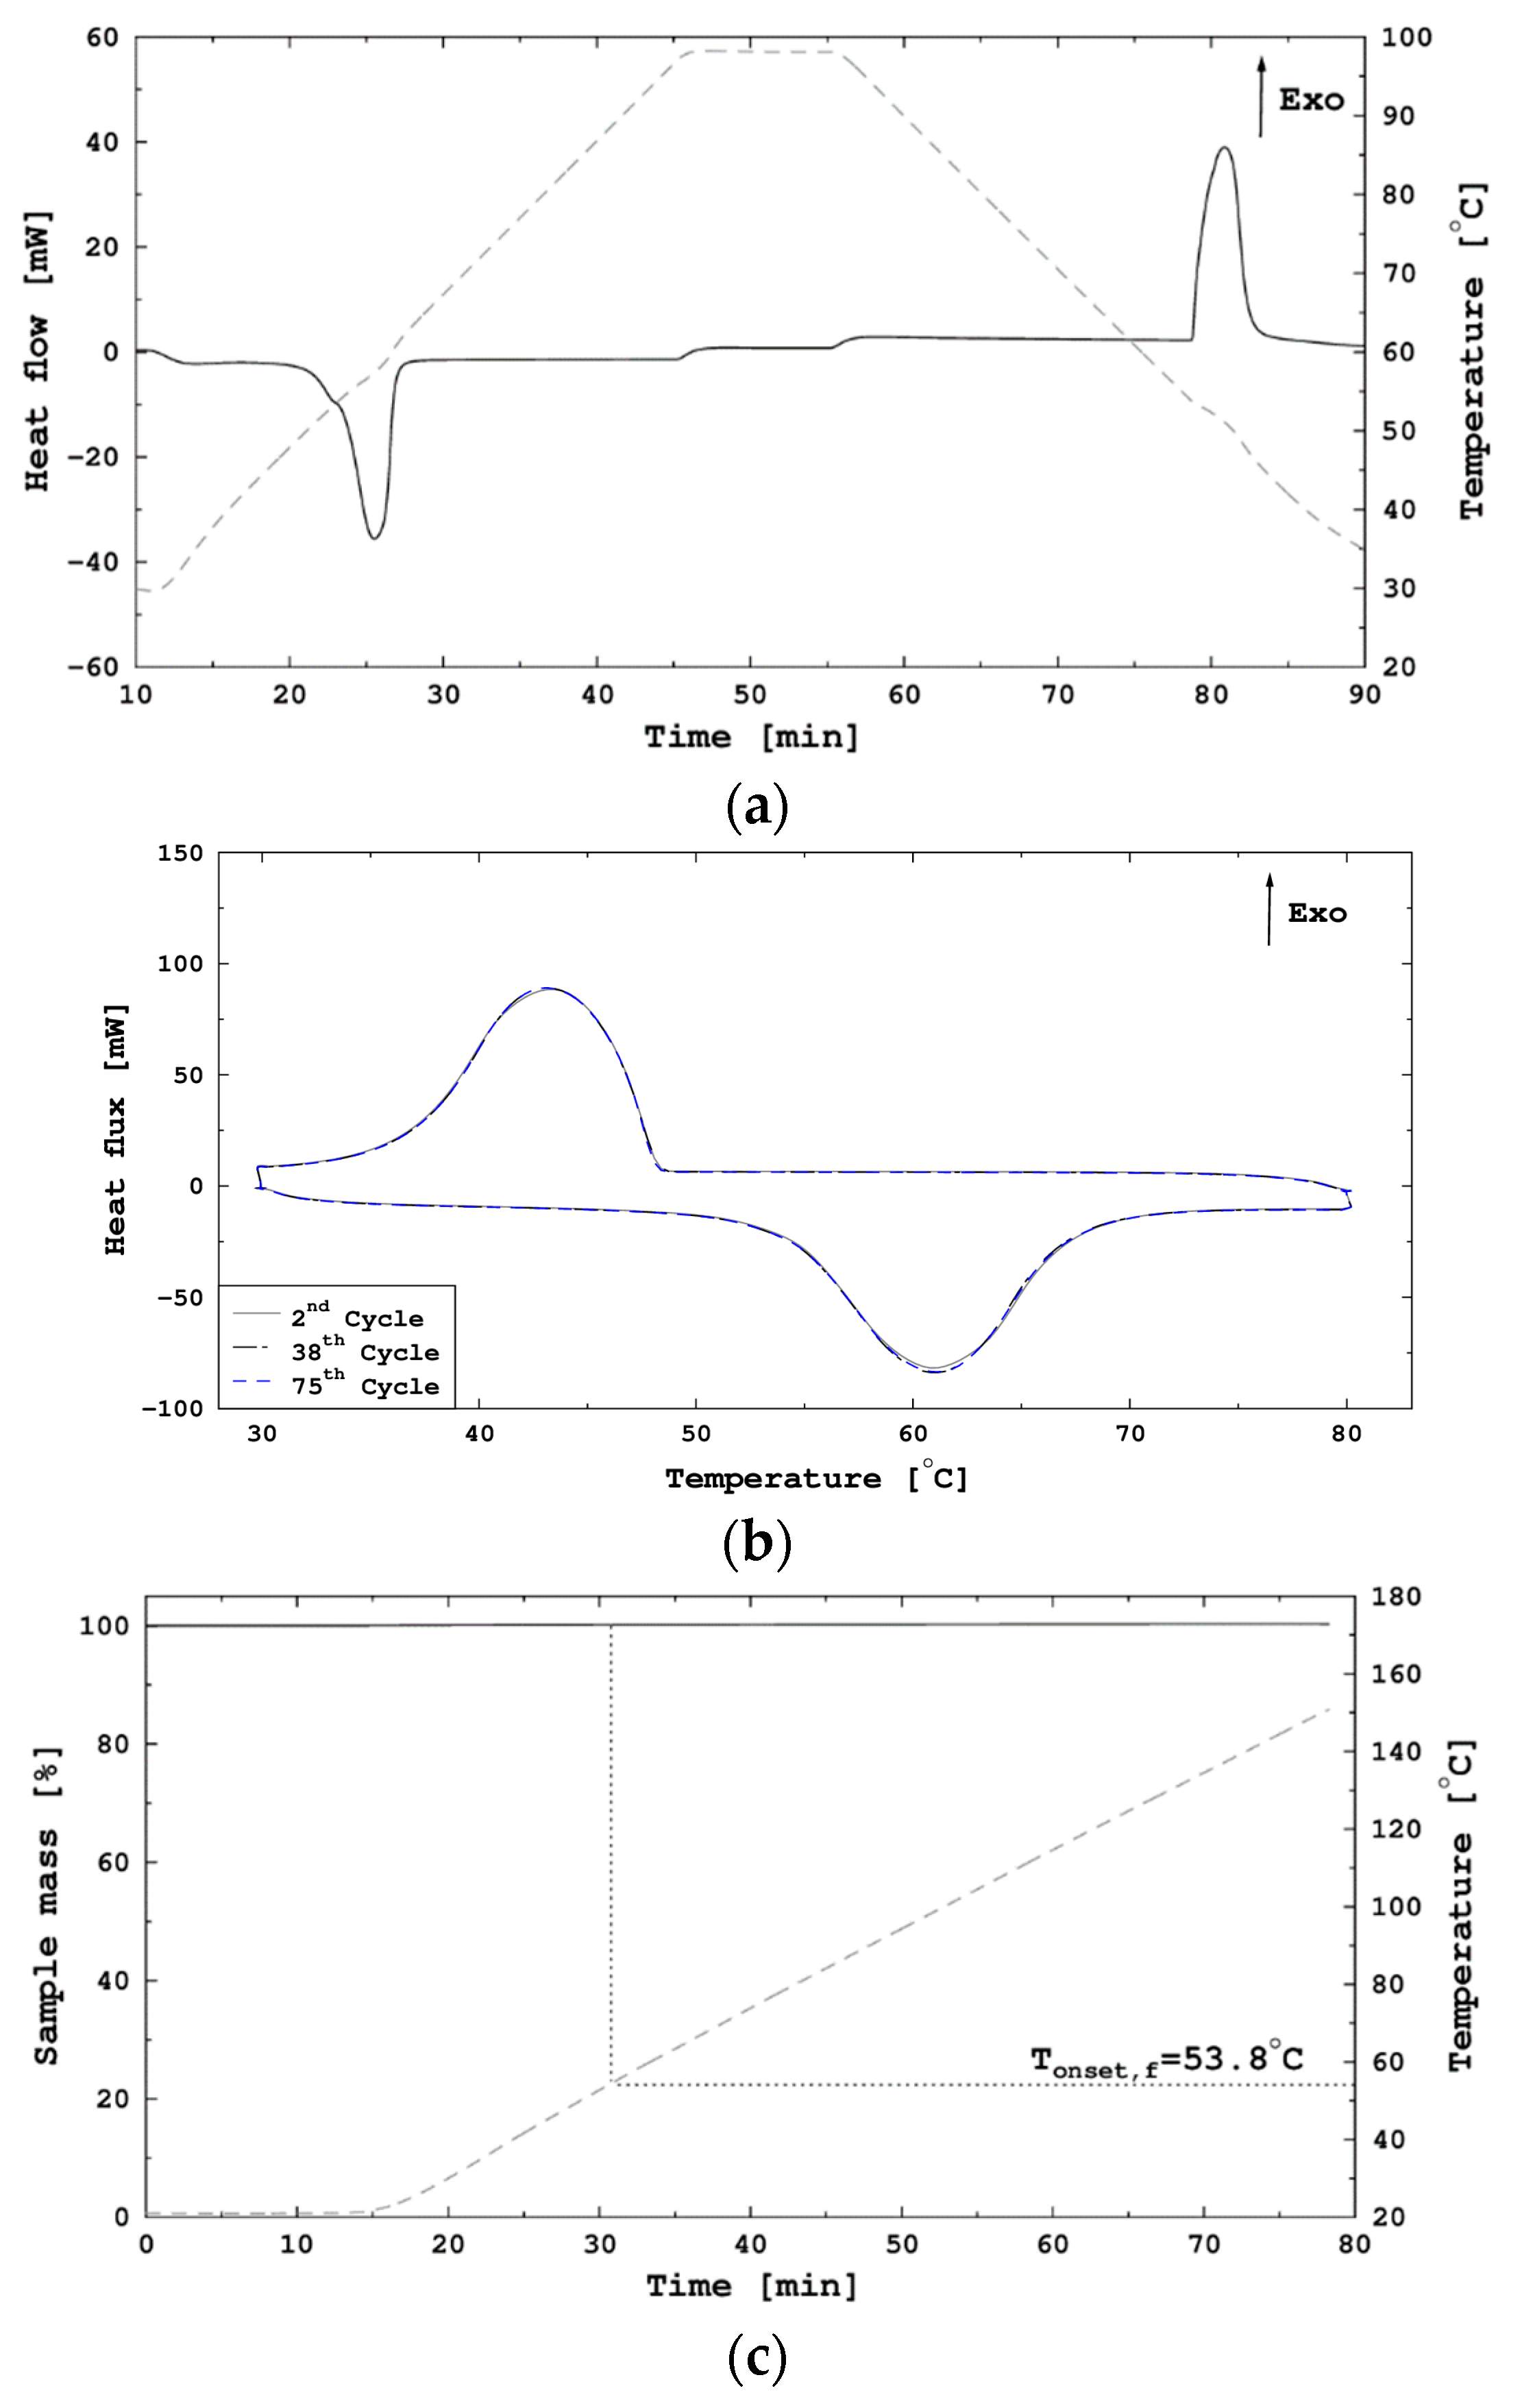
Figure 1 presents results of the thermal analysis of the SA–PA mixture.
Figure 1a shows the result of DSC in dynamic mode using the Setaram DSC131. The mixture showed no supercooling issue for a sample mass of 32.324 ± 0.004 mg. The melting onset temperature was measured at 53.8 ± 0.2 °C, and the change in enthalpy of fusion was estimated at 178 ± 9 J/g, i.e., 47.3 kWh/m
3. Those properties are equal to those measured by [
27] for a similar industrial fatty acid mixture, and close to the industrial-grade pure stearic acid studied by [
28].
Figure 1b presents the results of thermal cycling using the Perkin Elmer Pyris Diamond DSC with the superposition of the 2nd, 38th and 75th cycles of the SA–PA mixture. The mass of the sample is then 11.080 ± 0.004 mg. The results indicate that this PCM keeps its thermo-physical properties during thermal cycling as the 2nd, 38th and 75th cycle thermograms are strictly similar.
Figure 1c shows the thermogravimetric analysis of the SA–PA mixture (Setaram SETSYS apparatus). The melting onset temperature is plotted on the graph (53.8 °C). It can be noted that up to the final temperature of the experiment, i.e., 150 °C, no mass loss is evident.
2.3. Aging of SA–PA Mixture
The SA–PA mixture’s thermal stability was assessed through long-term exposure to temperatures above its melting temperature, at levels that could be encountered in an industrial context. PCM samples in hermetically sealed flasks were put in three stoves and monitored at the following temperatures: 65 °C, 75 °C and 85 °C. The properties were examined after 7, 14, 21 and 28 days, each measurement being conducted on a dedicated flask to avoid sample pollution. The standard operating conditions involve stability at 10 °C above the melting temperature, while isolated monitoring accidents could expose the PCM at higher temperatures for shorter periods. Those accidental exposure durations are difficult to predict, but as an order of magnitude, a 20 min exposure per week would lead to approximatively 15 days of high-temperature exposure throughout the 20 years of a system’s lifetime. The aging studies were then conducted using such durations.
As a first step, a visual check of the samples in the oven was carried out to highlight the possible impact of the temperature and duration of the experiment on the PCM. Regardless of the temperature to which the sample was subjected, no degradation of the material could be visually observed.
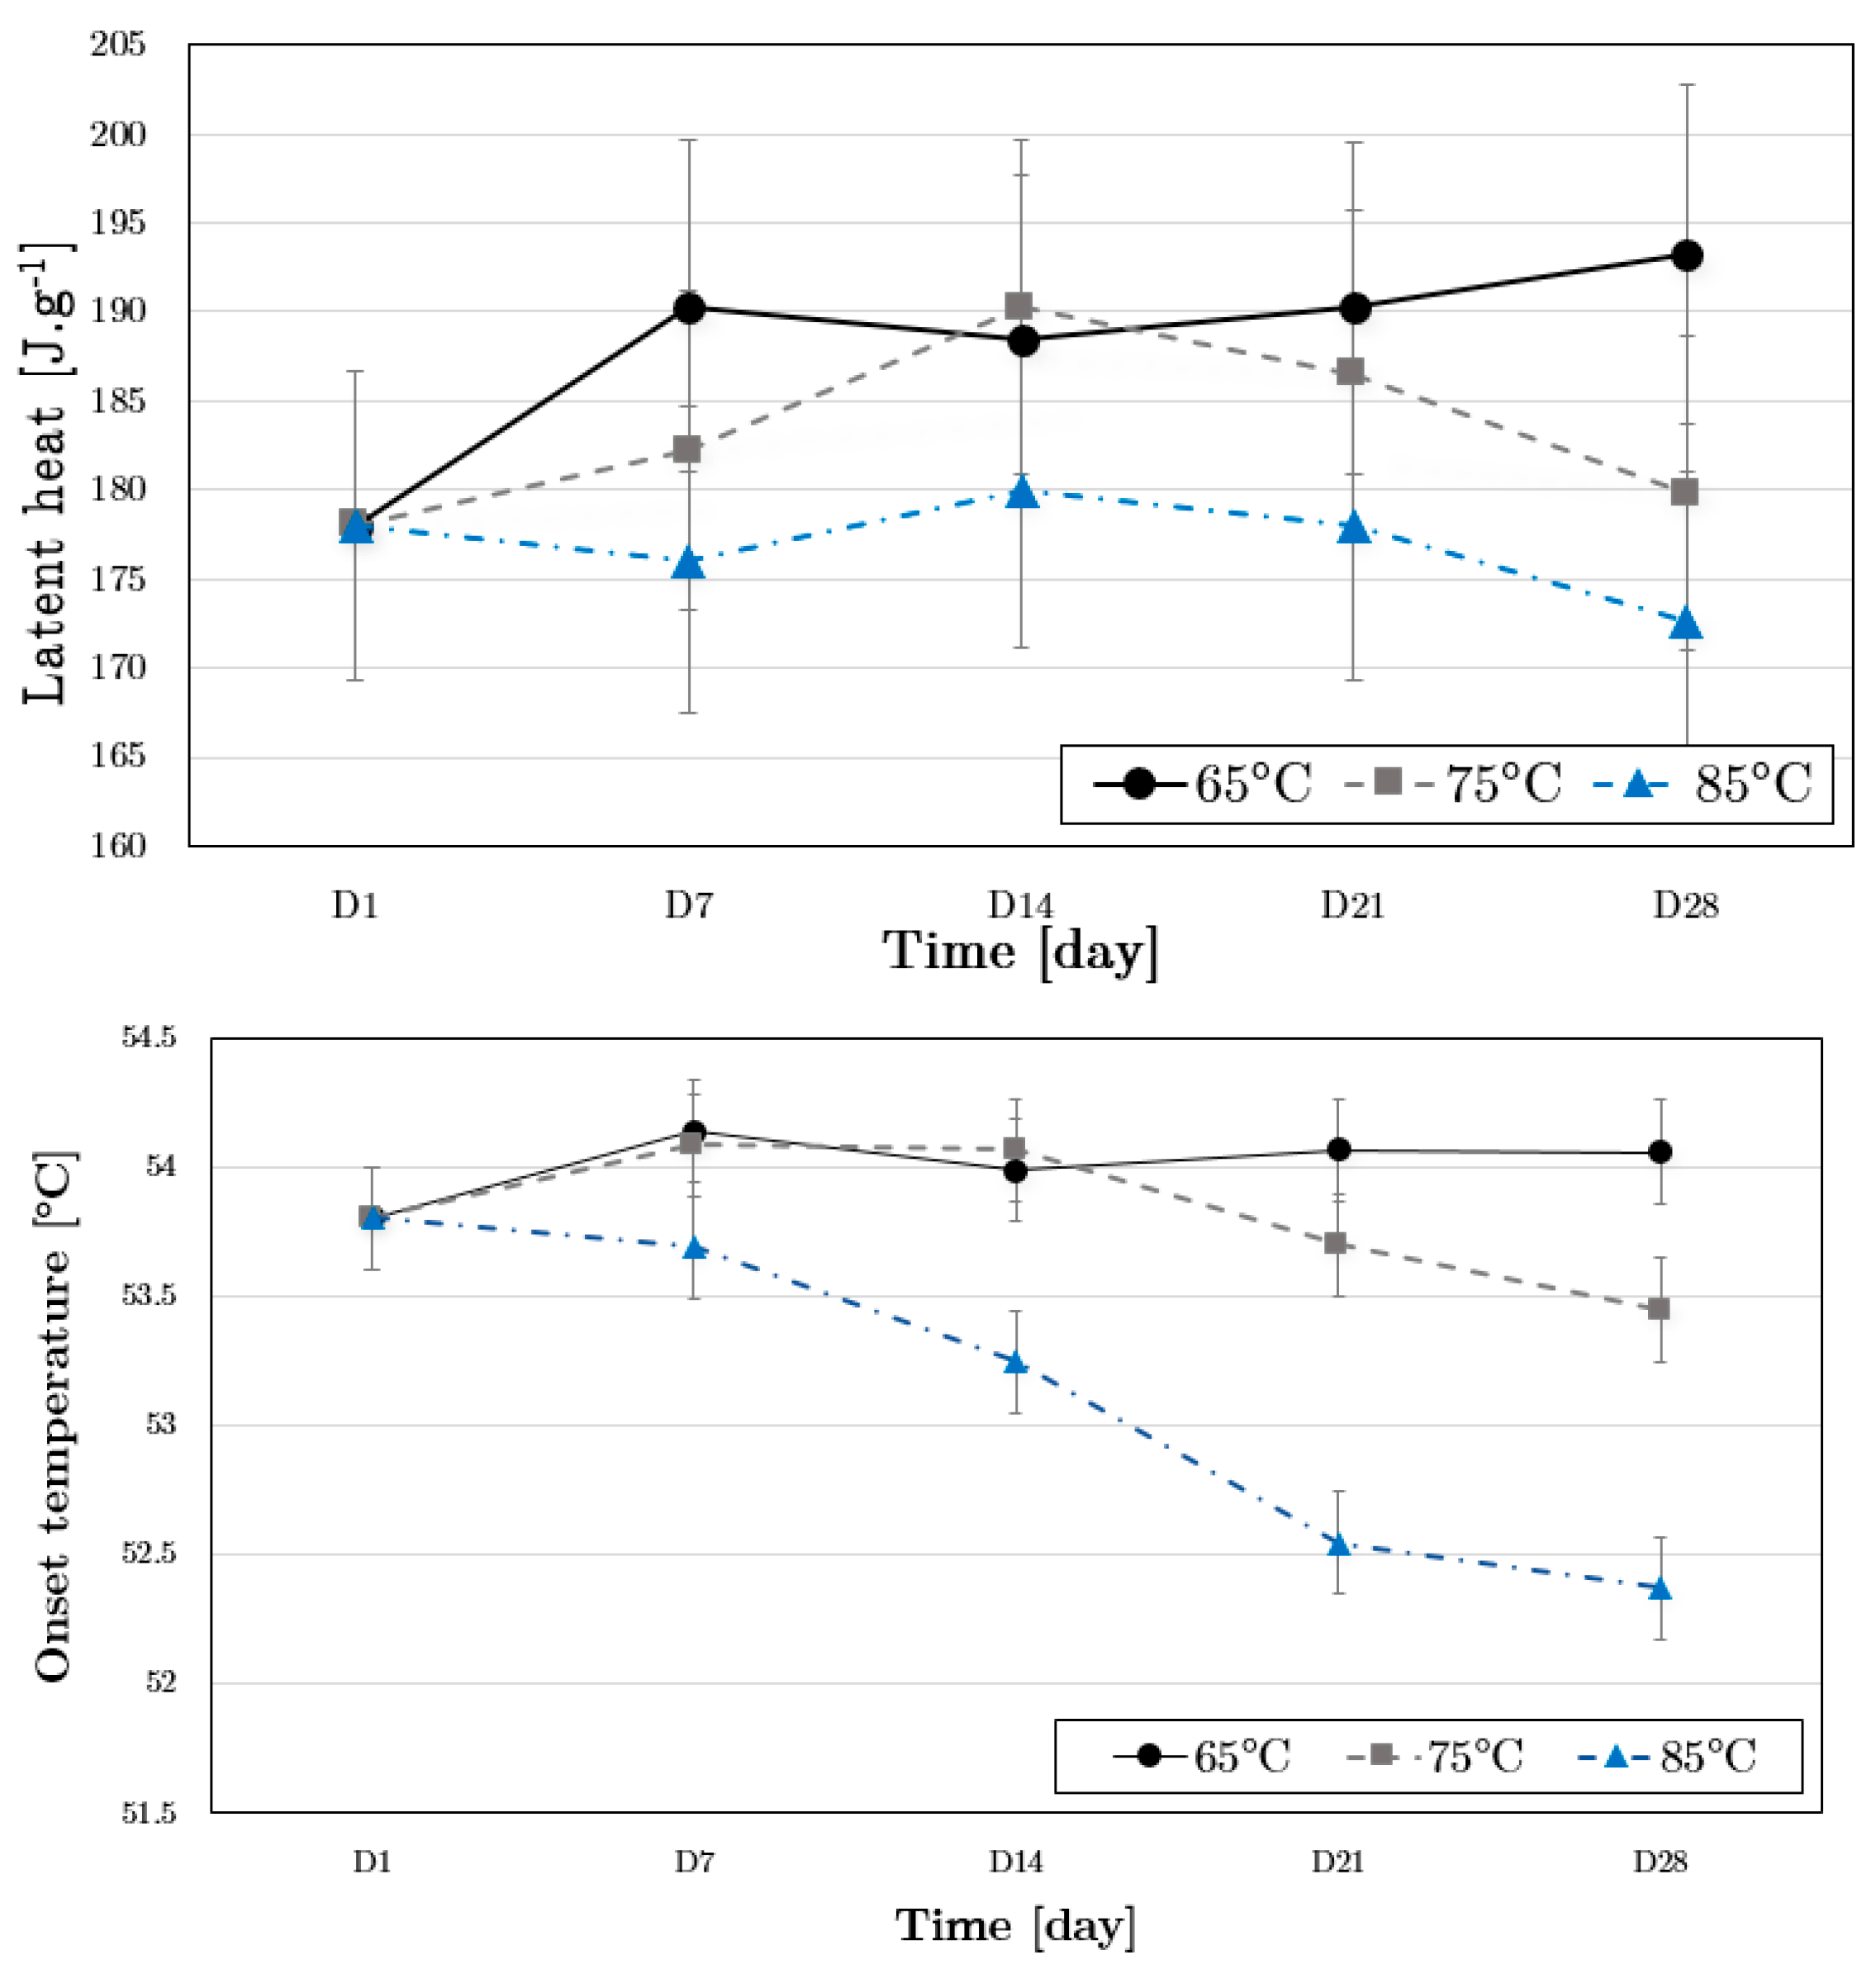
The second step consisted of a calorimetric analysis of the sample with Setaram DSC 131 following the protocol detailed in paragraph 2.1. The results, presented in
Figure 2, show the evolution of key thermo-physical properties as a function of exposure time at the selected temperatures: 65 °C (black line with circles), 75 °C (gray dotted line with squares) and 85 °C (blue dotted line with triangles). Uncertainty has also been added to the graph.
A disparity in latent heat values between the three temperatures is visible in
Figure 2 after seven days, with 190 J/g for the sample placed at 65 °C, 182 J/g for the sample placed at 75 °C and 176 J/g for the sample placed at 85 °C. However, this difference remains at a value within the error interval throughout its thermal exposure, at all studied temperature levels. On the contrary, regarding the graph presenting the onset temperature as a function of time, differences are more noticeable between the samples. If the melting onset temperatures of the PCM placed at 65 °C and 75 °C are constant over time, the samples subjected to a temperature of 85 °C show a reduction of almost 2 °C between the reference time (D1), where the PCM is unaged, and the 28th day (D28).
Thus, the SA–PA mixture has a satisfying thermal stability when used up to 75 °C, but the operating conditions should avoid prolonged use at 85 °C and above, in order to maintain the initial melting onset temperature.
2.4. Compatibility between the PCM and Its Capsule
The second part of this aging study aims to conclude whether the encapsulation significantly alters the thermo-physical properties of the SA–PA mixture. In other words, it is important to know if contact between the polyolefin mixture (polyethylene and polypropylene) constituting the spherical capsules (nodules) and the SA–PA mixture induces significant differences in the latter’s storage capacities. Compatibility tests were carried out in the same ovens as the aging tests, i.e., at a fixed temperature, and the time and temperature constraints were also similar. Nodule pieces were sliced and then inserted into the flasks and completely immersed in the PCM. As many flasks as the number of samples needed for analysis were prepared. At the end of the experiment, the flasks were removed from the oven, photographed, and weighed. A sample of PCM was taken for analysis, then the nodule piece was removed from the bottle and photographed. A thorough study of the condition of the nodule would require additional investigations, such as tensile tests, to analyze the evolution of the material’s resistance over time according to the working temperature. However, as such analysis was not covered in the frame of this project, only visual and mass observations of the nodule were carried out.
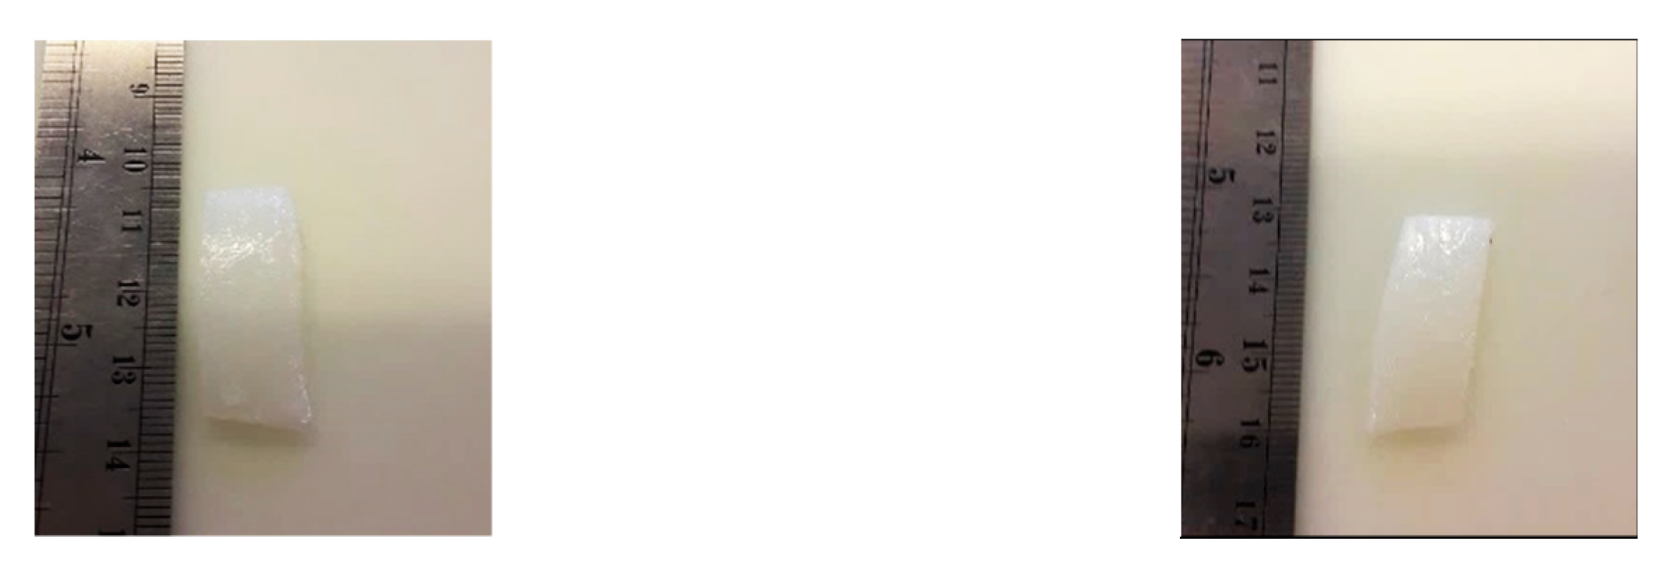
Figure 3 shows an example of the evolution of the visual appearance of the nodule pieces inserted within the flasks containing the SA–PA mixture. Photographs were taken of nodule pieces from flasks placed at 85 °C, the highest temperature stress, and removed after 7 days and then 28 days.
The two nodule pieces showed no visual changes, and therefore do not appear to have been degraded by contact with stearic acid over time. Their irregular shape is due to the fact that they were cut from a spherical nodule, and not to their undergoing plastic deformation due to exposure to high temperatures.
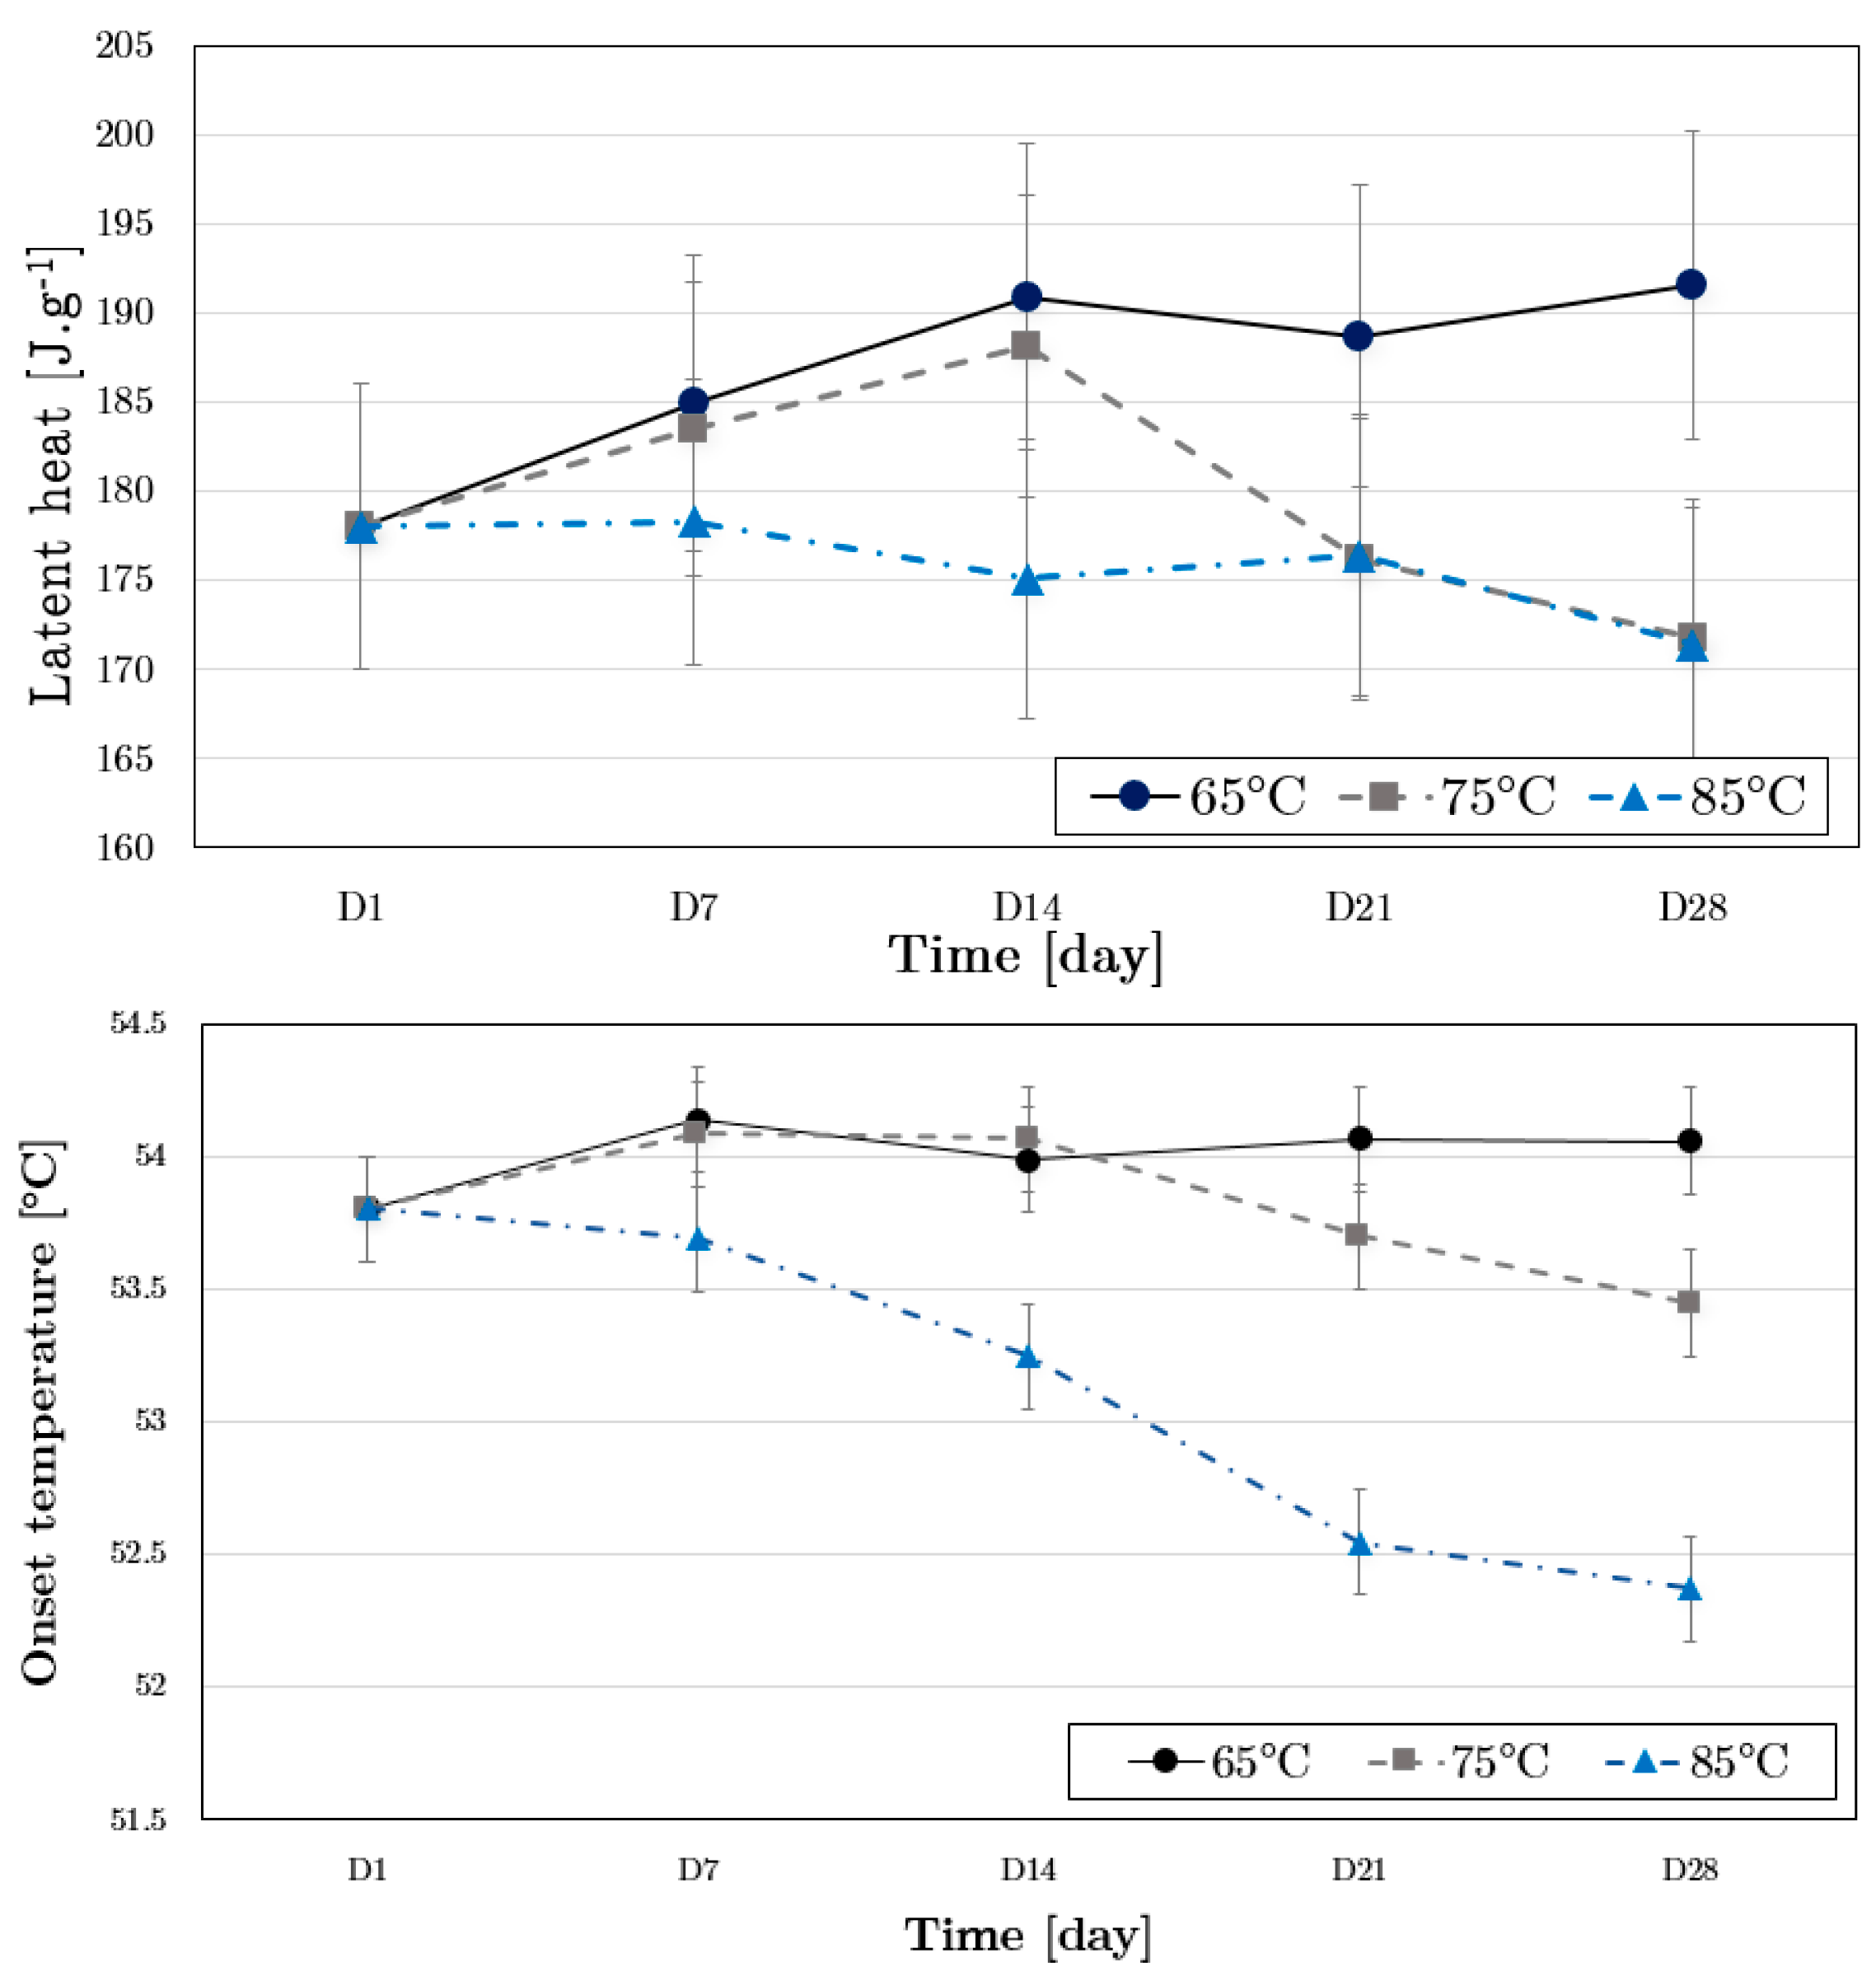
Figure 4 shows the evolution of the latent heat of fusion and onset temperature of the SA–PA mixture as a function of storage time and temperature.
The same behavior was observed whether the SA–PA mixture was or was not in contact with a sample of the nodule; that is, the latent heat was stable over the experiment time whatever the temperature, and a decrease in the onset temperature was recorded at 85 °C.
No compatibility issue was detected between the SA–PA and the encapsulation material. However, a compatibility study on pure stearic and palmitic acid and various plastics, including polypropylene, underlined the plastic swelling issue, possibly leading to its mechanical resistance degradation [
25]. Some caution should then be taken when conducing the experimental campaign on the prototype, monitoring the nodules’ integrity.
4. Exploring the TES Performances Improvement by a Numerical Parametric Study
The heat transfers during melting and crystallization have been widely studied [
11,
18,
31,
32,
33,
34,
35], showing that the driving phenomenon is the conductive transfer during the crystallization, while natural convection may also be involved during melting. Convection modeling may be avoided by considering the effective thermal conductivity [
36,
37,
38]. Based on the purely conductive heat transfer hypothesis, the resource-consumption modeling of the mobile phase change may be side-stepped by considering the enthalpy rather than the temperature in the energy conservation equation in the PCM [
39,
40,
41,
42,
43].
At the system level, and more precisely concerning spherically encapsulated PCM systems, a review showed that despite the case studies’ diversity, models based on energy conservation equations for HTF and PCM are suitable for most of the systems [
44]. Due to its ease of implementation and its demonstrated viability [
45], the enthalpic method is one of the more widely used [
33]. Thus, it was selected for the numerical part of this study, based on a previous work [
37] adapted to the particularity of the prototype presented in paragraph 3.
The aim of this numerical study is to explore the influence of monitoring parameters, materials’ properties, and system size on the global system’s performances. Those performances were assessed by the following parameters:
the storage responsiveness τ95% and efficiency ηstored/discharged as previously defined;
the storage density, defined as the amount of energy stored by unit of volume;
the valuable energy, defined as the energy discharged under industrial conditions, meaning above a temperature or power threshold.
4.1. Model Definition
The TES system is described by a C++ code, where the first law of thermodynamics is applied to the storage as an open system. Several hypotheses are considered.
First, for the HTF and the storage tank:
the HTF is incompressible, and its flow is axial;
the kinetic and potential energy variation are negligible;
the thermo-physical properties are independent of the temperature;
the tank is divided in N meshes of same size;
the meshing is small enough to consider the temperature as uniform with one consistent mesh volume.
Second, for the PCM and the nodules:
the PCM volume expansion during the phase change is neglected, thus the solid and liquid densities are identical, and there is no supercooling;
the thermo-physical properties of each phase are independent of the temperature;
the conductive heat transfer between nodules is neglected, and inside a nodule the heat transfer is only conductive;
each tank mesh includes Nod nodules and each nodule includes M concentric meshes.
4.1.1. Heat Transfer Fluid (HTF)
When considering one single mesh
j, the HTF internal energy variation by time step corresponds to the energy exchanged with the adjacent meshes, the nodules, and the environment (losses):
for a tank containing
NNod nodules and a HTF flowing at a mass flow
with a density
and a specific heat capacity
.
Vj is the volume of HTF in the mesh
j;
Tj and
Tj−1 are the temperature of the mesh
j and
j−1, respectively, and
is the heat flux exchanged between the HTF and the nodule
i in the mesh
j. Finally,
is the thermal resistance between the tank and the environment, including the conductive resistance of the steel tank and its insulation and the convective resistance from the outside ambient air. The convective heat transfer coefficient between the tank wall and the ambient air is calculated by the Churchill and Chu relation [
46].
4.1.2. PCM Nodules
The heat flow from the nodule i depends on the PCM state. The heat transfers inside the nodule are predicted to be purely conductive in the model, and the change of state occurs by concentric layers, starting from the nodule wall. This hypothesis is accurate during the PCM crystallization, but less valid during the melting, as the remaining solid phase will tend to fall and disturb the concentric fusion.
The heat equation inside the nodule filled with PCM is:
with
the PCM density,
its enthalpy,
its thermal conductivity and
its temperature.
The boundary condition is:
where
is the heat transfer coefficient between the HTF and the nodule wall at the temperature
Tw,Nod, calculated by an empirical correlation derived from Bédécarrats et al. considering the Prandtl and Reynolds numbers,
Pr and
Re [
37].
with
as the outer nodule’s diameter and
the HTF thermal conductivity.
is the thermal resistance between the PCM at a temperature and the HTF, including the nodule’s conductive resistance and the fluid’s convective resistance.
The PCM is considered as a pure body, its enthalpy varying with the temperature as described by Equation (8) [
47]. This approach allows for fast calculation, and induces in this case a minimal variation compared to the implementation of the experimental enthalpy variation curve.
with
and
being the specific heat capacity of the solid and liquid PCM phases,
Lm its latent heat of melting and
its liquid mass fraction. During the phase change, the temperature remains constant (
T =
Tm), while the liquid mass fraction varies. The reference
is set at an arbitrary temperature lower than the melting temperature.
The equation is resolved by the finite element method (FEM). The model is initialized at t = 0 with an equal initial temperature of the PCM and the HTF. Then, at each time step, the fluid temperature and the PCM enthalpy are calculated. The mesh number N inside the tank is limited to 8 as one mesh cannot be smaller than a nodule, and the mesh number M inside a nodule is set at 24 as a compromise between accuracy and speed.
4.2. Model Validation
The experimental part of this work, presented in
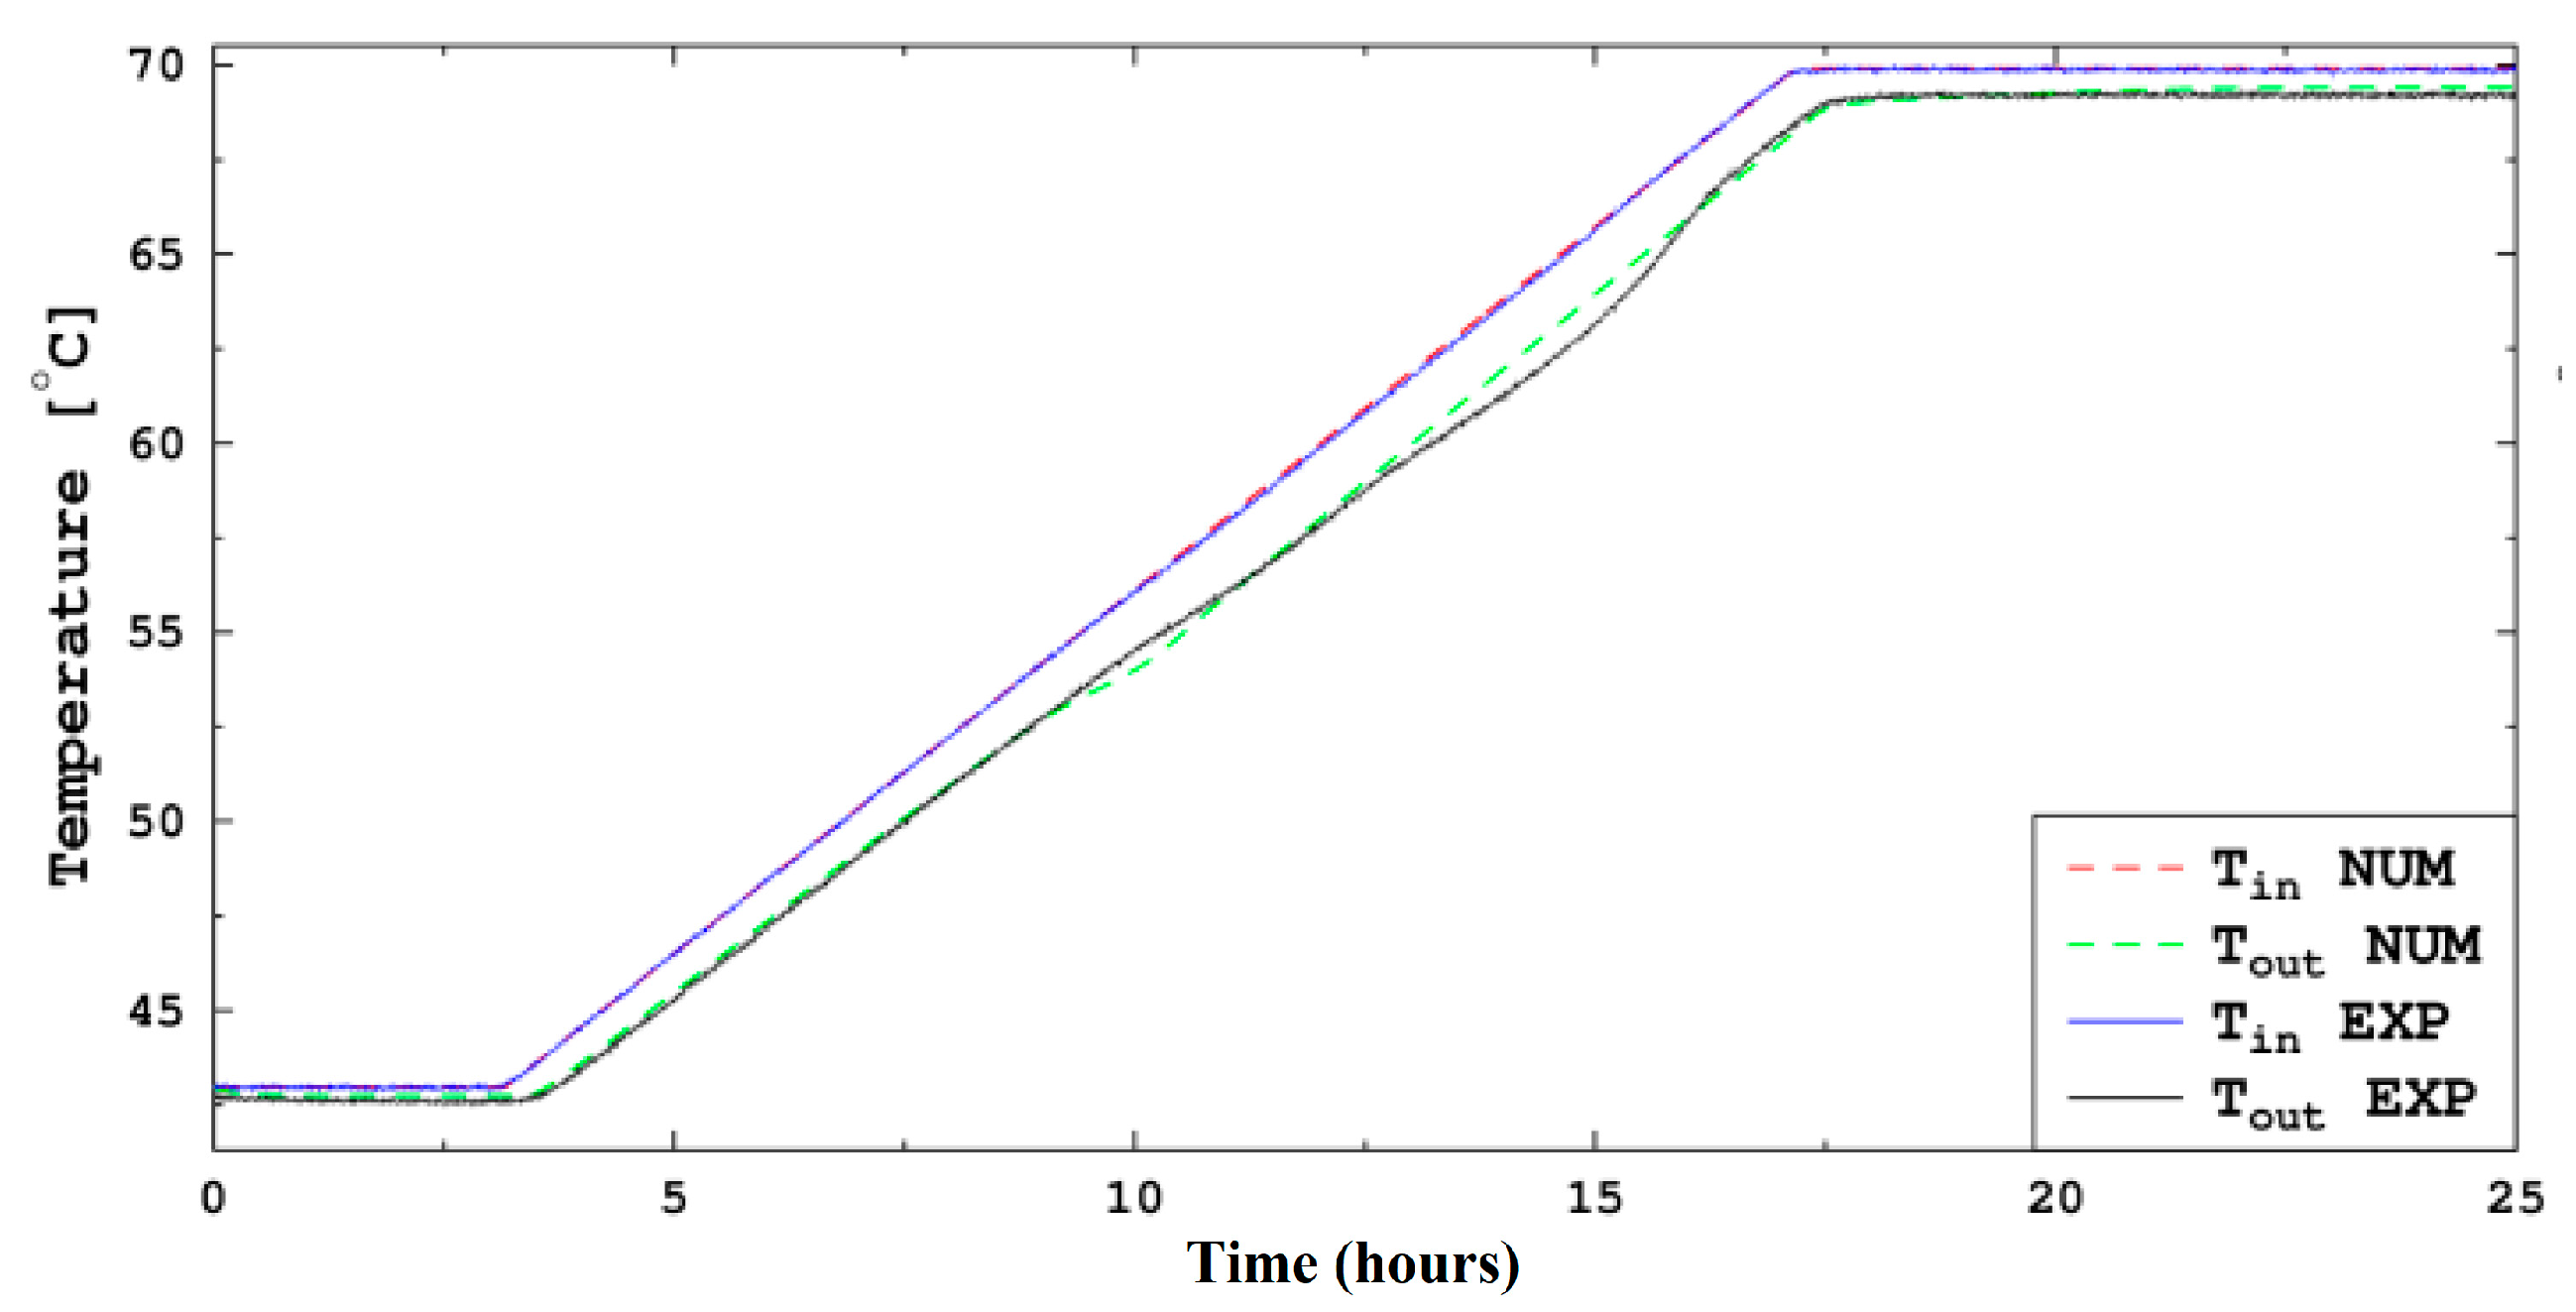
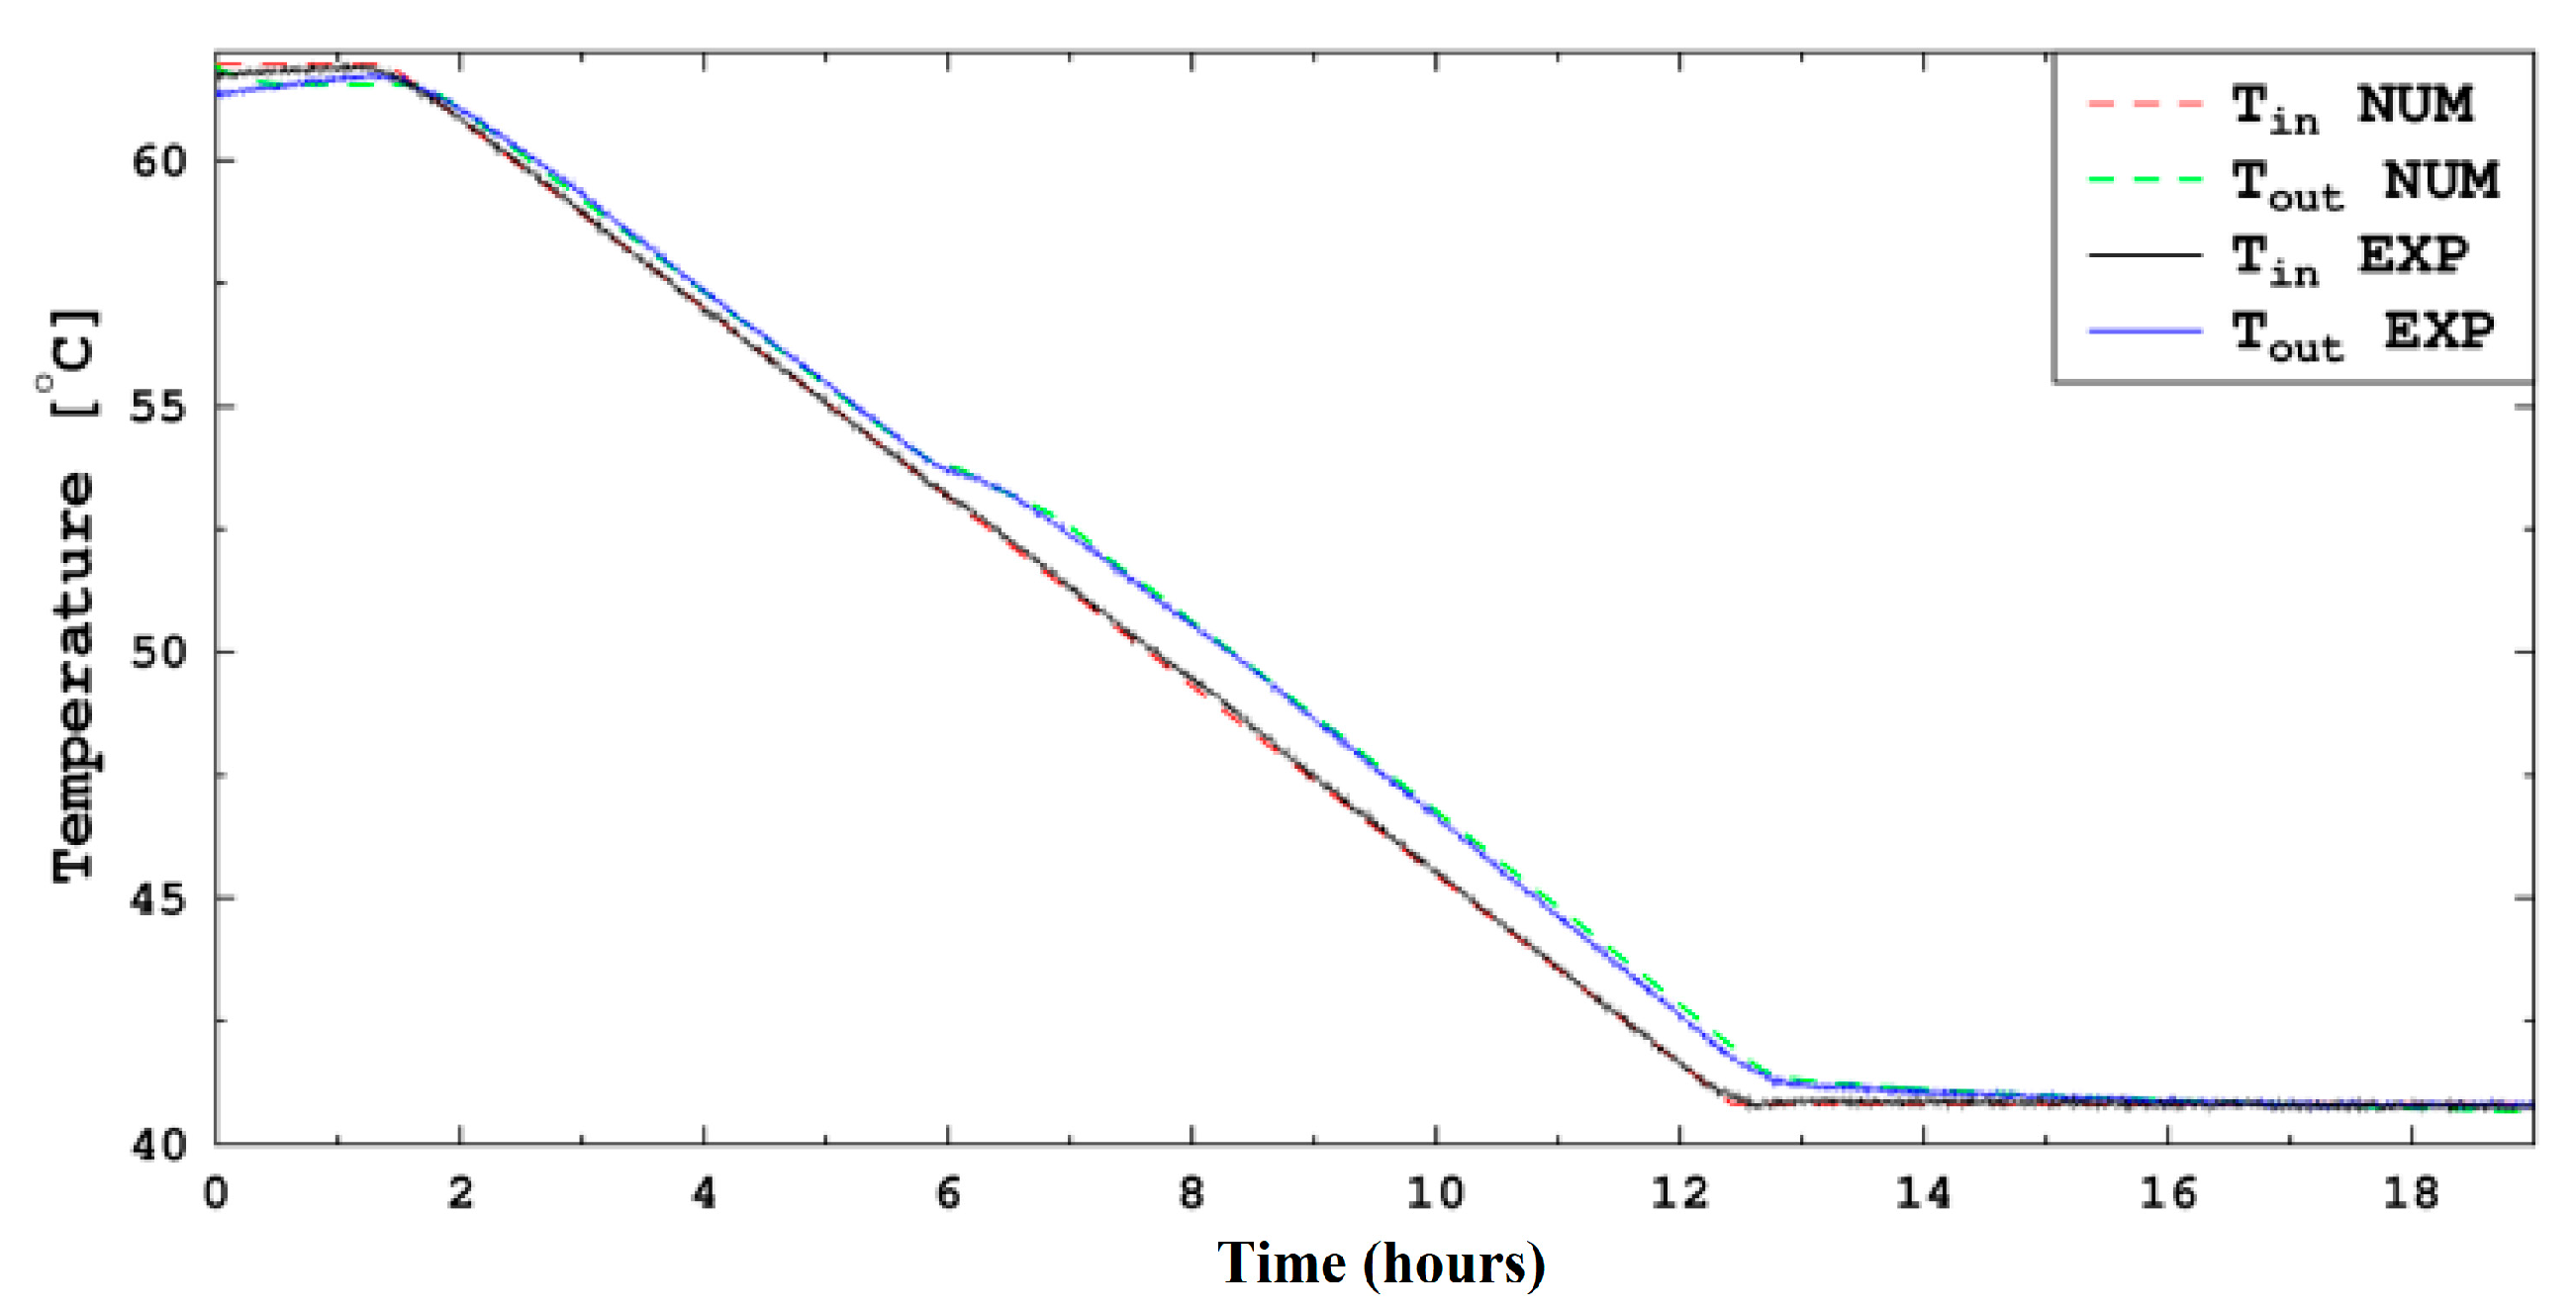
Section 3, has allowed the validation of the developed model via both charge and discharge operation. The inlet and outlet temperatures under the charge and discharge modes at 2 °C/h are displayed, respectively, in
Figure 7 and
Figure 8, with continuous lines for the experiment and dotted lines for the numerical results. Both results follow similar evolutions, especially under the discharge mode, where the crystallization
plateau is well defined. Some discrepancies appear during the charge, due to the fact that the convection phenomenon inside the nodule during the melting step is neglected in the numerical model: the melting is supposed to happen in a concentric way with conductive heat transfer, while in reality the solid core with a higher density tends towards the capsule’s bottom wall, inducing convective transfers in the liquid phase. Moreover, the phase change is modeled as if the PCM were a pure body, but this is not the case for the selected SA–PA mixture.
The global energy balance for both experiments is synthetized in
Table 6With an average deviation of 8%, a maximum 16% and minimum 3.1%, the numerical model was validated and the parametric study could begin.
4.3. Temperature and Flow Rate Sensitivity Analysis
Two monitoring parameters have been explored over a larger range than the one allowed by the experimental campaign: the inlet storage temperature and the HTF mass flow rate.
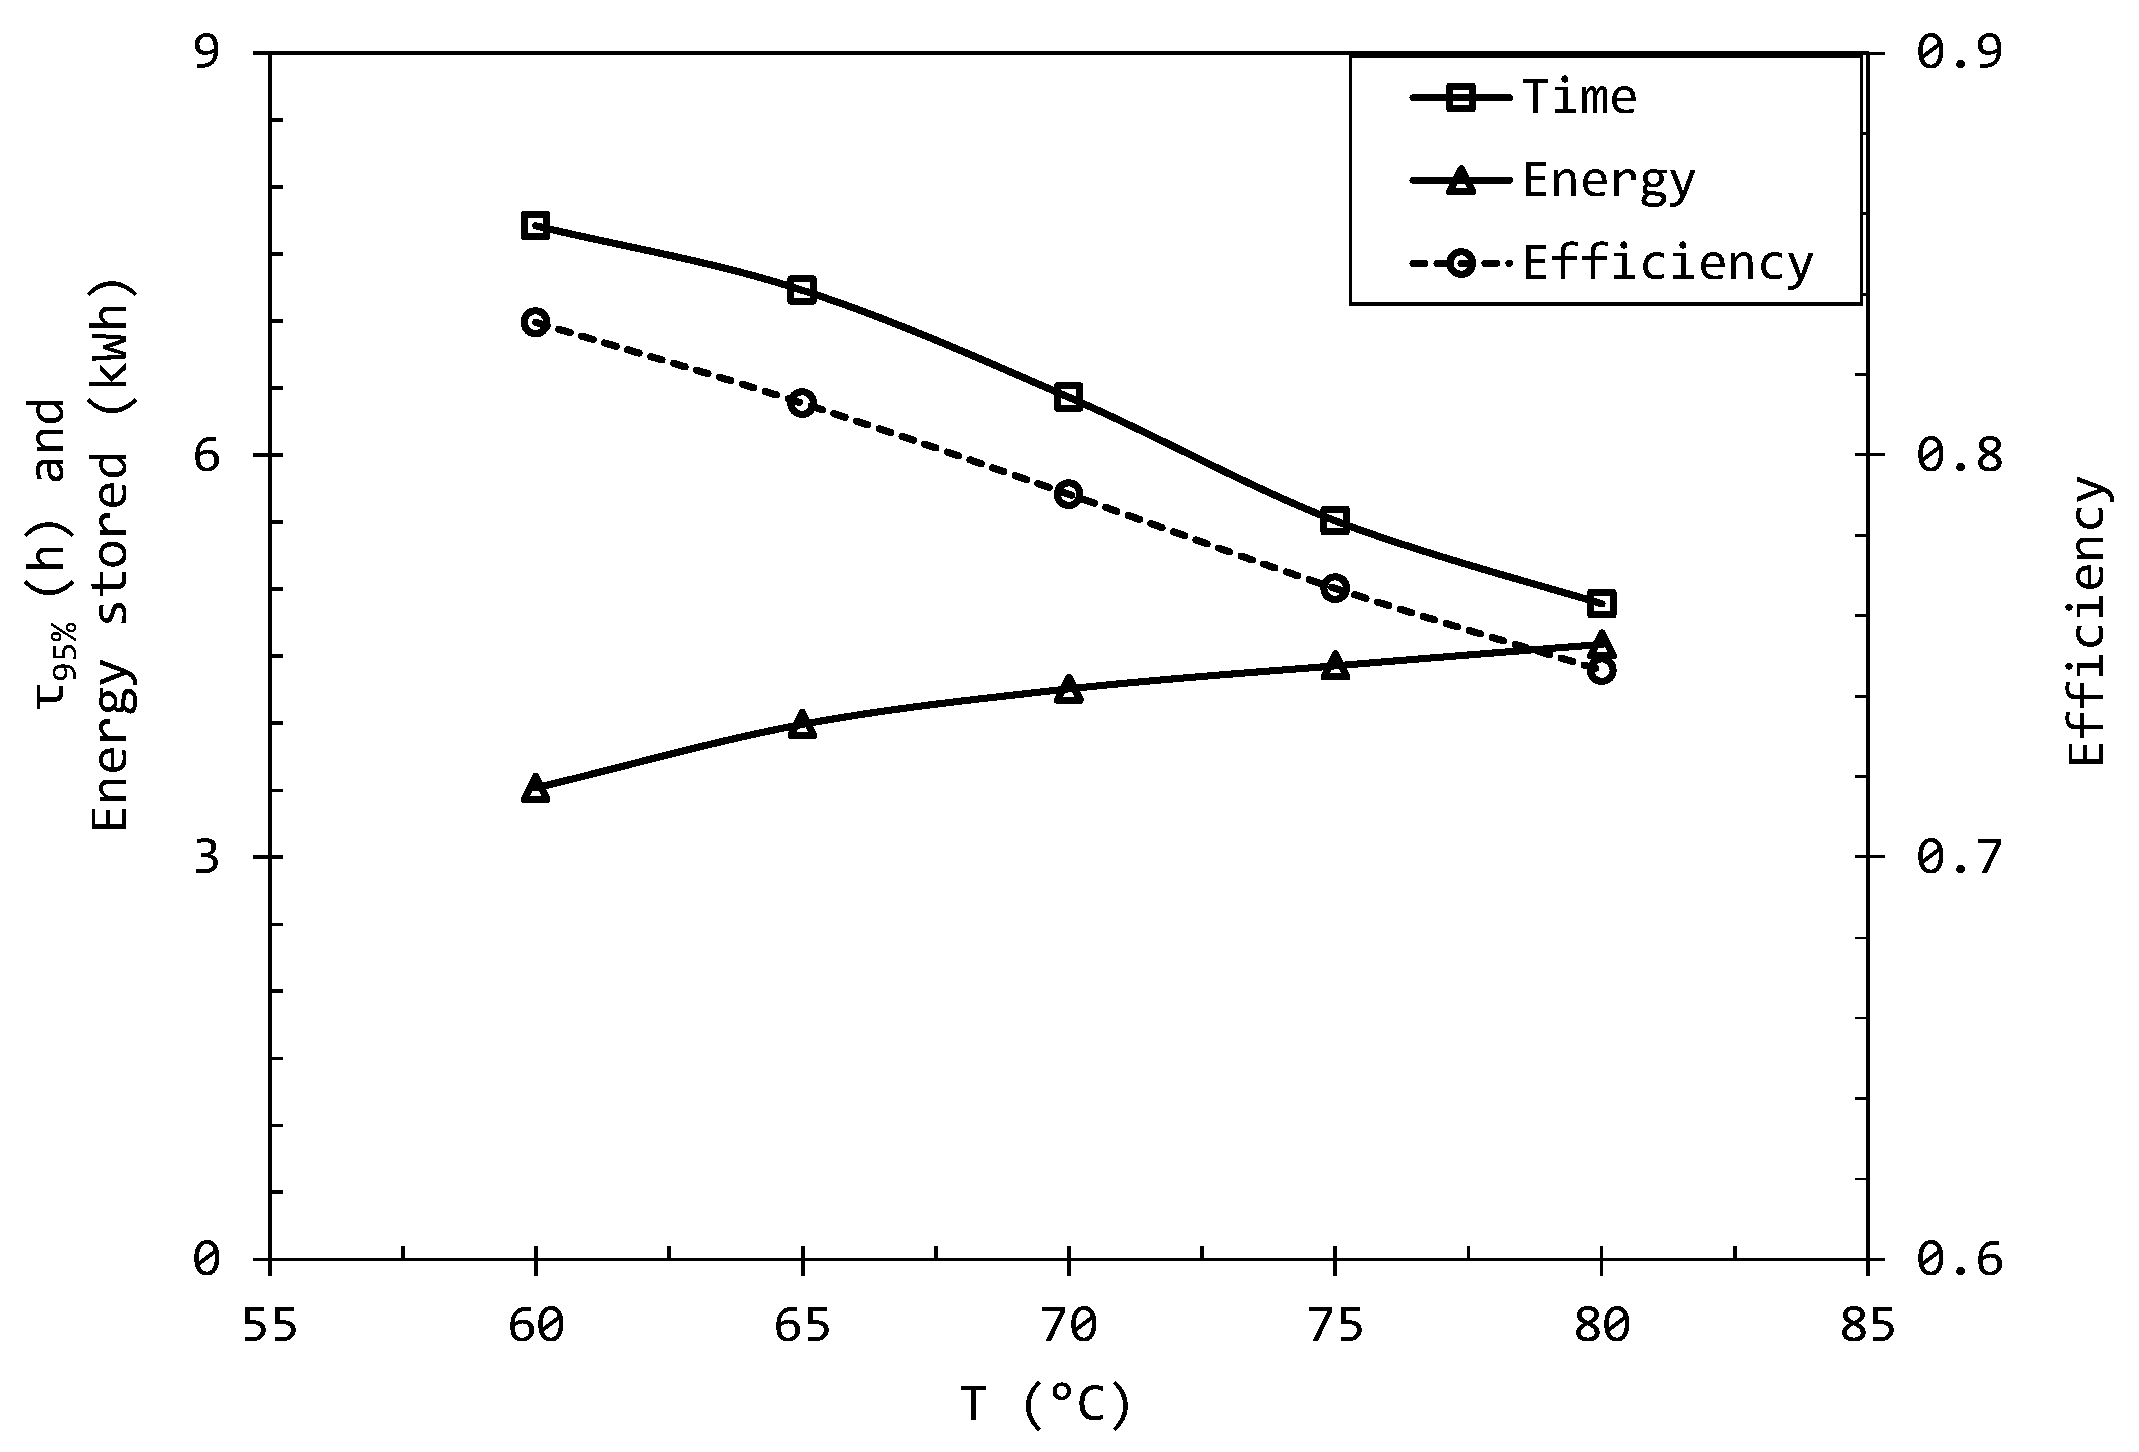
The influence of the inlet temperature on the charging time, the total energy stored and the storage efficiency is depicted in
Figure 9. The responsiveness decreased and the amount of energy stored increased with the inlet temperature: τ
95% dropped from 7.7 h to 4.9 h and the energy stored rose from 3.5 kWh to 4.6 kWh with a respective temperature increase from 60 to 80 °C. However, the influence of the inlet temperature is less important after a certain temperature for these two parameters. The storage efficiency proportionally decreased when the inlet temperature increased, as the tank insulation was not modified, inducing higher thermal losses. Besides hits, the aging study revealed that the PCM thermo-physical properties could be damaged above 75 °C: given the decreasing gains in time and energy and the degradation risks, the most suitable inlet temperature has been defined as 70 °C.
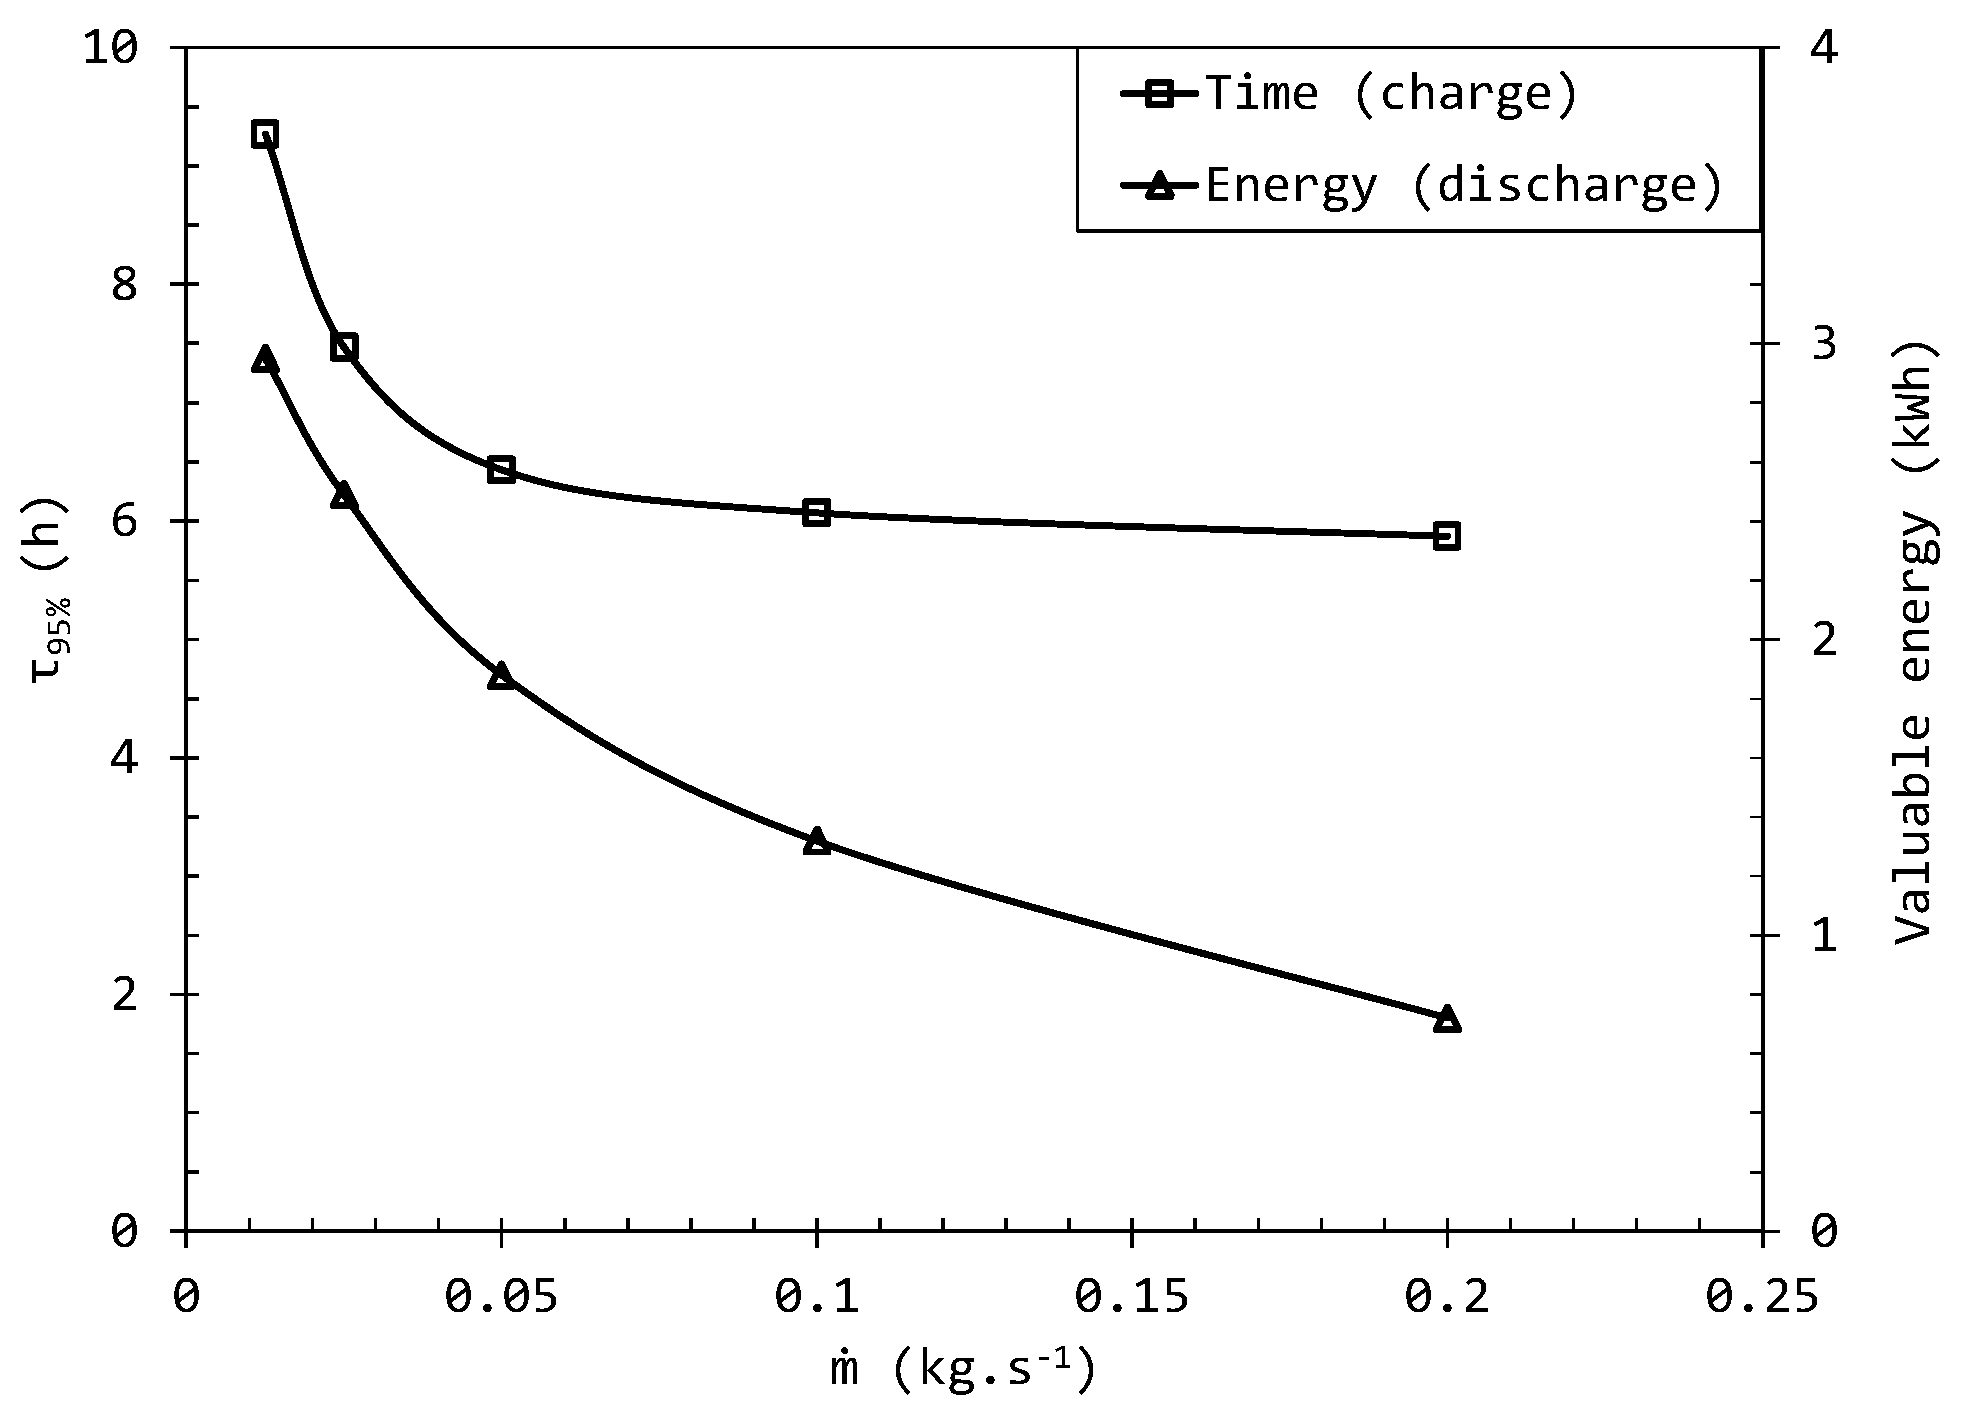
The influence of the mass flow rate
is shown in
Figure 10.
The charging and discharging times were similarly reduced by convective heat transfer intensification due to the flow rate’s increase, with a stabilization above 0.05 kg/s. The discharge performances should also be assessed via an estimation of the valuable energy, i.e., the thermal energy available at a minimum temperature threshold. Under real operating conditions, the downstream process drives this threshold. For this parametric study, it was arbitrary set around 10 °C below the PCM melting temperature, at 45 °C. It appears that the valuable energy decreased when the flow rate increased: the convective heat transfer enhancement may be driven to a higher power but cool down faster the heat storage materials, inducing a higher proportion of thermal energy discharge at lower temperatures. The proportion of available valuable energy should be optimized by a mass flow rate adaptation during the discharge to fit with the heat demand. To pursue the parametric study, the reference was set to a constant value of 0.05 kg/s (180 L/h), which is a compromise between the charge/discharge time and the valuable energy.
4.4. Materials Conductivity Sensitivity Analysis
As previously mentioned, the reference case was a charge up to 70 °C at 0.05 kg/s (180 L/h), storing 4.4 kWh, and the targeted parameter for minimization was the charge duration τ95%.
A low global thermal resistance causes the heat transfer rate to increase and τ
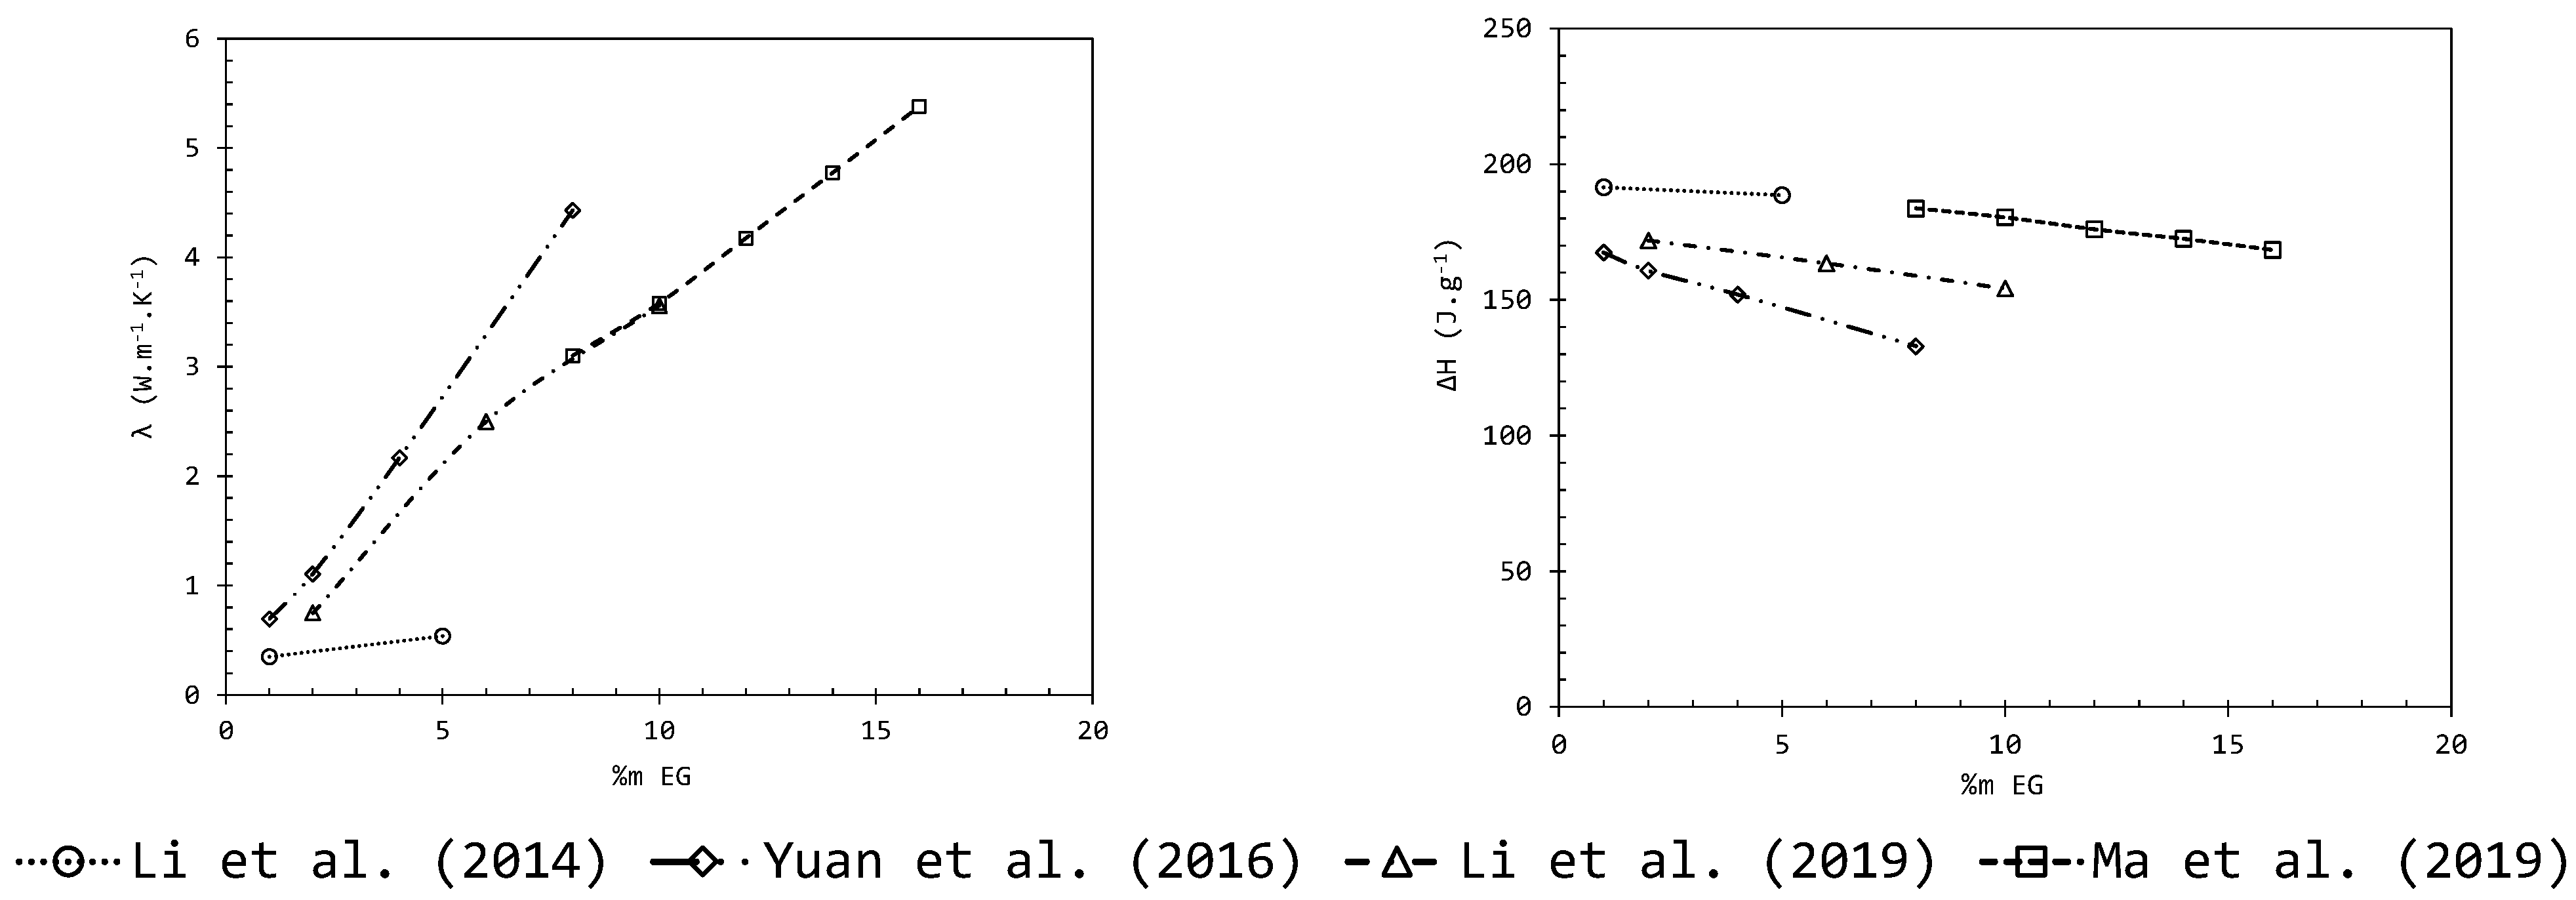
95% to decrease. Three thermal resistances affect the storage process: convective between the HTF and the nodule, conductive in the capsule wall, and conductive in the PCM (convection in PCM is neglected). In the reference case, the two first resistances were respectively equal to 0.15 K/W and 0.06 K/W. The last one developed as the PCM melted, increasing up to 80 K/W; the limited transfer was due to the low thermal conductivity of the PCM, which is thus the main property to optimize. The PCM’s conductivity may be enhanced by various methods, a widely studied approach being loading with expanded graphite. As summarized in
Figure 11, the conductivity of stearic acid-based PCM increased with the mass fraction of expanded graphite (left), while the latent heat decreased (right). Thus, a larger storage tank will be needed to store the same amount of energy, decreasing the storage energy density.
The industrial-grade SA–PA mixture used to fill the prototype has similar thermo-physical properties to the one studied by [
28], whose results showed intermediate values compared to the other works, and were partially repeated by [
49]. Their experimental results on conductivity enhancement were then used in the following numerical results. An extrapolation was conducted, in accordance with other studies, with 28% expanded graphite to explore the effect of a conductivity value up to 50 times the standard. The heat capacity varied with the proportion of expanded graphite proportionally to its mass percentage, but the density was kept constant, as opposite influences were found in the literature [
27,
49].
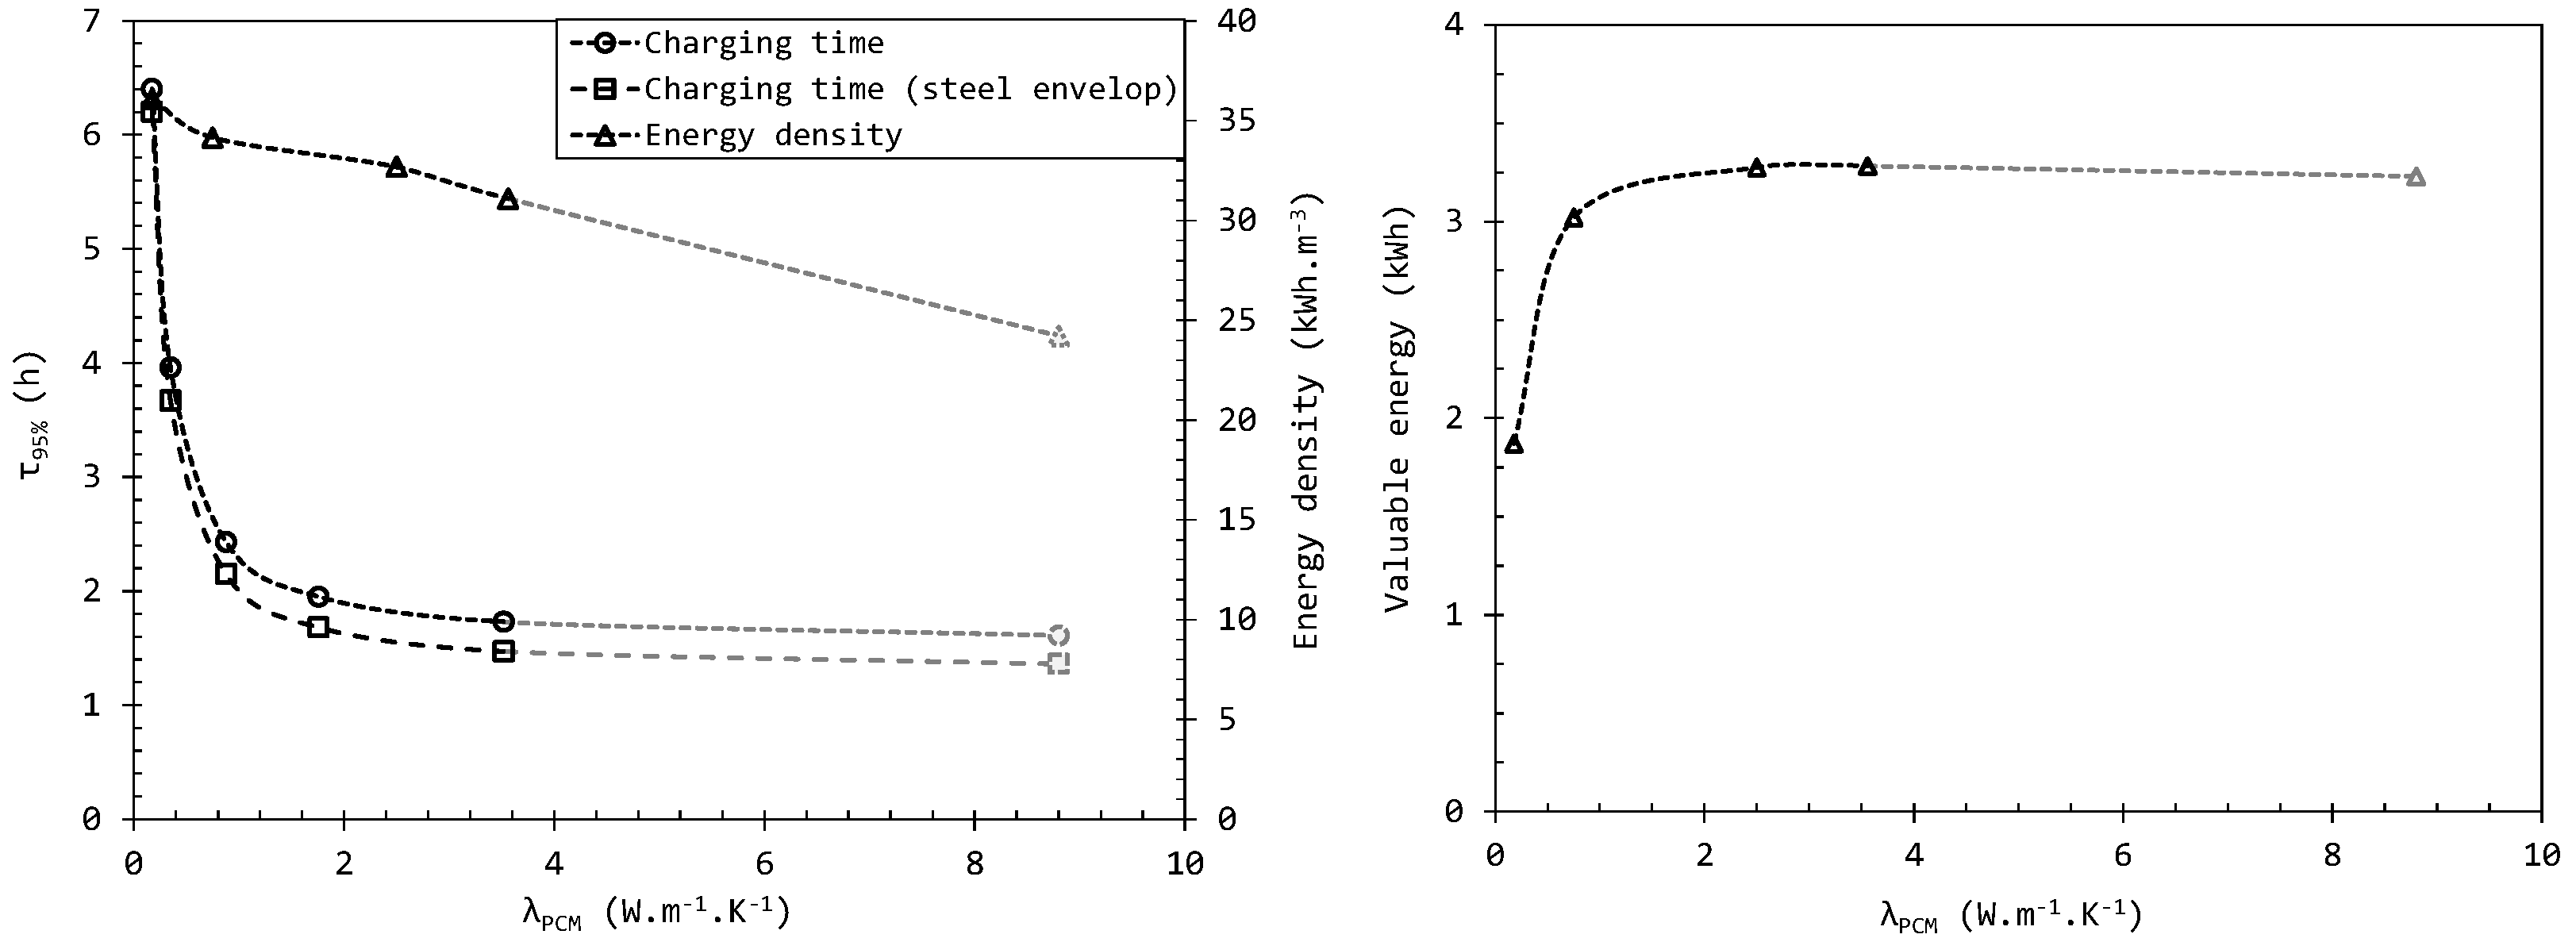
Figure 12 scrutinizes the effects on the charging time and the system energy density (left), as well as the valuable energy available at the discharge (right). As expected, the charging time was minimized by a higher conductivity, but this improvement reached a
plateau after a multiplication by ~10 of the PCM conductivity. Meanwhile, the energy density continued to decrease when expanded graphite was added: an optimum loading may be around 4%, leading to a conductivity of near 1.8 W/m·K. Besides, after this conductivity threshold, the valuable energy was no longer improved, and even started to slightly decrease after 8 W/m·K. That threshold is dependent on the system’s features, such as the HTF. For instance, in a system with air as the HTF, the convective heat transfer between the HTF and the capsule wall starts to impose limitations earlier, and it is no longer relevant to improve the conductivity of the PCM when it exceeds 1 W/m·K [
50].
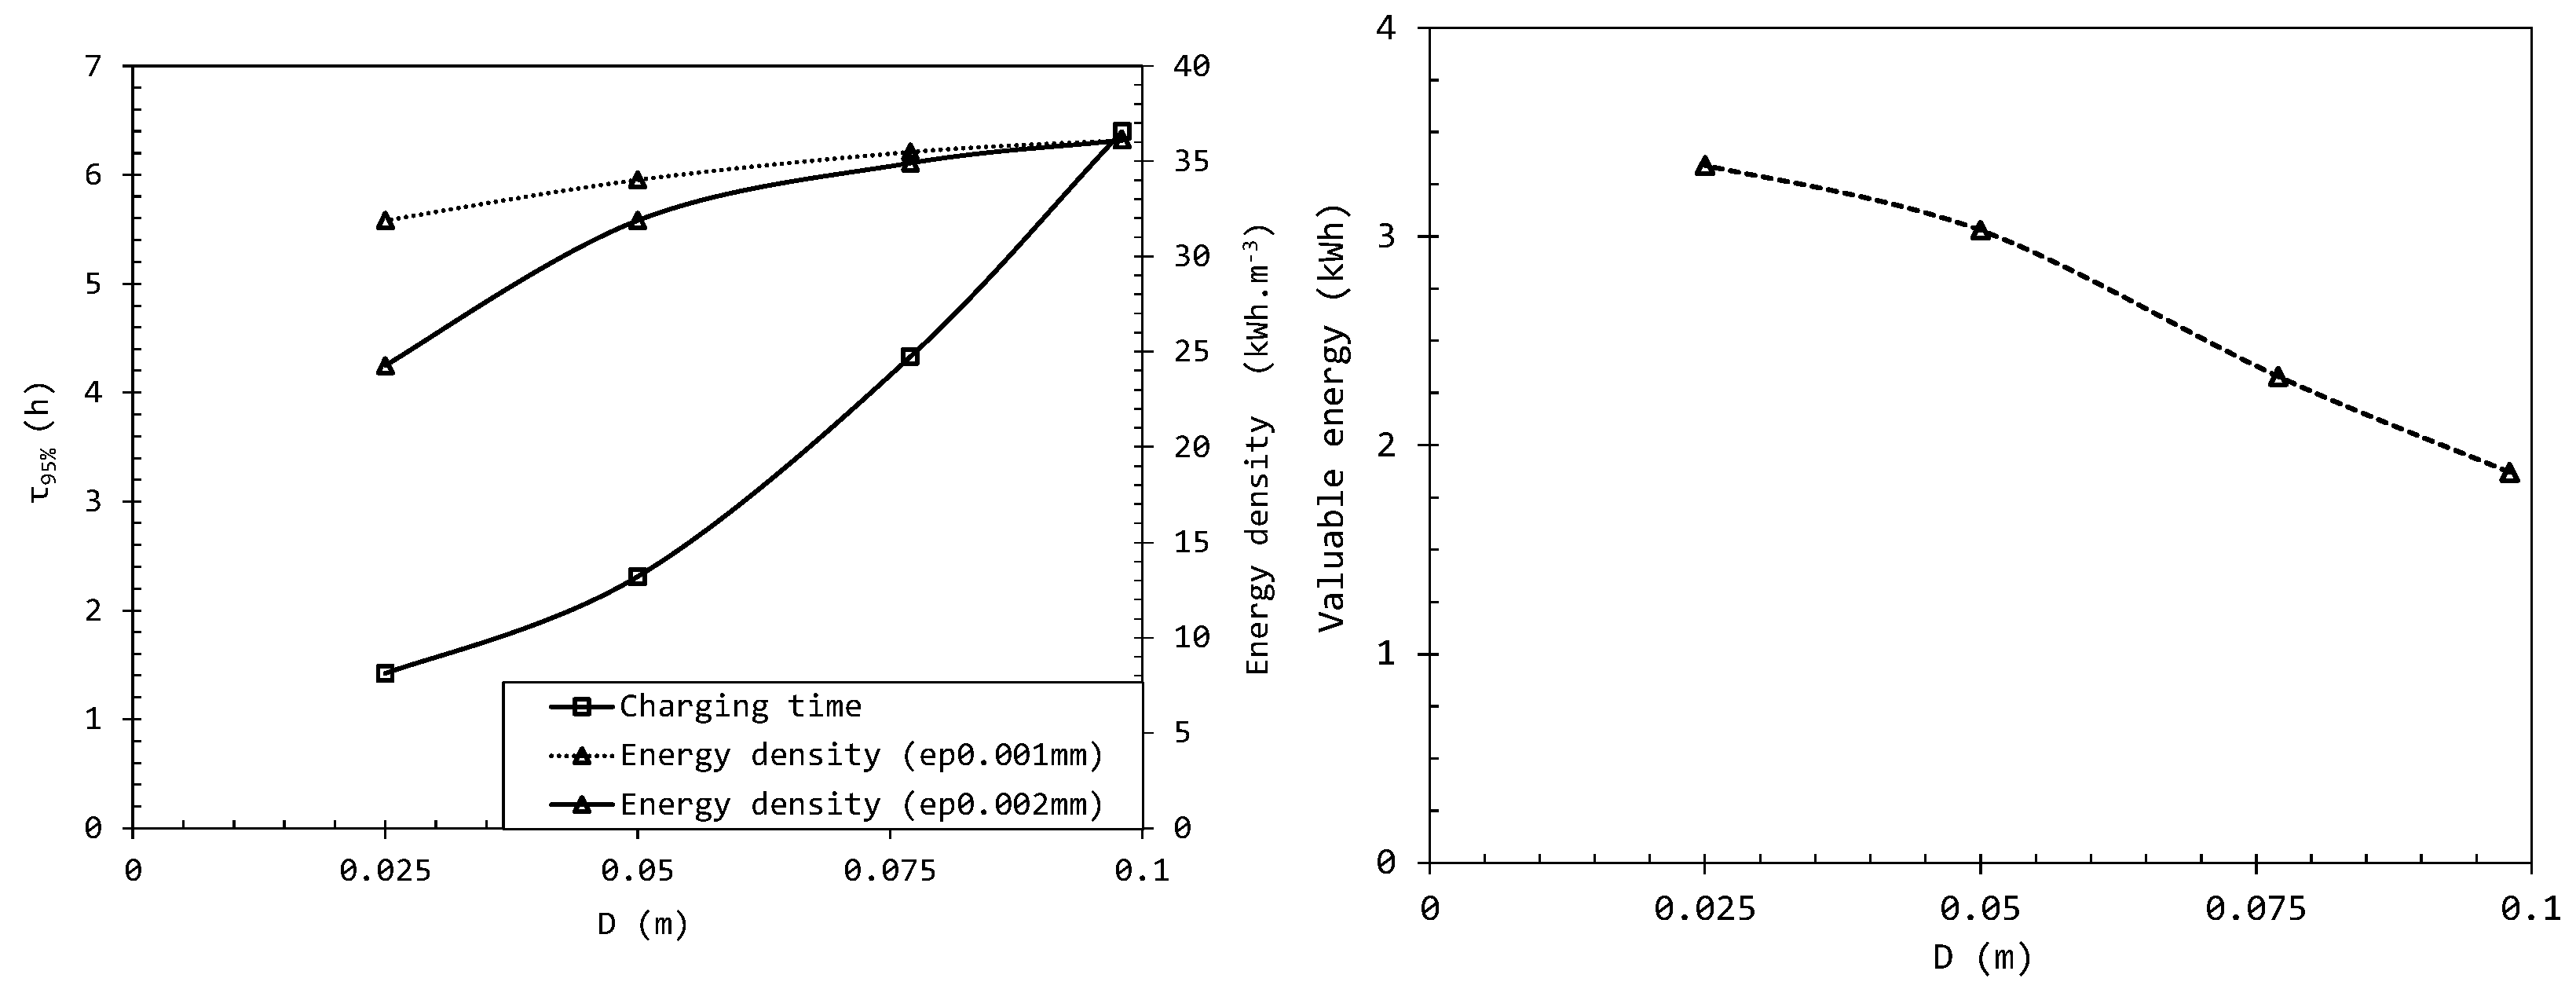
4.5. System Sizing Sensitivity Analysis
The size of the nodules also affects the storage performance, but to a lesser extent (
Figure 13). Indeed, the reduction in the diameter of the nodules from 98 mm to 77 mm (the two sizes of commercial nodules from the industrial partner’s technology) made it possible to decrease the storage time by 27%. This reduction was induced by the increase by 28% in the exchange surface between the HTF and the nodules (from 3.65 m
2 to 4.68 m
2), reducing the convective thermal resistance and consequently increasing by 26% the heat transfer between these two entities (from 228 W/m
2·K to 287 W/m
2·K). However, the envelop material ratio also increased, reducing the system energy density. Thus, while the charging time was reduced to ~1 h 30 with 2.5 cm-diameter nodules, the system energy density fell by 33%. This loss could be limited with thinner nodule walls (e.g., of 1 mm instead of 2 mm), but they should remain thick enough to guarantee their mechanical integrity.
Besides this, the quantity of valuable energy also rises when the nodules diameter is reduced, until reaching what seems to be a plateau. This attenuation in the rising could be even more pronounced if a full energy balance is considered, including the pumps’ consumption, which would be increased by the greater pressure drop due to the smaller nodule diameters.
Finally, the influence of the dimensions of the tank was also analyzed, emphasizing the conservation of the performance of the storage with different lengths of tank and identical volumes.
5. Conclusions
The aim of this work is to develop a latent thermal energy storage system using encapsulated phase change materials (PCM) for low-temperature applications, such as district heating systems or low-temperature waste heat recovery. The objective of this paper was to investigate a suitable PCM for the TES system, to perform experimental tests on a laboratory-scale pilot to validate its use in a representative environment, and then to explore the effects of sizing and operating variations on the system’s behavior via a numerical model.
The selected PCM, a stearic and palmitic acid mixture (SA–PA), was characterized by calorimetry (DSC) and thermogravimetric analysis to determine its thermo-physical properties and its thermal stability. No degradation of its thermo-physical properties was observed during the 75 successive thermal cycles, and even at 100 °C above its change-of-state temperature, the PCM did not lose 1% of its initial mass, thus showing no sign of degradation. The aging tests of PCM alone showed a conservation of the latent heat of fusion over time regardless of the chosen temperature, but a decreasing trend in the melting and crystallization onset temperatures as the exposure temperature increased. However, this decrease only appeared at a working temperature of 85 °C, which is more than 30 °C above its change of state temperature, which is not usually reached during actual operation. Finally, the compatibility study shows that the presence of the nodule envelop in contact with this SA–PA mixture did not cause a difference in its general thermo-physical behavior: the enthalpy variations and transition temperatures during the compatibility tests were identical to those obtained during the aging tests. Considering that in both thermal aging tests, the latent heat of fusion remained stable, and the melting temperature suffered a decrease that only began with overheating to 30 °C above melting temperature, the results are considered sufficiently promising to proceed to the next step of this research project: system integration, studied through a lab prototype and a parametric numerical study.
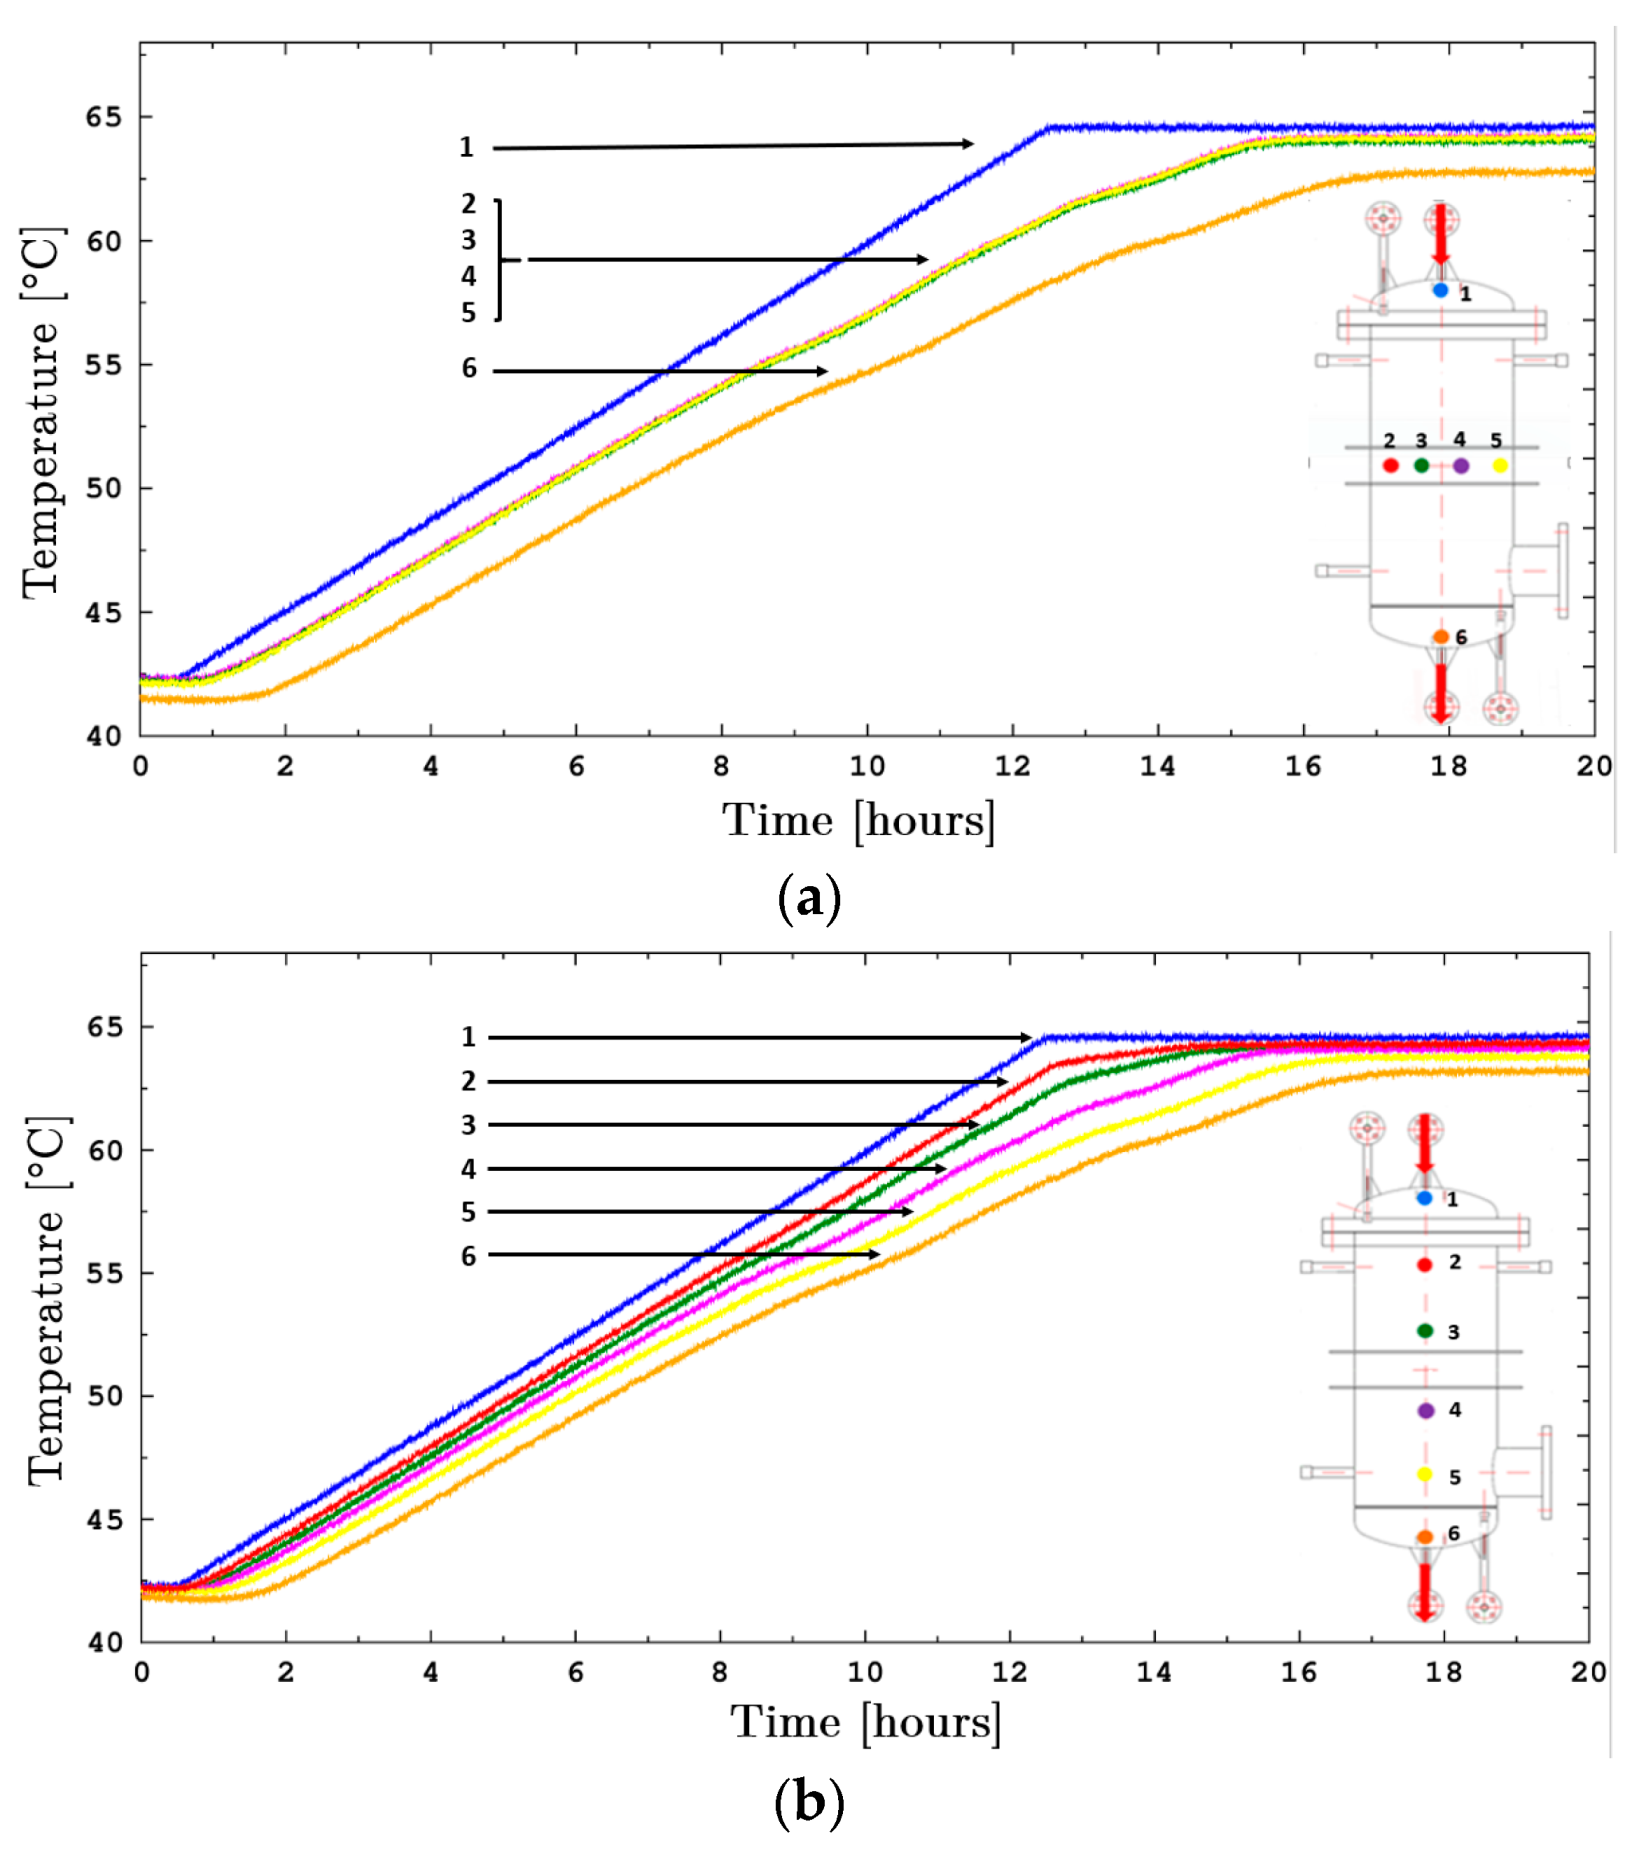
The tests carried out on our lab-scale TES system, composed of a 0.1 m3 steel tank filled with encapsulated SA–PA mixture, are promising, despite the compactness of the nodules being reduced by almost 33% due to the metal frame supporting the thermocouples. The results also highlight the fact that the vertical or horizontal positioning of the tank does not affect the evolution of the storage process if there is a piston flow in the tank corresponding to the direction of circulation of the HTF with respect to the natural thermal stratification of the fluid. The results also show that the increase in flow rate and the difference between the inlet temperature and the melting temperature reduce the duration of the charge and discharge modes, but this reduction is limited by the PCM phase change kinetics. This storage system presents an alternative to standard hot water tanks, thanks to the larger amount of stored energy, which can rise by 34%.
Finally, the modeling of the experimental storage facility was carried out in order to simulate its thermal performance. The code was developed in C++ language, with the use of the enthalpic method, considering heat transfer in the PCM as a pure conduction problem. The temperatures provided by the model agree well with the experimental results. A slight difference is visible during the melting, and this could be caused by the fact that the natural convection phenomena within the liquid PCM are not considered. In terms of energy, the difference between the model and the experiment was less than 16%.
Various numerical studies were carried out in order to observe the influence of parameters on the TES system’s performance. Increasing the flow rate, final temperature, and PCM conductivity reduces the duration of the storage. It is noted that the conductivity of the nodule envelope, due to its low thickness, has a negligible influence on storage performance. If the PCM mass is the same in the storage tank, the smaller the nodules are, the larger the exchange surface between the PCM and the HTF, and the higher the heat transfers, with a consequent decrease in storage time. Finally, a parametric study of the tank dimensions shows that the results are independent of the tank geometry if the volume is the same.
The next step of this project consists in increasing the size of the TES system and combining it with an existing industrial process. This will make the analyses of the performances of the installation possible, and determine whether the charge and discharge times are compatible. Then, an optimization study will be necessary to determine the ideal parameters of the storage facility, in order to achieve optimum performance via the targeted industrial process.


 ,
, 


