
Influence of the Thermal State of Vehicle Combustion Engines on the Results of the National Inventory of Pollutant Emissions

 , and
, and 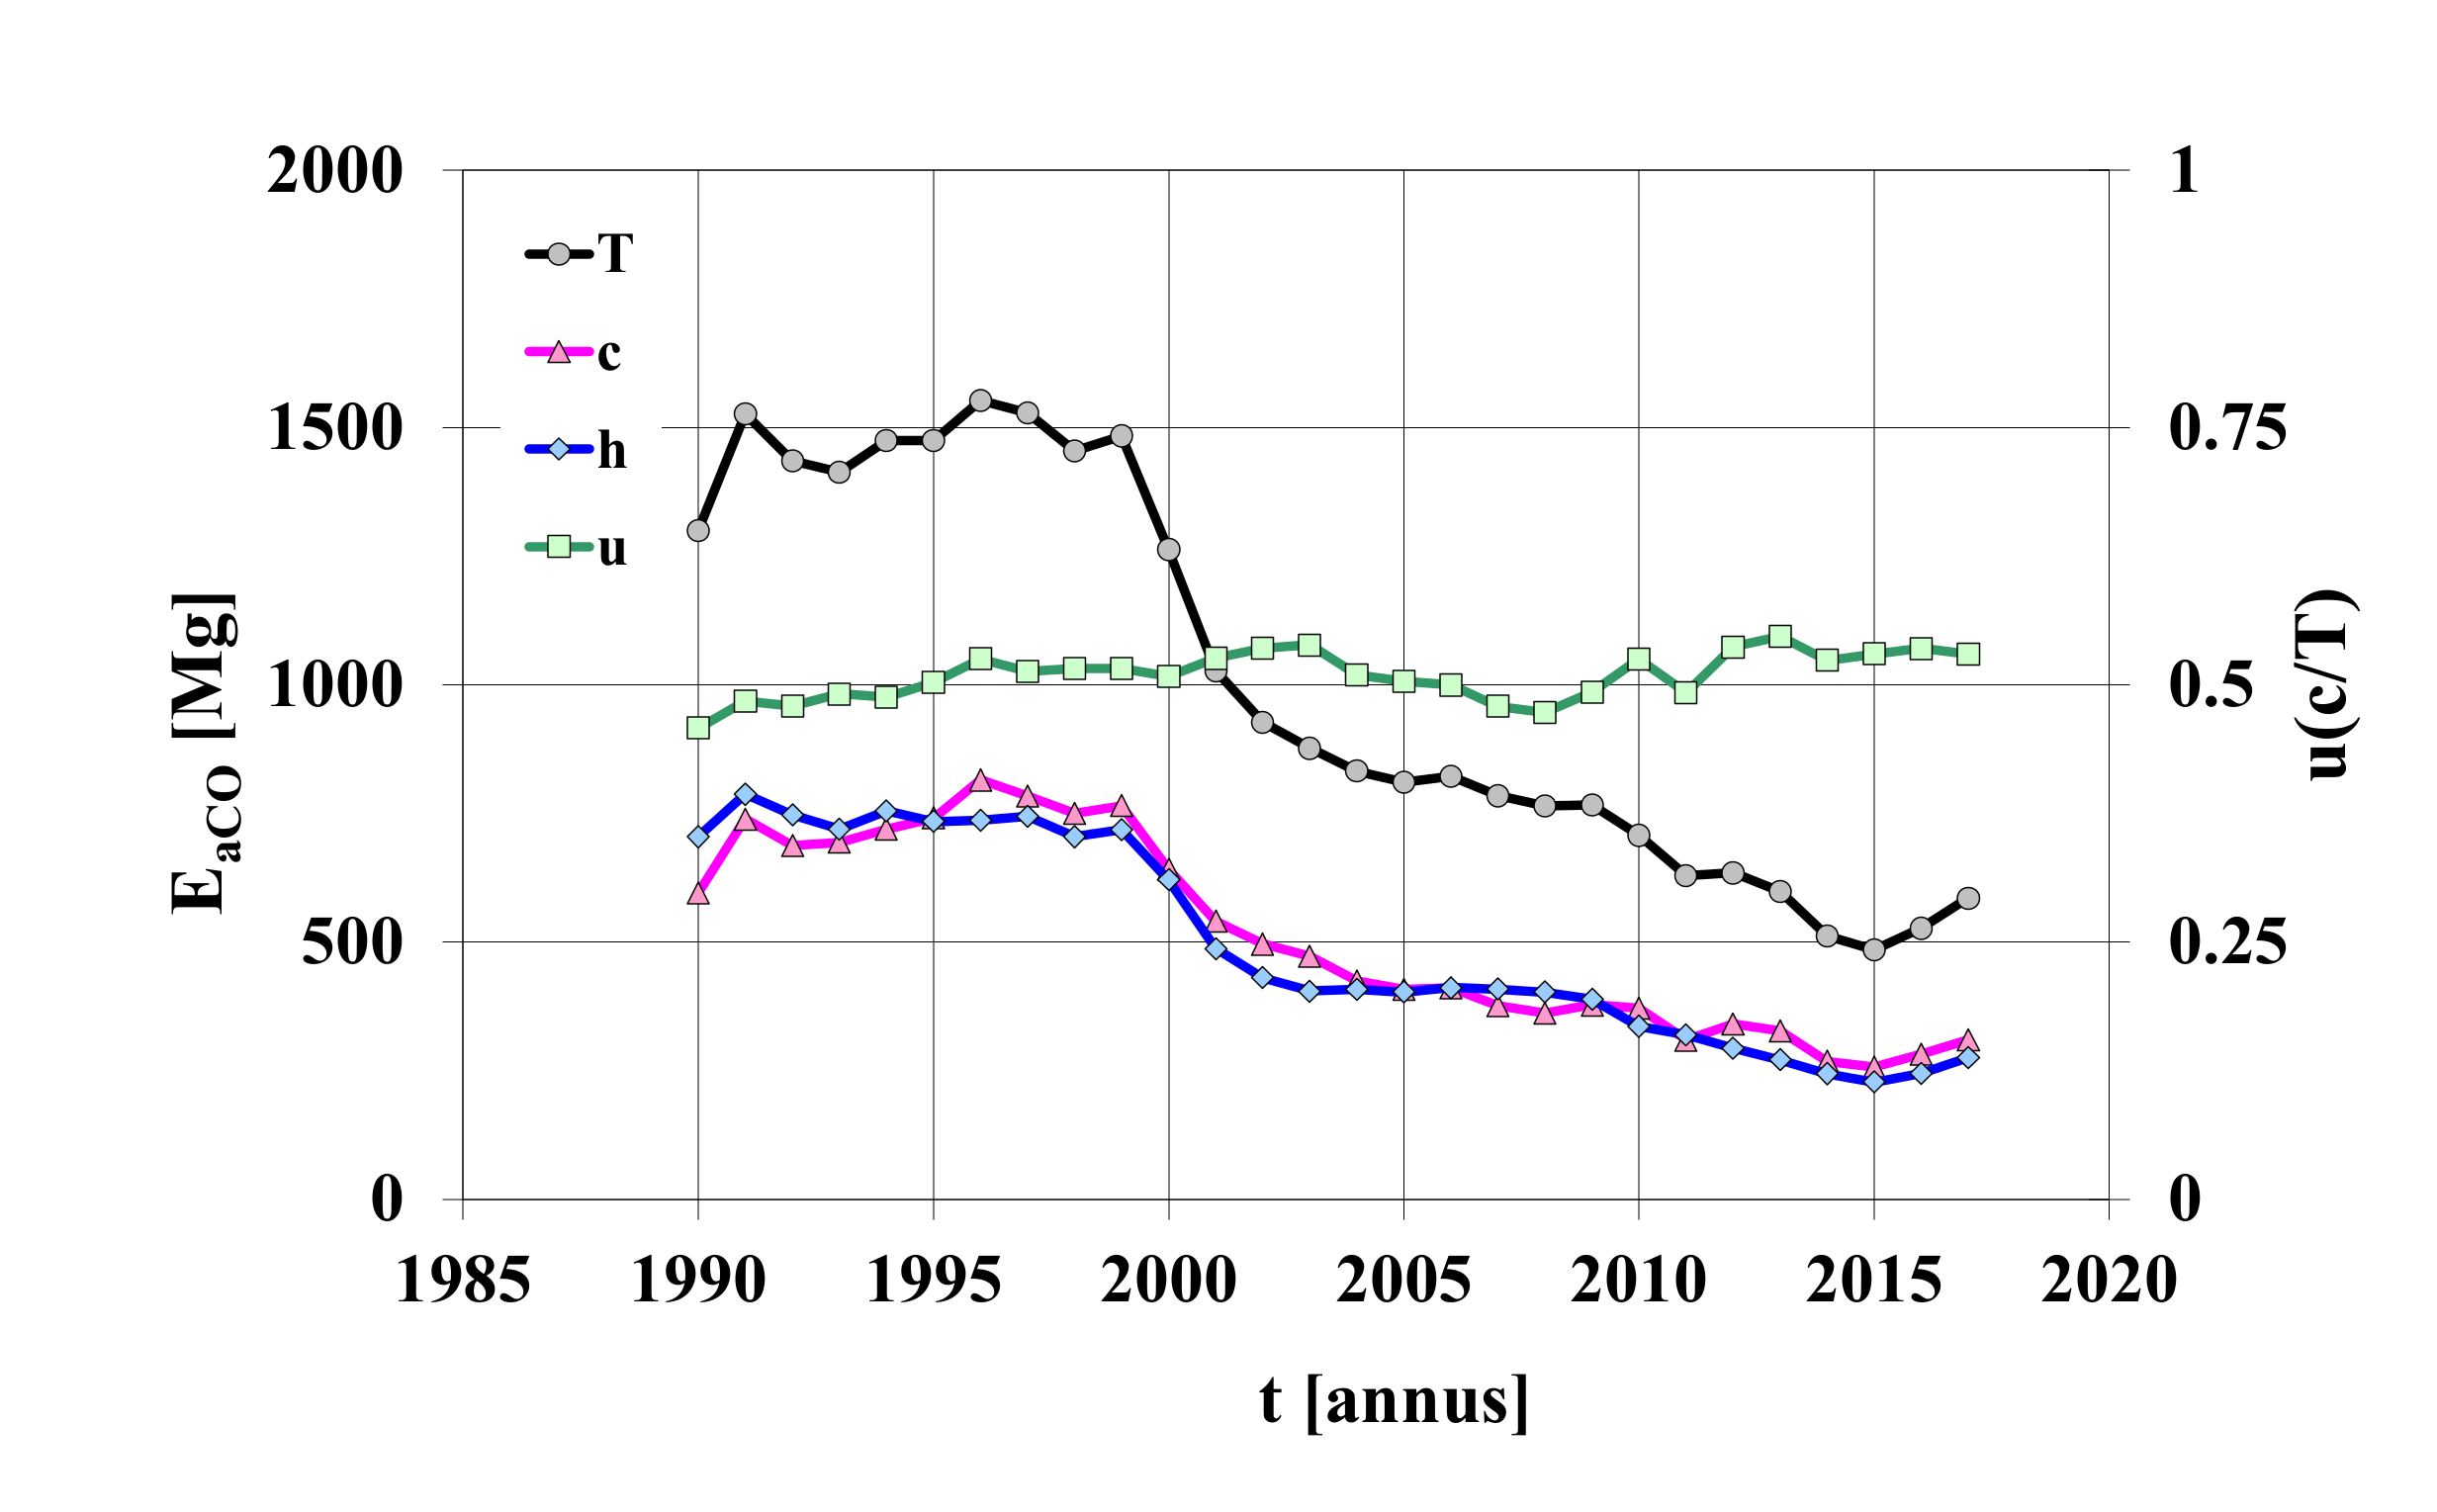
Abstract
:1. Introduction
- low efficiency of the catalytic converters due to too low temperatures of engine systems,
- less efficient combustion process under low engine temperatures,
- supplying cylinders with a richer mixture in the case of warmed-up engines.
- GF—total fuel consumption intensity,
- E—total pollutant emission intensity—a set of which elements are the emission intensity of an individual pollutant.
- ambient temperature—ta,
- rest time before starting the engine—τ,
- distance traveled by the vehicle after start-up—l,
- vehicle motion conditions after engine start-up, as described by the model of vehicle movement—v(t).
- GFw—additional fuel consumption intensity during warm-up of the internal combustion engine,
- Ew—additional pollutant emission intensity during warm-up of the internal combustion engine.
2. Methodology
- passenger cars,
- light commercial vehicles,
- heavy duty trucks,
- urban buses,
- coaches,
- the L-category: motorcycles, mopeds, quads, ATVs (all-terrain vehicles) and micro-cars.
- internal combustion engine heated to a stabilized temperature,
- combustion engine heating up,
- evaporation of fuel from the car’s fuel system.
- in cities,
- outside cities,
- on highways and expressways.
- purpose of road vehicles,
- contractual size of road vehicles and their propulsion engines,
- properties of road vehicles and their propulsion engines due to, inter alia, the emission of pollutants,
- fuel for internal combustion engines applied in road vehicles,
- technical level of road vehicles and their propulsion engines.
- average speed in model traffic conditions,
- share of the distance traveled by the vehicle in model traffic conditions in the total length of the road.
- distance traveled by the vehicle while the engine is warming up,
- extreme average temperatures during the month.
- carbon monoxide—CO,
- non-methane volatile organic compounds—NMVOC,
- nitrogen oxides NOx: nitrogen dioxide—NO2,
- particulate matter—PM,
- carbon dioxide—CO2.
- national annual emission of pollutants (total),
- annual emission of pollutants during internal combustion engine warm-up,
- annual emission of pollutants from engine heated to a stable temperature,
- shares of pollutant emissions during cold-start in total annual pollutant emission.
- ambient temperature: 0 °C,
- the distance traveled by the vehicle after engine start-up: (3 ÷ 4) km,
- parking time before starting the engine: more than 12 h,
- vehicle movement conditions after engine start-up: described by the urban traffic model for an average speed of about 37 km/h.
- additional emission of pollutants during engine heating for passenger cars of Euro 0–Euro 6 categories—a software procedure in accordance with Formula (3),
- specific distance emissions of pollutants from heated engines for passenger cars of Euro 0–Euro 6 categories,
- total emission of pollutants from engines for passenger cars of Euro 0–Euro 6 categories in accordance with the Formula (4),
- share of additional pollutant emissions in the time of engine heating in the total pollutant emission.
- mT—emission of pollutants from engines in model car traffic conditions,
- mc—additional emission of pollutants during engine heating in model car traffic conditions,
- mh—emission of pollutants from engines heated in model conditions of car traffic,
- bh—specific distance emissions of pollutants from engines heated in model car traffic conditions—a set of which elements are specific distance emissions of individual pollutants.
3. Results
4. Summary—Discussion of the Results and Conclusions
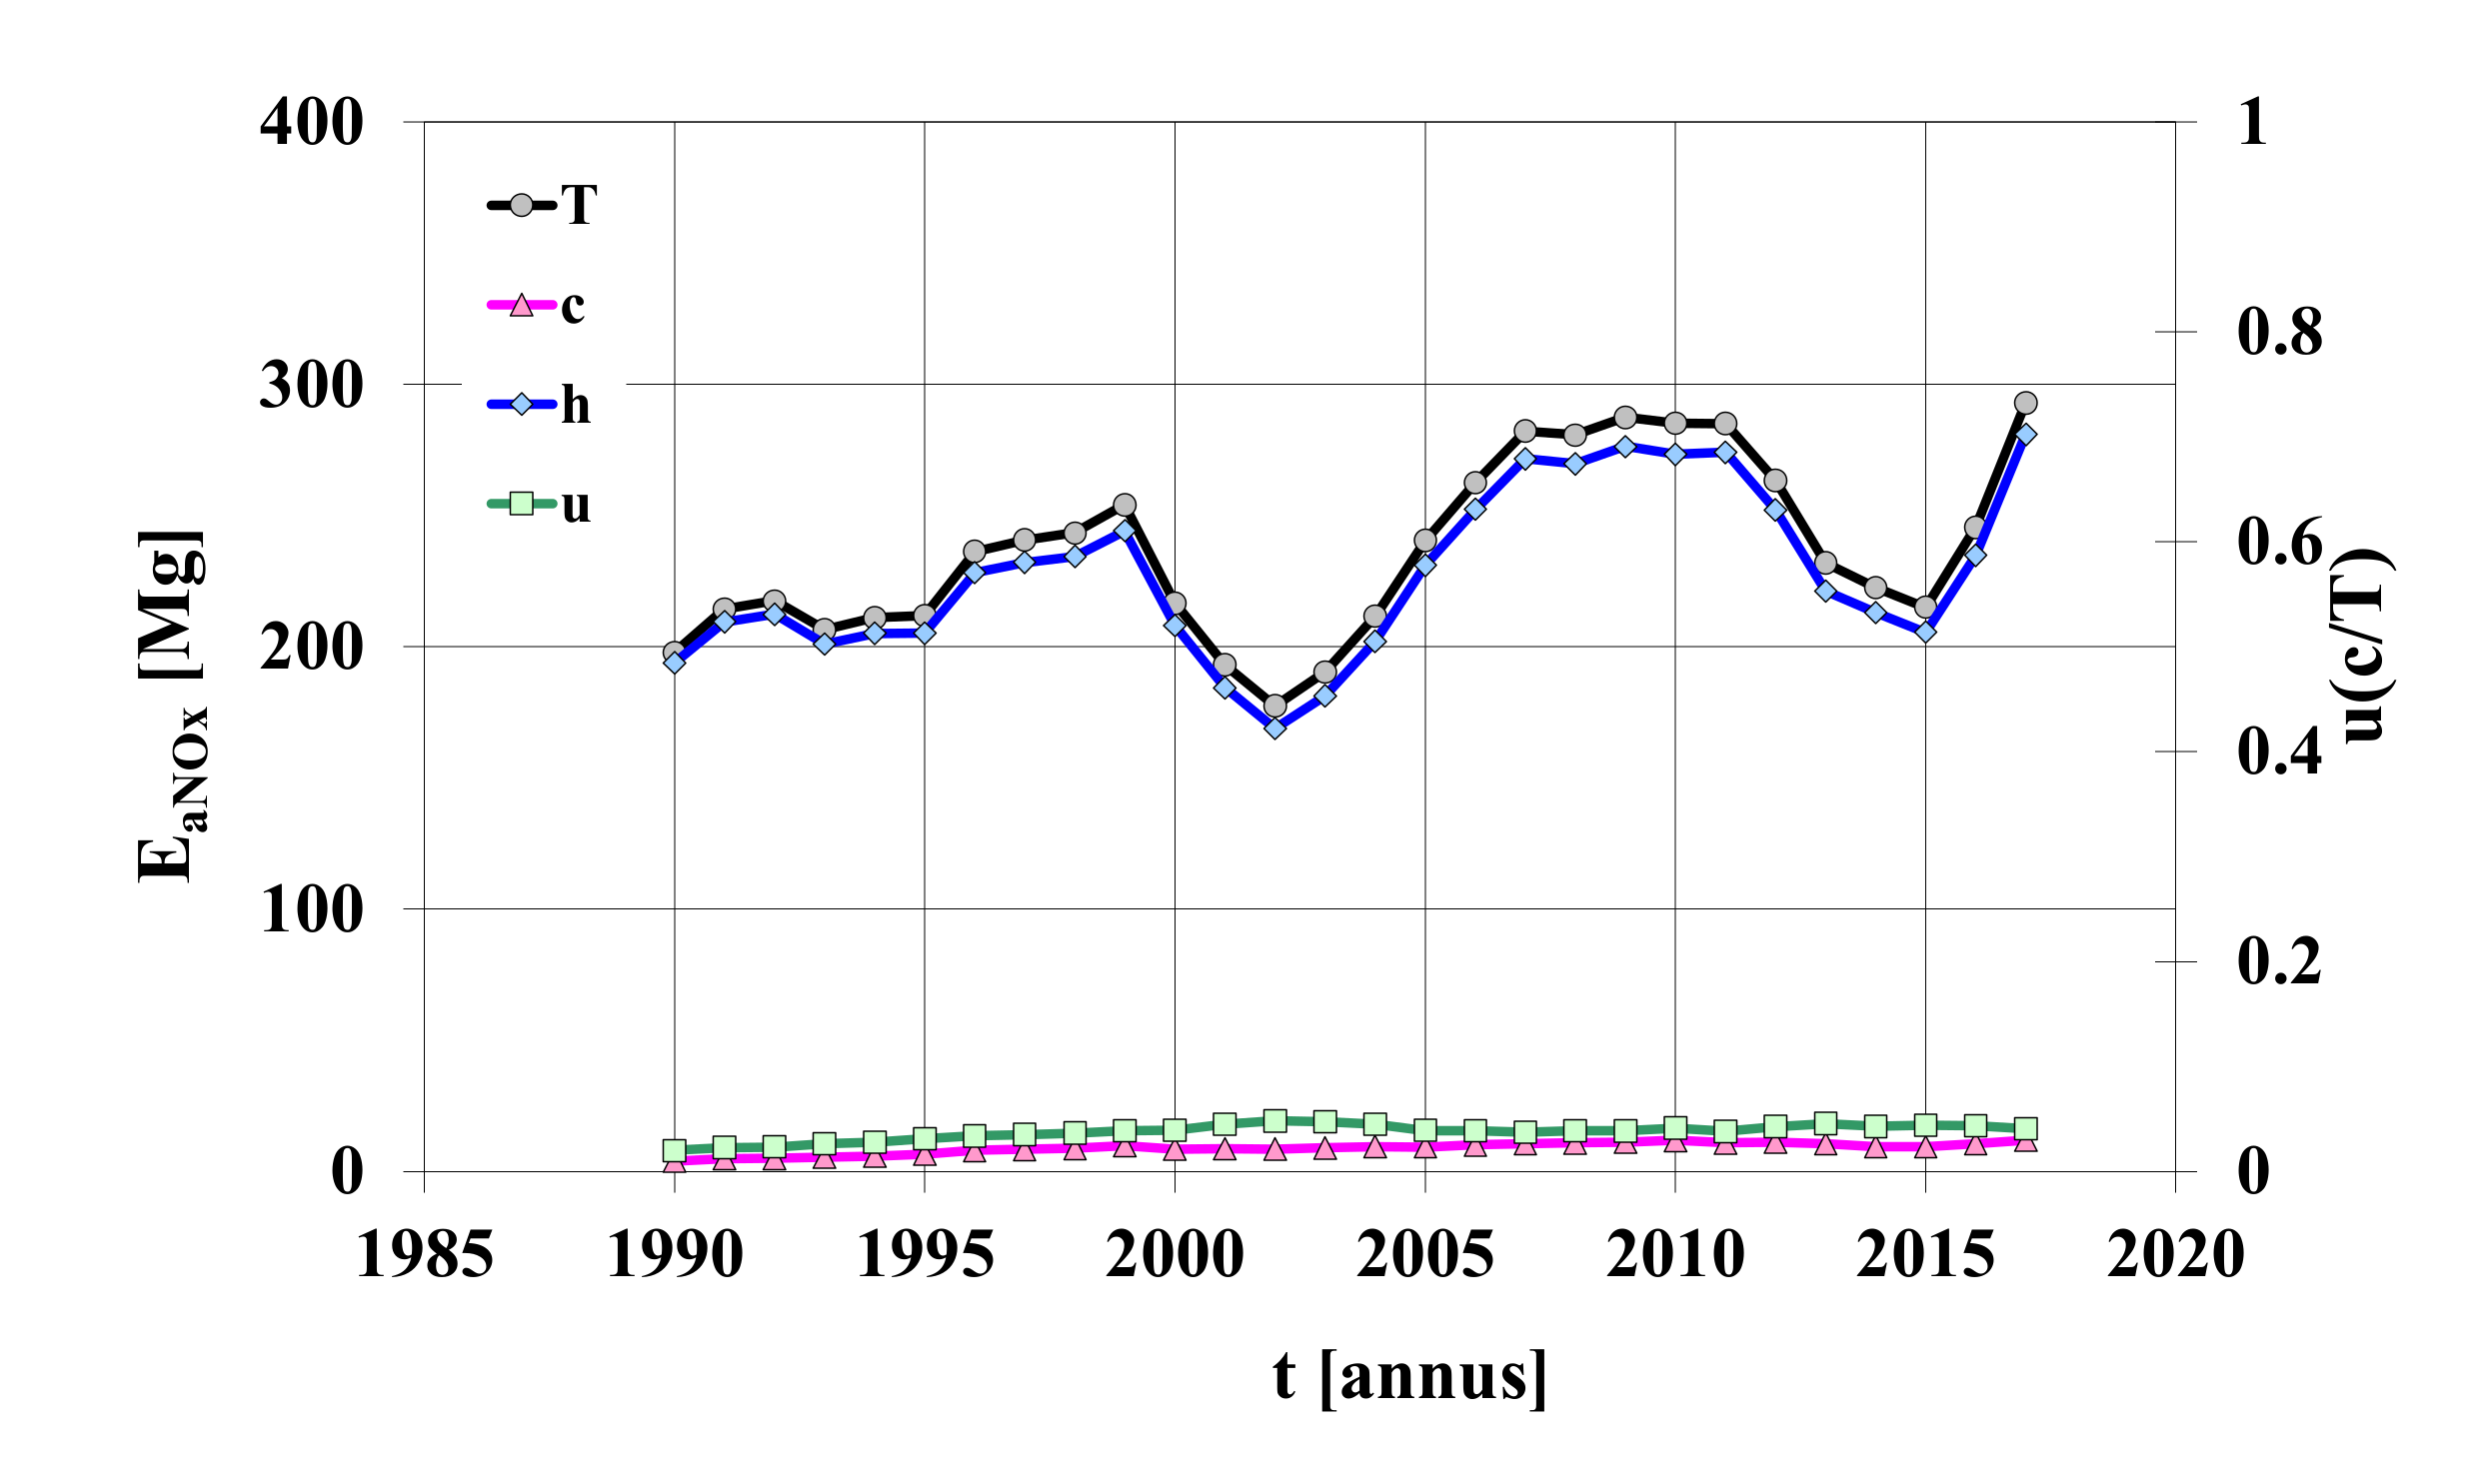
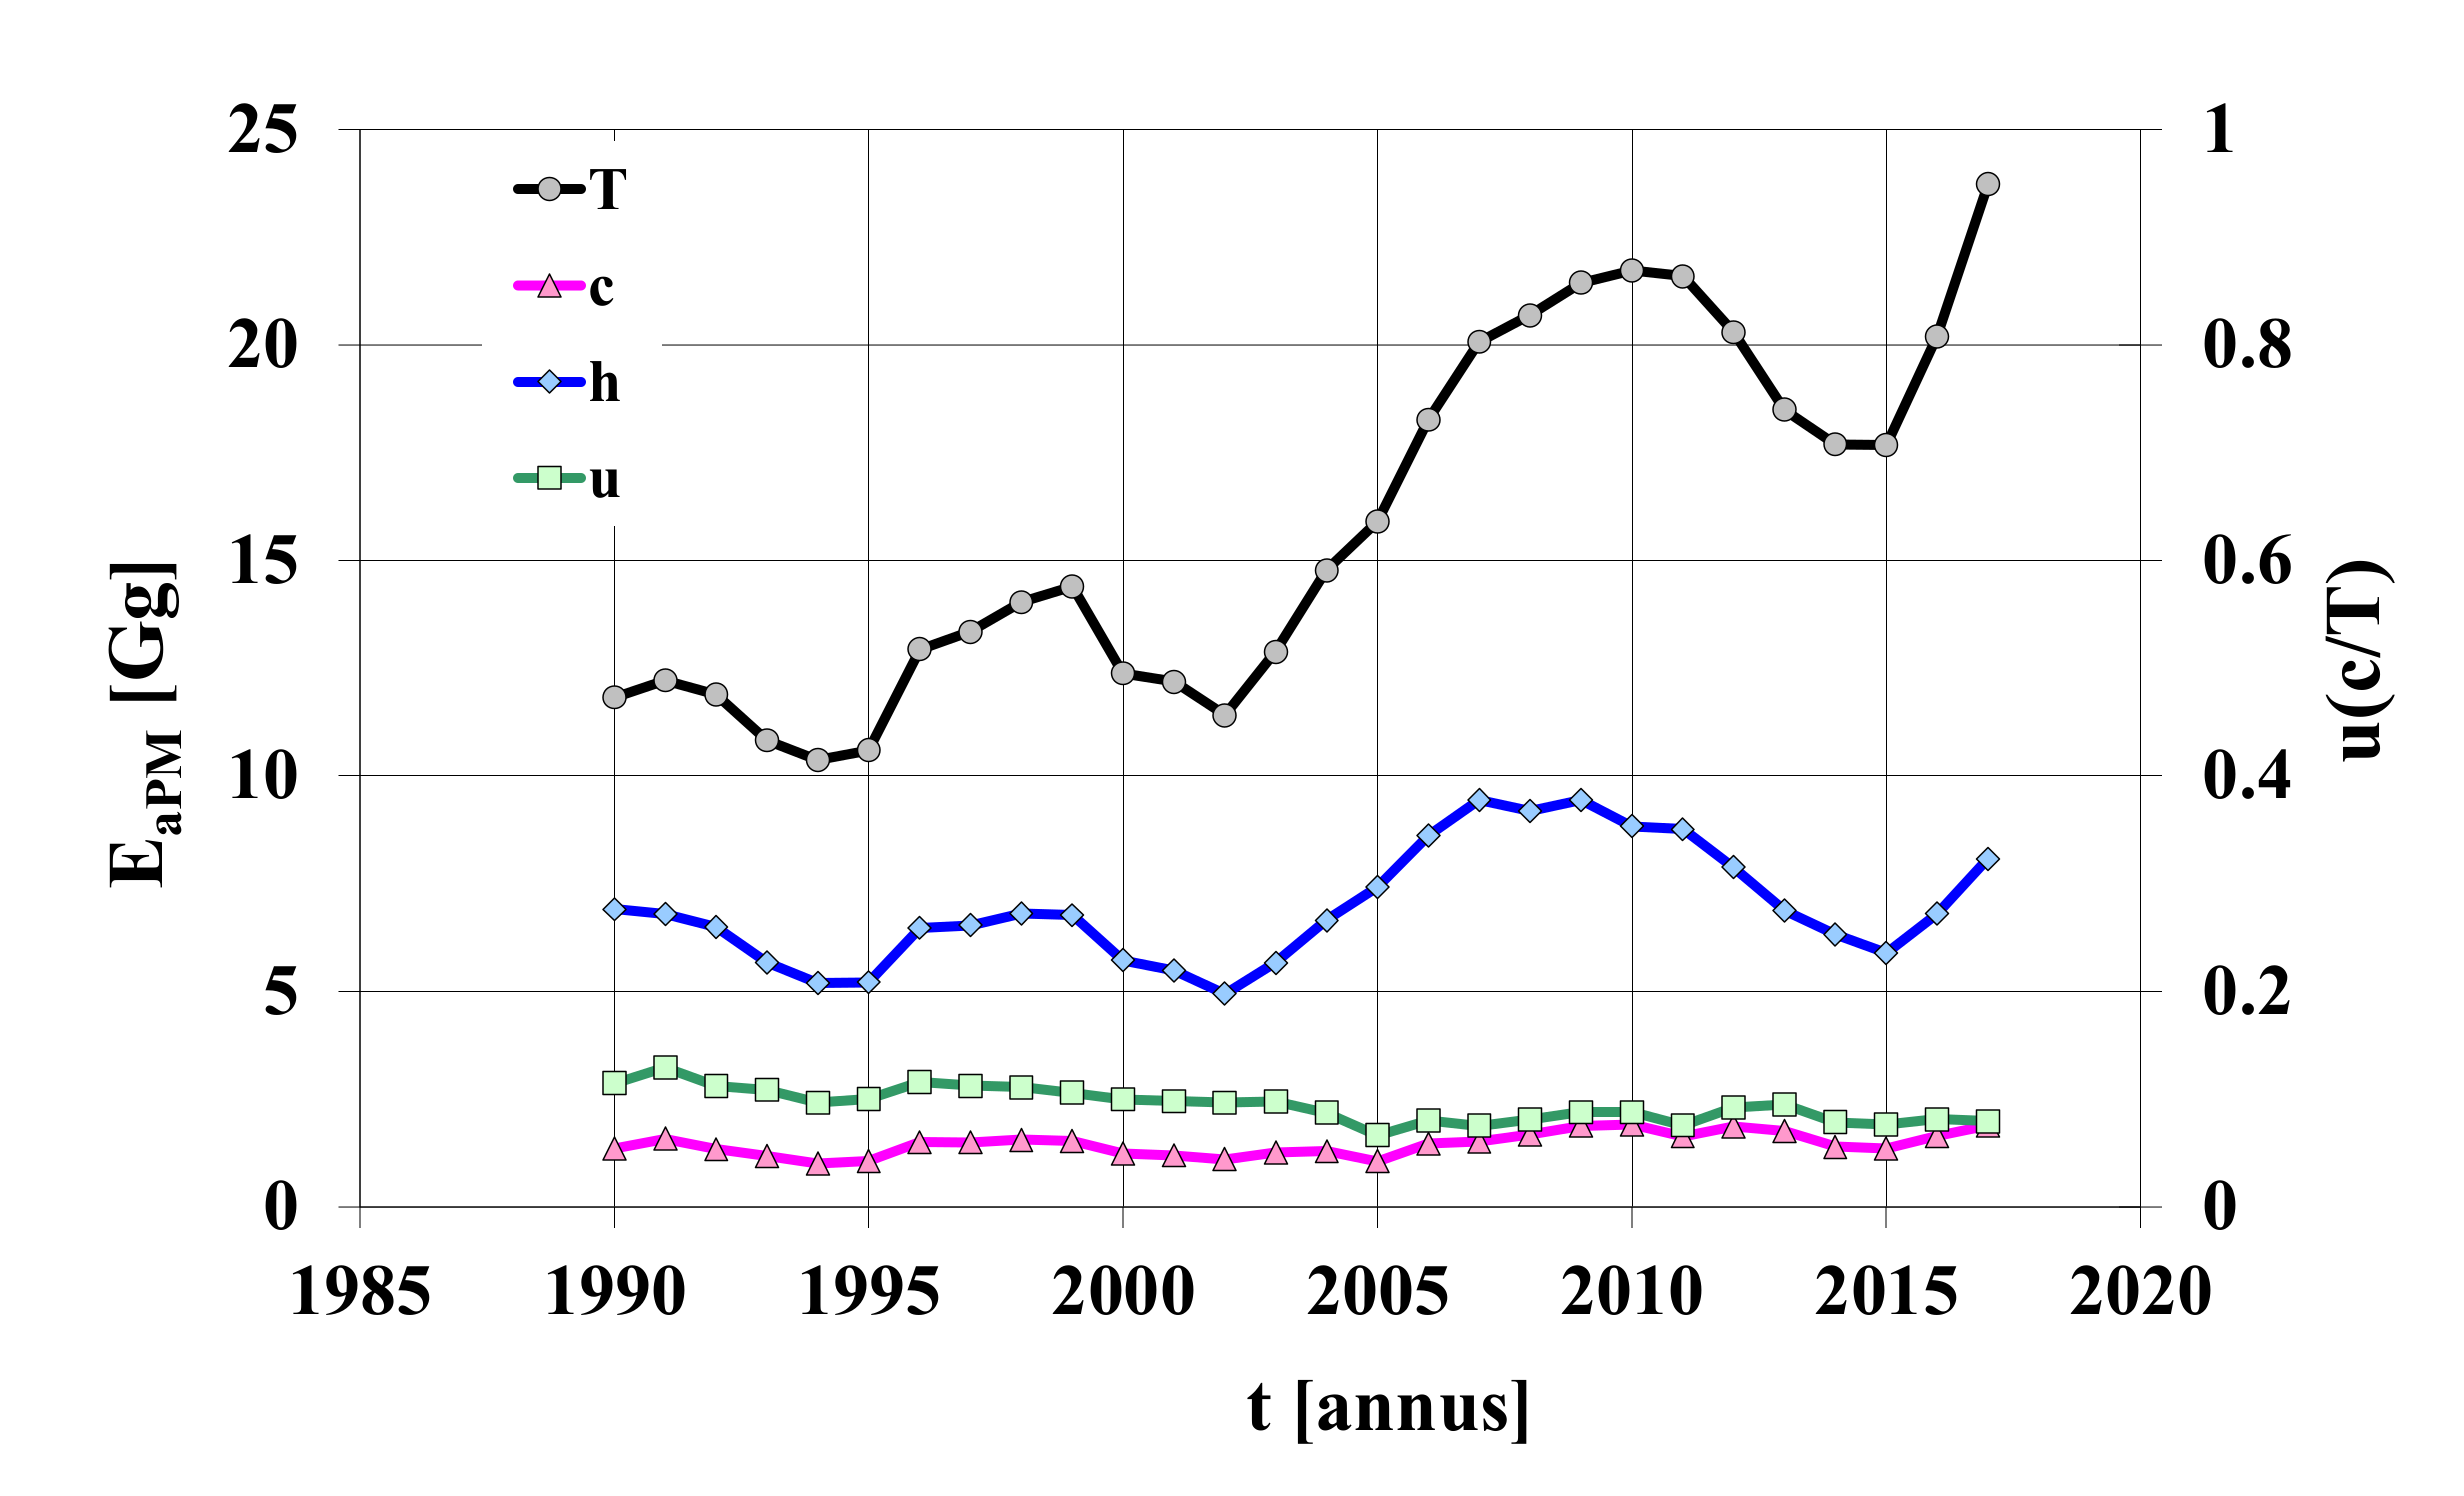
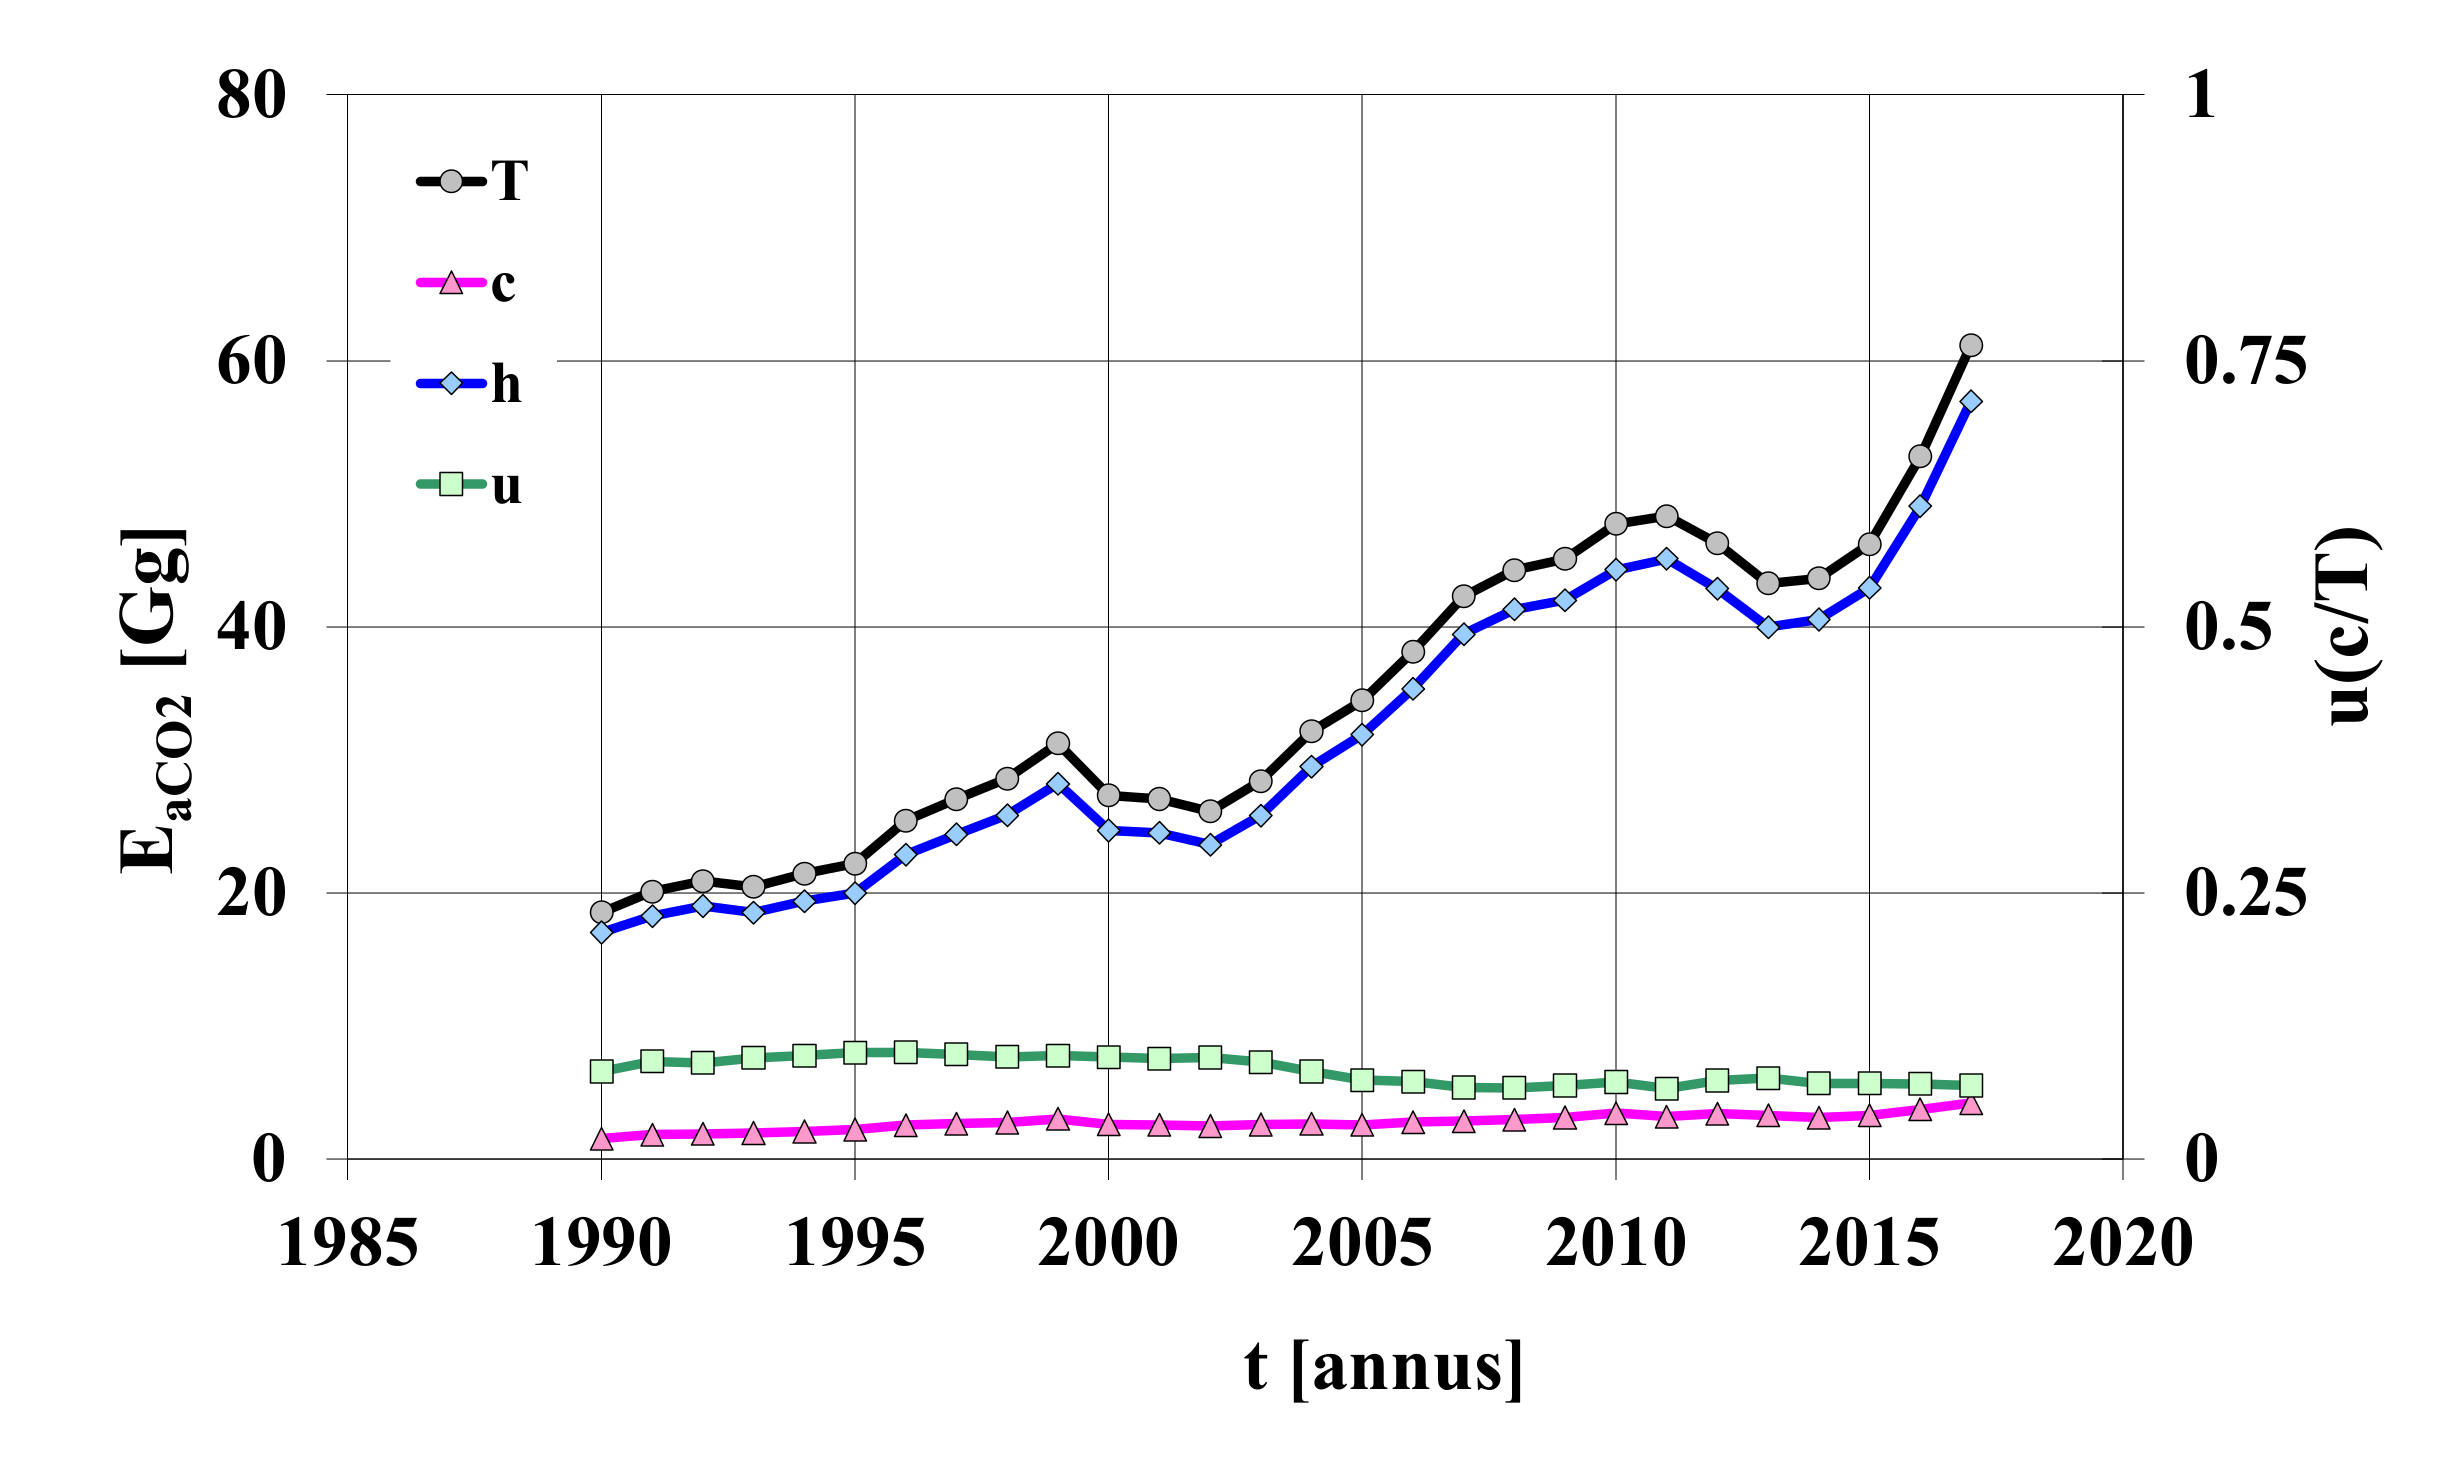
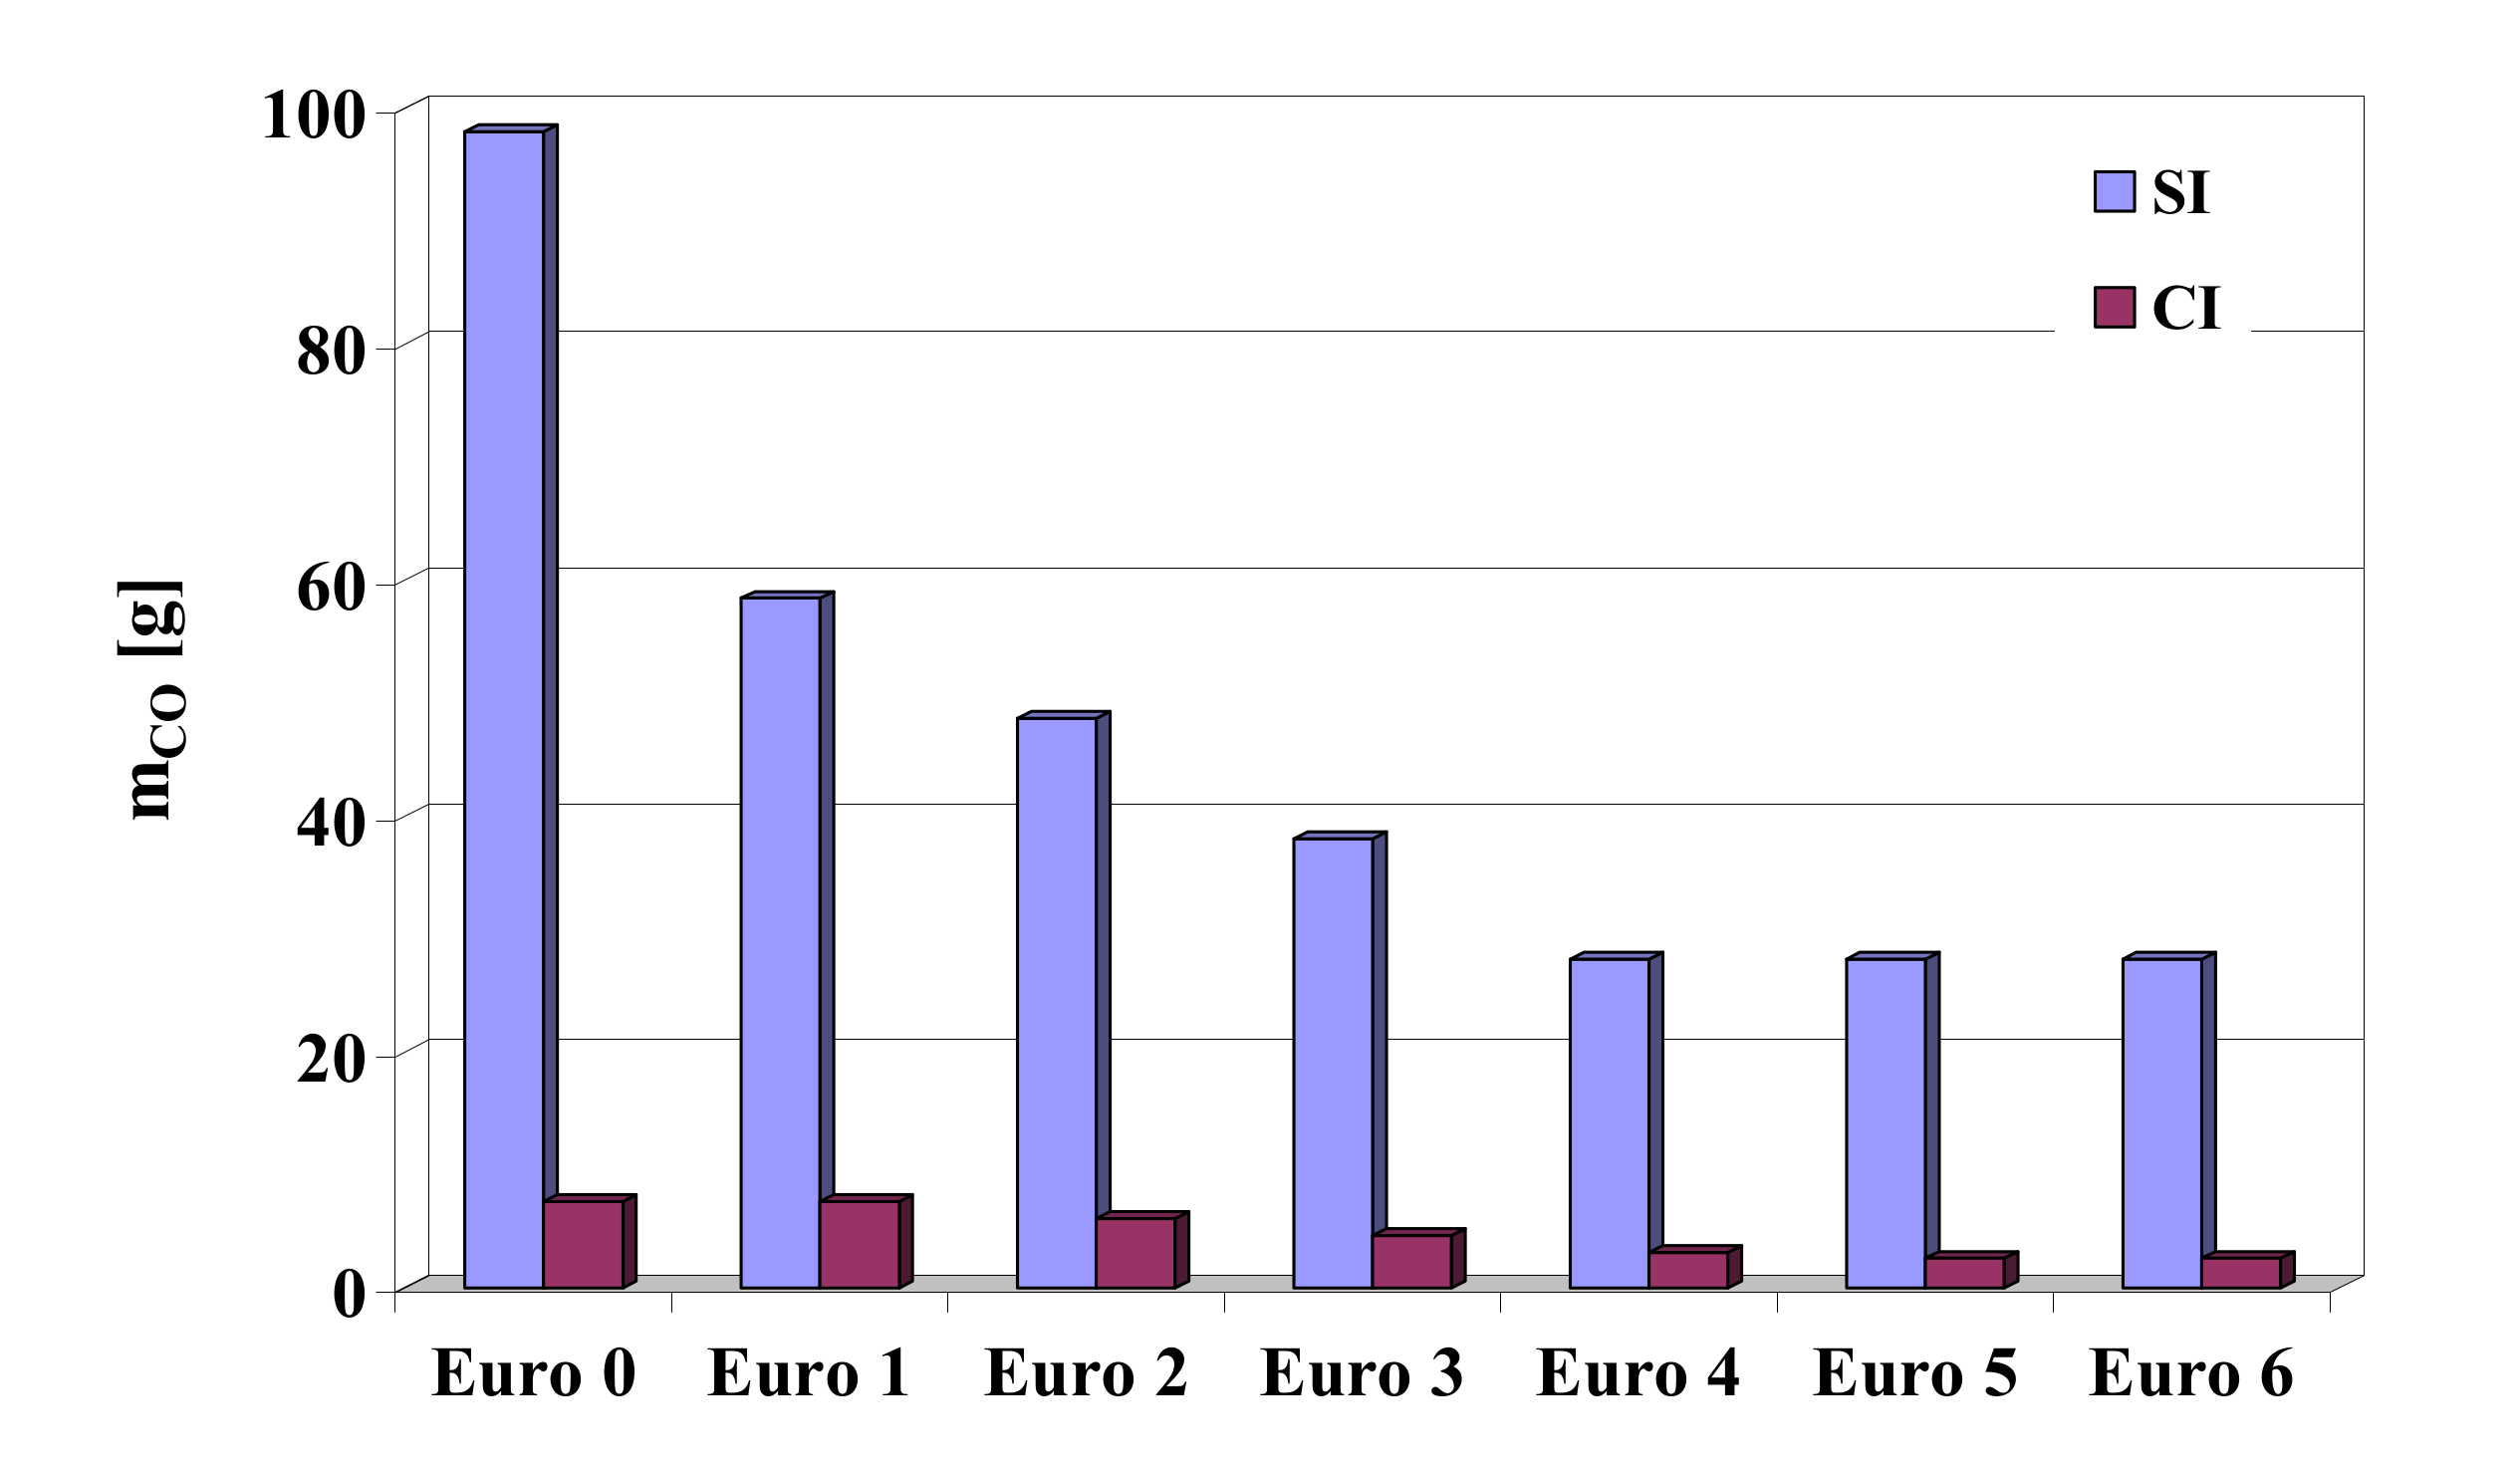
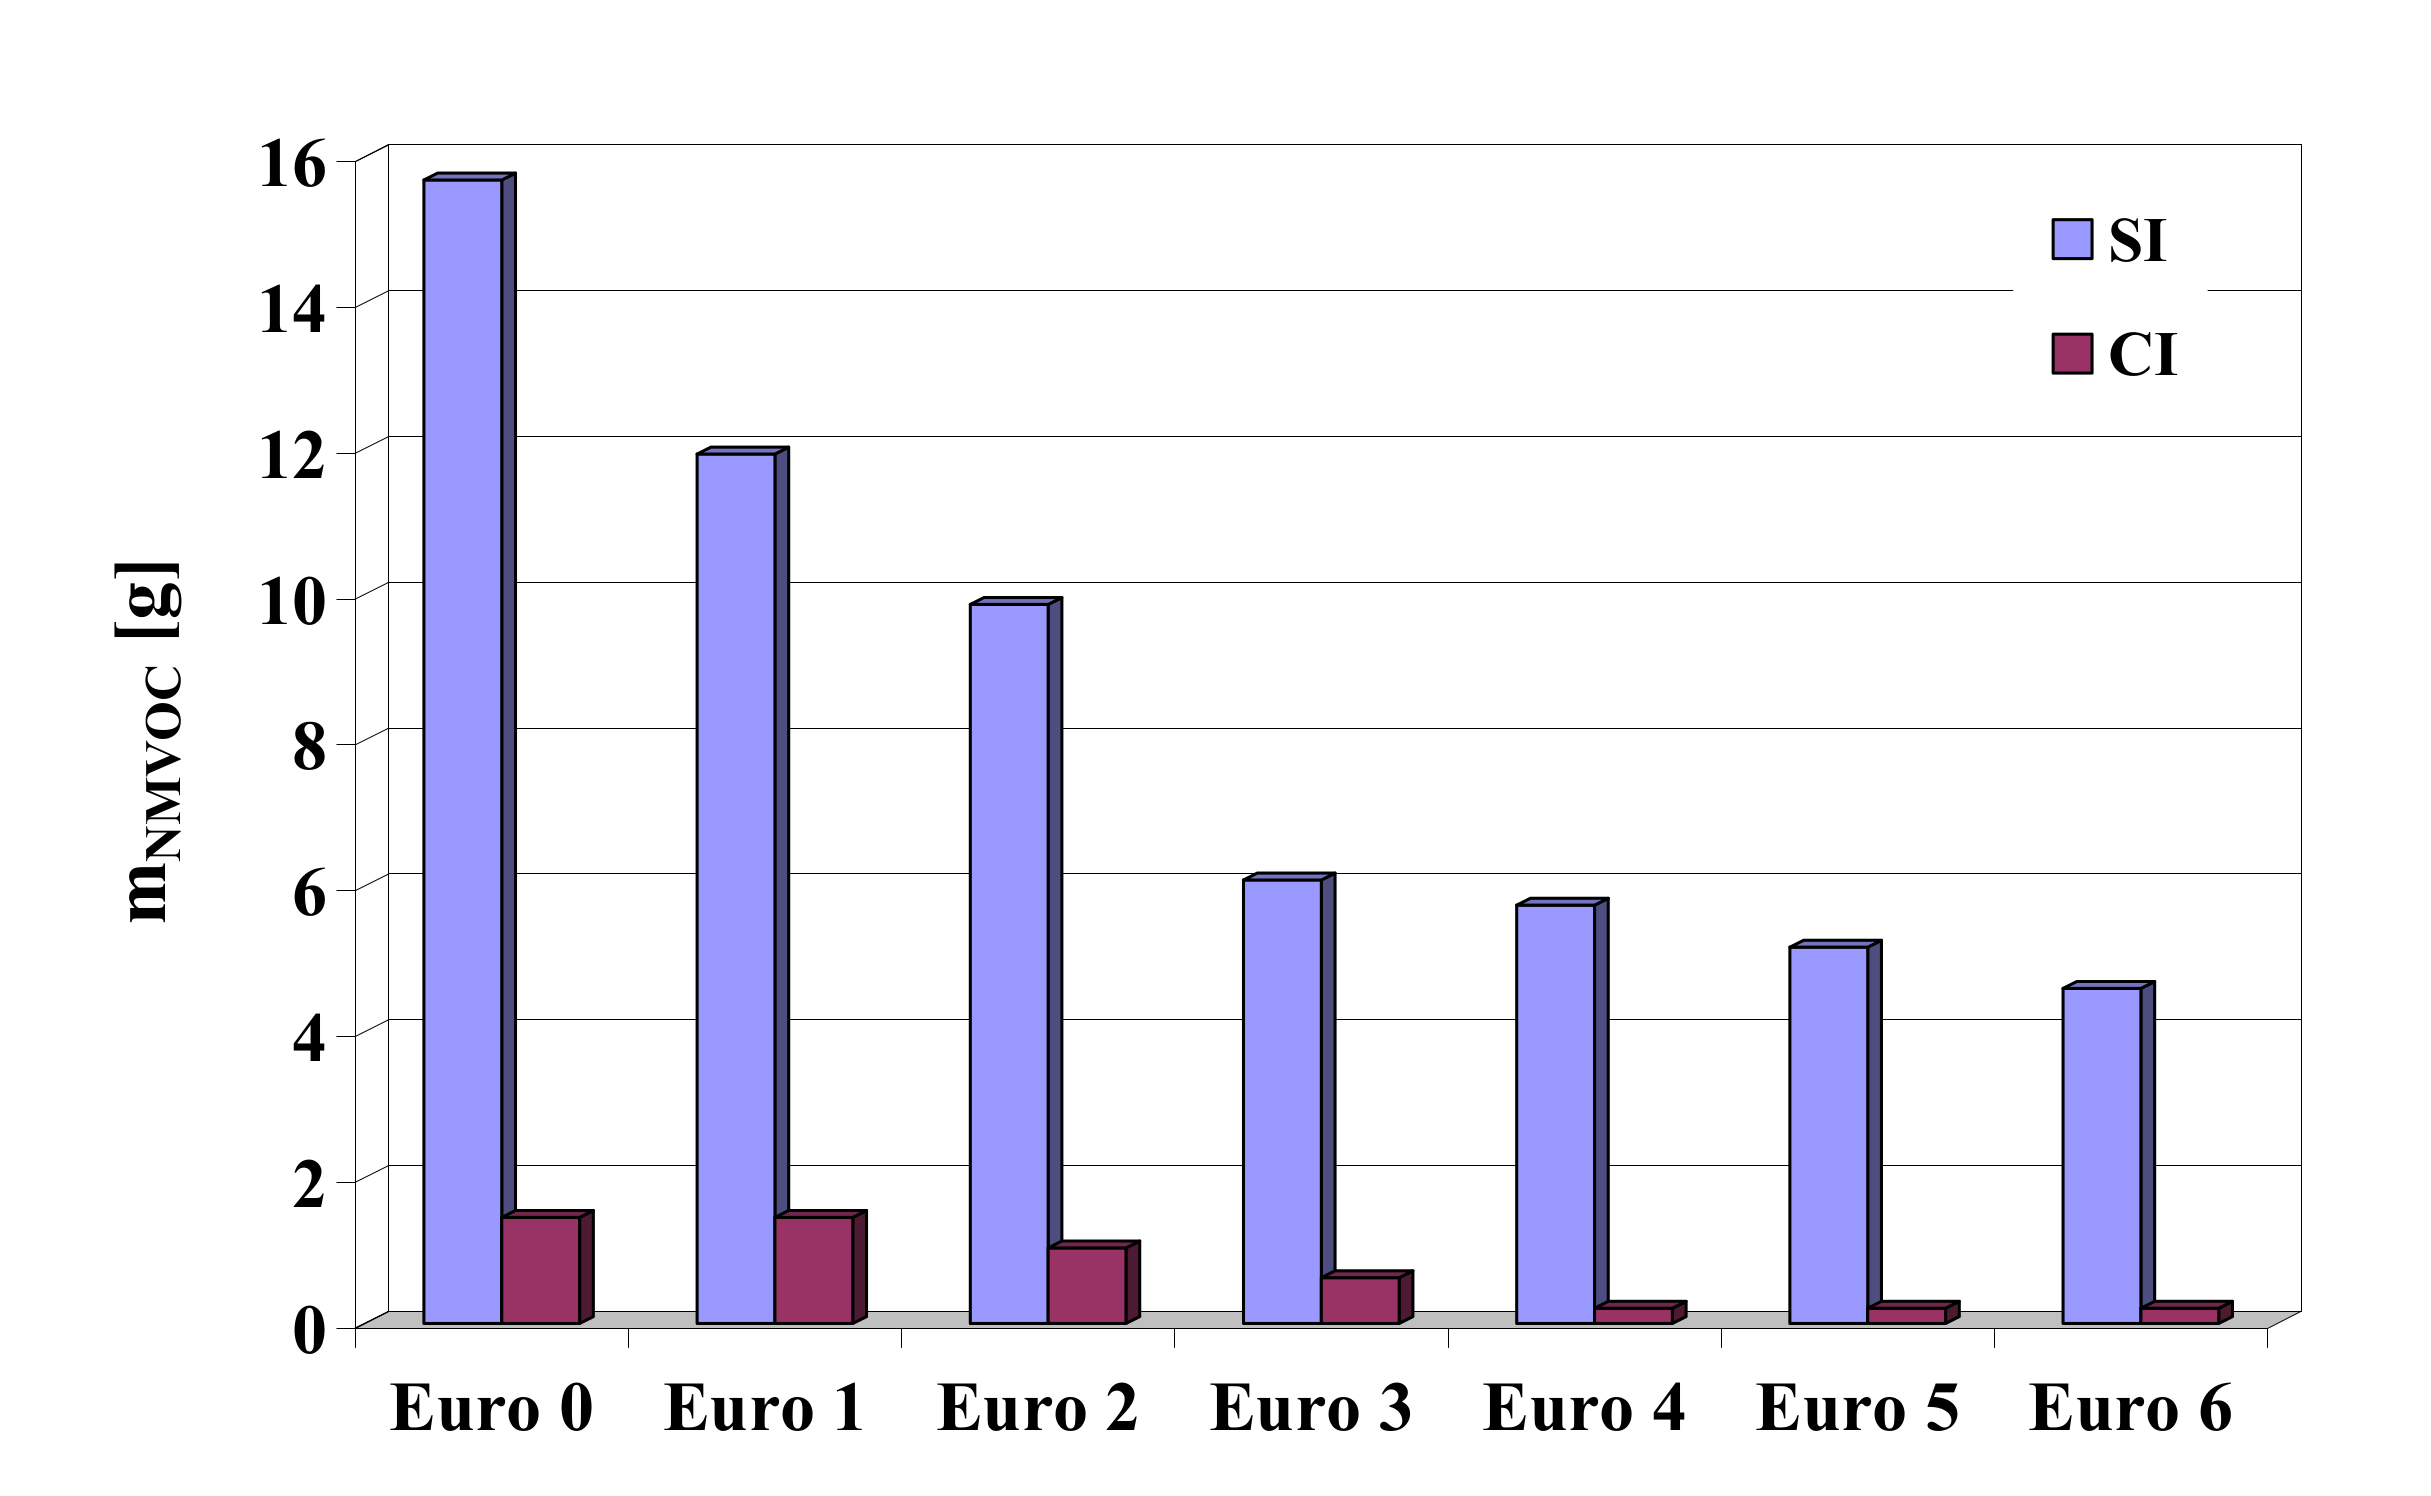
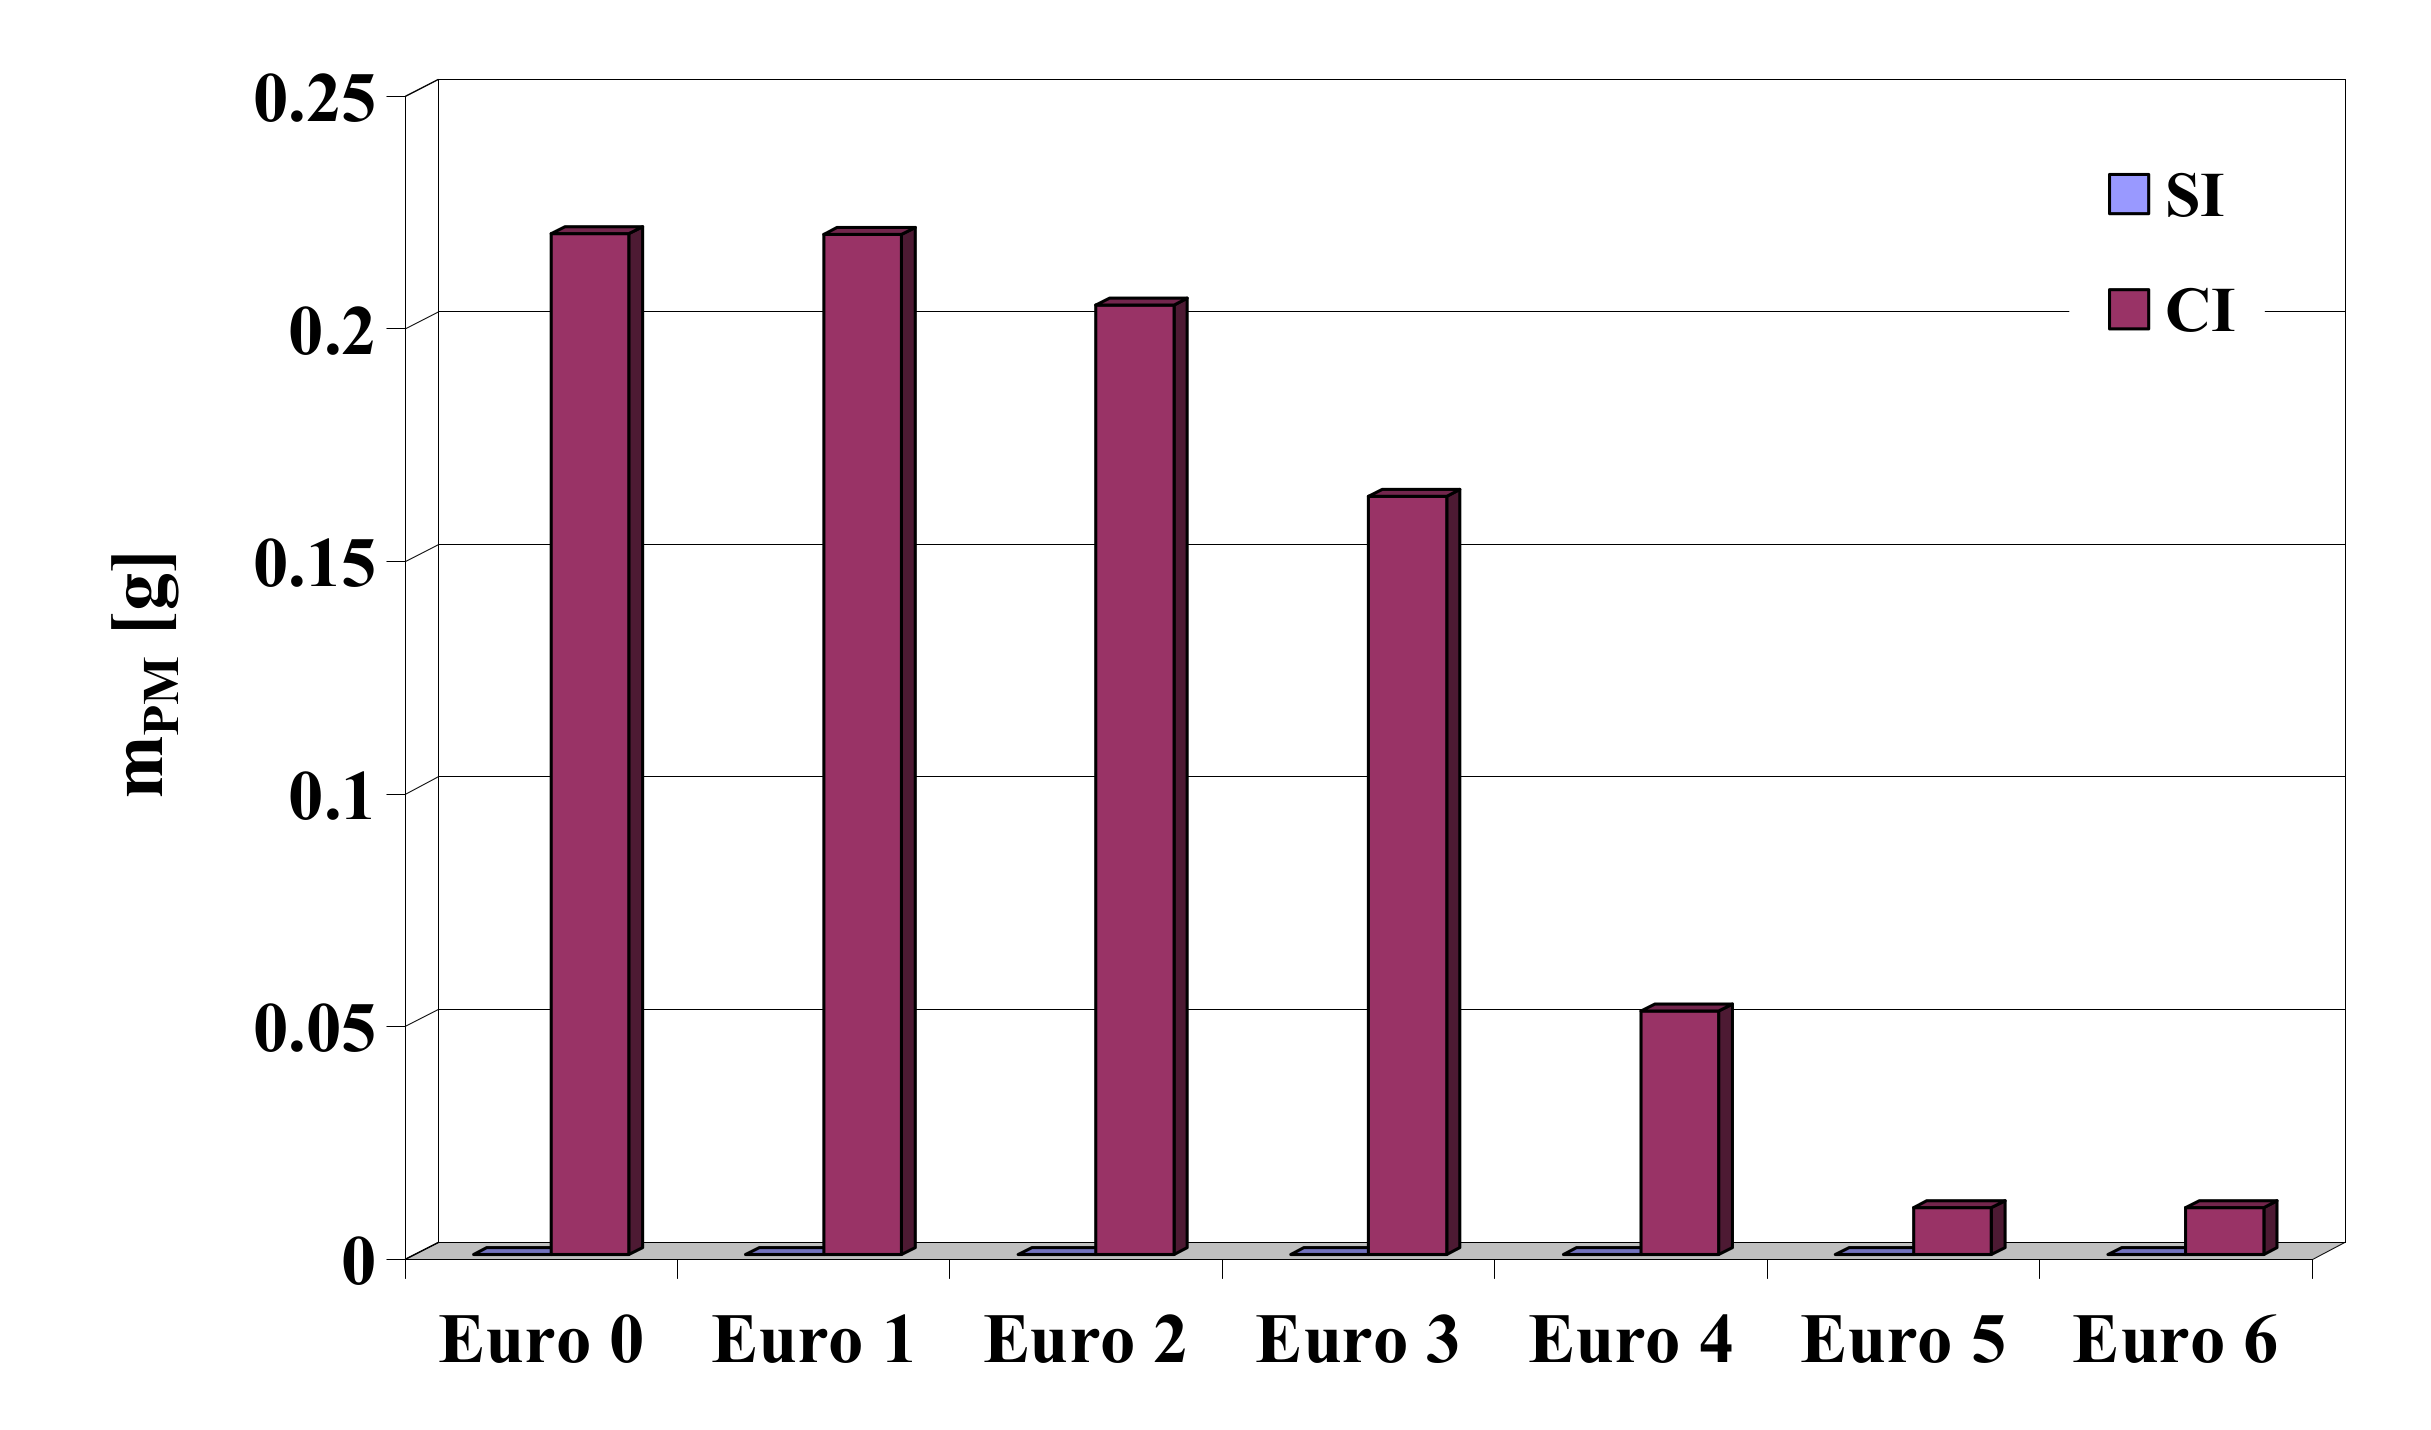
- Even with the ongoing considerable intensification of road transport in Poland, national annual emissions of hazardous pollutants, both total and from combustion engines under warm-up conditions, show evident decreasing trends in the case of carbon monoxide and volatile organic compounds. The annual emissions of nitrogen oxides and particulate matter have remained stable (Figure 1, Figure 2, Figure 3, Figure 4 and Figure 5) [7,8]. Emission reductions are associated with the technological advancement of the motor industry, and particularly with the use of modern solutions to reduce pollutant emissions from vehicles. The upward trend observed in annual carbon dioxide emission results from the intensification of road transport and, as a consequence, increased fuel consumption. The transport sector has strived hard to reduce fuel use and carbon dioxide emission; however the effectiveness of the efforts undertaken is limited due to the laws of nature that affect the thermal efficiency of internal combustion engine circuits and, first of all, by the second law of thermodynamics.
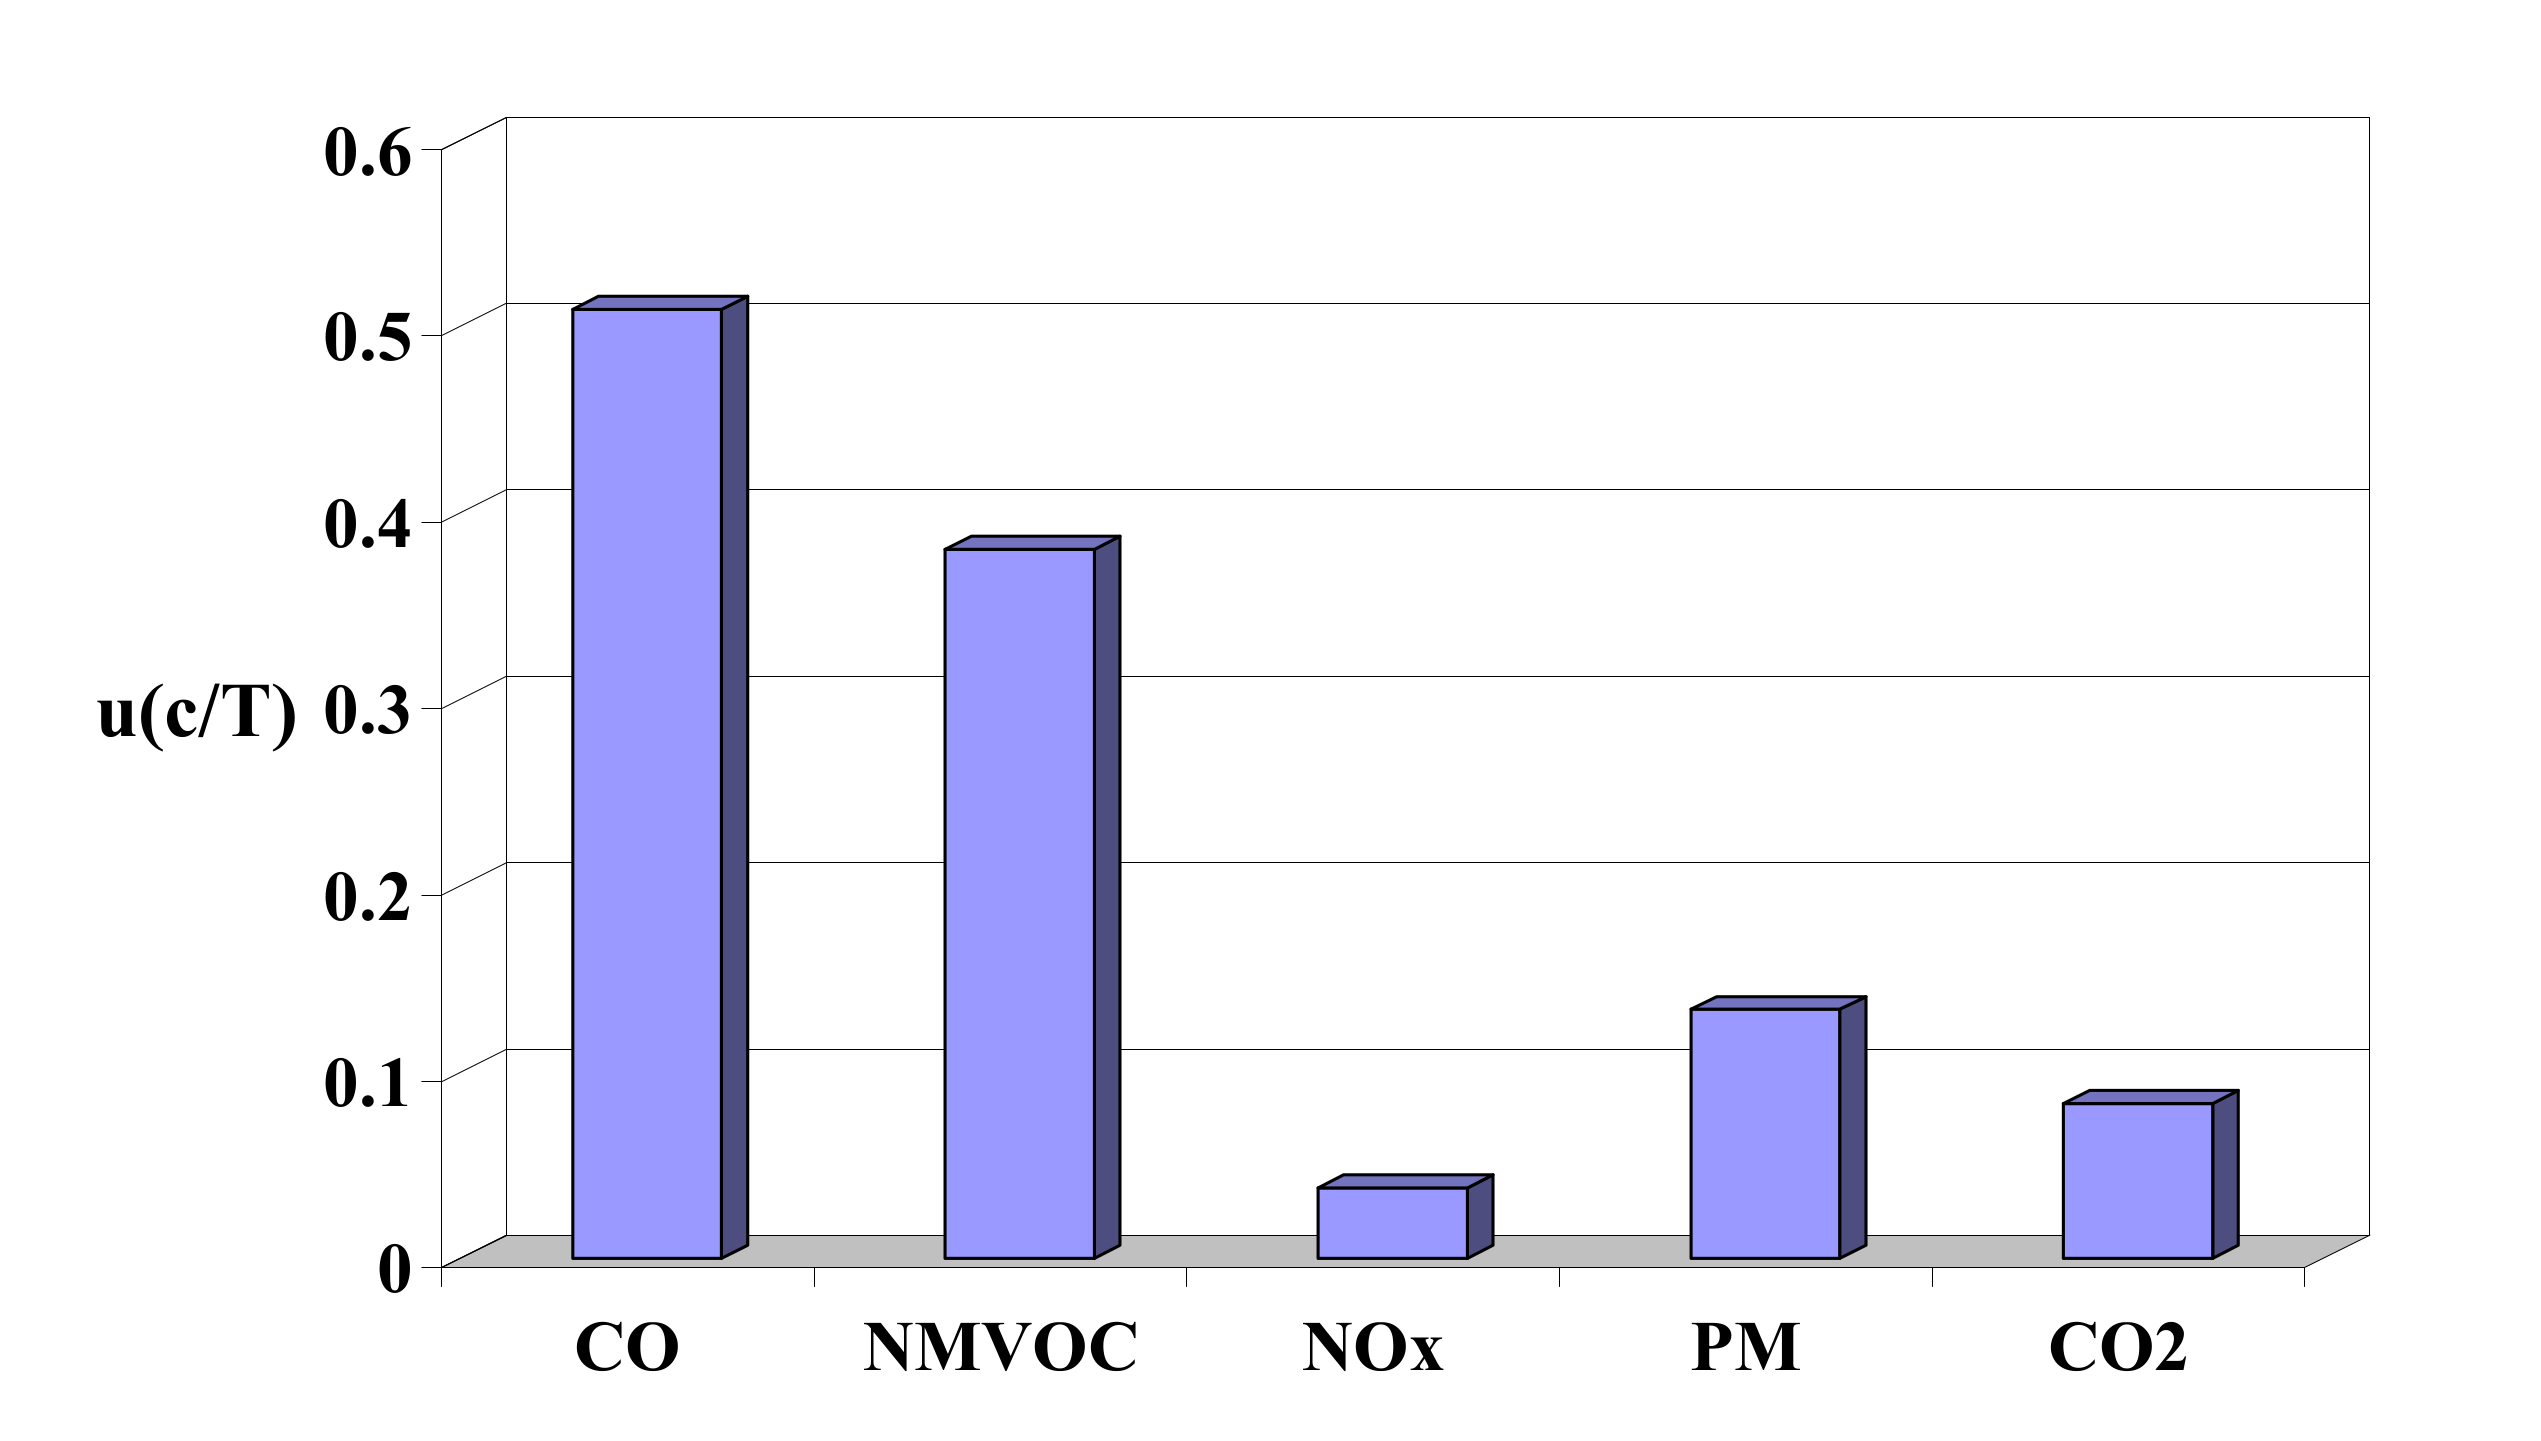
- The share of annual pollutant emissions from car engines under cold-start conditions in total annual emissions remains almost constant. Emissions of carbon monoxide and volatile organic compounds constitute the largest shares—about 50%, whereas the particulate matter share is less than 15%, carbon dioxide less than 10% and nitrogen oxides less than 5%.
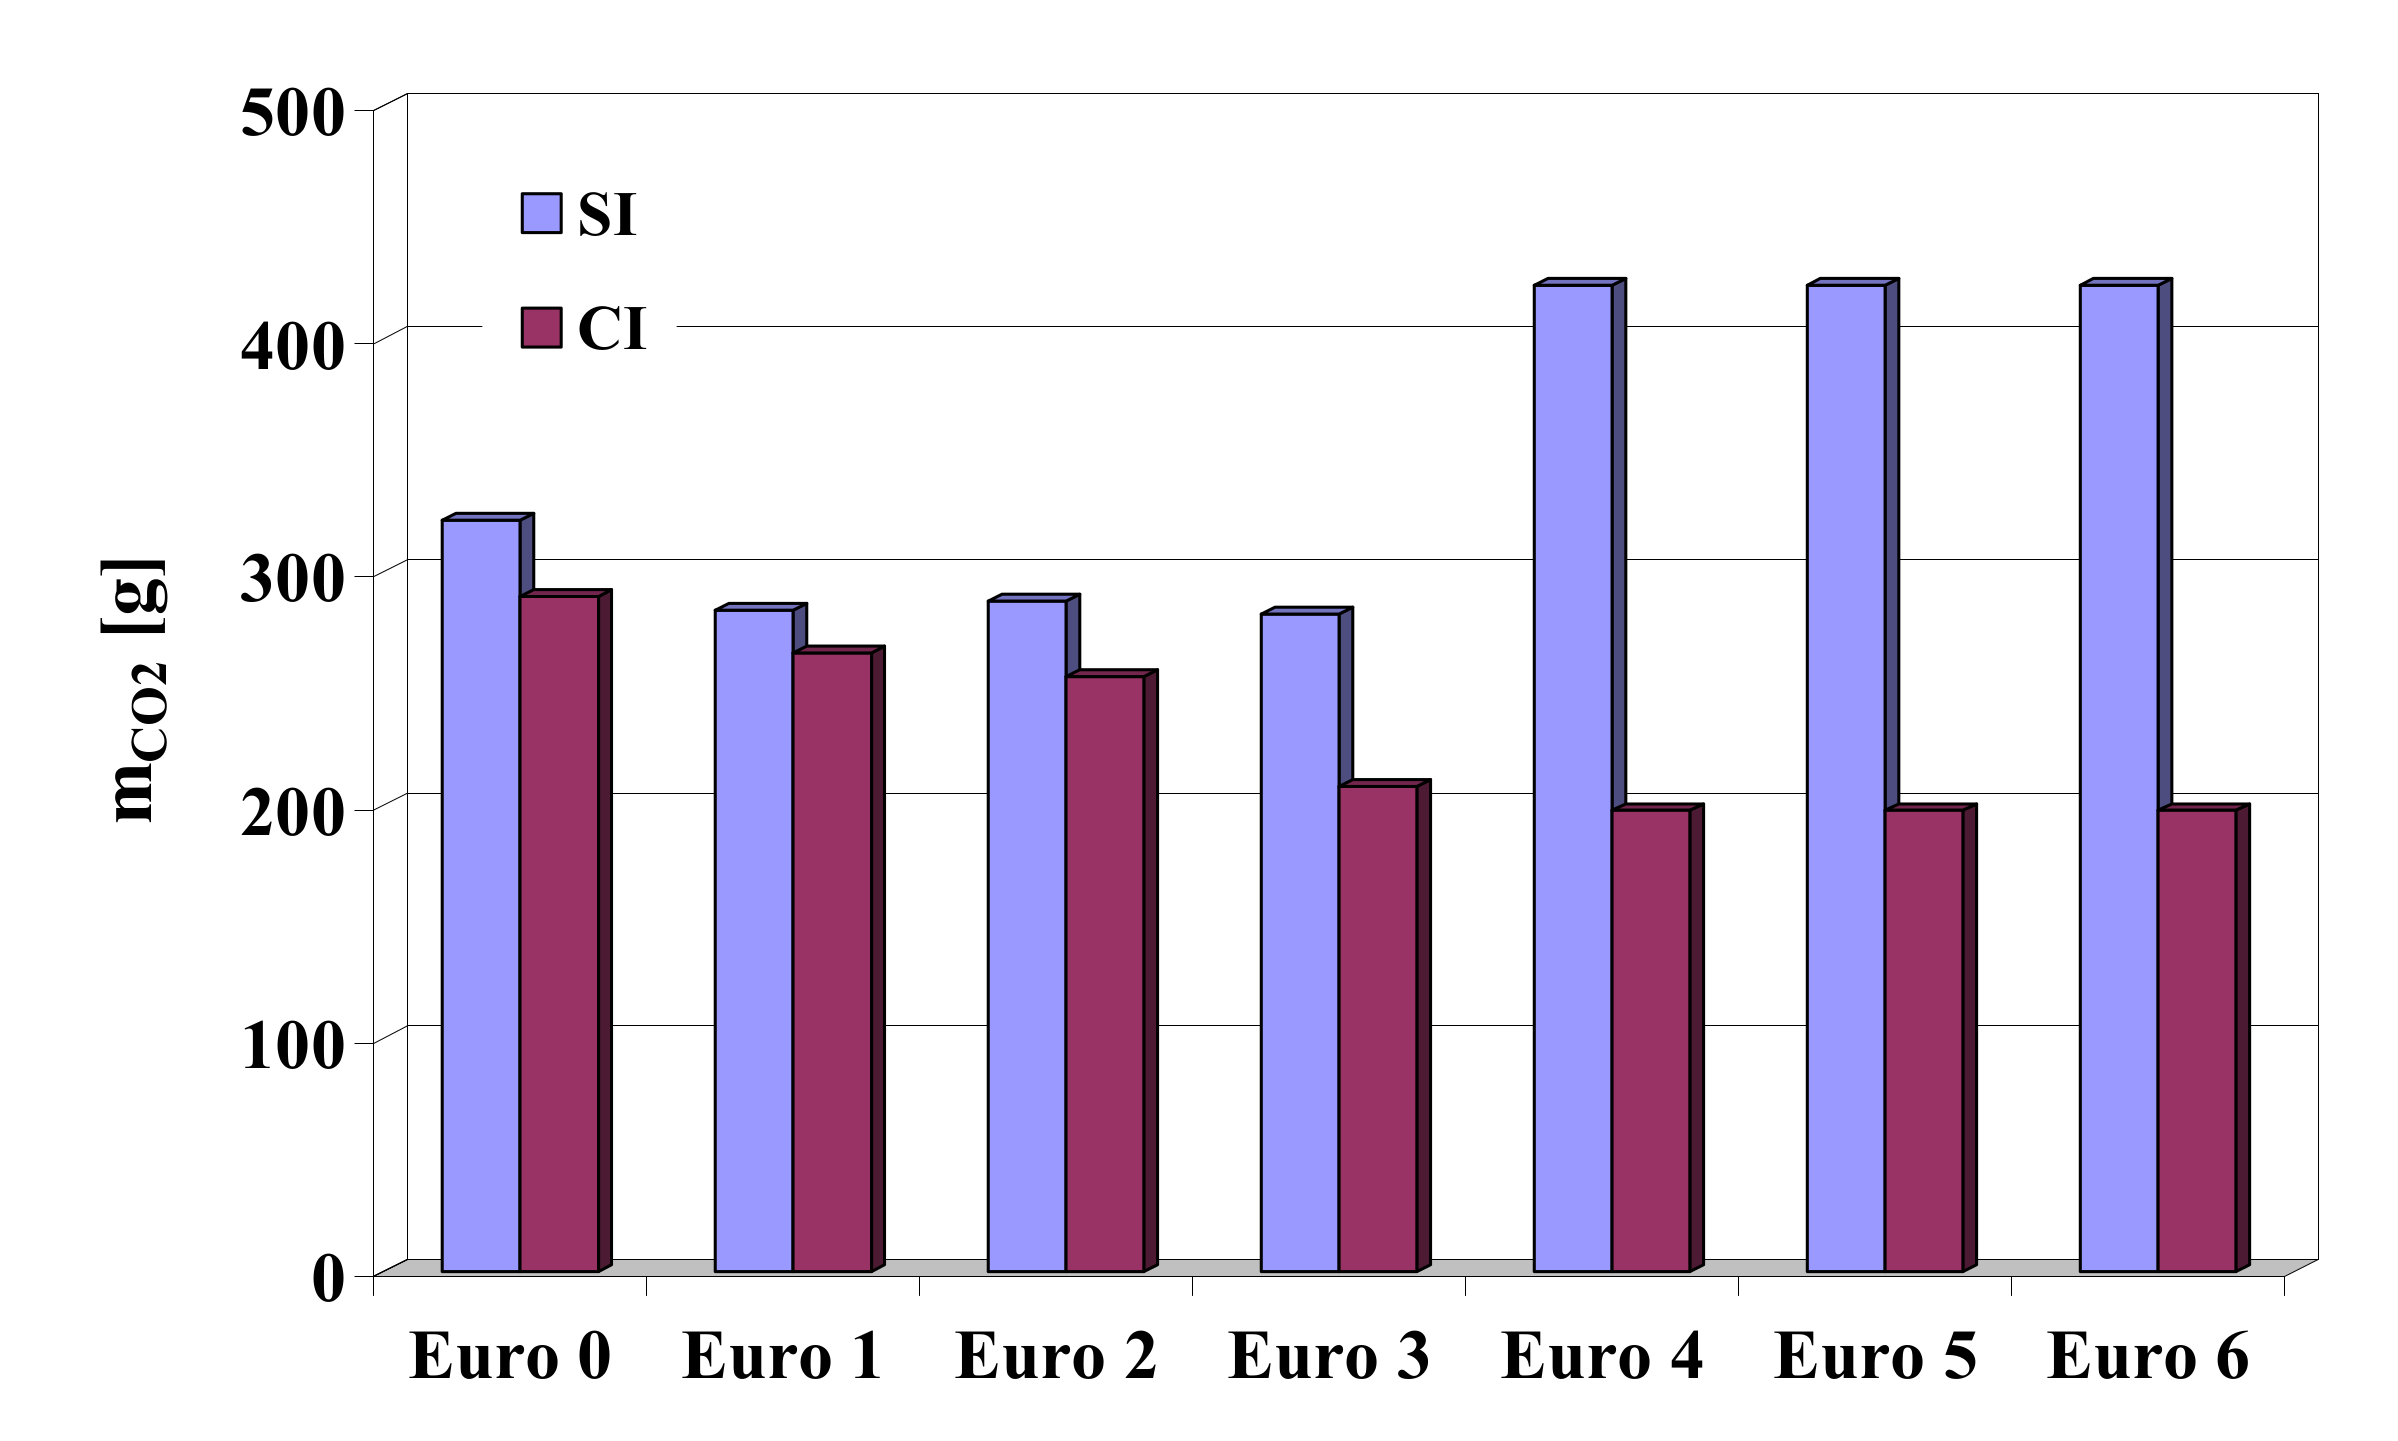
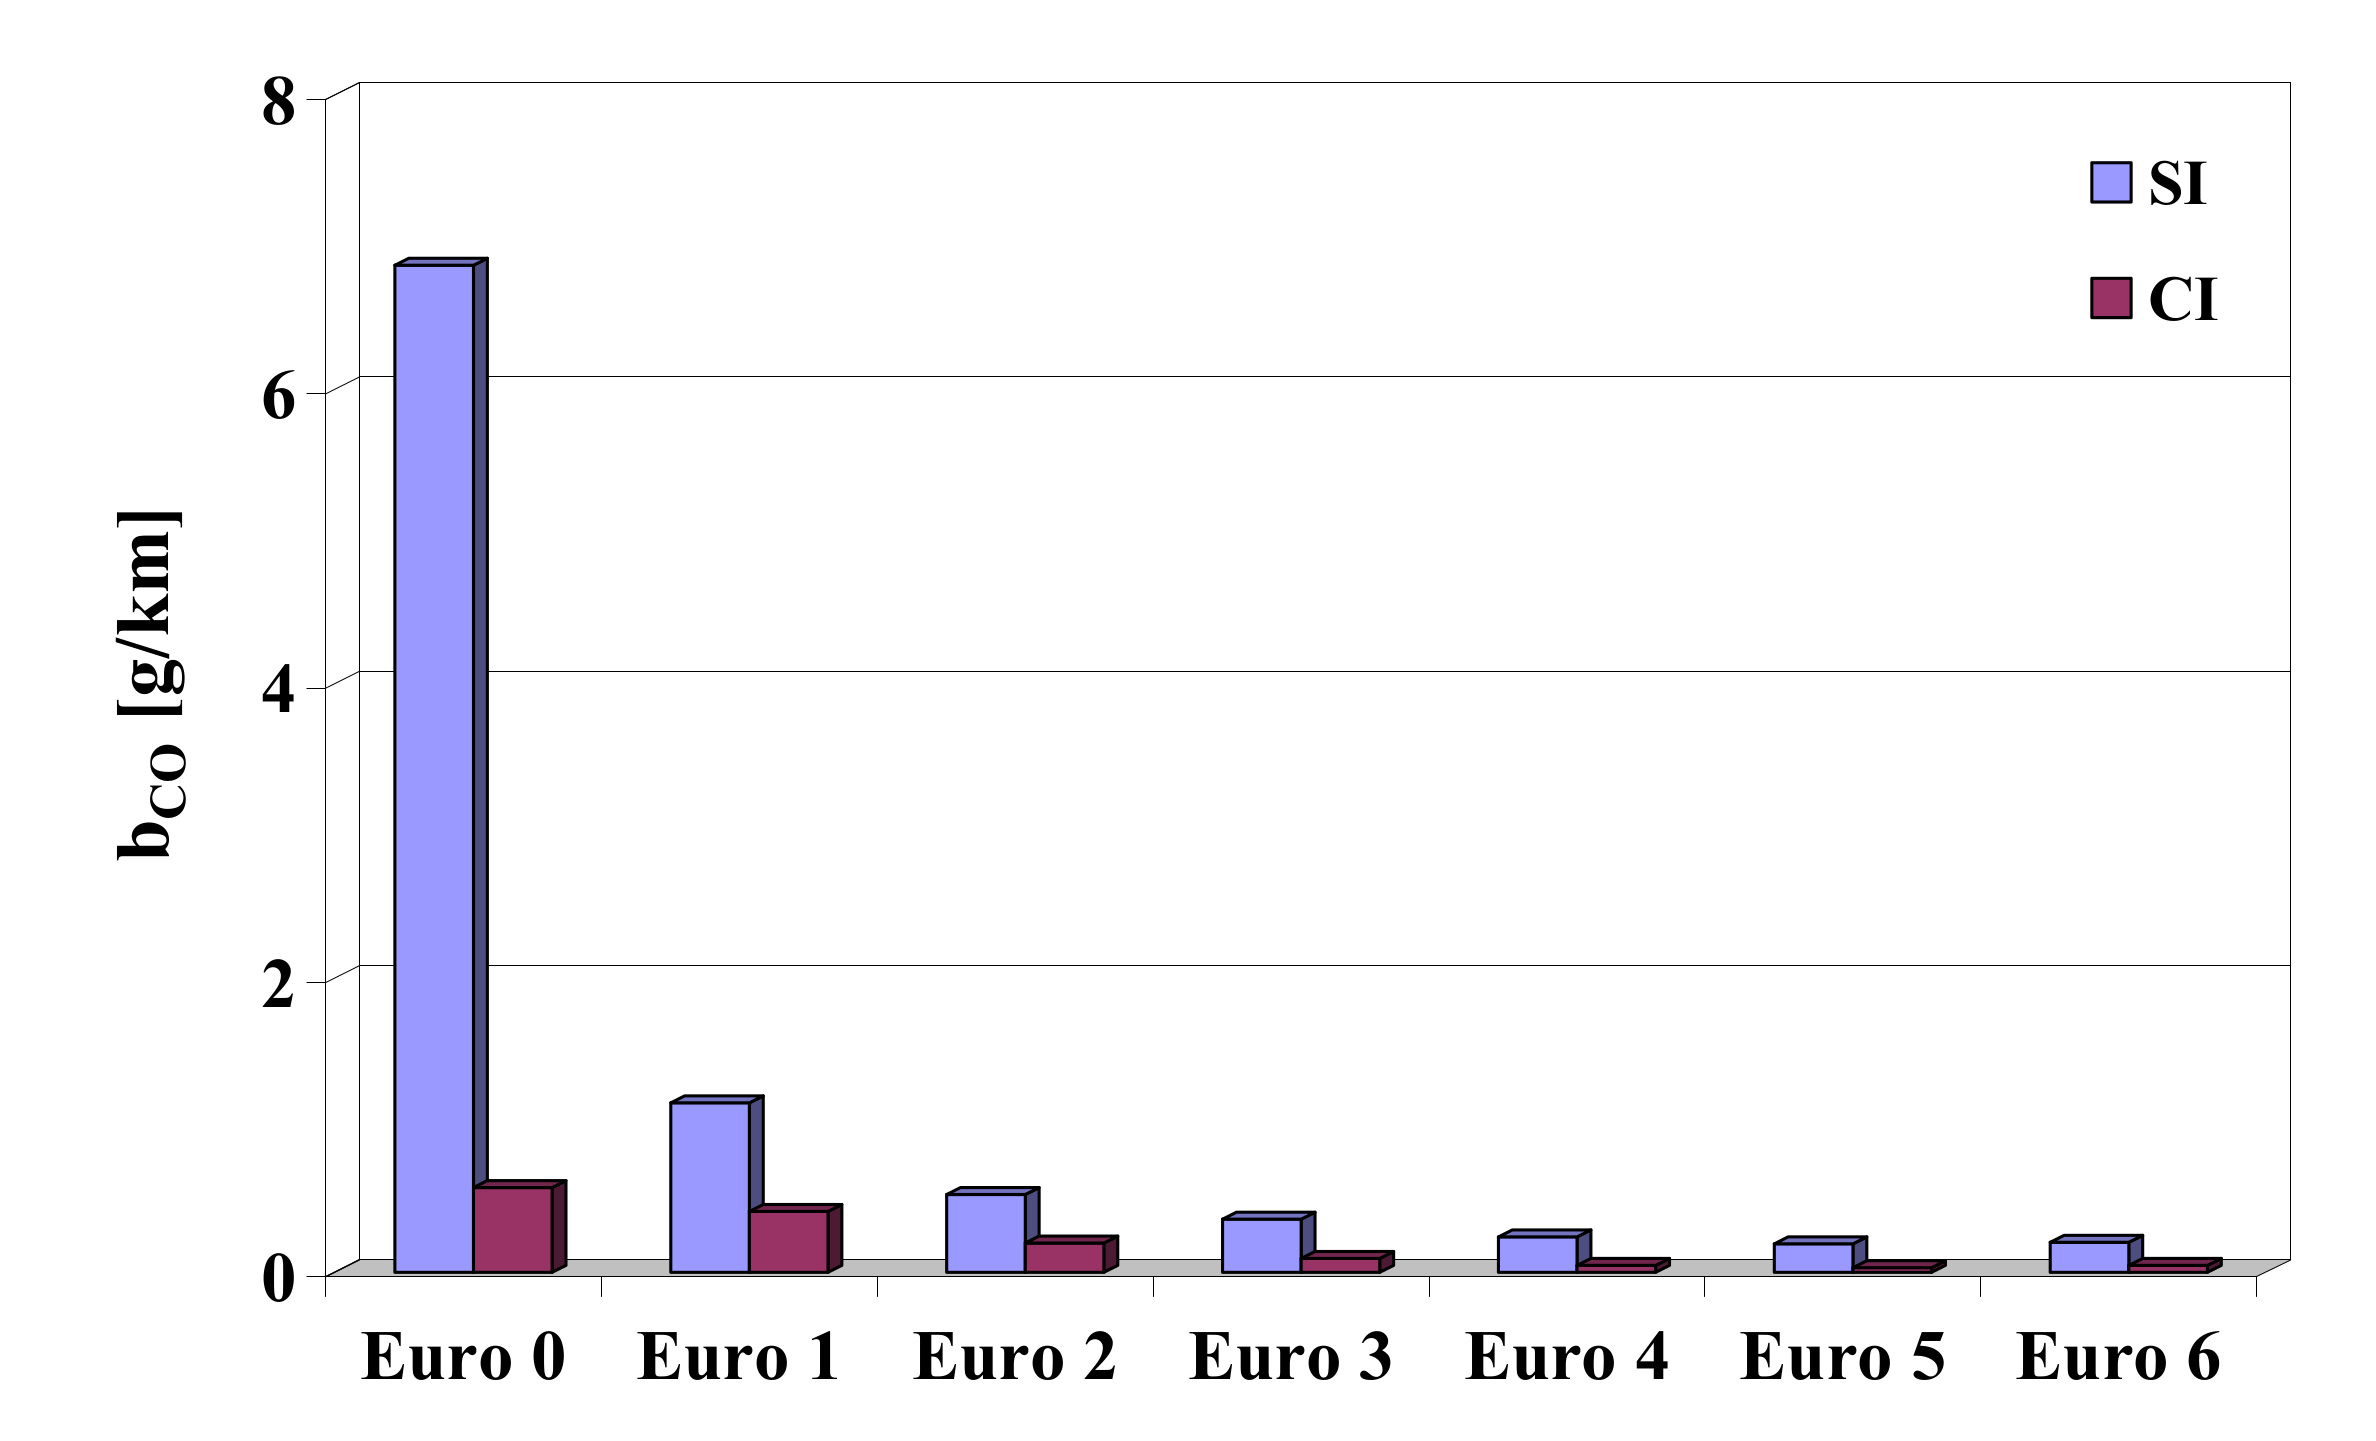
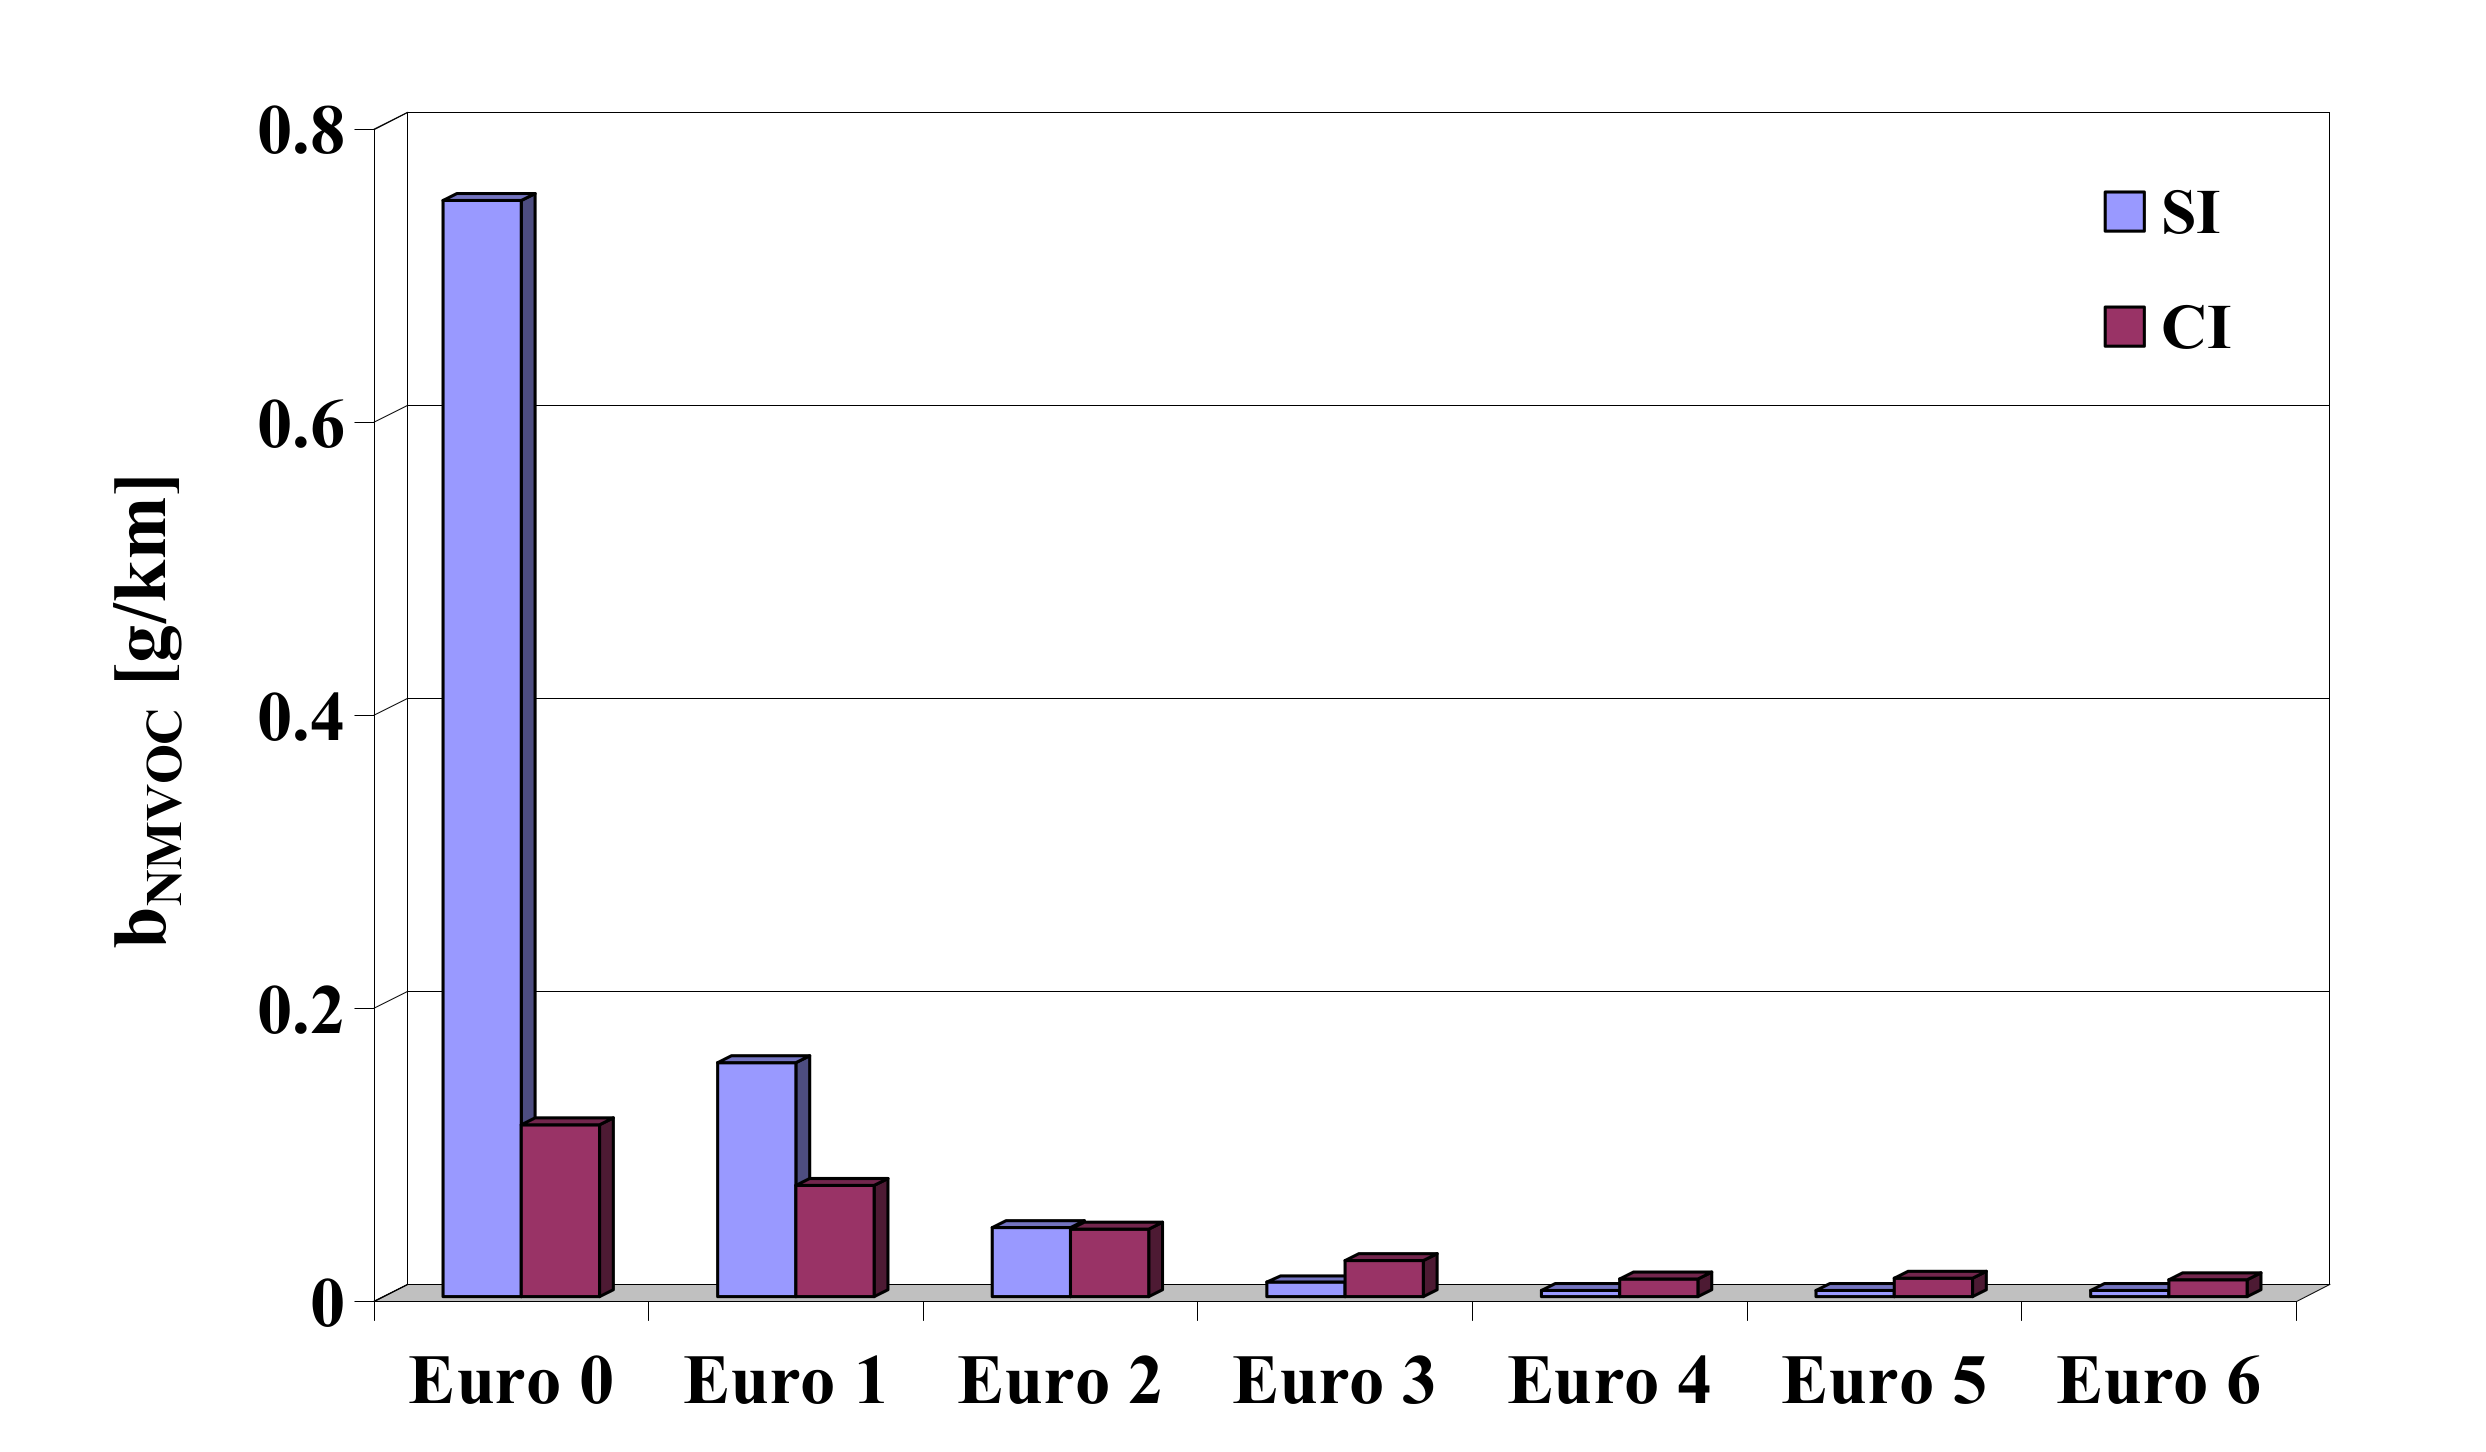
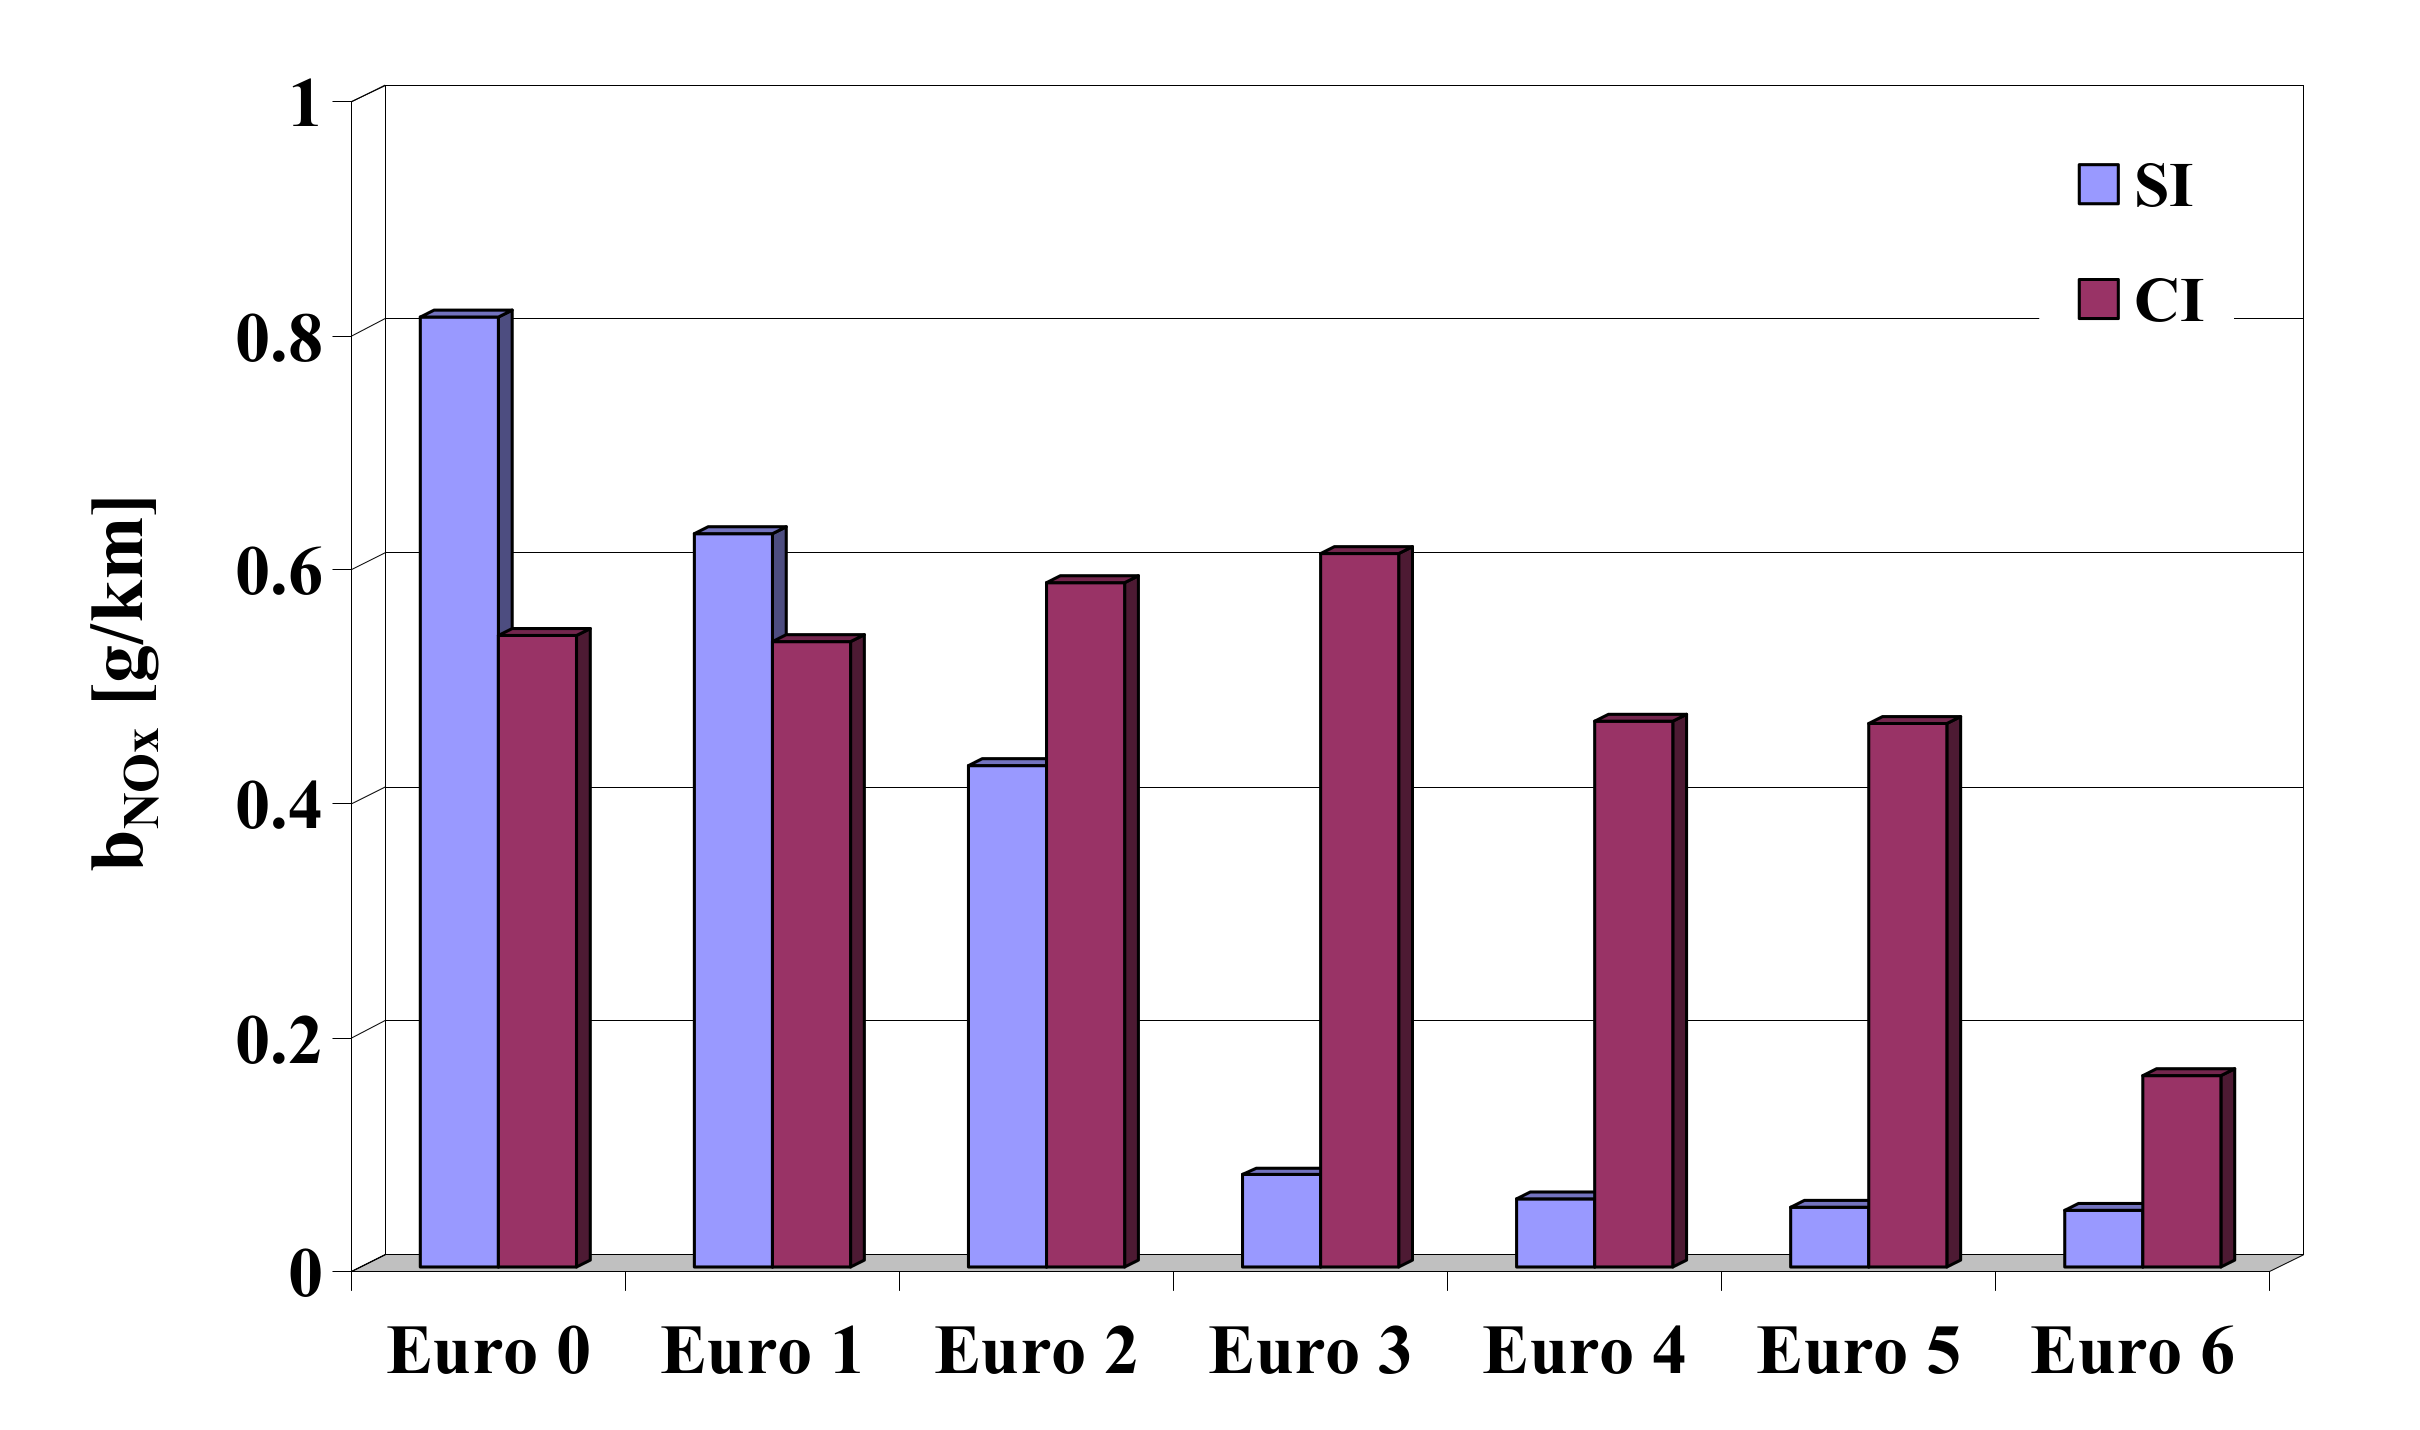
- The additional emission of pollutants from passenger cars’ combustion engines during engine warm-up and vehicle movement under urban conditions (Figure 7, Figure 8, Figure 9, Figure 10 and Figure 11) shows, with some exceptions, a decreasing trend, which results from the technological advancements of the motor industry. This does not apply to the emissions of carbon dioxide (Conclusion 1) and of nitrogen oxides from passenger cars designated to the Euro 1 pollutant emission category and equipped with spark-ignition engines which use multifunctional catalytic converters, which are efficient in reducing pollutants in exhaust gases but sensitive to operating temperatures in terms of reducing nitrogen oxides. The reduction in additional emissions as a result of the warm-up of internal combustion engines shows the strongest trend in the case of compounds with reducing properties in oxygen-containing environments: carbon monoxide and non-methane volatile organic compounds.
- The reduction in the specific distance emission of pollutants from combustion engines of passenger cars designated to the explicit pollutant emission categories is very clear—the strongest for carbon monoxide and non-methane volatile organic compounds (Figure 12, Figure 13, Figure 14, Figure 15 and Figure 16).
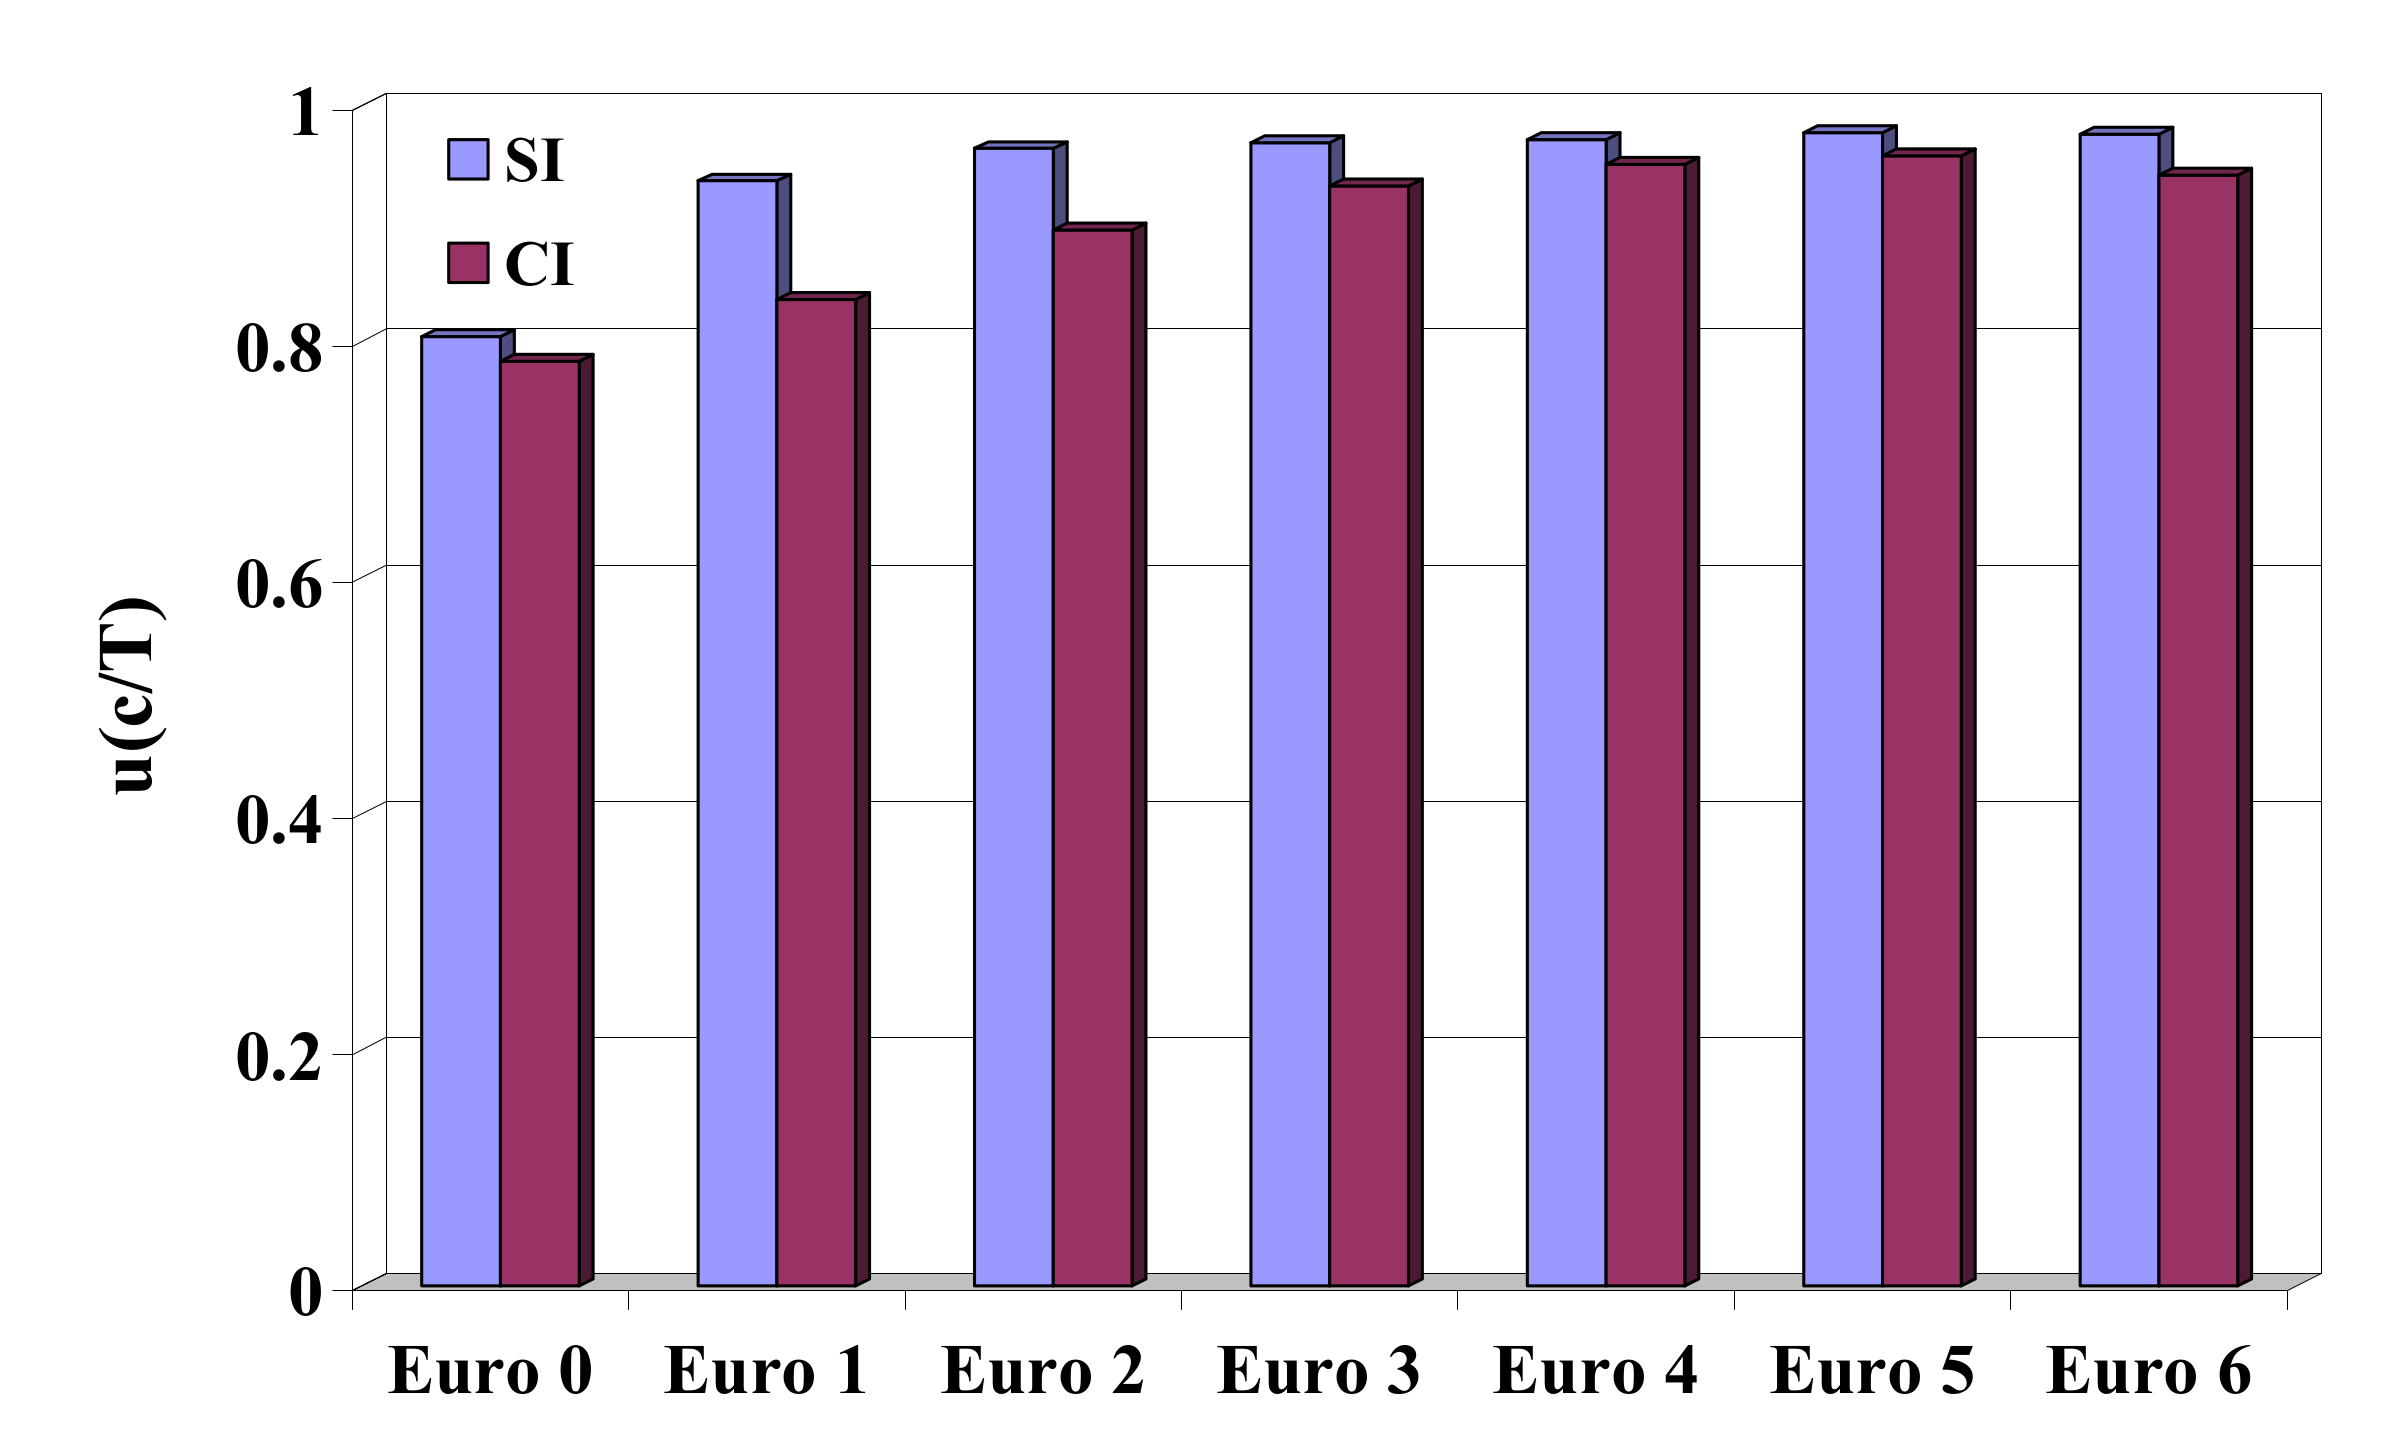
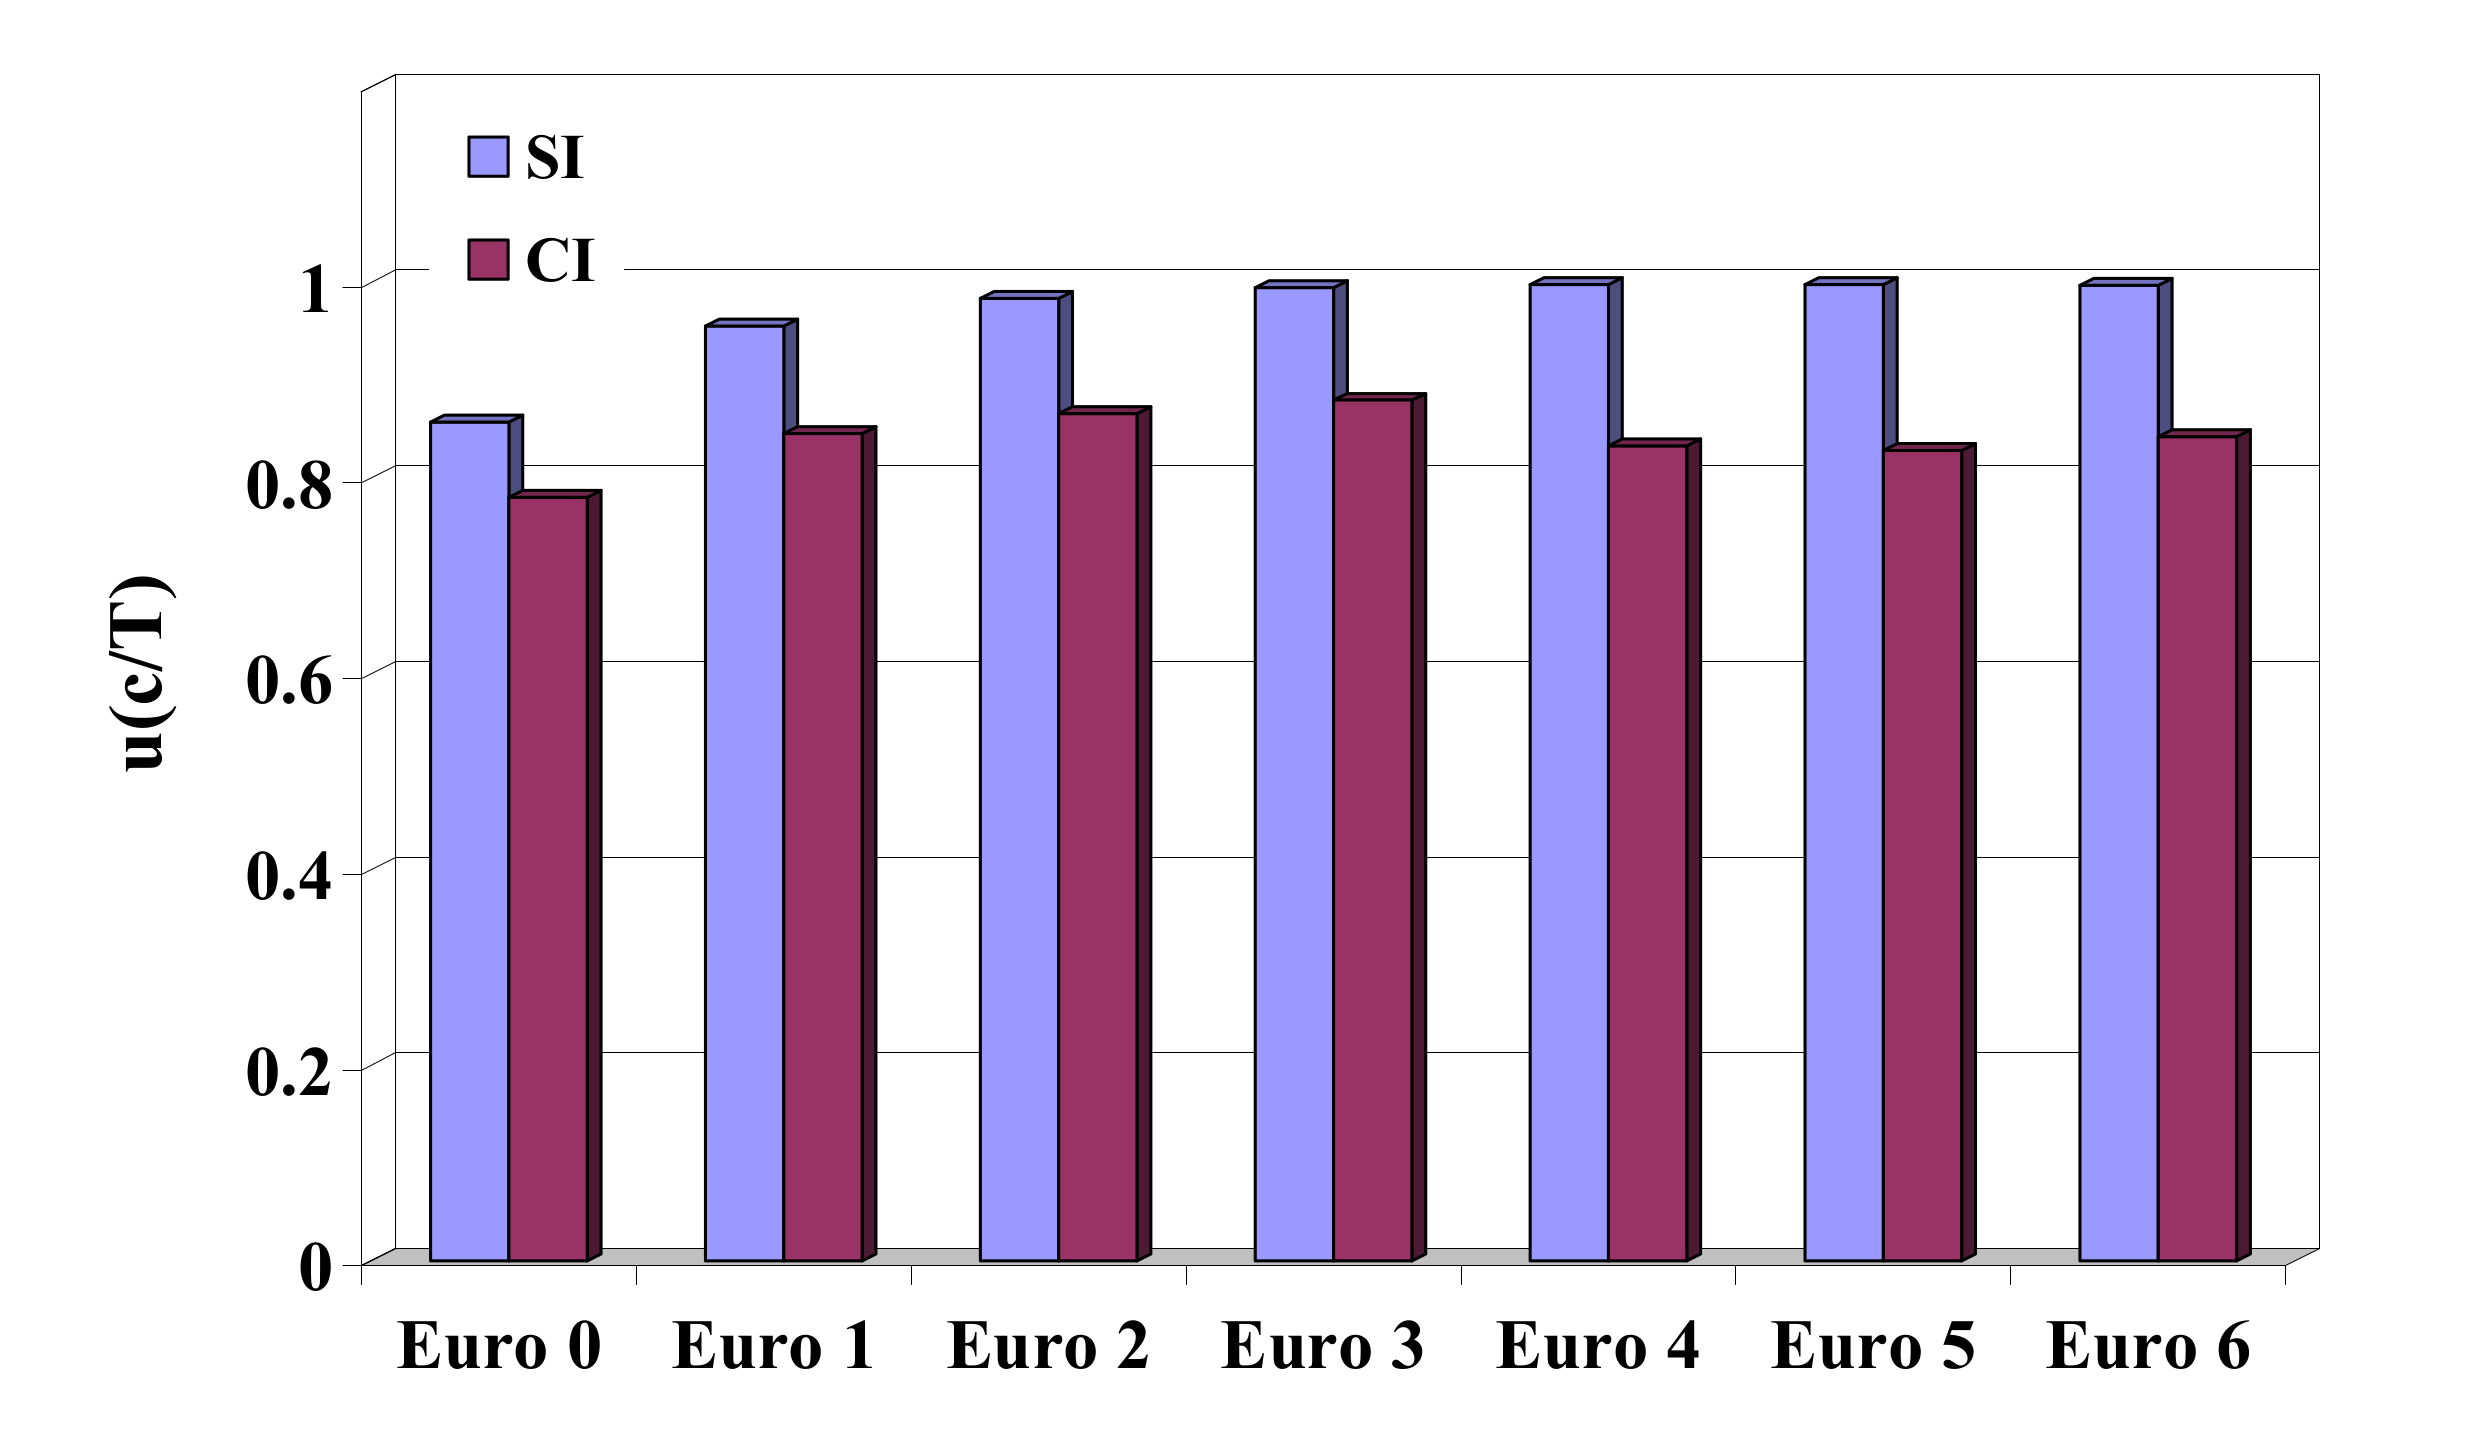
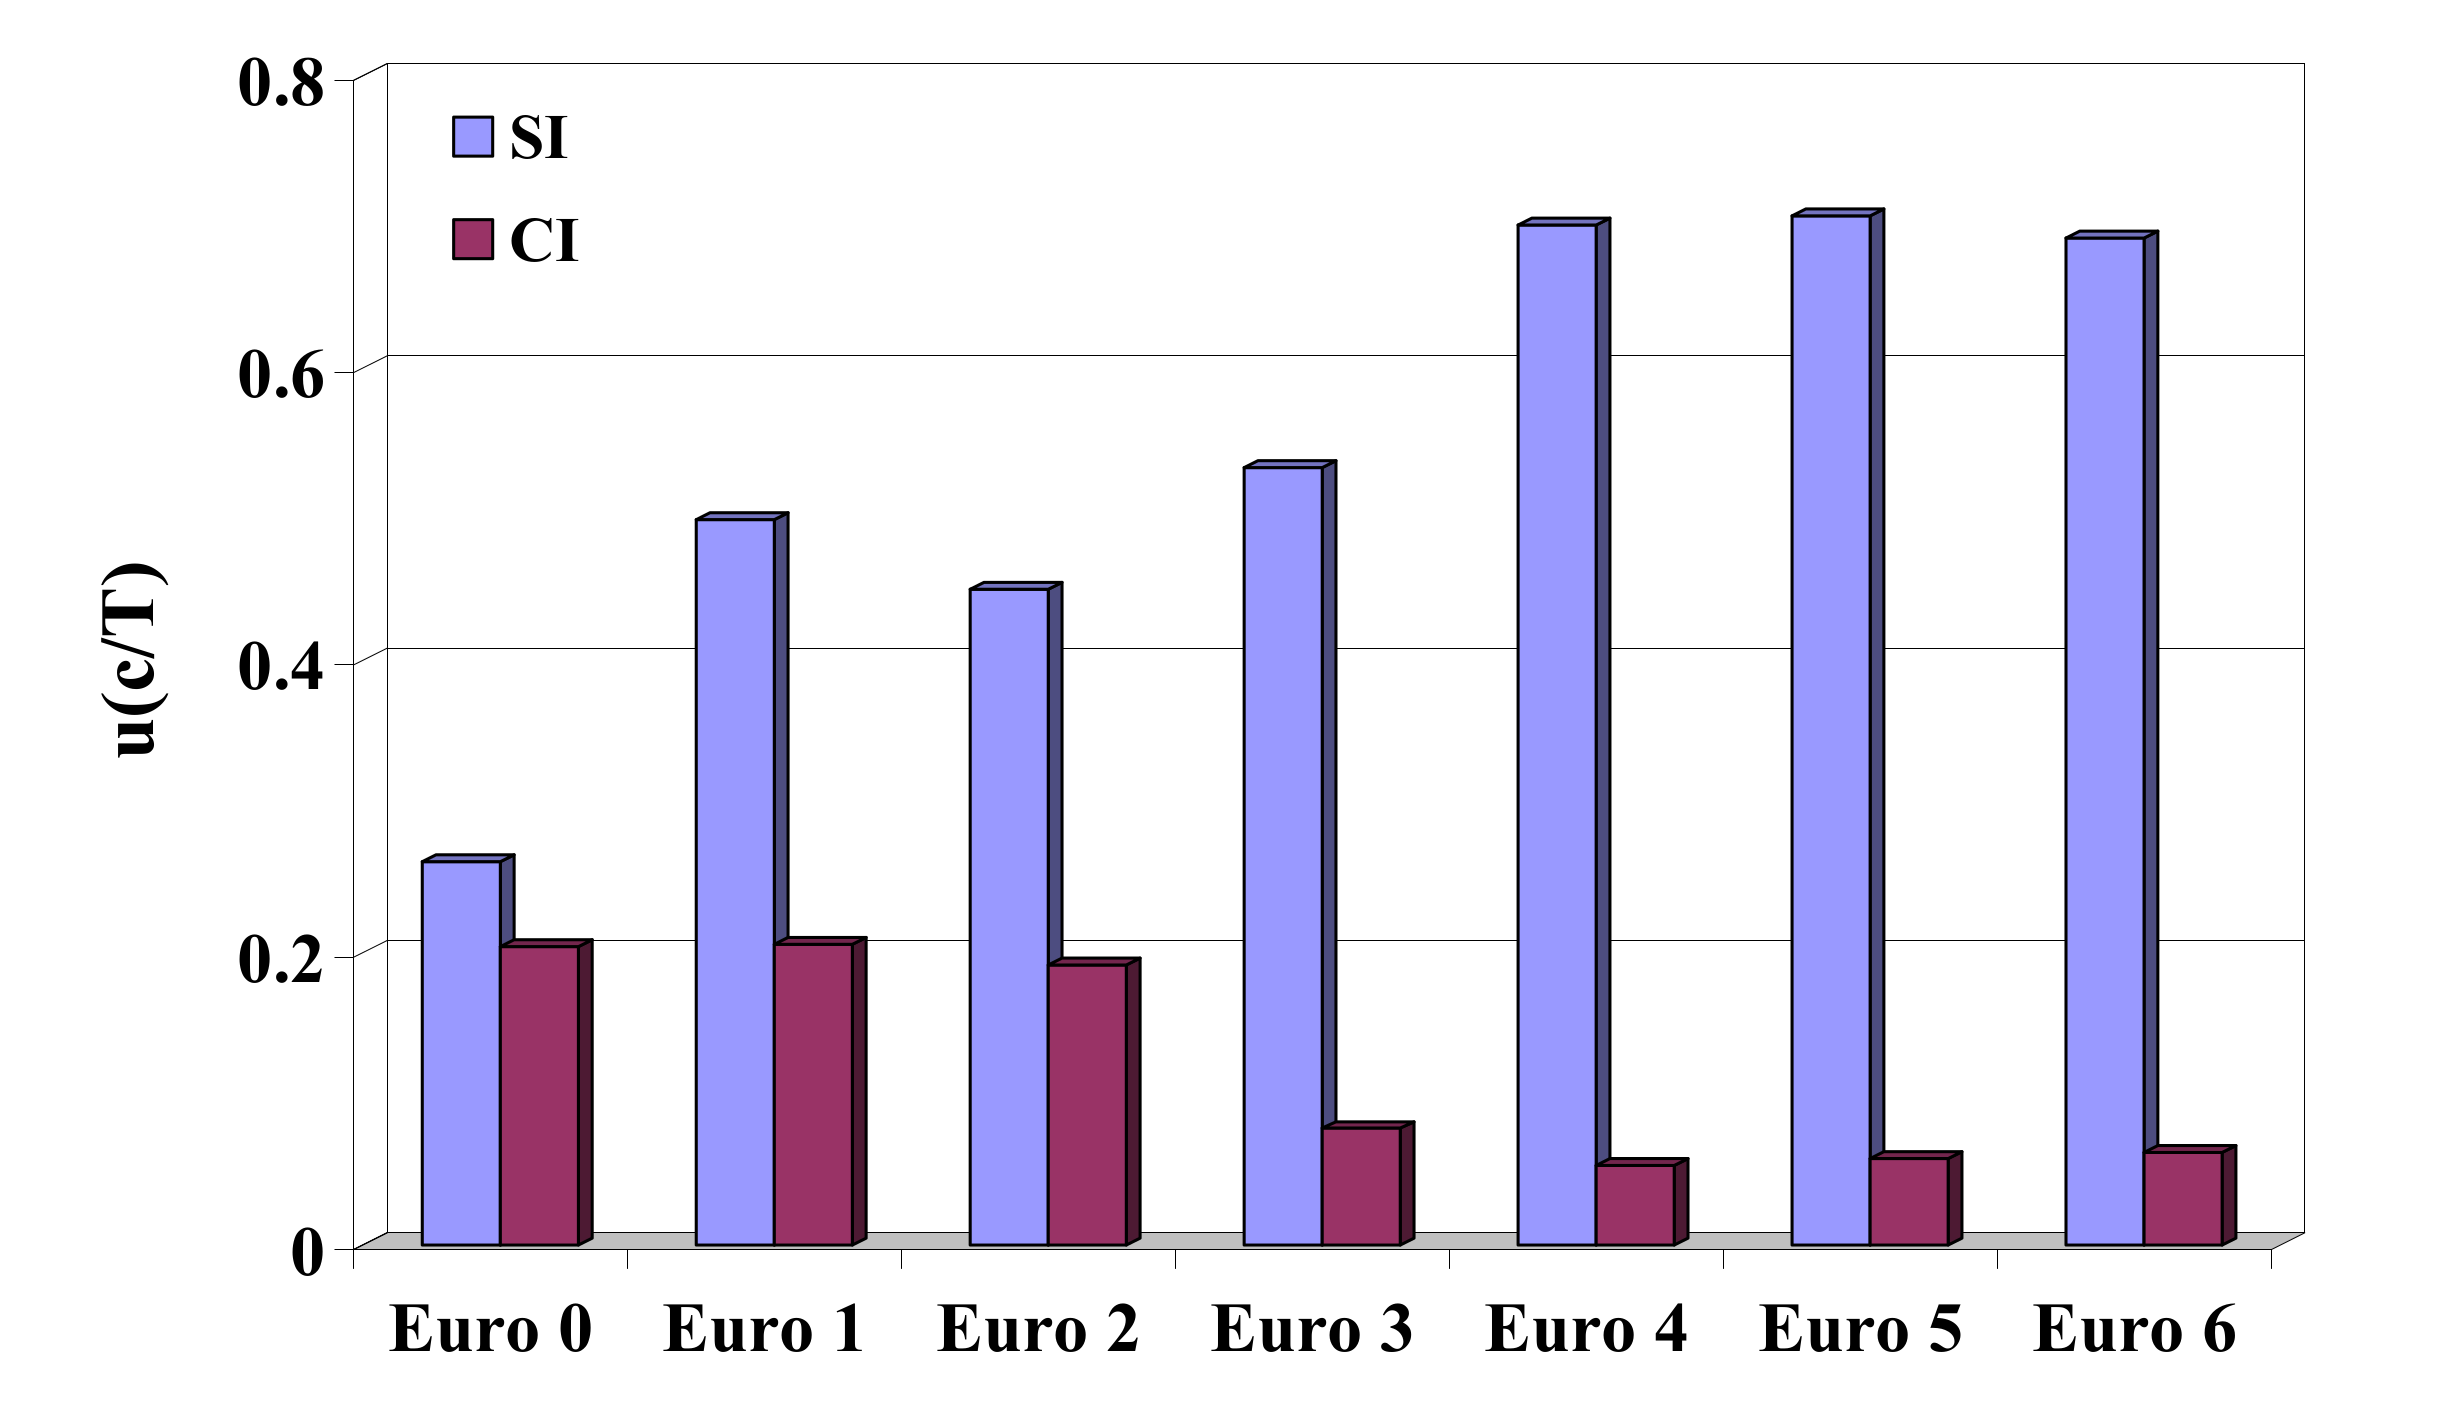
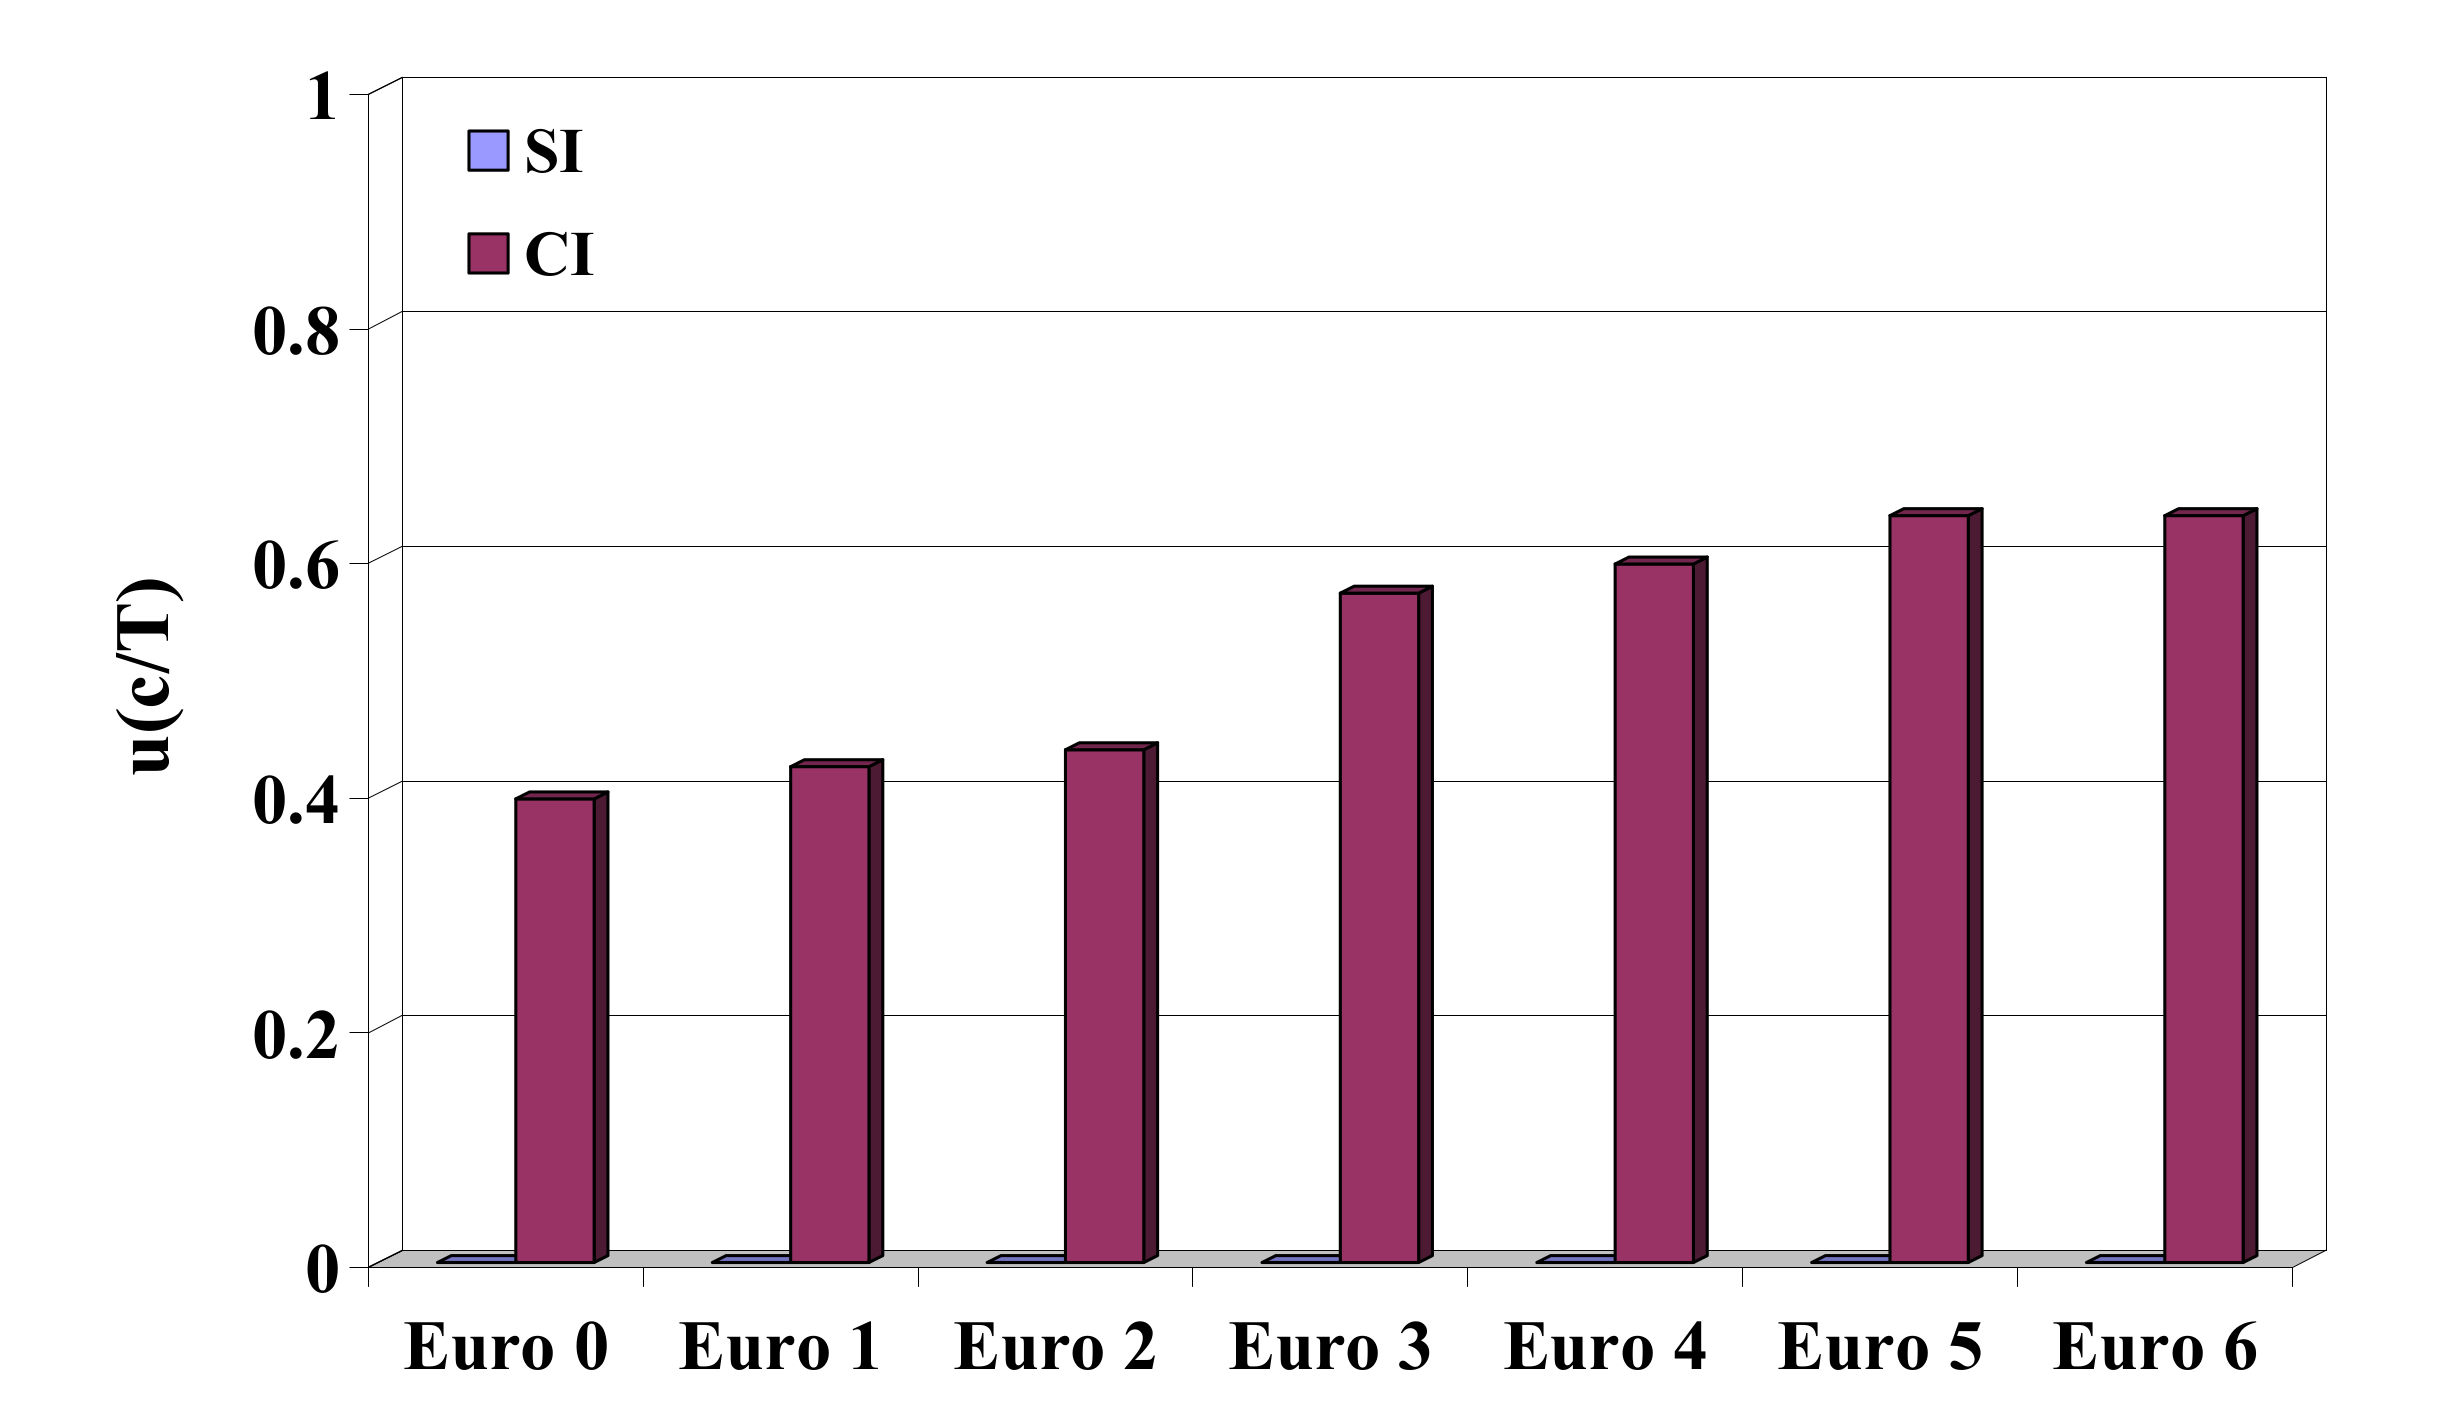
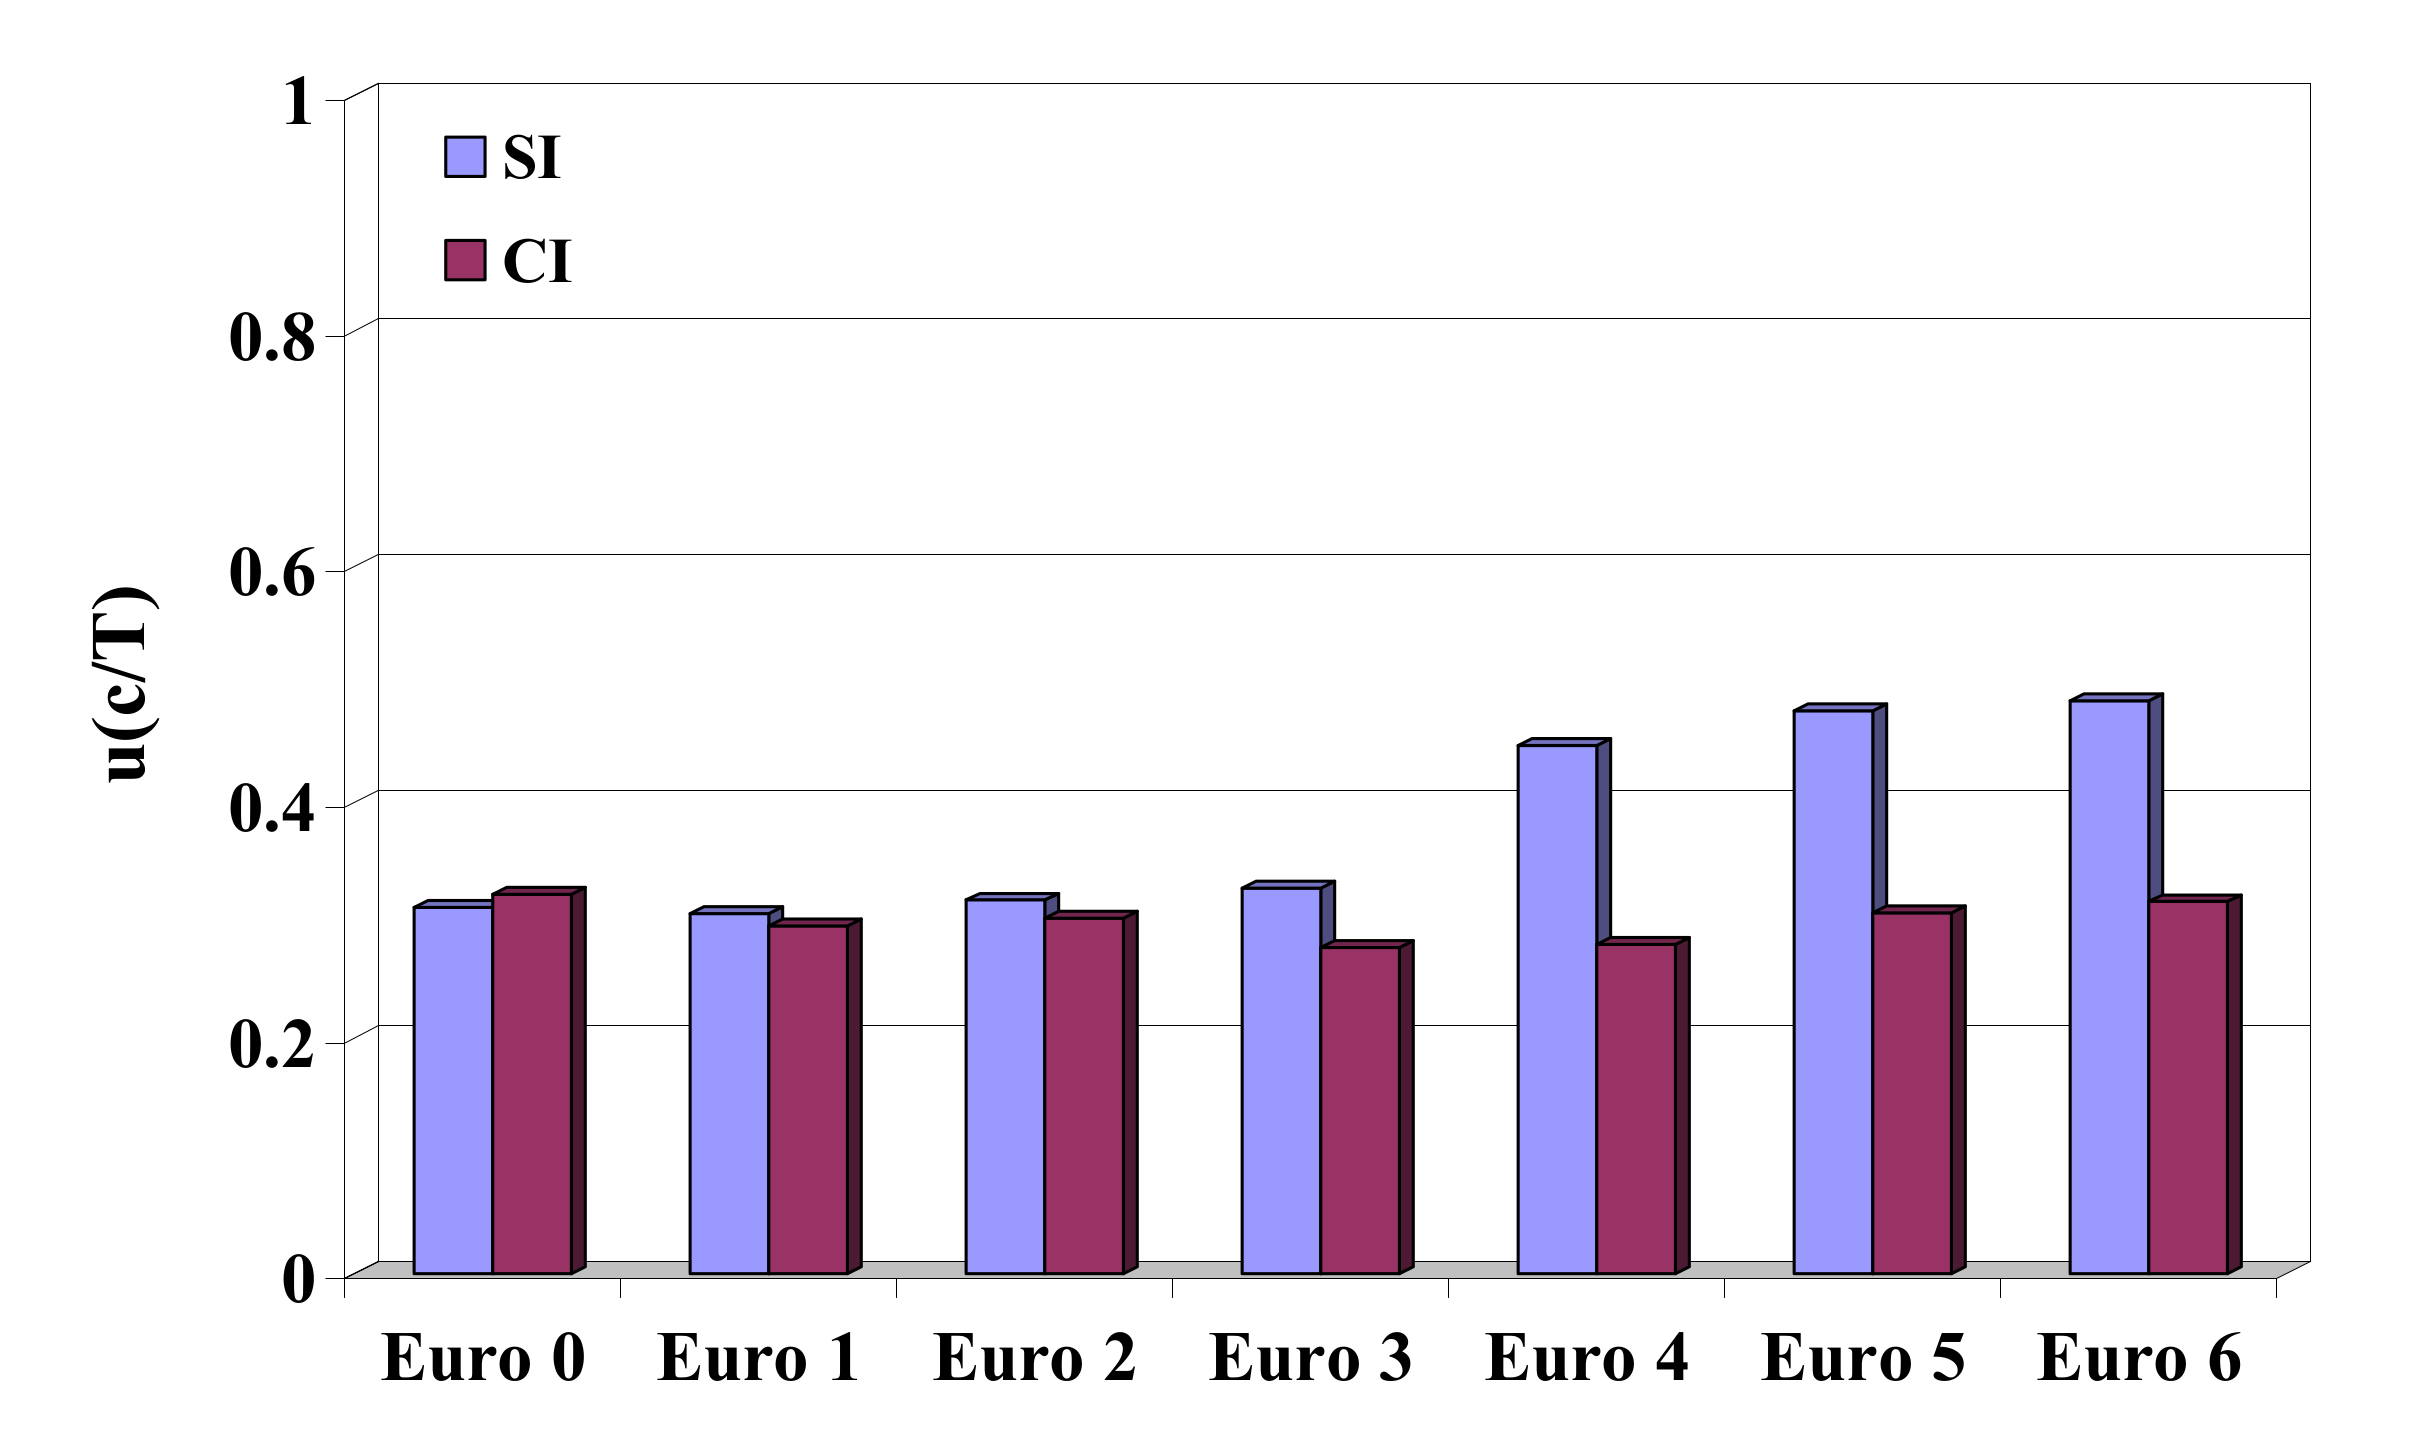
- In total emissions, there was observed a very high share of additional emissions from combustion engines during warm-up under the conditions of passenger car urban driving (Figure 17, Figure 18, Figure 19, Figure 20 and Figure 21), especially for spark-ignition engines: for carbon monoxide and non-methane volatile organic compounds, it was about 90%, and lesser for nitrogen oxides, especially in the case of compression-ignition engines, as well as for particulate matter in the case of compression-ignition engines. The carbon dioxide share constituted about 30%.
Supplementary Materials
Author Contributions
Funding
Institutional Review Board Statement
Informed Consent Statement
Data Availability Statement
Conflicts of Interest
References
- Smit, R.; Ntziachristos, L. Cold Start Emission Modelling for the Australian Petrol Fleet. Air Quality and Climate Change. August 2013; Volume 47, No. 3. Available online: https://www.researchgate.net/publication/285832041 (accessed on 1 August 2021).
- Worldwide Emission Standards and Related Regulations. Passenger Cars/Light and Medium Duty Vehicles. 2019. Available online: https://www.continental-automotive.com/getattachment/8f2dedad-b510-4672-a005-3156f77d1f85/EMISSIONBOOKLET_2019.pdf (accessed on 2 August 2021).
- 1990–2016 Air Pollutant Emission Inventory Report; Environment and Climate Change Canada: Gatineau, QC, Canada, 2018. Available online: https://www.canada.ca/content/dam/eccc/images/apei/apei-2018-en.pdf (accessed on 9 August 2021).
- United States Environmental Protection Agency. Air Emissions Inventories. 2017. Available online: https://www.epa.gov/air-emissions-inventories/2017-national-emissions-inventory-nei-data (accessed on 10 August 2021).
- Bebkiewicz, K.; Chłopek, Z.; Lasocki, J.; Szczepański, K.; Zimakowska-Laskowska, M. Analysis of emission of greenhouse gases from road transport in Poland between 1990 and 2017. Atmosphere 2020, 11, 387. [Google Scholar] [CrossRef] [Green Version]
- European Union Emission Inventory Report 1990–2017 under the UNECE Convention on Long-Range Transboundary Air Pollution (LRTAP); EEA Report No 08/2019; Publications Office of the European Union: Copenhagen, Denmark, 2019. Available online: https://www.eea.europa.eu/publications/european-union-emissionsinventory-report-2017 (accessed on 11 August 2021).
- Poland’s Informative Inventory Report 2017. Submission under the UN ECE Convention on Long-Range Transboundary Air Pollution and the Directive (EU) 2016/2284; Institute of Environmental Protection—National Research Institute, National Centre for Emission Management (KOBiZE): Warszawa, Poland, 2019. [Google Scholar]
- Poland’s National Inventory Report 2019. Greenhouse Gas Inventory for 1988-2017. Submission under the UN Framework Convention on Climate Change and Its Kyoto Protocol; Institute of Environmental Protection—National Research Institute, National Centre for Emission Management (KOBiZE): Warszawa, Poland, 2019. [Google Scholar]
- Chłopek, Z. Badania Symulacyjne Emisji Związków Organicznych z Samochodowych Silników Spalinowych w Fazie Nagrzewania się Silnika po Rozruchu; Zeszyt Nr 6; PAN Oddział w Lublinie; Komisja Motoryzacji i Energetyki Rolnictwa, Eksploatacja Silników Spalinowych: Szczecin, Poland, 2002. [Google Scholar]
- Chłopek, Z. Modelowanie Procesów Emisji Spalin w Warunkach Eksploatacji Trakcyjnej Silników Spalinowych; Prace Naukowe, Seria “Mechanika” z. 173; Oficyna Wydawnicza Politechniki Warszawskiej: Warszawa, Poland, 1999. [Google Scholar]
- Yusuf, A.A.; Inambaoa, F.L. Effect of cold start emissions from gasoline-fueled engines of light-duty vehicles at low and high ambient temperatures: Recent trends. Case Stud. Therm. Eng. 2019, 14, 100417. [Google Scholar] [CrossRef]
- Andrych-Zalewska, M.; Chłopek, Z.; Merkisz, J.; Pielecha, J. Exhaust emission from a vehicle engine operating in dynamic states and conditions corresponding to real driving. Combust. Engines 2019, 178, 99–105. [Google Scholar] [CrossRef]
- Schriftenreihe Umwelt Nr. 255. Luft. Luftschadstoff-Emissionen des Strassenverkehrs 1950–2020. Nachtrag; Bundesamt für Umwelt, Wald und Landschaft (BUWAL): Bern, Switzerland, 2000; Available online: http://iacweb.ethz.ch/staff//krieger/pdf/Buwal_schrift255.pdf (accessed on 11 August 2021).
- Chiatti, G.; Chiavola, O.; Recco, E.; Palmieri, F. Soot particles experimental characterization during cold start of a micro car engine. Energy Procedia 2016, 101, 662–669. [Google Scholar] [CrossRef]
- EMEP/EEA Air Pollutant Emission Inventory Guidebook; Publications Office of the European Union: Luxembourg, 2019; Available online: https://www.eea.europa.eu/publications/emep-eea-guidebook-2019 (accessed on 8 August 2021).
- Ibrahim, T.M.; Syahir, A.Z.; Zulkifli, N.W.M.; Masjuki, H.H.; Osman, A. Enhancing vehicle’s engine warm up using integrated mechanical approach. In Proceedings of the IOP Conference Series: Materials Science and Engineering, International Technical Postgraduate Conference, Kuala Lumpur, Malaysia, 5–6 April 2017; Volume 210. [Google Scholar] [CrossRef]
- INFRAS AG. Handbook Emission Factors for Road Transport 3.2. Quick Reference; Version 3.2.; INFRAS AG: Bern, Switzerland, 2014. [Google Scholar]
- Li, Q.; Shayler, P.J.; McGhee, M.; La Rocca, A. The initiation and development of combustion under cold idling conditions using a glow plug in diesel engines. Int. J. Engine Res. 2017, 18, 240–255. [Google Scholar] [CrossRef] [Green Version]
- Luján, J.M.; Climent, H.; Ruiz, S.; Moratal, A. Influence of ambient temperature on diesel engine raw pollutants and fuel consumption in different driving cycles. Int. J. Engine Res. 2019, 20, 877–888. [Google Scholar] [CrossRef]
- Ramadhas, A.; Xu, H. Improving Cold Start and Transient Performance of Automotive Diesel Engine at Low Ambient Temperatures; SAE Technical Paper 2016-01-0826; SAE: Warrendale, PA, USA, 2016. [Google Scholar] [CrossRef] [Green Version]
- Ramadhas, A.S.; Xu, H.; Liu, D.; Tian, J. Reducing cold start emissions from automotive diesel engine at cold ambient temperatures. Aerosol Air Qual. Res. 2016, 16, 3330–3337. [Google Scholar] [CrossRef] [Green Version]
- Zobel, T.; Schürch Ch Boulouchos, K.; Onder, C. Reduction of cold-start emissions for a micro combined heat and power plant. Energies 2020, 13, 1862. [Google Scholar] [CrossRef] [Green Version]
- Merkisz, J.; Pielecha, J. Nanoparticle Emissions from Combustion Engines; Springer Tracts on Transportation and Traffic—STTT 8; Springer: New York, NY, USA, 2015; Volume 8. [Google Scholar]
- COPERT 5—Manual. Available online: https://copert.emisia.com/manual/ (accessed on 1 December 2019).
- Eggleston, S.; Buendia, L.; Miwa, K.; Ngara, T.; Tanabe, K. (Eds.) IPCC 2006, 2006 IPCC Guidelines for National Greenhouse Gas Inventories, Prepared by the National Greenhouse Gas Inventories Programme. 2006. Available online: https://www.ipcc-nggip.iges.or.jp/public/2006gl/ (accessed on 6 August 2021).
- Chłopek, Z.; Olecka, A.; Szczepański, K.; Bebkiewicz, K. Share of road transport in greenhouse gas emissions in Poland in 1988-2015. Environ. Prot. Nat. Resour.—Ochr. Sr. I Zasobów Nat. 2018, 77, 13–20. [Google Scholar] [CrossRef]
- Bebkiewicz, K.; Chłopek, Z.; Lasocki, J.; Szczepański, K.; Zimakowska-Laskowska, M. The inventory of pollutants hazardous to the health of living organisms, emitted by road transport in Poland between 1990 and 2017. Sustainability 2020, 12, 5387. [Google Scholar] [CrossRef]
- Worldwide Emissions Standards Heavy Duty and Off-Highway Vehicles. 2016/17. Available online: https://www.delphi.com/sites/default/files/inline-files/2016-2017-heavy-duty-amp-off-highway-vehicles_0.pdf (accessed on 6 August 2021).
- Wang, T.; Zhang, Y.; Peng, Z.; Shu, G. A review of researches on thermal exhaust heat recovery with Rankine cycle. Renew. Sustain. Energy Rev. 2011, 15, 2862–2871. [Google Scholar] [CrossRef]
- Sivakumar, S.; Shingyouchi, H.; Yan, X.; Okajima, T.; Yamaguchi, K.; Kusaka, J.; Nagata, M. Effects of Using an Electrically Heated Catalyst on the State of Charge of the Battery Pack for Series Hybrid Electric Vehicles at Cold Start; SAE Technical Paper 2020-01-0444; WCX SAE World Congress Experience: Detroit, MI, USA, 2020. [Google Scholar] [CrossRef]
- Sınaǧ, A.; Kruse, A.; Rathert, J. Influence of the Heating Rate and the Type of Catalyst on the Formation of Key Intermediates and on the Generation of Gases during Hydropyrolysis of Glucose in Supercritical Water in a Batch Reactor. Ind. Eng. Chem. Res. 2004, 43, 502–508. [Google Scholar] [CrossRef]
- Bhaskar, K.; Sassykova, L.R.; Prabhahar, M.; Percis, E.S.; Nalini, A.; Jenish, T.; Jayarajan, J.; Jayabalakrishnan, D.; Sendilvelan, S.; Krishnamoorthi, S. Resistance Heated Catalytic Converter (RHCC) with copper oxide catalyst for reducing HC/CO emission from automobile. Mater. Today Proc. 2021, 45, 5868–5872. [Google Scholar] [CrossRef]


Publisher’s Note: MDPI stays neutral with regard to jurisdictional claims in published maps and institutional affiliations. |
© 2021 by the authors. Licensee MDPI, Basel, Switzerland. This article is an open access article distributed under the terms and conditions of the Creative Commons Attribution (CC BY) license (https://creativecommons.org/licenses/by/4.0/).
Share and Cite
Bebkiewicz, K.; Chłopek, Z.; Sar, H.; Szczepański, K.; Zimakowska-Laskowska, M. Influence of the Thermal State of Vehicle Combustion Engines on the Results of the National Inventory of Pollutant Emissions. Appl. Sci. 2021, 11, 9084. https://doi.org/10.3390/app11199084
Bebkiewicz K, Chłopek Z, Sar H, Szczepański K, Zimakowska-Laskowska M. Influence of the Thermal State of Vehicle Combustion Engines on the Results of the National Inventory of Pollutant Emissions. Applied Sciences. 2021; 11(19):9084. https://doi.org/10.3390/app11199084
Chicago/Turabian StyleBebkiewicz, Katarzyna, Zdzisław Chłopek, Hubert Sar, Krystian Szczepański, and Magdalena Zimakowska-Laskowska. 2021. "Influence of the Thermal State of Vehicle Combustion Engines on the Results of the National Inventory of Pollutant Emissions" Applied Sciences 11, no. 19: 9084. https://doi.org/10.3390/app11199084