
Evolutionary Methods in House Floor Plan Design


Institute of Applied Computers Science, Jagiellonian University, 30-348 Kraków, Poland
*
Author to whom correspondence should be addressed.
Appl. Sci. 2021, 11(17), 8229; https://doi.org/10.3390/app11178229
Submission received: 6 July 2021
/
Revised: 18 August 2021
/
Accepted: 2 September 2021
/
Published: 5 September 2021
(This article belongs to the Special Issue Intelligent Computing in Architecture, Engineering and Construction)
Abstract
:In this paper, an evolutionary technique is proposed as a method for generating new design solutions for the floor layout problem. The genotypes are represented by the vectors of numerical values of points representing endpoints of room walls. Equivalents of genetic operators for such a representation are proposed. A case study of the design problem of one-story houses is presented from the initial requirements to the best solutions. An evaluation method using requirement-weighted fitness function for evolved plans is also proposed. The obtained results as well as the advantages and issues related to such an approach are also discussed.
1. Introduction
Architectural designs of buildings are contemporarily created with the use of specialized CAD tools (like ArchiCAD by Graphisoft, Allplan by ALLPLAN, or Revit by Autodesk). However, most of these tools are not very efficient in the conceptual stage of design, in which the understanding of design requirements is often associated with visualization of early conceptual solutions. As design problems are usually open-ended and ill-defined, this design phase should be supported by a computer system which facilitates decision making based on the initial visualization of users’ requirements and provides the design knowledge required for reasoning concerning design solutions.
Over the past 50 years, a great deal of research has been conducted in the field of computer-aided architectural design with the main goal of automatically generating floor plans, which would be treated by designers as preliminary layouts to be further modified and adapted by them [1,2,3]. In most existing approaches, the graph-based representation of floor layouts is used [2,4,5]. In [6], an evolutionary technique based on a graph representation of genotypes was proposed as a method for generating new design solutions. In all these cases, floor plans are generated for given adjacency graphs, which is computationally demanding. Obtaining visualizations of such graphs requires specifying a geometric interpretation, which assigns geometric primitives to graph nodes, and then arranging them in a way that preserves the graph adjacency relations. Moreover, the proper arrangement of rooms may not exist, or the generation can result in layouts which may not be architecturally and aesthetically meaningful. Modifying the obtained floor plans according to the needs of the users and maintaining specific architectural requirements requires modification of the adjacency relations in the corresponding graphs.
Another well-known approach to automate the generation of floor plans is based on shape grammars [7,8,9,10,11,12]. In [13], an agent system combined with shape grammars was used to support floor layout designs. However, shape grammar interpreters are difficult to implement, as matching parametric shapes is still a challenging problem [14,15]. Moreover, this approach does not give much possibility for designer interaction, thus losing the human-centered perspective of the design. Thus, there is still a gap between the proposed research and its practical aspects.
In recent years, many approaches to the automation of floor plan design based on artificial intelligence and machine learning methods have been developed. In [16], stochastic optimization and a supervised learning algorithm based on Bayesian networks for generating residential building layouts is presented. In [17], another data-driven technique for constructing residential layouts is described, while in [18], a graph neural network generating floor plans is presented. In [19], an evolutionary strategy which generates a feasible layout solution, which incorporates complex requirements, is described, but the implementation of the proposed approach is not presented. The construction of floor plans using simulated annealing is discussed in [20], while in [21], reinforcement learning based on a heuristic search technique called Monte Carlo tree search was used to generate a feasible dimensionless rectangular floor plan corresponding to an adjacency graph given by the user. A generative expert system for the design of building layouts is proposed in [22].
Most of the above-mentioned methods are restricted to a single layout generated for the specified constraints, are limited to rooms with rectangular boundaries or are not suitable for complex layouts design, as their time complexity is very high due to the stochastic nature of the algorithms used. In methods where graphs describing layouts are represented within deep networks, the networks first map the graphs into feature vectors, which are then transformed into floor plans. Moreover, a large amount of data is needed to attain better accuracy.
Therefore, in this paper, an evolutionary technique is proposed as an efficient method for generating a variety of topologically distinct design solutions for the given floor layout problem. As the genotypes corresponding to the solutions are represented by the node-based structure, where nodes represent the meeting points of the room walls, the visualization of the obtained floor plans is straightforward. Such a representation is efficient, and the computational cost of the operations performed for it is low. This allows for representing not only rectangular spaces but any rectilinear rooms as well. It also implements the actual dimensions of the designed floor layout. Moreover, in our approach, the specified design constraints and requirements are taken into account by the fitness function, and by using optimization techniques, the proposed framework generates floor plans together with an assessment that determines the degree of their compliance with the design task specifications.
The problem of generating new designs can be seen in computer science as a search problem [23]. There are many different approaches to search problems, with one of them being the evolutionary technique. It is generally based on natural evolution, where instead of working with one solution at a time, a larger subset of the search space, known as a population, is considered. In the design context, this translates to evaluating, testing and refining many designs (instead of just one) at the same time. Moreover, it can be observed that as an evolutionary search consists of evaluating and refining possible solutions, it can be seen as analogous to a human design iterative process of analysis, testing and optimization [24]. Like in the refinement step in human design, which is based on earlier knowledge, analysis and testing, the evolutionary search designs to be modified are determined according to their evaluation (so-called fitness). The fitter the design, the more chances it has to contribute to the newly generated and refined designs [25,26].
No formal definition of an evolutionary algorithm exists, but there is an agreement that some standard elements such as a population of solutions, a method of encoding them, genetic operators that can generate new elements, an evaluation method, a method of selecting elements to be transformed and a stop condition for the whole process must be defined [23,24,25,26]. There has also been a lot of research in different types of evolutionary algorithms. The domain, collectively called evolutionary computation, includes such approaches as genetic algorithms (GAs), introduced in [26], evolutionary strategies (ESs), evolutionary programming (EP) and genetic programming (GP).
In this paper, evolutionary programming is proposed as a method for the quick generation of many possible (but still valid) floor layouts as early solutions of the given design task. This allows for visual exploration of the designer’s preliminary ideas, which is necessary in the conceptual phase of design. In evolutionary programming, the crossover operation is not used, while the mutation mechanism is constructed in such a way that radical changes are very unlikely and weak changes are preferred. In the evaluation module, the domain knowledge is required to decide which generated potential solutions are to be kept in future evolution cycles. In this manner, a gradual improvement in the overall quality of the proposed solutions is obtained.
In the proposed framework for visual floor plan generation, early design solutions are generated based on the designer’s knowledge, and the design specifications are determined in collaboration with the customer. In these specifications, the required number of rooms, their areas and functions as well as the rules of their arrangement can be determined. Design constraints as well as many requirements (called hard ones) determined in the specifications are to be fully satisfied (e.g., ‘one room must be at least 27 m2’). Some other requirements are soft ones (i.e., they are to be fulfilled to some degree (e.g., ‘the kitchen should be big’)). There are also sharp requirements, the fulfillment of which would be desirable but is not absolutely necessary (e.g., ‘the wardrobe should be next to the main bedroom’) [27]. As most design problems involve several criteria, the weights determining their importance can be defined. Then, the quality of the generated solutions and the degree to which they meet the design specifications can be properly assessed.
In the area of computer-aided design, the problem of how to represent the objects to be designed is of high importance. Over the years, many different approaches have been used to represent objects such as boundary representations, sweep volume representations, surface representations or Constructive Solid Geometry (CSG) [28,29,30]. These methods rely mainly on the geometrical features of an object, such as the size or position of its elements. Other proposed approaches are based on the structural relations within the designed objects, and they include trees and different types of graphs [31]. One of the first graph representations was based on the boundary representation, where a so-called face adjacency graph was used to represent an object consisting of faces [32].
A number of different representations is possible for the floor layout problem. Each of them has both advantages and drawbacks. In this paper, the genotypes of floor plans are represented in the form of numerical vectors consisting of numbers of nodes representing points where the walls of the rooms meet. Such a representation makes the description of evolutionary operators very straightforward and allows for fast computing of all mutation types. The other possible representations, such as the half-edge one, would require much more complex definitions of mutation operators.
Based on the specified design requirements, the initial population of floor plan genotypes is created by the designer. During the process of evolution, the genotype vectors are modified by mutation. After each evolutionary step, a new generation of phenotypes being floor plans corresponding to the obtained population is rendered. The fitness function, which evaluates generated floor plans, takes into account the number of generated spaces and their geometrical properties.
This paper contributes to the field of computer-aided architectural design based on evolutionary algorithms by proposing the new representation of floor plan genotypes, mutation operations adapted to this representation and a fitness function, which is determined by evaluating the designs based on their geometrical properties and the degree of compliance with the specifications determined by the user.
2. Visual Floor Plan Generation (VFPG) Framework
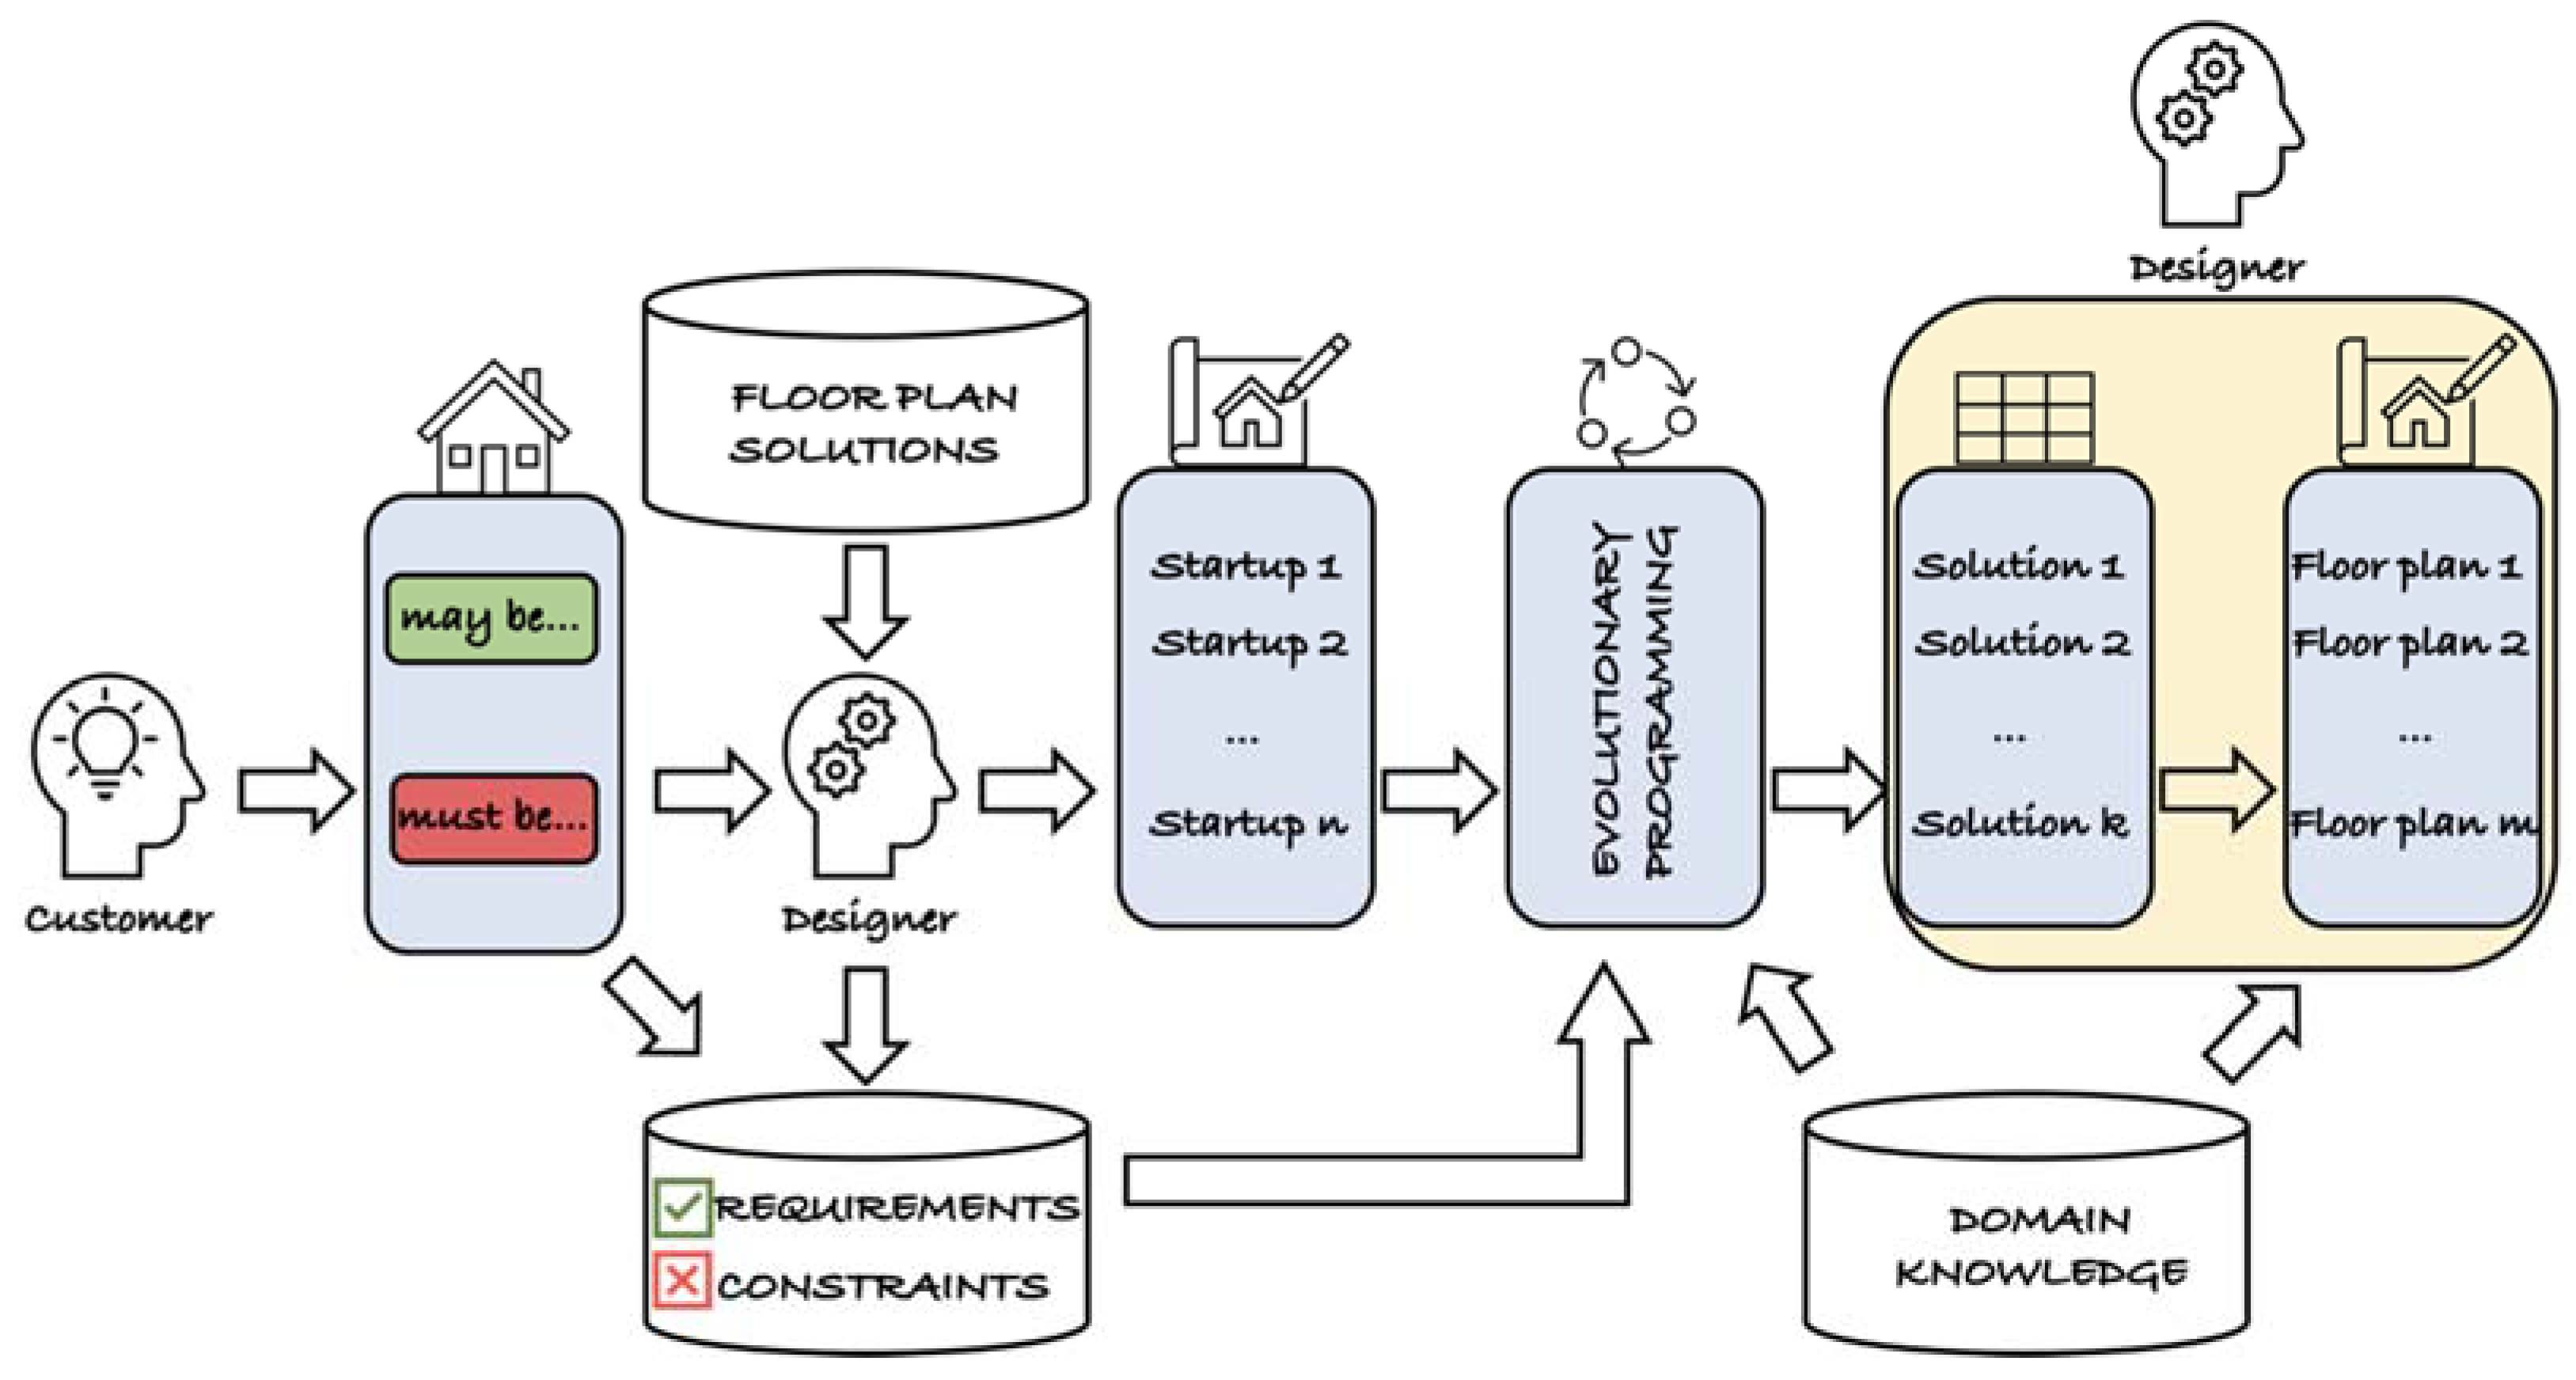
During the conceptual stage of design, many ideas are expressed graphically, and the diagram itself is being explored as an essential stage of the design process and the design thinking [33]. Computer-aided design can significantly speed up the time-consuming decision-making stage by benefitting from the dynamic character of the design context. In the proposed VFPG framework (see Figure 1), for quick, efficient and effective floor layout generation, the designer actively explores and moderates the design context. Together with the customer, he or she determines the may be requirements (and their importance coefficients) and the must be constraints. After that, based on his or her professional experience, he or she selects a set of startup floor plan solutions that constitute the input to the evolutionary programming generation engine. In addition to the requirements and constraints defined by the designer and customer, domain knowledge plays an important role in the generative process. It is used by the designer during the preparation of the initial designs and by the fitness function during the evaluation process. Such domain knowledge may contain both the information derived from the design standards (e.g., from the building code) and any additional information from the design domain. In the case of floor plans, layout design in addition to building code environment laws or the availability of infrastructure-specific information for the area where the building is located should be used.
During the ongoing generation of the possible solutions, the designer sees various layouts and moderates the evolutionary parameters to achieve better results. The evolutionary process stimulates the creativity of the designer, who can explore many potential solutions. Some floor plans generated by the system can be unexpected or innovative, and this enables the designer to experiment with his or her own design ideas.
In the last stage of generation, the function mapping between the obtained geometry and how the space is going to be used is performed by assigning labels determining the functions of the spaces. This final assignment can lead to significantly different functionalities for floor plans with the same geometry. It can be proposed by the software according to given requirements and constraints; however, the designer is free to modify it regardless of the predefined conditions.
Floor layout planning in architectural design starts with in-depth study of the utility zones and the activities that will take place in them. Thus, it is in fact the search process of the best floor plan behavior that adapts to the specific customer’s environmental conditions. Such a defined design task is ideally suited to be solved by the means of computational intelligence methods like evolutionary programming (EP).
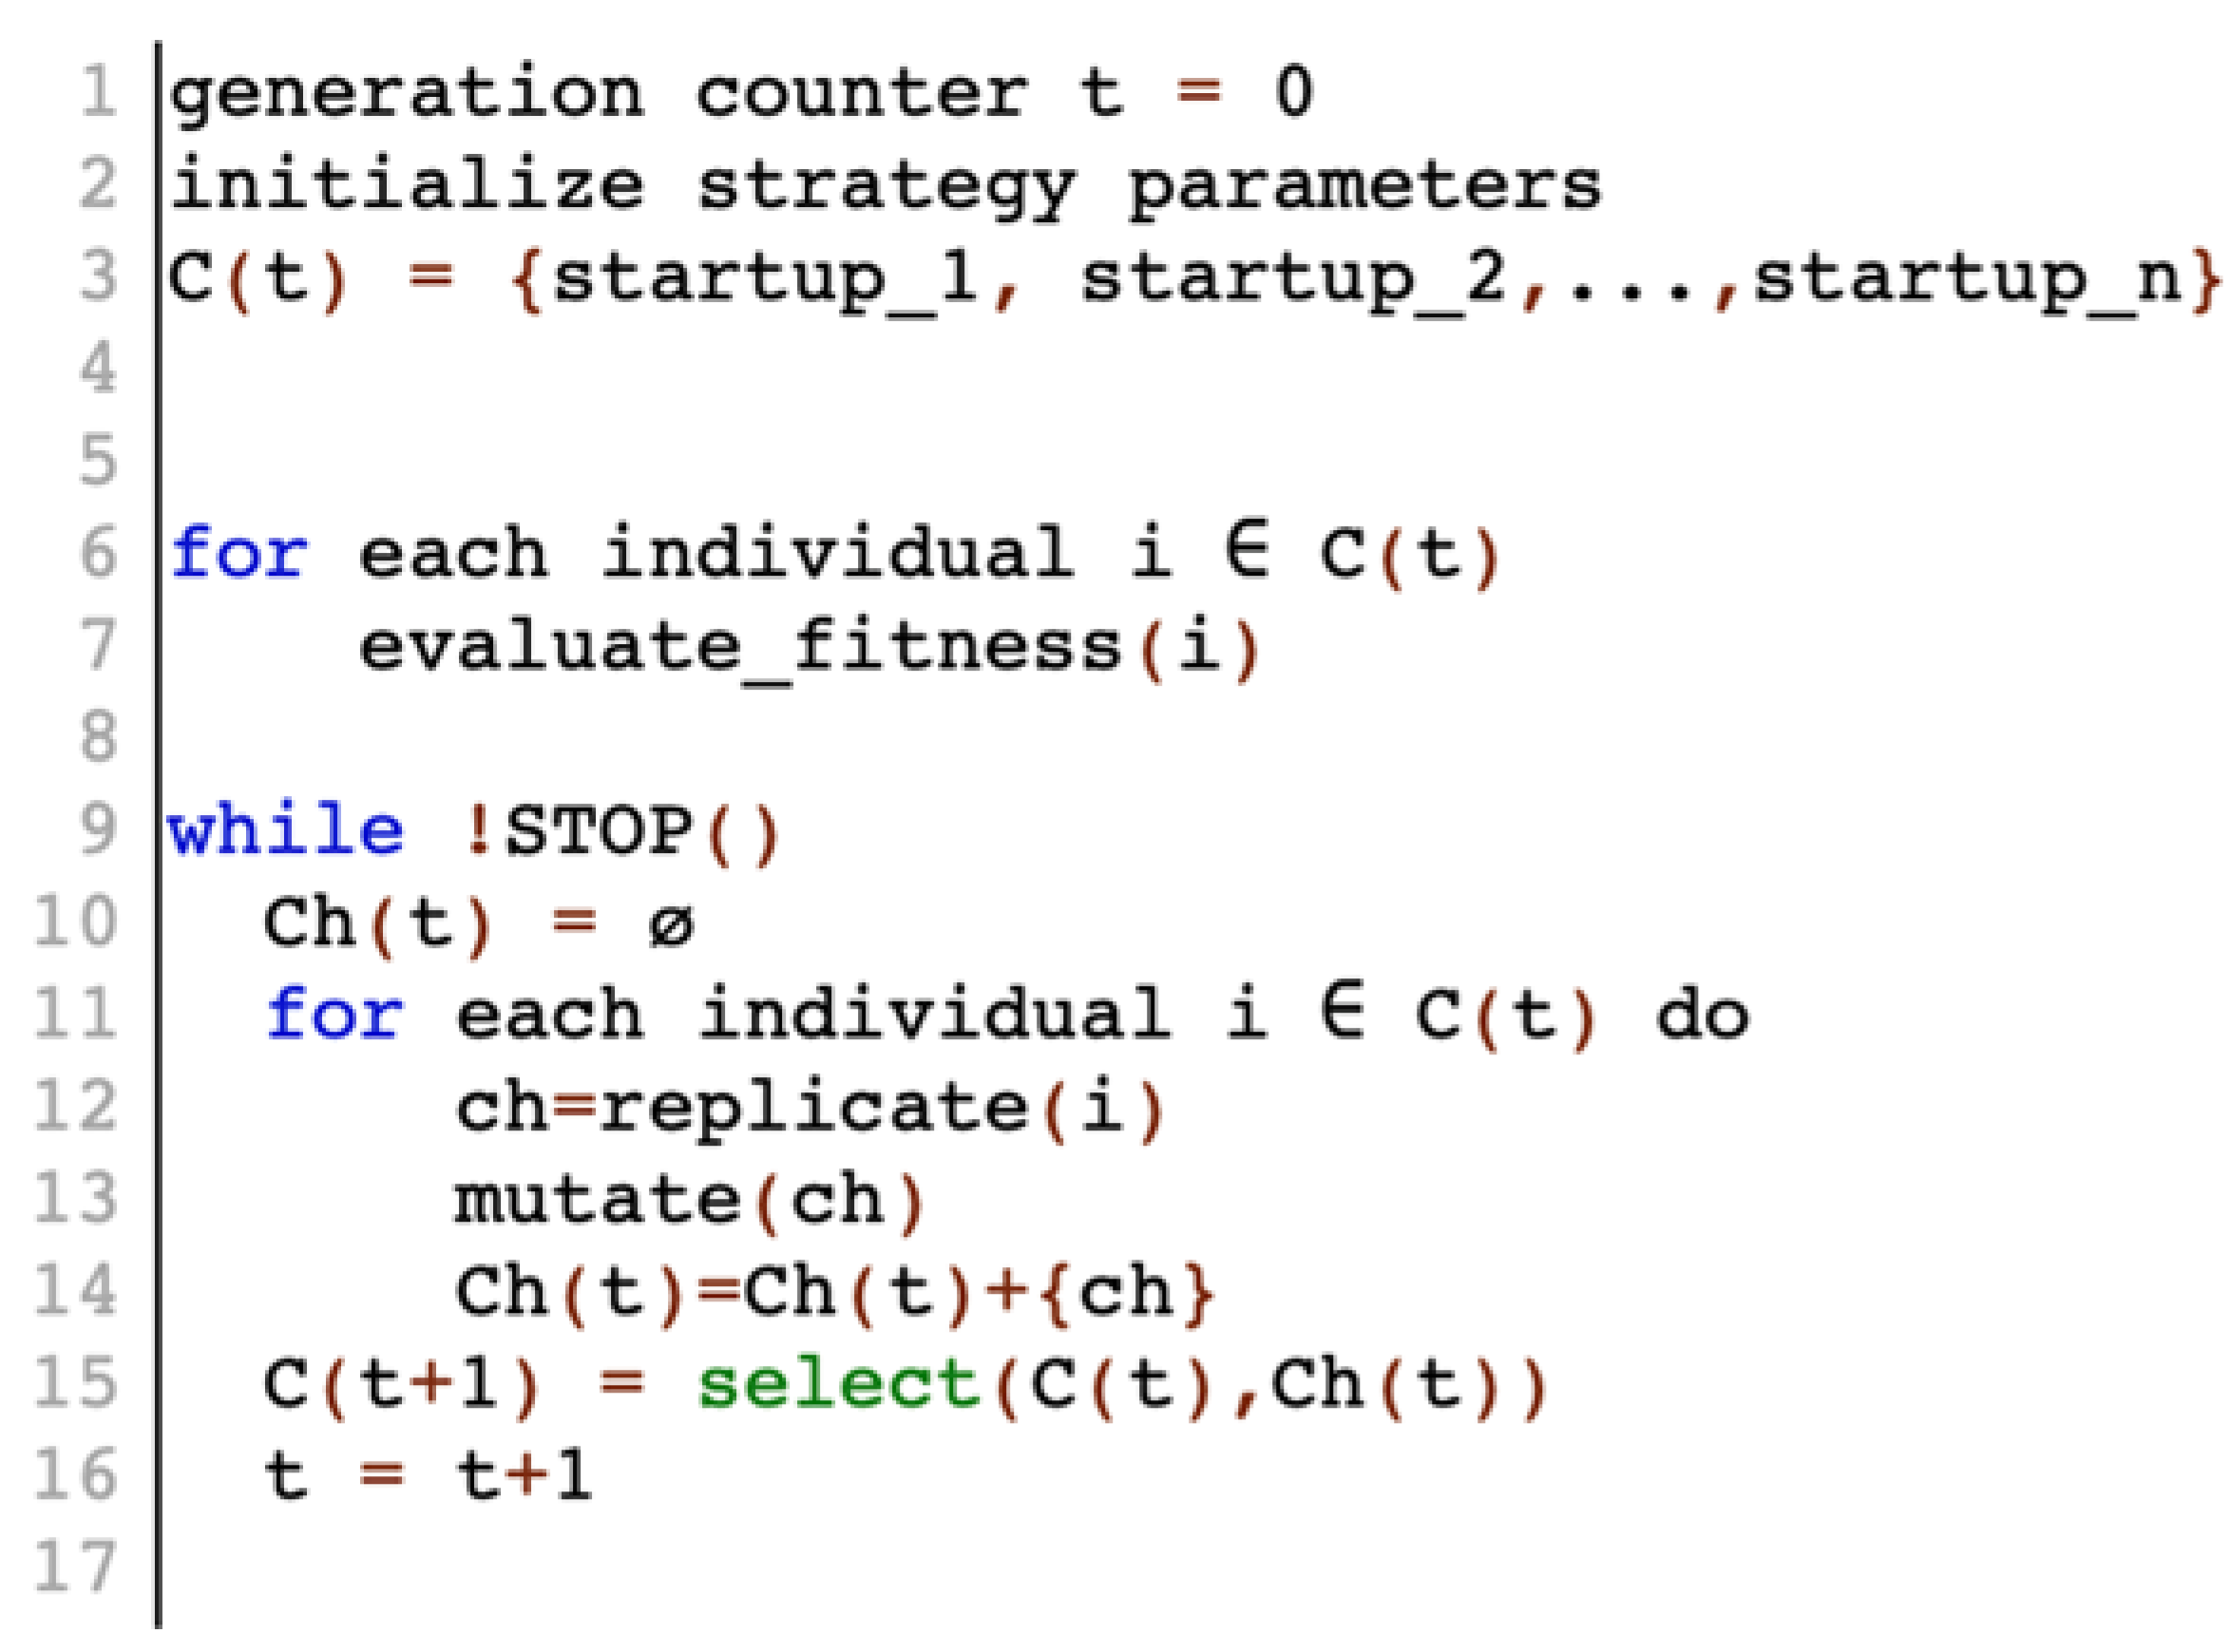
EP was developed to imitate the evolution of behavioral traits (i.e., to evolve a set of semi-optimal behaviors where the focus is on the phenotypic evolution instead of the genotypic one like in other evolutionary methods (e.g., genetic algorithms)) [34]. Thus, EP does not apply any recombination operators that exchange genetic material between individuals, and the search process is driven solely by mutation and selection. There is no single method of individual representation, like bitstrings in Holland’s genetic algorithms [26]. Instead, the representation is tightly connected to the current problem domain. The fitness function takes into account the environment of the individual and evaluates its behavior. The pseudocode of the basic evolutionary programming algorithm is presented in Figure 2. The proposed approach was implemented and reviewed using Python in the Jupyter Notebook, which is especially useful for interactively developing and visually verifying the ongoing evolutionary design process.
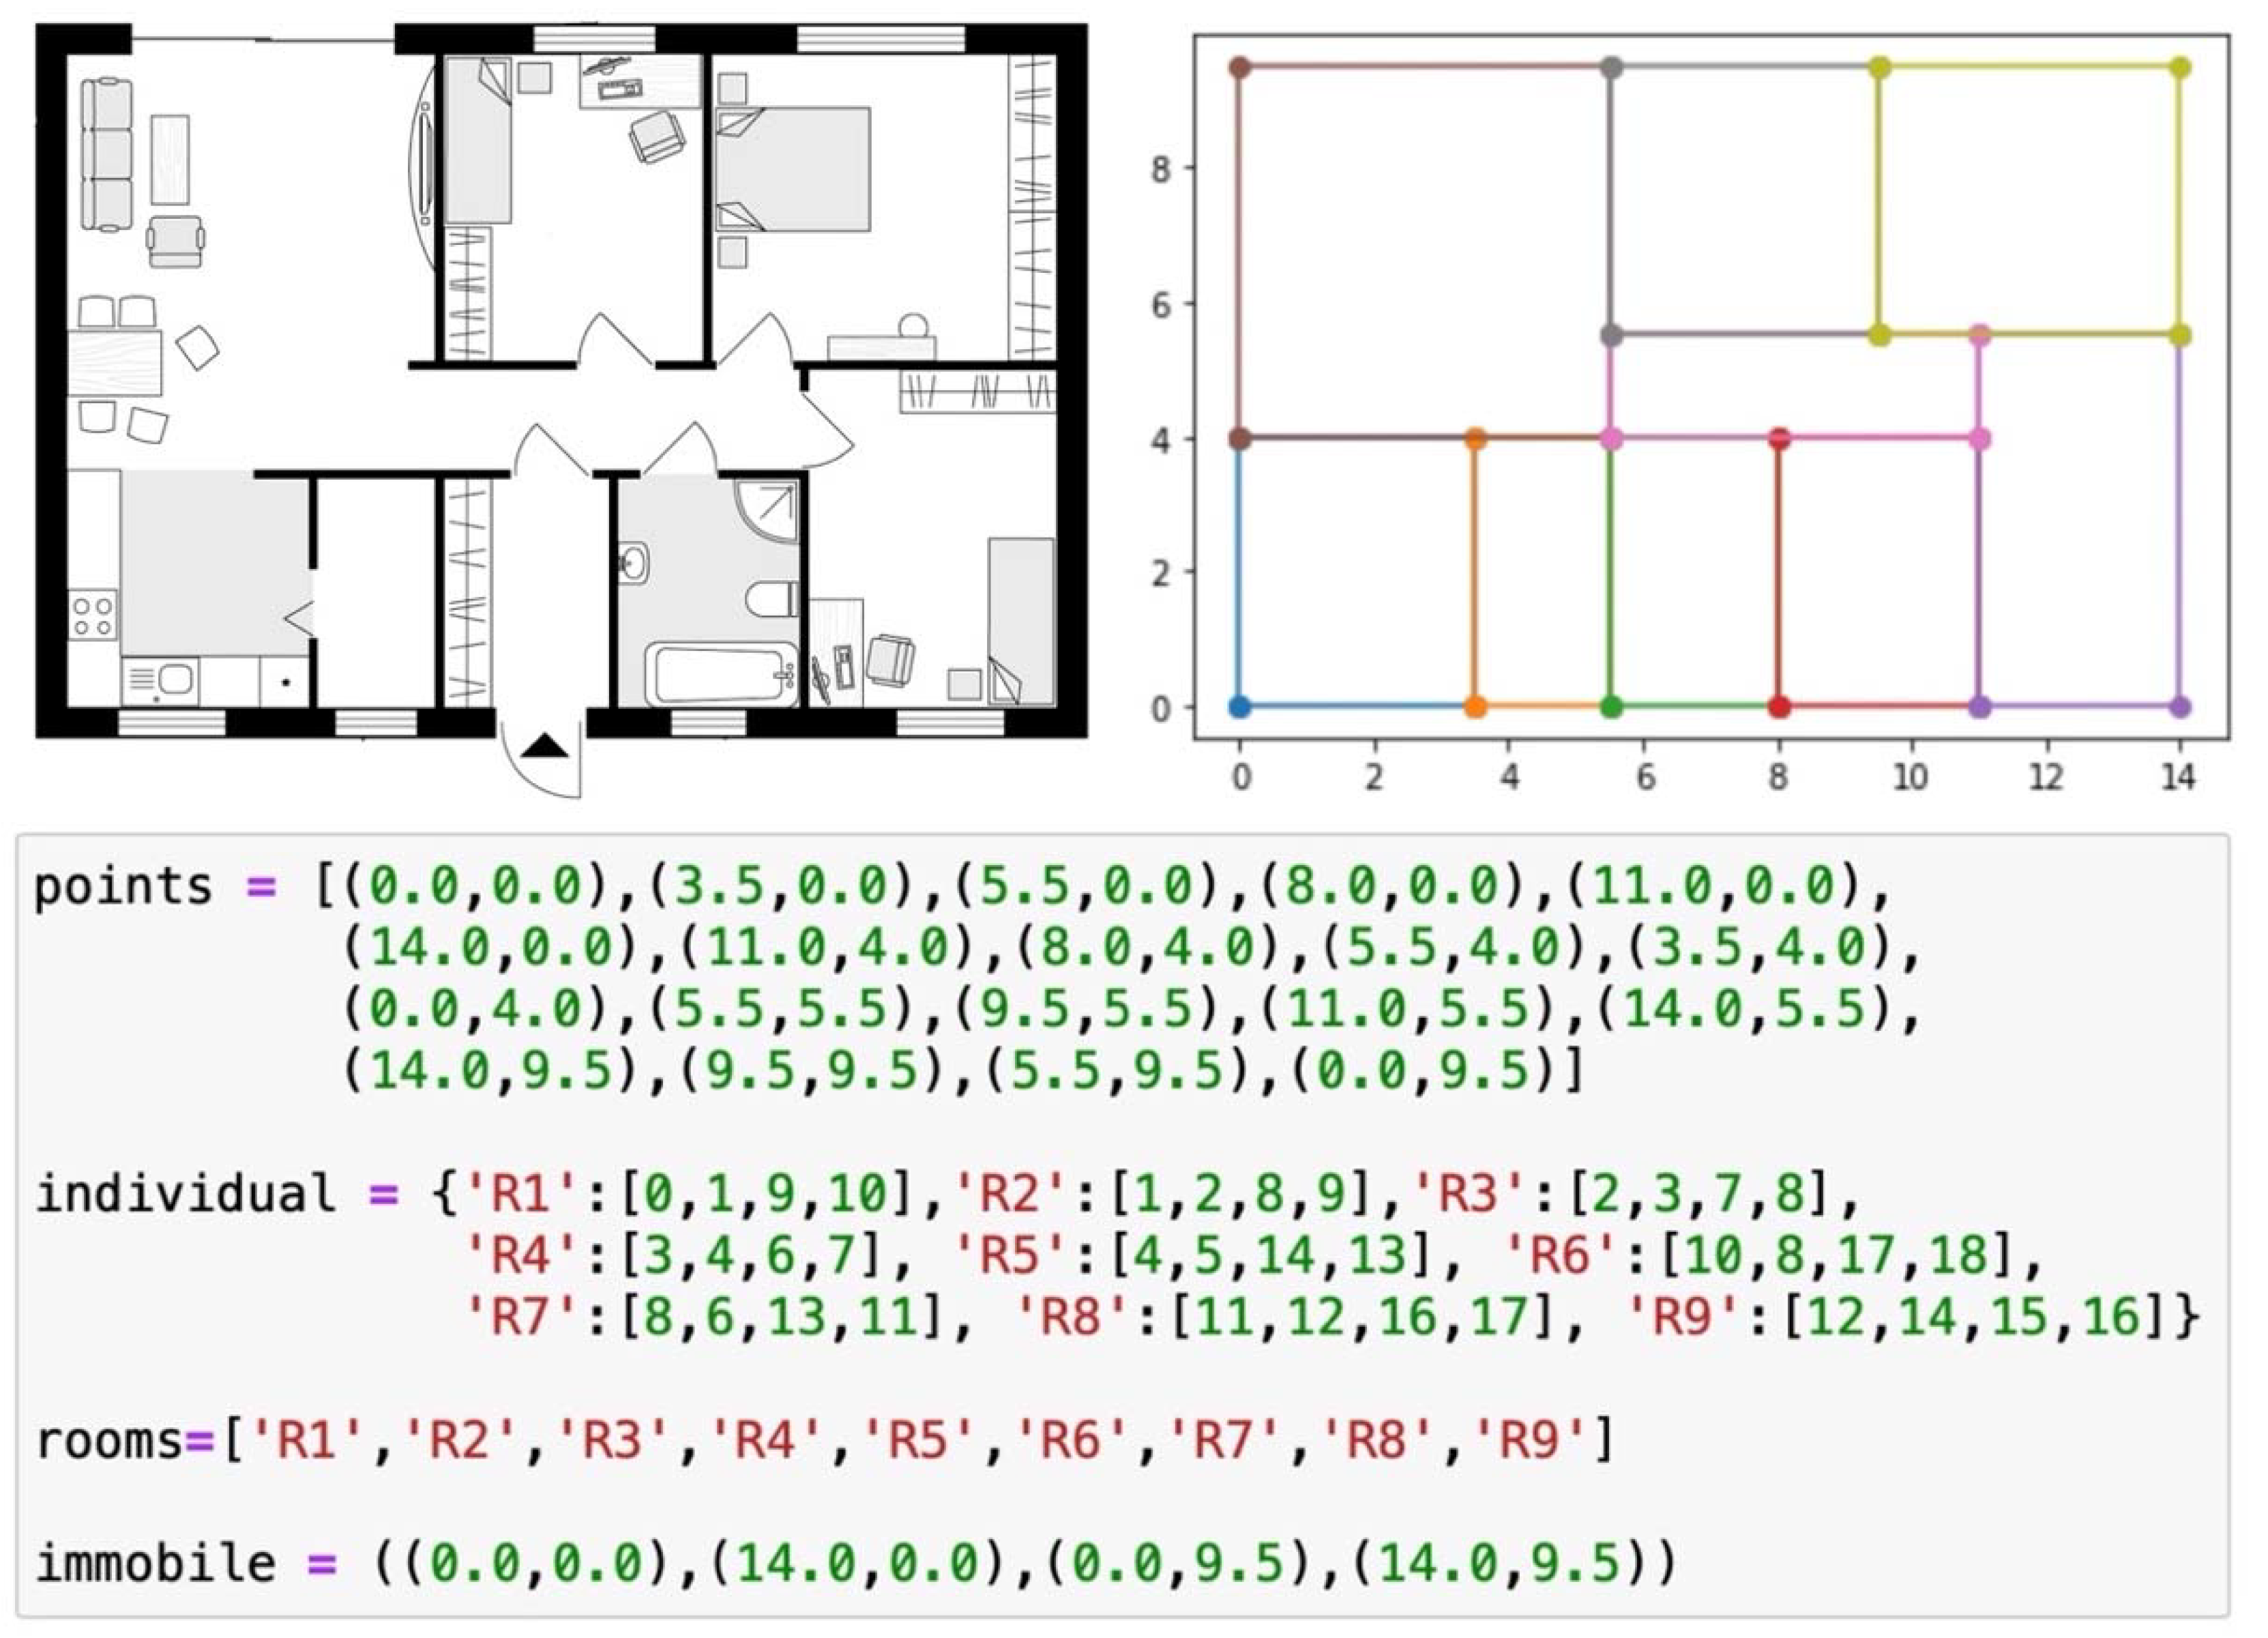
Representation: In our approach, we assume that all rooms in a floor plan are polygons. Thus, each room can be uniquely identified by a set of points P = {p1, …, pn} where pi = (x,y) ∊ R2,1 ≤ i ≤ n ∊ N. Each point represents the place where the walls of the rooms meet. Hence, individuals in our approach use a representation of a real-valued point sequence. In order to interpret such a sequence as a valid space plan, a preprocessing flood fill algorithm [35] is applied to determine the connected areas that constitute a room. In this way, the individual phenotype I is created in the following way: I = {‘R1’:[p11,p12, …, p1j_1], ‘R2’:[p21, …, p2j_2], …, ‘Rk’:[pk1, …, pkj_k]}, where R1, …, Rk denote recognized rooms and [pm1, …, pmj_m] is a sequence of points of all walls’ connections in a room Rm. The example floor plan, its simplified sketch with marked points and the actual representation are presented in Figure 3. Special points called immobile, which define the outline of the layout and as such cannot be changed by any evolutionary operation, are also indicated.
Initialization: It is not trivial to generate the initial population where individuals are to fulfill all the constraints and meet the given requirements of architectural design. Therefore, at this stage of the algorithm, the designer domain knowledge is irreplaceable, and he or she explicitly points out a set of start-up solutions from the Floor Plan Solutions Database.
Fitness Evaluation: The fitness of each individual F(I) is measured as the individual’s ability to fulfill all the constraints and the degree to which it achieves the objectives of the design task. There are different approaches to handle the constraints, like penalty functions or problem redefinition to an unconstrained one [36,37]. We propose defining the mutation in such a way that most of the generated offspring are feasible, and if an unacceptable solution unfortunately occurs, it is rejected. The requirements Reqi(I) ∊ [0,1] (i = 1, …, n) have the importance coefficients assigned such that wi (i = 1, …, n), and the weighted sum of the degree to which they are achieved gives the final value of the fitness evaluation, which may be summarized as follows:
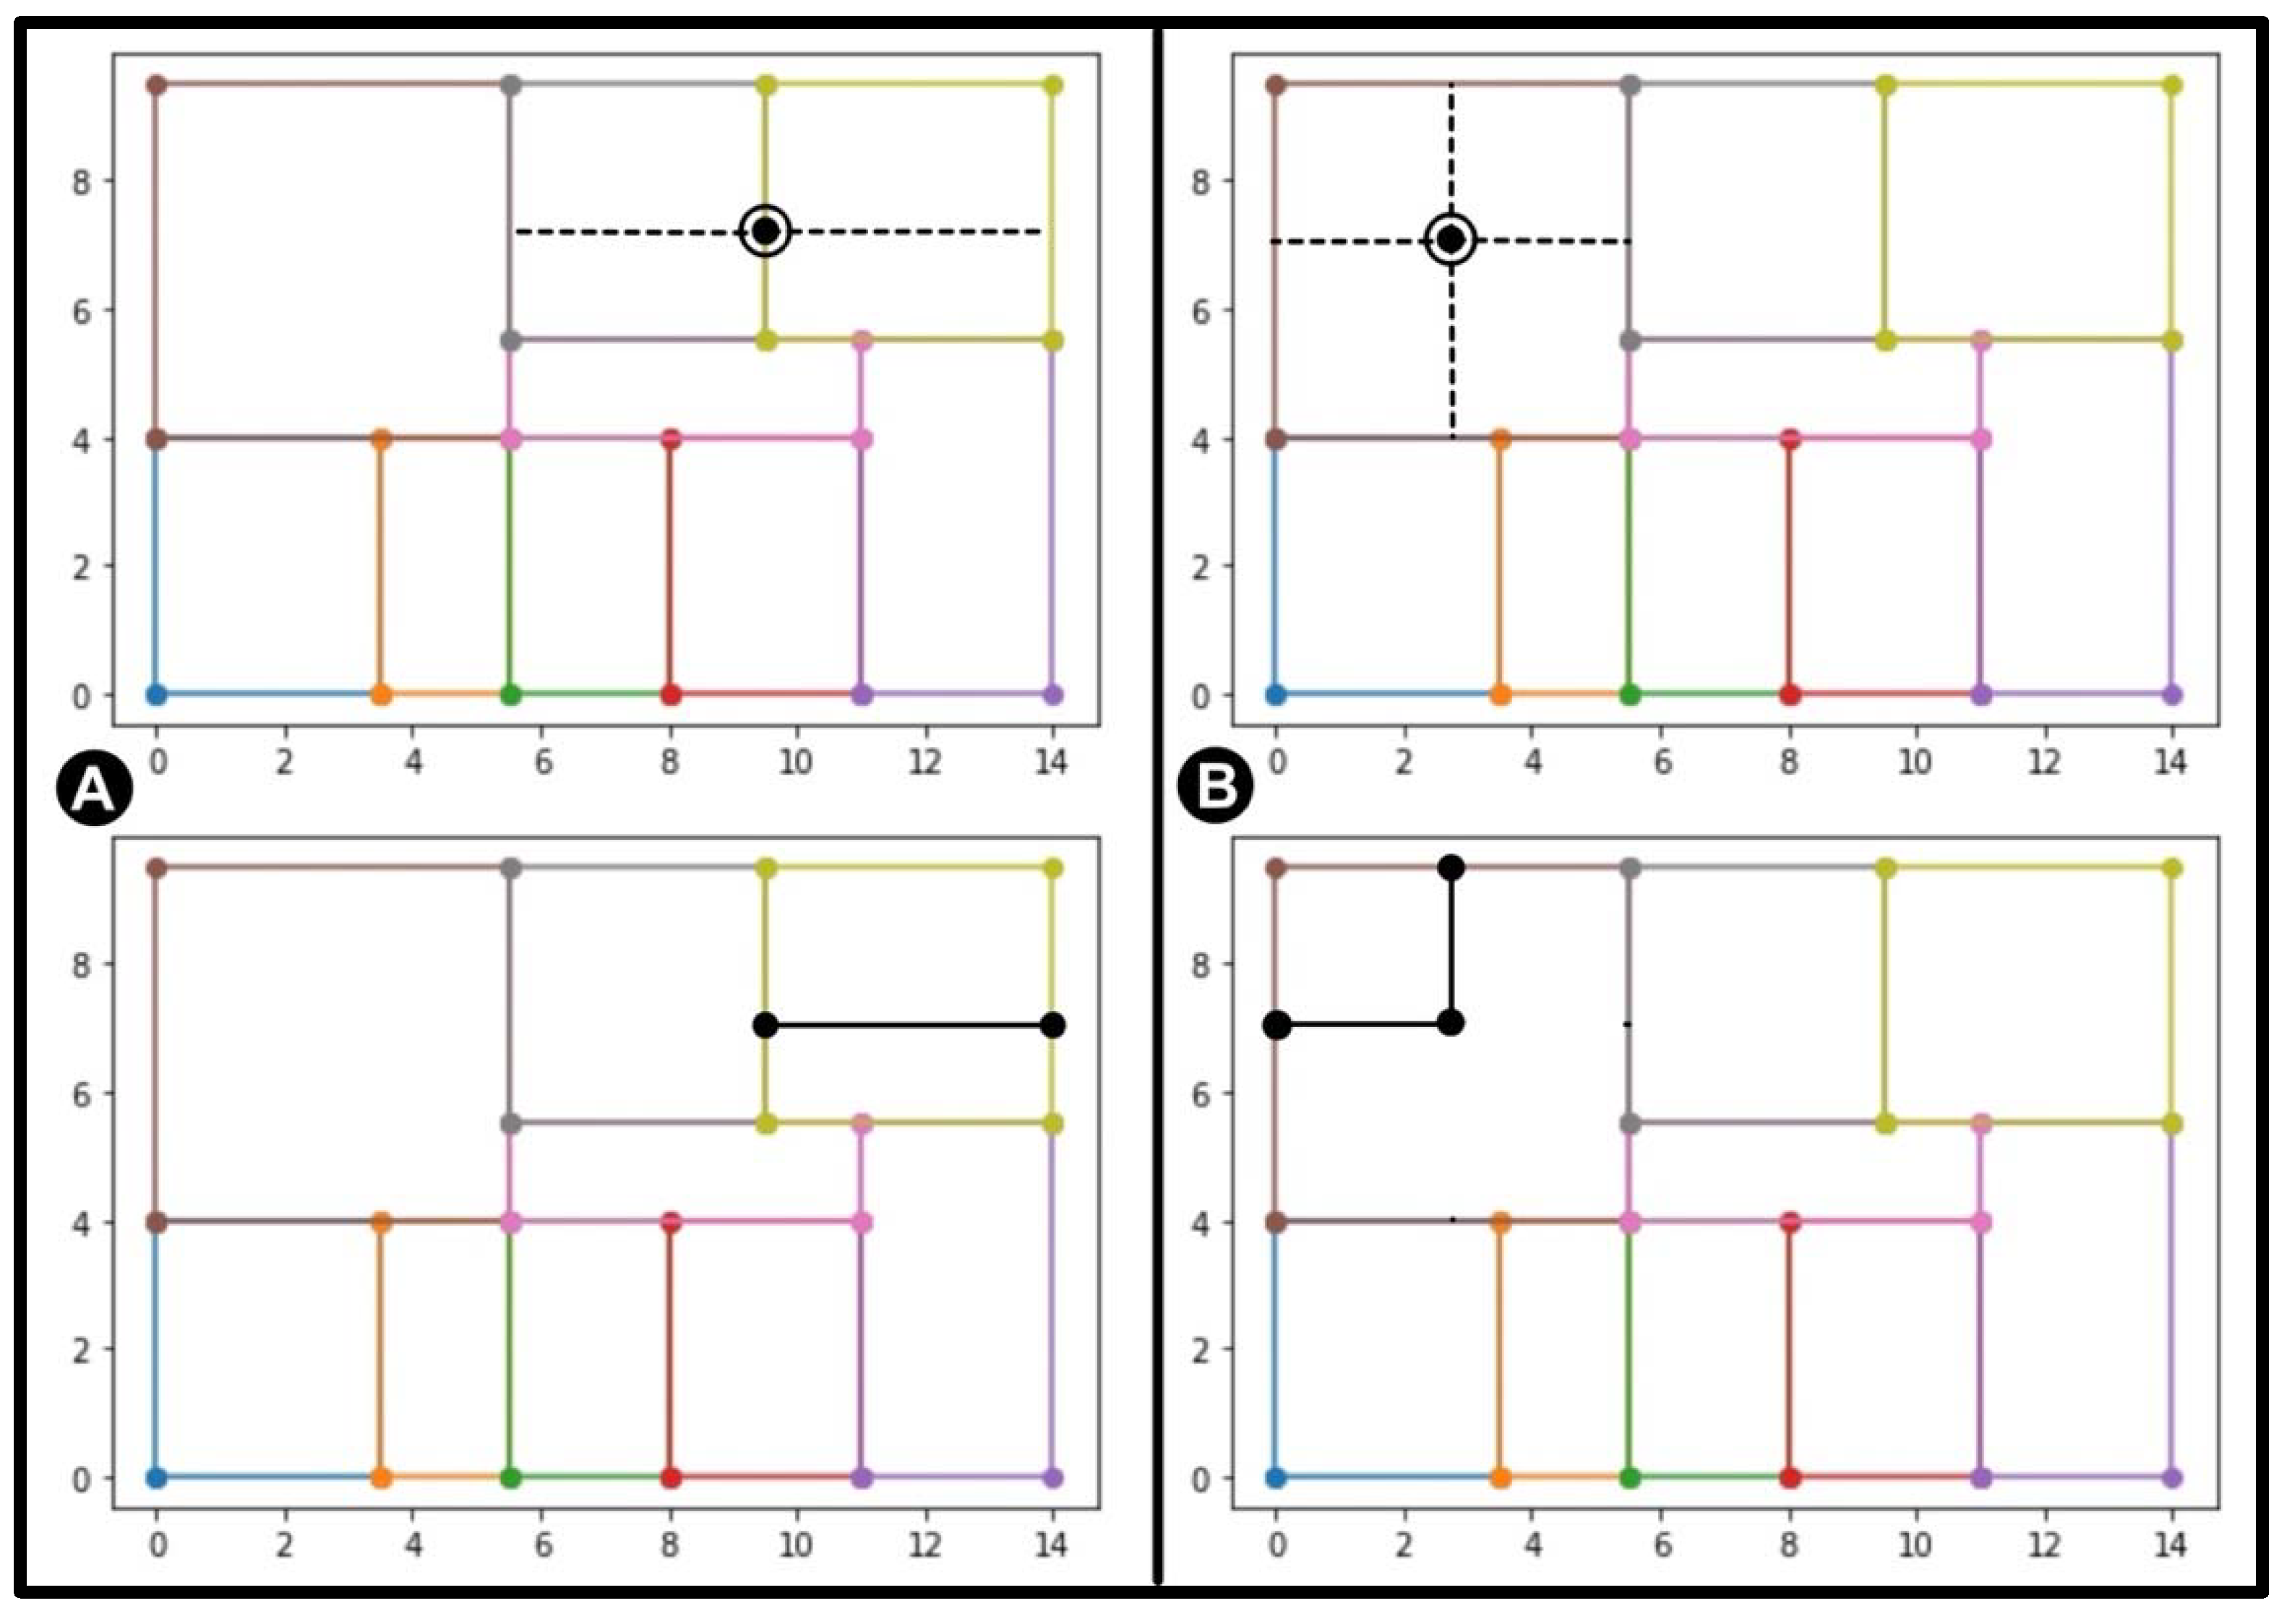
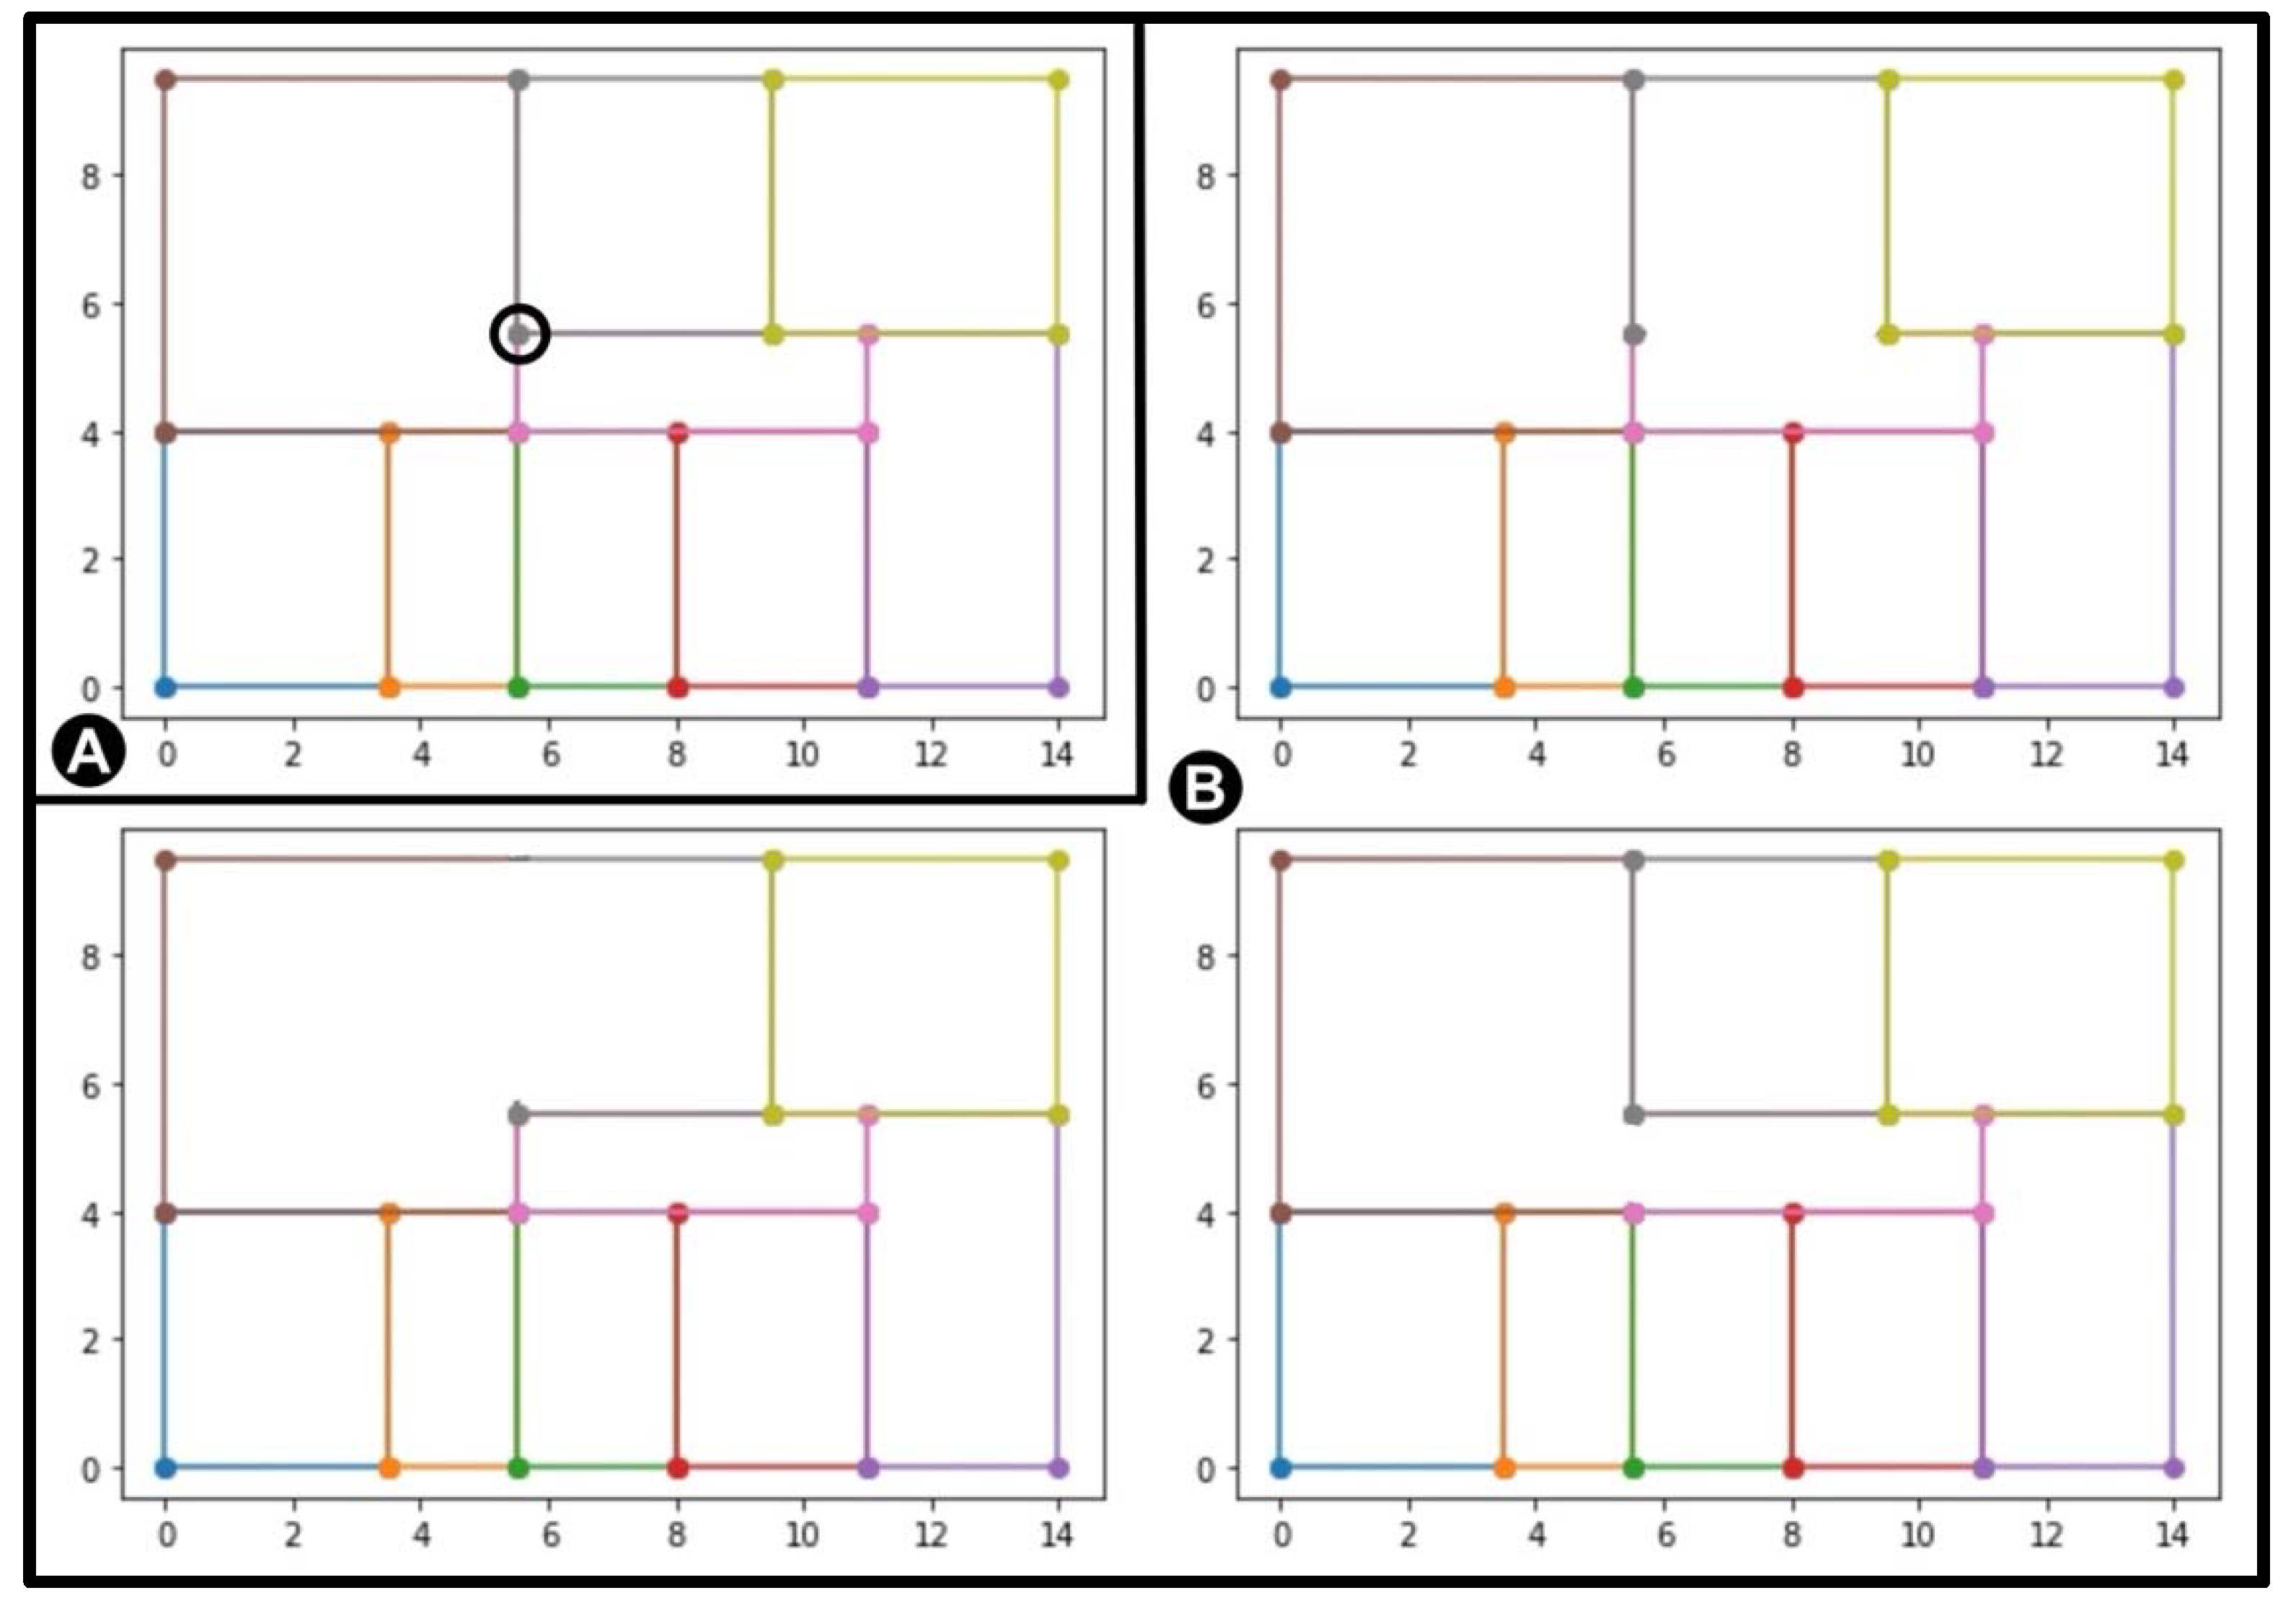
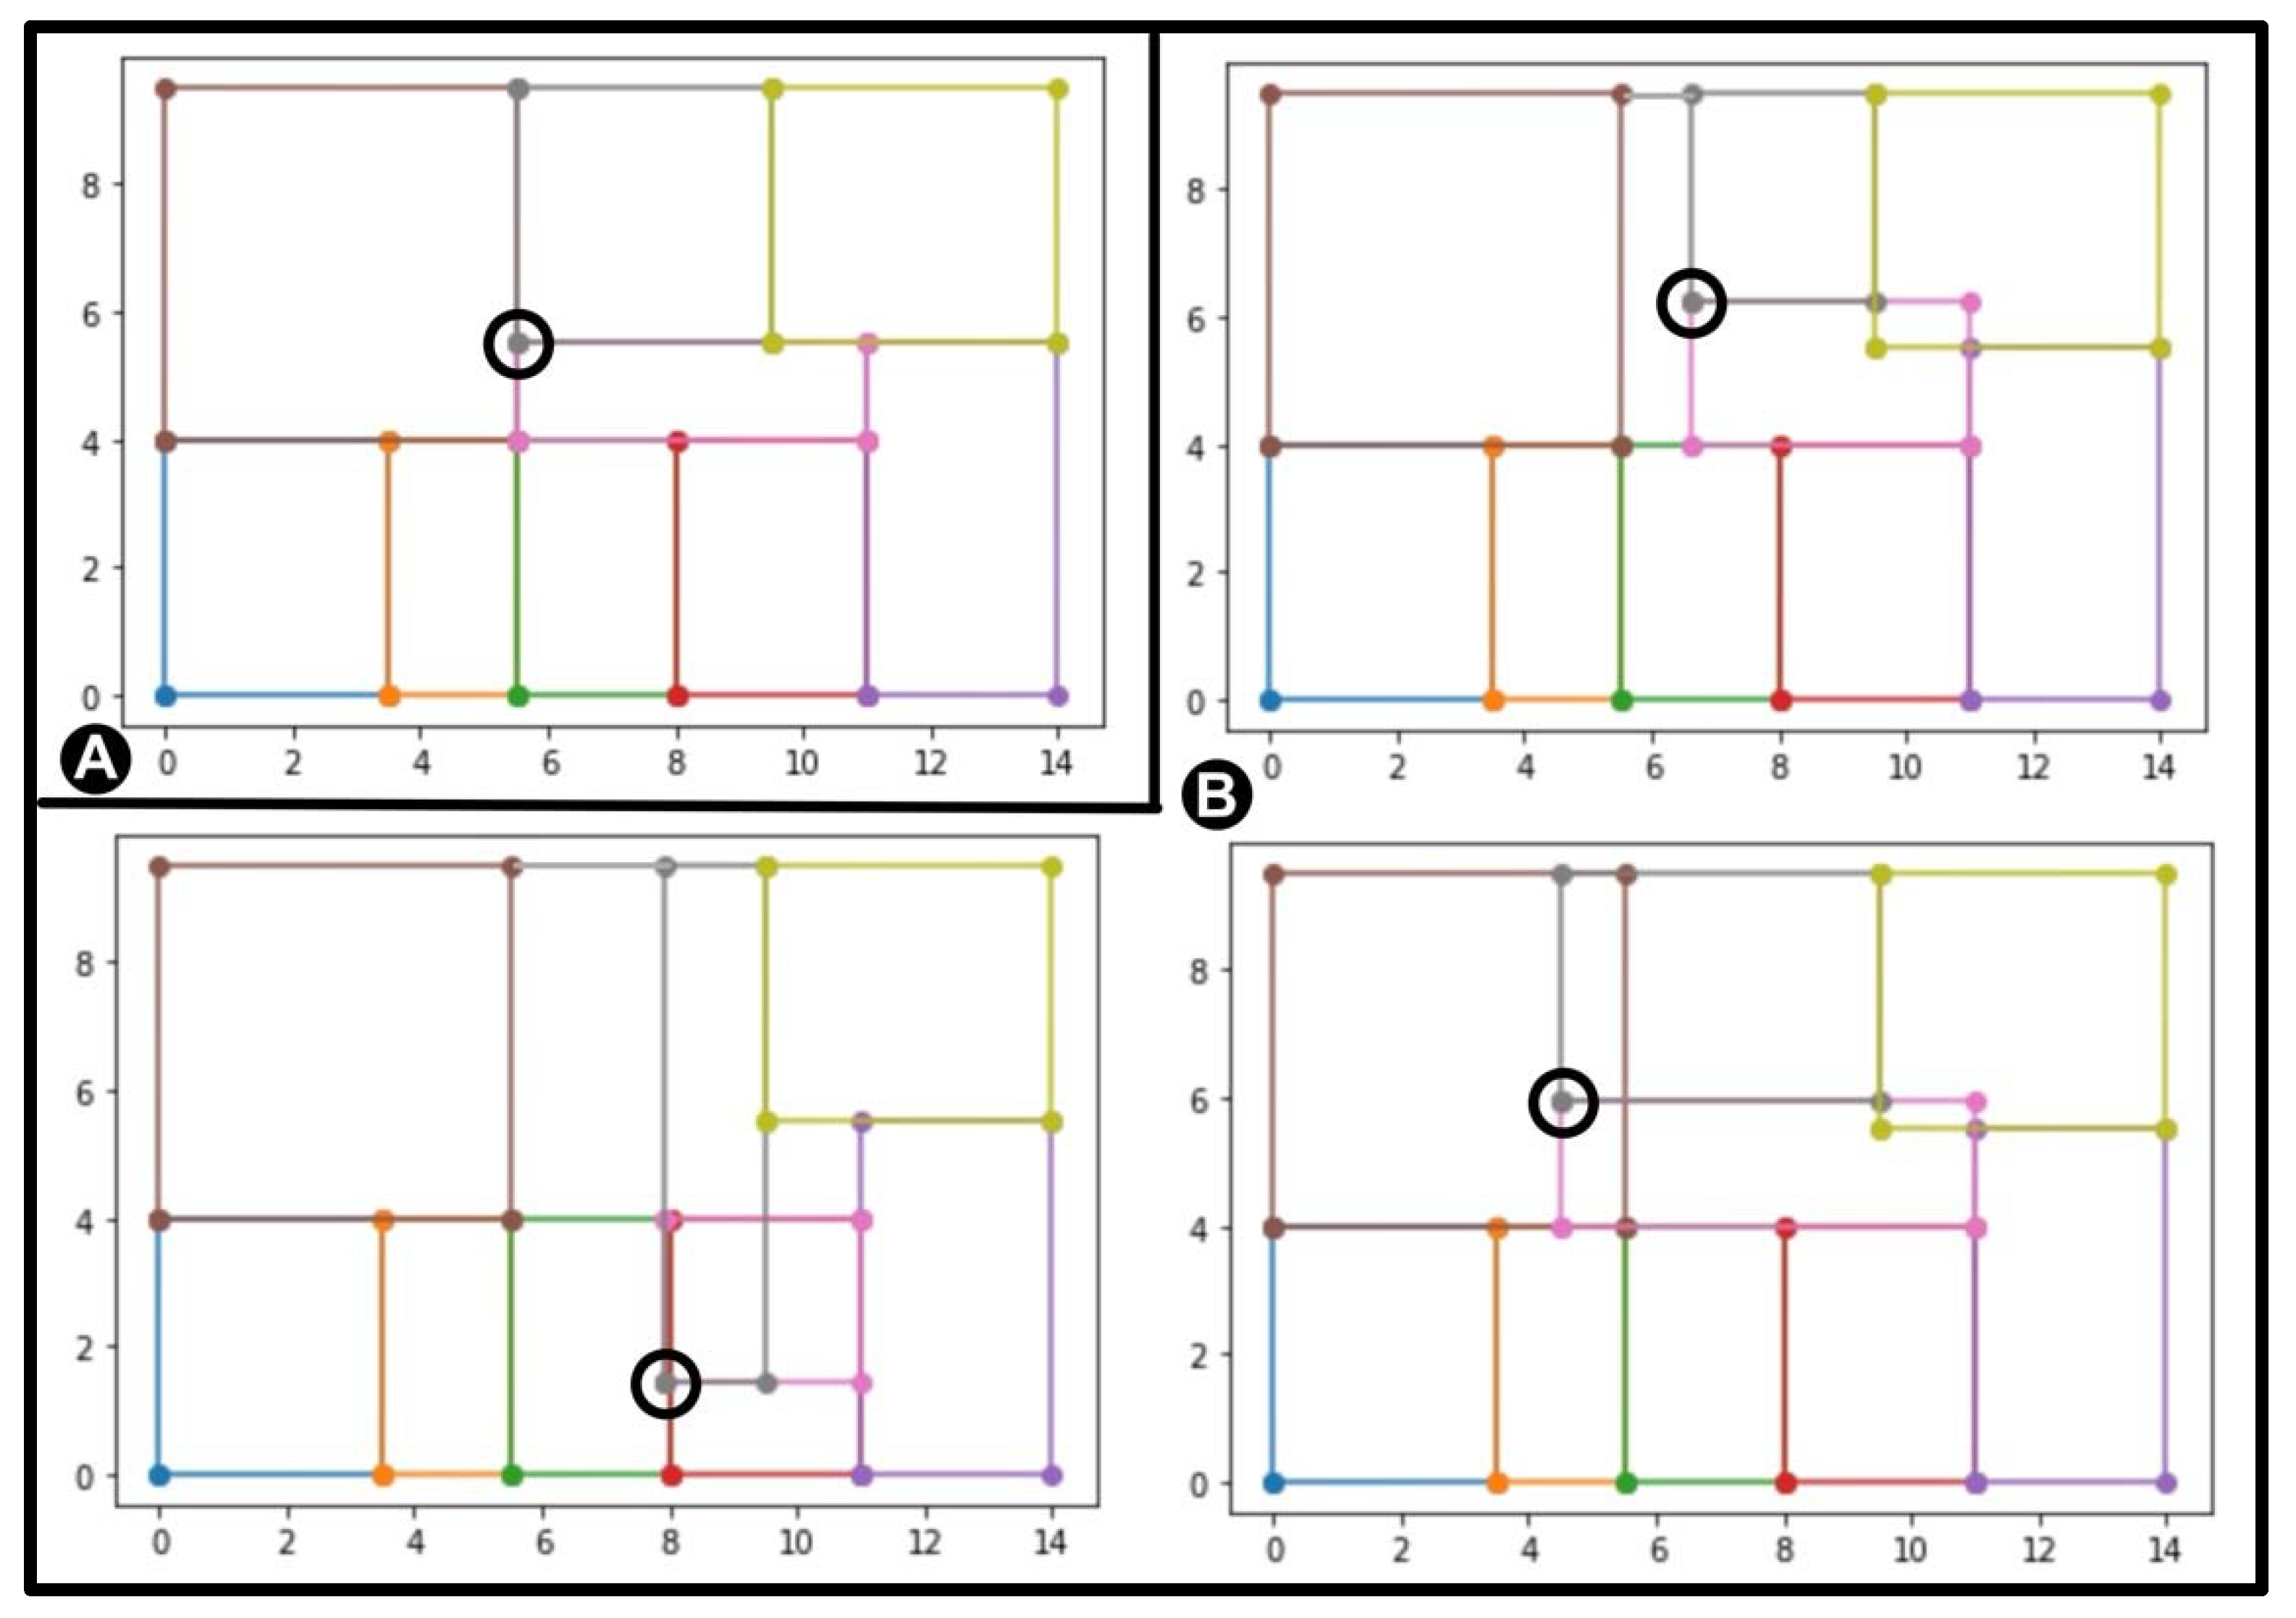
Mutation: The mutation operation is the only procedure that introduces variation in a population. In the early generations, it should dynamically explore the search space, and when the space is sufficiently covered, it should allow for exploiting the obtained results to fine tune them. The exploration–exploitation trade-off in EP is moderated by strategy parameters. So far, the static strategy has been implemented, which is the simplest one, where the value of deviation is fixed and there is one strategy parameter per operator. However, it is straightforward that in the future, it will have to be dynamically changed over the generation time and over the individual fitness value. The following mutation operators have been defined: a new point can be added, a point can be deleted and a point can be moved. The operators may be applied individually with a given probability or in a randomly selected sequence. Since we assume that, in most cases, the mutation generates feasible solutions, some accompanying actions for every mutation operator has to be performed. When adding a new point, two situations have to be considered: a new point is (1) on the existing wall or (2) inside a room. In the first situation, an additional point has to be added, and there are at most two different ways to do that (see Figure 4A). In the second one, at least a further two points have to be included (see Figure 4B). Deleting a point requires indication of another point connected to it by a wall, and these two points are deleted together (see Figure 5). Moving a point is the action that requires the most additional activities. After selecting a point to change, all the rooms that contain this wall connection are selected, and all walls are adjusted to a new (mutated) position. If there are still rooms that may become invalid after this translation and may have walls joined at an angle other than 90 degrees, an extra new point at the position before the mutation is added (see Figure 6).
Selection: The selection operator is applied to choose the individuals that survive to the next generation. In EP, both parents and their offspring compete to survive, and this competition is based on the relative fitness value. The relative fitness may be simply calculated as the number of competitors that are less adapted and have lower fitness function evaluations. It expresses how well an individual performs in a group, and based on that score, any of a number of selection operators that have been developed can be used: random, proportional, tournament, rank-based, elitism, hall of fame, etc. Since the goal of our approach was to preserve the high diversity in the population, a roulette wheel proportional selection, which is the operator with a low selective pressure, was applied. An operator with a high selective pressure, such as tournament or elitism, would limit the exploration abilities of the search process and produce a uniform population.
3. Case Study
Let us consider the example of designing a floor layout of a bungalow for a family with two children. The dimensions of the house cannot exceed 8.5 × 13 m. The customer specified the following constraints (CON) and requirements (REQ):
- CON 1: There have to be six spaces (three bedrooms, one bathroom, one kitchen and one living room).
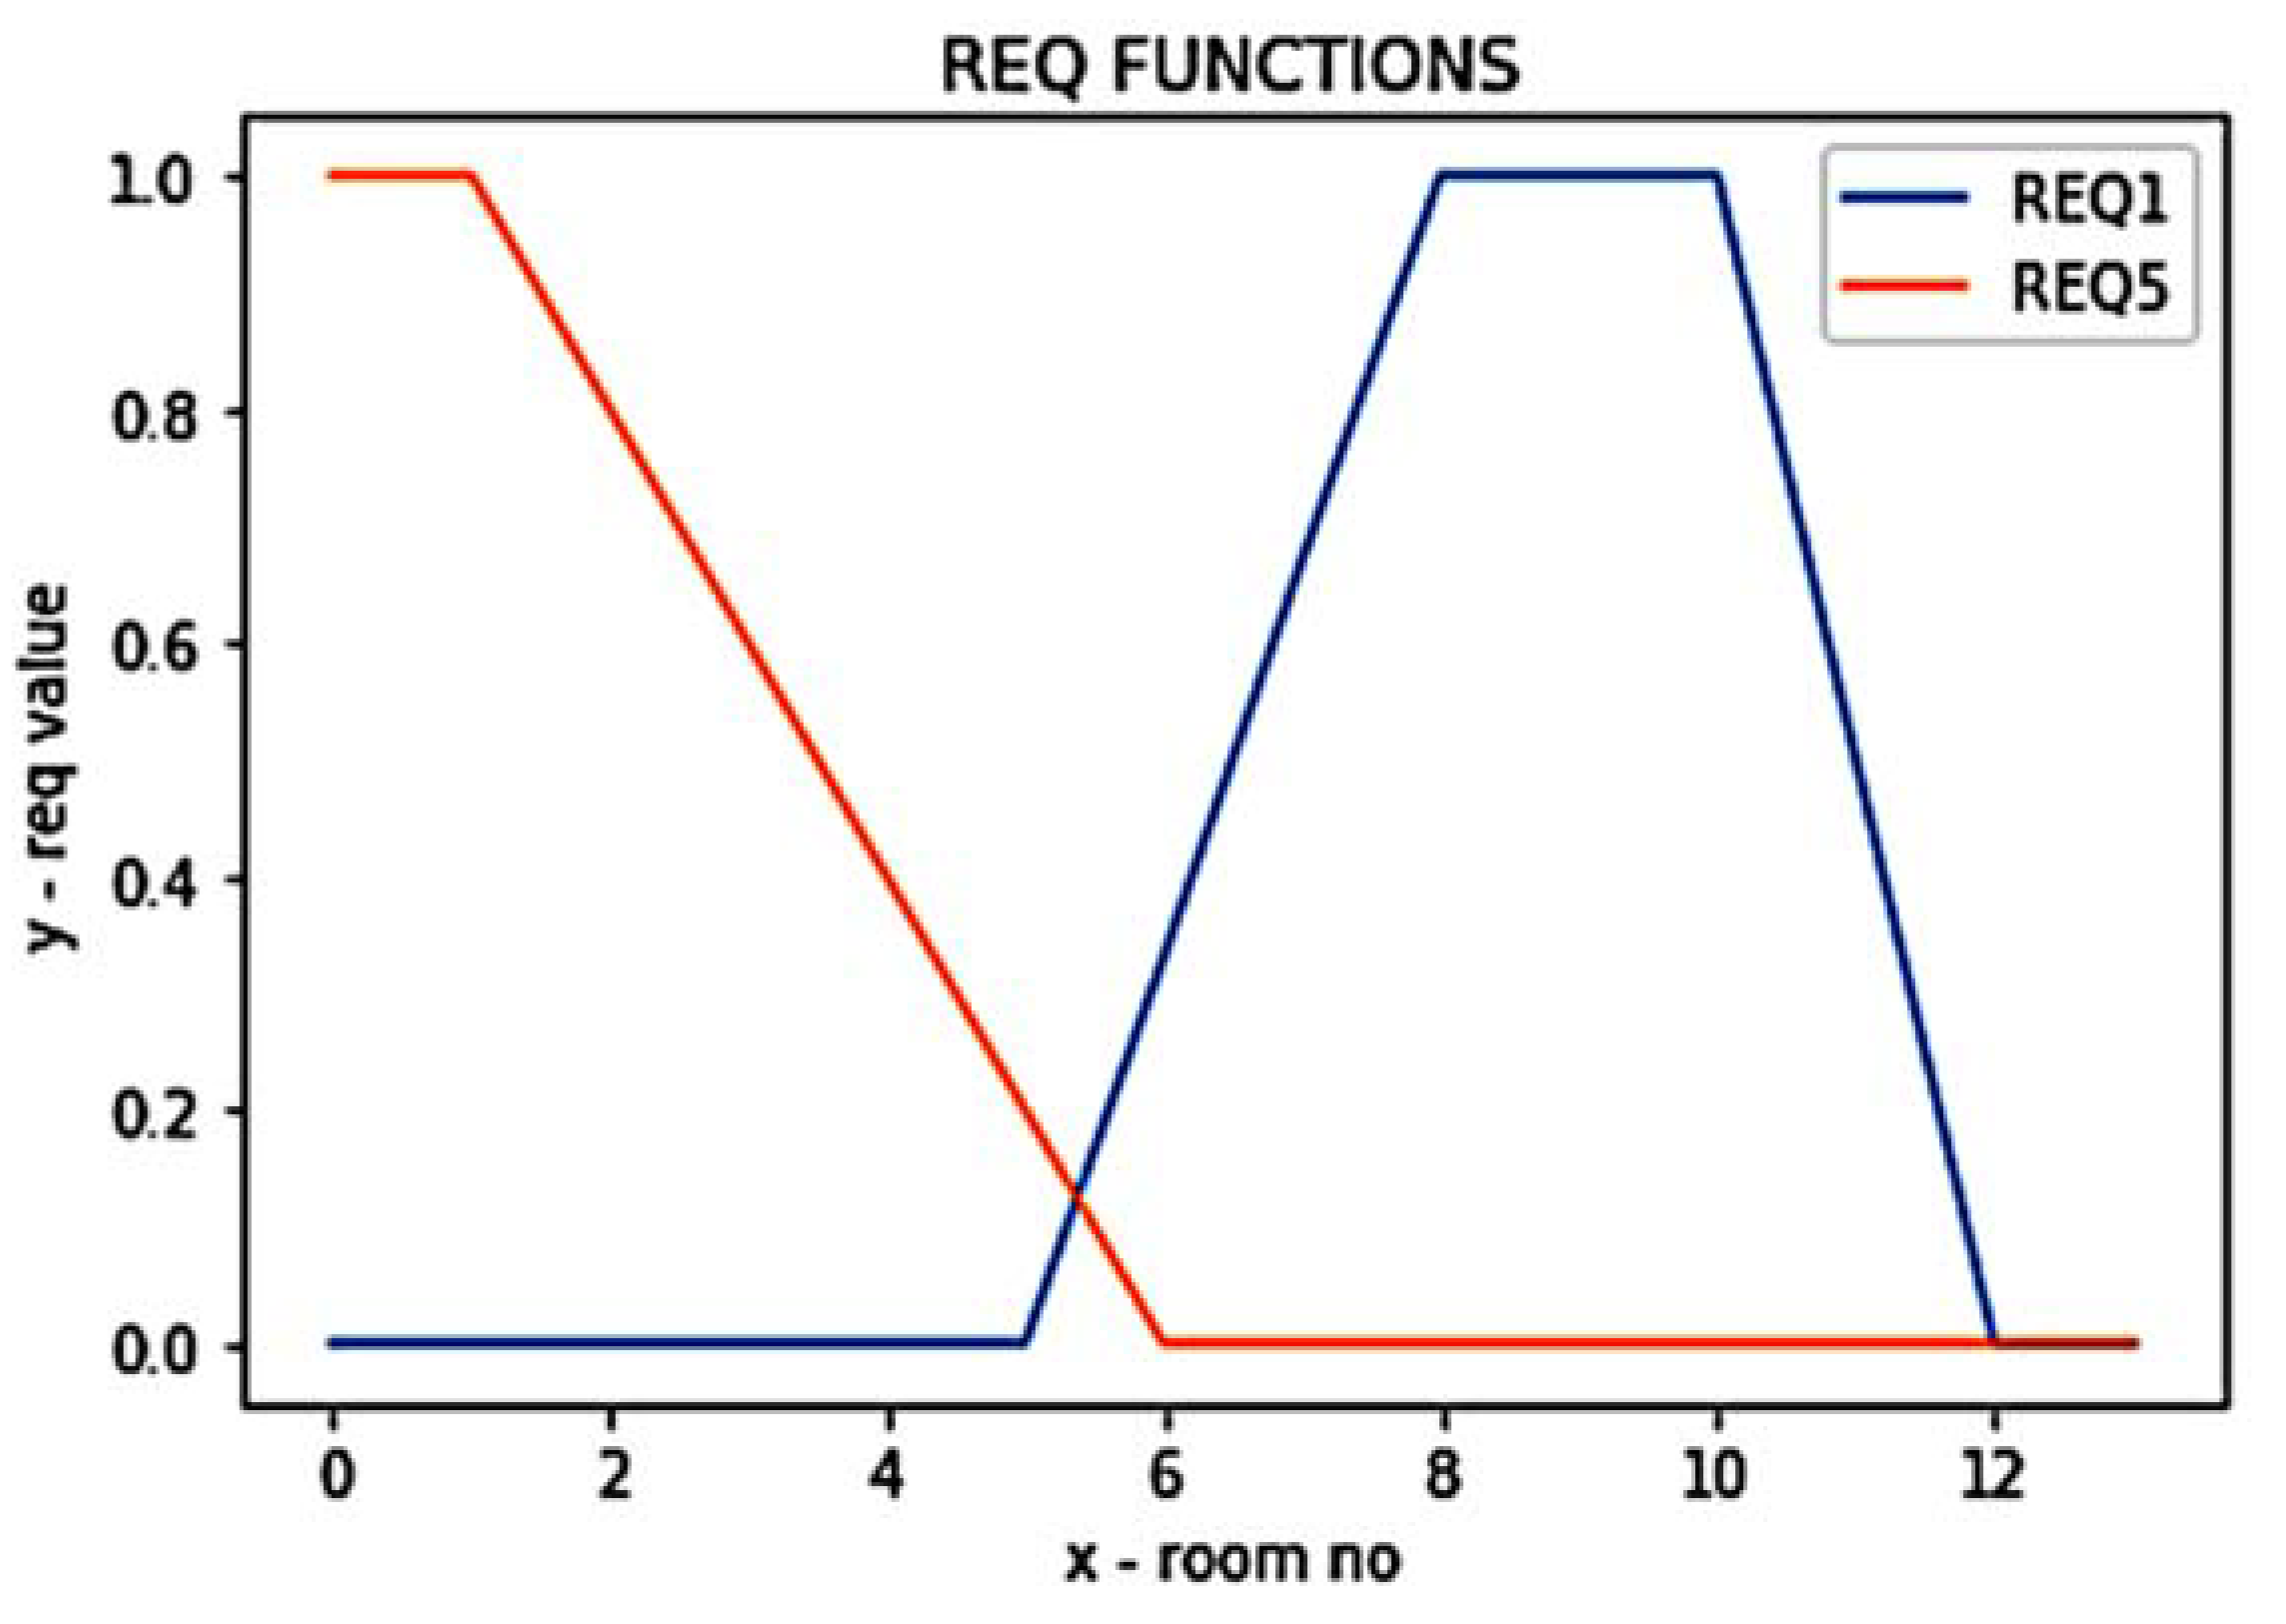
- REQ1: There should be at least eight spaces and w1 = 0.8, Req1 ∊ {0, 0.33, 0.5, 0.67,1} (see Figure 7).
- REQ2: The largest room should be bigger that 21 m2 and w2 = 0.7, Req2 ∊ {0,1}.
- REQ3: There should exist a room larger than 7 m2 adjacent to the largest room and w3 = 0.6, Req3 ∊ {0,1}.
- REQ4: The largest room should be oriented to the south and w4 = 0.5, Req4 ∊ {0,1}.
- REQ5: There are not many spaces with areas less than 2 m2 and w5 = 0.5, Req5 ∊ {0,0.2,0.4,0.6,0.8,1} (see Figure 7).
The only constraint imposed by the designer was that there be no spaces with any wall shorter than 0.8 m:
- CON2: No walls shorter than 0.8 m.
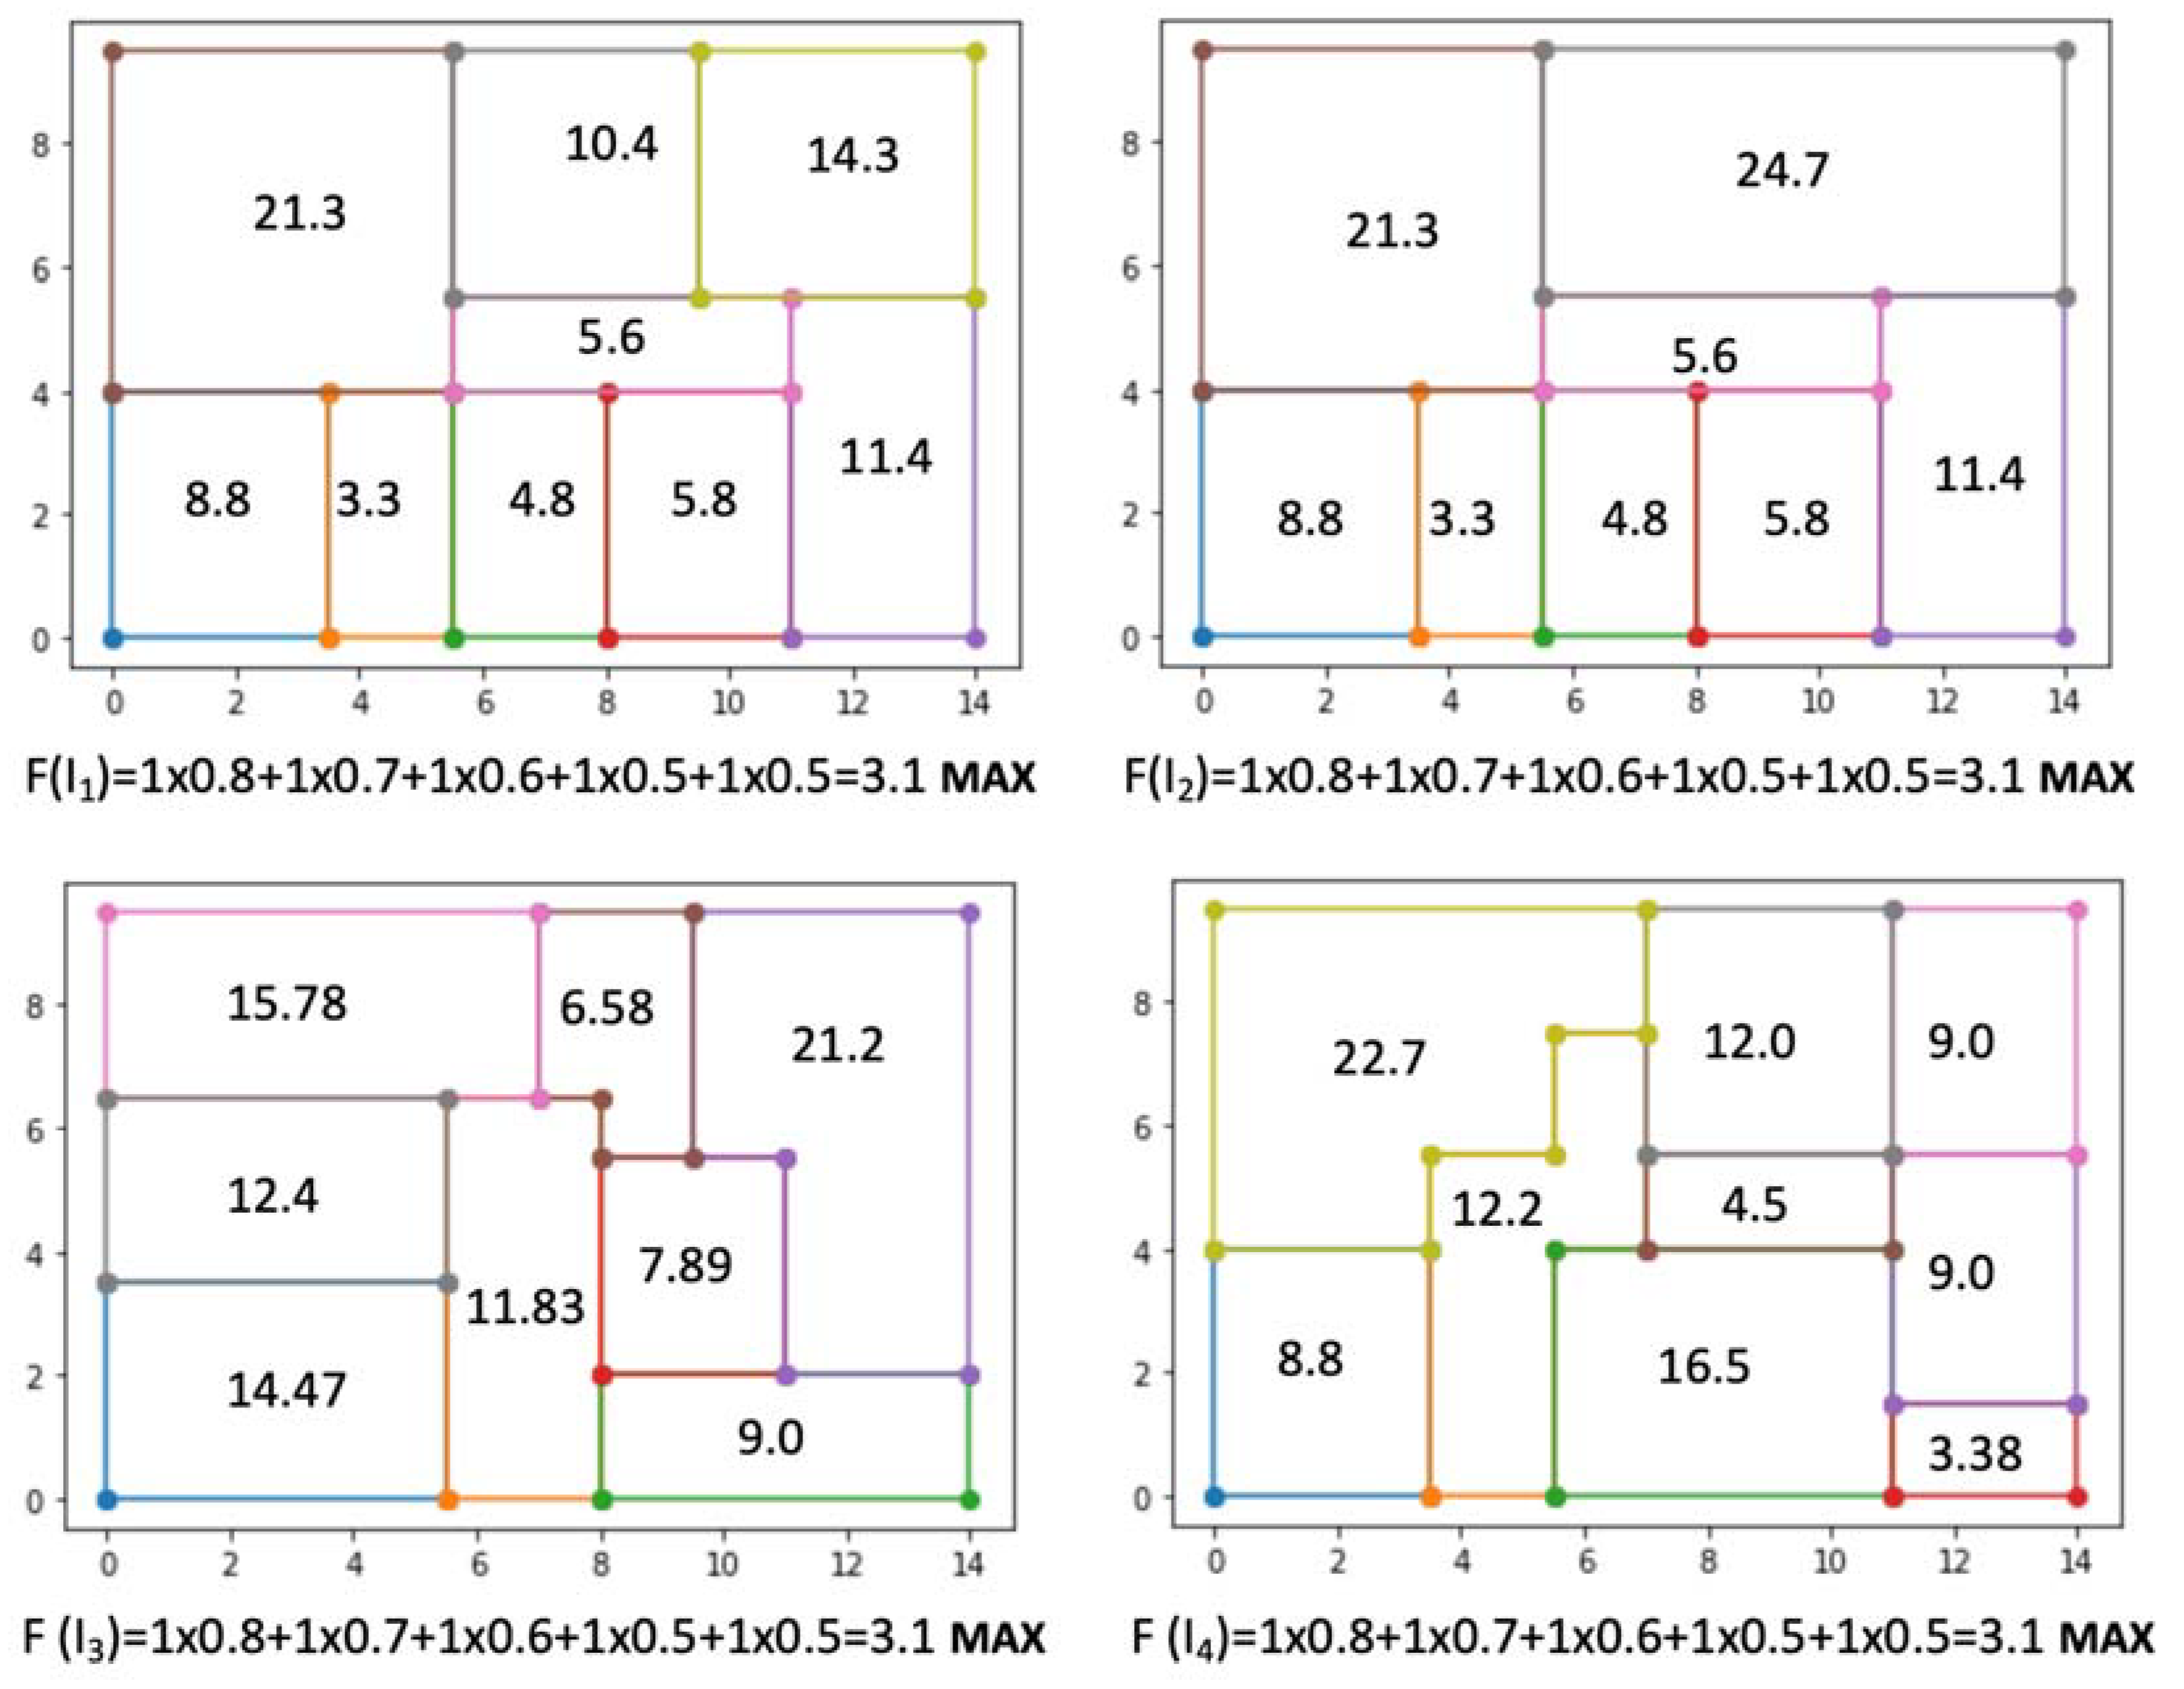
According to Equation (1), if the evaluated solution I meets the constraints CON1 and CON2, its fitness is calculated as follows: F(I) = 0.8Req1 + 0.7Req2 + 0.6Req3 + 0.5Req4 + 0.5Req5.
Based on the above-mentioned criteria, the floor plan shown in Figure 3, which fulfilled them all (F(I1) = 3.1 Figure 8), was chosen. The representation of this plan became the first individual of a population. During the ongoing evolution, in the first step, all floor plans with at least one wall shorter than 0.8 m and the ones with less than 6 spaces were removed. In the next step, the remaining solutions were evaluated, taking into account requirements REQ1–5. As far as the first requirement was concerned, the solutions were evaluated according to the trapezoidal function REQ1 presented in Figure 7, which assigned a value of 1 to the plans with 8, 9 and 10 spaces and correspondingly smaller values to the floor plans with the lower or higher number of spaces. Then, the system checked if there existed a room with an area larger than 21 m2, a room larger than 7 m2 adjacent to the largest room and if the largest room was oriented to the south. It was assumed that the southerly direction was on one of the long sides of the building. In the last step (REQ5, Figure 7) the solutions were evaluated using a linear function f(x) = −1/5x + 6/5 for x >= 1, and f(x) = 1 for x = 0, where x is the number of spaces with an area smaller than 2 m2. The maximum value was given to the plans with only one or no such small spaces. The greater the number of such spaces, the lower the evaluation of the solution. The plans with six or more small spaces were given a value of zero.
In Figure 8, there is a startup floor plan (I1) and three others obtained during the evolution (I2, I3, I4) with the highest possible value of the fitness function (F(I) = 3.1).
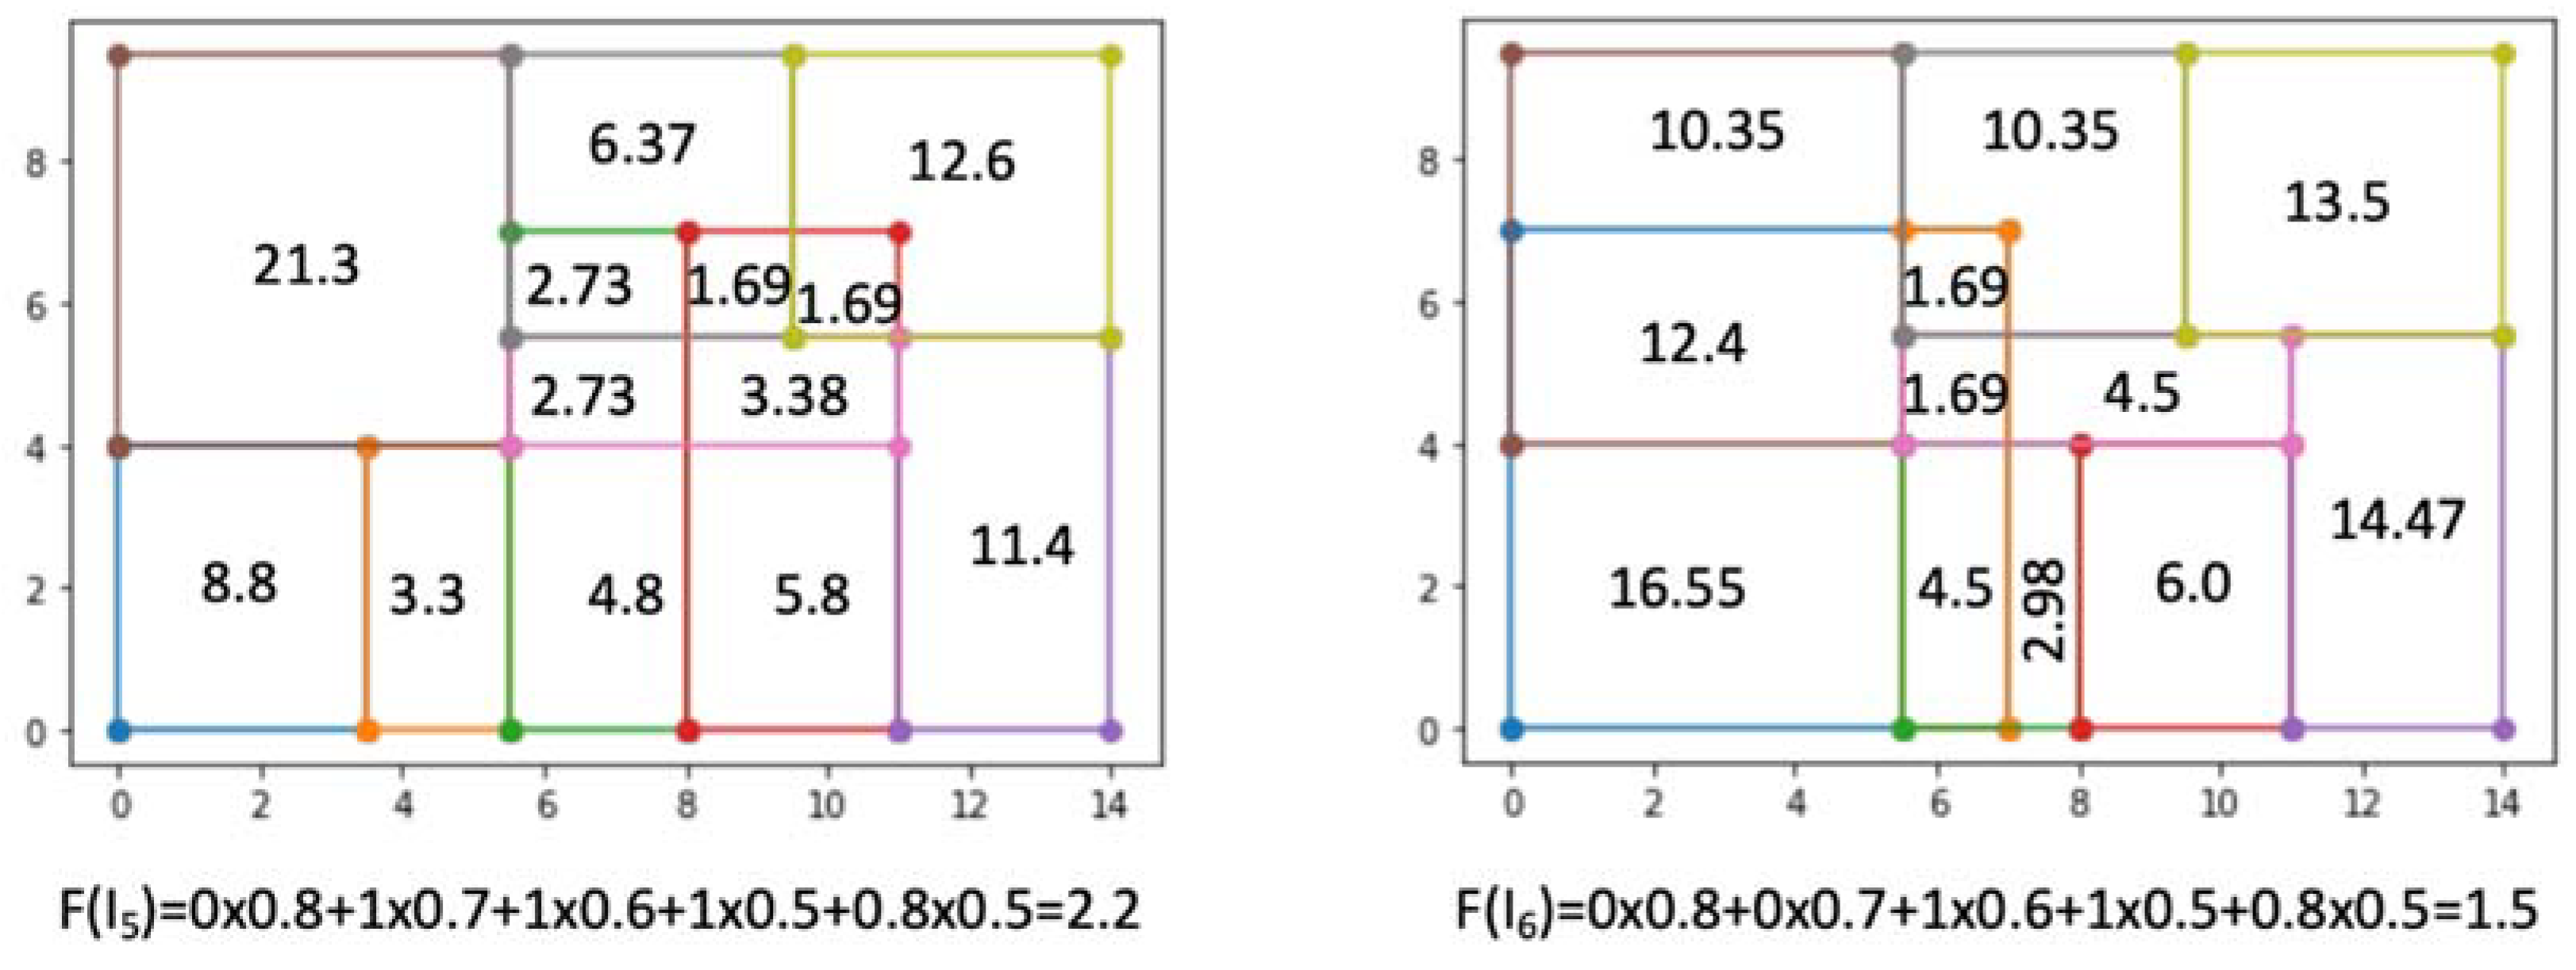
In Figure 9, there are two quite different floor plans that have very similar fitness values. Only one requirement, namely REQ2 (the largest room size), was evaluated differently and took the value of 1 for I5 and 0 for I6. The large number of spaces made Req1 equal to zero. Both plans had two spaces with areas lower than 2 m2, and therefore, Req5 had a value of 0.8. Thanks to this approach, we could achieve very large diversity in a highly adapted population of individuals. It is also worth stressing that both presented solutions were generated by a single application of the moving mutation to the start-up solution I1 (Figure 8). Thus, a considerable variety of individuals was already noticeable in the first generations.
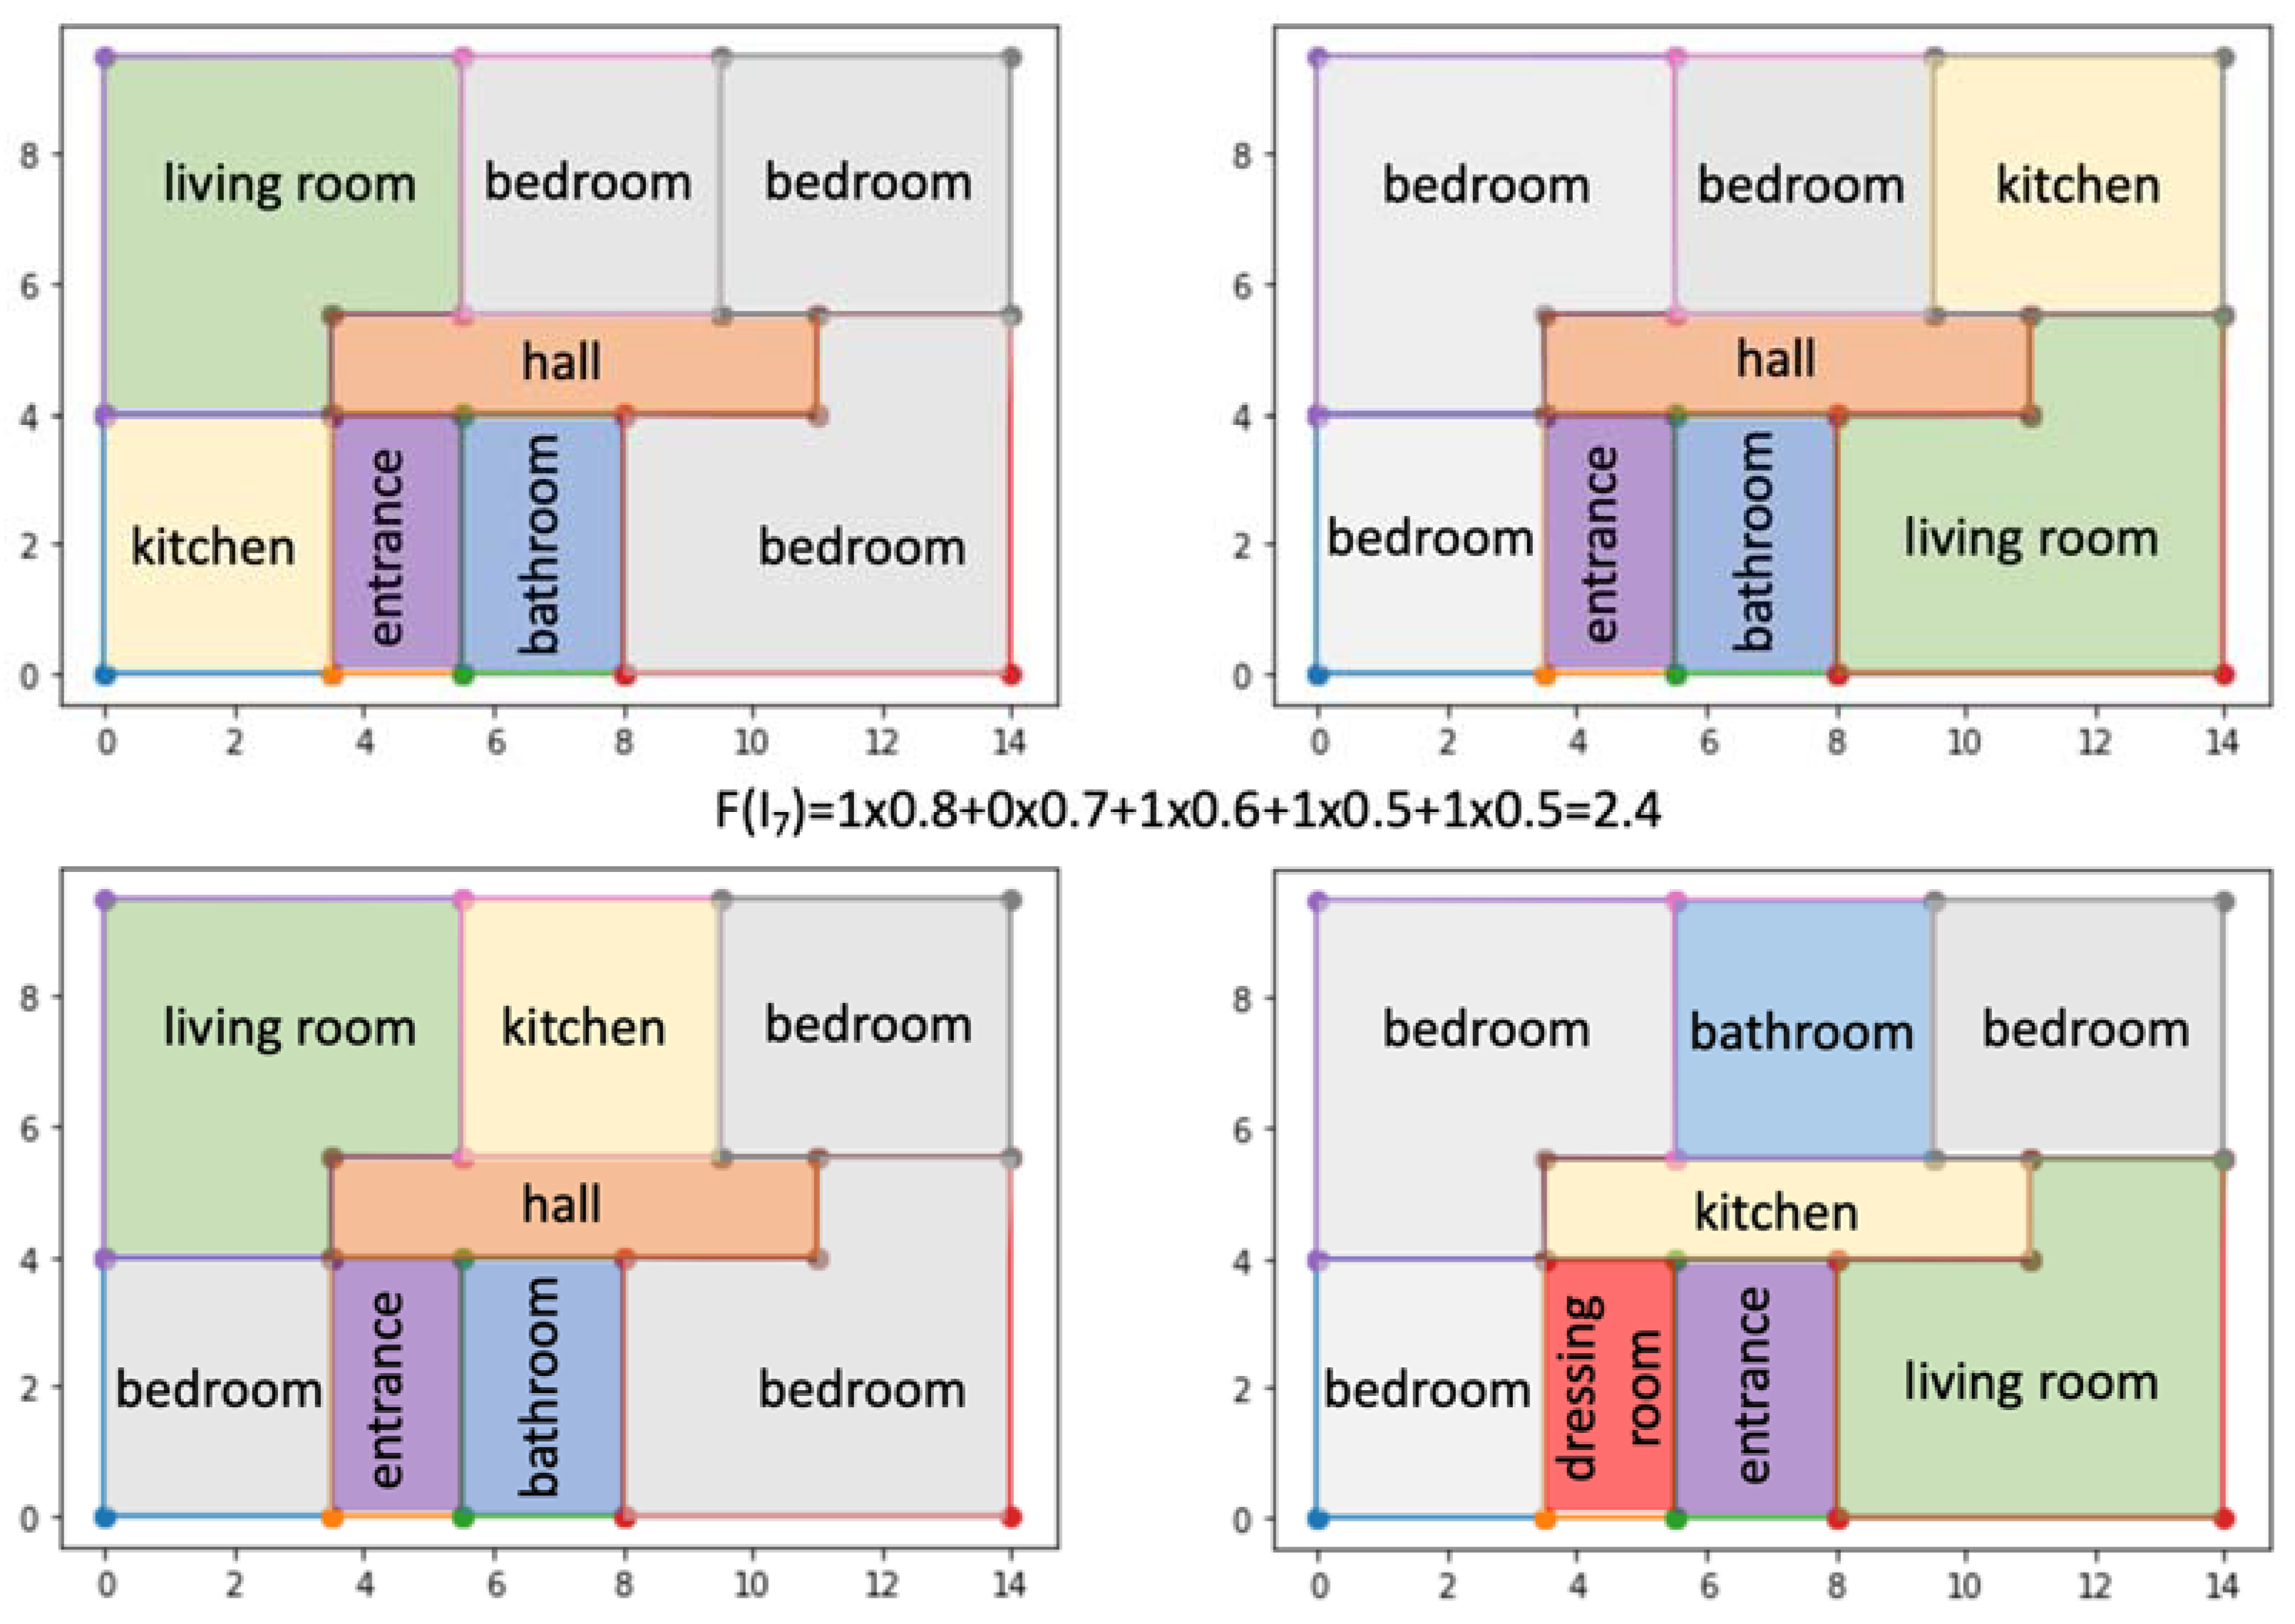
In Figure 10, two different floor plans that were very similar and were similarly evaluated are presented. Only one requirement, this time REQ1 (the number of spaces), was evaluated differently and had values of 1 for I7 and 0.67 for I8. In this case, the fitness value was in line with our intuition. The better evaluated individual I7 was more flexible and gave more freedom in assigning labels for determining the functions of spaces. Some of the possible assignments are presented in Figure 11. The possible assignments of space labels were created for floor layouts selected by the designer. He or she could also select the evaluation threshold value from 0 to 3.1 or the number of solutions to be presented on the screen.
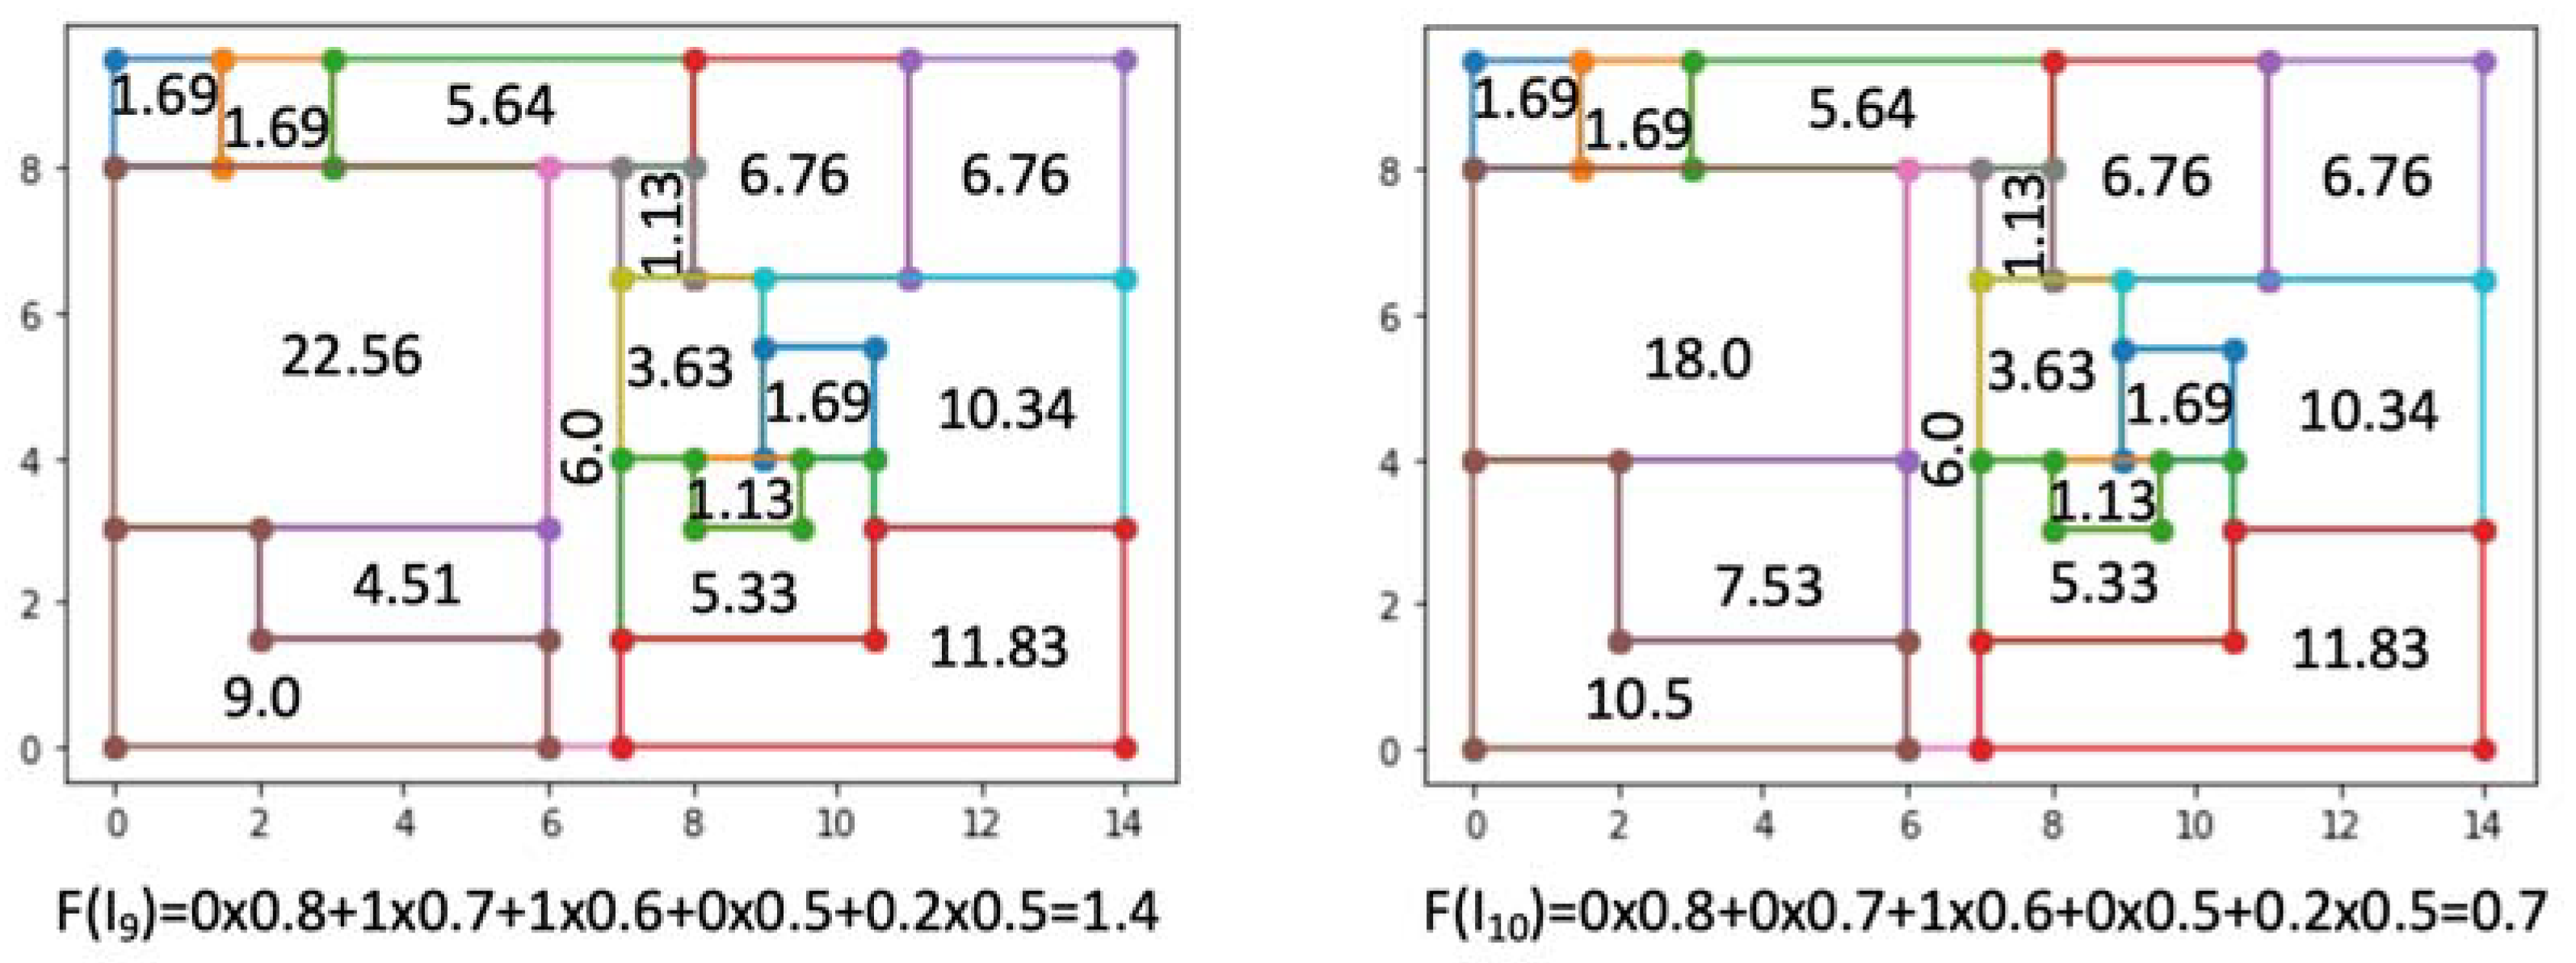
In Figure 12, two low-rated example layouts are presented, namely I9 and I10. Both arrangements qwre very similar: 16 spaces (Req1 = 0), a room larger than 7 m2 adjacent to the largest room (Req3 = 1), the largest room not being oriented toward the south (which was on one of the long sides of the building (Req4 = 0)) and 5 spaces with areas less than 2 m2 (Req5 = 0.2). However, there was one difference that had a huge impact on the individual fitness value: the fulfillment of the second requirement (REQ2) stating that the largest room should be bigger than 21 m2. This requirement was met by the solution I9, and taking into account the assigned importance coefficient (0.7), it yielded a solution twice the value of the fitness of the solution I10. This is a good example of how sensitive the results were to the values assigned to the coefficients used while blending requirement fulfillment.
4. Discussion
In the current research described in this paper, the floor plans were represented as real-valued point sequences, where points determined the locations of the wall endpoints. Thus, the mutation operations which added, moved or removed points changed the numbers, sizes and even shapes of the rooms. The solutions with L-shaped or T-shaped rooms could be obtained; however, the generation of semicircular walls was not considered.
The presented EP-based approach allows for the quick generation of many potential solutions, which are evaluated according to the given design criteria specified by the user. The system can automatically label the generated spaces, giving them functions like the bathroom, kitchen, living room or bedroom. However, this assignment of labels should be treated only as a proposition, and the final labeling should be left to the designer. He or she can also make some corrections in the layout and specify accessibility relation between spaces by adding door icons.
There can be many design constraints defined in the domain knowledge, the use of which influences the shape of the solution. For example, in our approach, we eliminated solutions with very narrow spaces, as we did not allow walls shorter than 0.8 m. Changing this parameter would affect the size of the obtained plan spaces. The solutions with very small spaces could be shown to the designer, who could then modify the walls him or herself.
In our framework, the style-related knowledge of the designer can also be used. The user can express design requirements related to styles like the presence of some characteristic features, such as symmetry of the plan, sizes and proportions of rooms, and assign to them specified weights. Then, the system will evaluate the generated solutions, taking into account the degree of their maintaining the given style. The presence of the predefined style features in generated designs can be a source of design inspiration and make designers creatively reuse interesting design details.
In order to properly assess the effectiveness of the proposed EP algorithm, a series of experiments should be carried out in the next step. First of all, we have to consider a mutation operator: the exploration–exploitation trade-off. So far, a non-adaptive static approach has been used, where the strategy parameters (probabilities of the proposed mutation operators) remain fixed. In future research, we will consider both dynamic and self-adaptive EP. In the dynamic approach, a deterministic function is used to change the parameters over time. In self-adaptive EP, parameters are learned in parallel with the evolution of individuals. Secondly, different selection operators will be applied (proportional, tournament, elitism, etc.) to find the best strategy for indicating the individuals that will survive.
Another issue that should be considered is the selection of weights for the requirements. In the current research, they are set by the designer based on their knowledge and experience, as well as the importance given to the requirements by the customer. Such an approach may result in giving too much importance to some requirements. Thus, it seems that modifying the importance coefficients over the evolution process could address this problem.
At this moment, some of the requirements have a binary form; that is, they are either satisfied or not. As a result, a very small difference in the design can have huge impact on the computed fitness value. A good example of this problem can be observed in Figure 12, where the difference in fitness resulted from the lack of a space larger than 21 m2, thus not satisfying one of the binary requirements with a weight of 0.7. Therefore, even the presence of a space having 20.99 m2 would result in a low evaluation, while a very large room of, for example, 50 m2 would yield a much higher value. Yet, it is very likely that the user might prefer the former over the later. The solution to this problem may be the use of a fuzzy function to evaluate the degree of satisfying a given requirement, which is not a hard one. In order to take into account the individual preferences of the designer, the metaevolution can be implemented, which would better fit the fuzzy membership functions determining the degree of fulfillment of the requirements. Using the possibilities offered by the evolutionary programming, together with the strategy parameters, different shapes of the fuzzy functions can be evolved and examined.
5. Conclusions
In this paper, the evolutionary technique is proposed as a method for generating new design solutions, with genotypes represented in the form of numerical vectors. The proposed original representation is simple but, at the same time, intuitive, and it has great expressive power. The real-valued points denote the endpoints of room walls, and the application of the flood fill algorithm determines the connected areas that constitute a room. As shown in the case study, three specified mutation operators, namely adding a new point, deleting a point and moving a point, already introduce a great variety of solutions in the first generations. Thus, a large area of the search space is covered in a relatively short generation time. This is a very promising indicator for our main goal of building an efficient tool for the conceptual stage of design. Additionally, the indicated properties of the proposed evaluation approach of the generated solutions are highly promising (like promoting flexible solutions (Figure 10) or the possibility of fuzzy parameter adjustment using metaevolution).
Author Contributions
Conceptualization and methodology, K.G.-K., B.S. and G.Ś.; software and visualization, K.G.-K.; validation, B.S. and G.Ś.; writing—original draft preparation, review and editing, K.G.-K., B.S. and G.Ś. All authors have read and agreed to the published version of the manuscript.
Funding
This research received no external funding.
Institutional Review Board Statement
Not applicable.
Informed Consent Statement
Not applicable.
Data Availability Statement
The study does not report any data.
Conflicts of Interest
The authors declare no conflict of interest. The funders had no role in the design of the study; in the collection, analyses, or interpretation of data; in the writing of the manuscript, or in the decision to publish the results.
References
- Eppstein, D.; Mumford, E.E.; Speckmann, B.; Verbeek, K.K. Area-Universal and Constrained Rectangular Layouts. SIAM J. Comput. 2012, 41, 537–564. [Google Scholar] [CrossRef] [Green Version]
- Wang, X.-Y.; Yang, Y.; Zhang, K. Customization and generation of floor plans based on graph transformations. Autom. Constr. 2018, 94, 405–416. [Google Scholar] [CrossRef]
- Upasani, N.; Shekhawat, K.; Sachdeva, G. Automated generation of dimensioned rectangular floorplans. Autom. Constr. 2020, 113, 103149. [Google Scholar] [CrossRef] [Green Version]
- Grabska, E.; Łachwa, A.; Ślusarczyk, G. New visual languages supporting design of multi-storey buildings. Adv. Eng. Inform. 2012, 26, 681–690. [Google Scholar] [CrossRef]
- Ślusarczyk, G. Graph-based representation of design properties in creating building floorplans. Comput. Des. 2018, 95, 24–39. [Google Scholar] [CrossRef]
- Strug, B.; Grabska, E.; Ślusarczyk, G. Supporting the design process with hypergraph genetic operators. Adv. Eng. Inform. 2014, 28, 11–27. [Google Scholar] [CrossRef]
- Harada, M.; Witkin, A.; Baraff, D. Interactive Physically-Based Manipulation of Discrete/Continuous Models. In SIGGRAPH ’95: Proceedings of the 22nd Annual Conference on Computer Graphics and Interactive Techniques; ACM: New York, NY, USA, 1995; pp. 199–208. [Google Scholar]
- Buelinckx, H. Wren’s language of City church designs: A formal generative classification. Environ. Plan. B Plan. Des. 1993, 20, 645–676. [Google Scholar] [CrossRef]
- Koning, H.; Eizenberg, J. The Language of the Prairie: Frank Lloyd Wright’s Prairie Houses. Environ. Plan. B Plan. Des. 1981, 8, 295–323. [Google Scholar] [CrossRef]
- Chiou, S.-C.; Krishnamurti, R. The grammar of Taiwanese traditional vernacular dwellings. Environ. Plan. B Plan. Des. 1995, 22, 689–720. [Google Scholar] [CrossRef]
- Duarte, J.P. A discursive grammar for customizing mass housing: The case of siza’s houses at malagueira. Autom. Constr. 2005, 14, 265–275. [Google Scholar] [CrossRef]
- Grzesiak-Kopec, K.; Ogorzalek, M.J. Intelligent 3D layout design with shape grammars. In Proceedings of the 2013 6th International Conference on Human System Interactions (HSI), Sopot, Poland, 6–8 June 2013; pp. 265–270. [Google Scholar]
- Grabska, E.; Grzesiak-Kopeć, K.; Ślusarczyk, G. Designing Floor-Layouts with the Assistance of Curious Agents. In Proceedings of the Computational Science—ICCS 2006, 6th International Conference, Reading, UK, 28–31 May 2006; Springer Science and Business Media LLC: Berlin/Heidelberg, Germany, 2006; Volume 3993, pp. 883–886. [Google Scholar]
- Krishnamurti, R. Explicit design space? Artif. Intell. Eng. Des. Anal. Manuf. 2006, 20, 95–103. [Google Scholar] [CrossRef]
- Beirão, J. CItyMaker: Designing Grammars for Urban Design; Delft University of Technology: Delft, The Netherlands, 2012. [Google Scholar]
- Merrell, P.; Schkufza, E.; Koltun, V. Computer-generated residential building layouts. ACM Trans. Graph. 2010, 29, 1–12. [Google Scholar] [CrossRef]
- Wu, W.; Fu, X.-M.; Tang, R.; Wang, Y.; Qi, Y.-H.; Liu, L. Data-driven interior plan generation for residential buildings. ACM Trans. Graph. 2019, 38, 1–12. [Google Scholar] [CrossRef] [Green Version]
- Hu, R.; Huang, Z.; Tang, Y.; van Kaick, O.; Zhang, H.; Huang, H. Graph2Plan: Learning Floorplan Generation from Layout Graphs. ACM Trans. Graph. 2020, 39, 1–14. [Google Scholar] [CrossRef]
- Rodrigues, E.; Gaspar, A.R.; Gomes, A. An evolutionary strategy enhanced with a local search technique for the space alloca-tion problem in architecture, part 2: Validation and performance tests. Comput. Aided Des. 2013, 45, 898–910. [Google Scholar] [CrossRef]
- Bao, F.; Yan, D.; Mitra, N.J.; Wonka, P. Generating and exploring good building layouts. ACM Trans. Graph. 2013, 32, 1–10. [Google Scholar] [CrossRef] [Green Version]
- Shi, F.; Soman, R.K.; Han, J.; Whyte, J.K. Addressing adjacency constraints in rectangular floor plans using Monte-Carlo Tree Search. Autom. Constr. 2020, 115, 103187. [Google Scholar] [CrossRef]
- Flemming, U.; Coyone, R.; Gavin, T.; Rychter, M. A Generative Expert System for the Design of Building Layouts—Version 2; Topping, B., Ed.; Artificial Intelligence in Engineering Design; Computational Mechanics: Southampton, UK, 1999; pp. 445–464. [Google Scholar]
- Rocke, D.M.; Michalewicz, Z. Genetic Algorithms + Data Structures = Evolution Programs. J. Am. Stat. Assoc. 2000, 95, 347. [Google Scholar] [CrossRef]
- Bentley, P.J. Generic Evolutionary Design of Solid Objects Using a Genetic Algorithm. Ph.D. Thesis, UCL, London, UK, 1997; pp. 3–38. [Google Scholar]
- Goldberg, D.E. Genetic Algorithms in Search, Optimization and Machine Learning; Addison-Wesley: Reading, MA, USA, 1989. [Google Scholar]
- Holland, J.H. Genetic Algorithms and Adaptation. In Adaptive Control of Ill-Defined Systems; Springer: Boston, MA, USA, 1984; pp. 317–333. [Google Scholar]
- Łachwa, A.; Grabska, E.; Ślusarczyk, G. Approximated Reasoning and Fuzzy Evaluation in a Design System. In Proceedings of the 20th International Workshop: Intelligent Computing in Engineering 2013, Vienna, Austria, 1–3 July 2013. [Google Scholar]
- Hoffman, C.M. Geometric and Solid Modeling: An Introduction; Morgan Kaufmann: San Francisco, CA, USA, 1989. [Google Scholar]
- Mantyla, M. An Introduction to Solid Modeling; Computer Science Press: Rockville, MD, USA, 1988. [Google Scholar]
- Martin, R.R.; Stephenson, P.C. Sweeping of Three-dimensional Objects. Comput. Aided Des. 1990, 22, 223–234. [Google Scholar] [CrossRef] [Green Version]
- Slyadnev, S.; Malyshev, A.; Voevodin, A.; Turlapov, V. On the Role of Graph Theory Apparatus in a CAD Modeling Kernel. In Proceedings of the 30th International Conference on Computer Graphics and Machine Vision (GraphiCon 2020), St. Petersburg, Russia, 22–25 September 2020. [Google Scholar]
- Ansaldi, S.; Floriani, L.D.; Folcidieno, B. Geometric Modeling for Solid Objects by Using a Face Adjacency Representation. ACM/SIGGRAPH Comput. Graph. 1985, 19, 131–139. [Google Scholar] [CrossRef]
- Liu, H.; Tang, M. Evolutionary design in a multi-agent design environment. Appl. Soft Comput. 2006, 6, 207–220. [Google Scholar] [CrossRef]
- Fogel, L.J.; Owens, A.J.; Walsh, M.J. Artificial Intelligence through Simulated Evolution; John Wiley & Sons: Hoboken, NJ, USA, 1966. [Google Scholar]
- Henrich, D. Space-efficient region filling in raster graphics. Vis. Comput. 1994, 10, 205–215. [Google Scholar] [CrossRef] [Green Version]
- Myung, H.; Kim, J.-H. Lagrangian-based evolutionary programming for constrained optimization. In Lecture Notes in Computer Science; Springer Science and Business Media LLC: Berlin/Heidelberg, Germany, 1997; pp. 35–44. [Google Scholar]
- Grzesiak-Kopeć, K.; Oramus, P.; Ogorzałek, M. Hypergraphs and extremal optimization in 3D integrated circuit design automation. Adv. Eng. Inform. 2017, 33, 491–501. [Google Scholar] [CrossRef]
Figure 1.
Visual Floor Plan Generation (VFPG) framework.

Figure 2.
The pseudocode of the proposed EP algorithm.

Figure 3.
The example floor plan, its sketch with marked points and EP representation.

Figure 4.
Adding a new point mutation example (A) on the existing wall and (B) inside a room.

Figure 5.
Deleting a point mutation. (A) Selected point. (B) Three possible realizations.

Figure 6.
Moving a point mutation. (A) Selected point. (B) Three possible realizations.

Figure 7.
Requirement (REQ1 and REQ5) evaluation functions.

Figure 8.
Four example floor plans I1, I2, I3 and I4 with the highest fitness value, equal to 3.1.

Figure 9.
Two example floor plans I5 and I6 where only REQ2 had a different evaluation value.

Figure 10.
Two example floor plans I7 and I8 where only REQ1 had a different evaluation value.

Figure 11.
Four different assignments of labels determining the functions for a single floor plan I7 from Figure 10.
Figure 11.
Four different assignments of labels determining the functions for a single floor plan I7 from Figure 10.

Figure 12.
Two very similar and low-rated example floor plans I9 and I10 where only REQ2 had a different evaluation value.
Figure 12.
Two very similar and low-rated example floor plans I9 and I10 where only REQ2 had a different evaluation value.

Publisher’s Note: MDPI stays neutral with regard to jurisdictional claims in published maps and institutional affiliations. |
© 2021 by the authors. Licensee MDPI, Basel, Switzerland. This article is an open access article distributed under the terms and conditions of the Creative Commons Attribution (CC BY) license (https://creativecommons.org/licenses/by/4.0/).
Share and Cite
MDPI and ACS Style
Grzesiak-Kopeć, K.; Strug, B.; Ślusarczyk, G. Evolutionary Methods in House Floor Plan Design. Appl. Sci. 2021, 11, 8229. https://doi.org/10.3390/app11178229
AMA Style
Grzesiak-Kopeć K, Strug B, Ślusarczyk G. Evolutionary Methods in House Floor Plan Design. Applied Sciences. 2021; 11(17):8229. https://doi.org/10.3390/app11178229
Chicago/Turabian StyleGrzesiak-Kopeć, Katarzyna, Barbara Strug, and Grażyna Ślusarczyk. 2021. "Evolutionary Methods in House Floor Plan Design" Applied Sciences 11, no. 17: 8229. https://doi.org/10.3390/app11178229
Note that from the first issue of 2016, this journal uses article numbers instead of page numbers. See further details here.