
pH Measurement of Cement-Based Materials: The Effect of Particle Size
by
 , ,
, ,
Poh Yee Loh
1 ,
,
Payam Shafigh
1,*,
Herda Yati Binti Katman
2,*,
Zainah Ibrahim
3 and
Sumra Yousuf
4 1
Centre for Building, Construction & Tropical Architecture (BuCTA), Faculty of Built Environment, Universiti Malaya, Kuala Lumpur 50603, Malaysia
2
Department of Civil Engineering, University Tenaga Nasional, Kajang 43000, Malaysia
3
Department of Civil Engineering, Faculty of Engineering, Universiti Malaya, Kuala Lumpur 50603, Malaysia
4
Department of Building and Architectural Engineering, Faculty of Engineering & Technology, Bahauddin Zakariya University, Multan 60000, Pakistan
*
Authors to whom correspondence should be addressed.
Appl. Sci. 2021, 11(17), 8000; https://doi.org/10.3390/app11178000
Submission received: 16 June 2021
/
Revised: 25 July 2021
/
Accepted: 1 August 2021
/
Published: 29 August 2021
(This article belongs to the Special Issue Advanced Structural Health Monitoring: From Theory to Applications)
Abstract
:Healthy reinforced concrete should be highly alkaline to safeguard the passive protective film for reinforcement of steel bars against corrosion. pH measurement is gaining importance in research of cement-based materials (CBMs), such as paste, mortar and concrete, as well as in structural health monitoring and forensic engineering applications. However, insufficient information is available regarding the most practical, economical and applicable quantitative pH measurement method for CBMs from the sampling to measurement stage. Existing recommended methods for measuring pH have many variables that need to be investigated to determine how they influence the pH value. Samples were recommended to be ground into very fine particles for pH measurement. Preparing very fine particles of CBMs is costly and time consuming, while larger particles, with sizes similar to sand particles, are easier to obtain, without needing special equipment. This study aims to investigate the effect of different particle sizes on the pH of cement mortar. Mortar specimens were crushed and sieved to obtain different ranges of particle sizes to measure the pH values. Results showed that specimens with large particle sizes (between 600 µm and 4.75 mm) can produce similar results to specimens with very fine particle sizes (<600 µm) by increasing the solid-to-solvent ratio or the leaching time.
1. Introduction
Calcium silicates (C3S and C2S) are the main cementitious compounds in cement. The hydration and hydrolysis of calcium silicates produces calcium hydroxide (Ca(OH)2 or CH) [1]. About 25% of the structural component of cement paste is CH, which increases the pH of cement-based materials (CBMs) to more than 12 [2]. The high pH of concrete will enable the formation of a passive protective film on the embedded steel. This thin oxide layer formed on the steel can prevent the metal atoms from dissolving and reduce the corrosion rate to an insignificant level [3]. However, carbonation, CH leaching, or the presence of ion chloride reduces the amount of CH and other alkalis in concrete [4]. When the pH of concrete is reduced to less than 11.5, the passive protective film for the embedded steel will be unstable and the steel will be corroded at the rate of at least 1000 times higher [3,4,5]. Phenolphthalein solution is typically used as an indicator to test the depth of carbonation from the concrete surface because it changes from pink to colourless when the pH is less than 9.5 [6]. However, this method is not accurate enough to evaluate the durability of reinforced concrete, where the pH near the embedded steel is more than 11.5 [4,5]. A more accurate pH measurement method is needed to evaluate the durability performance of concrete materials, particularly for concrete containing supplementary cementitious materials (SCMs). Gruyaert et al. [7] reported that concrete containing SCMs is more vulnerable to carbonation than ordinary Portland cement concrete. Sanjuán et al. [8] also reported that mortars and concretes made of ground granulated blast-furnace slag (GGBFS) cement exhibited higher carbonation rates, particularly when they were poorly cured and had high GGBFS content.
Researchers have investigated the pH of CBMs for different purposes. Most studies are related to the passive protective film of embedded steel bars and aim to compare the pH among different CBM mixtures [9,10,11], to monitor the pH profiles over time [12] and at different depths [6,13,14,15], to determine the rates of pH changes [16] and the pH profiles of CBMs due to early carbonation curing [15,17]. Meanwhile, Kakade [18], and Räsänen and Penttala [19] measured the pH of a concrete surface for floor covering purposes. Alonso et al. [20] analysed methods for pH measurement for low-pH CBMs (pH about 11) used in a geological repository.
Few studies have used pH testing and phenolphthalein testing and determined their relation. Zhang and Shao [15] conducted phenolphthalein and pH measurement tests at different depths of the concrete surface at days 1 and 28 of different concrete mixtures, when the concrete samples were under early carbonation curing. At day 1, the pH test results at a carbonation depth of 10–25 mm showed higher variance than those at other depths of 0–10 and 25–50 mm. However, at day 28, no carbonation was found on the samples by using the phenolphthalein test, consistent with the pH test. The author suggested that this finding may be due to the existence of transition zones. McPolin [6] measured the apparent pH (not true pH) value of different carbonated concrete mixtures at different depths of the concrete surface. The measurements were conducted weekly, for a period of 6 weeks. At the 6th week, a phenolphthalein test was carried out to identify the average carbonation depth. The results showed that, at the average carbonated depth measured by phenolphthalein, the apparent pH value was within 11.3–11.7.
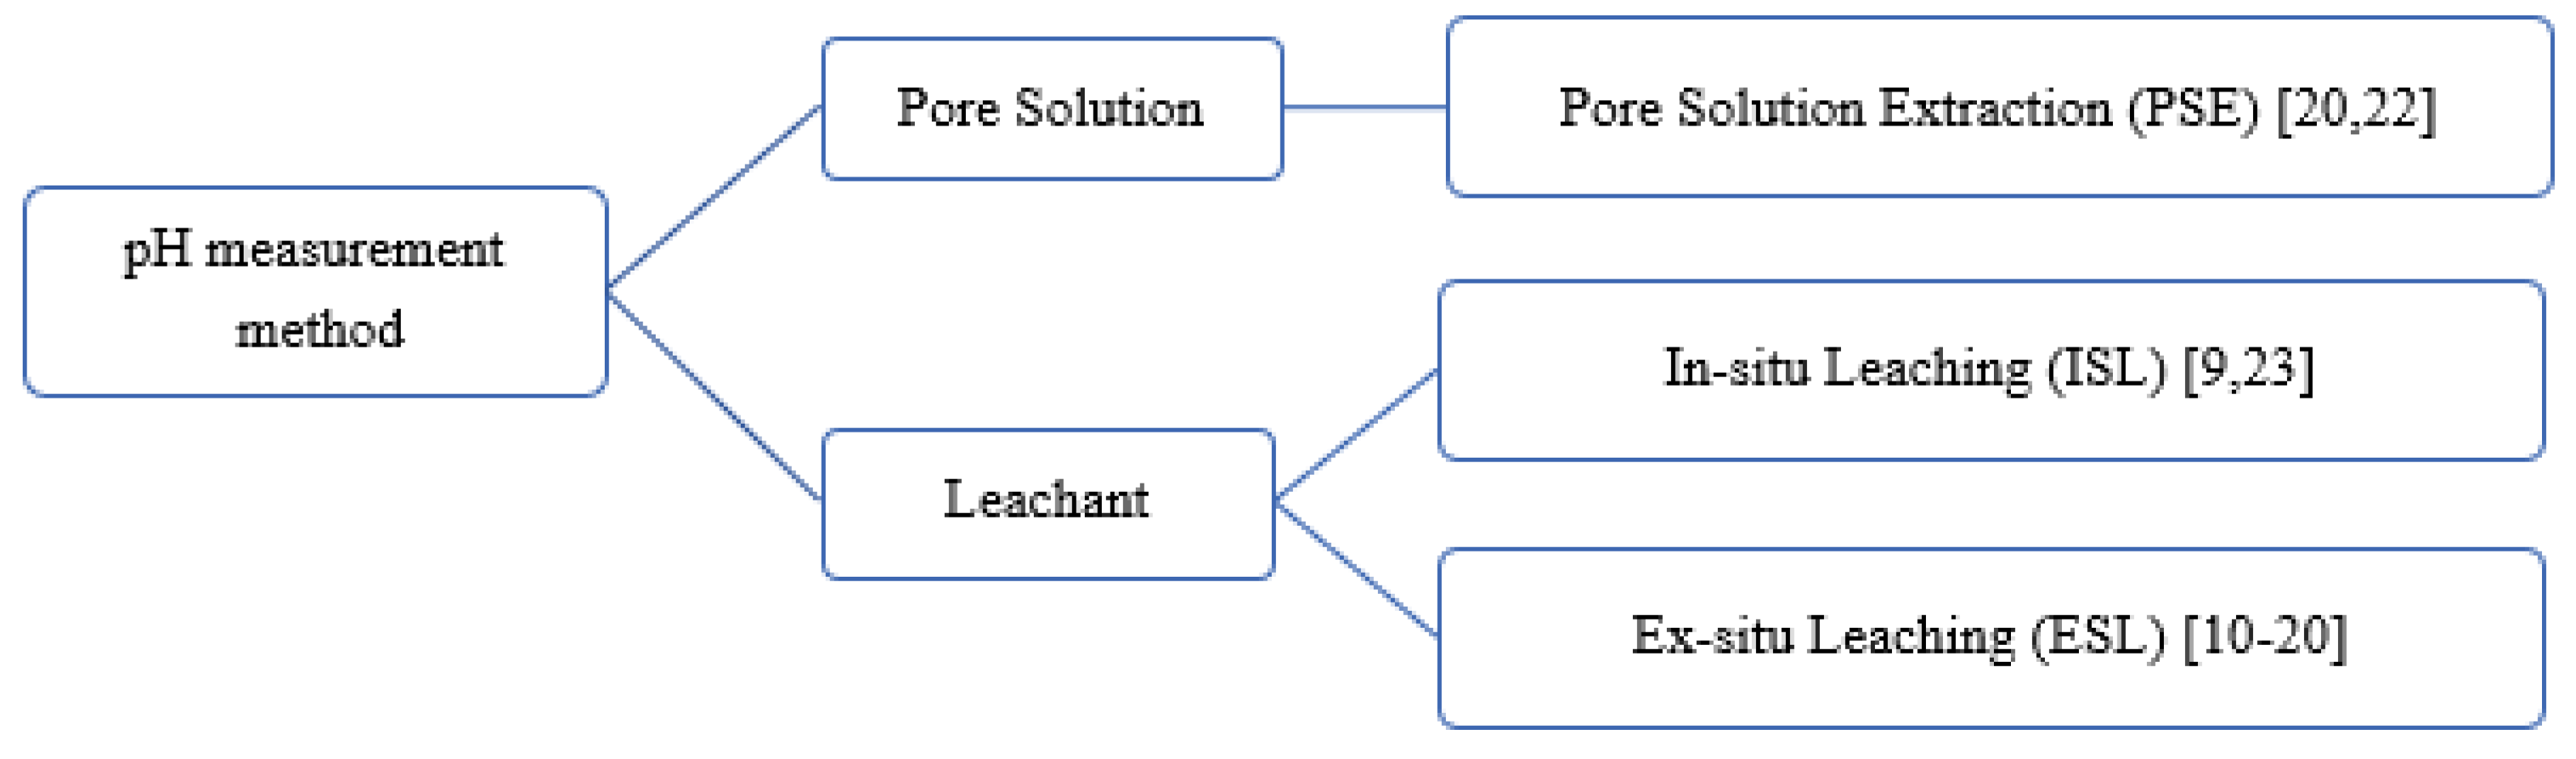
Behnood et al. [21] stated the lack of standardisation for pH measurement for concrete and urged the development of a profoundly reproducible and repeatable standard method for fresh and hardened concrete. Researchers typically applied their own consistent measurement methods across different samples for pH comparison (Figure 1). Pore solution extraction (PSE) method described in Barneyback and Diamond [22] is commonly referred by researches to extract pore solution from the CBMs for further analysis. Sagüés et al. [23] introduced in-situ leaching (ISL) method while ESL is the most widely applied method for pH measurement for CBMs. Each method has its advantages and disadvantages. However, there are insufficient studies about variables affecting each measurement method.
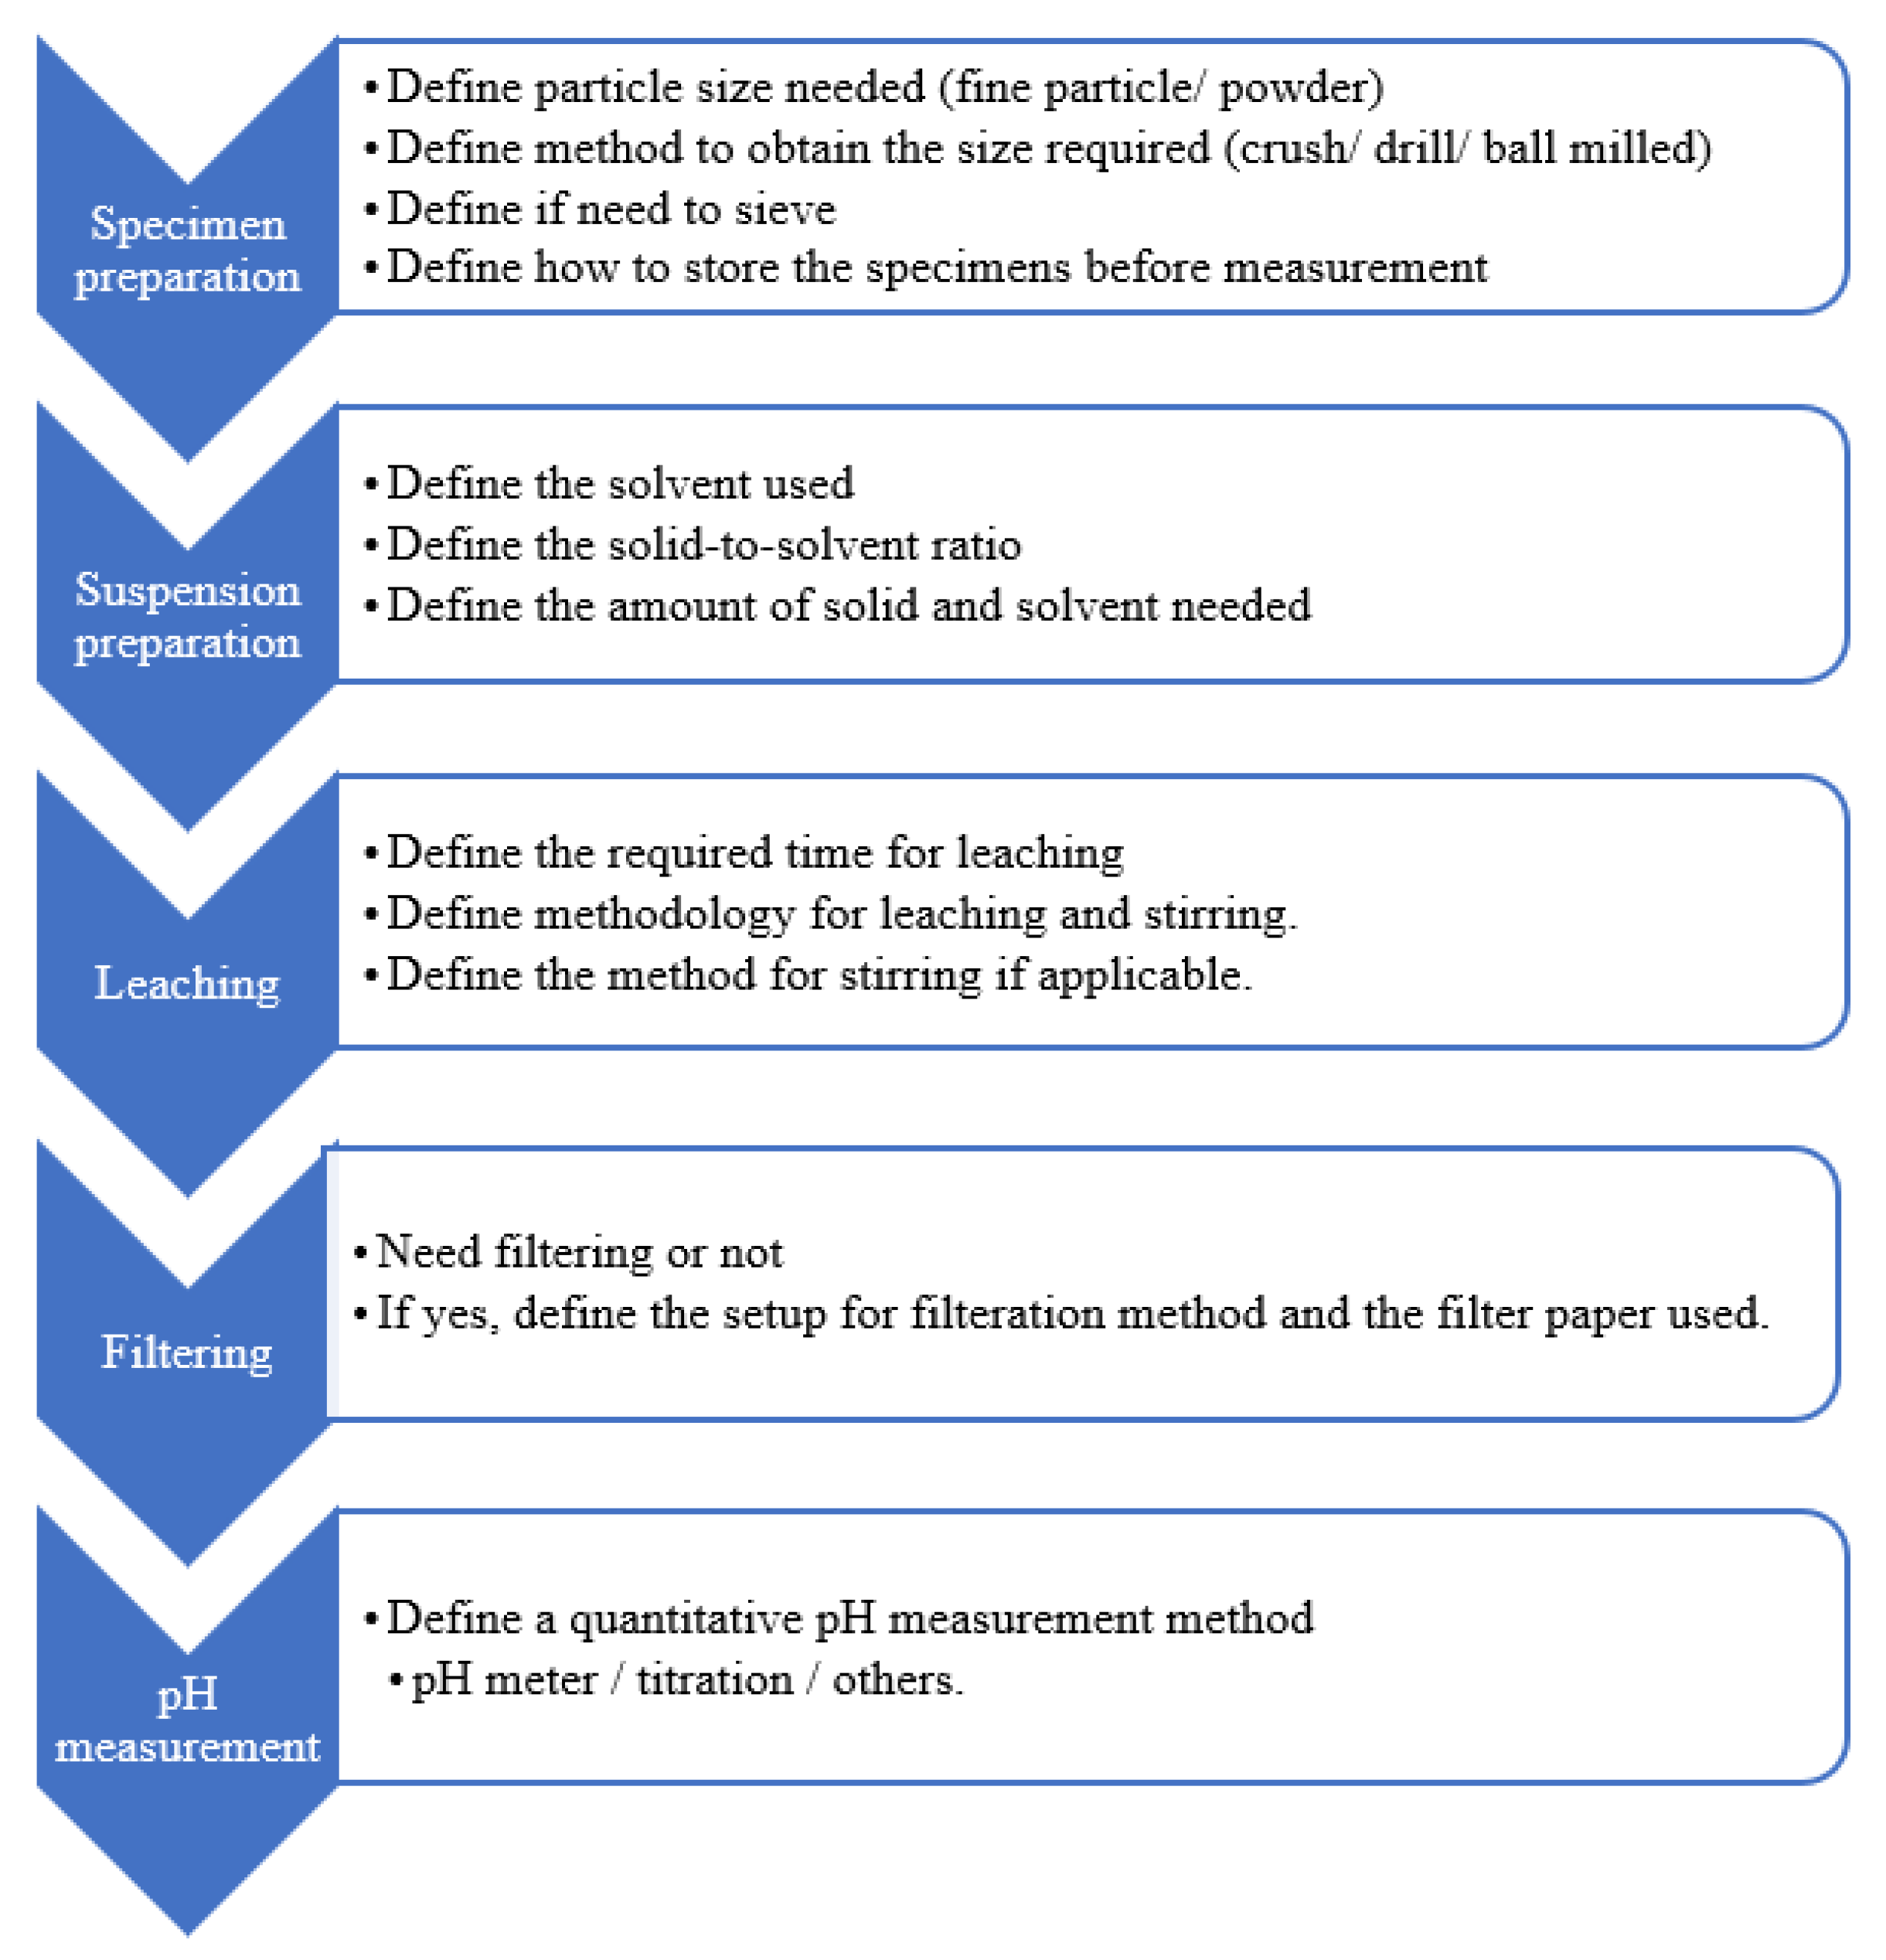
Among different pH measurement methods, the ex-situ leaching (ESL) method is economic and simple [24]. ESL has good repeatability and reproducibility [20,25]. Figure 2 illustrates the steps and considerations for each stage of the ESL method; these parameters are inconsistent among researchers, varying from specimen preparation to measurement. Given the lack of a standardised method for ESL, experimental errors may occur due to the wrong selection of variables. As shown in this figure, the first step of measuring pH is to prepare fine particle sizes from the specimens. Table 1 lists the particle sizes used by different researchers [13,19,25,26] in their pH measurement.
Pavlík [26] measured the concentration of OH− ions (in mmol/L) for cement paste to calculate pH. The equation of pH = 14 + log[OH] was used in his study. The results showed that smaller particle sizes had a higher OH− concentration, indicating a higher pH value (more alkaline). Räsänen and Penttala [19] tested concrete from blended cement with a solid-to-solvent ratio of 1:1, while Grubb et al. [13] tested concrete samples without fly ash, with a solid-to-solvent ratio of 1:2.
Table 2 shows the pH values of concrete in two different studies when different particle sizes were used. Specimens with bigger particle sizes had lower pH. Therefore, fine particles should be used for a more accurate measurement of pH [19]. However, preparing specimens into very fine particles requires more energy and time, compared with using bigger particle sizes.
Pavlík [26] reported that the effect of the particle size of Portland cement paste with a high solid-to-solvent ratio of 1:1 is relatively smaller than those with the ratios of 1:2, 1:5 and 1:50.
This study selected the ESL method to standardise a quantitative pH measurement method for CBMs to cover a wider pH range than phenolphthalein measurement. This work aims to determine the effects of using different particle sizes on the pH value of cement mortar and understand the possibility of using large particles (within the range of standard sand particle sizes) instead of using very fine particles for pH measurement. Similar studies were conducted on concrete and paste materials [13,19,25,26], and the results revealed that large particles had lower pH than very fine particles. Therefore, very fine particle sizes should be used to measure pH in the ESL method. No study has investigated the possibility of using large particles in pH measurement if very fine particles are not available. The use of large particles can benefit researchers and engineers with limited resources for making specimens in powdered form (very fine particle size). In addition, considering that the preparation of samples with large particle sizes is simpler, the time and cost of testing will be reduced.
2. Research Methodology
2.1. Materials
Low-porosity cement mortar with a cement to sand (c/s) ratio of 1:3 was prepared [30]. For a good workable mortar, a w/c ratio of 0.55 was applied. Ordinary Portland Cement (OPC) Type I (Tasek Corporation Berhad, Ipoh, Malaysia according to MS522 specification), local mining sand with a maximum grain size of 4.75 mm in saturated-surface-dry (SSD) condition and normal tap water from the pipeline were used. The fresh mortar, with a flow table test result of 220 mm, was cast in 50 mm cubes, and vibrated in two layers on a vibration table. The specimens were demoulded one day after casting and submerged in normal tap water until the time of testing (the age of specimens was 398 days at the time of testing). The average value of the compressive strength for the mortar sample was 55.7 MPa.
2.2. pH Meter Selection and Other Instruments
The main components of pH meter are an electrochemical system (a pH sensor and a reference electrode), a high input impedance meter (which processes the voltage difference in DC millivolt and displays them in mV or pH) and a temperature sensor. The reference electrode provides stable and constant reference voltage but is completely insensitive to the measured fluid. The junction of the reference electrode may be contaminated under adverse condition, such as high temperature, high pressure, high acidity and high basicity. An under-performing reference electrode can cause the pH reading to drift. Therefore, the reference electrode should be used carefully, according to the supplier’s recommendation, and/or a double-junction electrode should be selected, instead of a single-junction electrode, to minimise contamination
The quality of electrodes degrades overtime depending on usage and maintenance, as evident in response time, slope and offset of the pH electrode. Response time refers to the time taken to obtain a stable reading. In theory, a perfect pH electrode reads 0 mV at pH 7 buffer at 25 °C, with a slope of 59.16 mV/pH. For a clean, correctly calibrated, and in good condition electrode, at 25 °C, the slope shall be within 92% to 110%, where 100% is 59.16 mV/pH, while the offset shall be ±30 mV [31]. Before the test, calibration was performed with at least one to five standard buffer solutions, depending on the capability of the pH meter.
The suspension of CBMs consists of hard and sharp particles. The pH measurement was carried out in filtered aqueous solutions to protect the pH-sensitive glass sensor from physical damage. The Hanna Instrument [32] recommends the use of plastic beakers to minimise any EMC interferences during the measurement.
This experiment used the Hanna edge® pH HI2002 and Hanna digital pH electrode HI11310, with a resolution of 0.01 pH and accuracy of ±0.01 pH. The instrument has an automatic temperature compensation feature between −5 °C and 100 °C because of its built-in temperature sensor. This double-junction electrode has a 9.5 mm spherical tip.
2.3. Experimental Procedure
Test cubes were left to surface dry for about 15 min and crushed into pieces that could pass through sieve mesh no. 4 (4.75 mm). Throughout the test, CO2 contamination on the specimens was minimised by keeping a distance from the operator’s exhalation or other sources [23]. Wang et al. [25] reported insignificant pH difference (standard deviation of ±0.03) among paste powder samples exposed to air for 0, 1, 5, 10, 20, 30, 60 and 120 min before mixing with deionised water. The specimens and liquid used were maintained at room temperature throughout the test. The specimens for pH measurement were sieved to obtain at least 50 g for each category as shown below:
- (1)
- Mesh no. 8—to obtain particle size between 2.36 and 4.75 mm diameter;
- (2)
- Mesh no. 16—to obtain particle size between 1.18 and 2.36 mm diameter;
- (3)
- Mesh no. 30—to obtain particle size between 600 µm and 1.18 mm diameter;
- (4)
- Mesh no. 50—to obtain particle size between 300 and 600 µm diameter;
- (5)
- Mesh no. 100—to obtain particle size between 150 and 300 µm diameter;
- (6)
- Base tray—to obtain particle size between less than 150 µm diameter.
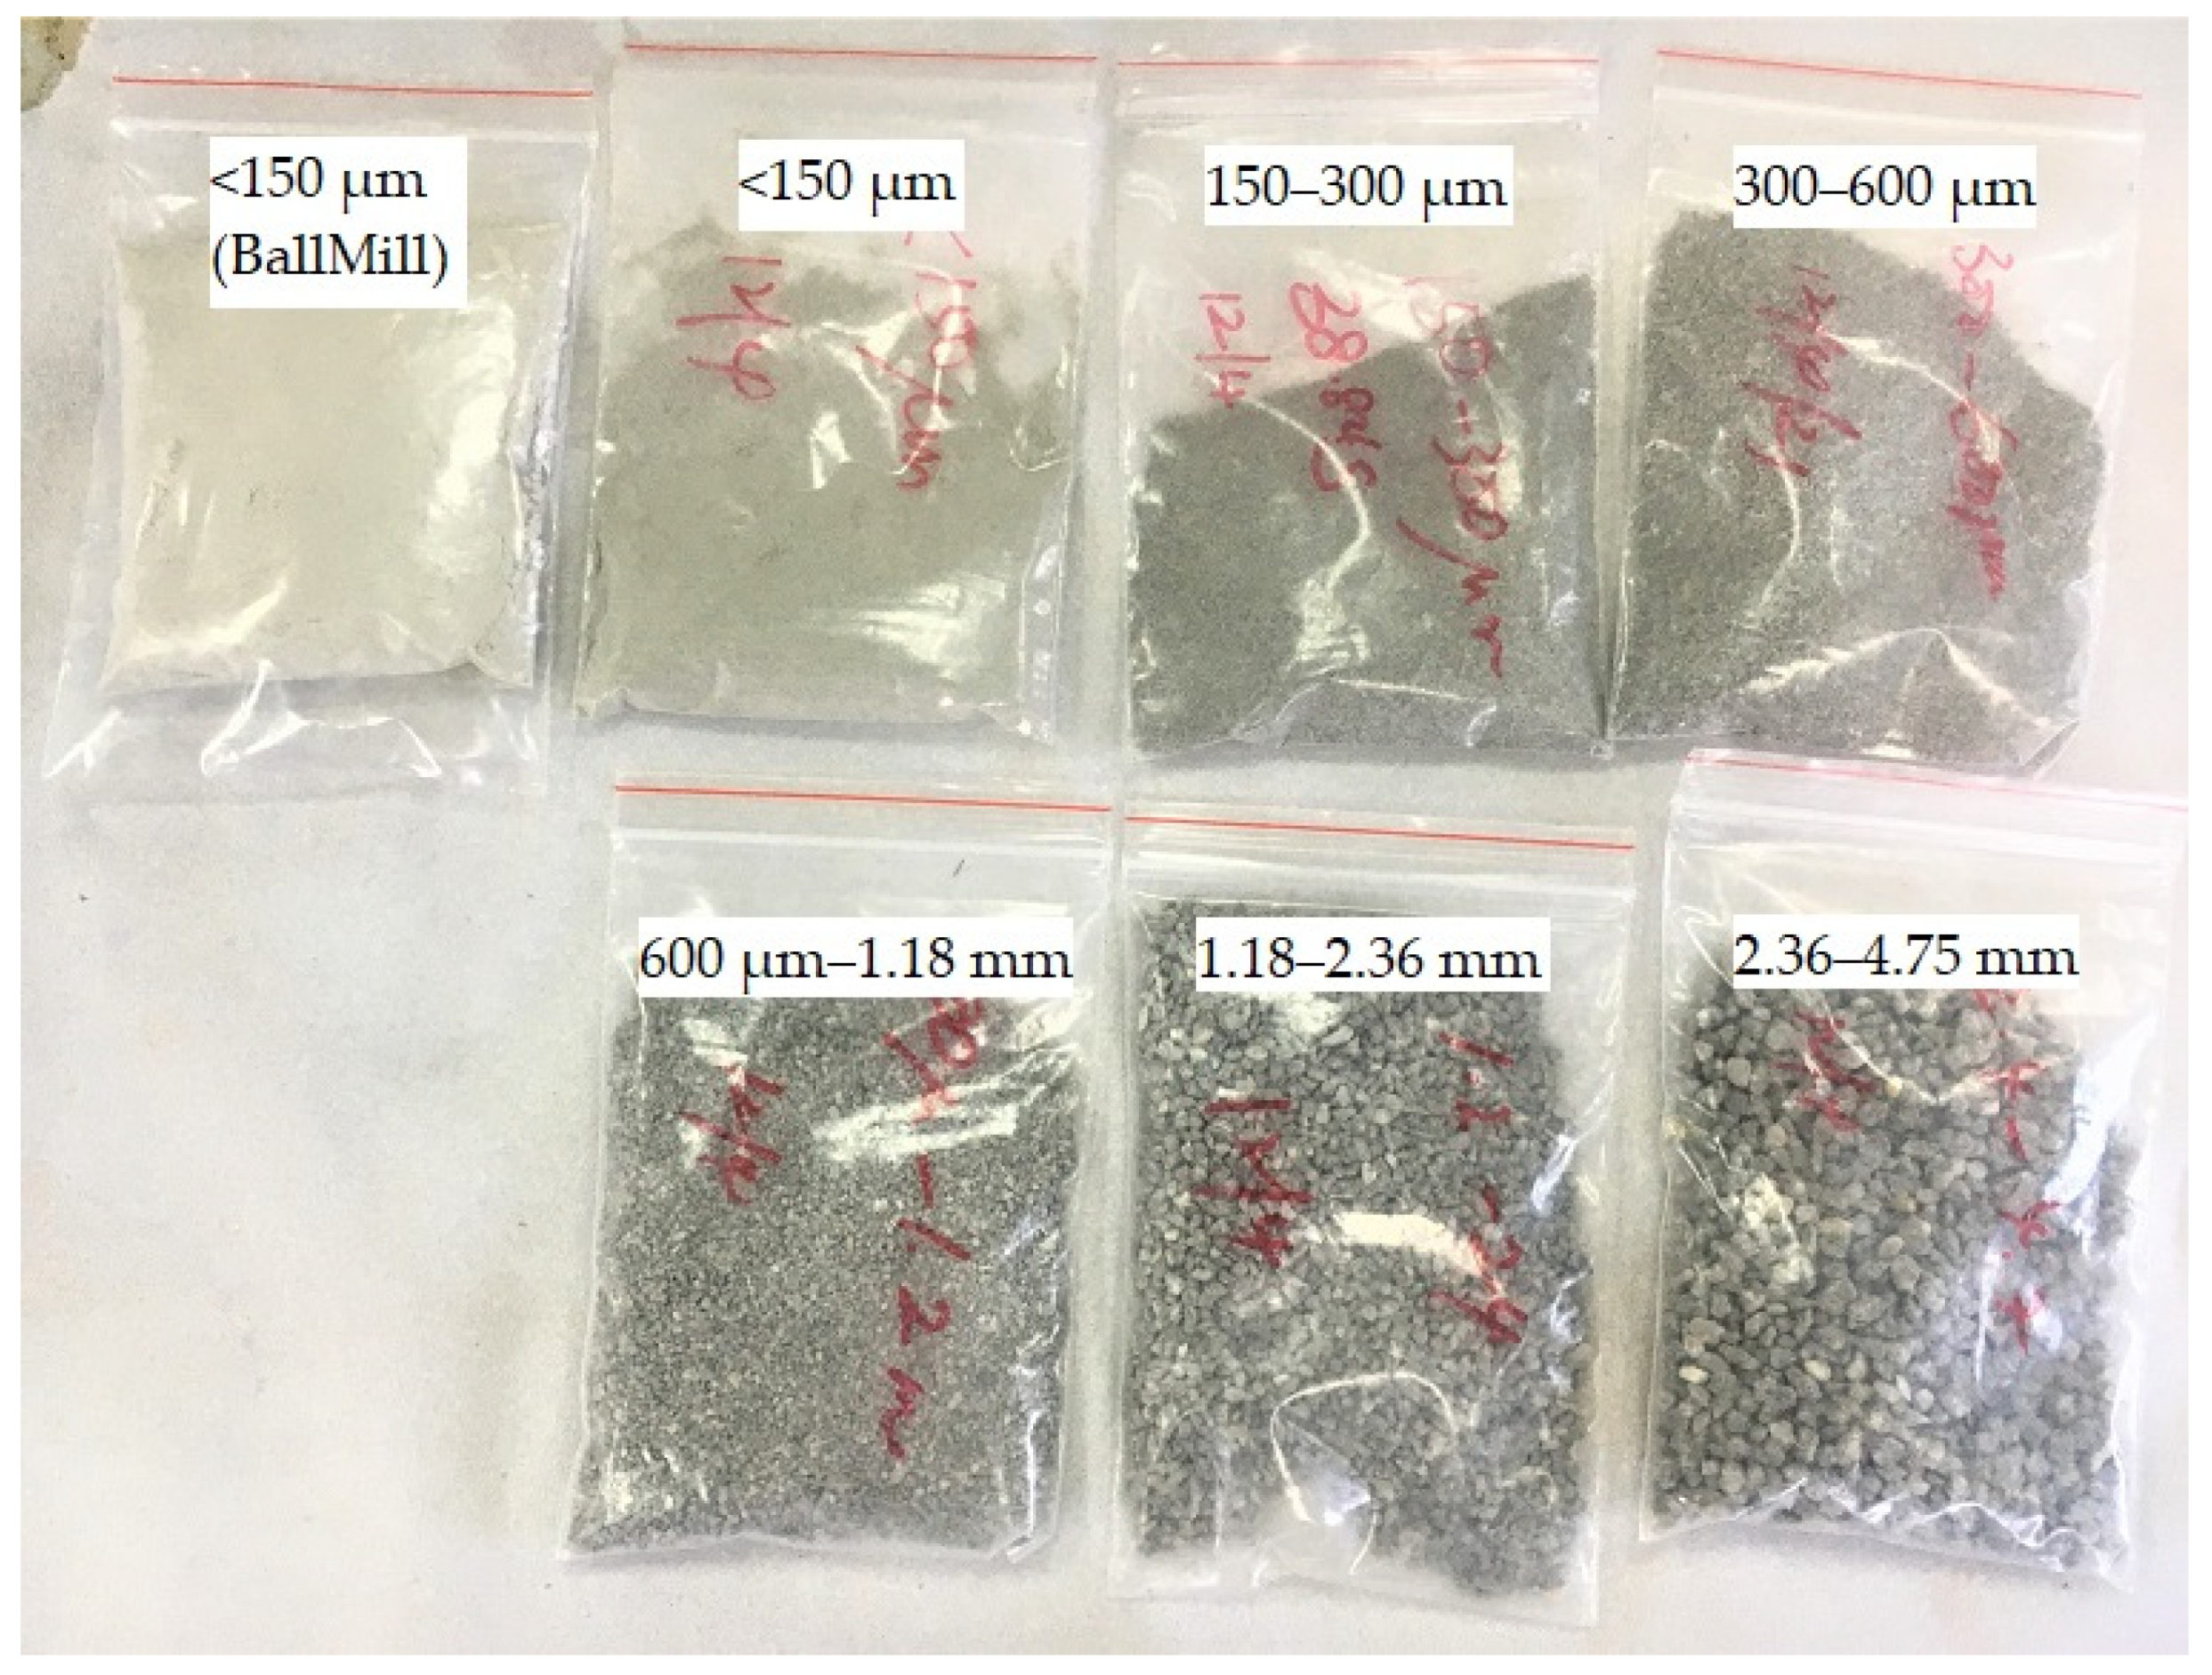
Grubb et al. [13] and Plusquellec et al. [29] milled the specimens to measure the pH of CBMs. For comparison, about 100 g of crushed specimens were ground using planetary ball mills. The majority of these specimens passed through the 150 µm sieve after the milling process. Figure 3 displays the specimens with different sizes for the test. Fine powder appeared lighter in colour than large particles.
Each category of the specimens was stored in individual, sealed plastic bags. Before the test, the pH meter was calibrated with standard buffer solutions of 4.01, 7.01 and 10.01, with an offset of ±30 mV and slope ranging between 92% and 110%.
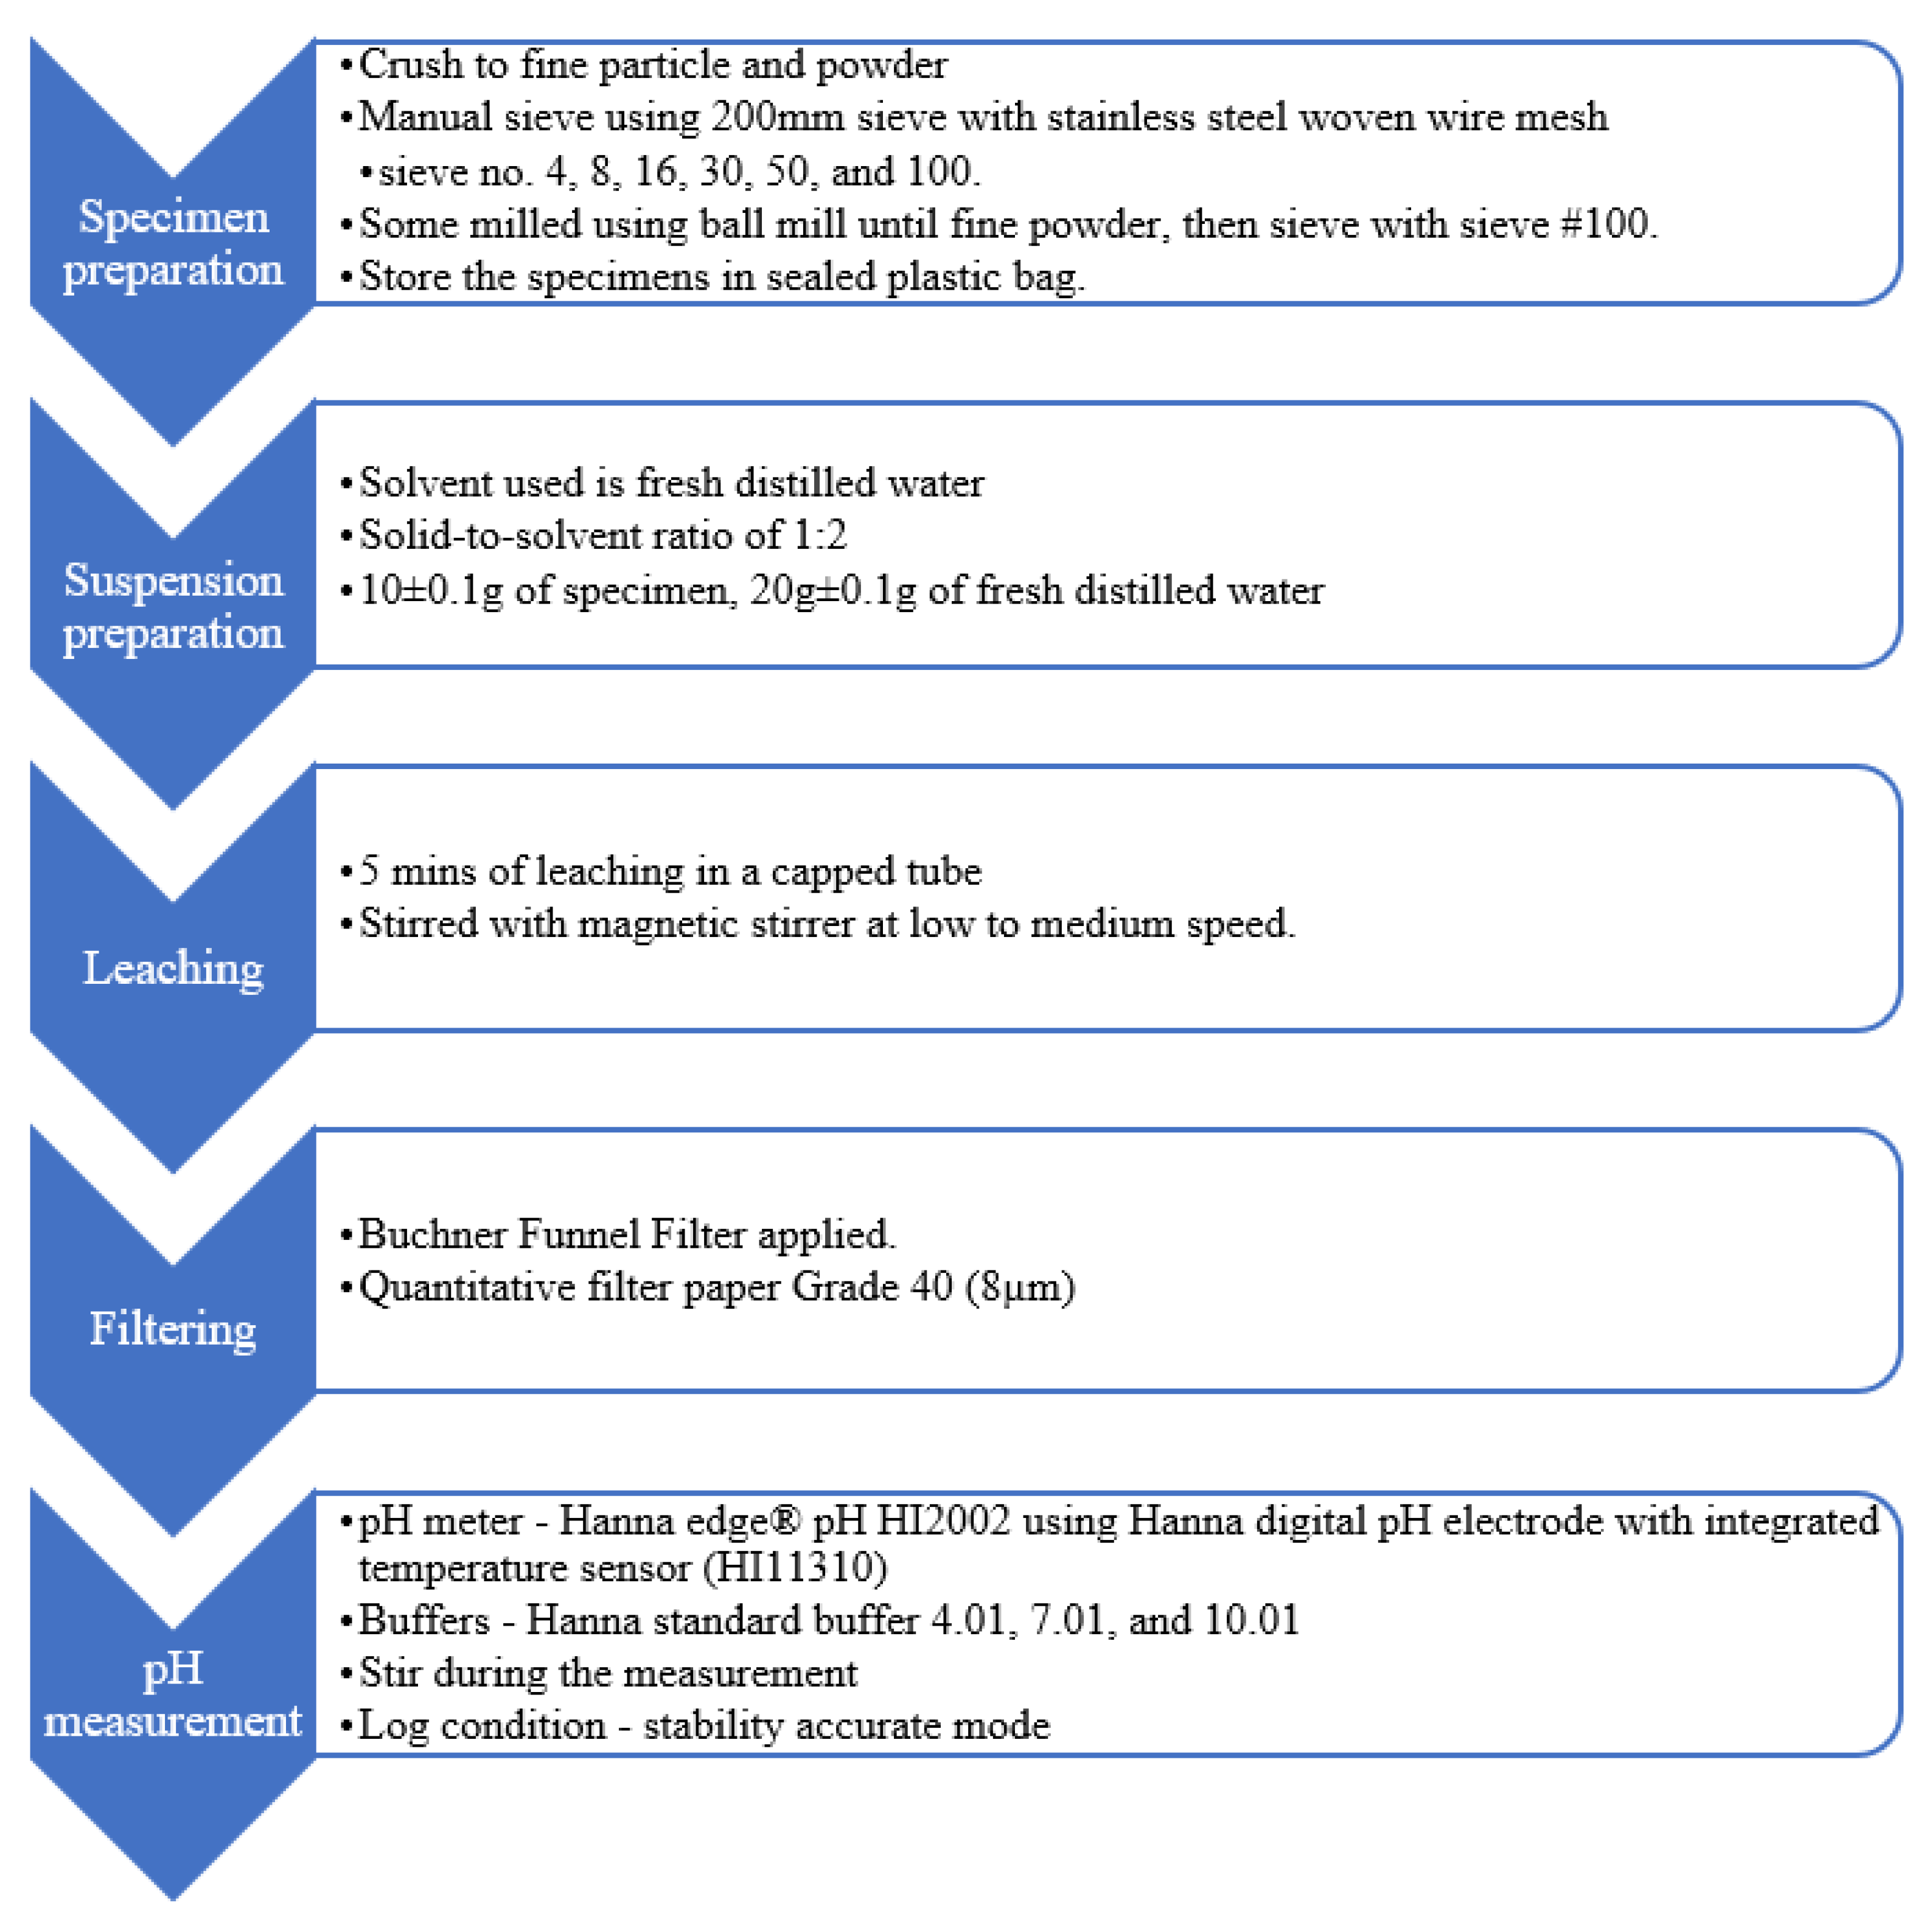
In a 50 mL self-standing centrifuge tube, 10 ± 0.1 g of the specimens was added to 20 ± 0.1 g of fresh distilled water, followed by magnetic stir bar, before tightening the screw cap on the tube. The tube was placed on the magnetic stirrer to stir without heating for 5 min of leaching. The suspension was filtered through a quantitative ashless filter paper Grade 40 by using a Buchner funnel filter to obtain at least 10 mL of the solution. The filtered solution was immediately poured into a clean 50 mL self-standing centrifuge tube for pH measurement. The solution level was higher than the ceramic junction and stirred during the measurement. The meter was set to log the reading in stability-accurate mode to avoid human error. For each sample, three readings were recorded, and the mean value was taken. The test was conducted randomly until three samples were tested for each particle size. The estimated time for the experiment (after the specimens were separated into respective sizes) was as follows: preparation of the suspension: within 5 min; stirring and leaching: 5 min; filtering: within 1 min and pH measurement: within 5 min.
Figure 4 summarises the variables set for the benchmark methodology to test the effect of different particle sizes. Alonso et al. [20] and Wang et al. [25] applied 5 min of mixing with magnetic stirrer for leaching 10 g of powder, with the solid-to-solvent ratio of 1:1. The solid-to-solvent ratio of 1:2 for the benchmark methodology was set instead of 1:1, given that Grubb et al. [13] commented that this ratio was practical for the measurement. In brief, 20 g of water was chosen so that the filtered solution in the 50 mL tube was higher than the ceramic junction of the electrode during pH measurement. The suspension was filtered with Grade 40 filter paper to protect the electrode from physical damages [13,29]. A Bushner funnel was also used to prevent carbonisation during filtering.
3. Results and Discussion
3.1. Effect of Particle Size on pH
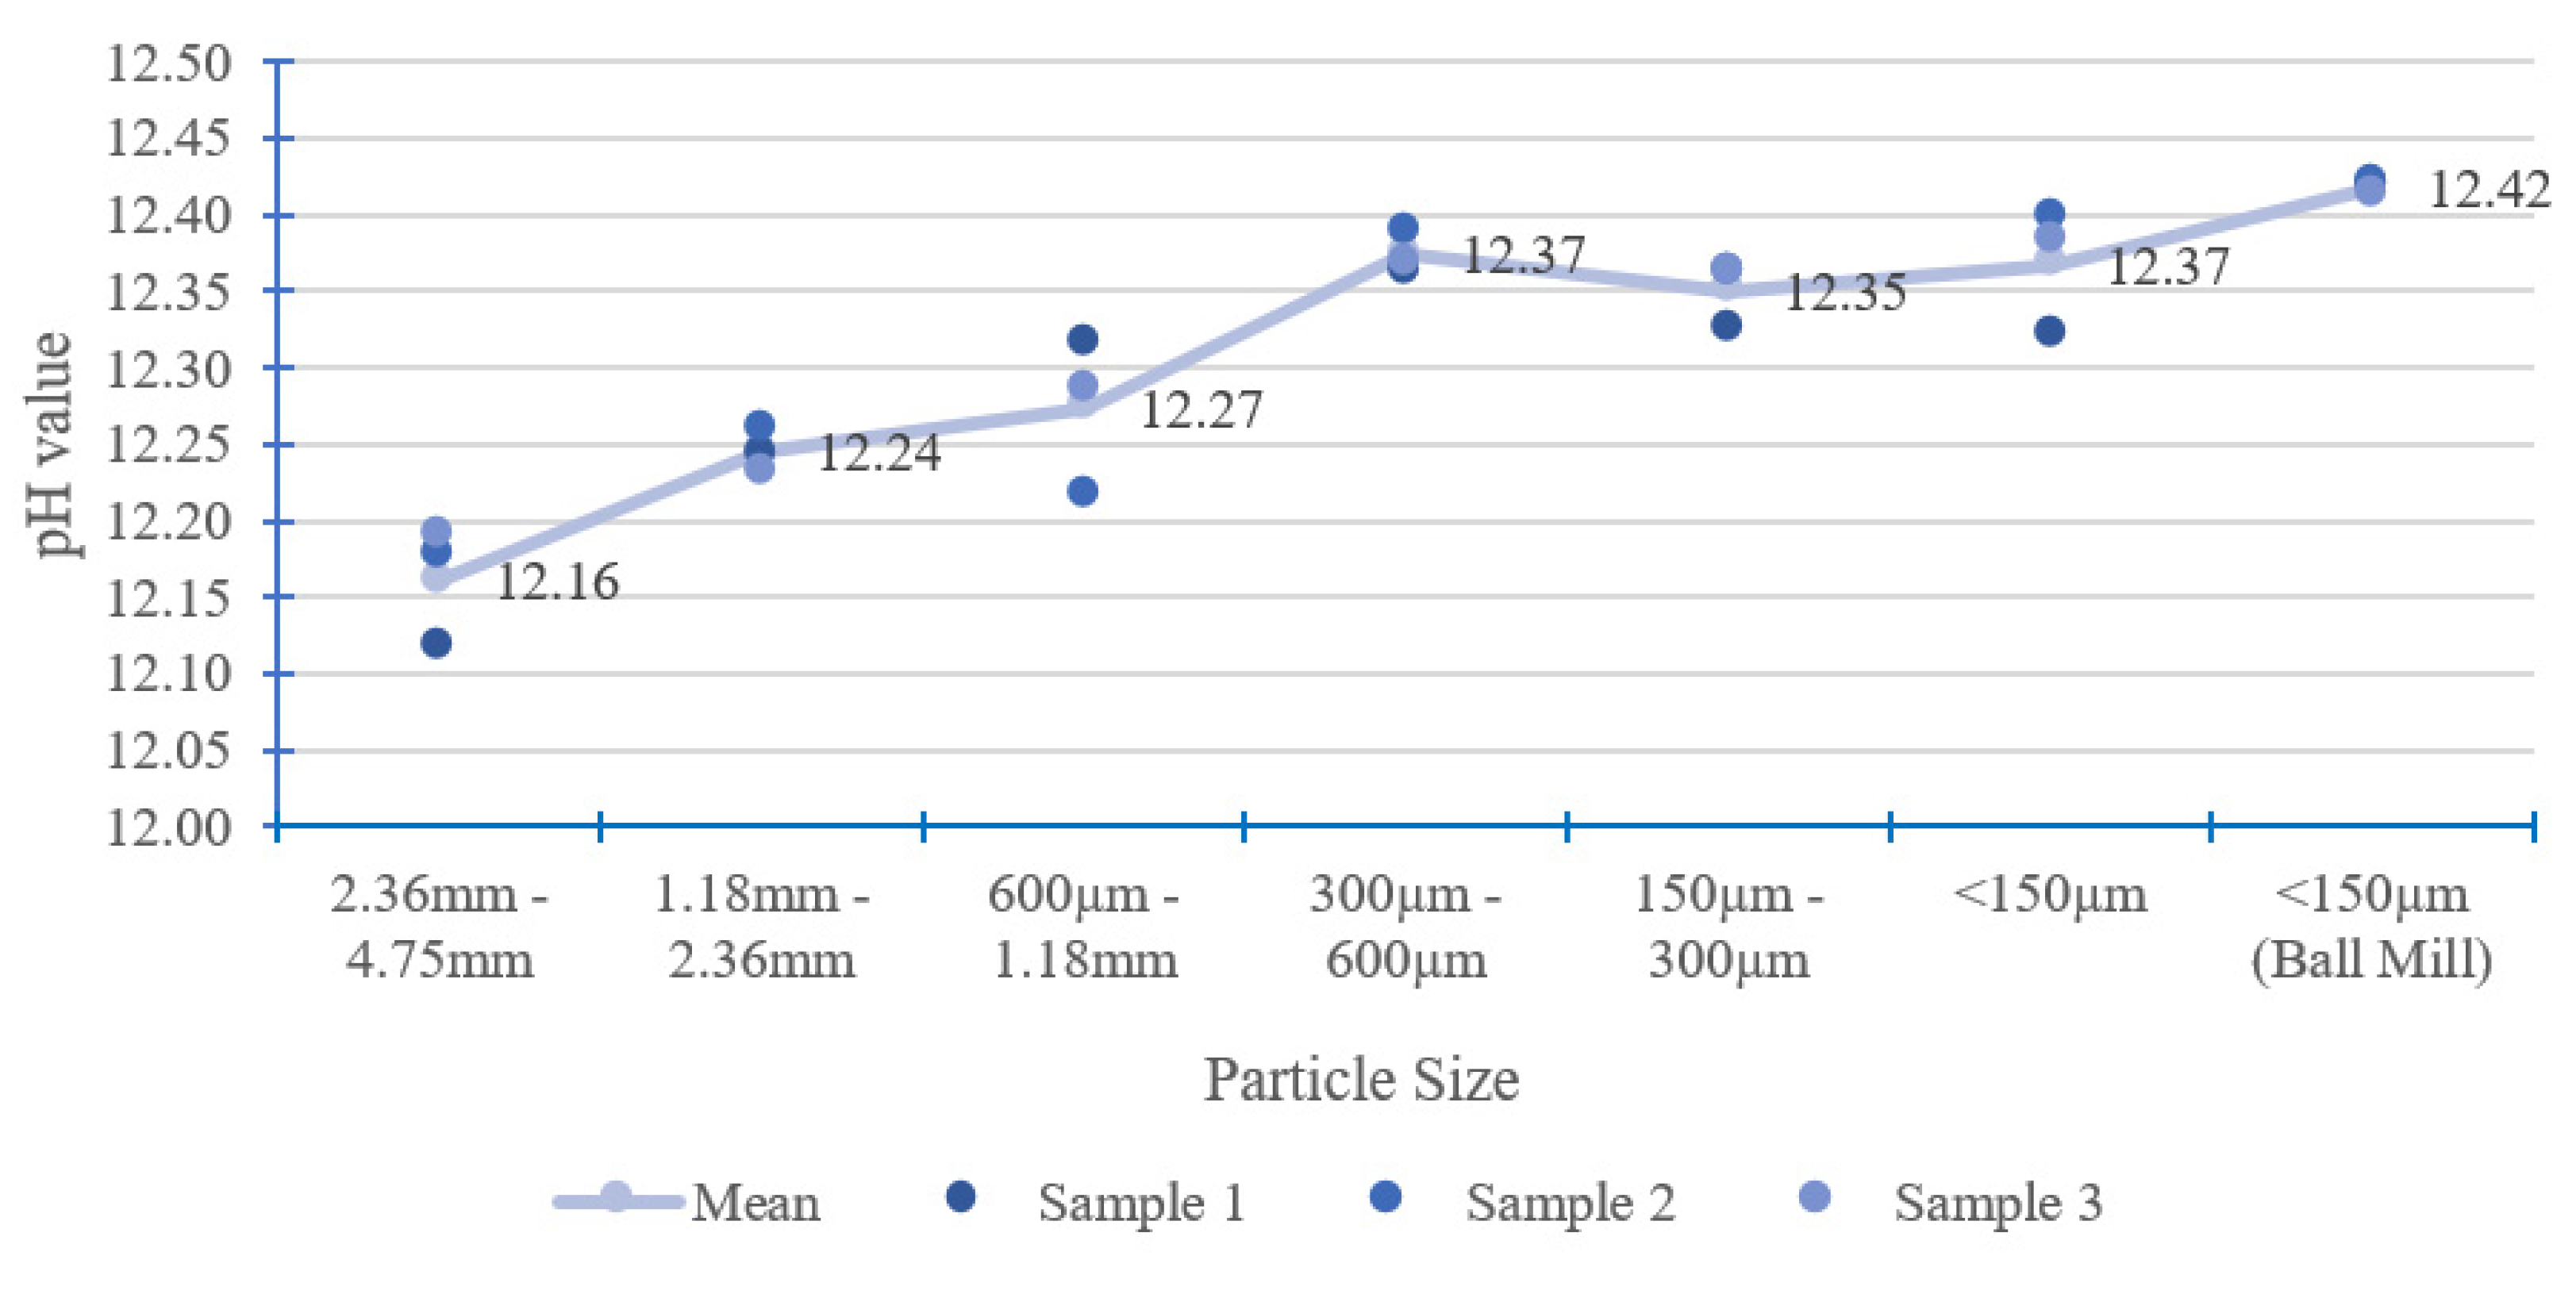
When a solid particle breaks into smaller particles, the total surface area increases. A large surface area allows more chemical reactions than a small surface area. Therefore, CBMs with smaller particle sizes have a higher total surface area in contact with solvent for the leaching of the OH− ion [33]. Figure 5 shows that larger particle sizes have a lower pH value, as evident in particle sizes of 2.36–4.75 mm to 0.60–1.18 mm. For particle sizes of 2.36–4.75 mm, the pH is about 0.26 units lower than very fine particles (<150 µm using ball mill). Fine particles with sizes below 600 µm have a pH differential of less than 0.05 units. For pH measurement, the sample particle sizes could be divided into two zones, namely, large particle size (particle sizes larger than 600 µm) and fine particle size (particle sizes smaller than 600 µm). Figure 5 also shows that the proposed pH measurement method has good repeatability, as the standard deviations are 0.05 or less for each category of particle size, as can be seen in Table 3. The standard deviation for each particle size denotes that the electrode probe has high accuracy during the measurement.
The results for cement mortar are consistent with the findings from other research (for similar particle size) but differ for CBMs, such as cement paste and concrete (Table 3). The pH value in the reference paper is higher than that in the present study, possibly due to the different calibration buffers used; this discrepancy requires further study for clarification. Wang et al. [25] determined the pH of cement paste by using calibration buffer solutions of 4, 7 and 10. Räsänen and Penttala [19] studied the pH of concrete by using calibration buffers of 10, 11, 12 and 13. The table also shows the similar trends of pH values for large and fine particle sizes.
3.2. Possibility of Using Samples with Large Particle Sizes in Measuring pH
Grubb et al. [13] reported that particle size influences the pH of CBMs, such that large particles showed lower pH than fine particles. Räsänen and Penttala [19] recommended that the particle size of samples should be fine or very fine to obtain an accurate result for the pH of cement-based materials; however, preparing fine particles is more difficult than large particles. Given the idea of using large particles for pH measurement, the following variables were examined.
3.2.1. Effect of Solid-to-Solvent Ratio on pH
The effect of solid-to-solvent ratio for large particles was determined. Large particle sizes refer to particles larger than 600 µm, while fine particle sizes refer to particles smaller than 600 µm. The solid-to-solvent ratio was changed from 1:2 to 1:1, where 20 g of solid was mixed with 20 g of fresh distilled water. On the same day, and with the same batch of specimens, samples with a size of 300–600 µm were tested according to the benchmark methodology for reference (Figure 2). The measured pH of 12.35 ± 0.02 matched the results reported in Section 3.1.
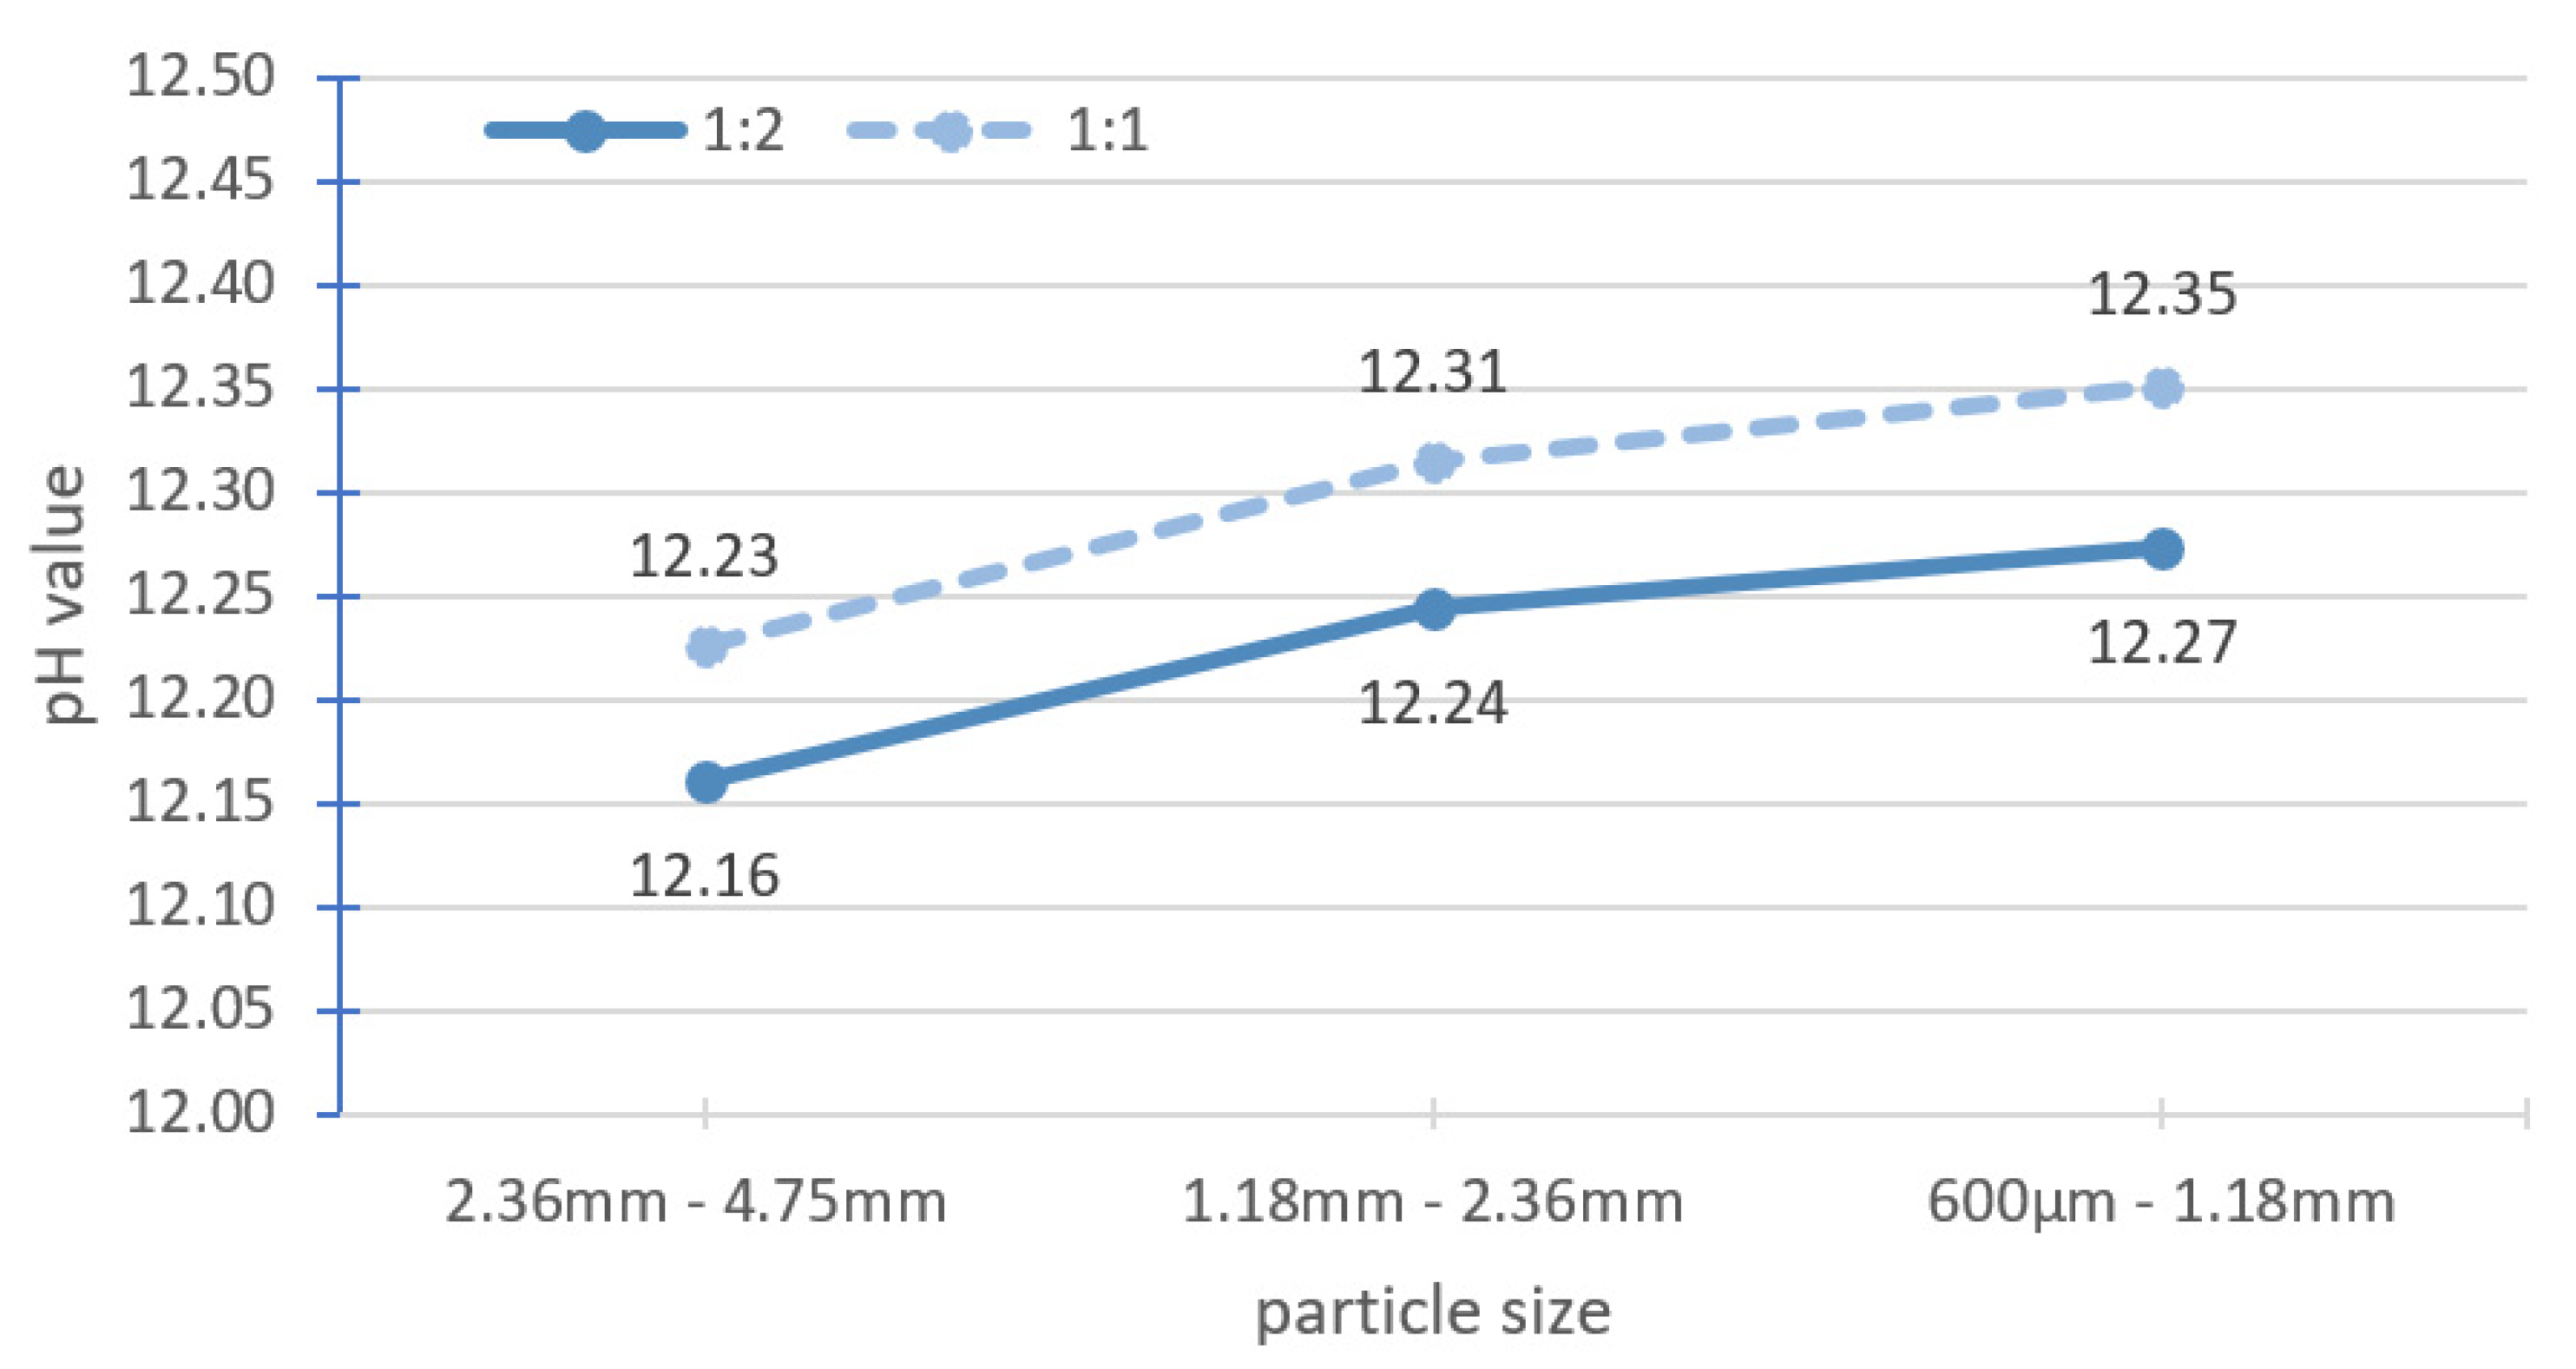
Table 4 shows the pH test results of three different ranges of large particle sizes (large particle sizes in ranges I, II and III) with the solid-to-solvent ratio of 1:1 in comparison with the pH value of fine particle sizes with the solid-to-solvent ratio of 1:2. With increasing solid-to-solvent ratio of the large particle sizes, the pH value of the range III particle size is similar to the reference, whereas that of the range II particle size differs from the reference. A meaningful difference was found between the range I particle size and the reference. By increasing the quantity of solid in the same amount of solvent, the total surface area increases, and a higher pH value (equal or close) than the reference could be achieved.
Figure 6 shows the pH values of the three ranges of large particle size with different solid-to-solvent ratios. The pH increased by about 0.07 units when the quantity of the solid samples was doubled for all the three ranges of the large particle size. Grubb et al. [13] reported that when the solid-to-solvent ratio of ground cement paste was changed from 1:2 to 1:1 (with 20 g of water), the pH increased by about 0.05 units. Räsänen and Penttala [19] tested the solid-to-solvent ratio for 7-day-old normal-strength concrete (NSC-7) and 180-day-old high-strength concrete (HSC-180), which were ground into powder. When the solid-to-solvent ratio was increased from 1:2 to 1:1, the pH value increased by approximately 0.04 units for NSC-7 and 0.12 units for HSC-180. The change in the solid-to-solvent ratio from 1:2 to 1:1 did not contribute much to the pH increment compared with the large particle sizes tested.
3.2.2. Effect of Leaching Time on pH
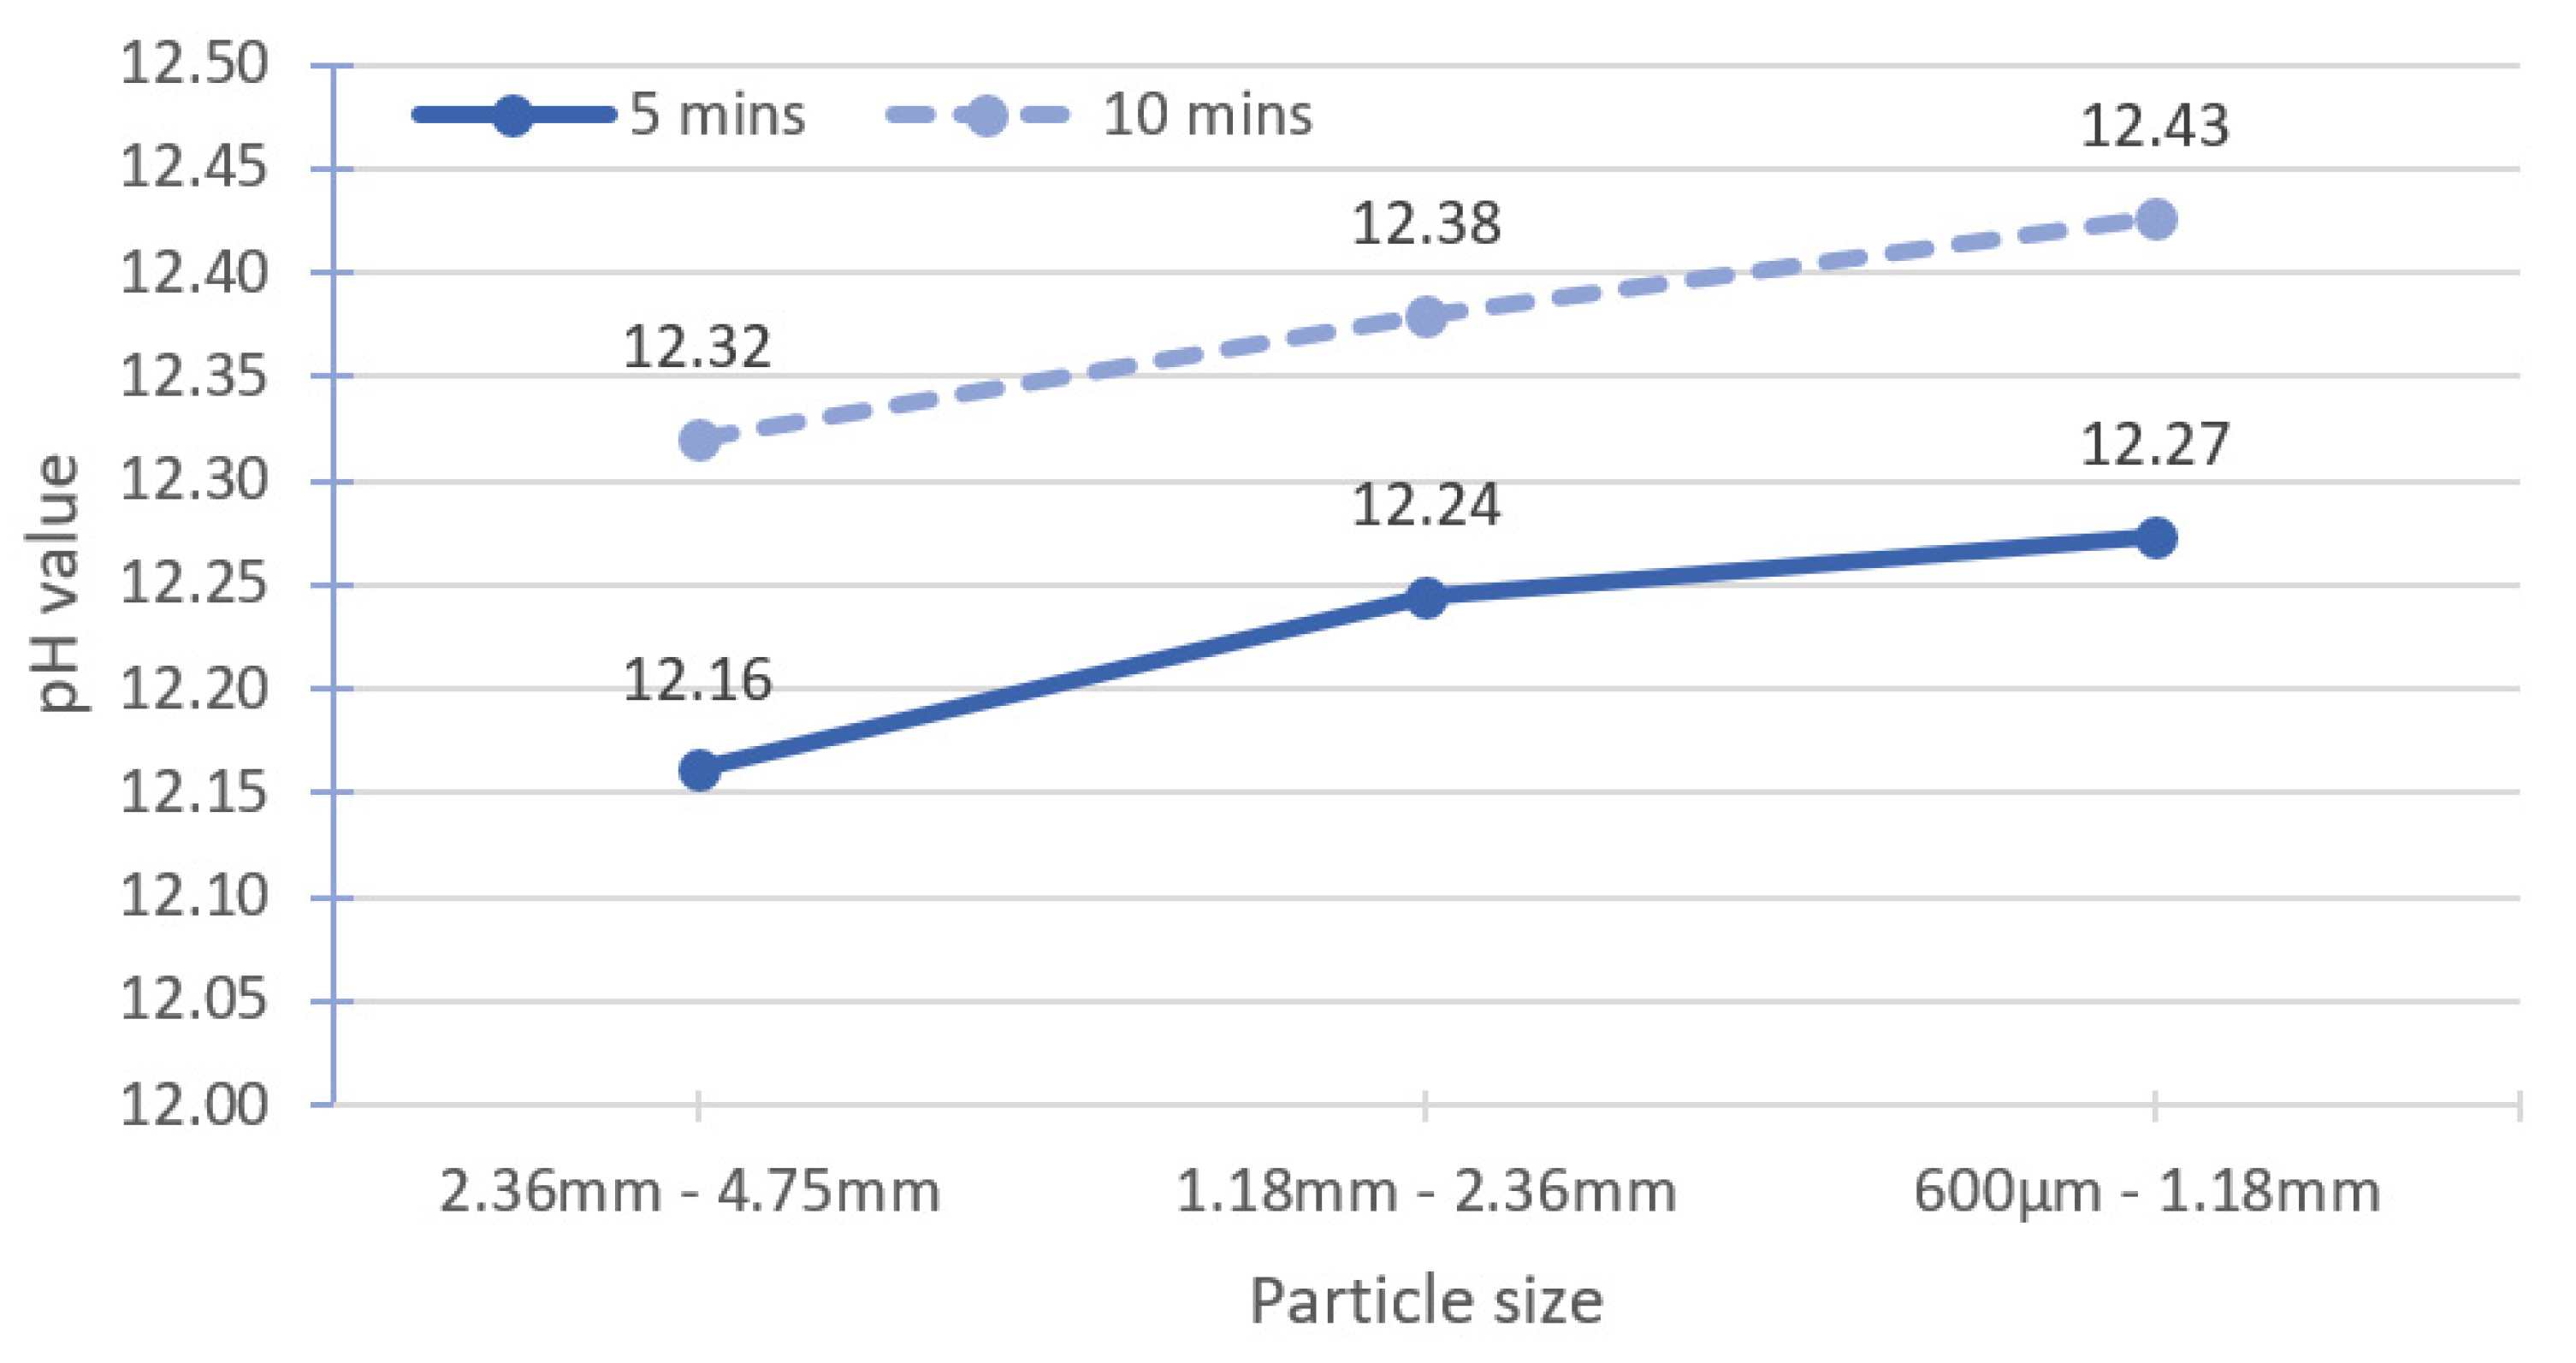
The leaching time was increased to investigate the possibility of using large particle sizes for accurate pH measurement. The specimens were placed in a magnetic stirrer for 10 min of leaching instead of 5 min. The reference sample was treated similarly to the method in Section 3.2.1, and the solid-to-solvent ratio for all specimens was 1:2. The test results are shown in Table 5. With increasing leaching time, the pH also increases, indicating that the leaching time for the benchmark methodology (Figure 4) may not be sufficient when the particle size of the specimens was large. The pH values of the ranges I and II large particle sizes are almost the same as the reference sample, but higher than that of the range III large particle size.
Figure 7 shows an average increment in the pH value of about 0.15 for large particle sizes when the leaching time is increased from 5 min to 10 min. Räsänen and Penttala [19] utilised a CM200 cell mixer with the speed of 35 rpm to stir the suspension. The stirring speed is slower than that of magnetic stirring used in the present study. For NSC-180, when the stirring time is increased from 5 min to 15 min, the pH increases by 0.01 units. Grubb et al. [13] recorded an insignificant pH change of approximately 0.05 units for a leaching time of 30–60 min. In both studies, the pH tests were conducted on the fine particle size (powder form).
4. Conclusions
As a part of durability and serviceability assessment of a concrete structure, the pH of structural concrete is one of the fundamental indicators to ensure that the concrete structure is in healthy condition or assess whether it needs rehabilitation and maintenance. Considering the lack of a standard for pH measurement, especially for high pH ranges, this work investigated the possibility of using large particle sizes, instead of fine particle sizes, for CBMs (cement mortar) to simplify the method of pH measurement.
Cement mortar specimens with smaller particle sizes resulted in a higher pH value, consistent with the studies on cement paste and concrete. Using a particle size of less than 600 µm (fine particle size) showed consistent pH measurement with a mean of 12.37–12.42 for cement mortar. In addition, large particle sizes (particle sizes between 2.36 mm and 600 µm) can be used for accurate pH measurement if the solid-to-solvent ratio is increased from 1:2 (used for fine particle sizes) to 1:1 or the leaching time is doubled (from 5 min for fine particle sizes to 10 min). However, increasing the leaching time is recommended, rather than increasing the solid-to-solvent ratio to obtain similar pH readings as fine particle size.
These findings are important for the development of a standardised pH measurement using the ESL method for CBMs. The effect of other variables should be investigated on different types of CBMs to verify the applicability of all variables before a standardised pH measurement can be proposed.
Author Contributions
Conceptualization, P.Y.L. and P.S.; methodology, P.Y.L. and P.S.; software, P.Y.L.; validation, P.Y.L., P.S., H.Y.B.K., Z.I. and S.Y.; formal analysis, P.Y.L. and P.S.; investigation, P.Y.L.; resources, P.Y.L.; data curation, P.Y.L. and P.S.; writing—original draft preparation, P.Y.L.; writing—review and editing, P.Y.L., P.S., H.Y.B.K., Z.I. and S.Y.; visualization, P.Y.L.; supervision, P.S. and Z.I.; funding acquisition, P.S. and H.Y.B.K. All authors have read and agreed to the published version of the manuscript.
Funding
This research is supported by Universiti Tenaga Nasional Internal Research Grant OPEX (J5100D4103-BOLDREFRESH2025-CENTRE OF EXCELLENCE) and Universiti Malaya research grant (Grant No. GPF007F-2019).
Institutional Review Board Statement
Not applicable.
Informed Consent Statement
Not applicable.
Data Availability Statement
The data presented in this study are available within the article.
Acknowledgments
The authors would like to express their gratitude for the provided support by Universiti Malaya and Universiti Tenaga Nasional.
Conflicts of Interest
The authors declare no conflict of interest.
References
- Neville, A.M. Portland cement. In Properties of Concrete, 5th ed.; Pearson Education Limited: London, UK, 2011. [Google Scholar]
- Li, Z.J. Materials for making concrete. In Advanced Concrete Technology; John Wiley & Sons. Inc.: Hoboken, NJ, USA, 2011; p. 38. [Google Scholar]
- ACI Committee 222. Protection of Metals in Concrete Against Corrosion; American Concrete Institute: Farmington Hills, MI, USA, 2001. [Google Scholar]
- Taylor, H.F.W. Concrete chemistry. In Cement Chemistry; Academic Press Limited: London, UK, 1990; pp. 383–387. [Google Scholar]
- Kurdowski, W. Concrete Properties. In Cement and Concrete Chemistry; Springer: Dordrecht, The Netherlands, 2014; p. 478. [Google Scholar] [CrossRef]
- McPolin, D.O.; Bashneer, P.A.M.; Long, A.E.; Grattan, K.T.V.; Sun, T. New test method to obtain pH profiles due to carbonation of concretes containing supplementary cementitious materials. J. Mater. Civ. Eng. 2007, 19, 936–956. [Google Scholar] [CrossRef]
- Gruyaert, E.; Van Den Heede, P.; De Belie, N. Carbonation of slag concrete: Effect of the cement replacement level and curing on the carbonation coefficient—Effect of carbonation on the pore structure. Cem. Concr. Comp. 2013, 35, 39–48. [Google Scholar] [CrossRef]
- Sanjuán, M.A.; Estévez, E.; Argiz, C.; Del Barrio, D. Effect of curing time on granulated blast-furnace slag cement mortars carbonation. Cem. Concr. Comp. 2018, 90, 257–265. [Google Scholar] [CrossRef]
- Li, L.F.; Sagüés, A.A.; Poor, N. In situ leaching investigation of pH and nitrite concentration in concrete pore solution. Cem. Concr. Res. 1999, 29, 315–321. [Google Scholar] [CrossRef]
- Rashad, A.M. An investigation on very high volume slag pastes subjected to elevated temperatures. Constr. Build. Mater. 2015, 74, 249–258. [Google Scholar] [CrossRef]
- Shafigh, P.; Yousuf, S.; Lee, C.J.; Ibrahim, Z. The effect of cement mortar composition on the pH value. IOP Conf. Ser. Mater. Sci. Eng. 2020, 770, 012026. [Google Scholar] [CrossRef] [Green Version]
- Gowripalan, N.; Mohamed, H.M. Chloride-ion induced corrosion of galvanized and ordinary steel reinforcement in high-performance concrete. Cem. Concr. Res. 1998, 28, 1119–1131. [Google Scholar] [CrossRef]
- Grubb, J.A.; Limaye, H.S.; Ashok, M.K. Testing pH of Concrete. Concr. Int. 2007, 29, 78–83. [Google Scholar]
- Rostami, V.; Shao, Y.X.; Boyd, A.J. Durability of concrete pipes subjected to combined steam and carbonation curing. Constr. Build. Mater. 2011, 25, 3345–3355. [Google Scholar] [CrossRef]
- Zhang, D.; Shao, Y.X. Effect of early carbonation curing on chloride penetration and weathering carbonation in concrete. Constr. Build. Mater. 2016, 123, 516–526. [Google Scholar] [CrossRef]
- Heng, M.; Murata, K. Aging of concrete buildings and determining the pH value on the surface of concrete by using a handy semi-conductive pH meter. Anal. Sci. 2004, 20, 1087–1090. [Google Scholar] [CrossRef] [PubMed] [Green Version]
- Rostami, V.; Shao, Y.X.; Boyd, A.J.; He, Z. Microstructure of cement paste subject to early carbonation curing. Cem. Concr. Res. 2012, 42, 186–193. [Google Scholar] [CrossRef]
- Kakade, A.M. Measuring concrete surface pH—A proposed test method. Concr. Repair Bull. 2014, 16–20. Available online: https://cdn.ymaws.com/www.icri.org/resource/resmgr/crb/2014marapr/CRBMarApr14_Kakade.pdf (accessed on 16 June 2021).
- Räsänen, V.; Penttala, V. The pH measurement of concrete and smoothing mortar using a concrete powder suspension. Cem. Concr. Res. 2004, 34, 813–820. [Google Scholar] [CrossRef]
- Alonso, M.C.; Calvo, J.L.G.; Walker, C.; Naito, M.; Pettersson, S.; Puigdomenech, I.; Cuñado, M.A.; Vuorio, M.; Weber, H.; Ueda, H.; et al. Development of an Accurate pH Measurement Methodology for the Pore Fluids of Low pH Cementitious Materials; SKB R-12-02; Swedish Nuclear Fuel and Waste Management Co.: Stockholm, Sweden, 2012. [Google Scholar]
- Behnood, A.; Van Tittelboom, K.; De Belie, N. Methods for measuring pH in concrete: A review. Constr. Build. Mater. 2016, 105, 176–188. [Google Scholar] [CrossRef]
- Barneyback Jr, R.; Diamond, S. Expression and analysis of pore fluids from hardened cement pastes and mortars. Cem. Concr. Res. 1981, 11, 279–285. [Google Scholar] [CrossRef]
- Sagüés, A.A.; Moreno, E.I.; Andrade, C. Evolution of pH during in-situ leaching in small concrete cavities. Cem. Concr. Res. 1997, 27, 1747–1759. [Google Scholar] [CrossRef]
- Manso, S.; Aguado, A. A review of sample preparation and its influence on pH determination in concrete samples. Mater. Construcción 2017, 67, 1–10. [Google Scholar] [CrossRef] [Green Version]
- Wang, W.C.; Huang, W.H.; Lee, M.Y.; Duong, H.T.H.; Chang, Y.H. Standardized Procedure of Measuring the pH Value of Cement Matrix Material by Ex-Situ Leaching Method (ESL). Crystals 2021, 11, 436. [Google Scholar] [CrossRef]
- Pavlík, V. Water extraction of chloride, hydroxide and other ions from hardened cement pastes. Cem. Concr. Res. 2000, 30, 895–906. [Google Scholar] [CrossRef]
- Björk, F.; Eriksson, C.A. Measurement of alkalinity in concrete by a simple procedure, to investigate transport of alkaline material from the concrete slab to a self-levelling screed. Constr. Build. Mater. 2002, 16, 535–542. [Google Scholar] [CrossRef]
- Li, L.F.; Nam, J.; Hartt, W.H. Ex situ leaching measurement of concrete alkalinity. Cem. Concr. Res. 2005, 35, 277–283. [Google Scholar] [CrossRef]
- Plusquellec, G.; Geiker, M.; Lindgård, J.; Duchesne, J.; Fournier, B.; De Weerdt, K. Determination of the pH and the free alkali metal content in the pore solution of concrete: Review and experimental comparison. Cem. Concr. Res. 2017, 96, 13–26. [Google Scholar] [CrossRef]
- Shafigh, P.; Asadi, P.; Akhiani, A.R.; Mahyuddin, N.B.; Hashemi, M. Thermal properties of cement mortar with different mix proportions. Mat. Constr. 2020, 70, 224. [Google Scholar] [CrossRef]
- Hanna Instruments. pH. In General Catalog; Hanna Instruments Inc.: Woonsocket, RI, USA, 2020; Volume 34, pp. 2.1–2.170. [Google Scholar]
- Hanna Instruments. Operational guide. In edge® pH Instruction Manual; Hanna Instruments Inc.: Woonsocket, RI, USA; p. 37. Available online: https://www.manualslib.com/manual/1555430/Hanna-Instruments-Edge.html#manual (accessed on 15 June 2021).
- Meyers, R.A. Encyclopedia of Environmental Analysis and Remediation. 8 Volume Set; Wiley-Interscience: New York, NY, USA, 1998; p. 2094. [Google Scholar]
Figure 1.
pH measurement methods categorised by different types of sample preparation.

Figure 2.
Summary for stages of the ESL method.

Figure 3.
Samples stored in individual, sealed plastic bags.

Figure 4.
Benchmark methodology for effect of particle size.

Figure 5.
Effect of particle size.

Figure 6.
Effect of solid-to-solvent ratio of 1:1 and 1:2 for large particle size.

Figure 7.
Effect of changing leaching time to 10 min for large particle size.


Table 1.
Particle sizes used by different researchers in the ESL method.
| Specimen Particle Size | Reference |
|---|---|
| Powder from drilling | McPolin et al. [6], Heng and Murata [16], Björk and Eriksson [27] |
| <63 µm | Rashad [10] |
| 150 µm | Manso and Aguado [24] |
| <297 µm | Li et al. [28] |
| Grind until <80 µm, do not use a sieve | Alonso et al. [20] |
| Crush and grind using a vibratory disc mill at 1500 rpm for 30 s, then sieve to <80 µm | Plusquellec et al. [29] |
| <500 µm, 500 µm–1 mm, 1–2 mm | Pavlík [26] |
| <75 µm, 75–125 µm, 125–250 µm, 250–500 µm, 500 µm–1 mm, 1–2 mm, 2–4 mm, 4–8 mm, 8–16 mm, >16 mm | Räsänen and Penttala [19] |
| <850 µm, 850 µm–2 mm, >2 mm | Grubb et al. [13] |
| <74 µm, 74–149 µm, 149–297 µm, 297–595 µm | Wang et al. [25] |
Table 2.
Comparison of the pH value for biggest and smallest particle sizes in previous studies.
| Grubb et al. [13] | Räsänen and Penttala [19] | ||
|---|---|---|---|
| Particle Size | pH Measured | Particle Size | pH Measured |
| >2 mm | 11.55 | >16 mm | 12.22 |
| <850 µm | 12.48 | <75 µm | 12.81 |
Table 3.
Comparison for pH among mortar, paste and concrete samples with similar particle sizes.
| Particle Size | pH Value | ||
|---|---|---|---|
| In This Study (Mortar) | Wang et al. [25] (Paste) | Räsänen and Penttala [19] (Concrete) | |
| 2.36–4.75 mm | 12.16 ± 0.04 | N.A. | 12.53 |
| 1.18–2.36 mm | 12.24 ± 0.02 | N.A. | 12.64 |
| 600 µm–1.18 mm | 12.27 ± 0.05 | N.A. | 12.72 |
| 300–600 µm | 12.37 ± 0.02 | 12.73 | 12.74 |
| 150–300 µm | 12.35 ± 0.02 | 12.73 | 12.77 |
| <150 µm | 12.37 ± 0.04 | 12.77 | 12.79 |
Table 4.
Effect of the solid-to-solvent ratio of different large particle sizes on pH.
| Particle Size | Large Particle Size | Fine Particle Size | ||
| 2.36–4.75 mm (Particle Size Range I) | 1.18–2.36 mm (Particle Size Range II) | 600 µm–1.18 mm (Particle Size Range III) | 300–600 µm (Reference) | |
| solid-to-solvent ratio | 1:1 | 1:1 | 1:1 | 1:2 |
| pH value (mean ± SD) | 12.23 ± 0.02 | 12.31 ± 0.04 | 12.35 ± 0.02 | 12.35 ± 0.02 |
Table 5.
Effect of leaching time for different large particle sizes on pH.
| Particle Size | Large Particle Size | Fine Particle Size | ||
|---|---|---|---|---|
| 2.36–4.75 mm (Particle Size Range I) | 1.18–2.36 mm (Particle Size Range II) | 600 µm–1.18 mm (Particle Size Range III) | 300–600 µm (Reference) | |
| Leaching time (min) | 10 | 10 | 10 | 5 |
| pH value (mean ± SD) | 12.32 ± 0.03 | 12.38 ± 0.02 | 12.43 ± 0.03 | 12.35 ± 0.02 |
Publisher’s Note: MDPI stays neutral with regard to jurisdictional claims in published maps and institutional affiliations. |
© 2021 by the authors. Licensee MDPI, Basel, Switzerland. This article is an open access article distributed under the terms and conditions of the Creative Commons Attribution (CC BY) license (https://creativecommons.org/licenses/by/4.0/).
Share and Cite
MDPI and ACS Style
Loh, P.Y.; Shafigh, P.; Katman, H.Y.B.; Ibrahim, Z.; Yousuf, S. pH Measurement of Cement-Based Materials: The Effect of Particle Size. Appl. Sci. 2021, 11, 8000. https://doi.org/10.3390/app11178000
AMA Style
Loh PY, Shafigh P, Katman HYB, Ibrahim Z, Yousuf S. pH Measurement of Cement-Based Materials: The Effect of Particle Size. Applied Sciences. 2021; 11(17):8000. https://doi.org/10.3390/app11178000
Chicago/Turabian StyleLoh, Poh Yee, Payam Shafigh, Herda Yati Binti Katman, Zainah Ibrahim, and Sumra Yousuf. 2021. "pH Measurement of Cement-Based Materials: The Effect of Particle Size" Applied Sciences 11, no. 17: 8000. https://doi.org/10.3390/app11178000
Note that from the first issue of 2016, this journal uses article numbers instead of page numbers. See further details here.