
Estimating Contact Force Chains Using Artificial Neural Network


1
Department of Architecture and Civil Engineering, City University of Hong Kong, Hong Kong, China
2
Shenzhen Research Institute, City University of Hong Kong, Shenzhen 518057, China
*
Author to whom correspondence should be addressed.
Appl. Sci. 2021, 11(14), 6278; https://doi.org/10.3390/app11146278
Submission received: 12 June 2021
/
Revised: 29 June 2021
/
Accepted: 5 July 2021
/
Published: 7 July 2021
(This article belongs to the Special Issue Intelligent Computing in Architecture, Engineering and Construction)
Abstract
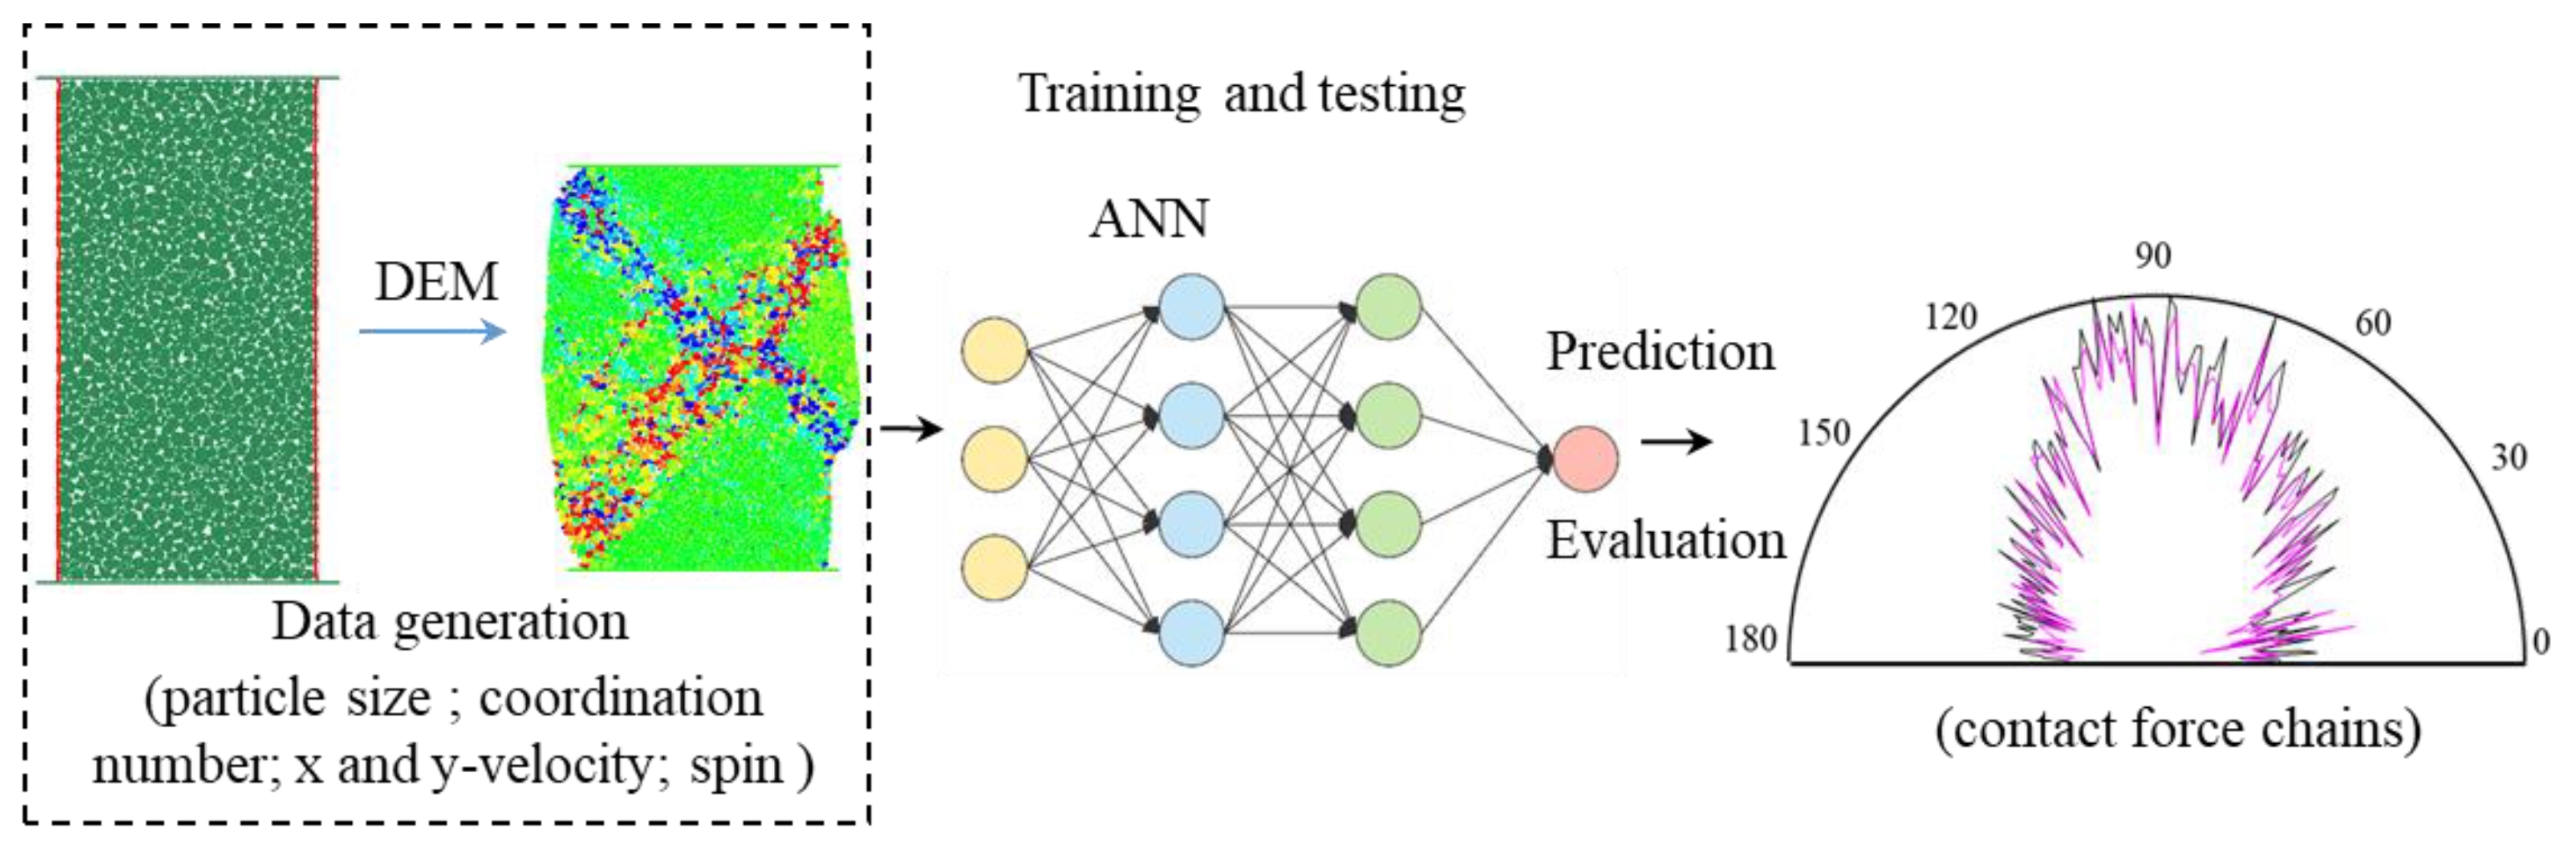
:The inhomogeneous distribution of contact force chains (CFC) in quasi-statically sheared granular materials dominates their bulk mechanical properties. Although previous micromechanical investigations have gained significant insights into the statistical and spatial distribution of CFC, they still lack the capacity to quantitatively estimate CFC evolution in a sheared granular system. In this paper, an artificial neural network (ANN) based on discrete element method (DEM) simulation data is developed and applied to predict the anisotropy of CFC in an assembly of spherical grains undergoing a biaxial test. Five particle-scale features including particle size, coordination number, x- and y-velocity (i.e., x and y-components of the particle velocity), and spin, which all contain predictive information about the CFC, are used to establish the ANN. The results of the model prediction show that the combined features of particle size and coordination number have a dominating influence on the CFC’s estimation. An excellent model performance manifested in a close match between the rose diagrams of the CFC from the ANN predictions and DEM simulations is obtained with a mean accuracy of about 0.85. This study has shown that machine learning is a promising tool for studying the complex mechanical behaviors of granular materials.
1. Introduction
It is well known that granular materials such as sand, gravel and coal exhibit a wide range of complex mechanical behaviors which are caused by the highly convoluted nature of their topological packing structure, individual grain morphology, microstructure and physical properties, as well as the contact mechanics of a large assembly of interacting grains [1,2]. Although a significant amount of work has been dedicated to the research of granular materials over the past 50 years [3,4,5], there is still a lack of a holistic physical theorem that can describe the complex macro–micro mechanics of granular materials, especially down to the grain-scale behavior.
Over the last two decades, X-ray microcomputed tomography (micro-CT) has been increasingly used as a powerful tool for the investigation of the grain-scale mechanical behavior of granular materials [6,7,8,9,10,11,12,13,14]. This tool makes it possible to capture and characterize the interparticle contacts of granular materials and their evolutions under the triaxial shearing condition [15,16]. However, micro-CT has a limitation in the measurement of contact forces between interacting particles that hampers our understanding of the structure and evolution of contact force chains. Contact force chains play an important role in the mechanical properties of granular materials such as flowability, elasticity and stability. Therefore, to gain new insight into the physical processes of granular materials, it is essential to estimate the interparticle contact forces in the shearing test.
Several approaches that could experimentally measure or estimate interparticle contact forces have been reported in the literature, such as the use of photo-elasticity data [17,18], the contact force estimation of rubber balls based on micro-CT images [19] and the inverse calculation of contact forces between rubber cylinders using the granular element method [20,21]. However, all of these approaches are limited to specific types of material with simple geometries, such as 2D birefringent grains for photo-elasticity [17,18], elastic rubber balls with an assumed contact law [19] or simple rubber cylindrical grains [20] for image-based measurement or estimation, and they thus cannot be applied to the analysis of complex granular materials such as sand. This deficiency presents a primary hurdle to achieving a holistic understanding of the mechanics of granular materials.
The difficulty of directly measuring interparticle contact forces within a loaded granular material has led to the intensive use of DEM modeling by the research community as an alternative approach to obtain such information [22,23,24]. With full access to all the particle-scale kinetics and kinematics information, DEM has proven to be a powerful tool for investigating the micromechanics of granular materials over the past three decades [5,25,26,27]. The recent incorporation of micro-CT images of sand particle morphologies into the DEM model by the authors has elevated the sophistication level of the model to a new height [27,28]. It is anticipated that the interparticle contact forces extracted from such a one-to-one mapping model are close representations of the real contact force data of the physical sample.
Machine learning (ML) is a branch of artificial intelligence that offers computers the capability to learn from existing data to solve problems that are too complex to solve with conventional programming. Among numerous ML approaches, the ANN model has been widely used [29,30,31] as it can adaptively estimate an accurate functional relationship between the input and output variables. The recent applications of ML to granular materials research, such as identifying structural flow defects [32], estimating fault friction from seismic signals [33], and predicting stress–strain relationship of a granular assembly based on 2D DEM datasets of biaxial testing [34] demonstrate that ML is a powerful tool for modeling the nonlinear relationships between high dimensional datasets.
Figure 1 shows the flowchart of the proposed ML-based modelling framework. The remainder of this paper is organized in the following manner. First, the research background is briefly introduced in Section 1. Then, the methodology of this study is explained in Section 2, which includes DEM simulations, data processing, dataset generation, and the construction of ANN model. Section 3 presents the results of the performance of the ANN model, which is evaluated using the ground truth of the DEM data of contact forces [35]. Besides, a detailed parametric study on the effects of features and data size on the model performance is also presented. The main conclusion of this study is given in Section 4.
2. Materials and Methods
2.1. DEM Model
We used the two-dimensional particle flow code PFC2D [36] to perform the biaxial test simulation. Five groups of simulations were conducted with the same model settings to create a big database for ML analysis. The sand sample is 150 mm in width and 300 mm in height, containing 6000 to 7000 uncrushable particles. The material is narrowly graded, with the largest and smallest particle diameters being 4 mm and 2 mm, respectively.
The biaxial test was simulated as per the following procedure. Four rigid sidewalls were first built to enclose and isotopically compress the sample to a target confining pressure of 300 kPa. Then, the left and right rigid walls were replaced by a flexible membrane [27,37,38] that was formed by a set of individual rows of frictionless and uniform 2 mm-diameter spherical particles linked by strong and flexible contact bonds and apt to flexible deformation. More information about the flexible membrane technique can be found in De Bono et al. [39]. Finally, the sample was compressed at a constant strain rate of 5 × 10⁻⁵ m/s until the axial strain of 0.15 was reached. The parameters used in the simulation are given in Table 1.
During the shearing process, the DEM data of contact (i.e., contact orientation and the magnitude of contact force) and all contacted particle pairs (i.e., particle size, x-velocity, y-velocity, and spin) were recorded every 20,000 timesteps.
2.2. DEM Data
The simulation was performed on a workstation with Intel Xeon Gold 6154 processors (3.0 GHz, Skylake-SP) with 18-core×2-CPU and 192 GB of main memory. The computational efficiency mainly depends on the number of grains and the size of stored data. The computation time used for a complete simulation is about 4 days.
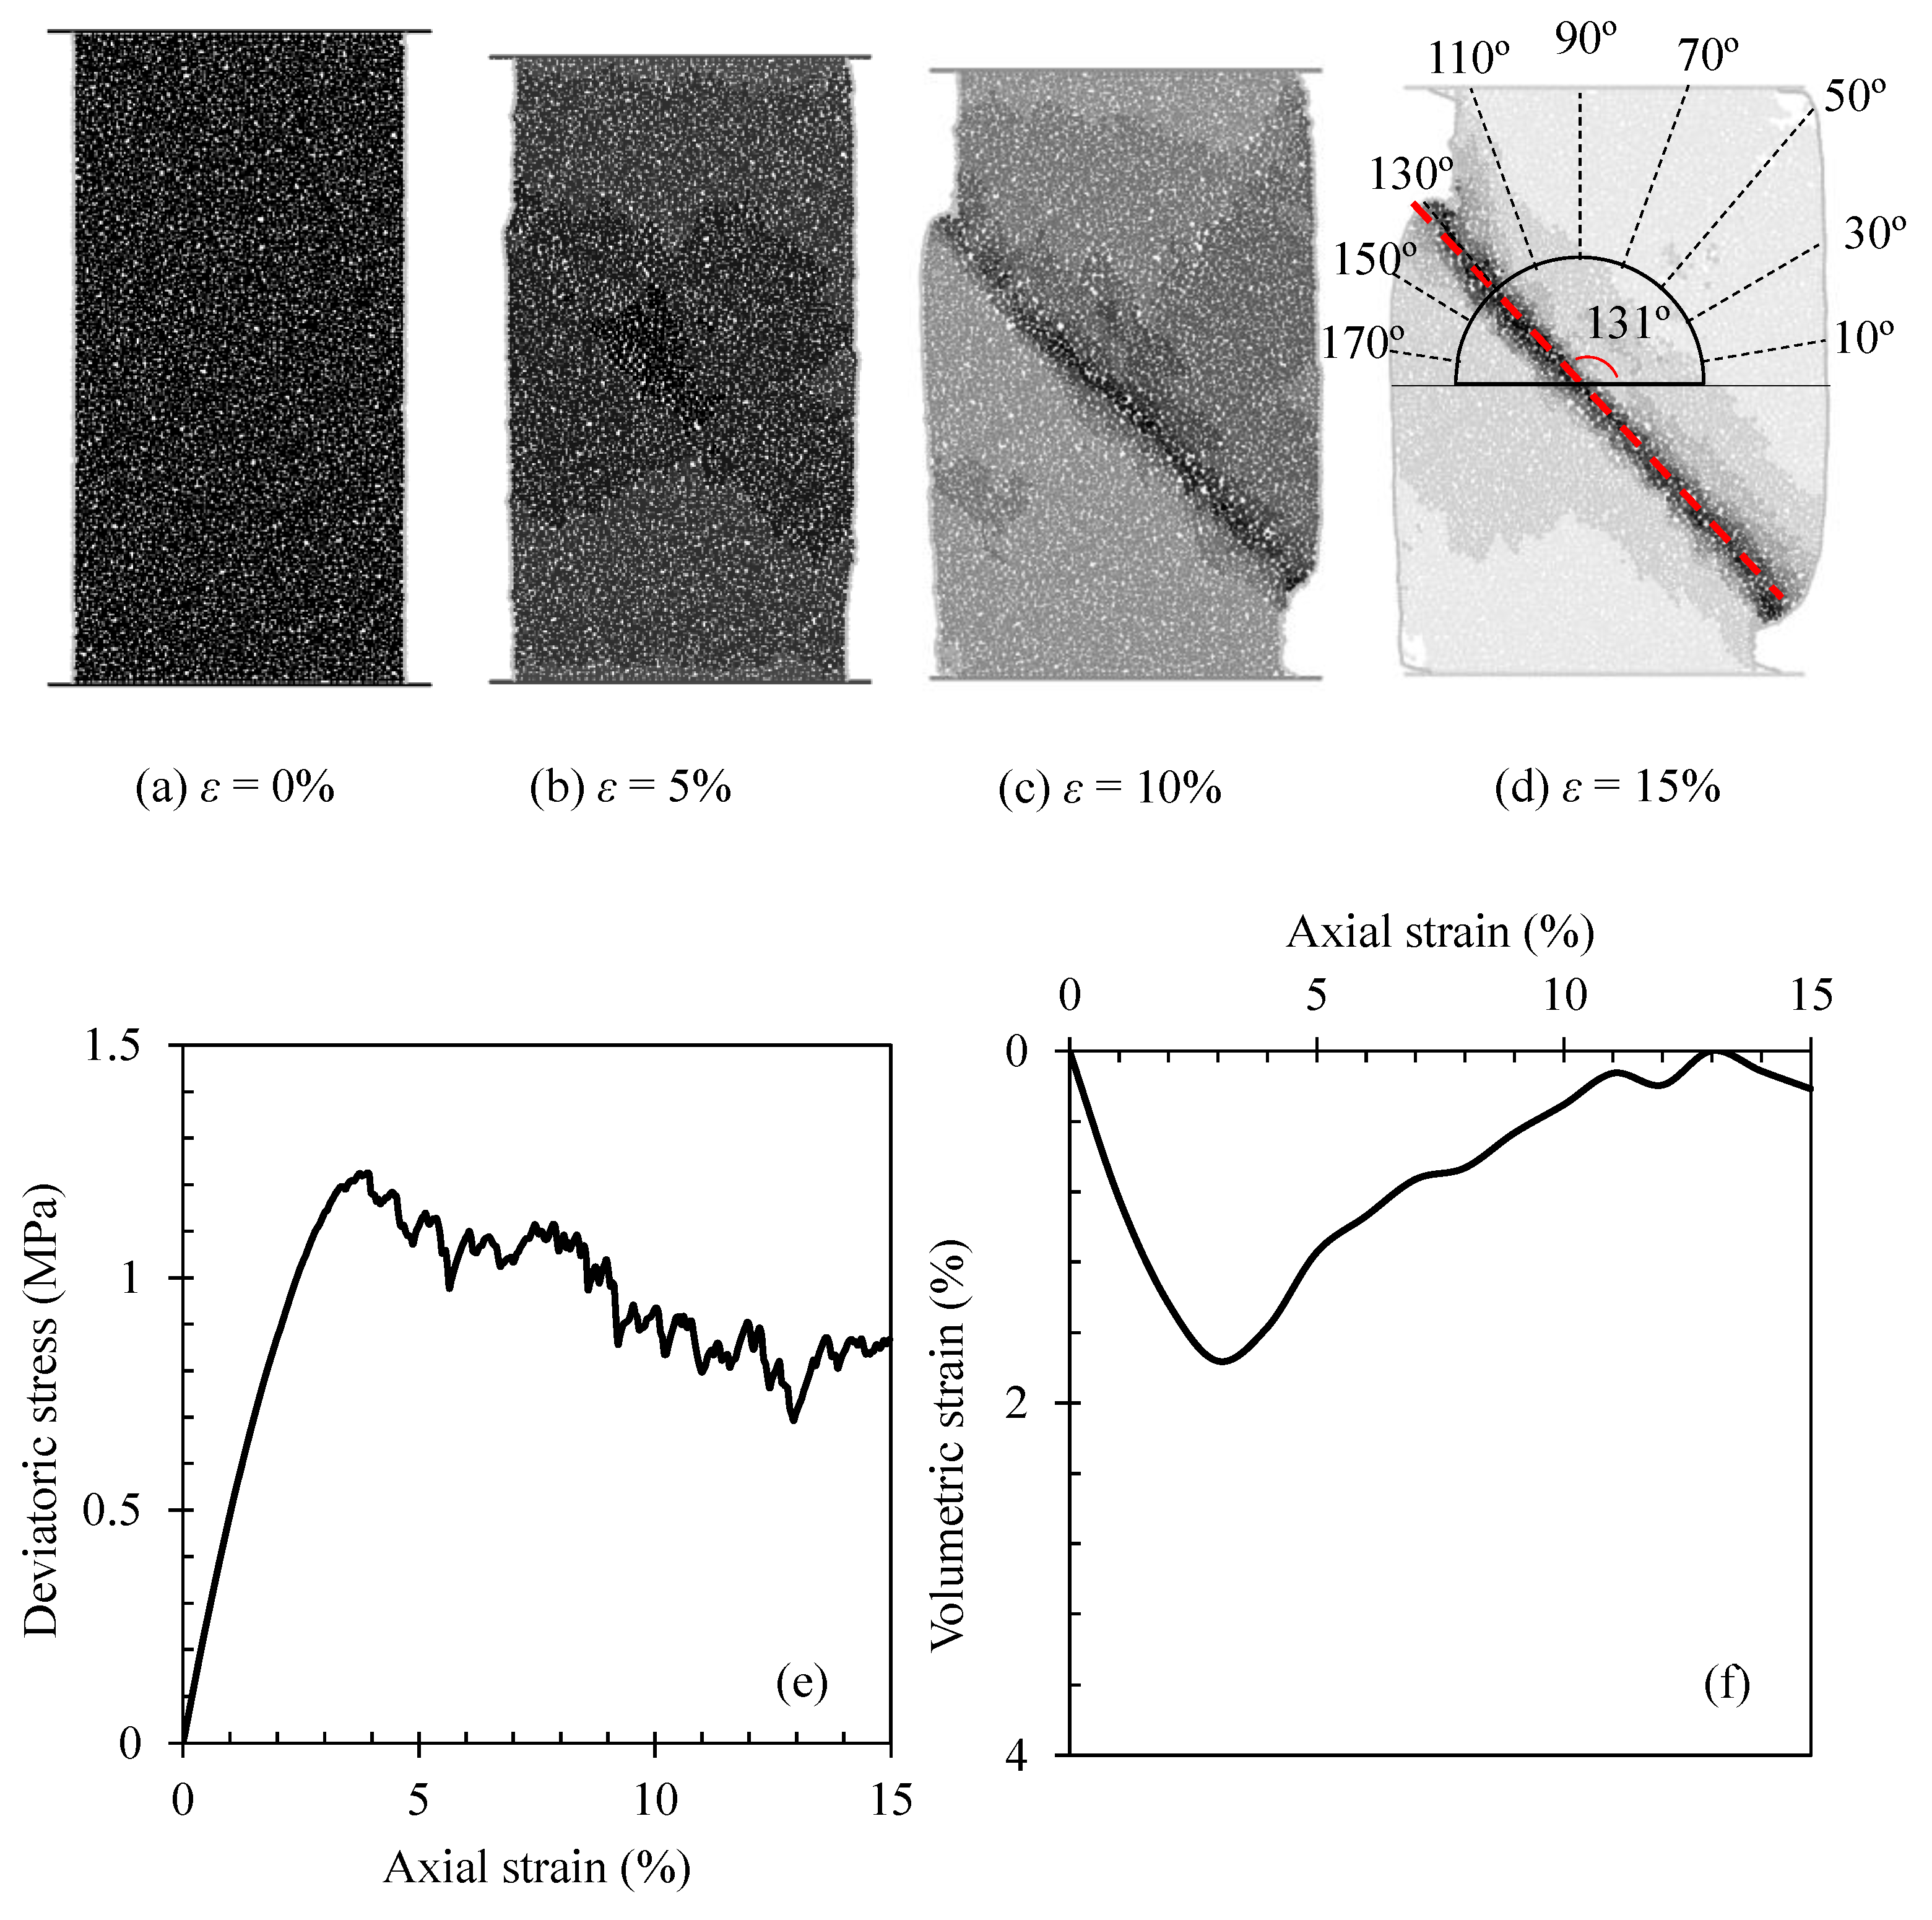
Figure 2a–d show the evolution of particle displacement during the shearing process. We can see that, with the sketch of a simplified protractor on Figure 2d, the sample exhibits failure along a shear band oriented at 131° (rotating counter-clockwise) from the horizontal. The typical curves of deviatoric stress vs. axial strain and volumetric strain vs. axial strain are shown in Figure 2e, f, respectively. The peak deviatoric stress is about 1.2 MPa under the confining pressure of 300 kPa.
Figure 3a–d show the evolution of contact networks within the sample at the axial strains of 0%, 5%, 10%, and 15%, respectively. It is seen that the distribution of contact networks is uniform and isotropic at the initial state. As shearing progresses, the contact force distribution shifts slightly from the isotropic state to the vertical-prevailing state. Consequently, the distribution frequency undergoes a significant loss in the horizontal direction and a distinct gain in the vertical direction. For the ease of quantifying the heterogeneous distribution of contact force networks, all the data were discretized into a set of equally spaced bins and characterized by an angular histogram, as shown in Figure 3e–h. It is seen that the evolution of the frequency of contact forces in each bin during the whole shearing test is clearly visualized.
Based on this statistical analysis, an ANN model was constructed in each bin to identify the functional relationship between the contact force and the five particle-scale features. Before training the ANN model, the input and output datasets need some preprocessing to reduce the computational cost. The detailed procedure, using the contact force as an example, is described as follows. The same procedure applies to the processing of the five particle-scale features. For each record, firstly, all the contact force orientations are discretized into 180 equally spaced bins and characterized by an angular histogram. Therefore, for a given contact, its contact force and the average particle size, velocity and spin of the two associated particles are grouped accordingly. Secondly, the values of all the contact forces within the same bin are summed up. Lastly, the summed contact force value in each bin is normalized with respect to the maximum value of the summed contact force among all the bins so that they all range from 0 to 1. The above steps are performed iteratively until all the records are processed.
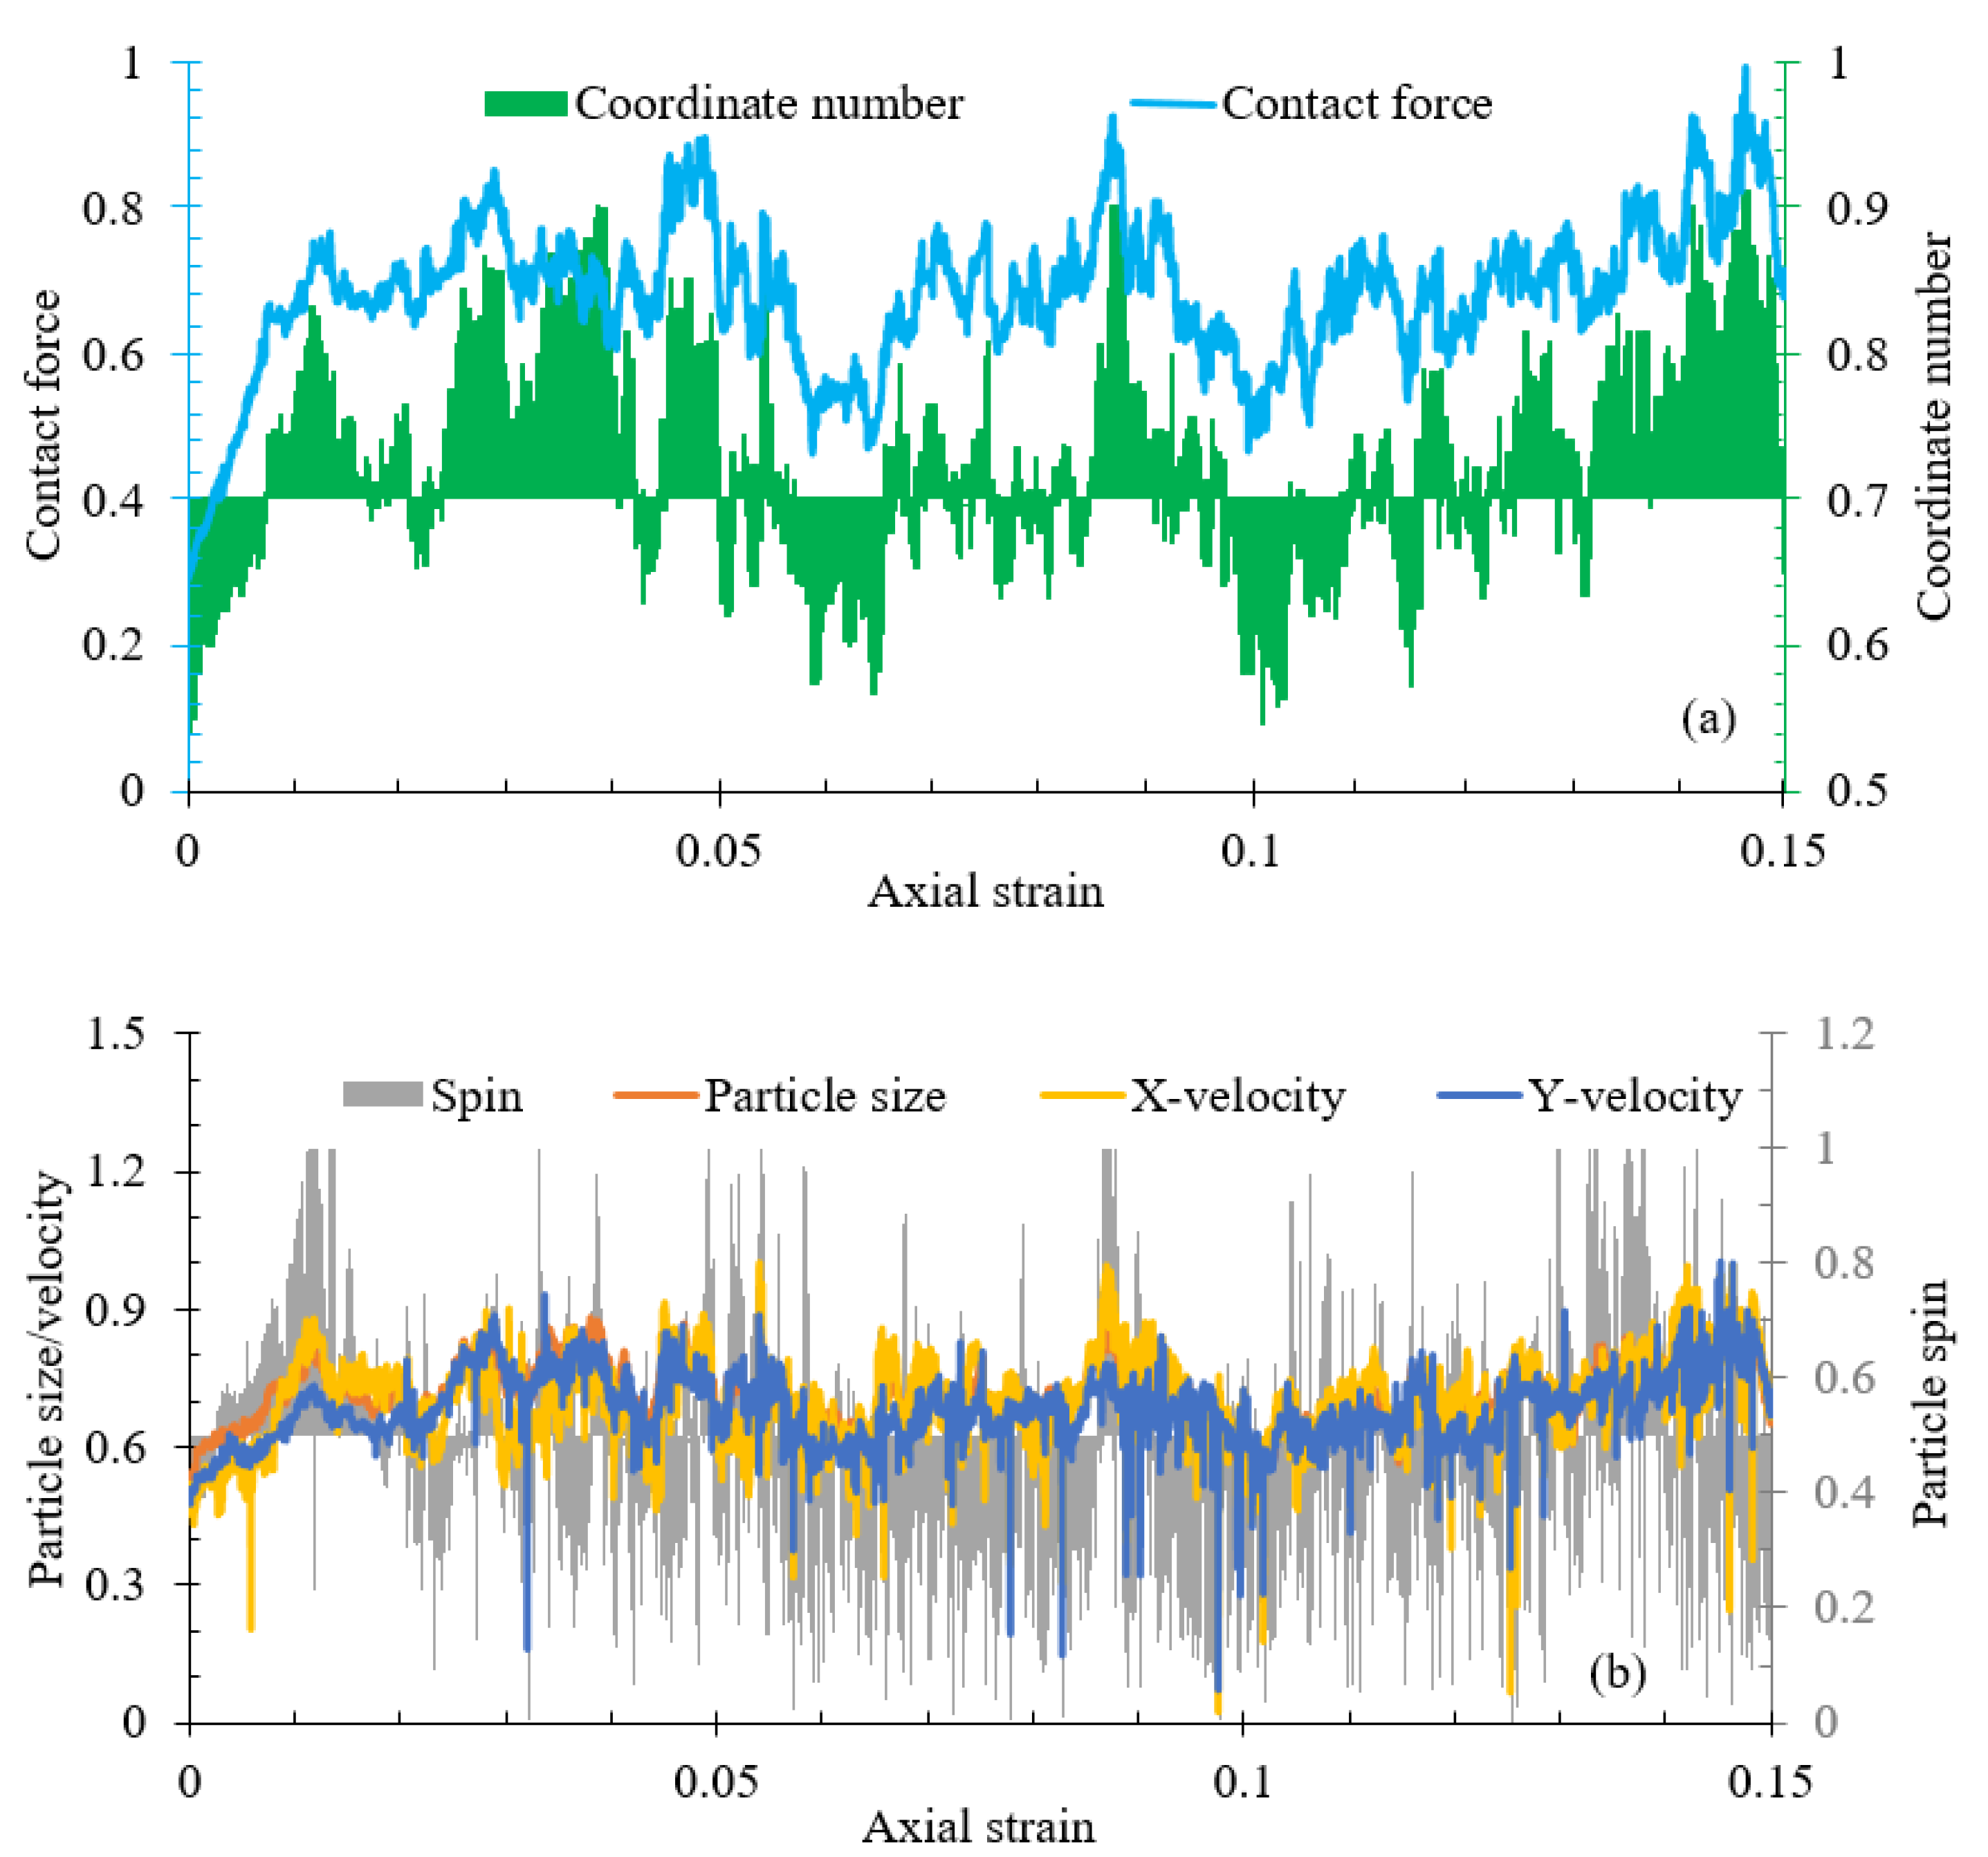
Figure 4a compares the typical evolutions of the contact force and the coordination number within the bin of [79°, 80°] throughout the shearing process. It can be seen that there is a strong positive relationship between them during the shearing process. Figure 4b shows the evolutions of other particle-scale features. We can see that the contact force also has a strong relationship with the rest of particle-scale information except for the particle spin, which has more obvious fluctuations after yielding.
2.3. Artificial Neural Network
Generally, there are three important types of neural networks, i.e., ANN, convolution neural networks (CNN) and recurrent neural networks (RNN), and each of them is tailored to certain types of tasks [40]. CNN models are commonly used to analyze visual imagery and frequently perform image classification work. RNN models are ubiquitous in sequence-to-sequence tasks such as speech recognition and machine translation, while ANN models are suitable for processing tabular data [40]. Therefore, the multilayer feedforward ANN model was adopted in the current study.
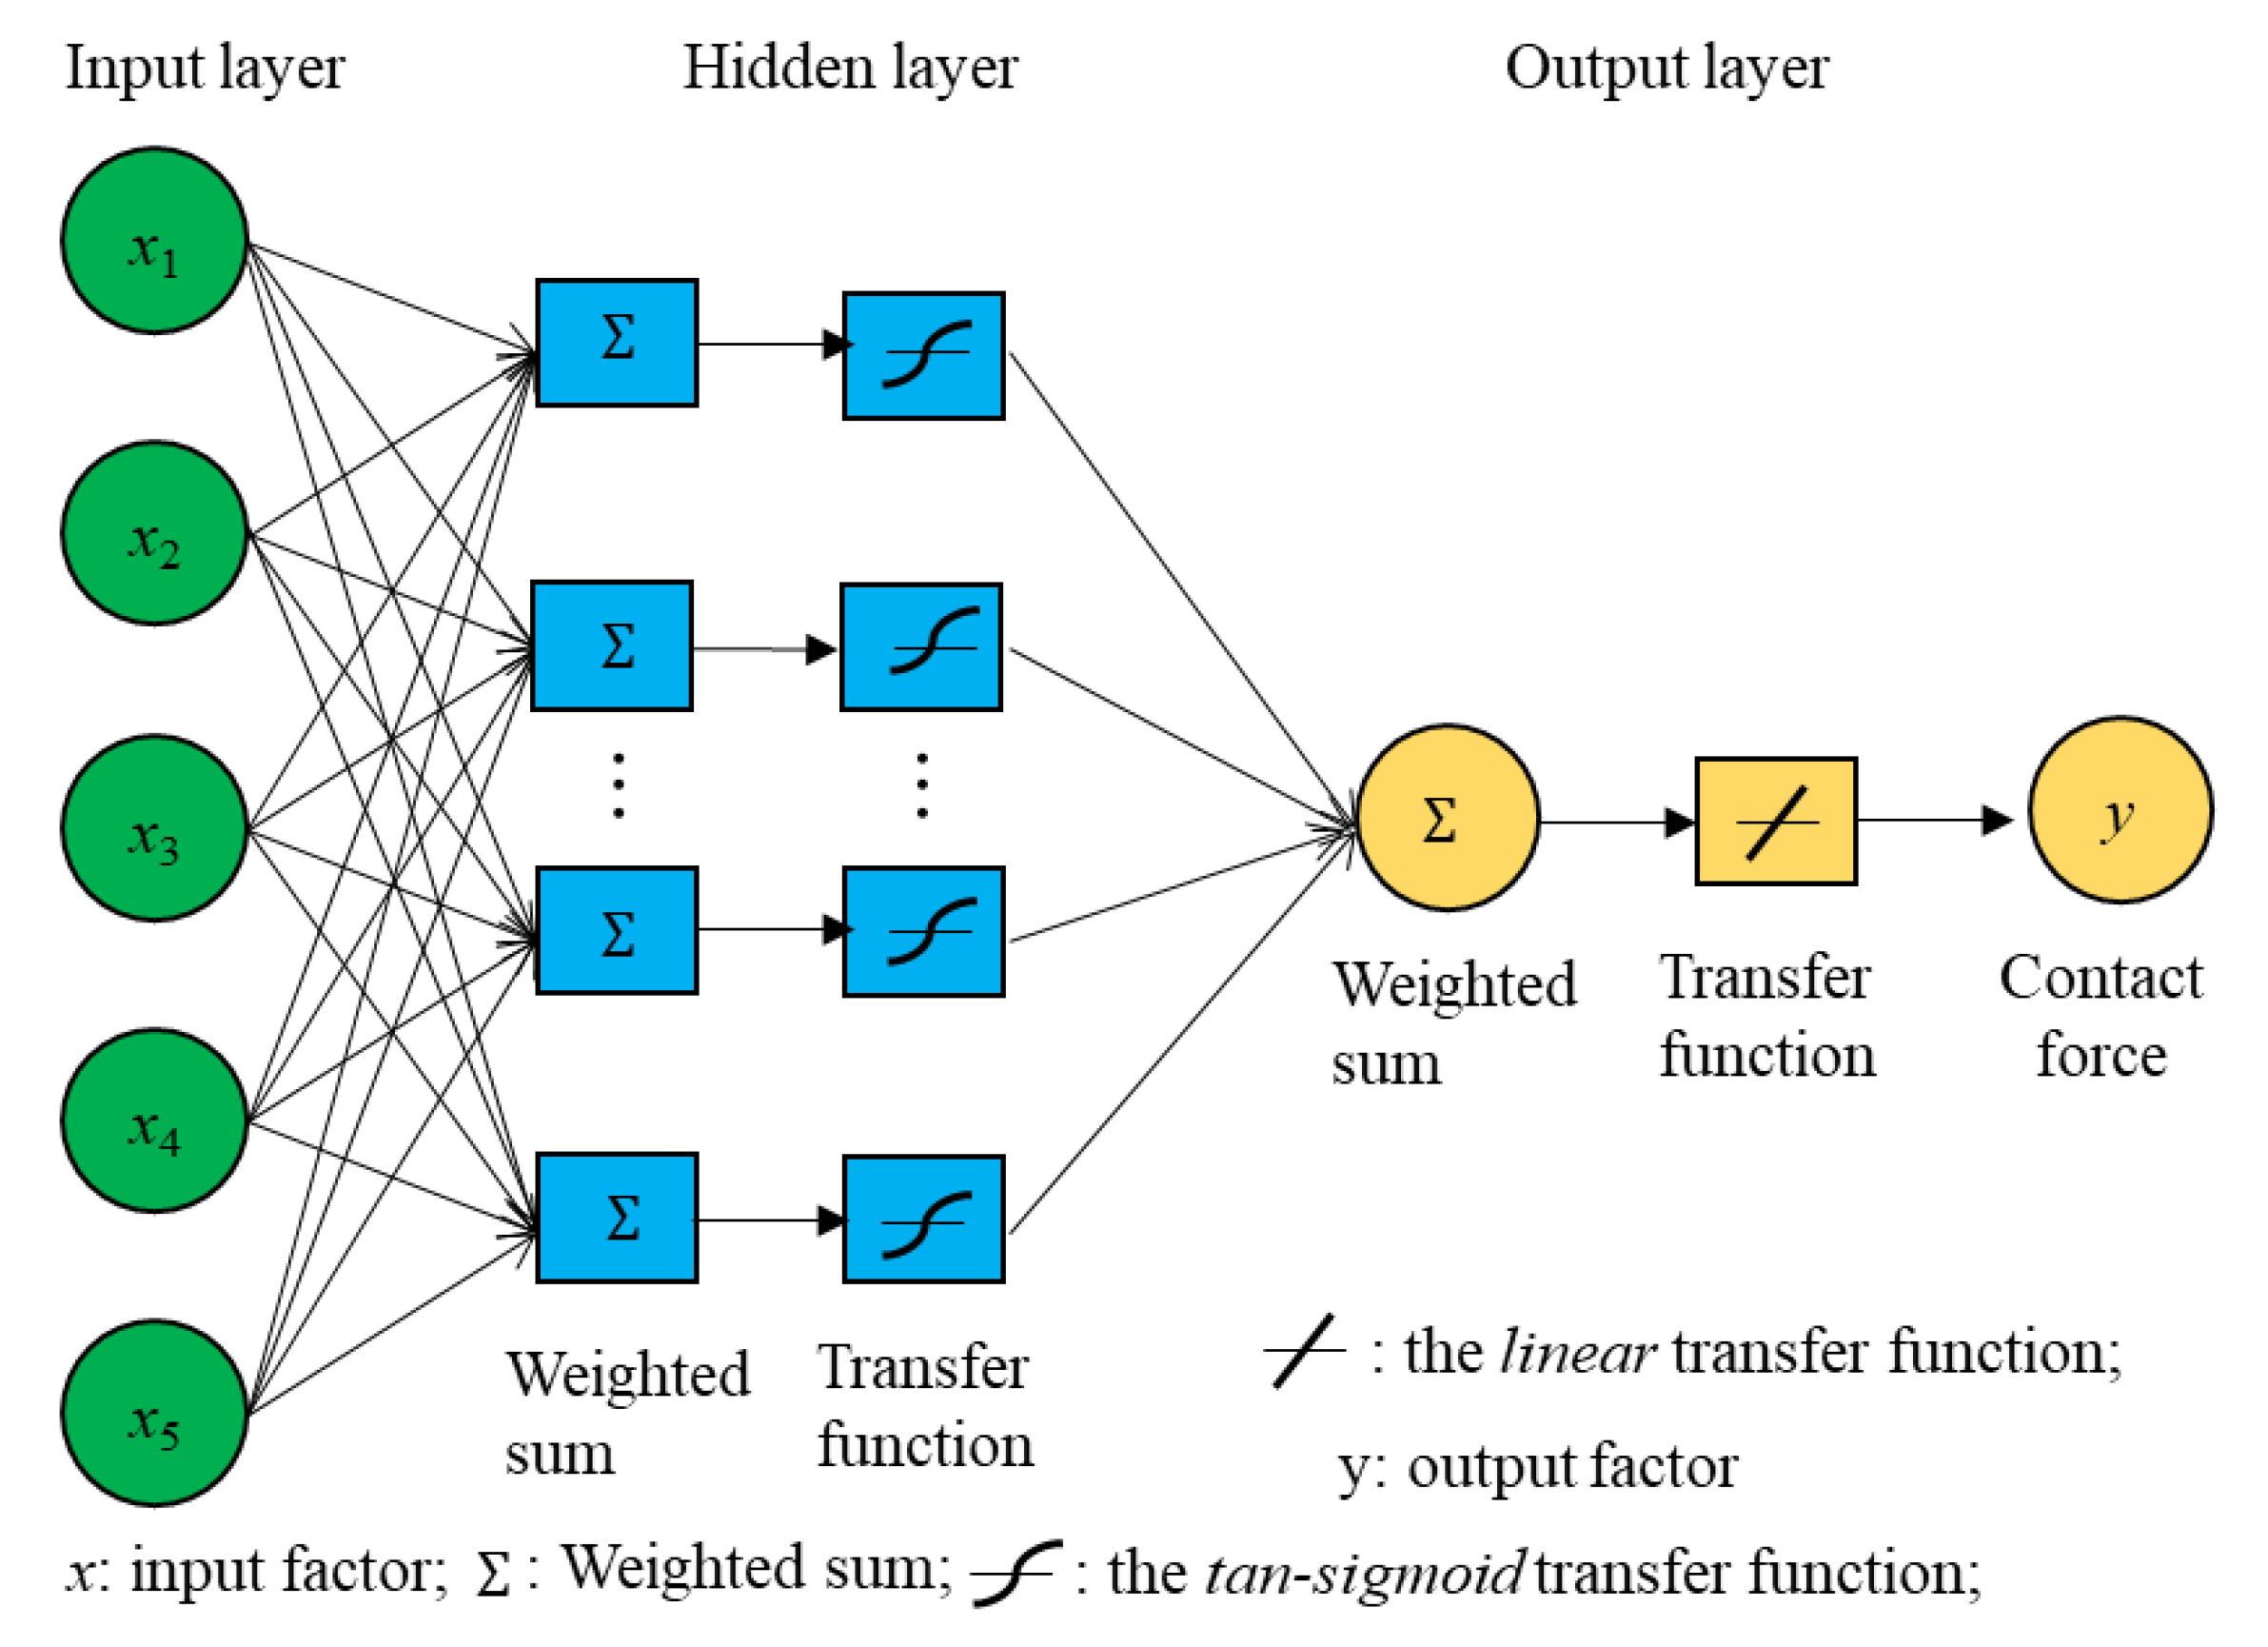
A typical multilayer feedforward ANN model is designed and shown in Figure 5. It consists of nodes or neurons in three layers: an input layer, an output layer and a hidden layer. The links between nodes of adjacent layers have weights and biases associated with them. The purpose of learning is to assign correct parameters (i.e., weights and biases) for these edges. For the nodes in the input layer, their function is to pass the information to the hidden nodes through the edges with associated weights and biases and no computation is performed in any of the input nodes. The number of nodes used in the input layer is equal to the number of input features. For the nodes in the hidden layer, they perform computations by summing the weighted inputs and the bias and transferring the computational result through the tan-sigmoid transfer function, f(x) = 2/(1 + e−2x) − 1 [41]. The number of neurons in the hidden layer is 10. Generally, the number of hidden neurons has a significant influence on the power of the network. Increasing the number of hidden neurons increases the network performance, but needs more computational resources. The output layer has one node with a linear transfer function, f(x) = x. This node receives input from the hidden layer and performs similar computations as illustrated for the hidden nodes.
We train the constructed ANN model by adjusting the weights and biases of these edges to optimize network performance. The training function is the Levenberg–Marquardt algorithm, which can be thought of as a combination of gradient descent and the Gauss–Newton method [42]. The Levenberg–Marquardt method behaves more like a gradient-descent method when the parameters are far from the correct one, and behaves more like the Gauss–Newton method when the parameters are close to the correct solution, by assigning a similar damping factor. The correlation coefficients between the outputs and targets are adopted to assess the performance of the trained or tested model.
Four groups of simulated data are chosen to train the ANN model, which uses a set of examples to regress the parameters (e.g., weights and biases of the links between nodes of adjacent layers). The remaining one is used to test the fully trained model. In the training phase, both the five particle-scale features used as input and the contact force as label are provided. In the testing phase, we aim to predict the anisotropy of CFC by only providing these five particle-scale features. The performance of the model is evaluated by the correlation coefficient.
3. Results
3.1. Predicting Contact Force Chains
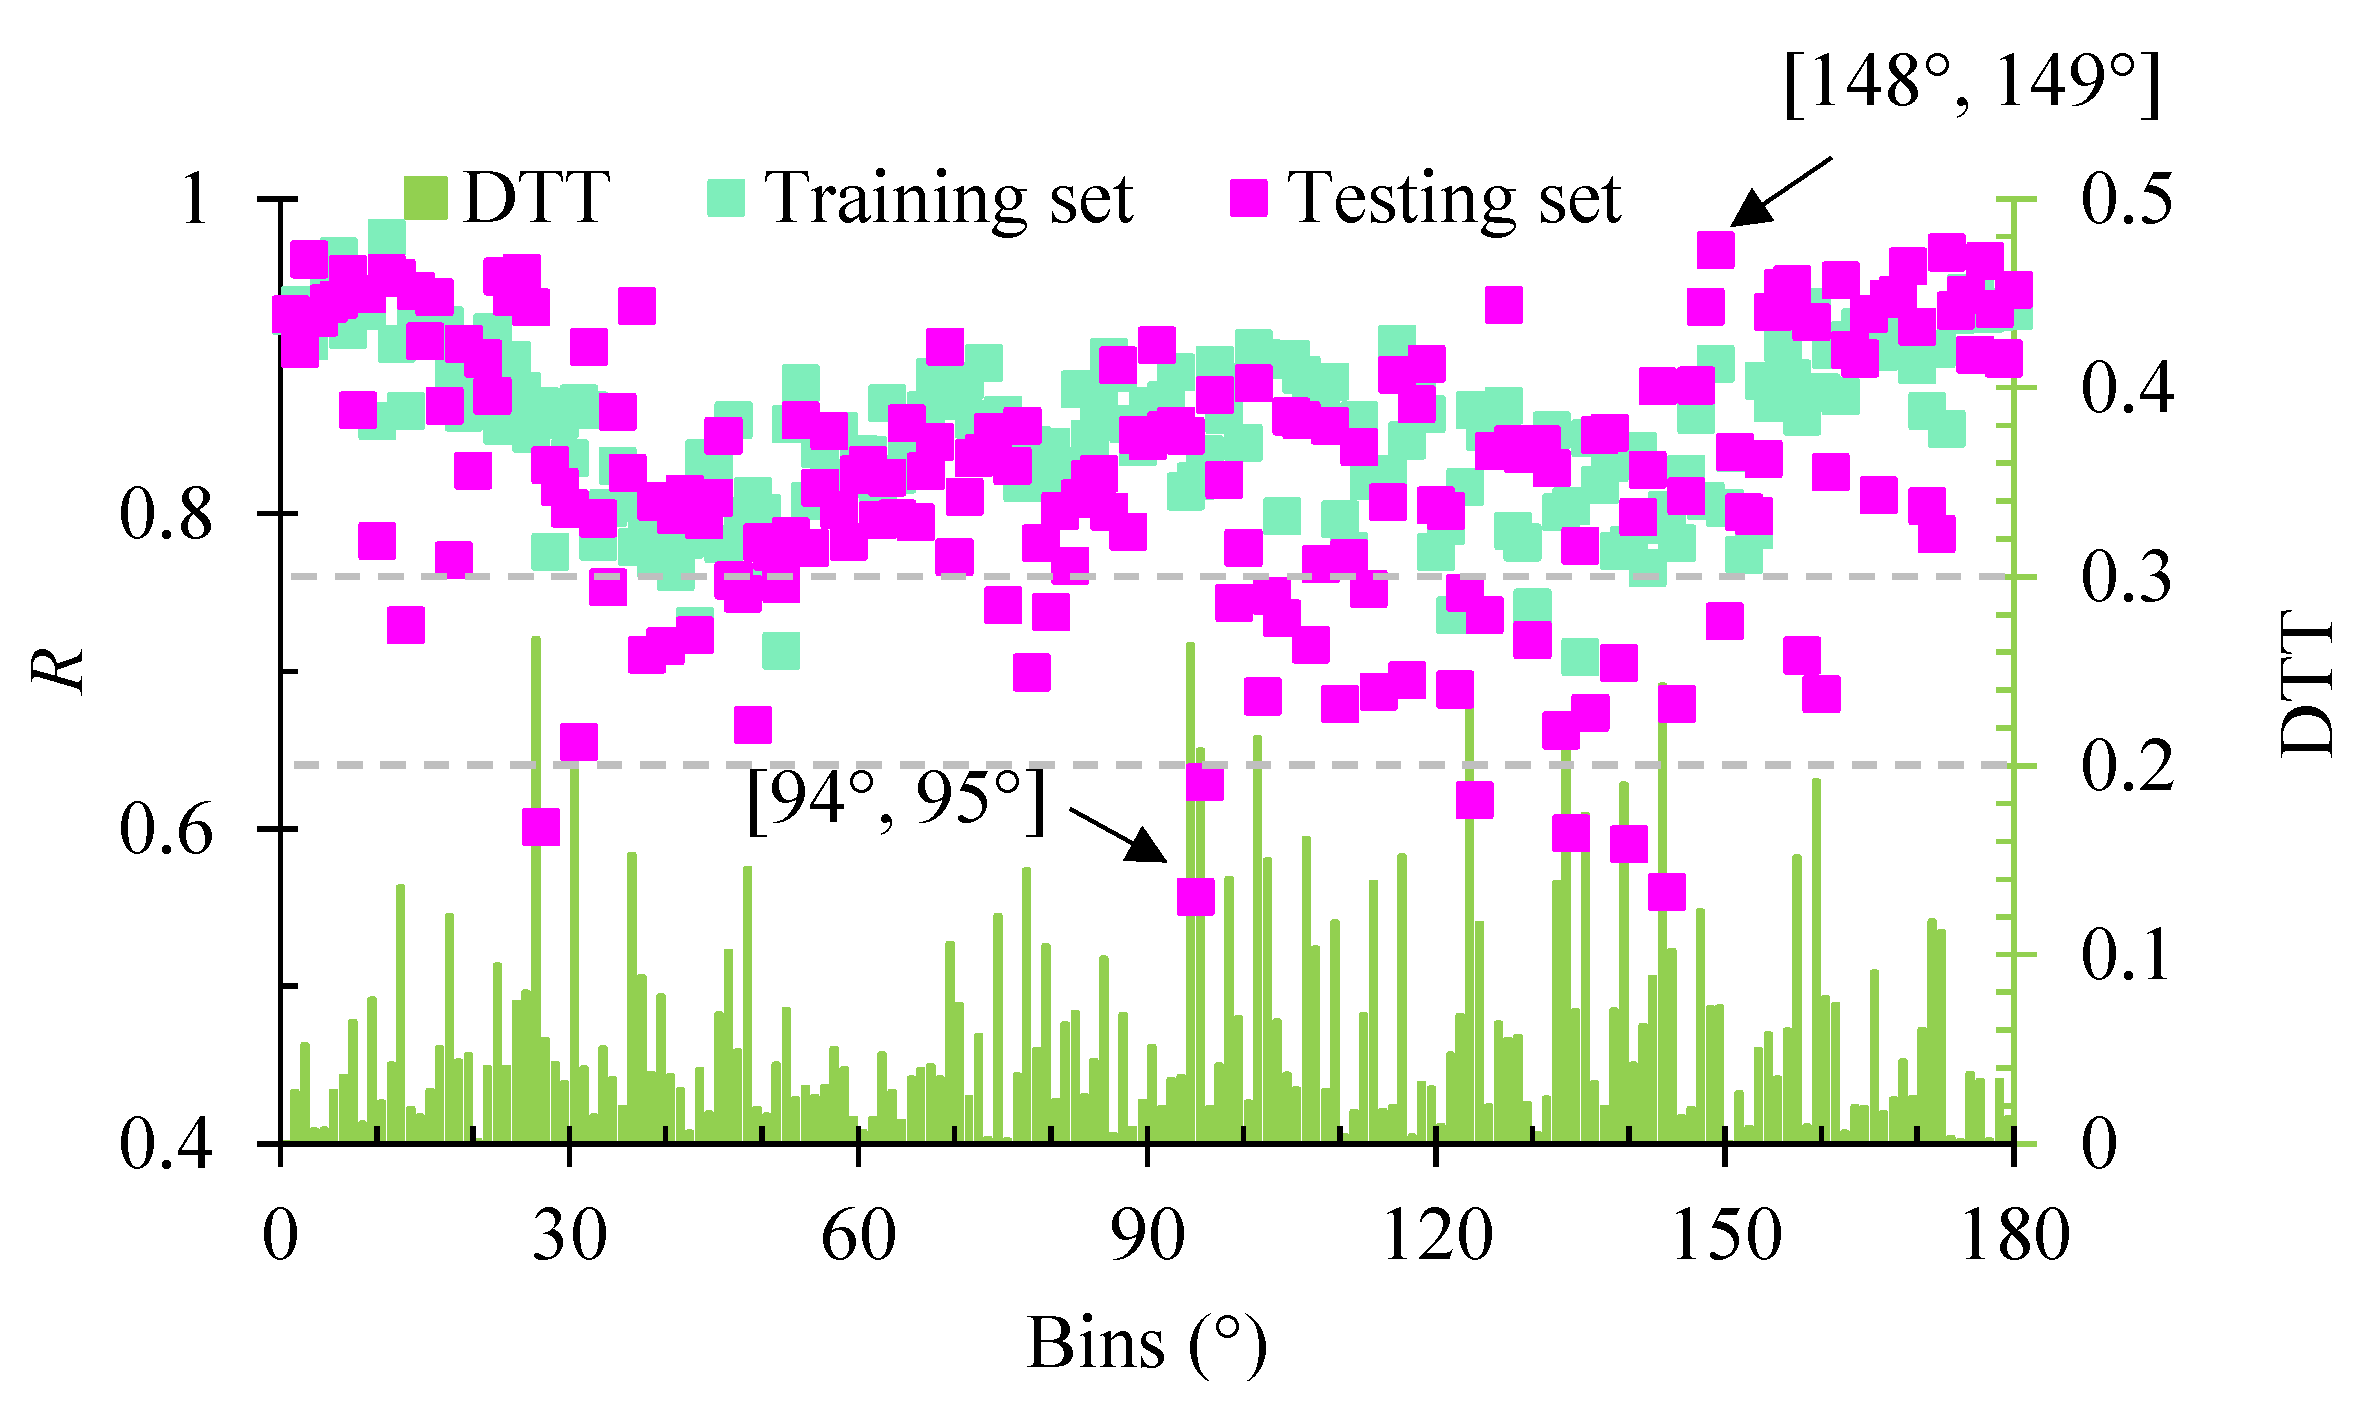
The dimensions of each feature in the training set are 40,000 × 180, where 40,000 is the number of records and 180 is the number of bins. Note that all bins are independent of each other. The ANN model is trained and tested in each bin. The R values of all bins for the training set are shown in Figure 6. We can see that the trained models perform well in all bins, with the maximum and minimum R values being 0.975 and 0.709, respectively. The median value and standard deviation of R for the training set are 0.859 and 0.05, respectively. This result indicates that there is a nonlinear functional relationship between the input (i.e., five particle-scale features) and output (i.e., contact force). This result also means that the anisotropy of CFC in sheared granular systems represented by a rose diagram can be estimated separately using the proposed ANN model, which was impossible before such a technique was developed. Compared with other bins, the bins in the ranges of [30°, 60°] and [120°, 150°] have smaller values of R mainly because of the development of the shear band. Such a result is reasonably expected, because as Cheng [16] noted, higher frequencies of contact gain and contact loss occur within the shear bands, which leads the trained model to be less effective in the directions aligned with the shear band.
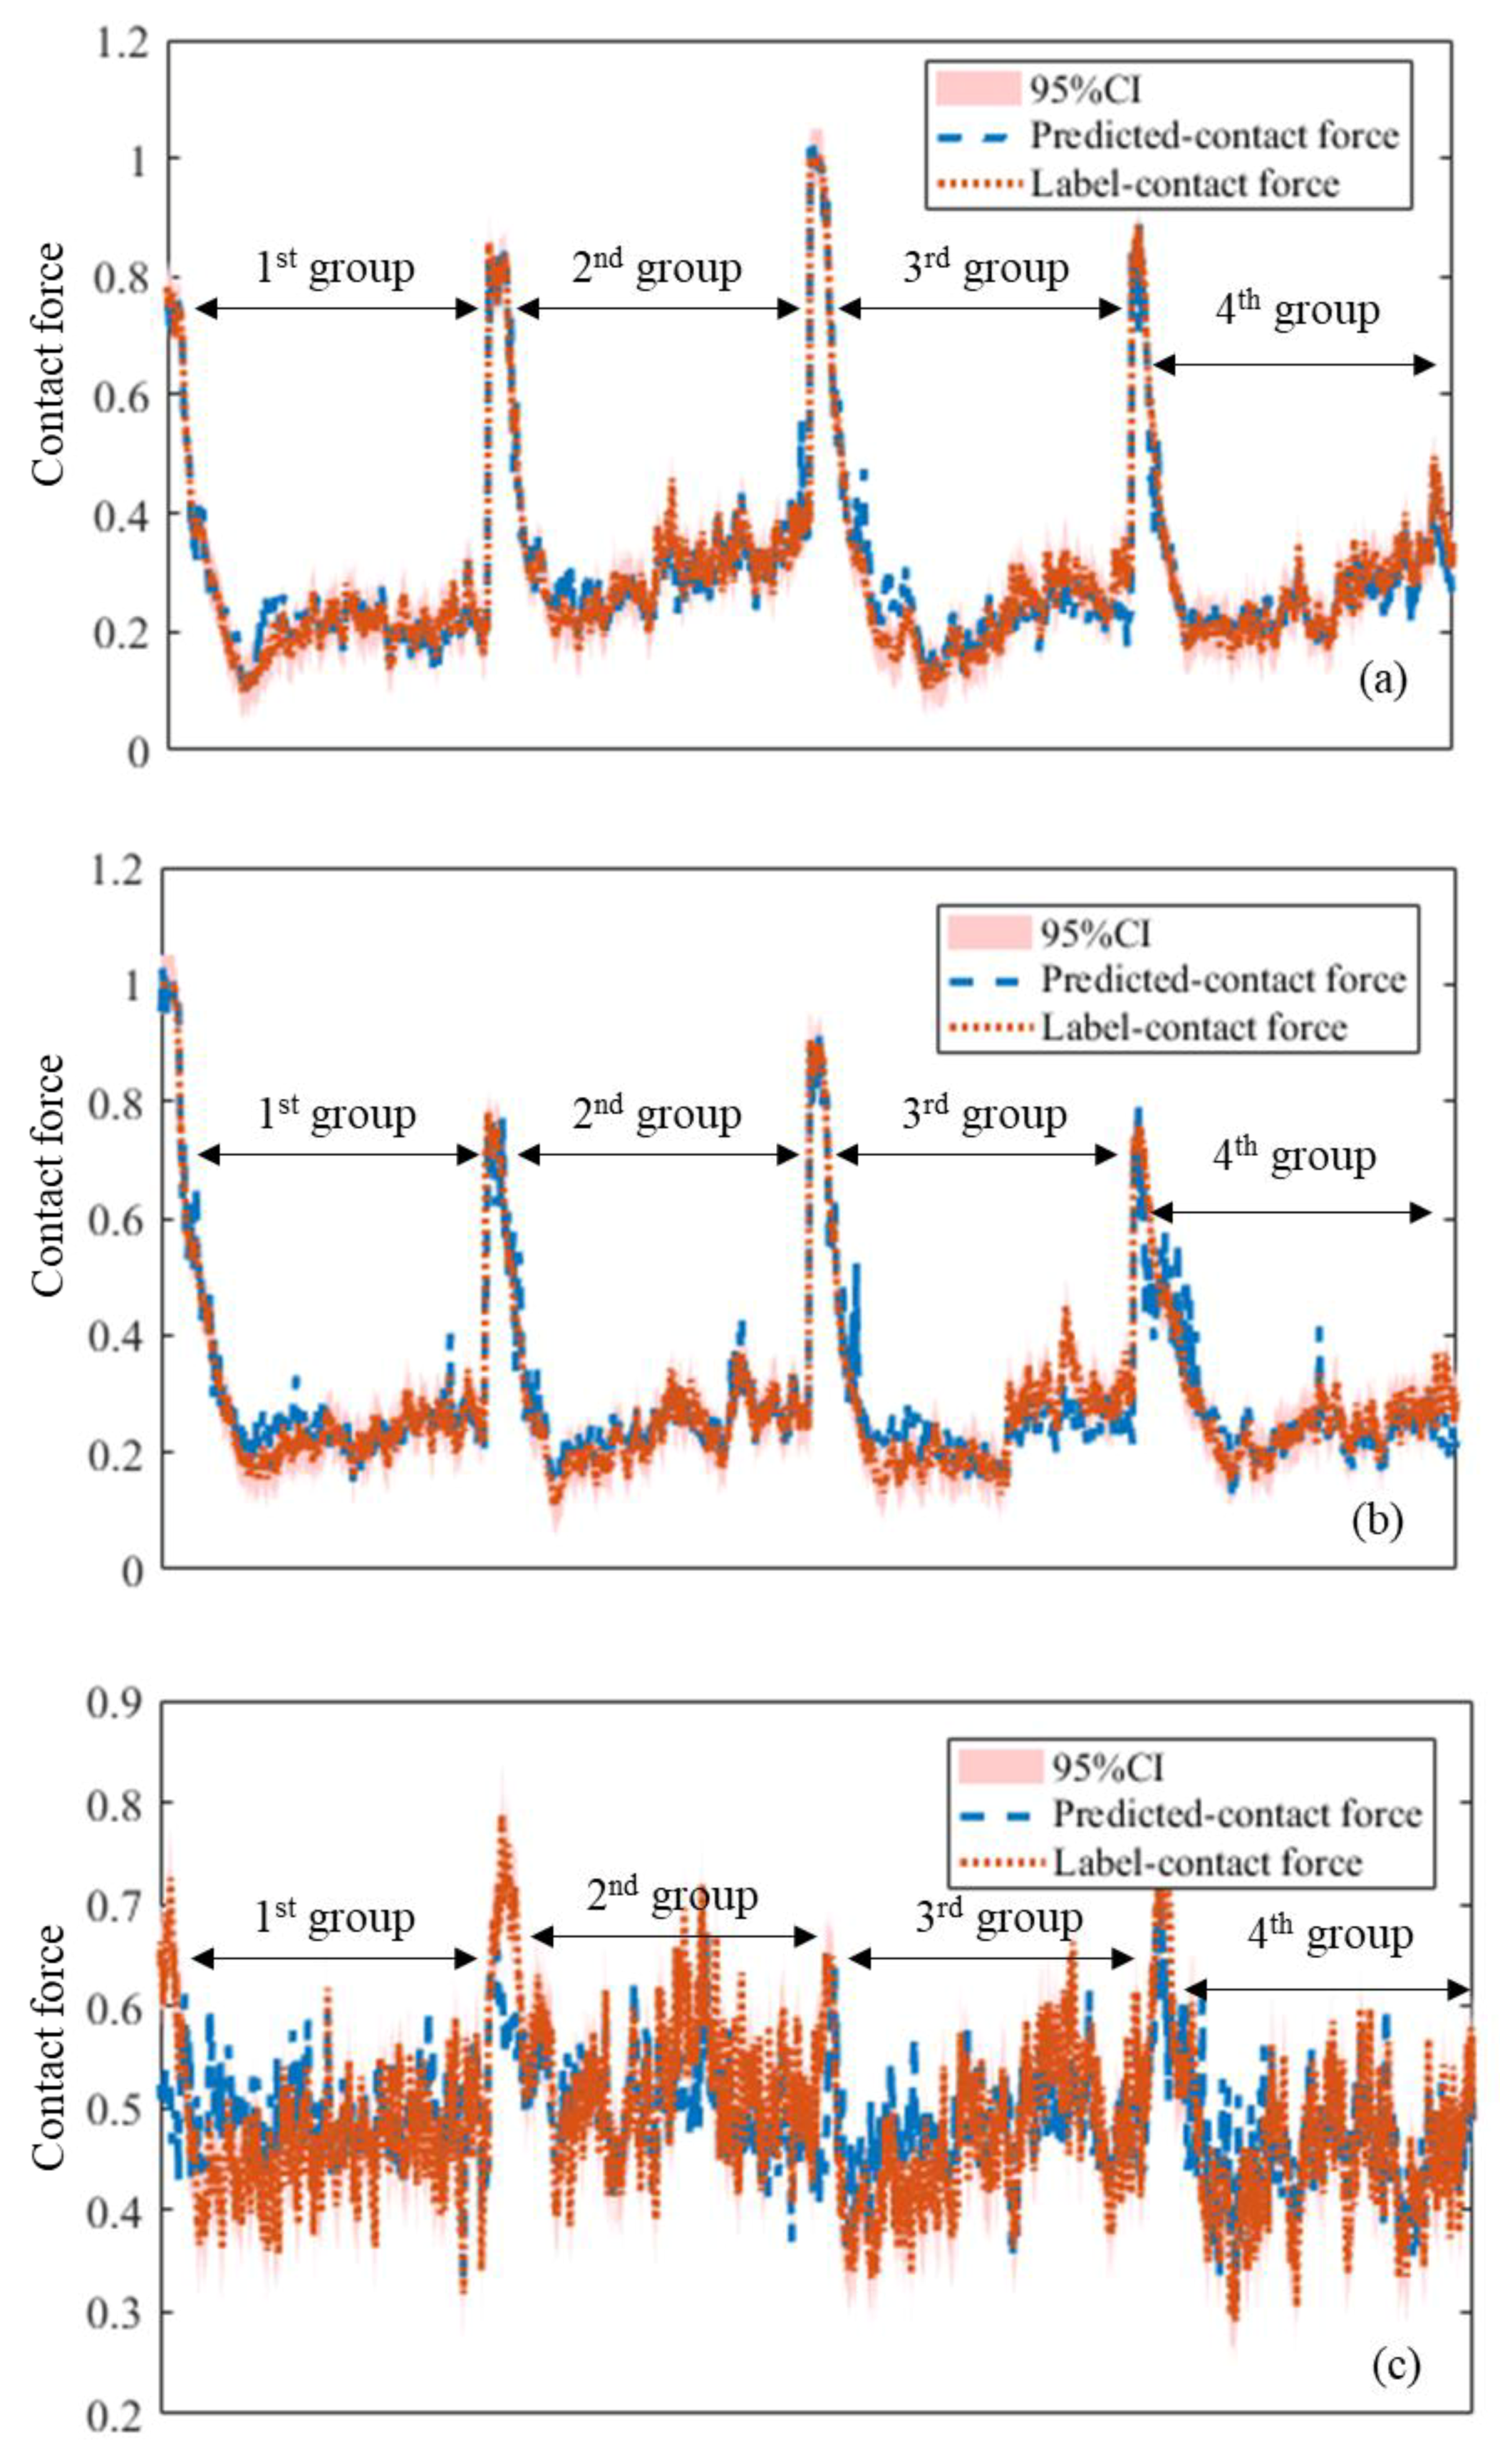
Two bins (i.e., [10°, 11°] and [5°, 6°]) with good model performance in the training set and a bin ([42°, 43°]) located within the shear band with a smaller value of R were selected for comparing their training output with the ground truth. The comparison results are shown in Figure 7. For the bins of [10°, 11°] and [5°, 6°], we can see that the estimated contact forces agree well with the ground truth derived from the DEM simulations. Along the horizontal direction, the contact force decreases before shear band forms and remains stable afterward. For the bin of [42°, 43°], we can see that the predicted contact forces match the fluctuated ground truth, although there is some difference between them. The above results demonstrate again the high capability and robustness of the proposed ANN model.
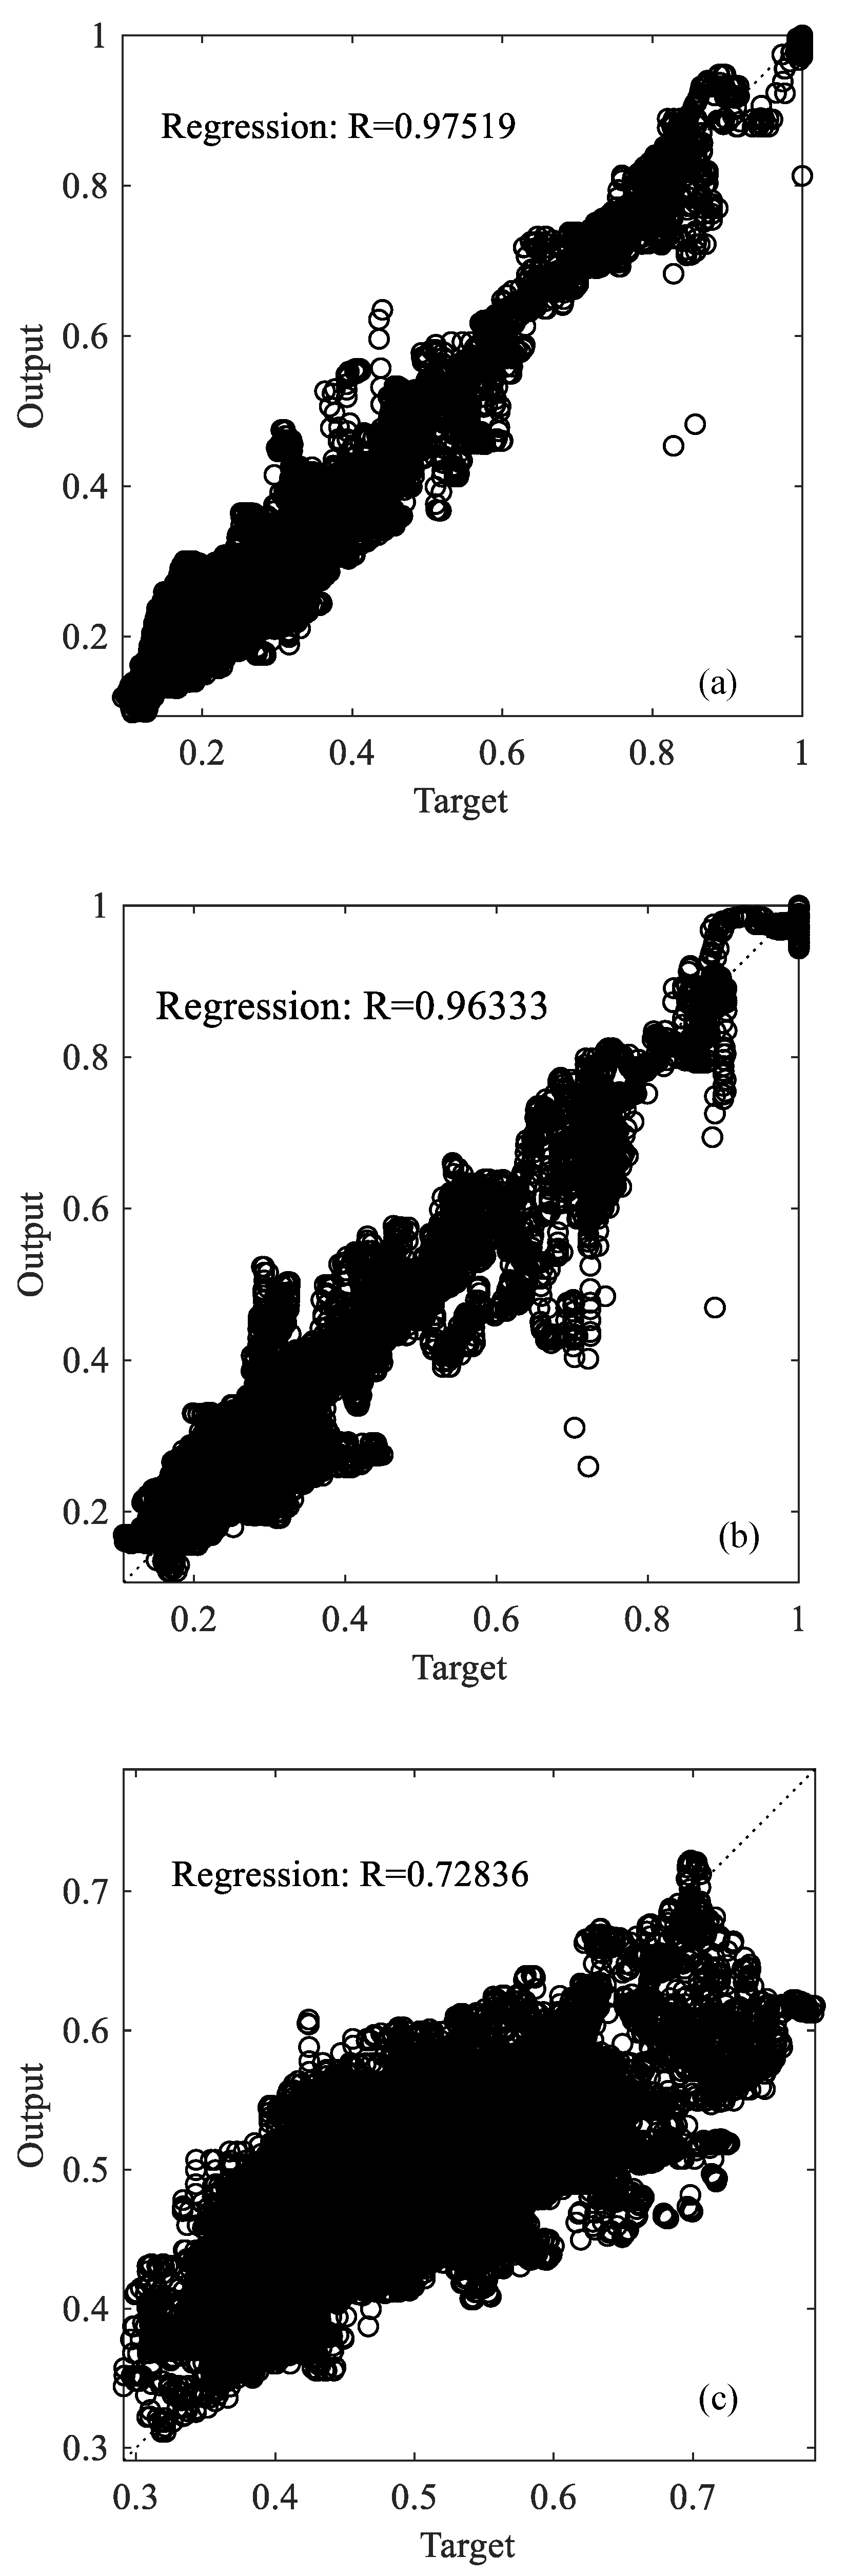
Figure 8 displays the network outputs vs. targets for the three selected bins in the training set. Ideally, the data should fall along the 45° line, where the network outputs are equal to the targets. For the current problem, the matches are reasonably good in the bins of [10°, 11°] and [5°, 6°], with the R values being 0.975 and 0.963, respectively. In the bin of [42°, 43°], with the R value of 0.728, the accuracy level of the model prediction of the contact forces is also acceptable.
The R values of all bins for the testing set are also shown in Figure 6. It can be seen that the tested model in the bin of [148°, 149°] having the R value of 0.967 shows the best performance among all models, while the model in the bin of [94°, 95°] having the R value of 0.556 shows the worst performance. The median value and standard deviation of R are 0.827 and 0.09 for the testing set, respectively. Overall, the distributions of the R values of both the tested and trained models show a general trend of decreasing performance levels from the horizontal direction to the vertical direction, with the lowest performance seen in the bin ranges of [30°, 60°] and [120°, 150°] which are approximately aligned with the shear band orientation (Figure 2d).
To avoid the problem of overfitting, the absolute difference, namely DDT, between the correlation coefficient of the training set and that of the testing set was calculated, as shown in Figure 6. Overfitting occurs when a model studies the details and the noise in the training data to the extent that it negatively affects the performance of the model on new data. It is found that 81.1% of the bins have the DTT values below 0.1 and only less than 5% of the bins have the DTT values greater than 0.2, indicating that the problem of overfitting occurring in the training stage is largely avoided. The median value and standard deviation of DTT are 0.04 and 0.05, respectively. Note that increasing the total amount of data in the training set will decrease the chance of overfitting.
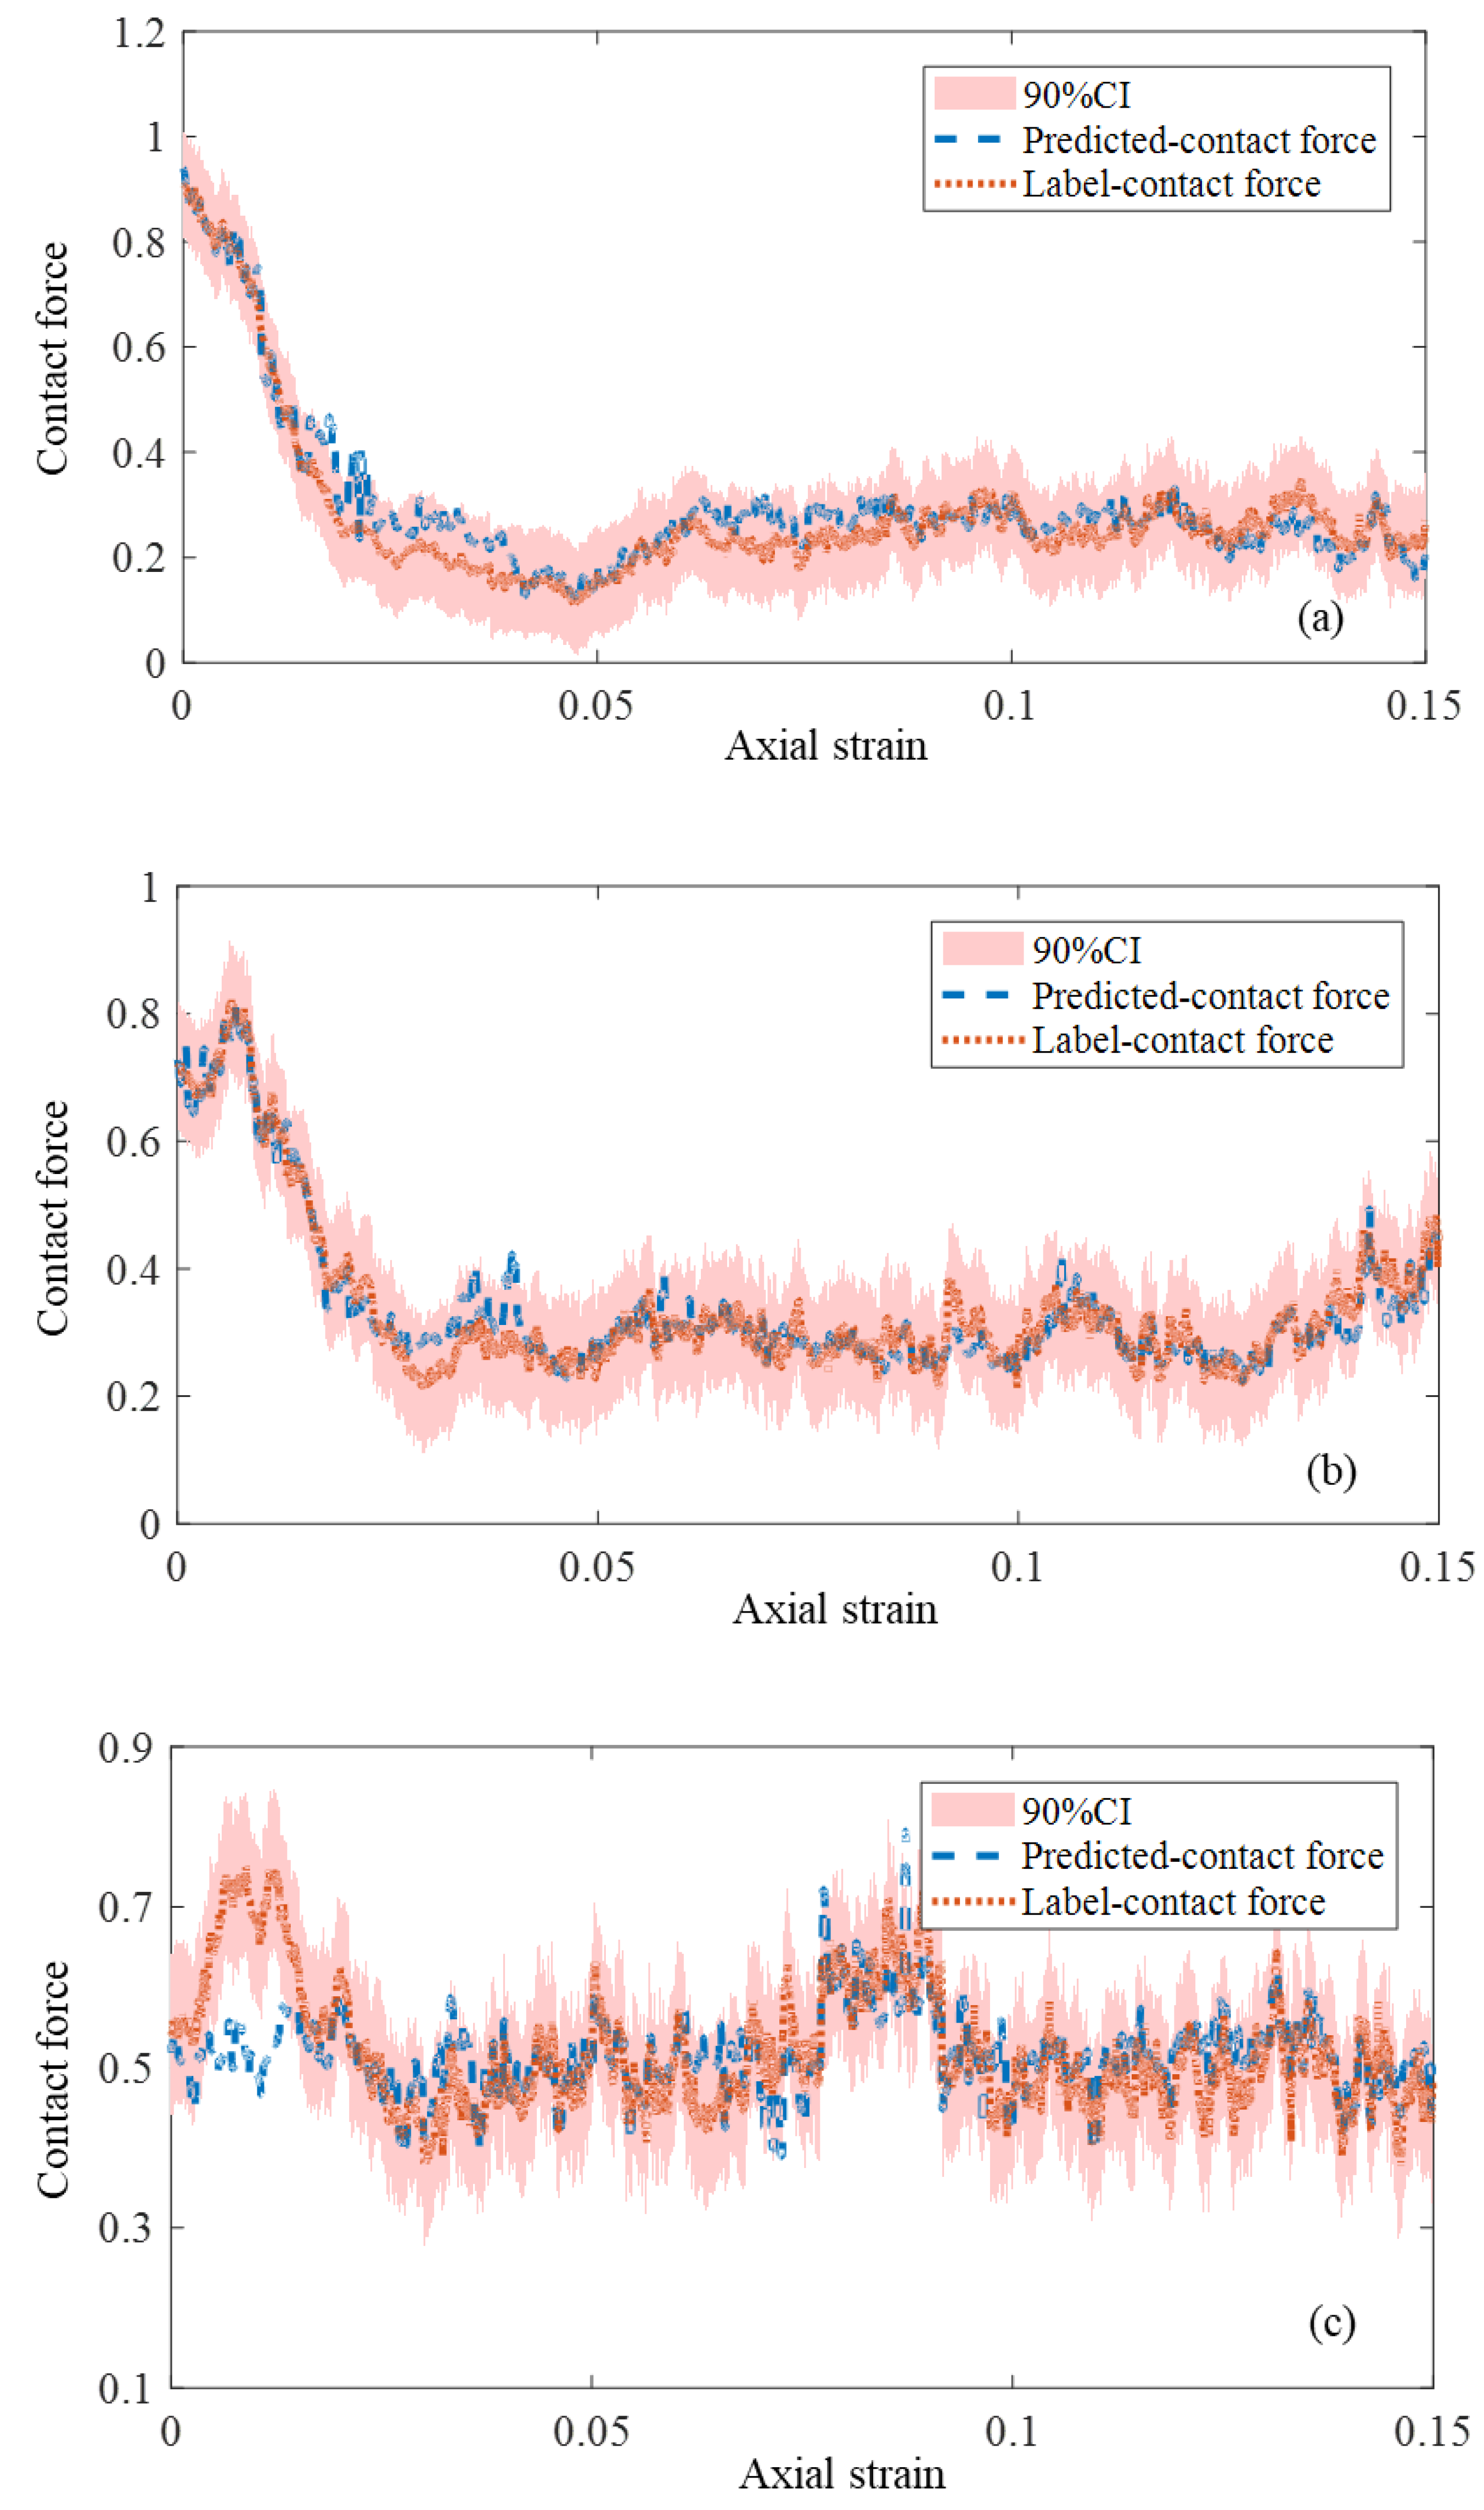
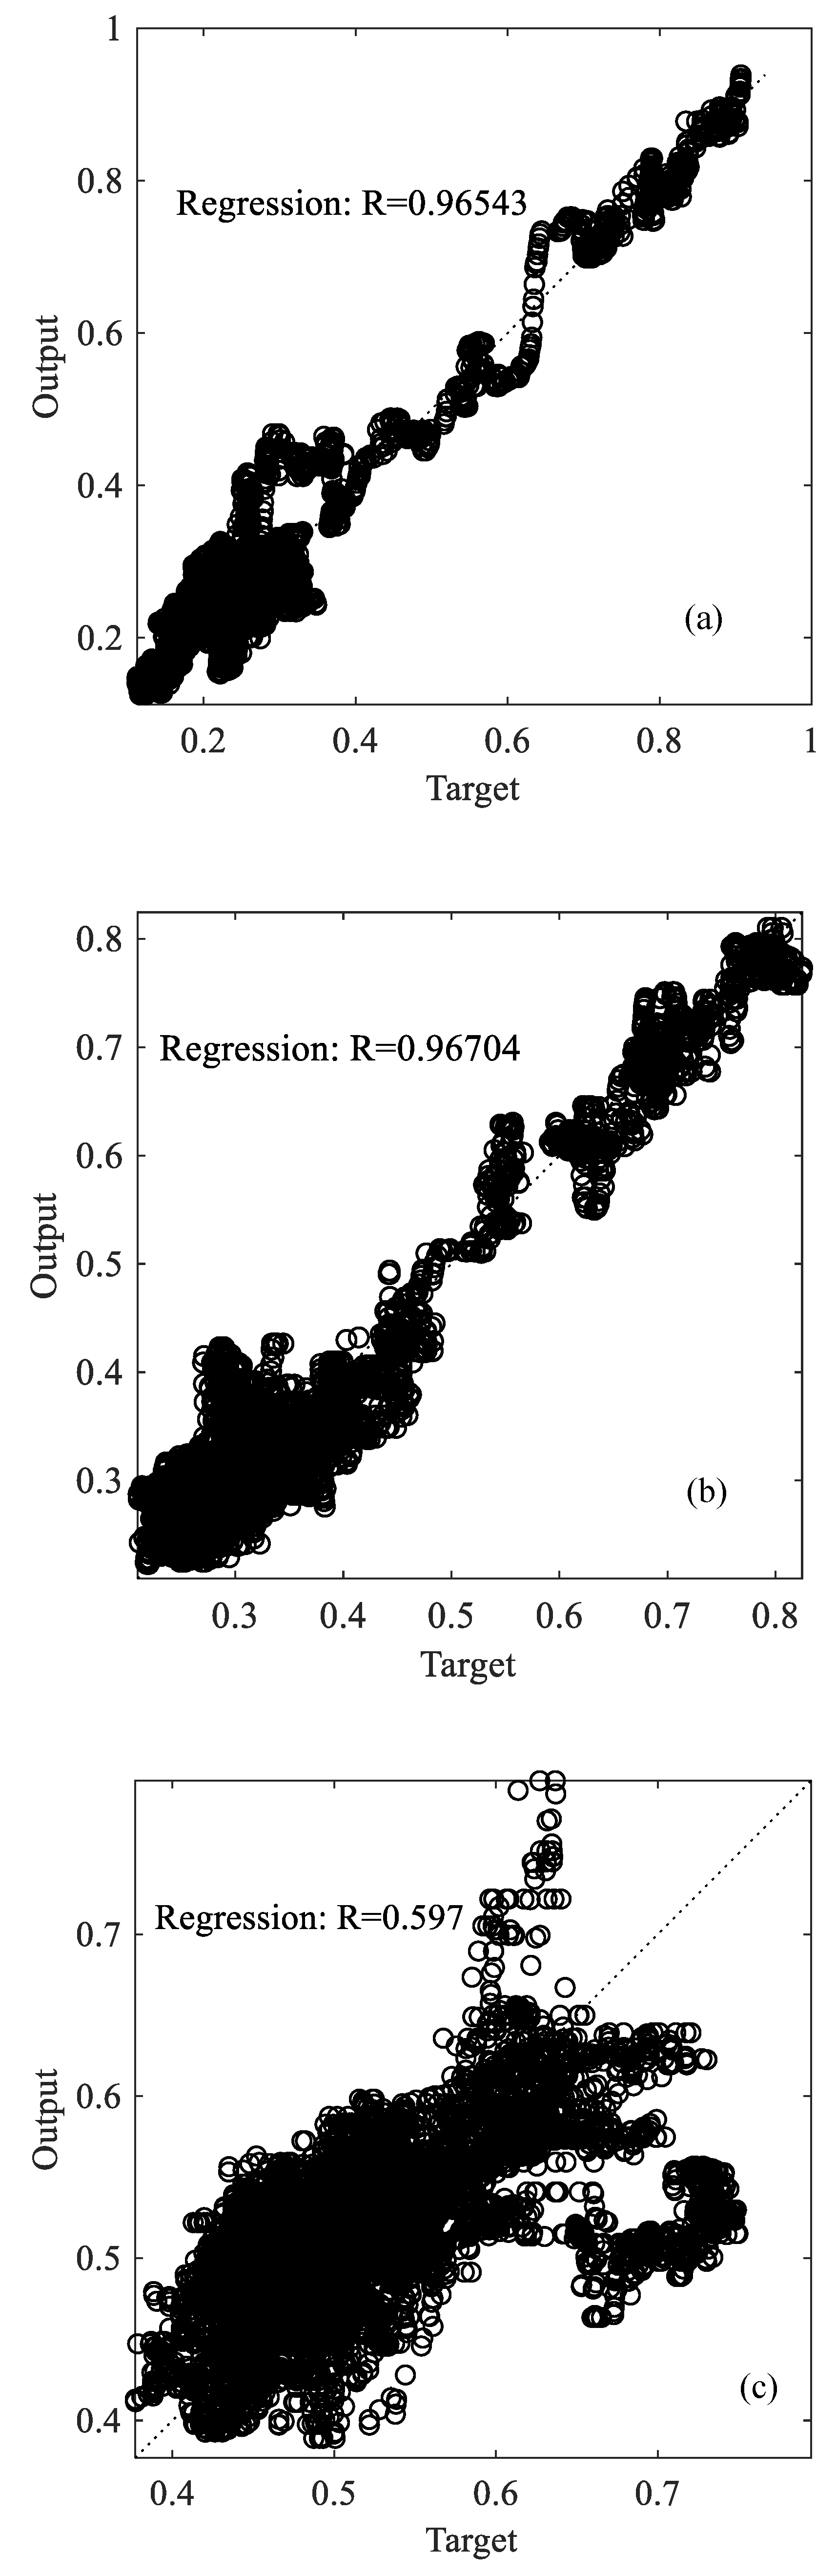
To better illustrate the performance of the ANN model for the testing set, three different bins, i.e., [172°, 173°], [148°, 149°], and [133°, 134°], were selected to compare their predicted contact forces with the ground truth, and the results are shown in Figure 9. We can see that, overall, the estimated contact forces in the selected bins match well with the ground truth derived from the DEM simulations. Figure 10 displays their model outputs vs. targets. It is found that the tested models in the bins of [172°, 173°] and [148°, 149°], having the R values of 0.965 and 0.967, respectively, perform well, with a large amount of data falling along the 45° line. For the bin of [133°, 134°], the tested model having the R value of 0.597 predicts the contact force acceptably when the value is below 0.6 and with a high deviation when the value is above 0.6.
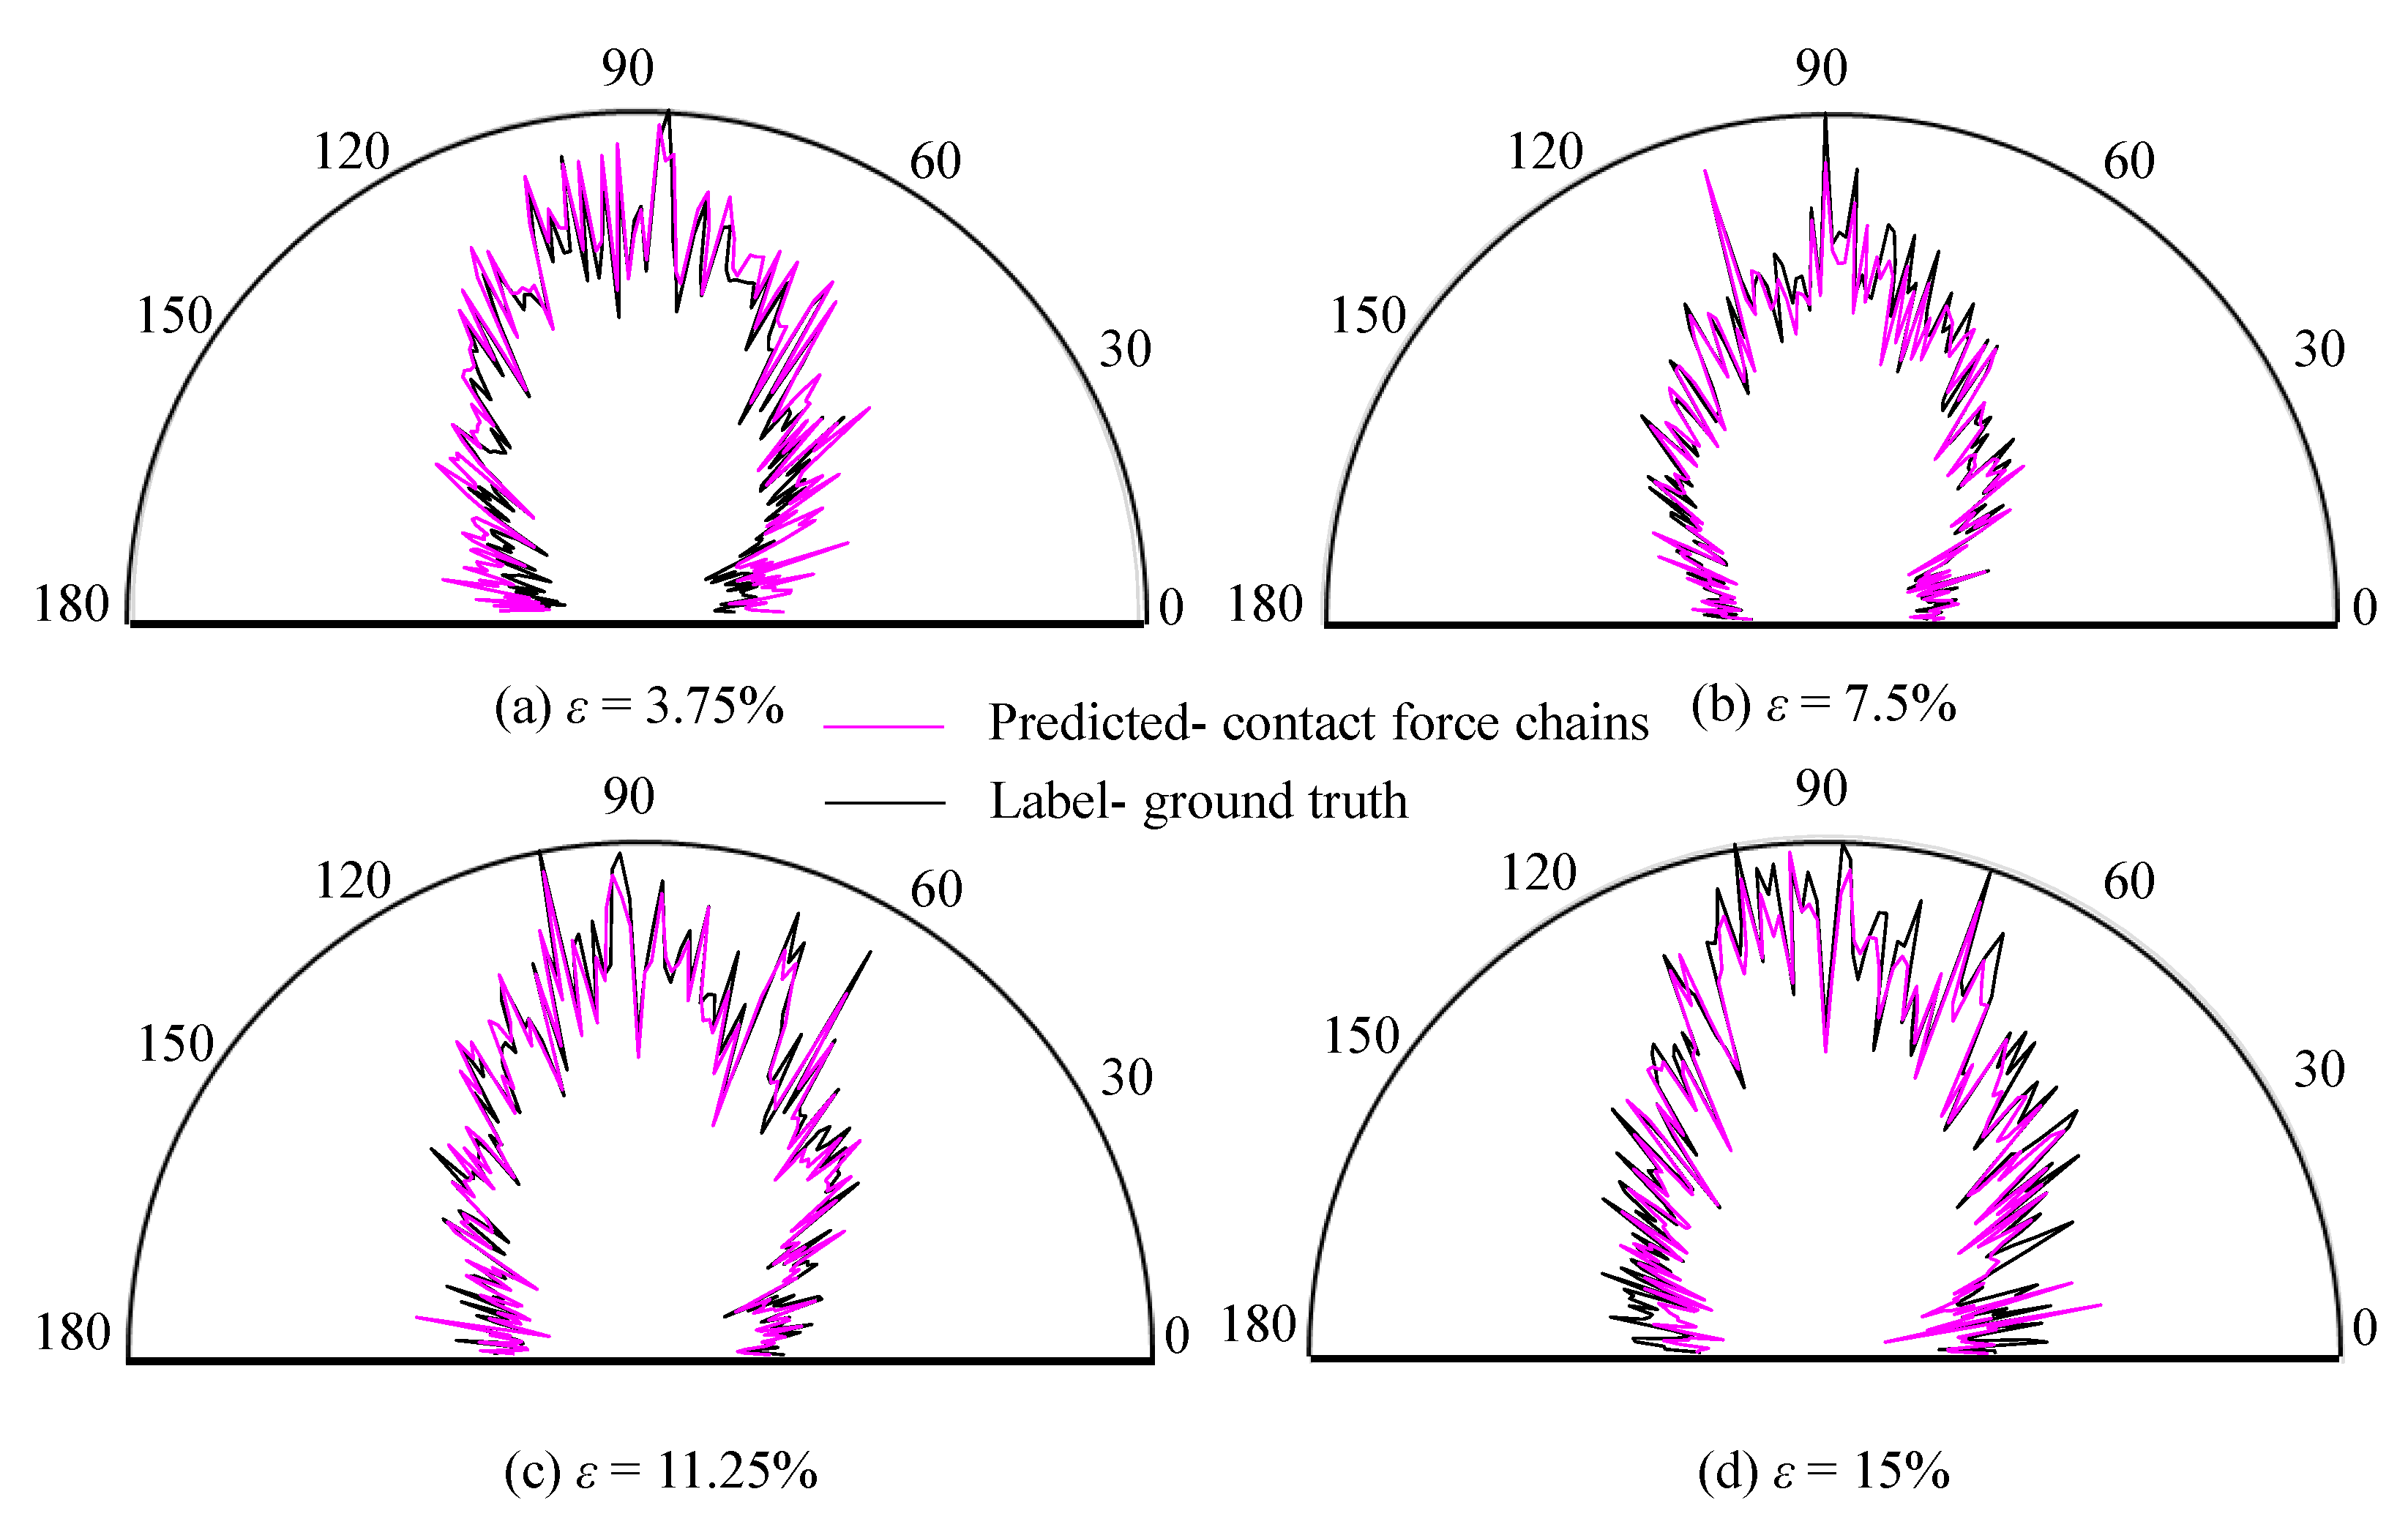
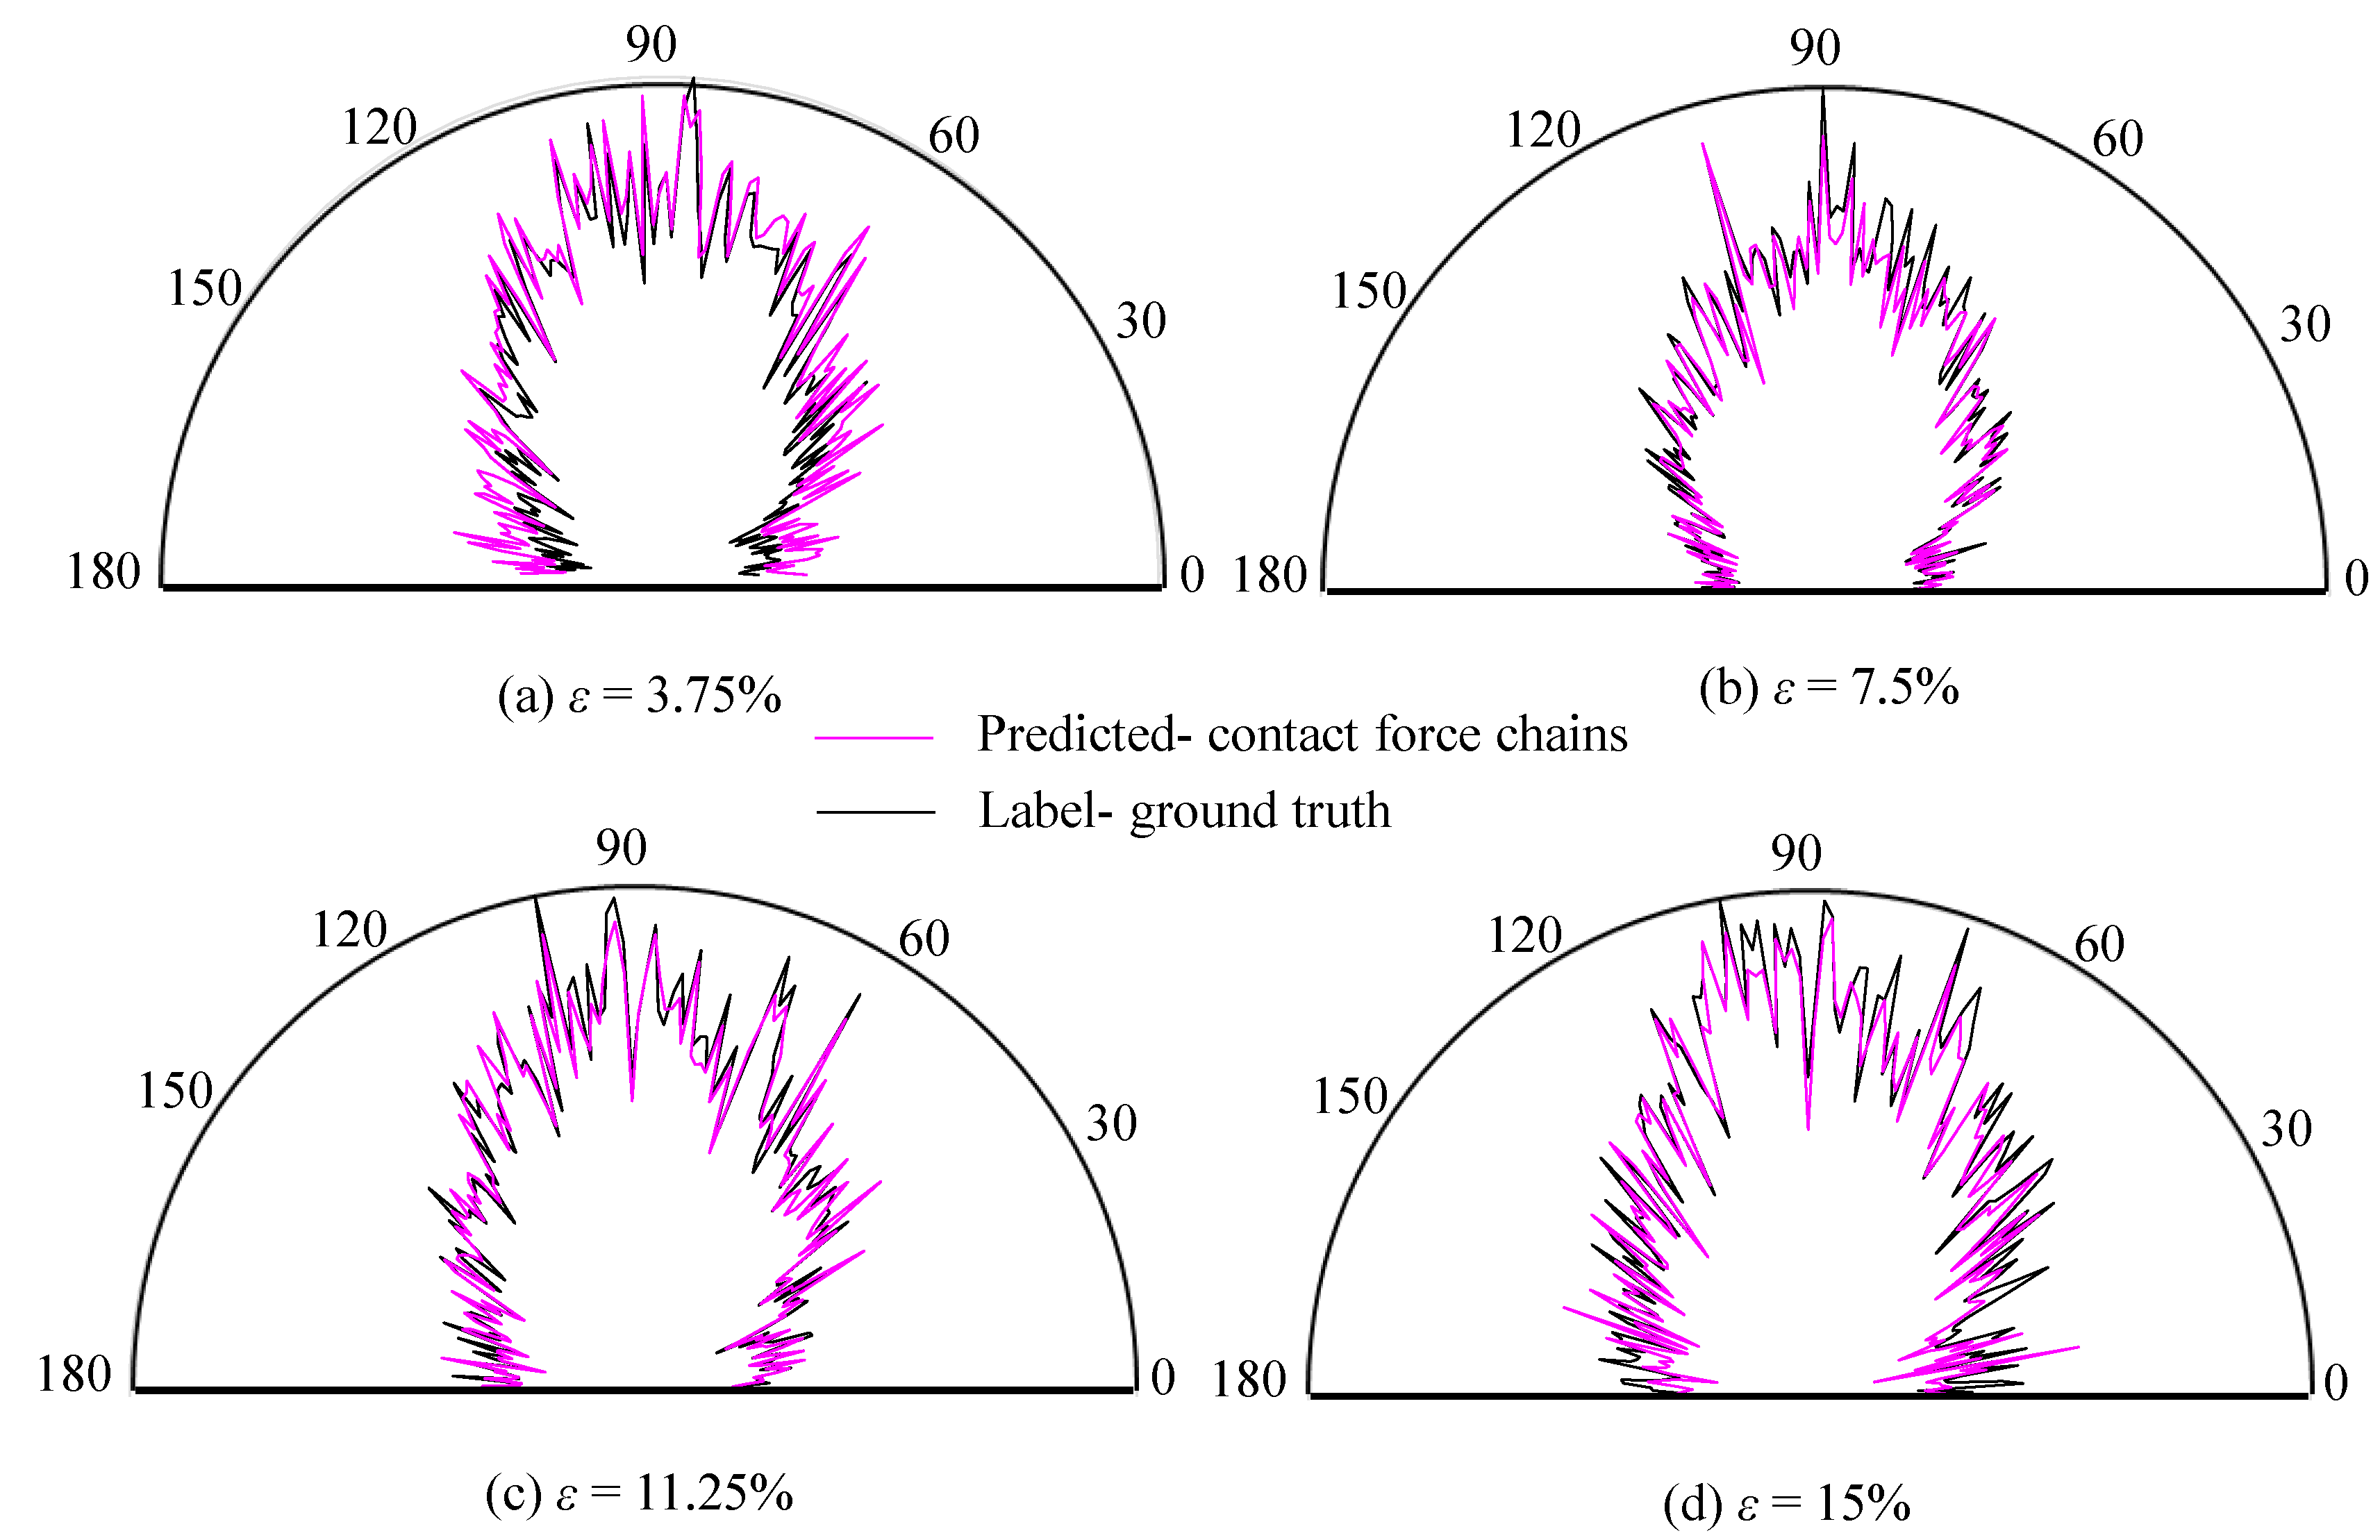
Figure 11 compares the rose diagrams of the predicted CFC with the ground truth at four different strain levels of 3.75%, 7.5%, 11.25%, and 15%. We can see that the predicted CFC is in good agreement with the ground truth during the whole shearing test. This overall agreement suggests that our ANN model is able to predict the anisotropy of the CFC in a quasi-statically sheared granular assembly and highlights the significant contribution of this study.
3.2. Parametric Study
A parametric study was conducted to investigate the effects of input particle-scale features and data size on the performance of the constructed ANN model. Table 2 summarizes the input parameters as well as the results of the tested model. The standard model, whose results have been presented in Section 3.1, is denoted as ML00. The symbol ‘/’ indicates that the parameters used are the same as those of the standard model. We used the median value (Rm), standard deviation (Rs), maximum (Rb) and minimum (Rw) of the R values to characterize the distribution of R for all the eleven tests.
3.2.1. The Effect of Features
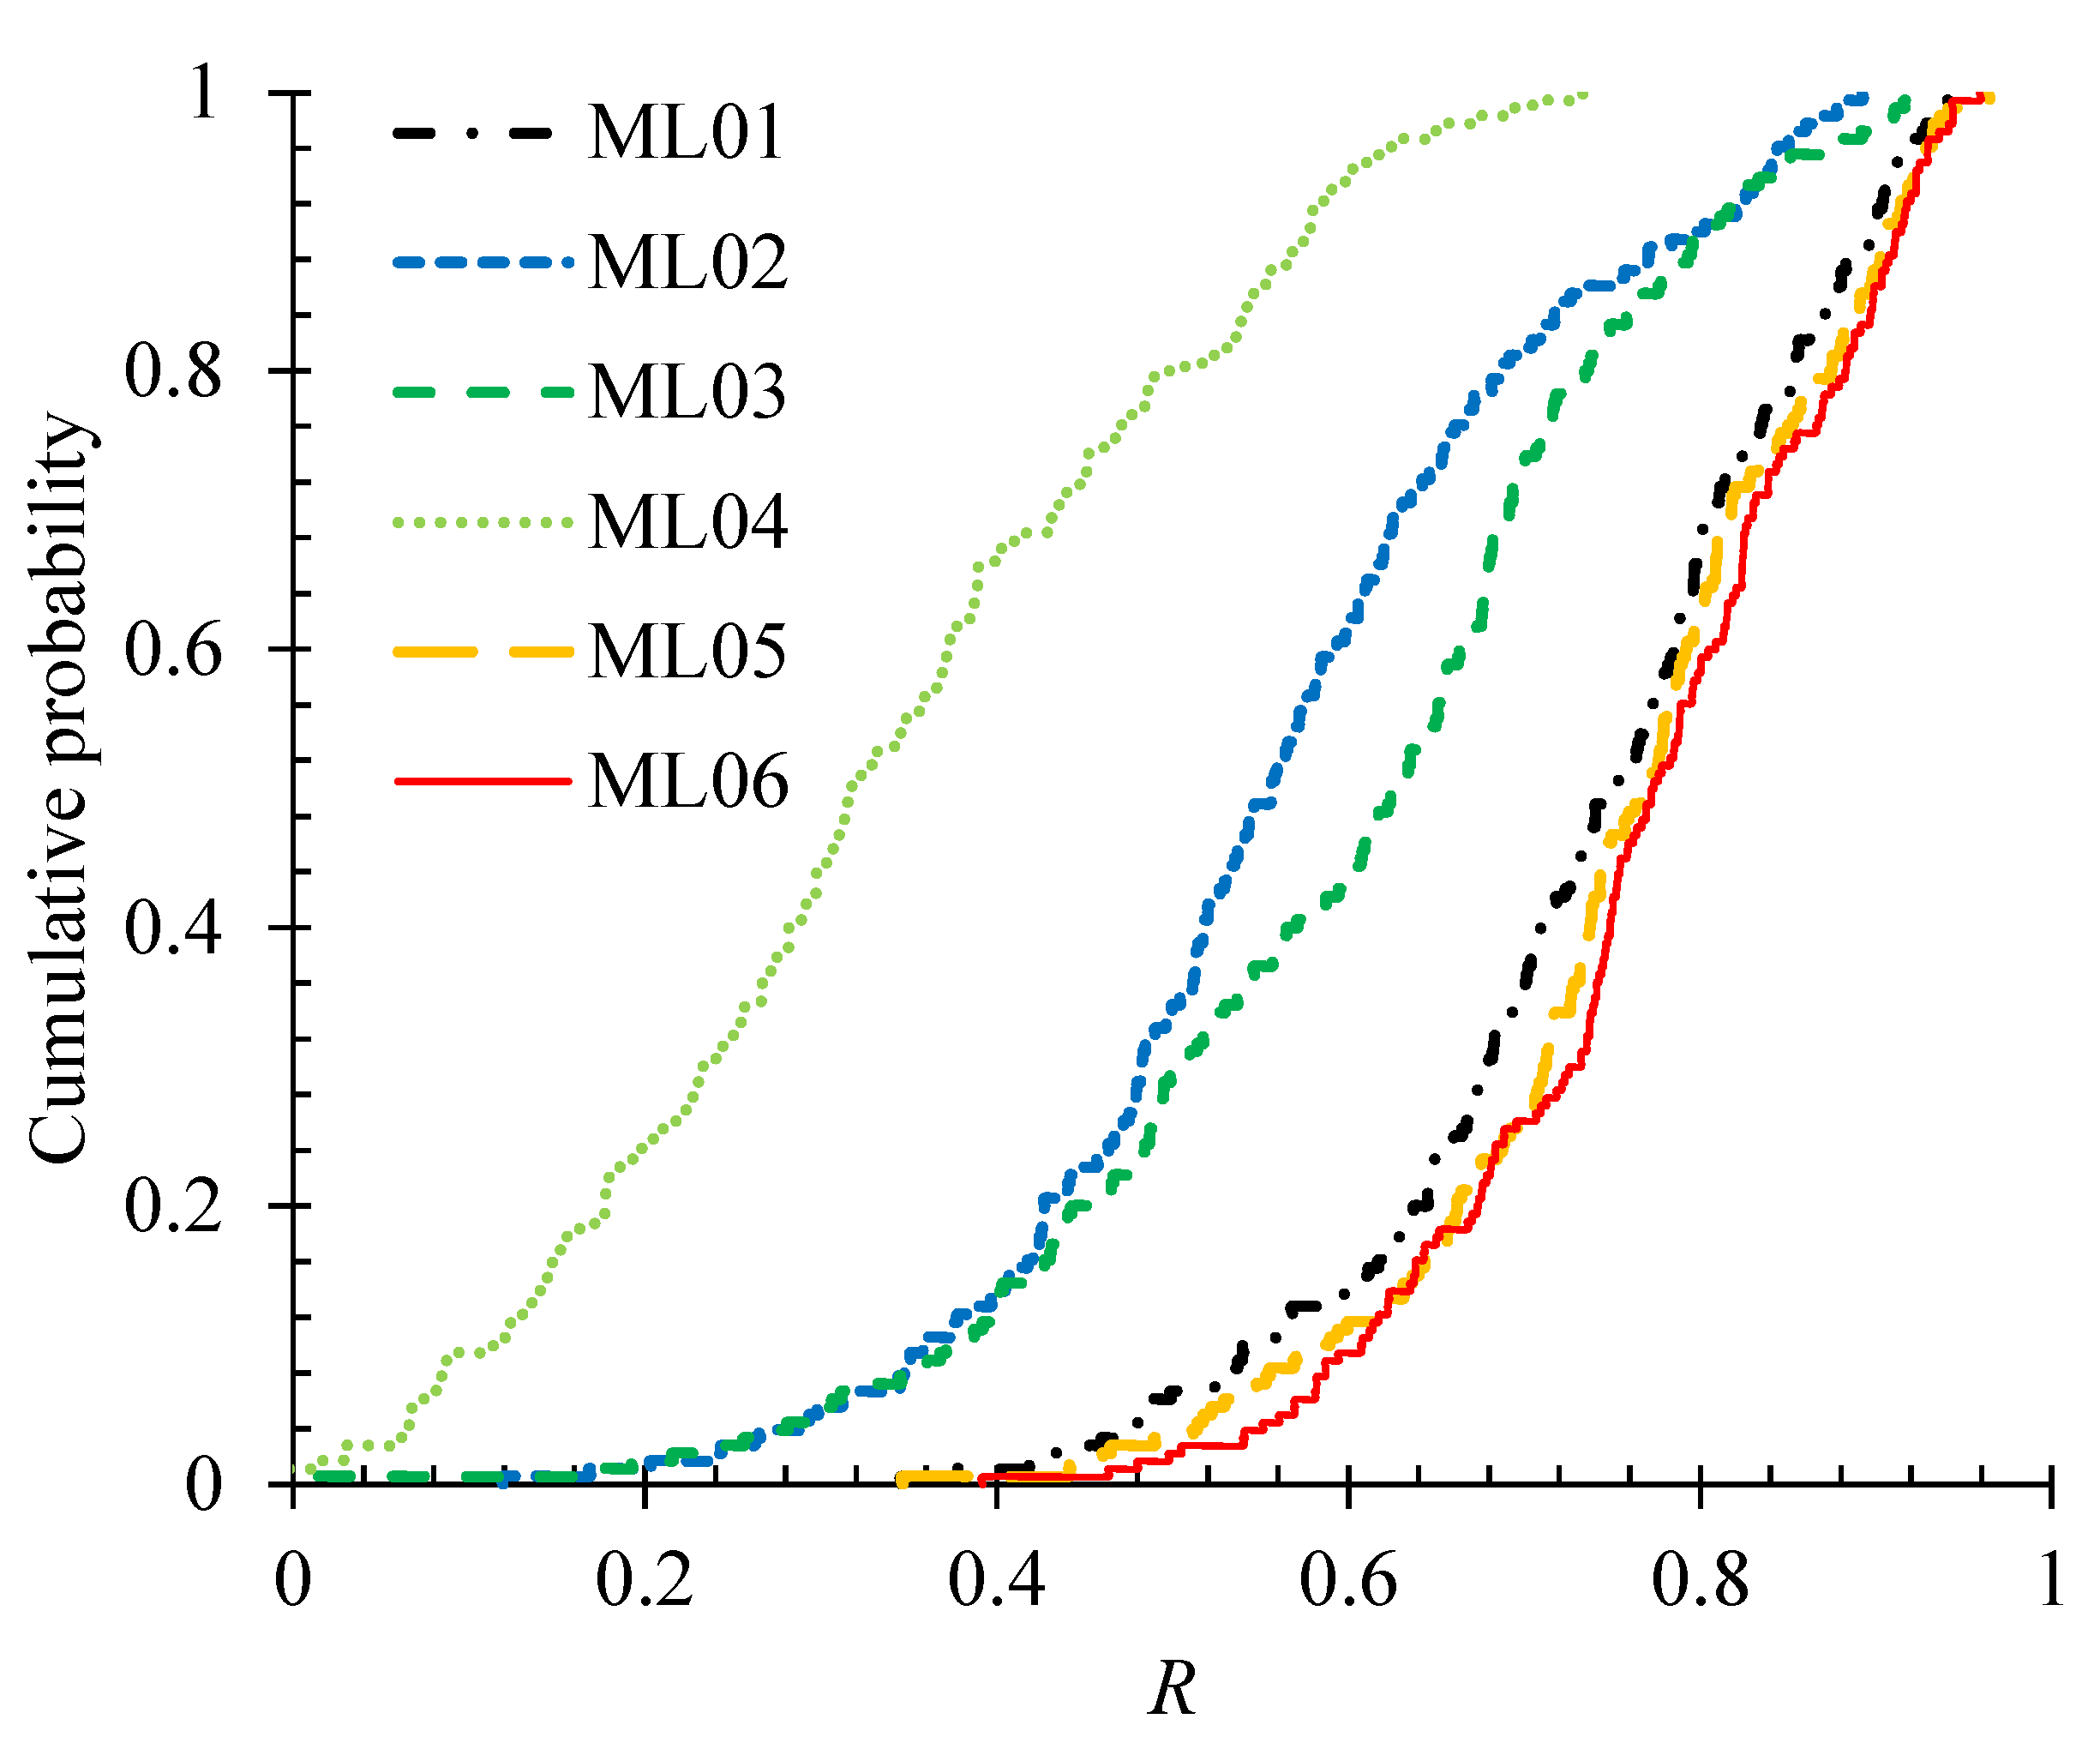
The R values for the selected individual features (i.e., with all other features being ignored) in ML01-ML05 and for the combined features of particle size and coordination number in ML06 were calculated based on the same set of simulation data. Their cumulative distributions of R are shown in Figure 12. It can be seen that the features of coordination number and particle size, with the median values of 0.749 and 0.768, respectively, show a much higher level of importance for the CFC prediction than the other features. For the ML04, the median value and standard deviation of R are 0.316 and 0.172, respectively, suggesting that the particle spin only plays a minor role in estimating the anisotropy of CFC. By comparing ML01 and ML05 with ML06, it is found that the combined features of particle size and coordination number have the highest level of influence on the CFC estimation.
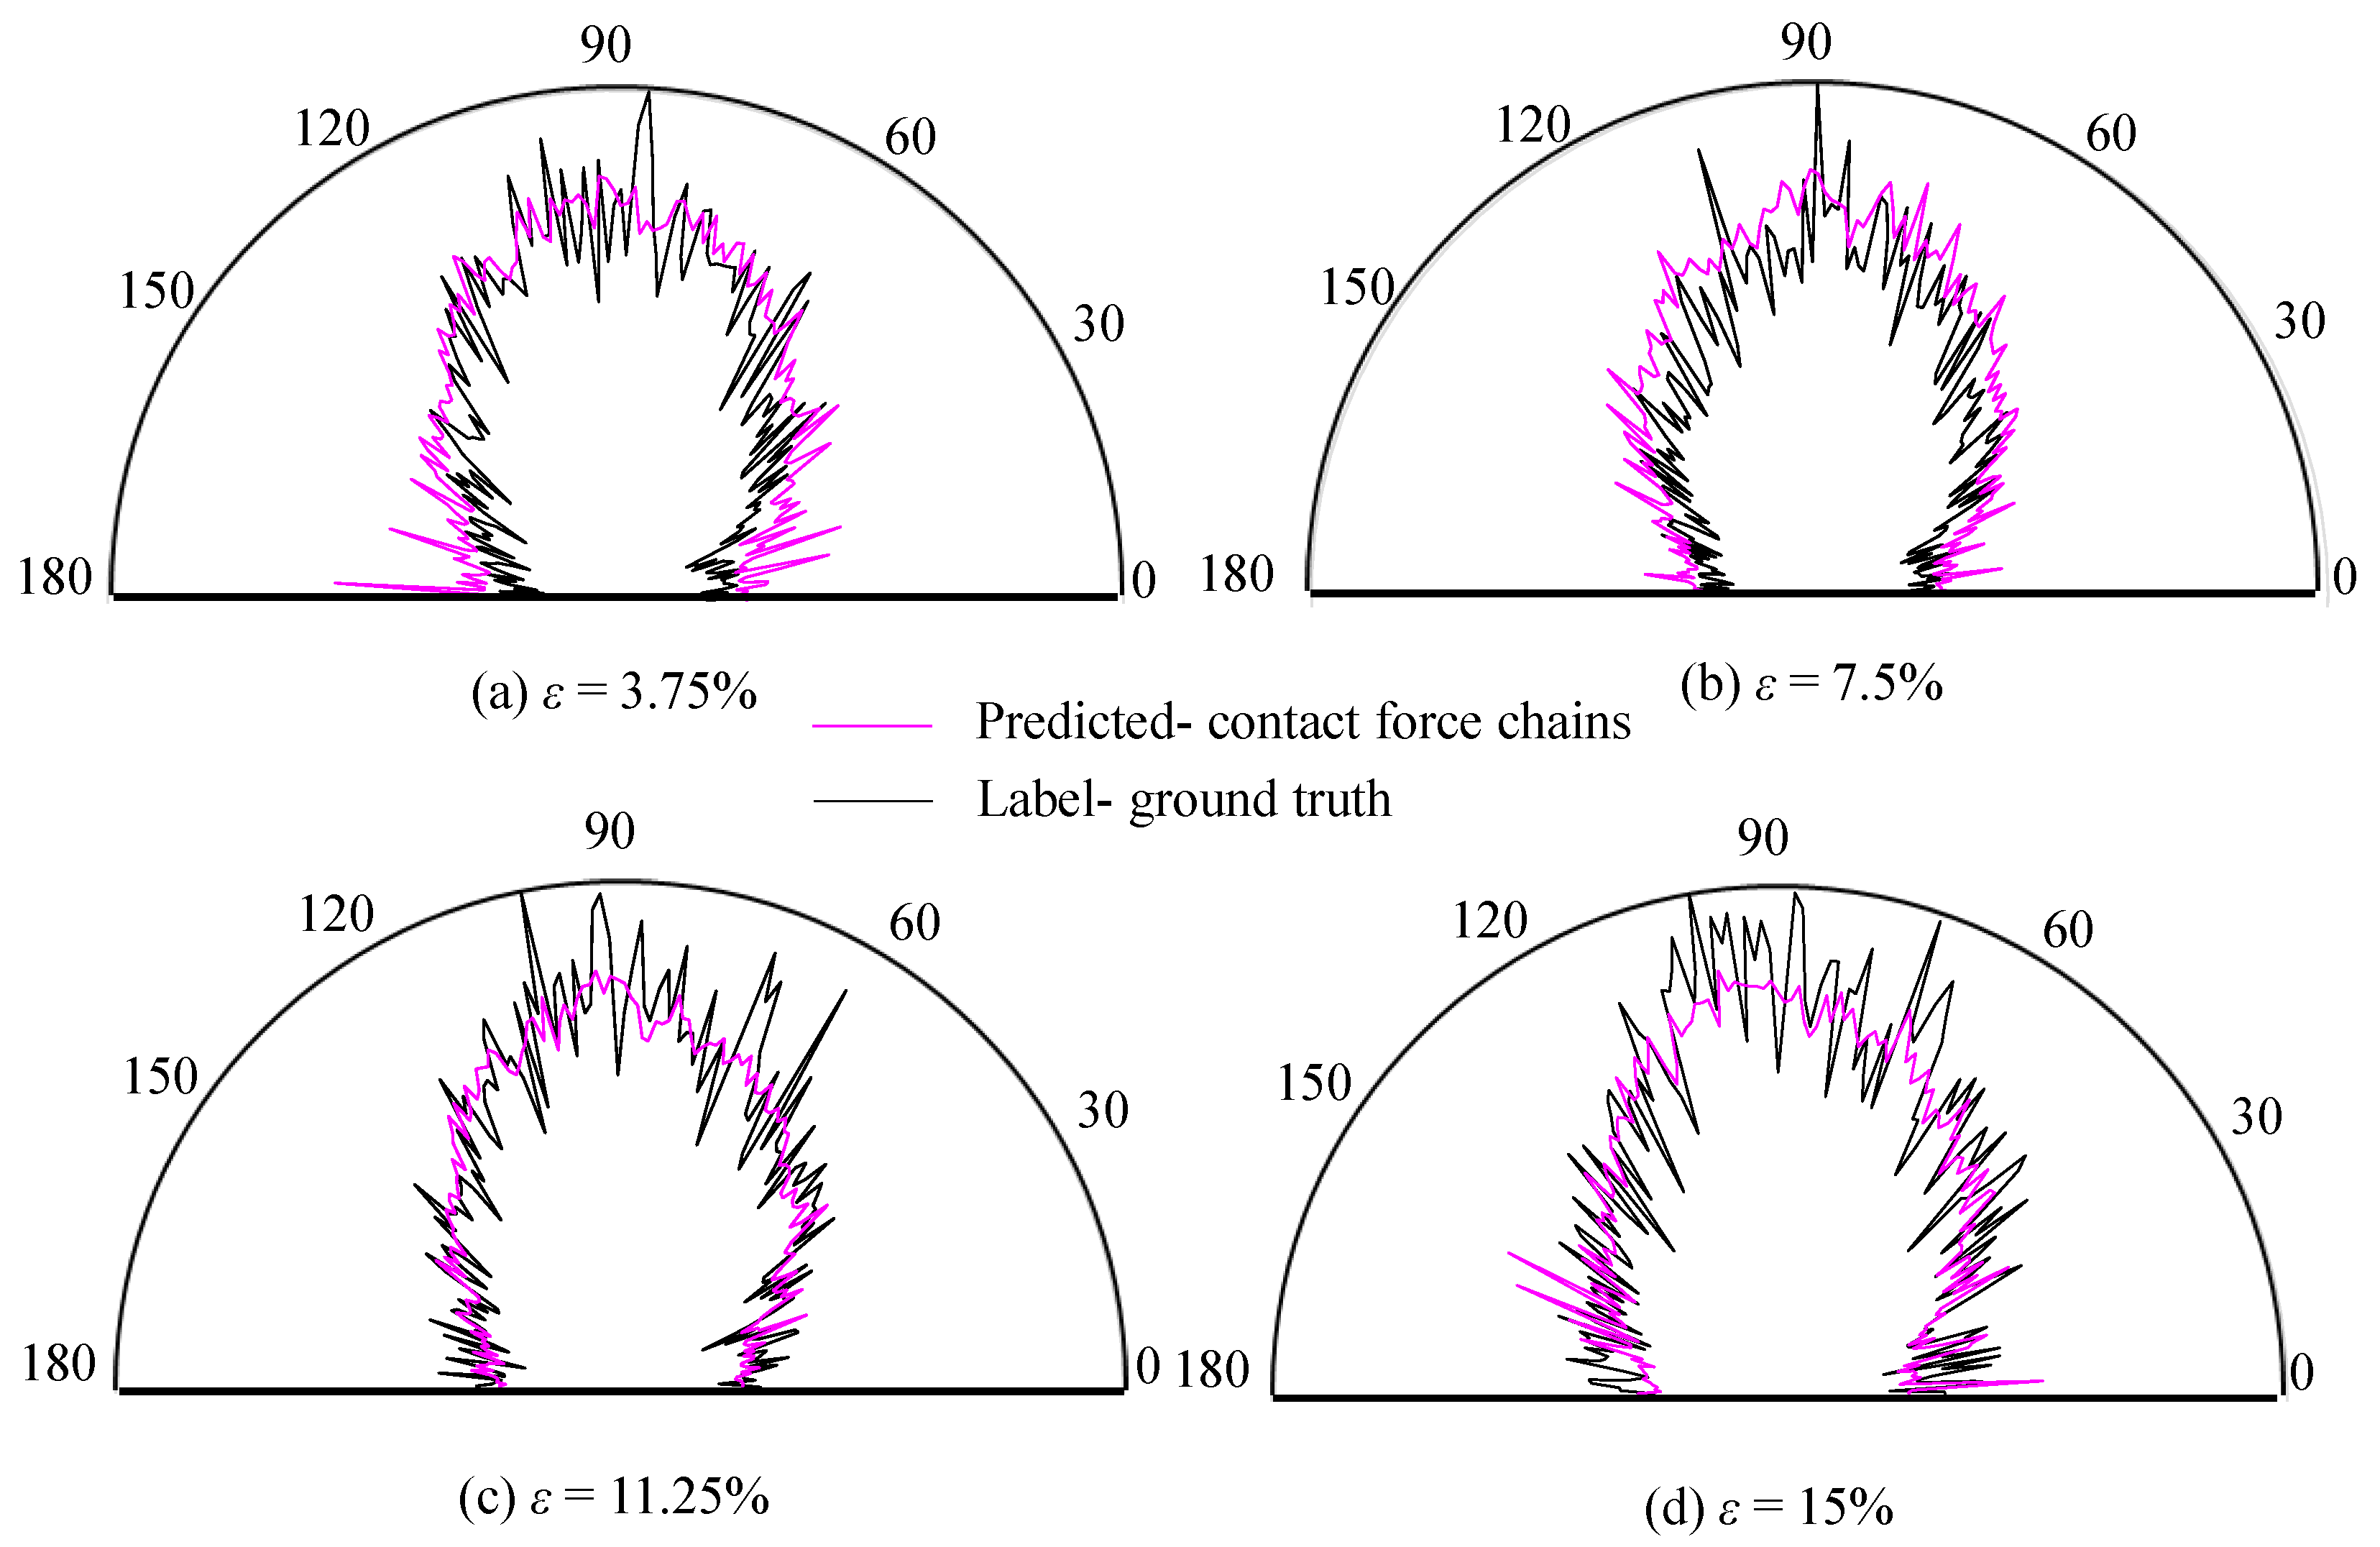
Figure 13 and Figure 14 compare the predicted CFC with the ground truth for the tests ML04 and ML06, respectively. For ML04, it can be found that the particle spin, compared with other particle-scale features, carries limited useful predictive information of CFC and results in the poorest prediction of the anisotropy of CFC. For ML06, the best model prediction manifested in the excellent match of the rose diagrams of CFC throughout the whole shearing process attests to the most important roles of the particle size and coordination number in the estimation of the CFC. The significance of this result is that, with the increasing use of X-ray microtomography and image processing techniques, it may provide a new way for estimating the CFC in opaque granular materials subject to quasi-static shear without the need to perform DEM simulations or develop complex mathematical or theoretical models.
3.2.2. The Effect of Data Size
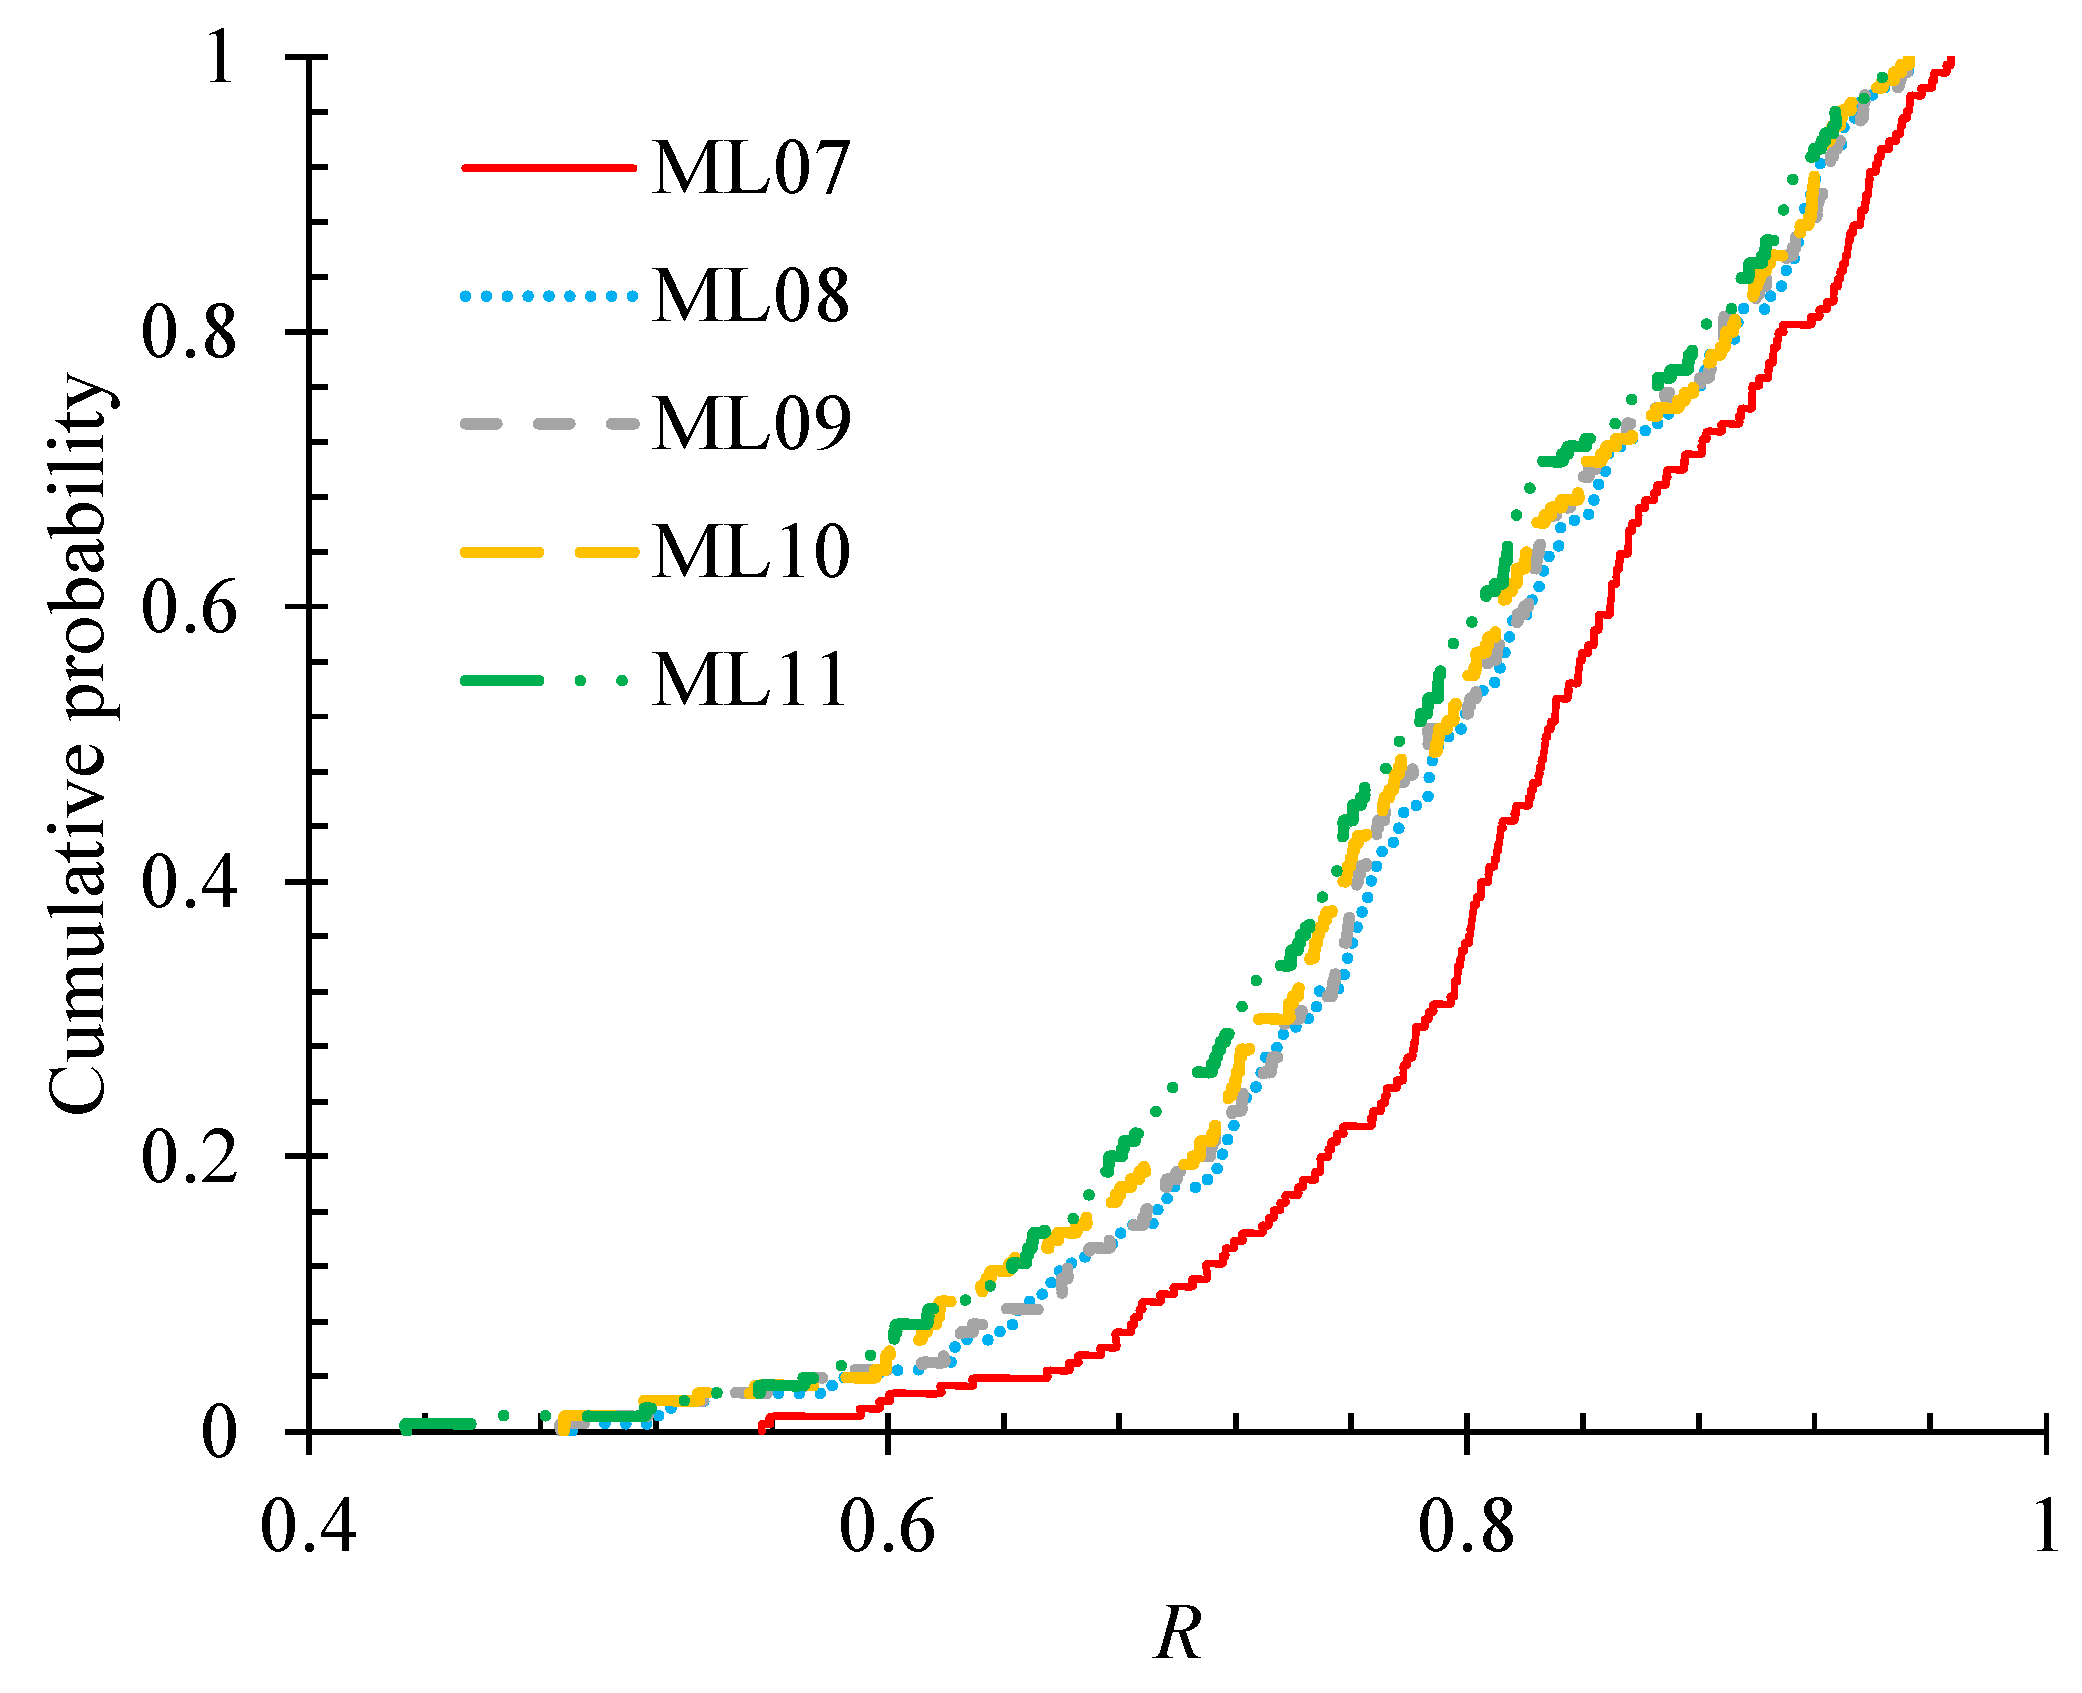
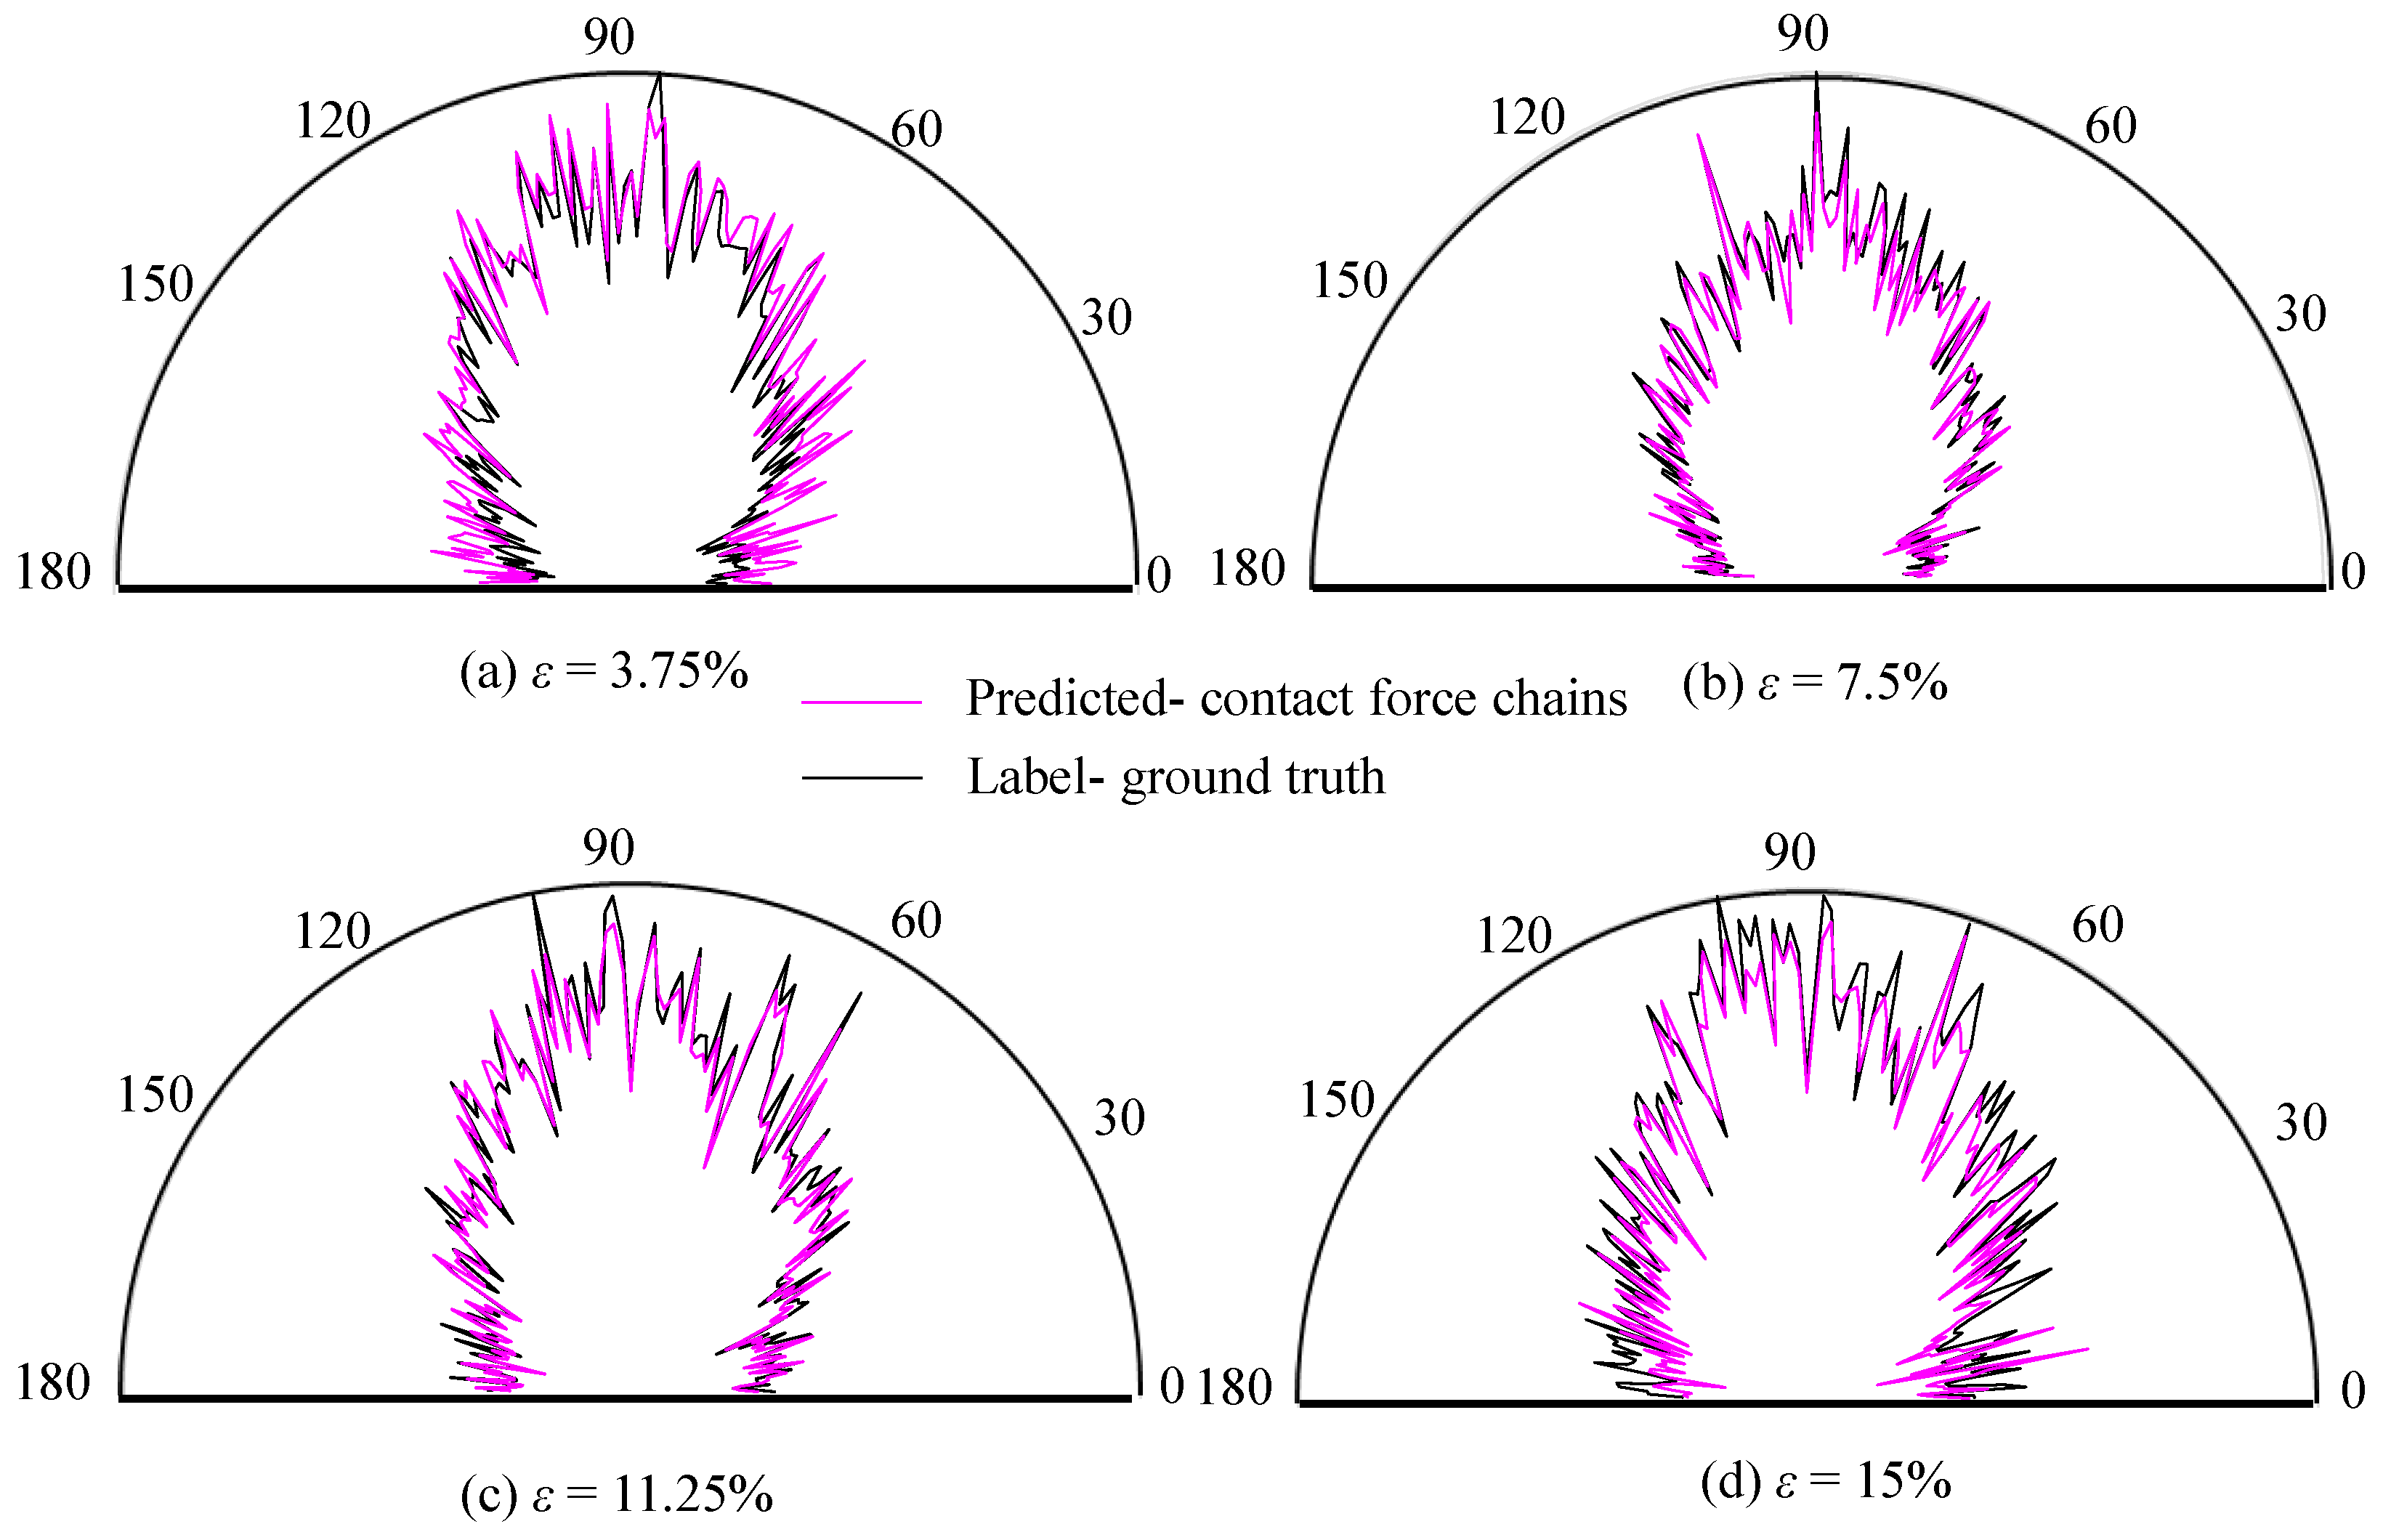
Figure 15 shows the cumulative distributions of R for ML07–ML11 with different data sizes. The change in the size of the training set is made by deleting records spaced at a constant interval from the original simulation data. It is seen that the performance of the tested model is largely improved with the increase in the size of the training set. Figure 16 compares the predicted CFC with the ground truth for ML11 with the smallest data size. It is a bit surprising to find that although only 2500 records were used in training the model, the degree of matching between the estimated contact force and the ground truth, as compared to Figure 11, is not severely affected. The practical problem of how much data is needed to train the ANN model is a controversial issue and has not been solved to date.
4. Discussion
Although the interparticle contact force is mathematically defined by the contact model adopted in the DEM modeling [36], the evolution of CFC cannot be analytically computed because the complex kinematics of the entire particle assembly cannot be easily predicted. That facilitates the implementation of ML algorithms in the estimation of CFCs. It is anticipated that the proposed ANN model captures the evolutions of contact force very well using the adopted five particle-scale features. This is because input and output have an obvious causal relationship based on the physics-based modeling [36]. Another important reason for selecting the five particle-scale features for the model development is that all these features can be readily acquired from micro-CT data and therefore will facilitate the future extension of the model to the micro-CT results [16].
Among the five particle-scale features, the particle size shows the highest level of importance for CFC prediction when investigating the effects of the features. This result was well expected as the particle size is an inherent soil characteristic that provides insights into the mechanical behavior of natural sands [43,44]. Arakawa and Nishino [45], Oda [46] and Pinson et al. [47] demonstrated that the coordination number is strongly affected by the particle size, and the distributed coordination numbers correspond to different types of contacts between the small and large components. The CFCs estimation results in Figure 12 also present a similar result, in which the performance of coordination number shows a similar effect to those observed in particle size.
It should be mentioned that this study serves as the starting point of a comprehensive research project which aims to develop and apply ML methods to granular material research. Our ultimate goal is to develop a powerful and robust ML model that is able to predict the macroscopic behaviors of a sheared sand, such as initial stiffness, maximum stress ratio or even stress–strain relationship, purely based on the input from micro-CT. Establishing a ML model to predict CFC using a DEM database represents the first step of a fundamental and rigorous approach to achieve such a goal.
Another point that is worthy of an explanation is that only the spatial distribution of CFC (i.e., anisotropy of CFC) is examined while the heterogeneity of CFC is not considered in this paper. The reason for this is that theoretical studies [48,49] have shown that a strong correlation usually exists between the anisotropy of CFC and the shear stress ratio of a loaded granular assembly, which means that we will be able to predict the stress ratio of the granular assembly once the anisotropies of CFC and material fabric become available. However, the heterogeneity of CFC, which is due to the inherent non-uniformity of any granular material, does not need to be specially investigated because it offers little value to our quantitative prediction of the macroscopic properties of granular materials in future.
It must be emphasized that due to the major hindrance of measuring interparticle contact forces experimentally, the current way of using DEM data for constructing the ML model is the only feasible approach, while the ANN model proposed to solve CFC prediction problem can be replaced by some other ML algorithms such as long short-term memory network [50]. For instance, Zhang and Yin [34] adopted a DEM-based ML approach to predict the constitutive relationships of 2D granular materials using CNN and bidirectional long short-term memory neural network. In their study, the contact fabric was simplified and approximated using a second Fourier component and characterized by two parameters. Compared with their method, a real inhomogeneous distribution of CFC was predicted, making this study a pioneering one in the investigation of the force chains in granular materials.
5. Conclusions
In this study, a multilayer feedforward ANN model based on a detailed set of 2D DEM simulation data was developed to estimate, with a high degree of accuracy, the anisotropy of CFC in a quasi-statically sheared granular system. The main contributions and conclusions from this study are stated as follows:
In a quasi-statically sheared granular system, the five particle-scale features, i.e., particle coordination number, size, x/y-velocity, and spin, all contain predictive information of the CFC. An excellent model performance manifested in a close match between the rose diagrams of CFC from the ANN predictions and DEM simulations is obtained. The training result shows that the proposed ANN model is less effective in the directions aligned with the shear band.
The results from the parametric study demonstrate that the combined features of particle size and coordination number have a dominating influence on the CFC estimation. The importance of the input features can be sorted (in the descending order) according to their model performance in the estimation of CFC as: particle size > coordination number > particle y-velocity > particle x-velocity > particle spin. The performance of the ANN model is also influenced by the data size, but the amount of data needed to train the ANN model is still a controversial issue which has not yet been solved.
The major contribution of this study lies in the following three aspects: (1) making a pioneering attempt to propose an ANN model for predicting the evolution of CFC within a sheared granular system; (2) providing valuable information about the key particle-scale features that must be carefully selected for the ML analysis; (3) suggesting ML as a promising tool for understanding and quantifying the complex mechanical behaviors of granular materials. Although only biaxial tests were conducted in this study, it represents the first feasible and effective step of a comprehensive research project to carry out machine learning investigations in the micromechanics of granular materials. Future enhancement of the model may include optimizing the structure of the proposed ANN model to better reflect the nonlinear relationship between the input and output variables, identifying more effective features as the input variable and using a larger dataset to train the ANN model. A similar approach can also be applied to the study of other physical quantities that cannot be measured directly from the experiment, such as the frictional state, energy input and dissipation within a sheared granular material. Another promising direction is to develop ML-assisted constitutive models to better quantify and predict the stress–strain behavior of granular materials.
Author Contributions
J.W. proposed the idea and edited the manuscript; M.W. performed the DEM simulations and wrote the manuscript; Both authors have read and agreed to the published version of the manuscript.
Funding
This study was supported by General Research Fund Grant Nos. CityU 11201020, CityU 11213517 and CityU 11207321 from the Research Grants Council of the Hong Kong SAR and Research Grant No. 51779213 from the National Science Foundation of China.
Institutional Review Board Statement
Not applicable.
Informed Consent Statement
Not applicable.
Data Availability Statement
Some or all data, models, or code generated or used during the study are available from the corresponding author by request.
Acknowledgments
The authors would like to express gratitude to Jiang Feifeng and Shi Zhanglei for their valuable advice in constructing the ANN model.
Conflicts of Interest
The authors declare no conflict of interest.
References
- Karatza, Z.; Andò, E.; Papanicolopulos, S.-A.; Viggiani, G.; Ooi, J.Y. Effect of particle morphology and contacts on particle breakage in a granular assembly studied using X-ray tomography. Granul. Matter 2019, 21, 44. [Google Scholar] [CrossRef] [Green Version]
- Jerves, A.X.; Kawamoto, R.Y.; Andrade, J.E. Effects of grain morphology on critical state: A computational analysis. Acta Geotech. 2015, 11, 493–503. [Google Scholar] [CrossRef]
- Bolton, M.D. The strength and dilatancy of sands. Géotechnique 1986, 36, 65–78. [Google Scholar] [CrossRef] [Green Version]
- Christoffersen, J.; Mehrabadi, M.M.; Nemat-Nasser, S. A Micromechanical Description of Granular Material Behavior. J. Appl. Mech. 1981, 48, 339–344. [Google Scholar] [CrossRef]
- McDowell, G.R.; Bolton, M.D. On the micromechanics of crushable aggregates. Géotechnique 1998, 48, 667–679. [Google Scholar] [CrossRef] [Green Version]
- Andò, E.; Hall, S.A.; Viggiani, G.; Desrues, J.; Bésuelle, P. Grain-scale experimental investigation of localised deformation in sand: A discrete particle tracking approach. Acta Geotech. 2011, 7, 1–13. [Google Scholar] [CrossRef]
- Andò, E.; Viggiani, G.; Hall, S.A.; Desrues, J. Experimental micro-mechanics of granular media studied by x-ray tomography: Recent results and challenges. Géotechnique Lett. 2013, 3, 142–146. [Google Scholar] [CrossRef]
- Druckrey, A.M.; Alshibli, K.A.; Al-Raoush, R.I. 3D characterization of sand particle-to-particle contact and morphology. Comput. Geotech. 2016, 74, 26–35. [Google Scholar] [CrossRef] [Green Version]
- Hall, S.; Bornert, M.; Desrues, J.; Pannier, Y.; Lenoir, N.; Viggiani, G.; Bésuelle, P. Discrete and continuum analysis of localised deformation in sand using X-ray μCT and volumetric digital image correlation. Géotechnique 2010, 60, 315–322. [Google Scholar] [CrossRef]
- Wiebicke, M.; Andò, E.; Herle, I.; Viggiani, G. On the metrology of interparticle contacts in sand from x-ray tomography images. Meas. Sci. Technol. 2017, 28, 124007. [Google Scholar] [CrossRef]
- Zhao, B.; Wang, J.; Coop, M.R.; Viggiani, G.; Jiang, M. An investigation of single sand particle fracture using X-ray micro-tomography. Géotechnique 2015, 65, 625–641. [Google Scholar] [CrossRef] [Green Version]
- Zhou, B.; Wang, J.; Zhao, B. Micromorphology characterization and reconstruction of sand particles using micro X-ray tomography and spherical harmonics. Eng. Geol. 2015, 184, 126–137. [Google Scholar] [CrossRef]
- Wu, M.; Wang, J. Registration of point cloud data for matching crushed sand particles. Powder Technol. 2019, 347, 227–242. [Google Scholar] [CrossRef]
- Viggiani GTengattini, A. Recent developments in laboratory testing of geomaterials with emphasis on imaging. In Proceedings of the XVII ECSMGE-2019, Reykjavík, Iceland, 1–6 September 2019. [Google Scholar] [CrossRef]
- Fonseca, J.; O’sullivan, C.; Coop, M.; Lee, P. Quantifying the evolution of soil fabric during shearing using scalar parameters. Géotechnique 2013, 63, 818–829. [Google Scholar] [CrossRef] [Green Version]
- Cheng, Z. Investigation of the Grain-Scale Mechanical Behavior of Granular Soils under Shear Using x-ray Micro-Tomography. Ph.D. Thesis, City University of Hong Kong, Hong Kong, China, 2018. [Google Scholar]
- Drescher, A.; de Josselin de Jong, G. Photoelastic verification of a mechanical model for the flow of a granular material. J. Mech. Phys. Solids 1972, 20, 337–340. [Google Scholar] [CrossRef]
- Howell, D.; Behringer, R.P.; Veje, C. Stress Fluctuations in a 2D Granular Couette Experiment: A Continuous Transition. Phys. Rev. Lett. 1999, 82, 5241–5244. [Google Scholar] [CrossRef] [Green Version]
- Saadatfar, M.; Sheppard, A.P.; Senden, T.J.; Kabla, A.J. Mapping forces in a 3D elastic assembly of grains. J. Mech. Phys. Solids 2012, 60, 55–66. [Google Scholar] [CrossRef] [Green Version]
- Hurley, R.; Marteau, E.; Ravichandran, G.; Andrade, J.E. Extracting inter-particle forces in opaque granular materials: Beyond photoelasticity. J. Mech. Phys. Solids 2014, 63, 154–166. [Google Scholar] [CrossRef]
- Andrade, J.E.; Lim, K.W.; Avila, C.F.; Vlahinić, I. Granular element method for computational particle mechanics. Comput. Methods Appl. Mech. Eng. 2012, 241–244, 262–274. [Google Scholar] [CrossRef]
- Wang, J.; Dove, J.E.; Gutierrez, M.S. Discrete-continuum analysis of shear banding in the direct shear test. Géotechnique 2007, 57, 513–526. [Google Scholar] [CrossRef]
- Thornton, C. Numerical simulations of deviatoric shear deformation of granular media. Géotechnique 2000, 50, 43–53. [Google Scholar] [CrossRef]
- Khoubani, A.; Evans, T.M. An efficient flexible membrane boundary condition for DEM simulation of axisymmetric element tests. Int. J. Numer. Anal. Methods Geomech. 2017, 42, 694–715. [Google Scholar] [CrossRef]
- Wang, J.; Yan, H. On the role of particle breakage in the shear failure behavior of granular soils by DEM. Int. J. Numer. Anal. Methods Geomech. 2011, 37, 832–854. [Google Scholar] [CrossRef]
- Wang, J.; Yan, H. DEM analysis of energy dissipation in crushable soils. Soils Found. 2012, 52, 644–657. [Google Scholar] [CrossRef] [Green Version]
- Wu, M.; Wang, J.; Russell, A.; Cheng, Z. DEM modelling of mini-triaxial test based on one-to-one mapping of sand particles. Géotechnique 2020, 1–14. [Google Scholar] [CrossRef]
- Wu, M.; Wang, J.; Zhao, B. DEM modeling of the one-dimensional compression of sands incorporating a statistical particle fragmentation scheme. Can. Geotech. J. Publ. 2021. [Google Scholar] [CrossRef]
- Zhang, W.; Goh, A.T. Multivariate adaptive regression splines and neural network models for prediction of pile drivability. Geosci. Front. 2016, 7, 45–52. [Google Scholar] [CrossRef] [Green Version]
- Shi, C.; Wang, Y. Non-parametric machine learning methods for interpolation of spatially varying non-stationary and non-Gaussian geotechnical properties. Geosci. Front. 2021, 12, 339–350. [Google Scholar] [CrossRef]
- Abdel-mawgoud, H.; Kamel, S.; Tostado, M.; Yu, J.; Jurado, F. Optimal Installation of Multiple DG using Chaotic Moth-flame Algorithm and Real Power Loss Sensitivity Factor in Distribution System. In Proceedings of the International Conference on Smart Energy Systems and Technologies (SEST), Seville, Spain, 10–12 September 2018; pp. 1–5. [Google Scholar] [CrossRef]
- Cubuk, E.; Schoenholz, S.; Rieser, J.; Malone, B.; Rottler, J.; Durian, D.; Kaxiras, E.; Liu, A. Identifying Structural Flow Defects in Disordered Solids Using Machine-Learning Methods. Phys. Rev. Lett. 2015, 114. [Google Scholar] [CrossRef] [Green Version]
- Rouet-Leduc, B.; Hulbert, C.; Bolton, D.C.; Ren, C.X.; Riviere, J.; Marone, C.; Guyer, R.A.; Johnson, P.A. Estimating Fault Friction From Seismic Signals in the Laboratory. Geophys. Res. Lett. 2018, 45, 1321–1329. [Google Scholar] [CrossRef] [Green Version]
- Zhang, P.; Yin, Z.Y. A novel deep learning-based modelling strategy from image of particles to mechanical properties for granular materials with CNN and BiLSTM. Comput. Methods Appl. Mech. Eng. 2021, 382, 113858. [Google Scholar] [CrossRef]
- Grosse, R.; Johnson, M.K.; Adelson, E.H.; Freeman, W.T. Ground truth dataset and baseline evaluations for intrinsic image algorithms. In Proceedings of the IEEE International Conference on Computer Vision, Kyoto, Japan, 29 September–2 October 2009; No. Iccv; IEEE: Piscataway, NJ, USA, 2009; pp. 2335–2342. [Google Scholar] [CrossRef]
- Itasca, PFC3D Manual; Itasca Consulting Group Inc.: Minneapolis, MI, USA, 2008.
- Henkel, D.J.; Gilbert, G.D. The Effect Measured of the Rubber Membrane on the Triaxial Compression Strength of Clay Samples. Géotechnique 1952, 3, 20–29. [Google Scholar] [CrossRef]
- Fazekas, S.; Török, J.; Kertész, J.; Wolf, D.E. Morphologies of three-dimensional shear bands in granular media. Phys. Rev. E 2006, 74, 031303. [Google Scholar] [CrossRef] [PubMed] [Green Version]
- de Bono, J.; Mcdowell, G.; Wanatowski, D. Discrete element modelling of a flexible membrane for triaxial testing of granular material at high pressures. Géotechnique Lett. 2012, 2, 199–203. [Google Scholar] [CrossRef] [Green Version]
- Ciaburro, G.; Venkateswaran, B. Neural Networks with R: Smart Models Using CNN, RNN, Deep Learning, and Artificial Intelligence Principles; Packt Publishing Ltd.: Birmingham, UK, 2017. [Google Scholar]
- Mathworks. MATLAB, Version 7.0.; Mathworks, Inc.: Natick, MA, USA, 2010. [Google Scholar]
- Moré, J.J. The Levenberg-Marquardt algorithm: Implementation and theory. In Proceedings of the Conference on Numerical Analysis, Dundee, UK, 28 June 1977; pp. 105–116. [Google Scholar] [CrossRef] [Green Version]
- Sperry, J.M.; Peirce, J.J. A Model for Estimating the Hydraulic Conductivity of Granular Material Based on Grain Shape, Grain Size, and Porosity. Ground Water 1995, 33, 892–898. [Google Scholar] [CrossRef]
- Yang, J.; Gu, X. Shear stiffness of granular material at small strains: Does it depend on grain size. Géotechnique 2013, 63, 165–179. [Google Scholar] [CrossRef] [Green Version]
- Arakawa, M.; Nishino, M. Contact Number and Porosity in Randomly Packed Sphere Mixtures of Various Sizes. J. Soc. Mater. Sci. 1973, 22, 658–662. [Google Scholar] [CrossRef]
- Oda, M. Co-Ordination Number and its Relation to Shear Strength of Granular Material. Soils Found. 1977, 17, 29–42. [Google Scholar] [CrossRef] [Green Version]
- Pinson, D.; Zou, R.P.; Yu, A.B.; Zulli, P.; McCarthy, M.J. Coordination number of binary mixtures of spheres. J. Phys. D Appl. Phys. 1998, 31, 457–462. [Google Scholar] [CrossRef]
- Bathurst, R.J.; Rothenburg, L. Observations on stress-force-fabric relationships in idealized granular materials. Mech. Mater. 1990, 9, 65–80. [Google Scholar] [CrossRef]
- Rothenburg, L.; Bathurst, R.J. Discussion: Analytical study of induced anisotropy in idealized granular material. Géotechnique 1990, 40, 665–667. [Google Scholar] [CrossRef]
- Buzau, M.M.; Tejedor-Aguilera, J.; Cruz-Romero, P.; Gomez-Exposito, A. Hybrid Deep Neural Networks for Detection of Non-Technical Losses in Electricity Smart Meters. IEEE Trans. Power Syst. 2020, 35, 1254–1263. [Google Scholar] [CrossRef]
Figure 1.
Flowchart of the proposed ML-based modelling framework.

Figure 2.
DEM simulation results. (a–d) Evolution of particle displacement field during the shearing process; (e) deviatoric stress response; (f) volumetric behavior.
Figure 2.
DEM simulation results. (a–d) Evolution of particle displacement field during the shearing process; (e) deviatoric stress response; (f) volumetric behavior.

Figure 3.
DEM simulation results. (a–d) Evolution of contact map during the shearing process; (e–h) the contact orientation distribution during the shearing process.
Figure 3.
DEM simulation results. (a–d) Evolution of contact map during the shearing process; (e–h) the contact orientation distribution during the shearing process.

Figure 4.
Pre-processed data for machine learning. (a) The typical evolutions of the contact force and the coordination number; (b) the evolutions of other particle-scale features.
Figure 4.
Pre-processed data for machine learning. (a) The typical evolutions of the contact force and the coordination number; (b) the evolutions of other particle-scale features.

Figure 5.
Schematic of typical multilayer neural network model.

Figure 6.
The distributions of R for the training and testing sets and the distribution of DTT.

Figure 7.
Performance of the ANN model versus the ground truth for the training set in the bins of (a) 10–11°; (b) 5–6°; (c) 42–43°.
Figure 7.
Performance of the ANN model versus the ground truth for the training set in the bins of (a) 10–11°; (b) 5–6°; (c) 42–43°.

Figure 8.
The comparison between the output and target for the training set at (a) 10–11°; (b) 5–6°; (c) 42–43°.
Figure 8.
The comparison between the output and target for the training set at (a) 10–11°; (b) 5–6°; (c) 42–43°.

Figure 9.
Performance of the ANN model versus the ground truth for the testing set in the bins of (a) 172–173°; (b) 148–149°; (c) 133–134°.
Figure 9.
Performance of the ANN model versus the ground truth for the testing set in the bins of (a) 172–173°; (b) 148–149°; (c) 133–134°.

Figure 10.
The comparison between the output and target for the testing set at (a) 172–173°; (b) 148–149°; (c) 133–134°.
Figure 10.
The comparison between the output and target for the testing set at (a) 172–173°; (b) 148–149°; (c) 133–134°.

Figure 11.
A comparison between predicted contact force chains and ground truth at strain (a) 3.75%; (b) 7.5%; (c) 11.25%; (d) 15%.
Figure 11.
A comparison between predicted contact force chains and ground truth at strain (a) 3.75%; (b) 7.5%; (c) 11.25%; (d) 15%.

Figure 12.
The cumulative probability of R with different features.

Figure 13.
A comparison between predicted contact force chains and ground truth for ML04 at strain (a) 3.75%; (b) 7.5%; (c) 11.25%; (d) 15%.
Figure 13.
A comparison between predicted contact force chains and ground truth for ML04 at strain (a) 3.75%; (b) 7.5%; (c) 11.25%; (d) 15%.

Figure 14.
A comparison between predicted contact force chains and ground truth for ML06 at strain (a) 3.75%; (b) 7.5%; (c) 11.25%; (d) 15%.
Figure 14.
A comparison between predicted contact force chains and ground truth for ML06 at strain (a) 3.75%; (b) 7.5%; (c) 11.25%; (d) 15%.

Figure 15.
The cumulative probability of R with different data sizes.

Figure 16.
A comparison between predicted contact force chains and ground truth for ML11 at strain (a) 3.75%; (b) 7.5%; (c) 11.25%; (d) 15%.
Figure 16.
A comparison between predicted contact force chains and ground truth for ML11 at strain (a) 3.75%; (b) 7.5%; (c) 11.25%; (d) 15%.


Table 1.
Biaxial sample properties.
| Sample Parameters | |
| Size: height × width, mm | 300 × 150 |
| No. of spheres | 6300 |
| Friction coefficient | 0.3 |
| Contact model | Linear rolling resistance model |
| Elastic modulus, Pa | 3.5 × 10⁷ |
| Rolling resistance coefficient | 0.35 |
| Density, kg/m3 | 2650 |
| Wall friction coefficient | 0 |
| Damping coefficient | 0.7 |
| Membrane Parameters | |
| Number of balls | 400 |
| Friction coefficient | 0 |
| Normal stiffness, N/m | 1 × 10⁶ |
| Shear stiffness, N/m | 1 × 10⁶ |
| Tensile strength, N | 1 × 10200 |
| Shear strength, N | 1 × 10200 |
| Density, kg/m3 | 1000 |
| Ball size, mm | 2 |
Table 2.
Summary of test results.
| Test ID | Feature | Bins | Training Data Size | Rb | Rw | Rm | Rs |
|---|---|---|---|---|---|---|---|
| ML00 | All features | 180 | 40,000 | 0.967 | 0.556 | 0.827 | 0.090 |
| ML01 | Coordination number | 0.962 | 0.345 | 0.749 | 0.128 | ||
| ML02 | x-velocity | 0.892 | 0.119 | 0.556 | 0.157 | ||
| ML03 | y-velocity | / | / | 0.932 | 0.064 | 0.626 | 0.170 |
| ML04 | Spin | 0.733 | 0.099 | 0.316 | 0.172 | ||
| ML05 | Particle size | 0.963 | 0.347 | 0.768 | 0.121 | ||
| ML06 | Particle size and coordination number | 0.959 | 0.392 | 0.773 | 0.115 | ||
| ML07 | 40,000 | 0.967 | 0.556 | 0.827 | 0.090 | ||
| ML08 | 20,000 | 0.953 | 0.491 | 0.790 | 0.101 | ||
| ML09 | / | / | 10,000 | 0.955 | 0.487 | 0.786 | 0.102 |
| ML10 | 5000 | 0.953 | 0.488 | 0.789 | 0.106 | ||
| ML11 | 2500 | 0.950 | 0.433 | 0.775 | 0.107 |
Publisher’s Note: MDPI stays neutral with regard to jurisdictional claims in published maps and institutional affiliations. |
© 2021 by the authors. Licensee MDPI, Basel, Switzerland. This article is an open access article distributed under the terms and conditions of the Creative Commons Attribution (CC BY) license (https://creativecommons.org/licenses/by/4.0/).
Share and Cite
MDPI and ACS Style
Wu, M.; Wang, J. Estimating Contact Force Chains Using Artificial Neural Network. Appl. Sci. 2021, 11, 6278. https://doi.org/10.3390/app11146278
AMA Style
Wu M, Wang J. Estimating Contact Force Chains Using Artificial Neural Network. Applied Sciences. 2021; 11(14):6278. https://doi.org/10.3390/app11146278
Chicago/Turabian StyleWu, Mengmeng, and Jianfeng Wang. 2021. "Estimating Contact Force Chains Using Artificial Neural Network" Applied Sciences 11, no. 14: 6278. https://doi.org/10.3390/app11146278
Note that from the first issue of 2016, this journal uses article numbers instead of page numbers. See further details here.