Article

Neuronutraceuticals Modulate Lipopolysaccharide- or Amyloid-β 1-42 Peptide-Induced Transglutaminase 2 Overexpression as a Marker of Neuroinflammation in Mouse Microglial Cells

1
Departments of Precision Medicine, University of Campania “L. Vanvitelli”, via de Crecchio 7, 80138 Naples, Italy
2
Department of Experimental Medicine, University of Campania “L. Vanvitelli”, via de Crecchio 7, 80138 Naples, Italy
3
IRCSS, Neuromed, 86077 Pozzilli, Italy
*
Author to whom correspondence should be addressed.
Appl. Sci. 2021, 11(12), 5718; https://doi.org/10.3390/app11125718
Submission received: 12 May 2021 / Revised: 17 June 2021 / Accepted: 18 June 2021 / Published: 20 June 2021
(This article belongs to the Special Issue Spotlights on Transglutaminase Genes and Functions)

Abstract

:
Background: Tissue type 2 transglutaminase (TG2, E.C. 2.3.2,13) is reported to be involved in the phagocytosis of apoptotic cells in mouse microglial BV2 cells and peripheral macrophages. In this study, by using lipopolysaccharide (LPS)- or amyloid-β 1-42 (Aβ 1-42) peptide-stimulated microglial cell line BV2 and mouse primary microglial cells, we examined the effects of different neuronutraceutical compounds, such as curcumin (Cu) and N-Palmitoylethanolamine (PEA), known for their anti-inflammatory activity, on TG2 and several inflammatory or neuroprotective biomarker expressions. Methods: Mouse BV2 cells were treated with LPS or Aβ1-42 in the presence of curcumin or PEA, in order to evaluate the expression of TG2 and other inflammatory or neuroprotective markers using Real Time-PCR and Western blot analyses. Results: Curcumin and PEA were capable of reducing TG2 expression in mouse microglial cells during co-treatment with LPS or Aβ 1-42. Conclusions: The results show the role of TG2 as an important marker of neuroinflammation and suggest a possible use of curcumin and PEA in order to reduce LPS- or Aβ1-42-induced TG2 overexpression in mouse microglial cells.

1. Introduction

Transglutaminases (TGs; EC 2.3.2.13) are a family of calcium-dependent enzymes that catalyze the cross-linking of proteins by promoting the formation of isopeptide bonds between protein-bound glutamine and lysine residues. These enzymes are also capable of catalyzed reactions, such as the attachment of a mono(poly)-amine to the γ-carboxamide of a glutaminyl residue and the deamidation of the γ-carboxamide group of a protein/polypeptide glutaminyl residue (for a review see [1,2]). Tissue transglutaminase (TG2) is both an intracellular and extracellular transglutaminase found in many cells and tissues [3]. TG2 is involved in several physiological processes, such as apoptotic cell death [4,5,6], in which the enzyme is induced and activated in apoptotic cells, and cross-linked proteins accumulate in the fragments (apoptotic bodies) of cells undergoing programmed cell death [7,8]. TG2 has also been implicated in the interactions between cells and the extracellular matrix [9,10,11,12,13]. Transglutaminase cross-linked matrix proteins have been shown to promote cellular adhesion [14,15,16], and the induction of tissue transglutaminase has been shown to be correlated with morphological changes and increased adhesion [17] in several cultured cell lines. Recently, the data from numerous studies have demonstrated the involvement of TG2 in Celiac disease (CD), while more recently, a large body of literature has suggested that TG2 could be involved in neurodegenerative disorders, including Alzheimer’s disease (AD), Parkinson’s disease (PD) and other neurodegenerative diseases [18,19]. In fact, a possible role for this enzyme has been suggested in the neuroinflammation process, which is often present during these neurodegenerative disorders [20]. Although inflammation is an initial protective effect, persistent inflammation has been believed to be involved in several human diseases, including the development of several neurological diseases. For example, the aberrantly increased activity of NF-kB, a master factor playing a key role in inflammation, is implicated in a variety of human cancers. Significantly, curcumin is known to exert anti-inflammatory effects by interrupting NF-κB signaling at multiple levels, very likely by inhibiting the activity of the kinase of the inhibitor of NF-kB (IKK). In fact, many observations indicate that curcumin indeed shows valuable potential in cancer treatment through inhibiting the activity of I-kB kinase, IKK [21]. Data from the literature have suggested that TG2 activates the pro-inflammatory transcriptional factor NF-kB in multiple ways, either by inducing the polymerization of its inhibitory subunit I-kBα, which, in turn, results in the dissociation of NF-kB and its translocation to the nucleus, where it is capable of up-regulating host inflammatory genes [22], or by a non-canonical pathway [23]. On the other side, NF-kB regulatory response elements are present also in the transglutaminase 2 promoter [24]. Our previous work reported the ability of curcumin to reduce the TG2 overexpression induced by retinoic acid in human nervous cell lines [25]. On the basis of these previous data, we analyzed the effects of curcumin and of another nutraceutical with known anti-inflammatory properties, such as the endocannabinoid PEA, on the TG2 expression in mouse microglial cells. In this article we describe the effects of the treatment with curcumin or PEA on the expression of TG2 in mouse microglial cells before inflammatory stimulations with LPS or Aβ 1-42 peptide, and the expression levels of TG2 and other inflammatory or neuroprotective markers are reported.

2. Materials and Methods

2.1. Materials

Lipopolysaccaride (LPS) and curcumin were purchased from Sigma (St. Louis, MO, USA). Amyloid-β 1-42 peptide (Aβ-1-42) was purchased from GenScript (Leiden, The Netherlands) and has been added to cell cultures in fibrillary forms. Ultramicronized-N-Palmitoylethanolamine (PEA) was a generous gift from Epitech Group S.p.A. (Saccolongo, Padova, Italy).

2.2. Cell Culture

Mouse microglial cell line BV2 cells were grown in Dulbecco’s modified eagle medium (DMEM) supplemented with 2 mM L-glutamine, 10% fetal bovine serum, 50 U/mL penicillin and 50 μg/mL streptomycin. Cells were grown at 37 °C in a humidified atmosphere containing 5% CO2. Cells were treated with curcumin or PEA just before LPS or Aβ-1-42 peptide were added.

2.3. Mouse Primary Microglia Isolation

According to our previous study [26], mouse primary microglia has been prepared from the brains of C57BL/6J pups with a postnatal age of 3 days (P3). Each experimental point is made by from the brains of four to six mice. A total of 5–6 different cultures were used for the study. Brain tissues were firstly harvested in a Petri dish with HBSS, Hanks’ balanced salt solution (Gibco), with 1% penicillin/streptomycin (Sigma). The brain tissues were cleared of the meninges by using a dissection microscope and then they were dissociated by adding dissection medium (150 mg BSA—bovine serum albumin powder (Gibco), 5 mg Trypsin powder (Gibco) and 8.5 mg DNase I powder (Gibco) all dissolved in 50 mL of EBSS, Earle’s Balanced Salt Solution (Gibco)). The mixed cell cultures generated were suspended in Dulbecco’s modified eagle medium (DMEM) with 15% heat-inactivated fetal bovine serum (Gibco) 1% penicillin/streptomycin and 1% GLUTAMAX (Gibco). The cell suspension was filtered through a 100-micrometer nylon mesh (BD Biosciences) and plated in T 50 tissue culture flasks precoated with poly-D-lysine (10 μg/mL). Cells were maintained in a 5% CO2 incubator at 37 °C and were harvested as floating cell suspensions following shaking after 10–12 days. Cells were plated in 13-millimeter diameter wells (5 × 10⁵ cells/well).

2.4. Western Blot Analysis

The cells were washed twice with PBS and homogenized in a buffer containing 100 mM Tris-HCl (pH 7.4), 5 mM EDTA, 5 mg/mL leupeptin and 2 mM PhMeso2F. The total cell homogenate and cytosolic fraction obtained after centrifugation at 18,000 g, were subjected to sodium dodecyl sulfate-polyacrylamide gel electrophoresis (SDS-PAGE) using 7.5–10% acrylamide slab gels. After electrophoresis, proteins were transferred to a nitrocellulose membrane for 1 h at 360 mA (in Tris-glycine). The immune reaction was carried out as follows: the blot was incubated for 1 h in TBS Tween containing 5% skim milk at room temperature and then with the rabbit polyclonal antibody anti-human TG2 (Zedira, Darmstadt, Germany) (diluted 1:1000) in TBS Tween containing 5% skim milk overnight at 4 °C. This was followed by several washings with TBS containing 0.05% Tween-20, incubation with 1:10,000 peroxidase-conjugated goat anti-rabbit IgG (Sigma-Aldrich) for 1 h at room temperature, several washings with TBS containing 0.05% Tween-20 and development with the chemiluminescence technique using an ECL detection system (Amersham, Arlington Heights, Ill.) for 1 min. Each Western blot analysis was repeated at least three times. Anti-glyceraldehyde-3-phosphate dehydrogenase (GAPDH) (Proteintech, Rosemont, IL, USA) was used for standardization. Human recombinant TG2 (Zedira, Darmstadt, Germany) was used as positive control.

2.5. RNA Extraction and Semi-Quantitative RT-qPCR Analysis

RNA extraction from cell cultures was performed by using the Chomczynski and Sacchi protocol [27]. The reverse transcription was performed by using the 5X All-In-One RT Mastermix kit (abm®), according to the manufacturer’s instructions. Semi-quantitative RT-qPCR analyses were carried out on 50–100 ng DNA-free RNA by using the PrimePCR™ SYBR® Green Assay (Bio-Rad Laboratories, Inc., Rosemont, IL, USA) kit. The reaction volume mixture was 10 μL and 20 pmol of each primer were used (Table 1).
Plates were run using the BioRad CFX96 Real-Time PCR detection system (Bio-Rad Laboratories, Inc., Rosemont, IL, USA) and each set of reactions included both a non-reverse transcription control and a no template sample negative control (data not shown). The protocol consisted of a cycling profile of 2 min at 95 °C, 5 s at 95 °C and 30 s at 60 °C, for 40 cycles, according to the manufacturer’s instructions. Primer efficiency was checked for each primer-set using a representative test sample prepared as the experimental sample. Melt curve analysis confirmed that a single PCR product was present. Relative changes in gene expression were quantified using the comparative Ct (ΔCt, ΔΔCt) method, as described by Livak and Schmittgen [28] and Schmittgen and Livak [29]. The Ct value of the genes of interest was normalized to an average of the endogenous housekeeping gene, GAPDH. Where multiple comparisons were being made, they were then compared to the normalized control sample. Alteration in the mRNA expression of target genes was defined as fold difference in the expression level in cells relative to that of the control.

2.6. Statistical Analysis

Experiments were performed at least three times with replicate samples. Data are expressed as mean ± standard deviation (SD). The means were compared using analysis of variance (ANOVA) plus post hoc Tukey’s test. A p-value of <0.05 was considered to indicate a statistically significant result.

3. Results

3.1. Effects of Curcumin and PEA on LPS-Induced TG2 Expression Levels in BV2 Cells

3.1.1. Effects of Curcumin and PEA on LPS-Induced TG2 RNA Expression Levels in BV2 Cells

Neuroinflammation has an important role in the progression of many neurodegenerative diseases. In this study, we initially focused the attention on the anti-inflammatory effects of PEA and curcumin, nutraceuticals tested under in vitro neuroinflammatory conditions induced by challenge with LPS. To study the anti-inflammatory effects on a BV2 cell model, this cell type was treated with LPS 1 μg/mL in the presence or absence of the nutraceuticals tested at a concentration of 10 μM for PEA and curcumin. The exacerbated activation of microglia, however, induces neuronal death, a histological characteristic of neurodegenerative diseases such as PD and AD [30,31]. In order to confirm the pharmacological effects of the two neuronutraceuticals under investigation in our study (Cu and PEA), we firstly evaluated the RNA expression levels of some already known pro-inflammatory or anti-inflammatory markers, together with the RNA expression levels of TG2. We found that the molecules tested reduced the pro-inflammatory markers Interleukin 1β (IL-1β) and Interleukin 6 (IL-6), and inducible Nitric oxide synthase (iNOS) mRNA levels were increased by the LPS presence (Figure 1A–C); conversely, they increased the RNA level synthesis of the neuroprotective or anti-inflammatory markers’ triggering receptor expressed on myeloid cells 2 (TREM-2) and Arginase-1 (ARG-1) (Figure 2A,B) in LPS-stimulated BV2 cells. Intriguingly, we noted that TG2 expression shows a similar profile of pro-inflammatory markers. In fact, TG2 RNA levels increased under LPS-derived pro-inflammatory stimulus, and they decreased when the tested nutraceuticals were added (Figure 1D).

3.1.2. TG2 Protein Levels in BV2 Cells After Treatment with Neuronutraceuticals and LPS

To evaluate the anti-inflammatory effects of the neuronutraceuticals under study using the TG2 protein expression levels in a BV2 cell model, this cell type was treated with LPS 1 μg/mL in the absence or presence of the nutraceuticals tested at a concentration of 10 μM for PEA or curcumin for 48 h. The Western blot results on the BV2 microglia cell line have confirmed the regulation of TG2 under these treatments (Figure 3). In fact, TG2 protein levels increased under LPS-derived pro-inflammatory stimulus and decreased when the tested nutraceuticals were added.

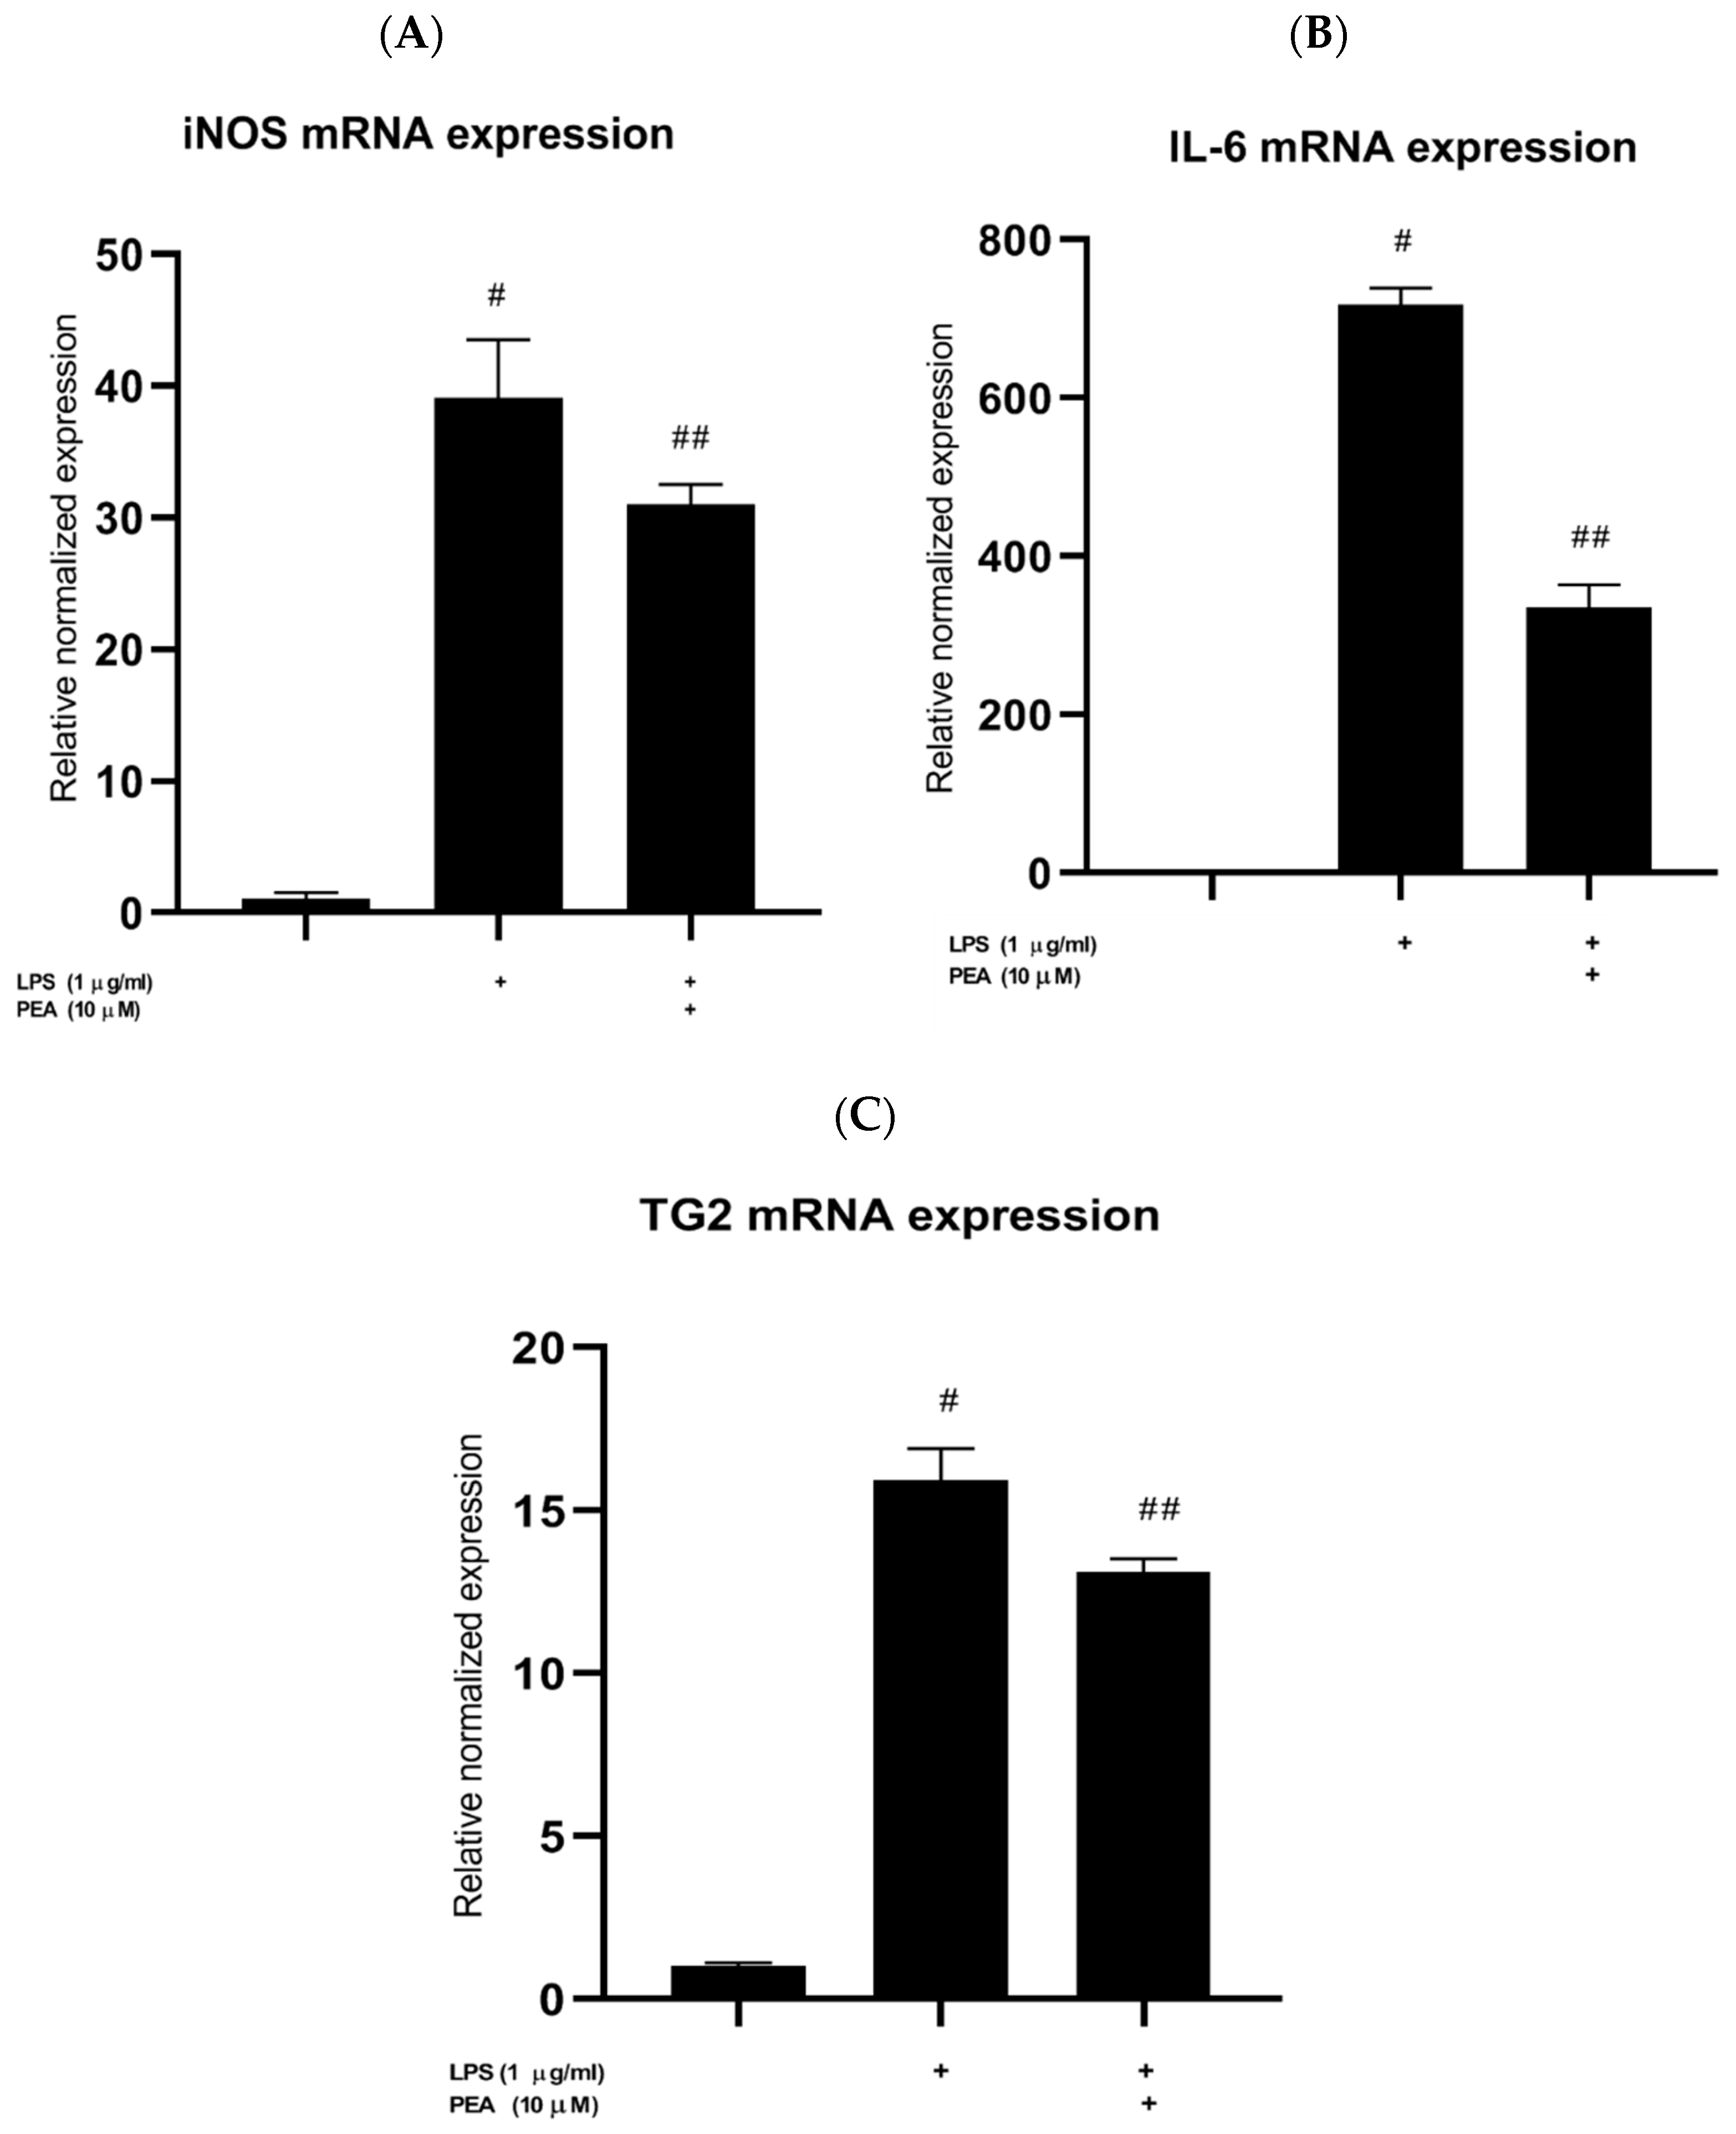
3.1.3. Effects of PEA on LPS-Induced TG2, Inflammatory Markers RNA Expression Levels in Murine Primary Microglial Cells

In order to confirm the results obtained with the in vitro BV2 microglial cell model, we made the same treatment ex vivo with primary murine microglia cells extracted from murine pups. Given the poor yield of the microglia cells obtained, we started to evaluate the PEA effect on pro-inflammatory RNA levels, iNOS and IL-6, increased by the LPS presence (Figure 4A,B). Even in this case, we measured an effective increase in the iNOS and IL-6 RNA levels induced by 1 μg/mL LPS, but the presence of PEA interferes with it. In the same circumstances, we measured an increased TG2 RNA level under LPS treatment and a subsequent reduction when 10 μM PEA was added to the inflammatory condition (Figure 4C).

3.2. Effects of Curcumin and PEA on Aβ1-42-Induced TG2, Inflammatory or Neuroprotective Markers Expression Levels in BV2 Cells

3.2.1. Effects of Aβ1-42 on TG2 Protein Expression in BV2 Cells

In order to establish the best concentration of Aβ1-42 capable of stimulating TG2 protein expression in BV2 cells, we conducted a dose-dependent analysis of the impact of different Aβ1-42 concentrations on TG2 protein expression in BV2 cells. As shown in Figure 5, we found the highest TG2 protein expression in BV2 cells when they were treated with 1 μM Aβ1-42 for 48 h.

3.2.2. Effects of Curcumin and PEA on Aβ1-42-Induced TG2, Inflammatory or Neuroprotective Markers RNA Expression Levels in BV2 Cells

In order to evaluate whether curcumin and PEA could modulate TG2 (Figure 6D), inflammatory (Figure 6A) or neuroprotective (Figure 6B,C) cytokines’ expression levels in BV2 cells under a different inflammatory condition, the BV2 cells were treated with 1 μM Aβ1-42 peptide in the absence or presence of curcumin or PEA, and the RNA levels were evaluated using a RT-PCR (Figure 6).

3.2.3. TG2 Protein Levels in BV2 Cells after Treatment with Neuronutraceuticals and Aβ1-42

To evaluate the anti-inflammatory effects of the neuronutraceuticals under study on the TG2 protein expression levels in a BV2 cell model, this cell type has been treated with Aβ1-42 1 μM in the absence or presence of the tested nutraceuticals at a concentration of 10 μM for PEA and curcumin. The Western blot results on the BV2 microglia cell line have confirmed the regulation of TG2 under these treatments (Figure 7). In fact, the TG2 protein levels increased under Aβ1-42-derived pro-inflammatory stimulus and decreased when the tested nutraceuticals were added.

4. Discussion

Our previous work reported the ability of curcumin to reduce the TG2 overexpression induced by retinoic acid in human nervous cell lines [25]. On the basis of these previous data, and other data present in the literature, we analyzed the effects of curcumin and of another nutraceutical with known anti-inflammatory properties, such as PEA, on the TG2 expression in mouse microglial cells. The present study provides the evidence that curcumin, a naturally occurring compound derived from turmeric (Curcuma longa) that has long been suggested to have strong therapeutic or preventive potential against several major human diseases because of its anti-oxidative, anti-cancerous and anti-inflammatory effects, and the endocannabinoid PEA, are capable of down-regulating the lipopolysaccharide- or amyloid-β 1-42 peptide-induced overexpression of TG2 in mouse microglial cells. In fact, we found that, similarly to curcumin, PEA exerted protective effects on microglia cells. The anti-inflammatory and neuroprotective effects of PEA have been largely demonstrated in different neuroinflammatory conditions associated with CNS disorders [32,33]. This effect was associated with the reduction in an inflammatory cell phenotype, as suggested by the reduction in the proinflammatory markers and the increase in the typical anti-inflammatory markers of microglia. TG2 is both an intracellular and extracellular transglutaminase found in many cells and tissues [3] and is involved in several physiological processes, such as apoptotic cell death [4,5,6], in which the enzyme is induced and activated in apoptotic cells, and cross-linked proteins accumulate in the fragments (apoptotic bodies) of cells undergoing programmed cell death [7,8]. Recently, the data from numerous studies have demonstrate the involvement of TG2 in Celiac disease (CD), while more recently, a large body of literature has suggested that TG2 could be involved in neurodegenerative disorders, including Alzheimer’s disease (AD), Parkinson’s disease (PD) and other neurodegenerative diseases [18,19]. Moreover, it has also been suggested that this enzyme has a possible role in the neuroinflammation process, which is often present during these neurodegenerative disorders [20]. Significantly, curcumin is known to exert anti-inflammatory effects by interrupting NF-κB signaling at multiple levels, very likely by inhibiting the activity of the inhibitor of NF-kB kinase (IKK). In fact, many observations indicate that curcumin indeed shows valuable potential in cancer treatment through inhibiting the activity of I-κB kinase, IKK [21]. Since data from the literature have suggested that TG2 activates the pro-inflammatory transcriptional factor NF-kB in multiple ways, either by inducing the polymerization of its inhibitory subunit I-kBα, which, in turn, results in the dissociation of NF-kB and its translocation to the nucleus, where it is capable of up-regulating host inflammatory genes [22], or by a non-canonical pathway [23], and, on the other side, NF-kB regulatory response elements are also present in the transglutaminase 2 promoter [24], we analyzed the effects of curcumin and the endocannabinoid PEA on TG2 expression in murine microglial cells. In fact, most of the anti-inflammatory effects of PEA have been attributed to the activation of peroxisome proliferator-activated receptor-alpha (PPAR-α) [34]. Upon stimulation, PPAR- α forms a heterodimer with the retinoid X receptor (RXR), and, by binding to specific DNA response elements, regulates gene transcription by causing a downstream inhibition of nuclear factor kappa B (NF-kB)-dependent inflammation. Interestingly, both curcumin and PEA were able to downregulate the lipopolysaccharide- or amyloid-β 1-42 peptide-induced overexpression of TG2 in murine microglial cells, also suggesting a possible role for this enzyme in the mechanism responsible for both acute and chronic inflammation in microglial cells. In particular, the possible effects of curcumin and PEA, the other nutraceutical under investigation in our study on the modulation of TG2 expression in microglial cells, were also confirmed by the capability of these compounds to modulate the expression of several inflammatory or neuroprotective markers, such as IL6 RNA and others. However, a more accurate analysis of the molecular pathways responsible for the downregulation of the expression of TG2 at both protein and mRNA levels needs to be carried out in the future to explain these effects. In conclusion, a possible use of these nutraceutical compounds for neuroprotection in neuroinflammatory conditions could be suggested.

Author Contributions

Conceptualization, N.G.G., A.P., F.G., S.M. and V.G.; methodology, N.G.G. and A.P.; investigation, N.G.G. and A.P.; writing, V.G. All authors have read and agreed to the published version of the manuscript.

Funding

This work was supported by departmental funding and by Progetti di Ricerca Scientifica Finanziabili ai sensi della L.R. N.5 del 28.03.2002, GIUNTA REGIONALE DELLA CAMPANIA ASSESSORATO ALLA RICERCA SCIENTIFICA (2008). Title: Identificazione e caratterizzazione di geni della transglutaminasi nel Sistema Nervoso in relazione allo sviluppo di malattie neurodegenerative (Identification and characterization of transglutaminase genes in the Nervous System in relationship to the development of neurodegenerative diseases).

Acknowledgments

Epitech Group S.p.A. (Saccolongo, Padova, Italy) for the materials used for experiments.

Conflicts of Interest

The authors declare no conflict of interest.

References

  1. Folk, J.E. Transglutaminases. Annu. Rev. Biochem. 1980, 49, 517–531. [Google Scholar] [CrossRef]
  2. Lorand, L.; Conrad, S.M. Transglutaminases. Mol. Cell Biol. 1984, 58, 9–35. [Google Scholar]
  3. Thomazy, V.; Fesus, L. Differential expression of tissue transglutaminase in human cells: An immunohistochemical study. Cell Tissue Res. 1989, 255, 215–224. [Google Scholar] [CrossRef]
  4. Fesus, L.; Thomazy, V.; Falus, A. Induction and activation of tissue transglutaminase during programmed cell death. FEBS (Fed. Eur. Biochem. Soc.) Lett. 1987, 224, 104–108. [Google Scholar] [CrossRef] [Green Version]
  5. Piacentini, M.; Autuori, F.; Dini, L.; Farrace, M.G.; Ghibelli, L.; Piredda, L.; Fesus, L. “Tissue” transglutaminase is specifically expressed in neonatal rat liver cells undergoing apoptosis upon epidermal growth factor stimulation. Cell Tissue Res. 1991, 263, 227–235. [Google Scholar] [CrossRef] [PubMed]
  6. Fesus, L.; Davies, P.J.A.; Piacentini, M. Apoptosis: Molecular mechanisms in programmed cell death. Eur. J. Cell Biol. 1992, 56, 170–177. [Google Scholar]
  7. Fesus, L.; Tarcsa, E. Formation of N-ε−(γ-glutamyl)-lysine isodipeptide in chinese hamster ovary cells. Biochem. J. 1989, 263, 843–848. [Google Scholar] [CrossRef]
  8. Melino, G.; Annichiarico-Petruzzelli, M.; Piredda, L.; Candi, E.; Gentile, V.; Davies, P.J.A.; Piacentini, M. Tissue transglutaminase and apoptosis: Sense and antisense transfection studies with human neuroblastoma cells. Mol. Cell. Biol. 1994, 14, 6584–6596. [Google Scholar] [CrossRef] [Green Version]
  9. Bowness, J.M.; Folk, J.E.; Timpl, R. Identification of a substrate site for liver transglutaminase on the aminopropeptide of type III collagen. J. Biol. Chem. 1987, 262, 1022–1024. [Google Scholar] [CrossRef]
  10. Slife, C.W.; Dorsett, M.D.; Tillotson, M.L. Subcellular localization and a large molecular weight substrate for the liver plasma membrane transglutaminase. J. Biol. Chem. 1986, 261, 3451–3456. [Google Scholar] [CrossRef]
  11. Tyrrel, D.J.; Sale, W.S.; Slife, C.W. Fibronectin is a component of the sodium dodecyl sulfate-insoluble transglutaminase substrate. J. Biol. Chem. 1988, 263, 8464–8469. [Google Scholar] [CrossRef]
  12. Kinsella, M.G.; Wight, T.N. Modulation of sulfated proteoglycan synthesis by bovine aortic endothelial cells during migration. J. Cell Biol. 1986, 162, 679–687. [Google Scholar] [CrossRef]
  13. Kinsella, M.G.; Wight, T.N. Formation of high weight dermatan sulfate proteoglycan in bovine aortic endothelial cell cultures. J. Biol. Chem. 1990, 265, 17891–17898. [Google Scholar] [CrossRef]
  14. Fesus, L.; Metsis, M.L.; Muszbek, L.; Koteliansky, V.E. Transglutaminase-sensitive glutamine residues of human plasma fibronectin revealed by studying its proteolytic fragments. Eur. J. Biochem. 1986, 154, 371–374. [Google Scholar] [CrossRef] [Green Version]
  15. Martinez, J.; Rich, E.; Barsigian, C. Transglutaminase-mediated cross-linking of fibrinogen by human umbilical vein endothelial cells. J. Biol. Chem. 1989, 264, 20502–20508. [Google Scholar] [CrossRef]
  16. Sane, D.C.; Moser, T.L.; Greenberg, C.S. Vitronectin in the substratum of endothelial cells is cross-linked and phosphorylated. Biochem. Biophys. Res. Commun. 1991, 174, 465–469. [Google Scholar] [CrossRef]
  17. Gentile, V.; Thomazy, V.; Piacentini, M.; Fesus, L.; Davies, P.J.A. Expression of tissue transglutaminase in Balb-C 3T3 fibroblasts: Effects on cellular morphology and adhesion. J. Cell Biol. 1992, 119, 463–474. [Google Scholar] [CrossRef] [PubMed] [Green Version]
  18. Zhang, J.; Wang, S.; Huang, W.; Bennett, D.A. Tissue transglutaminase and its product isopeptide are increased in Alzheimer’s disease and APPswe/PS1dE9 double transgenic mice brains. Mol. Neurobiol. 2015. [Google Scholar] [CrossRef] [PubMed] [Green Version]
  19. Wilhelmus, M.M.; de Jager, M.; Smit, A.B.; van der Loo, R.J.; Drukarch, B. Catalytically active tissue transglutaminase colocalises with Aβ pathology in Alzheimer’s disease mouse models. Sci. Rep. 2016. [Google Scholar] [CrossRef] [Green Version]
  20. Ientile, R.; Currò, M.; Caccamo, D. Transglutaminase 2 and neuroinflammation. Amino Acids 2015, 47, 19–26. [Google Scholar] [CrossRef]
  21. Chih-Li, L.; Jen-Kun, L. Curcumin: A potential cancer chemopreventive agent through suppressing NF-kB signaling. J. Cancer Mol. 2008, 4, 11–16. [Google Scholar]
  22. Lee, J.; Kim, Y.S.; Choi, D.H.; Bang, M.S.; Han, T.R.; Joh, T.H.; Kim, S.Y. Transglutaminase 2 induces nuclear factor-kB activation via a novel pathway in BV-2 microglia. J. Biol. Chem. 2004, 279, 53725–53735. [Google Scholar] [CrossRef] [Green Version]
  23. Kumar, S.; Mehta, K. Tissue transglutaminase constitutively activates HIF-1a promoter and nuclear factor-kB via a non-canonical pathway. PLoS ONE 2012, 7, e49321. [Google Scholar] [CrossRef] [Green Version]
  24. Lu, S.; Saydak, M.; Gentile, V.; Stein, J.P.; Davies, P.J.A. Isolation and characterization of the human tissue transglutaminase promoter. J. Biol. Chem. 1995, 270, 9748–9755. [Google Scholar] [CrossRef] [PubMed] [Green Version]
  25. Gatta, N.G.; Cammarota, G.; Iannaccone, M.; Serretiello, E.; Gentile, V. Curcumin (Diferulolylmethane) reduces transglutaminase 2 overexpression induced by retinoic acid in human nervous cell lines. Neuroimmunomodulation 2016, 23, 188–193. [Google Scholar] [CrossRef]
  26. Alessio, N.; Belardo, C.; Trotta, M.C.; Paino, S.; Boccella, S.; Gargano, F.; Pieretti, G.; Ricciardi, F.; Marabese, I.; Luongo, L.; et al. Vitamin D Deficiency Induces Chronic Pain and Microglial Phenotypic Changes in Mice. Int. J. Mol. Sci. 2021, 22, 3604. [Google Scholar] [CrossRef] [PubMed]
  27. Chomczynski, P.; Sacchi, N. Single-step method of RNA isolation by acid guanidinium thiocyanate-phenol-chloroform extraction. Anal. Biochem. 1987, 162, 156–159. [Google Scholar] [CrossRef]
  28. Livak, K.J.; Schmittgen, T.D. Analysis of relative gene expression data using real-time quantitative PCR and the 2(-Delta Delta C(T)) Method. Methods 2001, 25, 402–408. [Google Scholar] [CrossRef] [PubMed]
  29. Schmittgen, T.D.; Livak, K.J. Analyzing real-time PCR data by the comparative C(T) method. Nat. Protoc. 2008, 3, 1101–1108. [Google Scholar] [CrossRef]
  30. Mosser, D.M.; Edwards, J.P. Exploring the full spectrum of macrophage activation. Nat. Rev. Immunol. 2008, 8, 958–969. [Google Scholar] [CrossRef]
  31. Gordon, S.; Taylor, P.R. Monocyte and macrophage heterogeneity. Nat. Rev. Immunol. 2005, 5, 953–964. [Google Scholar] [CrossRef] [PubMed]
  32. Guida, F.; Luongo, L.; Boccella, S.; Giordano, M.E.; Romano, R.; Bellini, G.; Manzo, I.; Furiano, A.; Rizzo, A.; Imperatore, R.; et al. Palmitoylethanolamide induces microglia changes associated with increased migration and phagocytic activity: Involvement of the CB2 receptor. Sci. Rep. 2017, 7, 375–386. [Google Scholar] [CrossRef] [PubMed]
  33. Guida, F.; Boccella, S.; Iannotta, M.; De Gregorio, D.; Giordano, C.; Belardo, C.; Romano, R.; Palazzo, E.; Scafuro, M.A.; Serra, N.; et al. Palmitoylethanolamide Reduces Neuropsychiatric Behaviors by Restoring Cortical Electrophysiological Activity in a Mouse Model of Mild Traumatic Brain Injury. Front Pharmacol. 2017, 8, 95–119. [Google Scholar] [CrossRef] [Green Version]
  34. Lo Verme, J.; Fu, J.; Astarita, G.; La Rana, G.; Russo, R.; Calignano, A.; Piomelli, D. The nuclear receptor peroxisome proliferator-activated receptor-alpha mediates the anti-inflammatory actions of palmitoylethanolamide. Mol. Pharmacol. 2005, 67, 15–19. [Google Scholar] [CrossRef] [PubMed]
Figure 1. Real Time-PCR was performed to measure the mRNA expression of inflammatory markers after 24 h treatment. BV2 cells were pretreated with the indicated concentrations of PEA and curcumin (Cu) followed by treatment with LPS (1 μg/mL for 24 h). Data are shown as the mean ± SD of three independent experiments. # p value < 0.05 compared with control group. ## p < 0.05 compared with LPS group.
Applsci 11 05718 g001
Figure 2. Real Time-PCR was performed to measure the mRNA expression of neuroprotective or anti-inflammatory markers after 24 h treatment. BV2 cells were pretreated with the indicated concentrations of PEA and curcumin (Cu) followed by treatment with LPS (1 μg/mL for 24 h). Data are shown as the mean ± SD of three independent experiments. # p value < 0.05 compared with control group. ## p < 0.05 compared with LPS group.
Applsci 11 05718 g002
Figure 3. Panel (A): Western blot for TG2 protein expression. BV2 cells were cultured in medium supplemented or not (NT) with 10 μM of PEA and Cu or in presence of 1 μg/mL LPS for 48 h. Cells were treated also with 10 μL of ethanol (ETOH) as a negative control or with 10 μM retinoic acid (RA) as a positive control. SDS-PAGE was blotted with an antibody against TG2. GAPDH protein expression was used as loading control. The experiments were performed at least 3 different times and the results were always similar; Panel (B): graph shows the densitometric intensity of TG2/GAPDH bands ratio. # p value < 0.05 compared with control group (NT). ## p < 0.05 compared with LPS group.
Applsci 11 05718 g003
Figure 4. Real Time-PCR was performed to measure the mRNA expression. Murine primary microglial cells were treated with the indicated concentrations of PEA followed by treatment with 1 μg/mL LPS for 24 h. Data are shown as the mean ± SD of three independent experiments. # p value < 0.05 compared with control group. ## p < 0.05 compared with LPS group.
Applsci 11 05718 g004
Figure 5. Panel (A): Western blot for TG2 expression in BV2 cells after treatment with different concentrations of Aβ1-42 for 48 h. SDS-PAGE blotted with antibody against TG2. GAPDH protein expression was used as loading control. The experiments were performed at least 3 different times and the results were always similar; Panel (B): graph shows the densitometric intensity of TG2/GAPDH bands ratio. The intensity of signals is expressed as a percentage in respect to the control (CTRL). # p value < 0.05; ## p value < 0.01.
Applsci 11 05718 g005
Figure 6. Real Time-PCR was performed to measure the RNA expression levels of TG2 (D), inflammatory (A) or neuroprotective (B,C) markers after 24 h treatment. BV2 cells were pre-treated with the indicated concentrations of PEA or curcumin (Cu), followed by treatment with Aβ1-42 (1 μM for 24 h). Data are shown as the mean ± SD of three independent experiments. # p value < 0.05 compared with control group. ## p < 0.05 compared with Aβ1-42 group.
Applsci 11 05718 g006
Figure 7. Panel (A): Western blot for TG2 expression. BV2 cells were cultured in medium supplemented or not with 10 μM of PEA or Cu, and Aβ1-42 (1 μM) for 48 h. SDS-PAGE was blotted with antibody against TG2. GAPDH protein expression was used as loading control. The experiments were performed at least 3 different times and the results were always similar; Panel (B): graph shows the densitometric intensity the full lanes (TG2 full length and splicing variants)/GAPDH bands ratio. # p value < 0.05 compared with control group (NT). ## p < 0.05 compared with Aβ1-42 group.
Applsci 11 05718 g007
Table 1. List of primers used.
Genes and Reference Sequence Data for Nucleotide SequencesForwardReverse
TG2
NM_009373.3
5′-ACTTCGACGTGTTTGCCCACAT-3′5′-TTGATGTCCTCAGTGCCACACT-3′
IL6
NM_031168.2
5′-GATGGATGCTACCAAACTGGAT- 3′5′-CCAGGTAGCTATGGTACTCCAGA-3′
iNOS
NM_010927.4
5′-TGAGCTCATCTTTGCCACCA-3′5′-ACAGTTCCGAGCGTCAAAGA-3′
IL-1β
NM_008361.4
5′-TCGGACCCATATGAGCTGAAAG-3′5′-CCACAGGTATTTTGTCGTTGCT-3′
TREM2
NM_031254.3
5′-AGCCTGACTGGCTTGGTCAT-3′5′-CCCAGTGCTTCAAGGCGTCA-3′
ARG1
NM_007482.3
5′-CAGCCTCGAGGAGGGGTAGA-3′5′-CCCGTGGTCTCTCACGTCAT-3′
GAPDH
NM_001289726.1
5′-GGGCATCTTGGGCTACACTGAGGACC-3′5′-GGGGGCCGAGTTGGGATAGGG-3′
Publisher’s Note: MDPI stays neutral with regard to jurisdictional claims in published maps and institutional affiliations.

