Article

Acoustic Identification of the Voicing Boundary during Intervocalic Offsets and Onsets Based on Vocal Fold Vibratory Measures

by
Jennifer M. Vojtech
1,2,3,4,*,
Dante D. Cilento
2,
Austin T. Luong
2,
Jacob P. Noordzij, Jr.
2,
Manuel Diaz-Cadiz
2,
Matti D. Groll
1,2,
Daniel P. Buckley
2,5,
Victoria S. McKenna
2,
J. Pieter Noordzij
5 and
Cara E. Stepp
1,2,5
1
Department of Biomedical Engineering, Boston University, Boston, MA 02215, USA
2
Department of Speech, Language, and Hearing Sciences, Boston University, Boston, MA 02215, USA
3
Delsys, Inc., Natick, MA 01760, USA
4
Altec, Inc., Natick, MA 01760, USA
5
Department of Otolaryngology—Head and Neck Surgery, Boston University School of Medicine, Boston, MA 02118, USA
*
Author to whom correspondence should be addressed.
Appl. Sci. 2021, 11(9), 3816; https://doi.org/10.3390/app11093816
Submission received: 29 March 2021 / Revised: 21 April 2021 / Accepted: 22 April 2021 / Published: 23 April 2021
(This article belongs to the Special Issue Computational Methods and Engineering Solutions to Voice II)

Abstract

:
Methods for automating relative fundamental frequency (RFF)—an acoustic estimate of laryngeal tension—rely on manual identification of voiced/unvoiced boundaries from acoustic signals. This study determined the effect of incorporating features derived from vocal fold vibratory transitions for acoustic boundary detection. Simultaneous microphone and flexible nasendoscope recordings were collected from adults with typical voices (N = 69) and with voices characterized by excessive laryngeal tension (N = 53) producing voiced–unvoiced–voiced utterances. Acoustic features that coincided with vocal fold vibratory transitions were identified and incorporated into an automated RFF algorithm (“aRFF-APH”). Voiced/unvoiced boundary detection accuracy was compared between the aRFF-APH algorithm, a recently published version of the automated RFF algorithm (“aRFF-AP”), and gold-standard, manual RFF estimation. Chi-square tests were performed to characterize differences in boundary cycle identification accuracy among the three RFF estimation methods. Voiced/unvoiced boundary detection accuracy significantly differed by RFF estimation method for voicing offsets and onsets. Of 7721 productions, 76.0% of boundaries were accurately identified via the aRFF-APH algorithm, compared to 70.3% with the aRFF-AP algorithm and 20.4% with manual estimation. Incorporating acoustic features that corresponded with voiced/unvoiced boundaries led to improvements in boundary detection accuracy that surpassed the gold-standard method for calculating RFF.

Graphical Abstract

1. Introduction

Excessive and/or imbalanced laryngeal muscle forces have been implicated in over 65% of individuals with voice disorders [1]. The specific pathophysiology of laryngeal hypertonicity is a known characteristic of many functional, structural, and neurological disorders, including adductor-type laryngeal dystonia [2,3], hyperfunctional voice disorders (e.g., muscle tension dysphonia, nodules; [4]), and Parkinson’s disease [5]. Despite this prevalence, current clinical voice assessments fall short in objectively quantifying the degree of laryngeal muscle tension. For instance, auditory-perceptual judgments are a gold-standard technique used to assess voice quality, but the reliability and validity of these judgments remains questionable [6,7]. Likewise, manual laryngeal palpation techniques can be useful for evaluating tension of the extrinsic laryngeal and other superficial neck musculature; however, these methods do not assess the intrinsic laryngeal muscles and, moreover, are subject to the skill and experience of the practitioner [8]. Much of the research surrounding laryngeal hypertonicity has therefore turned to acoustic analyses, for which data can be non-invasively collected via a microphone. Acoustic signals can provide insight into characteristics of the glottal source (e.g., timing, frequency, and amplitude of vocal fold vibration). To date, however, a single acoustic indicator specific to laryngeal muscle tension has not been identified.

1.1. Relative Fundamental Frequency (RFF) as an Estimate of Laryngeal Muscle Tension

In recent years, relative fundamental frequency (RFF) has been suggested as an acoustic indicator of laryngeal muscle tension. Estimated from short-term changes in instantaneous fo during intervocalic offsets and onsets, RFF is a non-invasive, objective measure that shows promise in estimating the degree of baseline laryngeal muscle tension. RFF can be calculated from a vowel–voiceless consonant–vowel (VCV) production as in Figure 1. The instantaneous fo of the ten voiced cycles preceding (“voicing offset”) and following (“voicing onset”) the voiceless consonant are each estimated and normalized to a steady-state fo of the nearest vowel ( f o   r e f ) to produce an RFF estimate in semitones (ST):
RFF   ( ST ) = 12 × log 2 ( f o f o   r e f )
Recent work exploring the clinical utility of RFF for assessing laryngeal muscle tension suggests that RFF correlates with severity of vocal symptoms in speakers with dysphonia [9,10,11] and can distinguish speakers with and without voice disorders characterized by excessive laryngeal muscle tension, including individuals with vocal hyperfunction (VH) [9,12,13], Parkinson’s disease [14,15], and adductor-type laryngeal dystonia [11]. Specifically, those with voice disorders characterized by excessive laryngeal muscle tension tend to exhibit lower average RFF values, perhaps due to increased baseline laryngeal muscle tension that impedes their ability to leverage tension as a strategy for devoicing (voicing offset) and reinitiating voicing (voicing onset). RFF also normalizes (increases) in individuals with VH following voice therapy (i.e., a functional change; [9,16]), but not in individuals with vocal nodules or polyps following therapy (i.e., structural intervention; [16]). This suggests that RFF reflects functional voice changes rather than structural voice changes. It has also been demonstrated that RFF captures within-speaker changes in vocal effort [17], or the perceived exertion of a vocalist to a perceived communication scenario (i.e., vocal demand; [18]), as well as indirect kinematic estimates of laryngeal tension [19]. Despite the promise of RFF as an acoustic estimate of laryngeal muscle tension, this measure requires refinement before it will be appropriate for routine clinical use.
RFF can currently be calculated in two ways: manually or semi-automatically. The current gold-standard method of computing RFF is through manual estimation techniques using Praat software [20]. Due to the time- and training-intensive procedures that are necessary to reliably perform manual RFF estimation, a semi-automated RFF algorithm, called the “aRFF” algorithm was developed [21,22]. Both manual and aRFF estimation techniques use autocorrelation to estimate fo, which occurs by comparing a segment of the voice signal with itself when offset by a certain period. Despite being a relatively fast fo estimation method, autocorrelation assumes signal periodicity and fo stationarity, requiring 2–3 complete pitch periods to examine the physiological fo ranges encountered in speech [23]. These characteristics are not ideal for estimating fo during the voicing offset and onset transitions examined in RFF, which specifically capture rapid changes in fo. Indeed, Vojtech et al. [24] compared the effects of different fo estimation techniques on resulting RFF estimates, determining that fo estimation via the Auditory-SWIPE′ algorithm (an algorithm that estimates the fo of an input sound by first filtering the sound using a auditory-processing front-end then comparing the spectrum of the filtered sound to a sawtooth waveform) [25] led to smaller errors between manual and semi-automated RFF estimates compared to autocorrelation. The results of this work led to a refined version of the aRFF algorithm that employs Auditory-SWIPE′ for fo estimation, as well as using the acoustic metric, pitch strength [26], to account for differences in voice sample characteristics (e.g., recording location, overall severity of dysphonia). Incorporating both Auditory-SWIPE′ and pitch strength-based sample categories, this algorithm is called “aRFF-AP”.
In both manual and semi-automated RFF estimation methods, the most tedious step of the RFF computational process is identifying the boundary between voiced and unvoiced speech. As RFF depends on the termination and initiation of voicing within a VCV production, these points in time must be identified from the acoustic signal prior to collecting vocal cycles for RFF estimation. Manual RFF estimation relies on trial-and-error techniques of trained technicians to locate this boundary (requiring 20–40 min of analysis time per RFF estimate; [11]), whereas the semi-automated RFF algorithms (aRFF, aRFF-AP) take advantage of a faster, more objective approach. Specifically, three acoustic features (normalized peak-to-peak amplitude, number of zero crossings, and waveform shape similarity) are examined in time to identify where a state transition in feature values occurs to locate voiced/unvoiced boundary. The aRFF and aRFF-AP algorithms assume that each acoustic feature will exhibit a substantial change in feature values over time and that this change will occur at the boundary between voiced and unvoiced segments.

1.2. Voiced/Unvoiced Boundary Detection

The methodology used to identify the voiced/unvoiced boundary in semi-automated RFF estimation requires further inquiry. First, it is unclear as to whether the three features used in aRFF and aRFF-AP algorithms are the best choice of acoustic features to mark the initiation and termination of vibration since voiced/unvoiced boundary detection accuracy has not been formally assessed amongst the three features or compared to that of other acoustic features (e.g., cepstral peak prominence). Second, there is uncertainty in how the boundary identified using these acoustic features corresponds to the physiological initiation or termination of vocal fold vibration. This is because both manual and semi-automated RFF methods rely only on the acoustic signal, which only provides indirect information about the vibration of the vocal folds and may be masked by supraglottic resonances, coarticulation (e.g., due to concurrent aspiration and frication), and radiation [27]. Thus—in addition to a lack of fo stationarity during vocal fold offset and onset transitions—signal masking adds to the complexity of identifying the initiation or termination of vocal fold vibration. The uncertainties in acoustic boundary cycle identification warrant further investigation to (i) inform the implementation of acoustic features used in the semi-automated RFF algorithm and (ii) validate manual RFF estimation as a gold-standard that accurately represents changes in instantaneous fo during voicing offsets and onsets.
High-speed videoendoscopy (HSV) may be a useful technique to examine the relationship between the acoustic signal and vocal fold vibration. By sampling at frame rates much greater than typical modal (i.e., the vocal register most typically used during conversational speech) fo values, HSV can capture cycle-to-cycle changes in vocal fold vibratory behavior during voicing offsets and onsets [28,29,30]. Indeed, prior work has employed HSV to investigate voicing offsets and onsets relative to the acoustic signal: Patel et al. [31] acquired simultaneous recordings via a microphone and rigid laryngoscope as vocally healthy speakers repeated /hi hi hi/ at their typical pitch and loudness. The results of this work indicated a tight coupling between the acoustic signal and the physiological vibrations of the vocal folds; however, this relationship may not be generalizable to the acoustic outputs typically examined with RFF. Transitioning between a vowel and the voiceless glottal fricative, /h/, may require different mechanisms than when transitioning between a vowel and a voiceless obstruent produced via oral constrictions (e.g., /f/, /s/, /∫/, /p/, /t/, /k/). For instance, Löfqvist et al. [32] observed that glottal vibrations continued uninterruptedly through the /h/ during the production of /aha/ sequences by some speakers; these vibrations were not present for voiceless consonant productions of /asa/ or /apa/. Such differences could ultimately affect the relationship between oscillatory events obtained from the laryngoscopic images and from the acoustic signal. Additionally, the participants in Patel et al. [31] were limited to adults with typical voices, whereas the target population for employing RFF in clinical voice assessments includes speakers with voice disorders characterized by excessive laryngeal muscle tension. As such, additional investigations are needed to examine voicing offsets and onsets in the context of speakers with and without voice disorders.

1.3. Current Investigation

To carry out the present investigation, speakers with typical voices and speakers with voices characterized by excessive laryngeal muscle tension were enrolled across a wide age range to investigate the relationship between acoustic features and vocal fold vibratory characteristics during intervocalic voicing offset and onsets. Acoustic features were identified that corresponded with the physiological initiation and/or termination of vocal fold vibration. The aRFF-AP algorithm was then further refined by modifying algorithmic parameters corresponding to the HSV-tuned acoustic feature set (“aRFF-APH”). Voiced/unvoiced boundary detection accuracy was computed for each of the three RFF methods (manual estimation, aRFF-AP, aRFF-APH) relative to the actual vocal fold vibratory features identified via HSV. It was hypothesized that incorporating features related to the onset and offset of vocal fold vibration would improve the accuracy of acoustic voiced/unvoiced boundary detection (aRFF-APH) over methods that did not leverage these tuned features (manual, aRFF-AP).

2. Materials and Methods

2.1. Participants

Sixty-nine individuals with typical voices (33 cisgender females, 36 cisgender males) aged 18–91 years (M = 43.2 years, SD = 23.1 years) were enrolled in this study. All provided informed, written consent in compliance with the Boston University Institutional Review Board. All were fluent in English and had no history of speech, language, hearing, neurological, or voice problems. A certified, voice-specializing speech-language pathologist screened all participants with typical voices for healthy vocal function via auditory-perceptual assessment and flexible nasendoscopic laryngeal imaging.
Fifty-three individuals with voice disorders characterized by excessive laryngeal tension (28 cisgender females, 1 transgender female, 23 cisgender males, 1 transgender male; M = 49.5 years, SD = 18.4 years, range = 19–75 years) were enrolled in this study. All provided informed, written consent in compliance with the Boston University Institutional Review Board. All were fluent in English and reported no history of hearing problems. Participants within this group were either diagnosed with idiopathic Parkinson’s disease (PD) by a neurologist or were diagnosed with a hyperfunctional voice disorder (HVD; e.g., muscle tension dysphonia) by a board-certified laryngologist. All individuals with PD were recorded while on their typical carbidopa/levodopa medication schedule. Individuals who used deep brain stimulation devices (N = 5) were requested to turn their device off for the duration of the data collection. Of the 53 participants with voice disorders, 25 (6 cisgender females, 1 transgender female, 18 cisgender males) were diagnosed with PD. The average time since diagnosis was 7 years (SD = 5.8 years, range = 0–24 years), and the average severity of motor complications as assessed via the Movement Disorder Society-sponsored revision of the Unified Parkinson’s Disease Rating Scale (Part III) were moderate (M = 48.8, SD = 20.5, range = 13–91). The remaining 28 participants (22 cisgender females, 5 cisgender males, 1 transgender male) were diagnosed with HVDs, including muscle tension dysphonia (20/28), vocal fold nodules (4/28), vocal fold polyp (2/28), vocal fold scarring (1/28), and hyperdermal lesion with secondary supraglottic compression (1/28).
A speech-language pathologist specializing in voice disorders assessed the overall severity of dysphonia (OS; 0–100) of each participant using the Consensus Auditory-Perceptual Evaluation of Voice (CAPE-V). The average OS for participants with typical voices was 8.3 (SD = 6.7, range = 0.6–34.2), and that of participants with either an HVD or PD was 15.6 (SD = 12.4, range = 0.9–51.3). The speech-language pathologist rerated 15% of participants in a separate sitting to ensure adequate intrarater reliability. Pearson’s product-moment correlation coefficient was calculated on the ratings using the statistical package R (Version 3.2.4), yielding an intrarater reliability of r = 0.96. The overall demographic information for participants with typical voices (split into young adults <40 years of age and older adults ≥40 years of age), participants with HVDs, and participants with PD are included in Table 1.

2.2. Procedure

The current study comprised three main components: participant training, experimental setup, and data collection. In the training segment, each participant was instructed to produce the speech tokens that would be simultaneously captured via microphone and flexible nasendoscope during data collection. Following the training segment, participants were instrumented with recording equipment. Data collection then commenced, during which participants were cued to produce speech tokens during a nasendoscopic examination that totaled approximately 5–10 min. The overall experimental time (including consent, training, setup, and recording) required approximately 1–2 h.

2.2.1. Participant Training

Participants were trained to produce eight iterations of the VCV utterance, /ifi/. This token was selected since the phoneme /i/ provides an open pharynx to better view the vocal folds under endoscopy [19], whereas the phoneme /f/ has been shown to minimize within-speaker variations in RFF [33]. Each participant was instructed to produce four /ifi/ utterances, take a breath, and then produce the remaining four /ifi/ utterances.
Participants were then trained to produce the eight /ifi/ utterances at different vocal rates and levels of vocal effort. These modifications were chosen to alter the stiffness of the laryngeal musculature [34] to, in turn, produce voice with varying degrees of laryngeal muscle tension. These utterances were collected in an effort to expand the dataset used to investigate the relationship between acoustic features and vocal fold vibratory characteristics during intervocalic voicing transitions across the spectrum of laryngeal muscle tension. Using methodology employed by McKenna et al. [19], a metronome was used to train three vocal speeds: slow rate (50 beats per minute), regular rate (65 beats per minute), and fast rate (80 beats per minute). Similarly, participants were cued using methodology described by McKenna et al. [19] to produce voice with varying levels of vocal effort (mild effort, moderate effort, maximum effort) while maintaining comfortable speaking rate and volume. While instructing participants to “increase your effort during your speech as if you are trying to push your air out,” mild effort was cued as “mildly more effort than your regular speaking voice,” moderate effort as “more effort than mild,” and maximum effort as “as much effort as you can while still having a voice.”

2.2.2. Experimental Setup

After the training segment, participants were seated in a sound-attenuated booth and instrumented with a directional headset microphone (Shure SM35 XLR) placed 45° from the midline and 7 cm from the lips. Microphone signals were pre-amplified (Xenyx Behringer 802 Preamplifier) and digitized at 30 kHz (National Instruments 6312 USB). A flexible routine endoscope (Pentax, Model FNL-10RP3, 3.5-mm) was then passed transnasally through the inferior nasal turbinate, superior to the soft palate, and into the hypopharynx for laryngeal visualization. In cases in which participant nasal anatomy or reported discomfort interfered with image acquisition using the routine endoscope, a flexible slim endoscope (Pentax, Model FNL-7RP3, 2.4-mm) was used. A numbing agent was not administered so as to not affect laryngeal function [35], but a nasal decongestant was offered prior to insertion to minimize participant discomfort as the endoscope was passed through the nasal cavity. To record images of the larynx, the endoscope was attached to a camera (FASTCAM Mini AX100; Model 540K-C-16GB; 256 × 256 pixels) with a 40-mm optical lens adapter. A steady xenon light was used for imaging (300 W KayPENTAX Model 7162B).

2.2.3. Experimental Recording

During the endoscopy procedure, participants were instructed to produce the eight ifi/ repetitions for each condition, which were cued in the following order: slow rate, regular rate, fast rate, mild effort, moderate effort, and maximum effort. Participants completed a minimum of two recordings per condition, and recordings were repeated when the experimenter determined that the vocal folds were not adequately captured (e.g., obstruction by the epiglottis). Video images were acquired at a frame rate of 1 kHz using Photron Fastcam Viewer software (v.3.6.6) to track the fundamental frequency of vibration of the vocal folds, which is estimated to be 85–255 Hz during modal phonation in adults [36]. Recording was triggered by the camera software and a custom MATLAB (version 9.3; The MathWorks, Natick, MA, USA) script that automatically time-aligned the video images with the microphone signal. Due to the recording limitations of the high-speed imaging system, the synchronized microphone and HSV recordings were restricted in duration to 7.940 s when the 3.5-mm endoscope was used and 8.734 s when the 2.4-mm endoscope was used.

2.3. Data Analysis

2.3.1. High-Speed Video Processing

Technician Training

A semi-automated algorithm was used to identify the physiological termination and initiation of vocal fold vibration from each /ifi/ production. To carry out this processing, a series of technicians used the algorithm to compute the glottic angle waveform, from which vocal fold abductory and adductory patterns were isolated. The training and experimental data processing schemes used to extract vocal fold vibratory features are described in detail below.
Prior to processing experimental data, nine technicians underwent a training scheme described by McKenna et al. [37]. In brief, technicians were first trained to measure glottic angles (extending from the anterior commissure along the medial vocal fold edge to the vocal process) from images obtained during a flexible nasendoscopic procedure using a halogen light source and acquired at a conventional framerate of 30 frames per second. Technicians were required to meet two-way mixed-effects intraclass correlation coefficients (ICC) for consistency of agreement ≥0.80 when compared to glottic angle markings made previously by a gold-standard technician [38]. The average reliability for the nine technicians was ICC(3,1) = 0.89 (SD = 0.01, range = 0.88–0.91).
The nine technicians then completed training to use a semi-automated glottic angle tracking algorithm, as described in detail in Diaz-Cadiz et al. [38]. Using this algorithm, the technicians were trained to use time-aligned microphone signal and video frames captured during an /ifi/ utterance to semi-automatically estimate the glottic angle over time. Within the glottic angle tracking training, technicians were required to meet agreement standards of ICC(3,1) ≥ 0.80 compared to a gold-standard technician, described in Diaz-Cadiz et al. [38]. The resulting average reliability of the nine technicians was ICC(3,1) = 0.85 (SD = 0.04, range = 0.80–0.91).

Experimental Data Processing

To process experimental data, technicians first determined whether each /ifi/ production was analyzable based on manual inspection of the laryngoscopic recordings. An /ifi/ production was rejected from further analysis if the glottis was obstructed (e.g., by the epiglottis), if video quality was too poor to resolve the glottis, or if an /ifi/ production at the end of the recording was incompletely captured due to the pre-defined recording length. Of the potential 9172 /ifi/ productions recorded, 12.8% were considered unusable (1173 of 9172), leaving 7999 for further processing.
Technicians then used the semi-automated angle algorithm to calculate the glottic angle waveform for the usable /ifi/ productions (N = 7999). Within this analysis, each of the nine technicians was assigned to analyze a subset of the 122 speakers, wherein the assigned technician processed all /ifi/ productions of each speaker within the subset. Assigned technicians were blinded to the diagnosis of the speakers in their analysis set. For each speaker, the assigned technician determined whether the /ifi/ production was usable and, if so, obtained a quantitative estimate of the glottic angle for the production. During this process, all /ifi/ productions assigned to a technician were visually inspected to ensure that the anterior one-third of the vocal folds (anterior commissure) was visible for the semi-automated algorithm to sufficiently track the vocal folds over time. Manual intervention was implemented if algorithmic estimates of the glottic angle waveform was deemed inappropriate by the technician; if errors persisted following manual intervention, the technicians were instructed to mark the instance as unusable. The technicians accepted the fully automated results in 75.0% of cases (6000 of 7999), whereas the technicians accepted the automated results only after performing manual glottic angle intervention in 21.5% of cases (1721 of 7999). The remaining 3.5% of cases were discarded due to producing inappropriate glottic angle estimates even after manual-assisted angle estimation (278 of 7999). This analysis resulted in 7721 usable /ifi/ productions for further processing. This initial data processing was then rechecked by a second technician.
A series of kinematic time points were then extracted from each usable /ifi/ production to mark the physiological termination or initiation of vocal fold vibration. Technicians were presented with a MATLAB GUI showing time-aligned high-speed video frames, the microphone signal, the previously extracted glottic angle waveform, and a high-pass filtered version of the quick vibratory profile (QVP; see Figure 2). The QVP was included here as an alternative to the glottic angle waveform due to its sensitivity to HSV imagery and superior ability to track the vibrating glottis during the transition between voiced and unvoiced segments [29]. The QVP was calculated by (i) centering the HSV frame over the glottis using the semi-automated glottic angle extraction algorithm from Diaz-Cadiz et al. [38], (ii) calculating vertical and horizontal profiles of the HSV frames using the methodology from Ikuma et al. [29], and (iii) high-pass filtering the resulting QVP using a 7th order Butterworth filter to attenuate low frequency energy below a cut-off frequency of 50 Hz.
With the MATLAB GUI, a total of three technicians used the time-aligned microphone signal, glottic angle waveform, and QVP to identify the time of voicing offset (toff) and the time of voicing onset (ton). For each participant, a single technician was assigned to identify toff and ton for all utterances. In this analysis, toff was described as the termination of the last vibratory cycle before the voiceless consonant, whereas ton was characterized as the initiation of the first vibratory cycle after the voiceless consonant. In the event that the vocal folds exhibited an abrupt closure at the start of voicing onset (i.e., prior to vocal fold vibration), ton was extracted as the time point immediately before the point of abrupt vocal fold closure. Technicians were instructed to use the glottic angle waveform and QVP to identify these two time points, then corroborate the selected indices via manual visualization of the raw HSV images. This process was carried out to minimize errors that may occur if the glottic angle waveform failed to capture small glottal gaps during vibratory cycle phases or if the QVP was confounded by lighting artifacts (e.g., intensity saturation due to the epiglottis coming into view). The microphone signal was included within the GUI to orient technicians in the event that the glottic angle waveform and QVP both failed to properly track the vibrations of the vocal folds; in such cases, the technicians were instructed to indicate that the production needed to be rejected or reprocessed.
The technicians each reanalyzed 10% of participants in a separate sitting to ensure adequate intrarater reliability. The three technicians also analyzed the HSV images of the same participant to assess interrater reliability. Intrarater reliability was assessed via two-way mixed-effects ICCs for absolute agreement, whereas interrater reliability was computed using two-way mixed-effects ICCs for consistency of agreement (single measures). Intrarater reliability ranged from 0.86 to 0.99, with an overall mean reliability of 0.96 (SD = 0.05). Average interrater reliability was ICC(3,1) = 0.91 (95% CI = 0.86–0.96) for toff and ICC(3,1) = 0.97 (95% CI = 0.96–0.99) for ton.

2.3.2. Manual RFF Estimation

Five technicians were trained to manually estimate RFF using methodology described in Vojtech and Heller Murray [39]. The dataset used to train individuals in manual RFF estimation was a separate dataset from that described here and may be downloaded from https://sites.bu.edu/stepplab/research/rff/ accessed on 21 April 2021. Technicians were required to meet an interrater reliability criterion ≥0.93, as described in Vojtech et al. [24]. Table 2 shows the number of participants that each of the five technicians rated throughout the course of data collection. Two trained technicians carried out manual RFF estimation on each participant (7721 total /ifi/ productions). Mean RFF values were computed across two technicians to use as the gold standard for RFF estimates.
Intrarater reliability was assessed via Pearson’s correlation coefficients within each technician when instructed to reanalyze 20% of participants in a separate sitting, whereas interrater reliability was computed via two-way mixed-effects ICCs for consistency of agreement. The average intrarater reliability was calculated as r = 0.90 (SD = 0.05, range = 0.84–0.97), and the average interrater reliability was computed as ICC(3,1) = 0.93 (SD = 0.04, range = 0.87–0.98). Rater reliability was also examined by assessing the difference between selected boundary cycles (i.e., voicing offset cycle 10, voicing onset cycle 1) of original and reanalyzed samples. The mean intrarater error was 0.64 vocal cycles (SD = 0.44 cycles, range = 0–5 cycles), and the mean interrater error was 0.71 vocal cycles (SD = 0.41 cycles, range = 0–6 cycles).

2.3.3. Semi-Automated RFF Estimation

Semi-automated RFF estimation was performed on all 7721 /ifi/ productions using the MATLAB-based aRFF-AP algorithm, which is described in detail in Vojtech et al. [24]. The aRFF-AP algorithm estimates RFF using a 9-step process that includes: (1) identifying the voiceless consonant and vowels in each production via high-to-low energy ratios of the acoustic signal, (2) manually confirming and/or modifying the locations of the voiceless consonant and vowels in the acoustic signal, (3) estimating the average fo and pitch strength of the vowels via the Auditory-SWIPE′ algorithm [25], (4) categorizing the voice signal based on average pitch strength, (5) identifying peaks and troughs of potential vocal cycles pertaining to the vowel, (6) estimating a series of acoustic features during the transition into or out of the voiceless consonant, (7) locating the boundary between each vowel and the voiceless consonant by applying category-based thresholds to the acoustic feature vectors, (8) rejecting instances that do not meet specified criteria (e.g., less than 10 onset or offset cycles, glottalization, misarticulation, voicing during the voiceless consonant), and (9) calculating RFF according to Equation (1).
The relationship between acoustic and physiologic voicing transitions was assessed by examining acoustic features relative to the termination (toff) or initiation (ton) of voicing. This step is distinct from the development of the aRFF-AP algorithm, as Vojtech et al. [24] examined acoustic features relative to the intervocalic voicing transitions indicated by manual RFF estimation. To perform this analysis, a literature review was conducted to select a set of acoustic features that showed promise in distinguishing voiced and unvoiced segments, as is the goal of the acoustic features in the semi-automated RFF algorithm (i.e., step 7 of the aRFF-AP algorithm). The acoustic features that best corresponded with the termination or initiation of voicing were then implemented in the aRFF-AP algorithm.

Acoustic Feature Selection

In the aRFF-AP algorithm, acoustic feature trends are examined to identify a state transition in feature values that mark the boundary cycle, or the vocal cycle that distinguishes the vowel from the voiceless consonant. The boundary cycle is offset cycle 10 for voicing offset and onset cycle 1 for voicing onset (see Figure 1). The aRFF-AP algorithm uses three acoustic features to characterize the transition between voiced and unvoiced segments: normalized peak-to-peak amplitude, number of zero crossings, and waveform shape similarity.
In addition to the three features included within the aRFF-AP algorithm, a set of 15 new acoustic features were examined with respect to classifying voiced and unvoiced speech segments: (1) autocorrelation, (2) mean cepstral peak prominence, (3) average pitch strength, (4) average voice fo, (5) cross-correlation, (6) low-to-high ratio of spectral energy, (7) median pitch strength, (8) median voice fo, (9) normalized cross-correlation, (10) short-time energy, (11) short-time log energy, (12) short-time magnitude, (13) signal-to-noise ratio, (14) standard deviation of cepstral peak prominence, and (15) standard deviation of voice fo. Of the 18 total features (3 features currently in the aRFF and aRFF-AP algorithms plus 15 new acoustic features), 13 features were calculated directly from the microphone signal. This included autocorrelation, mean and standard deviation of cepstral peak prominence, cross-correlation, low-to-high ratio of spectral energy, normalized cross-correlation, normalized peak-to-peak amplitude, number of zero crossings, short-time energy, short-time log energy, short-time magnitude, signal-to-noise ratio, and waveform shape similarity. The remaining five features were calculated using a processed version of the microphone signal. Specifically, the third step of the aRFF-AP algorithm leverages the Auditory-SWIPE′ algorithm to calculate the fo contour and pitch strength contour of each /ifi/ production. Three features were calculated from the fo contour (average, median, and standard deviation of voice fo), and two features were computed using the pitch strength contour (average and median pitch strength).
In addition to examining the 13 acoustic features extracted from the raw microphone signal, filtered versions of these features were also considered. The aRFF and aRFF-AP algorithms employ a version of the microphone signal when band-pass filtered ±3 ST around the average fo of the speaker to identify peaks and troughs in signal amplitude. The aRFF-AP algorithm also used this filtered version of the signal to compute normalized peak-to-peak amplitude (whereas the number of zero crossings and waveform shape similarity were calculated using the raw microphone signal). By including features computed from the filtered microphone signal, the result of this literature review resulted in a total of 31 acoustic features for subsequent analysis. Table 3 provides an overview of the acoustic features, including the signal used to calculate each and the proposed hypotheses in acoustic feature values when used for voiced/unvoiced detection.

Feature Set Reduction

The 31-feature set was first examined to remove features that did not sufficiently capture the transition between voiced and unvoiced segments. The sliding window process in step 6 of the aRFF-AP algorithm was simulated to estimate each feature over time, ranging from the midpoint of the voiceless consonant and into the vowel. Acoustic feature trends were then examined relative to HSV-derived voicing transitions as a function of the number of pitch periods (“pitch period” refers to the duration of one glottal cycle and was computed per /ifi/ production using the average fo determined using Auditory-SWIPE′) away from the “true” boundary cycle; specifically, the true boundary cycle was set to reference the time of voicing offset (toff) and the time of voicing onset (ton) to investigate the relationship between these acoustic features and the physiologically derived termination and initiation of vocal fold vibration, respectively. To comprehensively examine trends in feature values, the acoustic features were analyzed as a function of ±10 pitch periods from the true boundary cycle, resulting in 21 feature values (i.e., one feature value for each pitch period) for each of the 31 acoustic features per /ifi/. The feature values were then visually inspected to determine which acoustic features failed to exhibit a substantial change in feature magnitude (empirically chosen at >0.25 normalized feature units) and/or demonstrated a large standard deviation (empirically chosen at >2 standard deviations from the mean) in feature magnitude during the transition between the voiceless consonant and vowel; such features were removed from subsequent analysis.
The remaining acoustic features were then used as predictors in a stepwise binary logistic regression to determine the probability of feature values corresponding to a voiced (1) or unvoiced (0) segment. The 21 values per acoustic feature for each of the 7721 /ifi/ productions were continuous predictors. Feature values were assumed independent in the regression model to identify which features were significantly related to voicing status rather than to create a regression equation for predicting voicing status. Variable significance was set to p < 0.05. Highly correlated features (variable inflation factor >10) were removed from the model to reduce multicollinearity. Acoustic features that exhibited significant predictive effects and were sufficiently independent were retained for further algorithmic refinement.

Algorithmic Modifications

The acoustic features that exhibited significant predictive effects on voicing status were introduced into the aRFF-AP algorithm to produce a more physiologically relevant version of the RFF algorithms called “aRFF-APH” (aRFF-AP with HSV-derived acoustic features). The pitch strength rejection criterion of the aRFF-AP algorithm—which removes VCV productions with average pitch strength values below 0.05 from subsequent analysis due to little-to-no presence of a pitch sensation—was retained in the current study to streamline data processing. A sliding window based on the speaker’s estimated fo then navigated from the voiceless consonant and into the vowel of interest. Within each window of time, the selected acoustic features from the current study were calculated rather than those within the aRFF-AP algorithm (i.e., normalized peak-to-peak amplitude, number of zero crossings, waveform shape similarity). Rule-based signal processing techniques were then adapted from the aRFF [21,22] and aRFF-AP algorithms to identify the boundary cycle separating voiced and unvoiced segments. To locate this cycle, the algorithm identified a feature value that maximized the effect size between left and right components of each acoustic feature vector; the cycle index that corresponded to this identified feature value was selected as the boundary cycle candidate for that feature. From here, the median of these candidates was then calculated as the final boundary cycle.

2.3.4. Performance of Manual and Semi-Automated RFF Estimation Methods

To examine the impact of introducing physiologically relevant acoustic features into the semi-automated RFF algorithms, the ability of manual and algorithmic RFF estimation methods to locate the true boundary cycle (derived via HSV; referenced to toff for voicing offset and ton for voicing onset) was assessed. First, the 7721 /ifi/ productions from 122 participants were processed using the aRFF-AP and aRFF-APH algorithms as well as manual estimation techniques. The accuracy of the three RFF estimation methods was then quantified as the distance (in average pitch periods) between true and selected boundary cycles for each voicing offset and onset instance of each /ifi/ production. The distance between true and selected boundary cycles was compared across RFF estimation methods to determine which method best corresponded with vocal fold vibratory characteristics during intervocalic offsets and onsets.

2.4. Statistical Analysis

Chi-square tests were performed to determine whether there was a relationship between RFF estimation method (manual, aRFF-AP, aRFF-APH) and boundary cycle classification accuracy. Two chi-square tests were conducted: one for voicing offset and one for voicing onset. In each analysis, a correctly classified boundary cycle referred to an instance in which the distance between true and selected boundary cycles was zero (whereas a misclassified boundary cycle corresponded to some non-zero distance between true and selected boundary cycles). Significance was set a priori to p < 0.05. Cramer’s V was used to assess effect sizes of significant associations. Resulting effect sizes were interpreted using criteria from Cohen [49]. Post hoc chi-square tests of independence were then performed for pairwise comparisons of the three RFF estimation methods using a Bonferroni-adjusted p value of 0.017 (0.05/3 comparisons).

3. Results

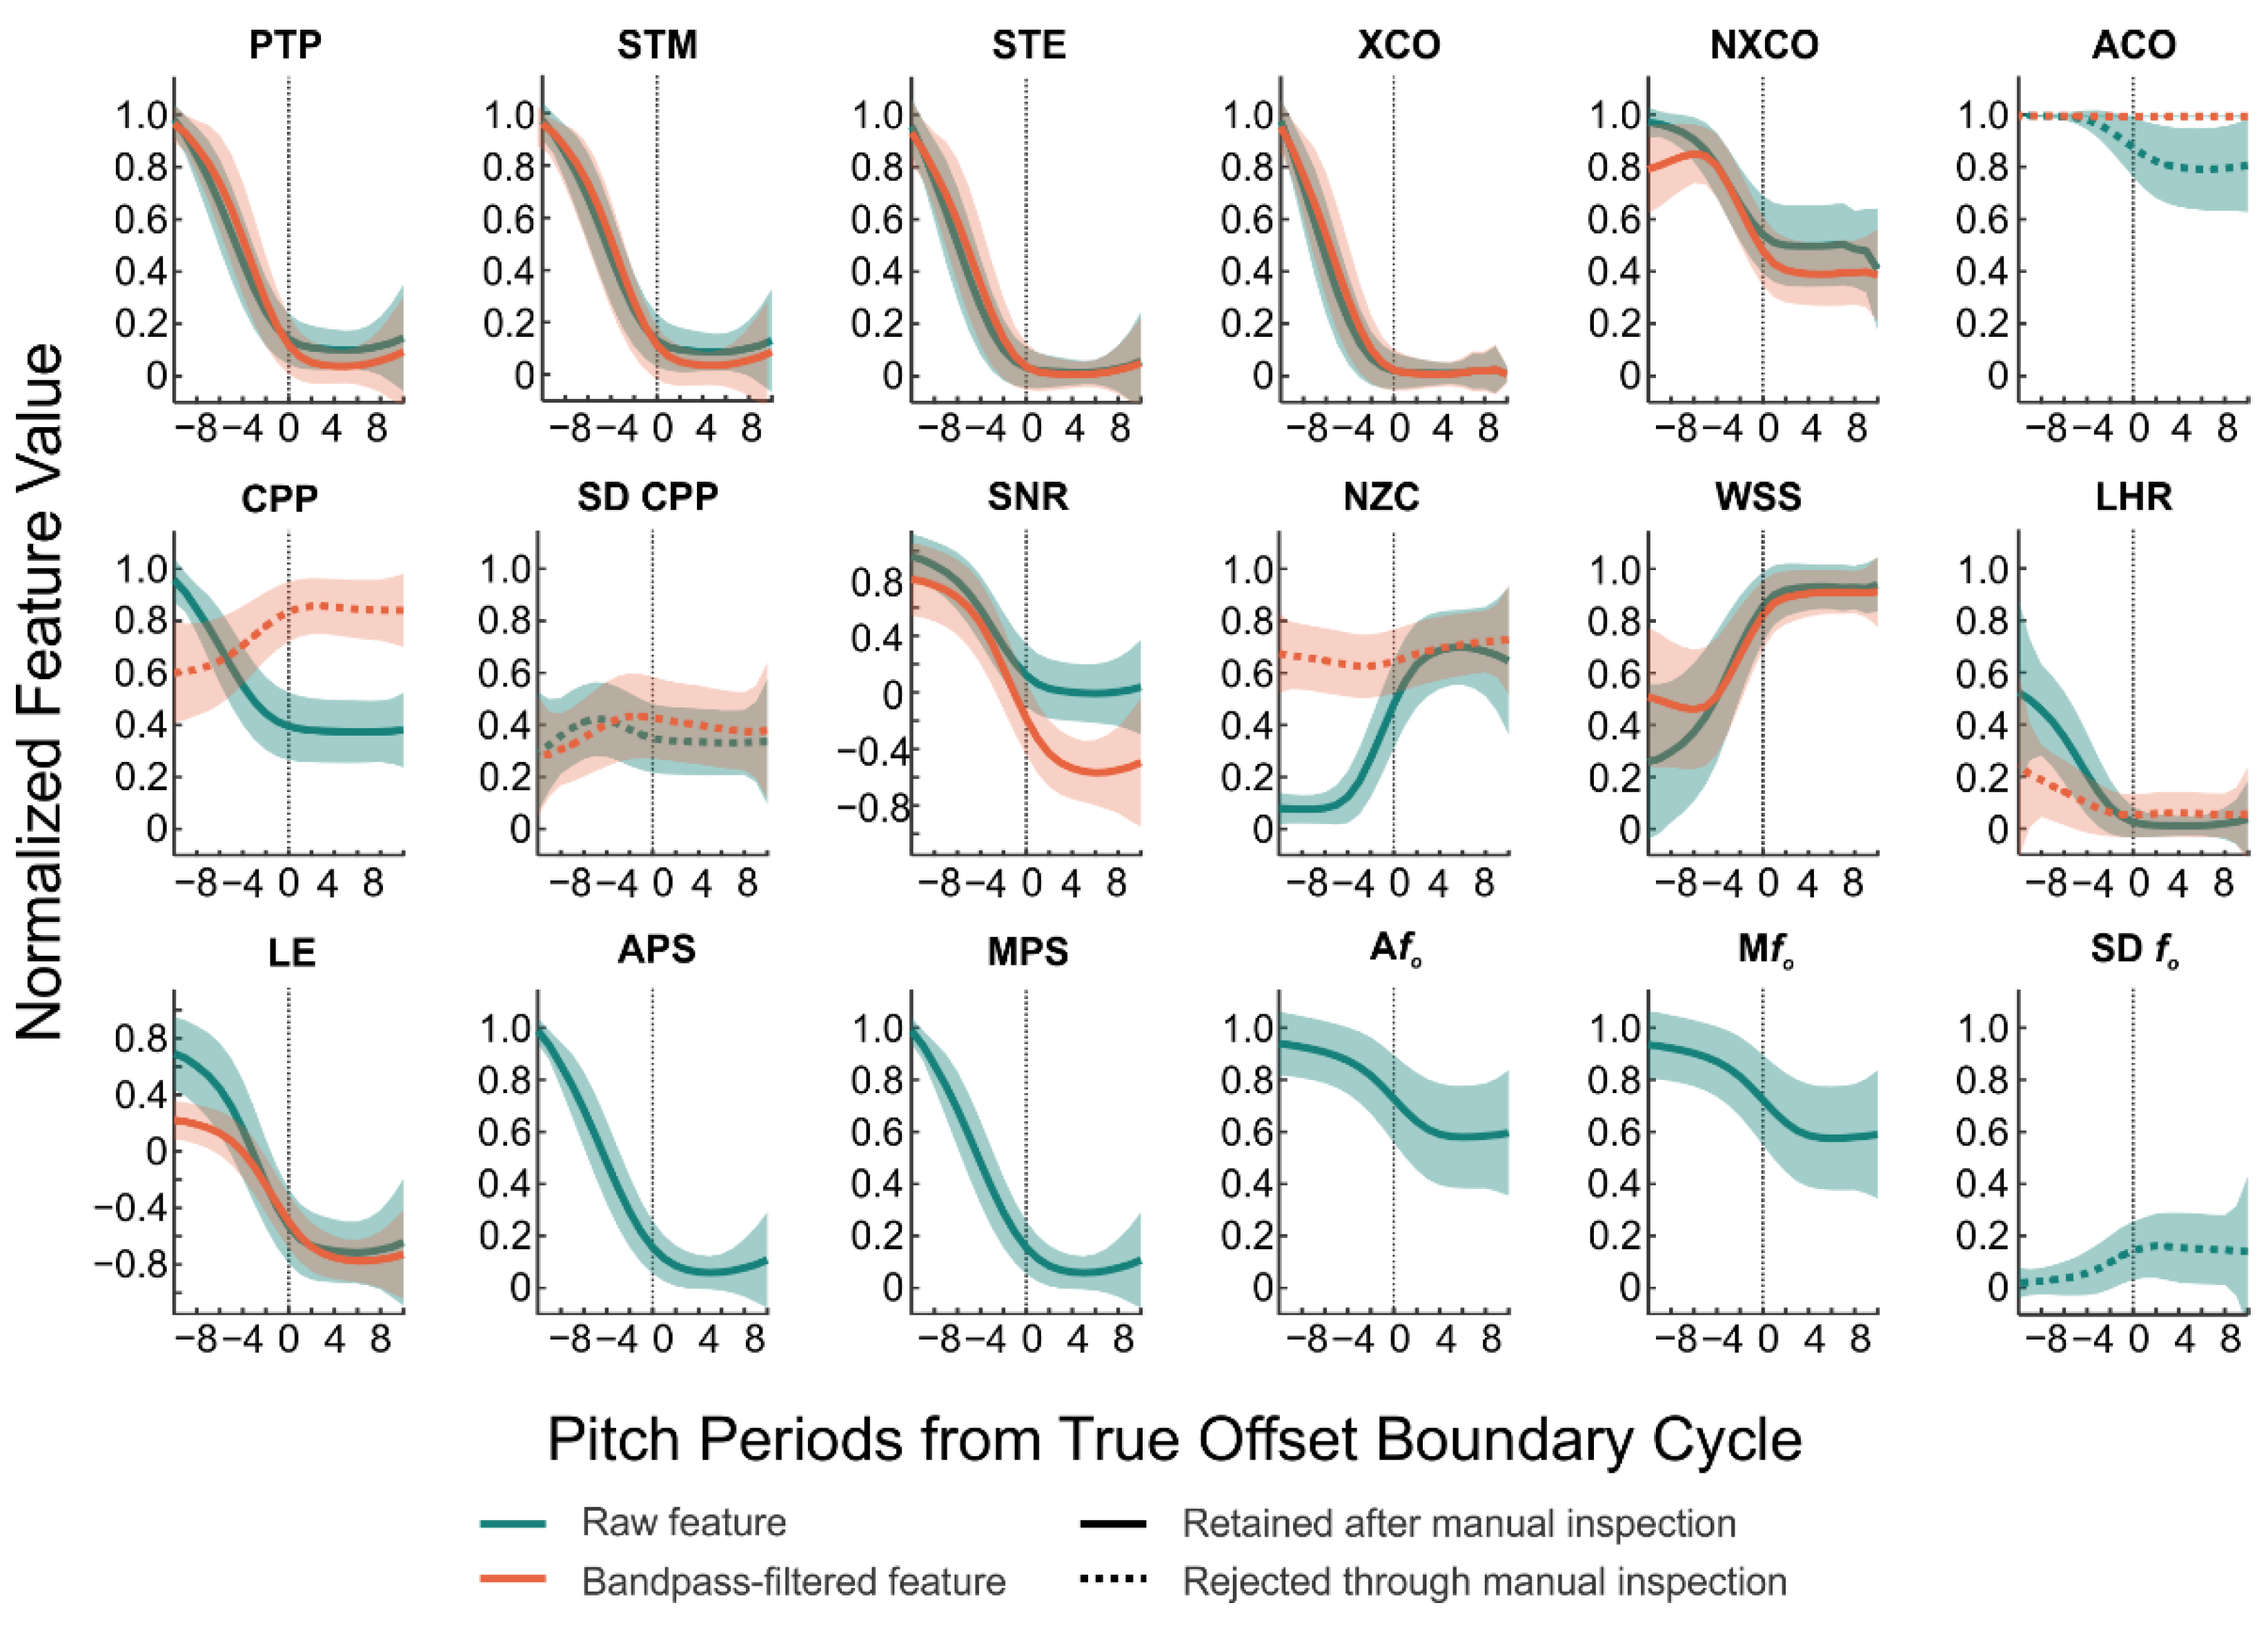
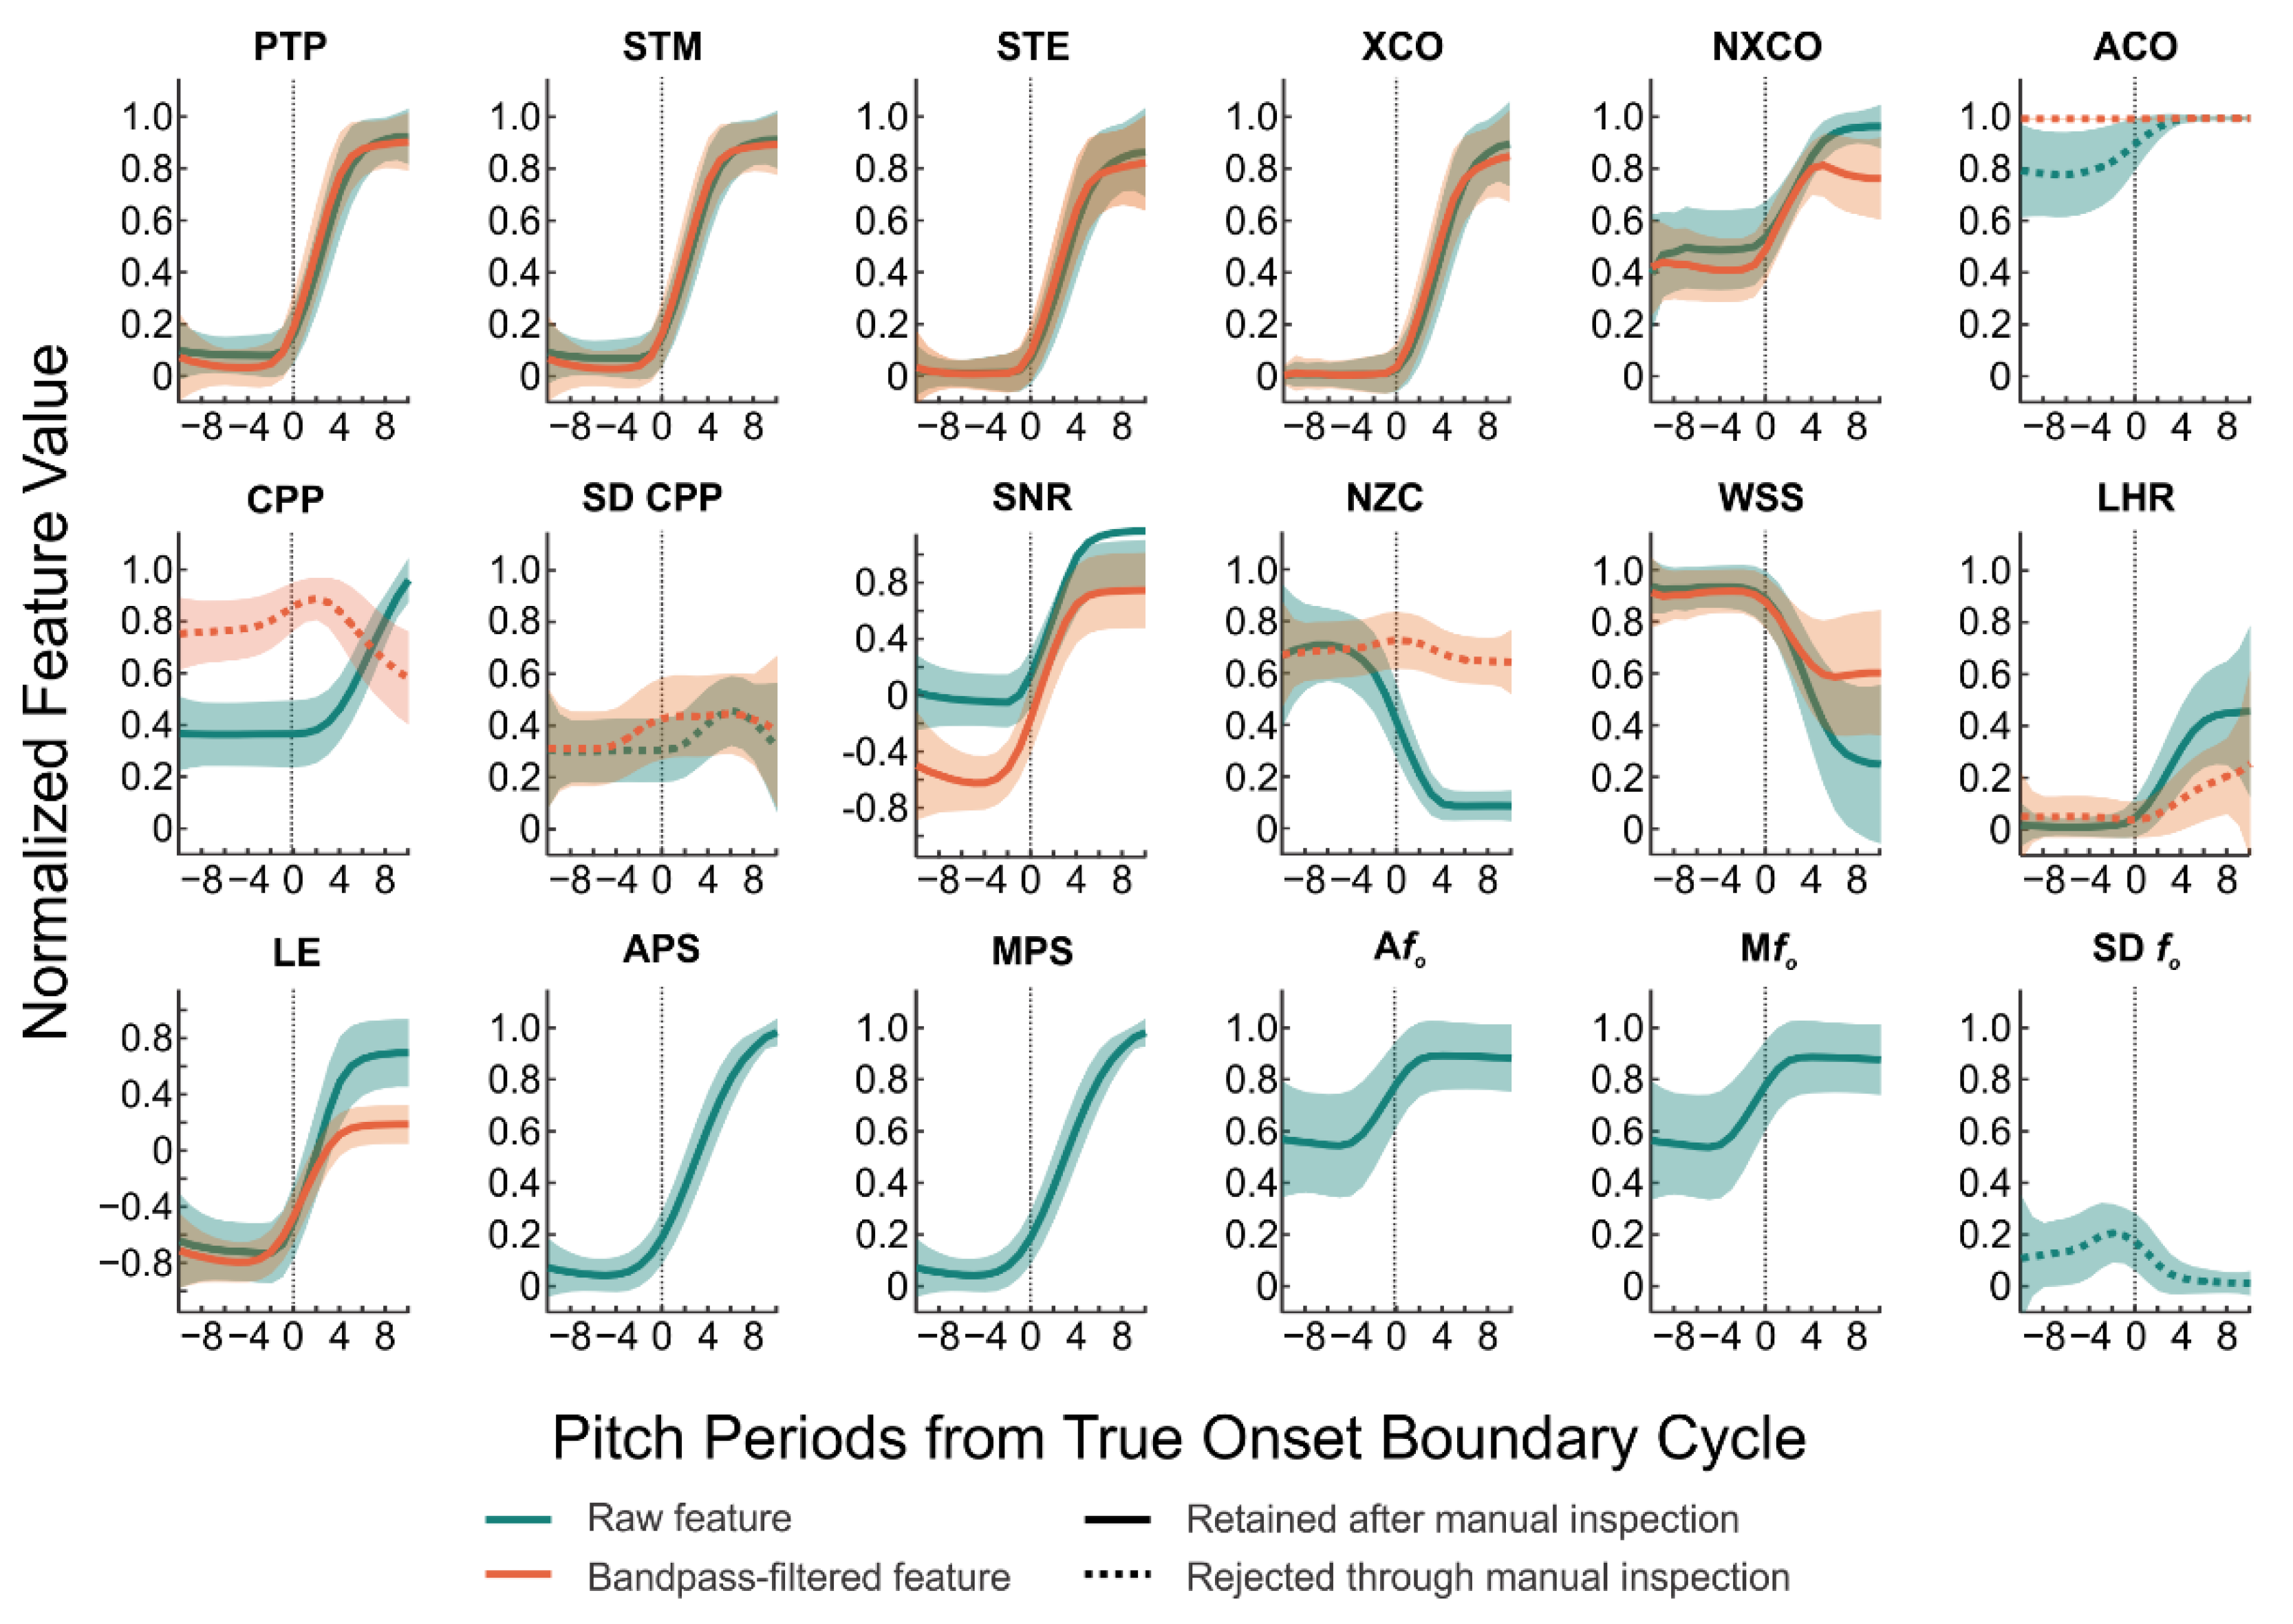
3.1. Acoustic Feature Trend Analysis

Figure 3 shows the relationship between acoustic features and the true boundary cycle (relative to toff) for 7721 voicing offset instances. Figure 4 shows this relationship (relative to ton) for 7721 voicing onset instances. Manual inspection of these 31 features resulted in the removal of the filtered number of zero crossings (NZC), raw and filtered autocorrelation (ACO), filtered cepstral peak prominence (CPP), filtered low-to-high ratio of spectral energy (LHR), raw and filtered standard deviation of cepstral peak prominence (SD CPP), and standard deviation of voice fo (SD fo) due to a lack of discrimination between voiced and unvoiced segments (indicated by the dashed lines in Figure 3 and Figure 4). All further analyses were completed using the remaining 23 features (indicated by the solid lines in Figure 3 and Figure 4).

3.2. Acoustic Feature Set Reduction

The results of the logistic regression (shown in Table 4) indicated that filtered waveform shape similarity, median of voice fo, cepstral peak prominence, number of zero crossings, short-time energy, average pitch strength, normalized cross-correlation, and cross-correlation were all significant predictors of voicing status for voicing offset (p < 0.05). When using these eight features, the model for voicing offset accounted for 61.7% of the variance in voicing status (adjusted R2 = 61.7%), with an area under the receiver operating characteristic (ROC) curve of 0.96. Inspection of the coefficients indicated that the log odds of voicing decreased per one-unit increase in short-time energy, normalized cross-correlation, number of zero crossings, or filtered waveform shape similarity (i.e., negative coefficient). On the other hand, the log odds of voicing increased per one-unit increase in median of voice fo, cepstral peak prominence, average pitch strength, or cross-correlation (i.e., positive coefficient).
For voicing onset, the stepwise binary logistic regression revealed that filtered waveform shape similarity, median of voice fo, cepstral peak prominence, number of zero crossings, average pitch strength, signal-to-noise ratio, filtered short-time energy, and filtered short-time log energy were all significant predictors of voicing status (p < 0.05; see Table 4). The model for voicing onset accounted for 75.8% of the variance in voicing status (adjusted R2 = 75.8%), with an area under the ROC curve of 0.98. The model for voicing onset indicated that the log odds of voicing decreased per one-unit increase in number of zero crossings or filtered short-time energy. The log odds of voicing increased per-unit increase in filtered waveform shape similarity, median of voice fo, cepstral peak prominence, average pitch strength, signal-to-noise ratio, or filtered short-time log energy. The resulting acoustic features were then incorporated into the aRFF-APH algorithms to identify the boundary cycle of voicing.

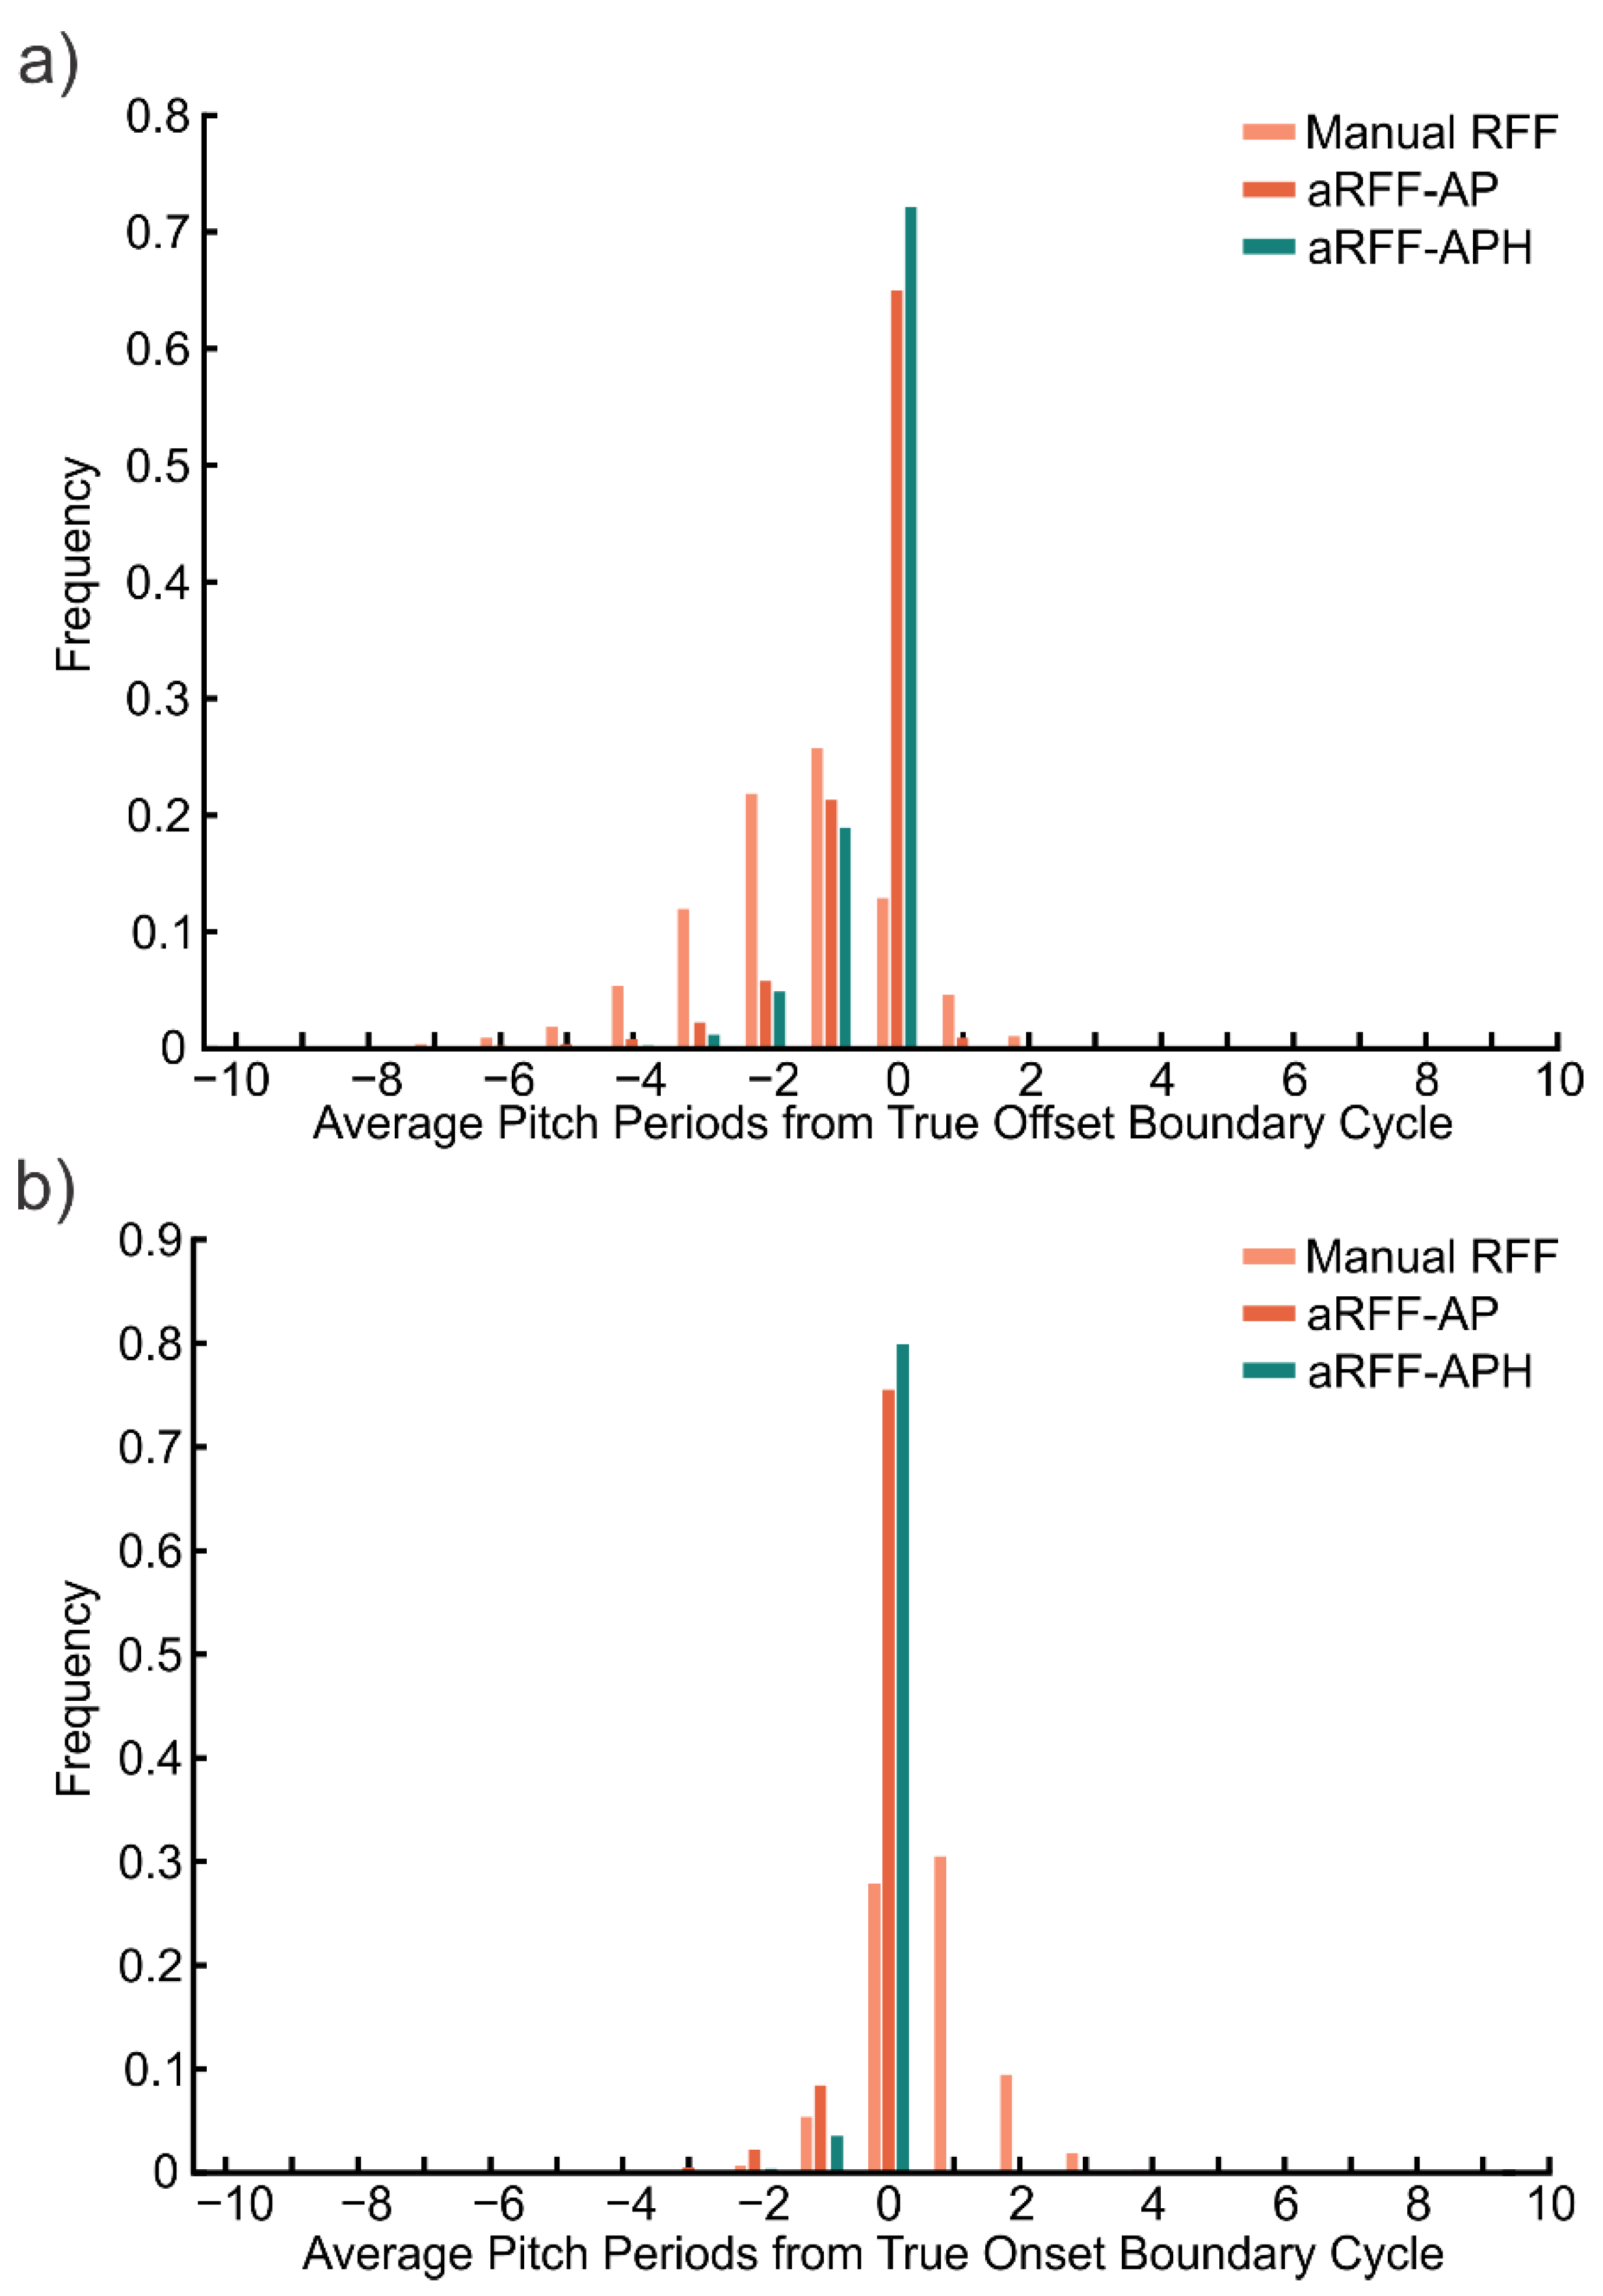
3.3. Performance of Manual and Semi-Automated RFF Estimation Methods

The comparison of aRFF-APH, aRFF-AP, and manual RFF estimation techniques in identifying the true boundary cycle is shown in Figure 5. Out of 7721 offset instances (see Figure 5a), the aRFF-APH algorithms correctly identified the boundary cycle in 72.1% of instances (N = 5565). The aRFF-AP algorithm correctly identified the boundary cycle in 65.0% of offset instances (N = 5021), followed by manual RFF estimation in which only 12.9% of offset boundary cycles (N = 994) were correctly identified. The proportion of correct boundary cycle identifications by cohort is shown in Table 5. When using manual RFF estimation, boundary cycles were correctly classified for participants with typical voices less than a third of the time (14.7% for voicing offset, 30.4% for voicing onset). The proportion of correctly identified boundary cycles decreased for the majority of individuals with HVDs, including those with Parkinson’s disease (10.9% for voicing offset, 27.2% for voicing onset) and muscle tension dysphonia (8.3% for voicing offset, 20.0% for voicing onset). When using the aRFF-AP algorithm, offset boundary cycles were correctly classified for a larger percentage of typical voices (66.9%) than HVDs, including Parkinson’s disease (58.9%) and muscle tension dysphonia (66.1%). Using the aRFF-APH algorithm did not produce this trend, instead showing similar proportions between cohorts. Interestingly, the proportion of correctly identified onset boundary cycles for participants with typical voices relatively low for aRFF-AP (72.4%) and aRFF-APH algorithms (76.8%); this is in contrast to, for instance, individuals with Parkinson’s disease (78.1% for aRFF-AP, 81.9% for aRFF-APH) and muscle tension dysphonia (83.8% for aRFF-AP, 88.5% for aRFF-APH). All offset and onset proportions were, however, greater across all cohorts when using the aRFF-AP or aRFF-APH algorithms instead of manual estimation.
Misclassifications occurred at the rate of 25.6% for aRFF-APH (N = 1978), 32.2% for aRFF-AP (N = 2488), and 74.2% for manual RFF estimation (N = 5730). Nearly 13% of offset instances (N = 997) were rejected during manual estimation, whereas under 3% of offset instances were rejected by the aRFF-APH (N = 178) and aRFF-AP (N = 212) algorithms. For the algorithmic methods, three offset instances were automatically rejected due to pitch strength values < 0.05. The remainder of these rejections were due to errors in identifying voiced cycles (N = 151 for aRFF-AP, N = 150 for aRFF-APH), or post-processing of resulting RFF values (e.g., glottalization; N = 58 for aRFF-AP, N = 25 for aRFF-APH).
Out of 7721 onset instances (see Figure 5b), the aRFF-APH algorithm correctly identified the boundary cycle in 80.0% of instances (N = 6170). The aRFF-AP algorithm correctly identified the boundary cycle in 77.2% of onset instances (N = 5833), followed by manual estimation in which 28.0% of onset instances (N = 2158) resulted in correctly identified boundary cycles. Misclassifications occurred at the rate of 4.0% for aRFF-APH (N = 310), 11.5% for aRFF-AP (N = 888), and 48.6% for manual RFF estimation (N = 3752). Almost a quarter (N = 1811) of onset instances were rejected during manual analysis. The aRFF-AP algorithm led to the least number of rejected onset instances (N = 1000; 13.0%), followed by the aRFF-APH algorithm (N = 1241; 16.1%). A total of 216 onset instances were automatically rejected by the aRFF-AP and aRFF-APH algorithms due to a pitch strength < 0.05; the remainder of these rejections were due to errors in identifying voiced cycles (N = 567 for aRFF-AP, N = 891 for aRFF-APH), or post-processing of resulting RFF values (N = 217 for aRFF-AP, N = 134 for aRFF-APH).
The results of the chi-square tests are shown in Table 6. Boundary cycle classification accuracy was significantly different for RFF estimation method, producing large effect sizes for both voicing offset (p < 0.001, V = 0.52) and onset (p < 0.001, V = 0.58). Boundary cycle classification accuracy was significantly different between manual and aRFF-AP methods. Post hoc analyses revealed a large effect for voicing offset (p < 0.001, V = 0.53) and onset (p < 0.001, V = 0.52), wherein aRFF-AP was more likely to correctly identify the boundary cycle than manual estimation. Boundary cycle classification accuracy was also significantly different between manual and aRFF-APH methods. Post hoc analyses showed a large effect for both voicing offset (p < 0.001, V = 0.59) and onset (p < 0.001, V = 0.62), such that aRFF-AP was more likely to correctly identify the boundary cycle. Finally, the boundary cycle classification accuracy was significantly different between semi-automated RFF algorithms (aRFF-AP, aRFF-APH) for both voicing offset and onset (p < 0.001); yet, the size of this effect was negligible for offset (V = 0.08) and small for onset (V = 0.15).

4. Discussion

The aim of the current study was to investigate the relationship between acoustic features and vocal fold vibratory characteristics during intervocalic voicing offsets and onsets. A large set of speakers with typical voices and speakers with voices characterized by excessive laryngeal muscle tension were instructed to produce the VCV utterance, /ifi/, while altering vocal rate and vocal effort. Simultaneous recordings were acquired using a microphone and flexible nasendoscope. The initiation (voicing onset) and termination (voicing offset) of vocal fold vibration were identified via inspection of the laryngoscopic images. A set of acoustic features were examined in reference to these time points, and a stepwise binary logistic regression was performed to identify which features best coincided with voicing offset and onset. The features that exhibited significant predictive effects were then implemented into the semi-automated RFF algorithm (“aRFF-APH”). The accuracy of the aRFF-APH algorithm in locating the transition between voiced and unvoiced segments was then assessed against (1) the current version of the semi-automated RFF algorithm (“aRFF-AP”), and (2) manual RFF estimation, the current gold-standard technique for calculating RFF.

4.1. Performance of RFF Estimation Methods

The results of this investigation indicate that using the aRFF-APH algorithm led to the greatest percentage of correctly identified boundary cycles (76.0%), followed by the aRFF-AP algorithm (70.3%) then manual estimation (20.4%). This suggests that using physiologically tuned acoustic features to identify the transition between voiced and unvoiced segments—even in the absence of methods to account for differences in voice sample characteristics (i.e., as in the aRFF-AP algorithm)—improves the correspondence between algorithmic and physiologic boundary cycles. These findings are in support of our hypothesis that incorporating features related to the onset and offset of vocal fold vibration improves the accuracy of acoustic voiced/unvoiced boundary detection.
When examining the proportion of correctly identified boundary cycles across cohort, there were no obvious trends for either voicing offset or onset. Both aRFF-AP and aRFF-APH algorithms demonstrate relatively similar performance across voice disorder cohorts, with the exception of increased classification accuracy for individuals with nodules (N = 4) and polyp (N = 2). However, it is difficult to draw conclusions from these results due to the unbalanced nature of the dataset. For instance, the greatest proportion of correctly classified offset and onset boundary cycles via manual RFF estimation was for participants with scarring; however, there was only one participant with scarring included in the current dataset, totaling only 24 VCV instances. Future work therefore should aim to validate the aRFF algorithm (aRFF-AP, aRFF-APH) across a balanced set of HVD data.
Although the aRFF-APH algorithm demonstrated greater accuracy in detecting voiced/unvoiced boundaries, the aRFF-AP algorithm remains the gold-standard method for semi-automatically estimating RFF. This is because the aRFF-AP algorithm was developed and validated using independent training and test sets to improve the clinical applicability of RFF. The aRFF-APH algorithm, on the other hand, was developed with the goal of improving the acoustic voiced/unvoiced detection rather than clinical applicability and was specifically tuned to the limited database examined here. As part of this investigation, all speakers were recorded in a sound-attenuated booth in the presence of constant noise from the endoscopic light source. In addition to this single recording location, the voice sample characteristics that were captured in the speaker dataset were more limited that those used in the development of the aRFF-AP algorithm: Vojtech et al. [24] included over 20 different primary voice complaints with an overall severity of dysphonia ranging from 0 to 100, whereas the current study included a smaller range of diagnoses (57% typical, 16% MTD, 3% nodules, 2% polyp, 1% scarring, 1% lesion, 20% Parkinson’s disease) and resulting dysphonia severity (0–51.3). Because of the limited spectrum of vocal function captured here, pitch strength-tuned parameters and independent training/test sets were not implemented in the development of the aRFF-APH algorithm in the current study.

4.2. Manual RFF Estimation as a Gold Standard

Despite the aforementioned differences between the aRFF-AP and aRFF-APH algorithms, using either of these methods resulted in a greater boundary cycle identification accuracy than when using manual estimation. These findings are unexpected since manual estimation has long been considered the gold-standard RFF estimation method. Specifically, manual estimation has been long considered the benchmark for RFF since trained technicians may exercise trial and error to identify the boundary cycle in difficult scenarios (e.g., poor recording environment and/or equipment, severe dysphonia) when cycle masking is present. Prior published work has not compared microphone-derived estimates of RFF between manual and algorithmic estimation beyond that of Lien et al. [20] and Vojtech et al. [24], which tuned the semi-automated RFF algorithm to manual estimates. Moreover, prior work has not compared acoustically derived intervocalic voicing offsets of RFF stimuli to those identified via high-speed videoendoscopy. These findings call into question the utility of manual RFF estimation as a benchmark for accuracy comparisons.
It is possible that the characteristics of the speaker database confounded this outcome, as noise from the endoscopic light source may have masked the voice signals and/or speaker productions may have deviated from the norm due to the flexible nasendoscope. Even though manual estimation makes use of trial and error to subjectively locate the boundary cycle when masking is present, it is possible that manual estimation techniques were not sensitive enough to isolate the physiological boundary cycle in these conditions. On the other hand, the aRFF-AP algorithm was designed to account for such variations and the aRFF-APH algorithm was refined based on the physiologically determined vocal fold characteristics. Both algorithms also identify potential vocal cycles using a filtered version of the microphone signal that was designed to reduce the amplitude of vocal tract resonances, coarticulation due to concurrent frication and aspiration, and radiation of the lips. By only using the raw microphone signal to identify vocal cycles, the RFF values resulting from manual estimation may not reflect the true offset or onset of voicing as expected.
Although manual estimation resulted in the lowest boundary cycle identification accuracy, it is important to note that most misclassifications occurred within two pitch periods of the true boundary cycle for both voicing offset and onset (see Figure 5). These findings are similar to those of Lien et al. [50], in which manual RFF estimation was compared when performed on a microphone signal versus a neck-surface accelerometer signal. Since a neck-surface accelerometer is able to capture the vibrations of the glottal source in the absence of vocal cycle masking due to frication and aspiration (as may occur during the production of an intervocalic fricative; [27]), the accelerometer signal was considered to be a ground truth over the microphone signal. The authors observed that misclassifications occurred closer to the vowel for both voicing offset and onset when performing manual RFF estimation using a microphone signal rather than an accelerometer signal. Whereas offset RFF values were extracted approximately two cycles closer to the vowel when using a microphone signal, onset RFF values were computed less than one cycle away from the voiceless consonant when using a microphone signal. The results of the current study support these findings and, moreover, lend support to the supposition that the aRFF-AP and aRFF-APH algorithms benefit from using a band-pass filtered version of the microphone signal to identify potential vocal cycles.
As semi-automated RFF algorithm accuracy is typically quantified in reference to manual RFF estimation (e.g., see [22,24]), it is important to consider that manual estimation may not be a true gold-standard technique. Further investigation is necessary to examine the hypothesis that differences in boundary cycle identification may be attributed to the algorithms leveraging a band-pass filtered version of the microphone signal to reduce the impacts of vocal tract resonances, coarticulation due to concurrent frication and aspiration, and radiation of the lips. Such an investigation should include an analysis of both laryngeal imaging and acoustics to comprehensively assess the relevance and validity of manual estimation as the gold-standard technique for calculating RFF. Laryngeal imaging is a crucial component for this investigation, as this modality can provide physiological confirmation of vocal fold vibrations that are indirectly captured via RFF. In addition to comparing manual and semi-automated boundary cycle selections, this investigation should aim to compare the boundary cycles obtained via manual RFF estimation when using each version of the acoustic signal (i.e., microphone, accelerometer). In the event that manual estimation is no longer considered as gold-standard RFF method, efforts should be made to develop new metrics of algorithmic performance to replace those that are calculated in reference to RFF values obtained via manual estimation (e.g., root-mean-square error, mean bias error).
Even though manual RFF estimation demonstrated the lowest voiced/unvoiced boundary detection accuracy, it should also be noted that this method is currently the only means by which RFF can be calculated on running speech. Whereas manual RFF technicians are trained to process both isolated VCV productions and VCV productions extracted from running speech, the semi-automated RFF algorithm has been designed, trained, and tested on isolated VCV productions since its origination (see [22]). Thus, although aRFF-AP and aRFF-APH demonstrated greater accuracy in capturing the voicing transitions necessary to compute RFF, both versions of the algorithm can only be used in scenarios when the voice samples are compatible. It is therefore recommended that the aRFF-AP algorithm—which was validated across a broad spectrum of vocal function and recording locations [24]—be used in future investigations when compatible voice samples (i.e., isolated VCV productions) are available. In scenarios that require RFF to be computed from running speech, it is recommended that manual RFF estimation be used.

4.3. Limitations and Future Directions

A limitation of the current study is that the semi-automated glottic angle extraction algorithm used to identify glottic has only been used in previously published reports on healthy participants [38]. The algorithm estimates the glottic angle in a given video frame using the anterior one-third of the vocal folds (anterior commissure), which is largely outside of the vicinity of phonotraumatic lesions and the effects of bowing due to vocal fold atrophy. Regardless, visual inspection of each VCV production was carried out in this work to verify accurate angle extraction in cases with and without abnormal anatomical deviations (e.g., lesions, atrophy).
The results of the current study demonstrate the promise of using physiologically relevant acoustic features to locate the boundary cycle between voiced and unvoiced speech segments, specifically for estimates of RFF. However, additional steps must be undertaken to improve the clinical applicability of the aRFF-APH algorithm. This should include the use of independent training and test sets that span a broad range of vocal function. In doing so, the aRFF-APH algorithm could be modified to include pitch strength-tuned algorithm parameters to account for variations in voice sample characteristics. The aRFF-APH algorithms should also be expanded to neck-surface accelerometer signals, as there has been a growing interest in using the neck-surface vibrations generated during speech for ecological momentary assessment and ambulatory voice monitoring (e.g., [27,51,52,53,54,55,56,57,58,59,60]). By capturing daily vocal behavior through a neck-surface accelerometer, vocal behaviors associated with excessive or imbalanced laryngeal muscle forces could be identified and monitored via RFF. Although an accelerometer-based RFF algorithm has been developed [61] future work should aim to improve this algorithm by identify physiologically tuned features that can be used to identify the true termination and initiation of vocal fold vibration. Doing so would further improve the clinical relevance of using RFF to assess and track laryngeal muscle tension.

5. Conclusions

The current study examined the relationship between acoustic outputs from the semi-automated RFF algorithm and physiological vocal fold vibratory characteristics during intervocalic offsets and onsets. By incorporating features that reflected the onset and offset of vocal fold vibration, algorithmic accuracy of voiced/unvoiced detection increased. Voiced/unvoiced boundary detection accuracy when using the RFF algorithm exceeded that of the gold-standard, manual method for calculating RFF. These findings highlight the benefits of incorporating features related to vibratory offsets and onsets for acoustic voiced/unvoiced boundary detection. It is recommended that the recently validated version of the semi-automated algorithm be used to calculate RFF when voice samples containing isolated vowel–voiceless consonant–vowel productions are available, and manual RFF estimation in scenarios that require RFF to be computed from running speech.

Author Contributions

Conceptualization, J.M.V. and C.E.S.; Methodology, J.M.V. and C.E.S.; Software, J.M.V. and M.D.-C.; Validation, J.M.V. and C.E.S.; Formal Analysis, J.M.V.; Investigation, J.M.V., M.D.G., M.D.-C., V.S.M., and D.P.B.; Resources, C.E.S. and J.P.N.; Data Curation, J.M.V., D.D.C., A.T.L., J.P.N.J.; M.D.-C., and V.S.M.; Writing—Original Draft Preparation, J.M.V.; Writing—Review and Editing, J.M.V., D.D.C., A.T.L., J.P.N.J., M.D.-C., M.D.G., D.P.B., V.S.M., J.P.N., and C.E.S.; Visualization, J.M.V.; Supervision, C.E.S.; Project Administration, J.M.V. and C.E.S.; Funding Acquisition, J.M.V. and C.E.S. All authors have read and agreed to the published version of the manuscript.

Funding

This work was supported by the National Science Foundation under Grant No. 1247312 (J.M.V.) and the National Institutes of Health under Grant No. DC015570 (C.E.S.). The content is solely the responsibility of the authors and does not necessarily represent the official views of the National Science Foundation or the National Institutes of Health.

Institutional Review Board Statement

This study was conducted according to the guidelines of the Declaration of Helsinki and approved by the Boston University Institutional Review Board (Protocol #2625).

Informed Consent Statement

Informed consent was obtained from all subjects involved in this study.

Data Availability Statement

The data presented in this study are available on request from the corresponding author. The data are not publicly available due to the identifiable nature of voice acoustic recordings.

Acknowledgments

The authors would like to thank Roxanne Segina, Monique Tardif, Lidiya Dubrova, Feng Wang, and Anton Dolling for assistance in data processing.

Conflicts of Interest

The authors declare no conflict of interest.

References

  1. Ramig, L.O.; Verdolini, K. Treatment efficacy: Voice disorders. J. Speech Lang. Hear. Res. 1998, 41, S101–S116. [Google Scholar] [CrossRef] [Green Version]
  2. Aronson, A.E.; Bless, D.M. Clinical Voice Disorders, 4th ed.; Thieme Medical Publishers: New York, NY, USA, 2009. [Google Scholar]
  3. Nash, E.A.; Ludlow, C.L. Laryngeal muscle activity during speech breaks in adductor spasmodic dysphonia. Laryngoscope 1996, 106, 484–489. [Google Scholar] [CrossRef]
  4. Hillman, R.E.; Holmberg, E.B.; Perkell, J.S.; Walsh, M.; Vaughan, C. Objective assessment of vocal hyperfunction: An experimental framework and initial results. J. Speech Hear. Res. 1989, 32, 373–392. [Google Scholar] [CrossRef]
  5. Gallena, S.; Smith, P.J.; Zeffiro, T.; Ludlow, C.L. Effects of levodopa on laryngeal muscle activity for voice onset and offset in Parkinson disease. J. Speech Lang. Hear. Res. 2001, 44, 1284–1299. [Google Scholar] [CrossRef]
  6. Zraick, R.I.; Kempster, G.B.; Connor, N.P.; Thibeault, S.; Klaben, B.K.; Bursac, Z.; Thrush, C.R.; Glaze, L.E. Establishing validity of the Consensus Auditory-Perceptual Evaluation of Voice (CAPE-V). Am. J. Speech Lang. Pathol. 2011, 20, 14–22. [Google Scholar] [CrossRef]
  7. Dejonckere, P.H.; Remacle, M.; Fresnel-Elbaz, E.; Woisard, V.; Crevier-Buchman, L.; Millet, B. Differentiated perceptual evaluation of pathological voice quality: Reliability and correlations with acoustic measurements. Rev. Laryngol. Otol. Rhinol. 1996, 117, 219–224. [Google Scholar]
  8. Khoddami, S.M.; Ansari, N.N.; Jalaie, S. Review on laryngeal palpation methods in muscle tension dysphonia: Validity and reliability issues. J. Voice 2015, 29, 459–468. [Google Scholar] [CrossRef] [PubMed]
  9. Roy, N.; Fetrow, R.A.; Merrill, R.M.; Dromey, C. Exploring the clinical utility of relative fundamental frequency as an objective measure of vocal hyperfunction. J. Speech Lang. Hear. Res. 2016, 59, 1002–1017. [Google Scholar] [CrossRef]
  10. Stepp, C.E.; Sawin, D.E.; Eadie, T.L. The relationship between perception of vocal effort and relative fundamental frequency during voicing offset and onset. J. Speech Lang. Hear. Res. 2012, 55, 1887–1896. [Google Scholar] [CrossRef]
  11. Eadie, T.L.; Stepp, C.E. Acoustic correlate of vocal effort in spasmodic dysphonia. Ann. Otol. Rhinol. Laryngol. 2013, 122, 169–176. [Google Scholar] [CrossRef]
  12. Stepp, C.E.; Hillman, R.E.; Heaton, J.T. The impact of vocal hyperfunction on relative fundamental frequency during voicing offset and onset. J. Speech Lang. Hear. Res. 2010, 53, 1220–1226. [Google Scholar] [CrossRef]
  13. Murray, E.S.H.; Lien, Y.-A.S.; Van Stan, J.H.; Mehta, D.D.; Hillman, R.E.; Noordzij, J.P.; Stepp, C.E. Relative fundamental frequency distinguishes between phonotraumatic and non-phonotraumatic vocal hyperfunction. J. Speech Lang. Hear. Res. 2017, 60, 1507–1515. [Google Scholar] [CrossRef] [PubMed] [Green Version]
  14. Stepp, C.E. Relative fundamental frequency during vocal onset and offset in older speakers with and without Parkinson’s disease. J. Acoust. Soc. Am. 2013, 133, 1637–1643. [Google Scholar] [CrossRef] [PubMed] [Green Version]
  15. Goberman, A.M.; Blomgren, M. Fundamental frequency change during offset and onset of voicing in individuals with Parkinson disease. J. Voice 2008, 22, 178–191. [Google Scholar] [CrossRef]
  16. Stepp, C.E.; Merchant, G.R.; Heaton, J.T.; Hillman, R.E. Effects of voice therapy on relative fundamental frequency during voicing offset and onset in patients with vocal hyperfunction. J. Speech Lang. Hear. Res. 2011, 54, 1260–1266. [Google Scholar] [CrossRef] [Green Version]
  17. Lien, Y.-A.S.; Michener, C.M.; Eadie, T.L.; Stepp, C.E. Individual monitoring of vocal effort with relative fundamental frequency: Relationships with aerodynamics and listener perception. J. Speech Lang. Hear. Res. 2015, 58, 566–575. [Google Scholar] [CrossRef] [Green Version]
  18. Hunter, E.J.; Cantor-Cutiva, L.C.; Van Leer, E.; Van Mersbergen, M.; Nanjundeswaran, C.D.; Bottalico, P.; Sandage, M.J.; Whitling, S. Toward a consensus description of vocal effort, vocal load, vocal loading, and vocal fatigue. J. Speech Lang. Hear. Res. 2020, 63, 509–532. [Google Scholar] [CrossRef]
  19. McKenna, V.S.; Murray, E.S.H.; Lien, Y.-A.S.; Stepp, C.E. The relationship between relative fundamental frequency and a kinematic estimate of laryngeal stiffness in healthy adults. J. Speech Lang. Hear. Res. 2016, 59, 1283–1294. [Google Scholar] [CrossRef] [Green Version]
  20. Boersma, P. Praat, a system for doing phonetics by computer. Glot Int. 2001, 5, 341–345. [Google Scholar]
  21. Lien, Y.S. Optimization and Automation of Relative Fundamental Frequency for Objective Assessment of Vocal Hyperfunction. Ph.D. Thesis, Biomedical Engineering, Boston University, Boston, MA, USA, 2015. [Google Scholar]
  22. Lien, Y.-A.S.; Murray, E.S.H.; Calabrese, C.R.; Michener, C.M.; Van Stan, J.H.; Mehta, D.D.; Hillman, R.E.; Noordzij, J.P.; Stepp, C.E. Validation of an algorithm for semi-automated estimation of voice relative fundamental frequency. Ann. Otol. Rhinol. Laryngol. 2017, 126, 712–716. [Google Scholar] [CrossRef]
  23. Rabiner, L. Use of autocorrelation analysis for pitch detection. IEEE Trans. Acoust. Speech Signal Process. 1977, 25, 24–33. (In English) [Google Scholar] [CrossRef] [Green Version]
  24. Vojtech, J.M.; Segina, R.K.; Buckley, D.P.; Kolin, K.R.; Tardif, M.C.; Noordzij, J.P.; Stepp, C.E. Refining algorithmic estimation of relative fundamental frequency: Accounting for sample characteristics and fundamental frequency estimation method. J. Acoust. Soc. Am. 2019, 146, 3184–3202. [Google Scholar] [CrossRef] [PubMed]
  25. Camacho, A. On the use of auditory models’ elements to enhance a sawtooth waveform inspired pitch estimator on telephone-quality signals. In Proceedings of the ISSPA-2012, Montreal, QC, Canada, 2–5 July 2012; pp. 1080–1085. [Google Scholar]
  26. Camacho, A.; Harris, J.G. A sawtooth waveform inspired pitch estimator for speech and music. J. Acoust. Soc. Am. 2008, 124, 1638–1652. [Google Scholar] [CrossRef] [PubMed] [Green Version]
  27. Cheyne, H.A.; Hanson, H.M.; Genereux, R.P.; Stevens, K.N.; Hillman, R.E. Development and testing of a portable vocal accumulator. J. Speech Lang. Hear. Res. 2003, 46, 1457–1467. [Google Scholar] [CrossRef]
  28. Braunschweig, T.; Flaschka, J.; Schelhorn-Neise, P.; Döllinger, M. High-speed video analysis of the phonation onset, with an application to the diagnosis of functional dysphonias. Med. Eng. Phys. 2008, 30, 59–66. [Google Scholar] [CrossRef]
  29. Ikuma, T.; Kunduk, M.; McWhorter, A.J. Preprocessing techniques for high-speed videoendoscopy analysis. J. Voice 2013, 27, 500–505. [Google Scholar] [CrossRef]
  30. Kunduk, M.; Yan, Y.; McWhorter, A.J.; Bless, D. Investigation of voice initiation and voice offset characteristics with high-speed digital imaging. Logop. Phoniatr. Vocol. 2006, 31, 139–144. [Google Scholar] [CrossRef]
  31. Patel, R.R.; Forrest, K.; Hedges, D. Relationship between acoustic voice onset and offset and selected instances of oscillatory onset and offset in young healthy men and women. J. Voice 2017, 31, 389.e9–389.e17. [Google Scholar] [CrossRef] [Green Version]
  32. Löfqvist, A.; Koenig, L.L.; McGowan, R.S. Vocal tract aerodynamics in /aCa/ utterances: Measurements. Speech Commun. 1995, 16, 49–66. [Google Scholar] [CrossRef]
  33. Lien, Y.-A.S.; Gattuccio, C.I.; Stepp, C.E. Effects of phonetic context on relative fundamental frequency. J. Speech Lang. Hear. Res. 2014, 57, 1259–1267. [Google Scholar] [CrossRef] [Green Version]
  34. Stepp, C.E.; Hillman, R.E.; Heaton, J.T. A virtual trajectory model predicts differences in vocal fold kinematics in individuals with vocal hyperfunction. J. Acoust. Soc. Am. 2010, 127, 3166–3176. [Google Scholar] [CrossRef] [PubMed] [Green Version]
  35. Dworkin, J.P.; Meleca, R.J.; Simpson, M.L.; Garfield, I. Use of topical lidocaine in the treatment of muscle tension dysphonia. J. Voice 2000, 14, 567–574. [Google Scholar] [CrossRef]
  36. Baken, R.J.; Orlikoff, R.F. Clinical Measurement of Speech and Voice; Singular Thomson Learning: San Diego, CA, USA, 2000. [Google Scholar]
  37. McKenna, V.S.; Diaz-Cadiz, M.E.; Shembel, A.C.; Enos, N.M.; Stepp, C.E. The relationship between physiological mechanisms and the self-perception of vocal effort. J. Speech Lang. Hear. Res. 2019, 62, 815–834. [Google Scholar] [CrossRef]
  38. Diaz-Cadiz, M.; McKenna, V.S.; Vojtech, J.M.; Stepp, C.E. Adductory vocal fold kinematic trajectories during conventional versus high-speed videoendoscopy. J. Speech Lang. Hear. Res. 2019, 62, 1685–1706. [Google Scholar] [CrossRef] [PubMed]
  39. Vojtech, J.M.; Murray, E.S.H. Tutorial for Manual Relative Fundamental Frequency (RFF) Estimation Using Praat. 2019. Available online: https://sites.bu.edu/stepplab/research/rff/ (accessed on 6 August 2020).
  40. Nandhini, S.; Shenbagavalli, A. Voiced/Unvoiced Detection Using Short Term Processing, in ICIIECS-2014; International Journal of Computer Applications: Coimbatore, India, 2014; pp. 39–43. [Google Scholar]
  41. Jalil, M.; Butt, F.A.; Malik, A. Short-time energy, magnitude, zero crossing rate and autocorrelation measurement for discriminating voiced and unvoiced segments of speech signals. In Proceedings of the TAEECE-2013, Konya, Turkey, 9–11 May 2013; pp. 208–212. [Google Scholar]
  42. Camacho, A. SWIPE: A Sawtooth Waveform Inspired Pitch Estimator for Speech and Music. Ph.D. Thesis, Computer Engineering, University of Florida, Gainesville, FL, USA, 2007. [Google Scholar]
  43. Hillenbrand, J.M.; Houde, R.A. Acoustic correlates of breathy vocal quality: Dysphonic voices and continuous speech. J. Speech Lang. Hear. Res. 1996, 39, 311–321. [Google Scholar] [CrossRef] [PubMed]
  44. Samad, S.A.; Hussain, A.; Fah, L.K. Pitch detection of speech signals using the cross-correlation technique. In Proceedings of the 2000-TENCON, Kuala Lumpur, Malaysia, 24–27 September 2000; Volume 1, pp. 283–286. [Google Scholar]
  45. Ghaemmaghami, H.; Baker, B.J.; Vogt, R.J.; Sridharan, S. Noise robust voice activity detection using features extracted from the time-domain autocorrelation function. In Proceedings of the INTERSPEECH-2010, Makuhari, Chiba, Japan, 26–30 September 2010; pp. 3118–3121. [Google Scholar]
  46. Hillenbrand, J.; Cleveland, R.A.; Erickson, R.L. Acoustic correlates of breathy vocal quality. J. Speech Lang. Hear. Res. 1994, 37, 769–778. [Google Scholar] [CrossRef]
  47. Dong, E.; Liu, G.; Zhou, Y.; Cai, Y. Voice activity detection based on short-time energy and noise spectrum adaptation. In Proceedings of the ICSP-2002, Beijing, China, 26–30 August 2002; Volume 1, pp. 464–467. [Google Scholar]
  48. Swee, T.T.; Salleh, S.H.S.; Jamaludin, M.R. Speech pitch detection using short-time energy. In Proceedings of the ICCCS-2010, Kuala Lumpur, Malaysia, 11–12 May 2010. [Google Scholar]
  49. Cohen, J. Statistical Power Analysis for the Behavioral Sciences, 2nd ed.; Erlbaum: Hillsdale, NJ, USA, 1988. [Google Scholar]
  50. Lien, Y.-A.S.; Calabrese, C.R.; Michener, C.M.; Murray, E.H.; Van Stan, J.H.; Mehta, D.D.; Hillman, R.E.; Noordzij, J.P.; Stepp, C.E. Voice relative fundamental frequency via neck-skin acceleration in individuals with voice disorders. J. Speech Lang. Hear. Res. 2015, 58, 1482–1487. [Google Scholar] [CrossRef] [PubMed] [Green Version]
  51. Cortés, J.P.; Espinoza, V.M.; Ghassemi, M.; Mehta, D.D.; Van Stan, J.H.; Hillman, R.E.; Guttag, J.V.; Zañartu, M. Ambulatory assessment of phonotraumatic vocal hyperfunction using glottal airflow measures estimated from neck-surface acceleration. PLoS ONE 2018, 13, e0209017. [Google Scholar] [CrossRef] [PubMed] [Green Version]
  52. Fryd, A.S.; Van Stan, J.H.; Hillman, R.E.; Mehta, D.D. Estimating subglottal pressure from neck-surface acceleration during normal voice production. J. Speech Lang. Hear. Res. 2016, 59, 1335–1345. [Google Scholar] [CrossRef] [Green Version]
  53. Ghassemi, M.; Van Stan, J.H.; Mehta, D.D.; Zañartu, M.; Ii, H.A.C.; Hillman, R.E.; Guttag, J.V. Learning to detect vocal hyperfunction from ambulatory neck-surface acceleration features: Initial results for vocal fold nodules. IEEE Trans. Biomed. Eng. 2014, 61, 1668–1675. [Google Scholar] [CrossRef] [Green Version]
  54. Hillman, R.E.; Heaton, J.T.; Masaki, A.; Zeitels, S.M.; Cheyne, H.A. Ambulatory monitoring of disordered voices. Ann. Otol. Rhinol. Laryngol. 2006, 115, 795–801. [Google Scholar] [CrossRef]
  55. Mehta, D.D.; Van Stan, J.H.; Hillman, R.E. Relationships between vocal function measures derived from an acoustic microphone and a subglottal neck-surface accelerometer. IEEE/ACM Trans. Audio Speech Lang. Process. 2016, 24, 659–668. [Google Scholar] [CrossRef]
  56. Mehta, D.D.; Van Stan, J.H.; Zanartu, M.; Ghassemi, M.; Guttag, J.V.; Espinoza, V.M.; Cortés, J.P.; Cheyne, H.A.I.; Hillman, R.E. Using ambulatory voice monitoring to investigate common voice disorders: Research update. Front. Bioeng. Biotechnol. 2015, 3, 155. [Google Scholar] [CrossRef] [PubMed] [Green Version]
  57. Mehta, D.D.; Zanartu, M.; Feng, S.W.; Cheyne, H.A., 2nd; Hillman, R.E. Mobile voice health monitoring using a wearable accelerometer sensor and a smartphone platform. IEEE Trans. Biomed. Eng. 2012, 59, 3090–3096. [Google Scholar] [CrossRef] [PubMed] [Green Version]
  58. Van Stan, J.H.; Mehta, D.D.; Zeitels, S.M.; Burns, J.A.; Barbu, A.M.; Hillman, R.E. Average ambulatory measures of sound pressure level, fundamental frequency, and vocal dose do not differ between adult females with phonotraumatic lesions and matched control subjects. Ann. Otol. Rhinol. Laryngol. 2015, 124, 864–874. [Google Scholar] [CrossRef] [Green Version]
  59. JŠvec, J.G.; Titze, I.R.; Popolo, P.S. Estimation of sound pressure levels of voiced speech from skin vibration of the neck. J. Acoust. Soc. Am. 2005, 117, 1386–1394. [Google Scholar]
  60. Popolo, P.S.; Svec, J.G.; Titze, I.R. Adaptation of a pocket PC for use as a wearable voice dosimeter. J. Speech Lang. Hear. Res. 2005, 48, 780–791. [Google Scholar] [CrossRef]
  61. Groll, M.D.; Vojtech, J.M.; Hablani, S.; Mehta, D.D.; Buckley, D.P.; Noordzij, J.P.; Stepp, C.E. Automated relative fundamental frequency algorithms for use with neck-surface accelerometer signals. J. Voice 2020. advanced online publication. [Google Scholar] [CrossRef] [PubMed]
Figure 1. Acoustic waveform of the vowel–voiceless consonant–vowel production, /ifi/. Voicing cycles preceding the voiceless consonant, /f/, are marked as voicing offset cycles, whereas those following the /f/ are indicated as voicing onset cycles. The first and tenth vocal cycles are highlighted for each transition.
Applsci 11 03816 g001
Figure 2. (a) View of the vocal folds under flexible nasendoscopy, with the glottic angle marked from the anterior commissure to the vocal processes, (b) acoustic signal, (c) raw glottic angle waveform (gray) with smoothed data overlay (black), and (d) Filtered quick vibratory profile (QVP). The black dotted line in (bd) indicates the current video frame shown in (a). The time of voicing offset (orange solid line) and time of voicing onset (teal solid line) are indicated in (bd).
Applsci 11 03816 g002
Figure 3. Normalized feature values calculated from the raw microphone signal or Auditory-SWIPE′ output (teal) with respect to distance (pitch periods) from the true boundary cycle (thin black dotted line) for voicing offset. Normalized feature values calculated from band-pass filtered microphone signal are overlaid in orange (when applicable). Top row: normalized peak-to-peak amplitude (PTP), short-time magnitude (STM), short-time energy (STE), cross-correlation (XCO), normalized cross-correlation (NXCO), autocorrelation (ACO). Middle row: mean and standard deviation of cepstral peak prominence (CPP, SD CPP), signal-to-noise ratio (SNR), number of zero crossings (NZC), waveform shape similarity (WSS), low-to-high ratio of spectral energy (LHR). Bottom row: log energy (LE), average and median pitch strength (APS, MPS), average, median, and standard deviation of fo (Afo, Mfo, SD fo). Thick solid lines indicate mean values of features that were retained after manual inspection. Thick orange and teal dashed lines indicate mean values of features that were removed through manual inspection. Shaded regions indicate standard deviation.
Applsci 11 03816 g003
Figure 4. Normalized feature values calculated from the raw microphone signal or Auditory-SWIPE′ output (teal) with respect to distance (pitch periods) from the true boundary cycle (thin black dotted line) for voicing onset. Normalized feature values calculated from band-pass filtered microphone signal are overlaid in orange (when applicable). Top row: normalized peak-to-peak amplitude (PTP), short-time magnitude (STM), short-time energy (STE), cross-correlation (XCO), normalized cross-correlation (NXCO), autocorrelation (ACO). Middle row: mean and standard deviation of cepstral peak prominence (CPP, SD CPP), signal-to-noise ratio (SNR), number of zero crossings (NZC), waveform shape similarity (WSS), low-to-high ratio of spectral energy (LHR). Bottom row: log energy (LE), average and median pitch strength (APS, MPS), average, median, and standard deviation of fo (Afo, Mfo, SD fo). Thick solid lines indicate mean values of features that were retained after manual inspection. Thick orange and teal dashed lines indicate mean values of features that were removed through manual inspection. Shaded regions indicate standard deviation.
Applsci 11 03816 g004
Figure 5. Boundary cycle identification of each RFF estimation method (manual, aRFF-AP, aRFF-APH). For (a) voicing offset and (b) voicing onset. Results for manual RFF estimation are shown in light orange, aRFF-AP in dark orange, and aRFF-APH in teal.
Applsci 11 03816 g005
Table 1. Overall demographic information for the 122 participants.
CohortGenderAgeOverall Severity of Dysphonia
MFMeanSDRangeMeanSDRange
Young adults with typical voices181722.85.518–315.43.80.6–23.5
Older adults with typical voices181665.610.841–9111.47.71.7–34.2
Adults with HVD 162237.516.119–7012.310.70.9–38.5
Adults with PD 218763.09.443–7519.213.34.0–51.3
1 HVD = Hyperfunctional voice disorder; 2 PD = Parkinson’s disease.
Table 2. Number of participants for which each of five trained technicians manually computed relative fundamental frequency 1.
TechnicianTotal RatingsNumber of Participants in Common between Technicians
12345
137
2825
3791853
42914132
51701160
1 Total ratings sum to 244 as manual RFF estimation was performed twice for each participant (N = 122).
Table 3. Acoustic measures for classifying voiced and unvoiced speech segments, with abbreviations (Abbr), the signal used to calculate the feature, feature definition, and proposed hypotheses surrounding feature trends in voiced (V) vs. unvoiced (UV) segments. Rows that are shaded orange indicate that the acoustic feature was included in aRFF-AP algorithm.
Feature NameAbbr.SignalsDefinitionHypothesized Trend
AutocorrelationACORaw and Filtered
Microphone
ACO is a comparison of a segment of a voice signal to a delayed copy of itself as a function of the delay [40,41,42].V > UV
Mean Cepstral Peak ProminenceCPPRaw and Filtered
Microphone
CCP reflects the distribution of energy at harmonically related frequencies [43] and is calculated as the magnitude of the peak with the highest amplitude in the cepstrum (i.e., Fourier transform of power spectrum).V > UV
Average Pitch StrengthAPSPitch Strength ContourPitch strength is calculated using Auditory-SWIPE′ [25] by correlating a voice signal with a sawtooth waveform constructed across a range of possible fo values; the fo value that elicits the greatest correlation is considered the fo of the signal, and the degree of this correlation is the pitch strength. APS is then calculated as the average pitch strength of the window.V > UV
Average Voice foAfofo ContourAfo was calculated in the current study using the Auditory-SWIPE′ algorithm (described above in APS).V > UV
Cross-CorrelationXCORaw and Filtered
Microphone
XCO is a comparison of a segment of a voice signal with a different segment of the signal [42,44,45].V > UV
Low-to-High Ratio of Spectral EnergyLHRRaw and Filtered
Microphone
LHR is calculated by comparing spectral energy above and below a specified frequency. Using a cut-off frequency of 4 kHz [43,46], the LHR may distinguish harmonic energy of the /i/ from high-frequency aspiration and frication noise (>2–3 kHz) of the /f/.V > UV
Median Pitch StrengthMPSPitch Strength ContourMPS was included as an alternative to APS.V > UV
Median Voice foMfofo ContourMfo was included as an alternative to Afo.V > UV
Normalized Cross-CorrelationNXCORaw and Filtered
Microphone
NXCO was included as an alternative to XCO, in which the amplitude of the compared windows is normalized to remove differences in signal amplitude.V > UV
Normalized Peak-to-Peak AmplitudePTPRaw and Filtered
Microphone
PTP is the range of the amplitude of a windowed voice signal.V > UV
Number of Zero CrossingsNZCRaw and Filtered
Microphone
NZC refers to the number of sign changes of the windowed signal.V < UV
Short-Time EnergySTERaw and Filtered
Microphone
STE is the energy of a short voice segment [41,47,48].V > UV
Short-Time Log EnergySLERaw and Filtered
Microphone
SLE was included as an alternative to STE, and is calculated as the logarithm of the energy of a short voice segment.V > UV
Short-Time MagnitudeSTMRaw and Filtered
Microphone
STM is the magnitude of a short voice segment [41,47,48].V > UV
Signal-to-Noise RatioSNRRaw and Filtered
Microphone
SNR is an estimate of the power of a signal compared to that of a segment of noise.V > UV
Standard Deviation of Cepstral Peak ProminenceSD CPPRaw and Filtered
Microphone
SD CPP is the standard deviation of CPP values within a window and may capture variations in periodicity due to aspiration and frication noise in the /f/V < UV
Standard Deviation of Voice foSD fofo ContourSD fo is the standard deviation of fo values within a may be subject to fo estimation errors during the /f/ (as unvoiced segments would not have a valid fo value).V < UV
Waveform Shape SimilarityWSSRaw and Filtered
Microphone
WSS is the normalized sum of square error between the current and previous window of time and is calculated relative to a window of time in the /f/.V < UV
Table 4. Summary of significant variables in the stepwise binary logistic regression statistical model.
ModelAcoustic FeatureCoefSE Coefzp95% Confidence IntervalVIF 1
Lower BoundUpper Bound
Voicing OffsetConstant0.100.071.480.15−0.030.24
Filtered Waveform Shape Similarity−1.520.05−30.07<0.001−1.62−1.421.30
Median of Voice fo1.460.0434.85<0.0011.371.541.21
Cepstral Peak Prominence1.230.0620.07<0.0011.111.351.27
Number of Zero Crossings−3.310.04−78.69<0.001−3.39−3.231.55
Short-Time Energy−5.720.15−38.18<0.001−6.01−5.429.03
Average Pitch Strength9.240.1278.52<0.0019.019.474.81
Normalized Cross-Correlation−0.840.05−16.77<0.001−0.93−0.741.53
Cross-Correlation1.000.166.25<0.0010.691.317.74
Voicing OnsetConstant−2.180.10−22.69<0.001−2.37−2.00
Filtered Waveform Shape Similarity1.400.0818.34<0.0011.251.551.30
Median of Voice fo2.210.0640.31<0.0012.102.311.19
Cepstral Peak Prominence1.050.0812.53<0.0010.891.221.06
Number of Zero Crossings−2.620.06−42.15<0.001−2.75−2.501.66
Average Pitch Strength8.940.1559.45<0.0018.659.242.83
Signal-to-Noise Ratio0.560.069.84<0.0010.450.682.44
Filtered Short-Time Energy−3.750.10−37.51<0.001−3.95−3.563.66
Filtered Short-Time Log Energy3.110.0744.81<0.0012.973.243.01
1 VIF = variable inflation factor.
Table 5. Proportion of correctly identified boundary cycles (%) by RFF estimation method and cohort.
ModelCohortNProportion of Correctly Identified Boundary Cycles (%) by RFF Estimation Method
ManualaRFF-APaRFF-APH
Voicing OffsetTypical voice6914.766.972.8
Parkinson’s disease2510.958.972.0
Muscle tension dysphonia208.366.169.0
Nodules47.466.369.8
Polyp20.053.973.1
Scarring120.858.387.5
Lesion10.053.973.1
Voicing OnsetTypical voice6930.472.476.8
Parkinson’s disease2527.278.181.9
Muscle tension dysphonia2020.083.888.5
Nodules415.493.698.0
Polyp20.0100.084.6
Scarring133.362.583.3
Lesion121.282.788.5
Table 6. Chi-square (Χ2) tests of independence to examine RFF estimation method and accuracy of boundary cycle identification for voicing offset and onset. Cramer’s V effect sizes are interpreted using criteria from Cohen [49].
ModelRFF Estimation MethodsdfNΧ2pVEffect Size Interpretation
Voicing OffsetManual vs. aRFF-AP vs. aRFF-APH2217935821.0<0.0010.52Large
Manual vs. aRFF-AP1142503928.0<0.0010.53Large
Manual vs. aRFF-APH1142684982.0<0.0010.59Large
aRFF-AP vs. aRFF-APH11506889.7<0.0010.08Negligible
Voicing OnsetManual vs. aRFF-AP vs. aRFF-APH2191126417.0<0.0010.58Large
Manual vs. aRFF-AP1126313420.0<0.0010.52Large
Manual vs. aRFF-APH1123914831.0<0.0010.62Large
aRFF-AP vs. aRFF-APH113202283.0<0.0010.15Small
Publisher’s Note: MDPI stays neutral with regard to jurisdictional claims in published maps and institutional affiliations.

