
Differences of Mechanical Parameters and Rockburst Tendency Indices between Coal and Non-Coal Rocks and Modified Rockburst Tendency Classification Criteria for Non-Coal Rocks


Abstract
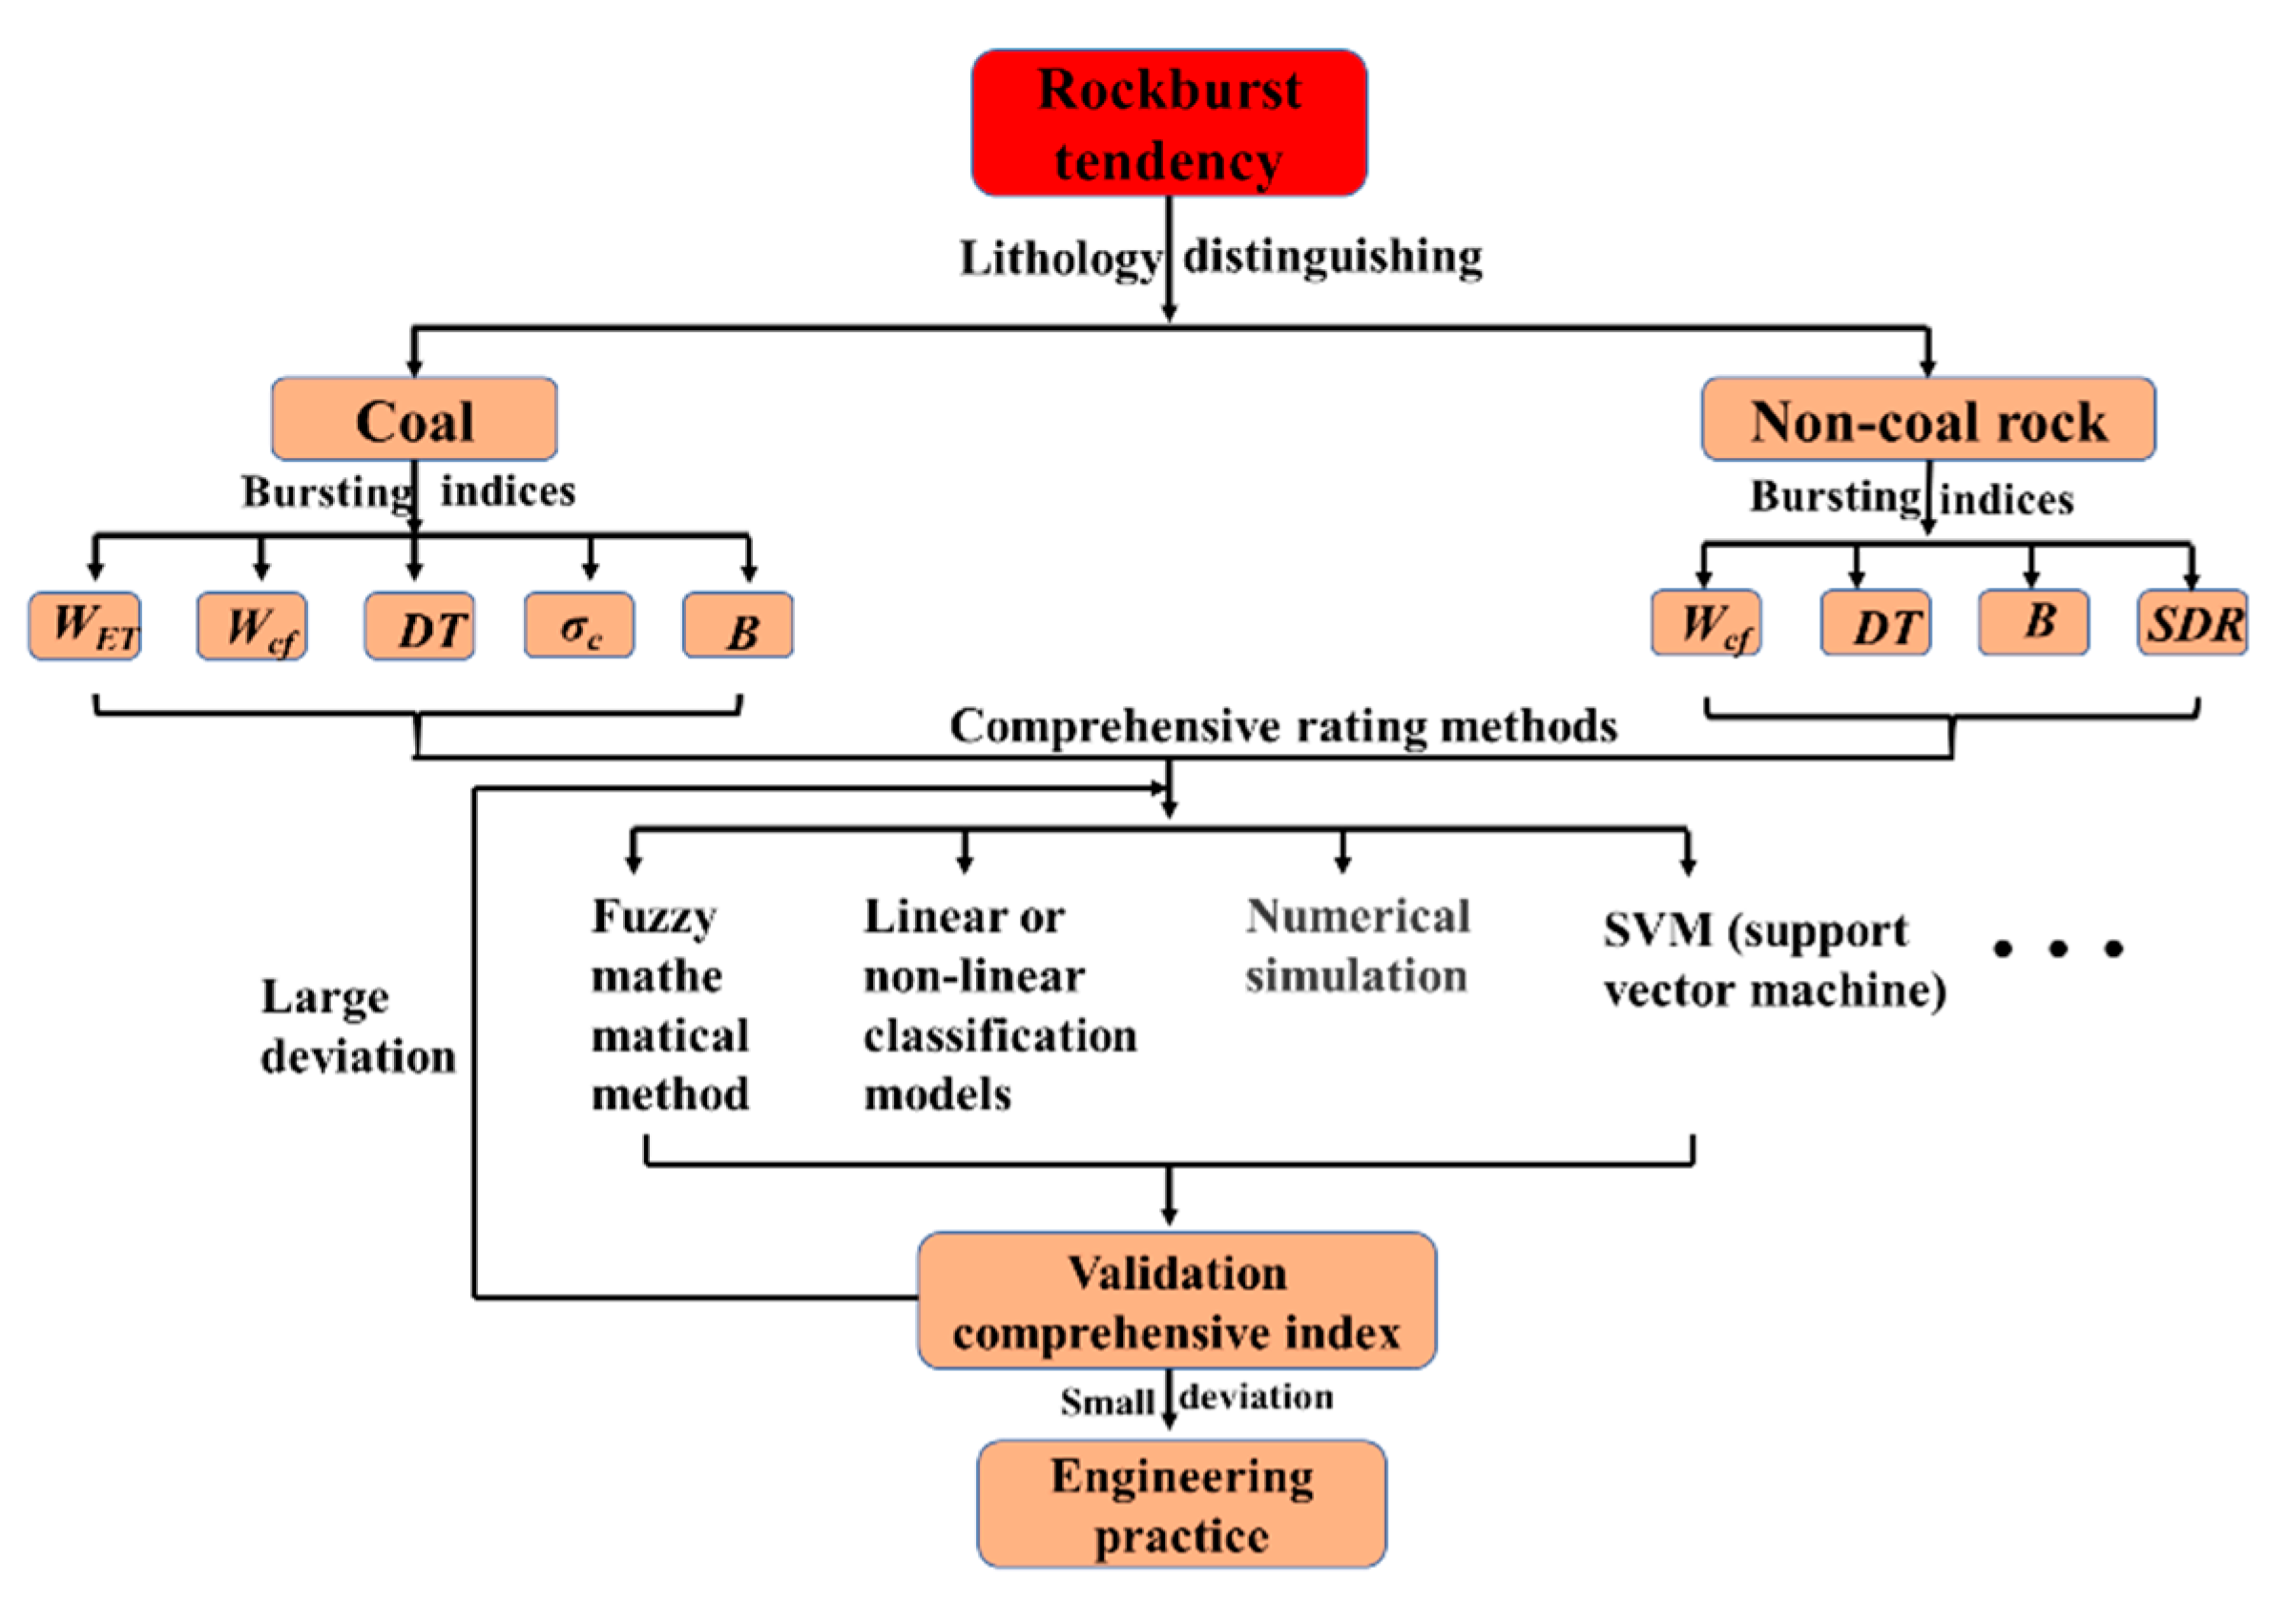
:1. Introduction
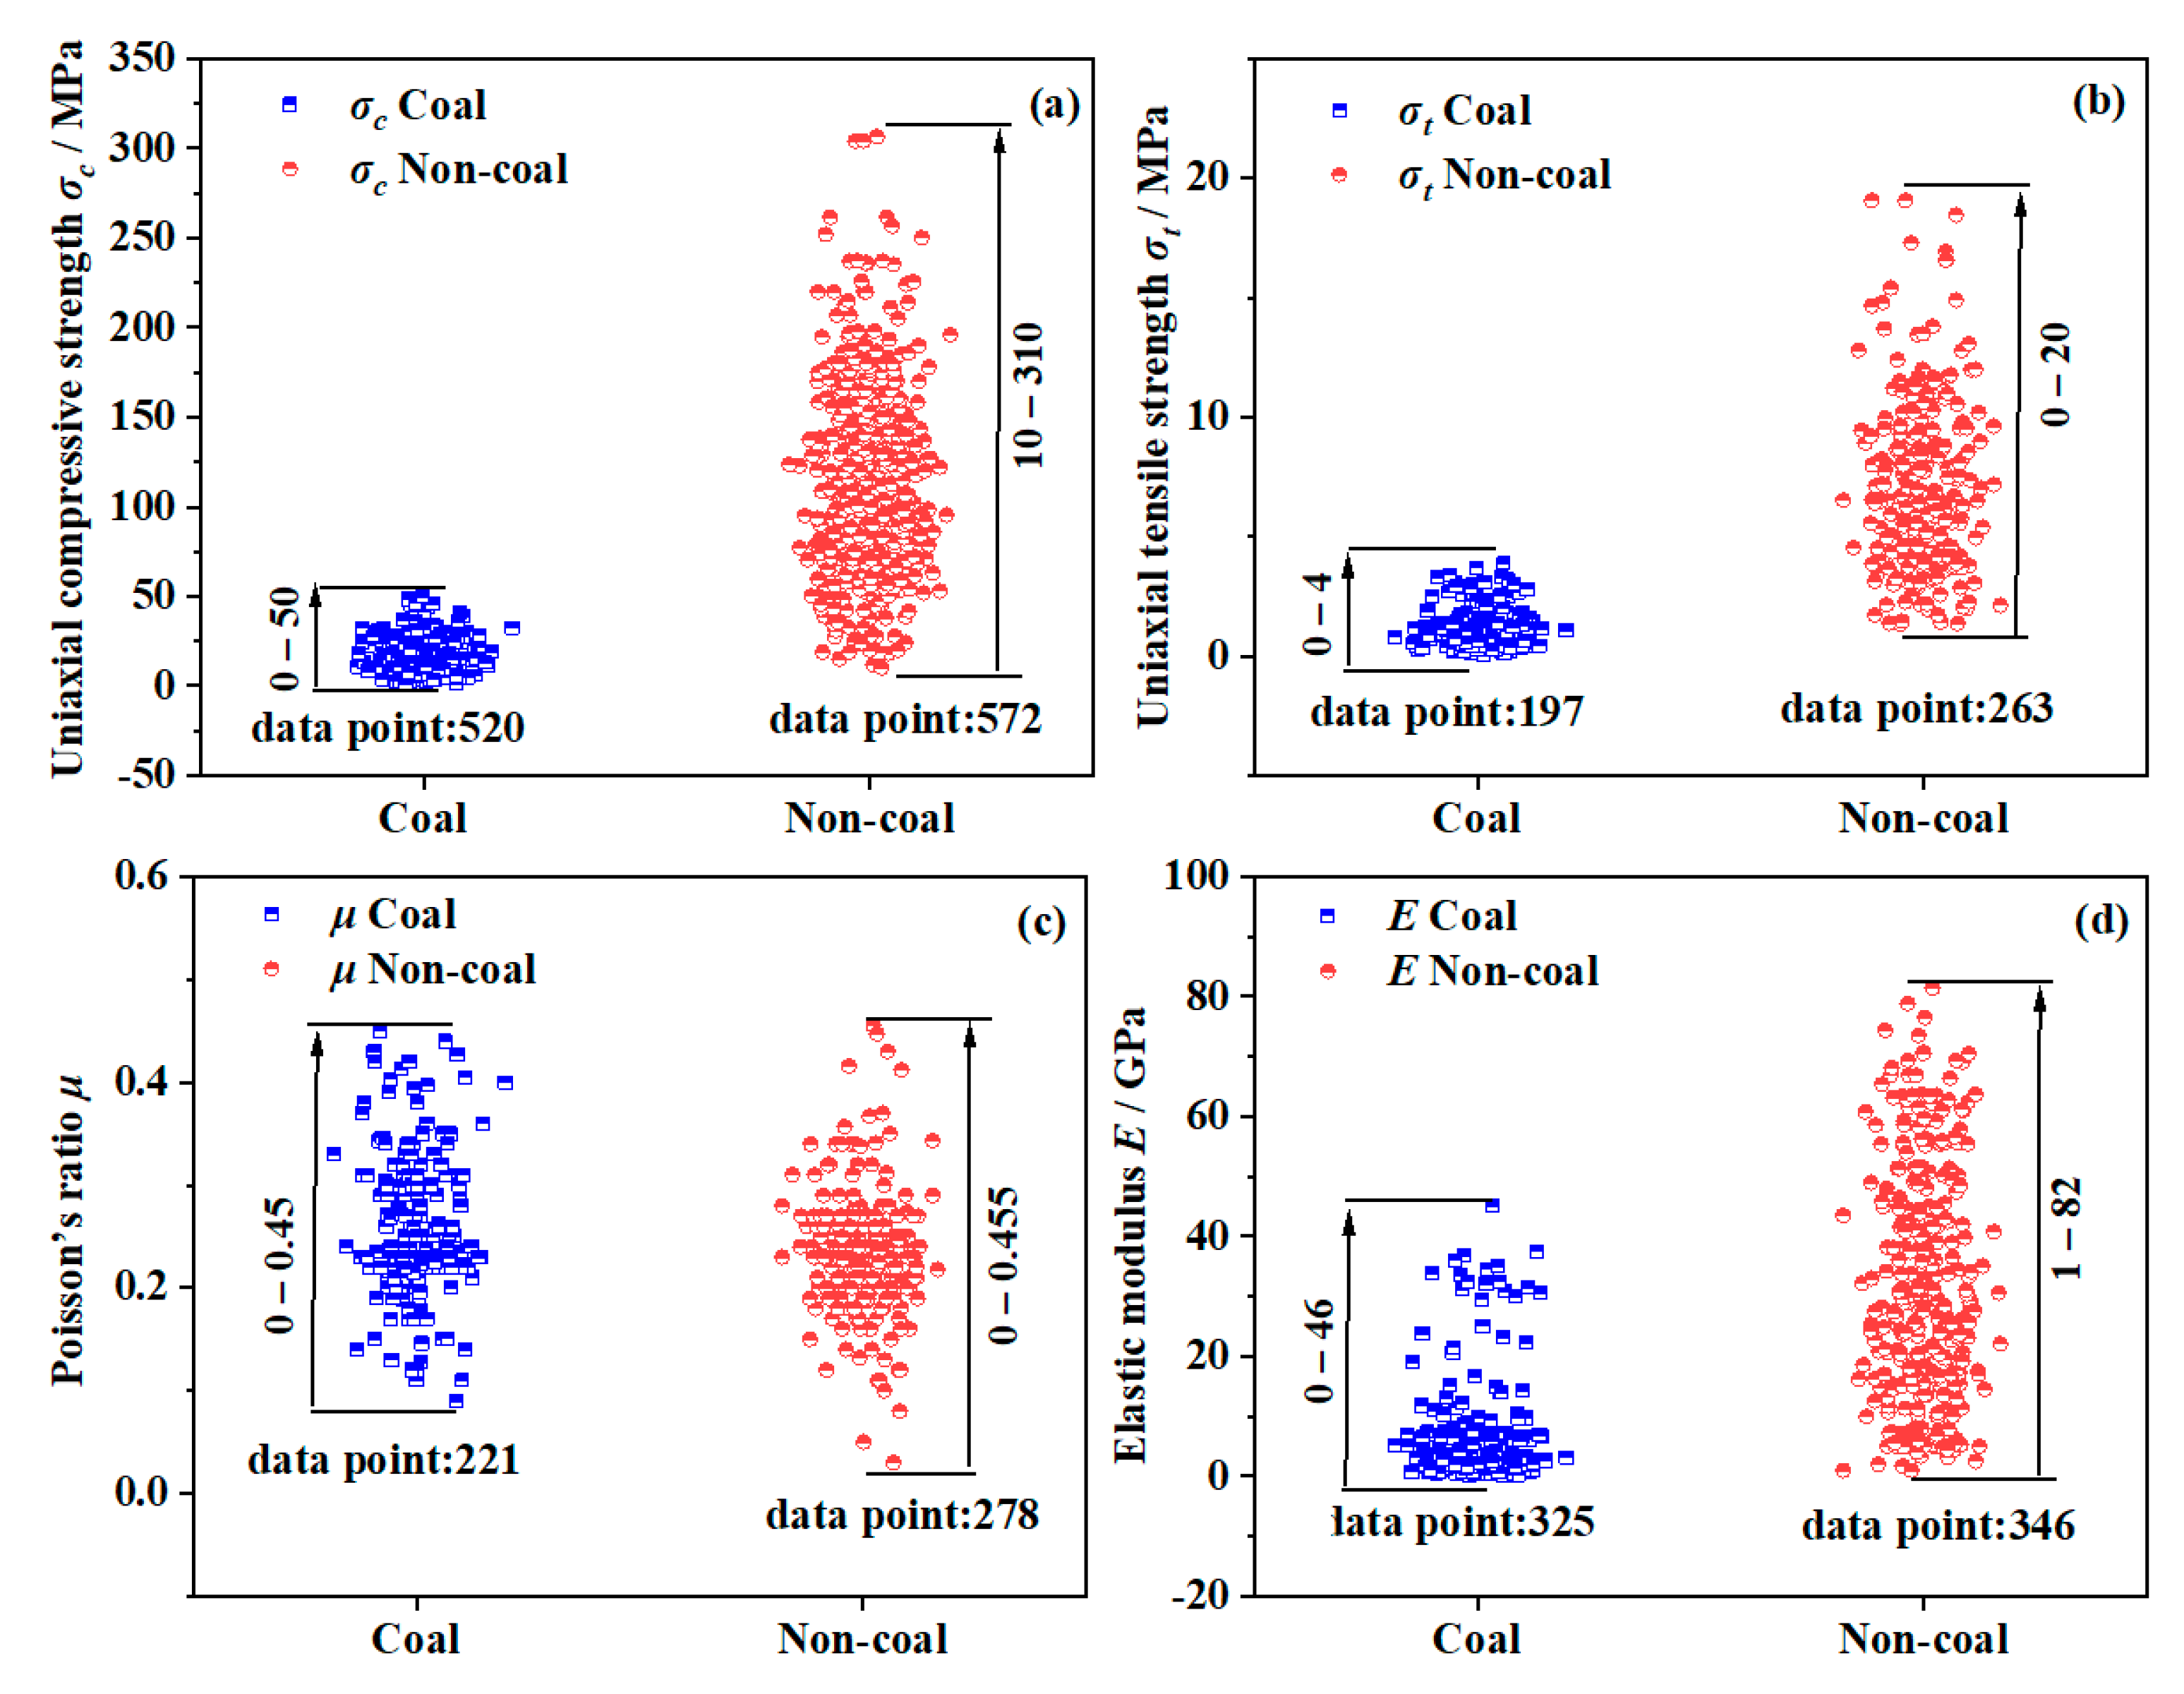
2. Basic Mechanical Parameters
3. Bursting Liability Indices
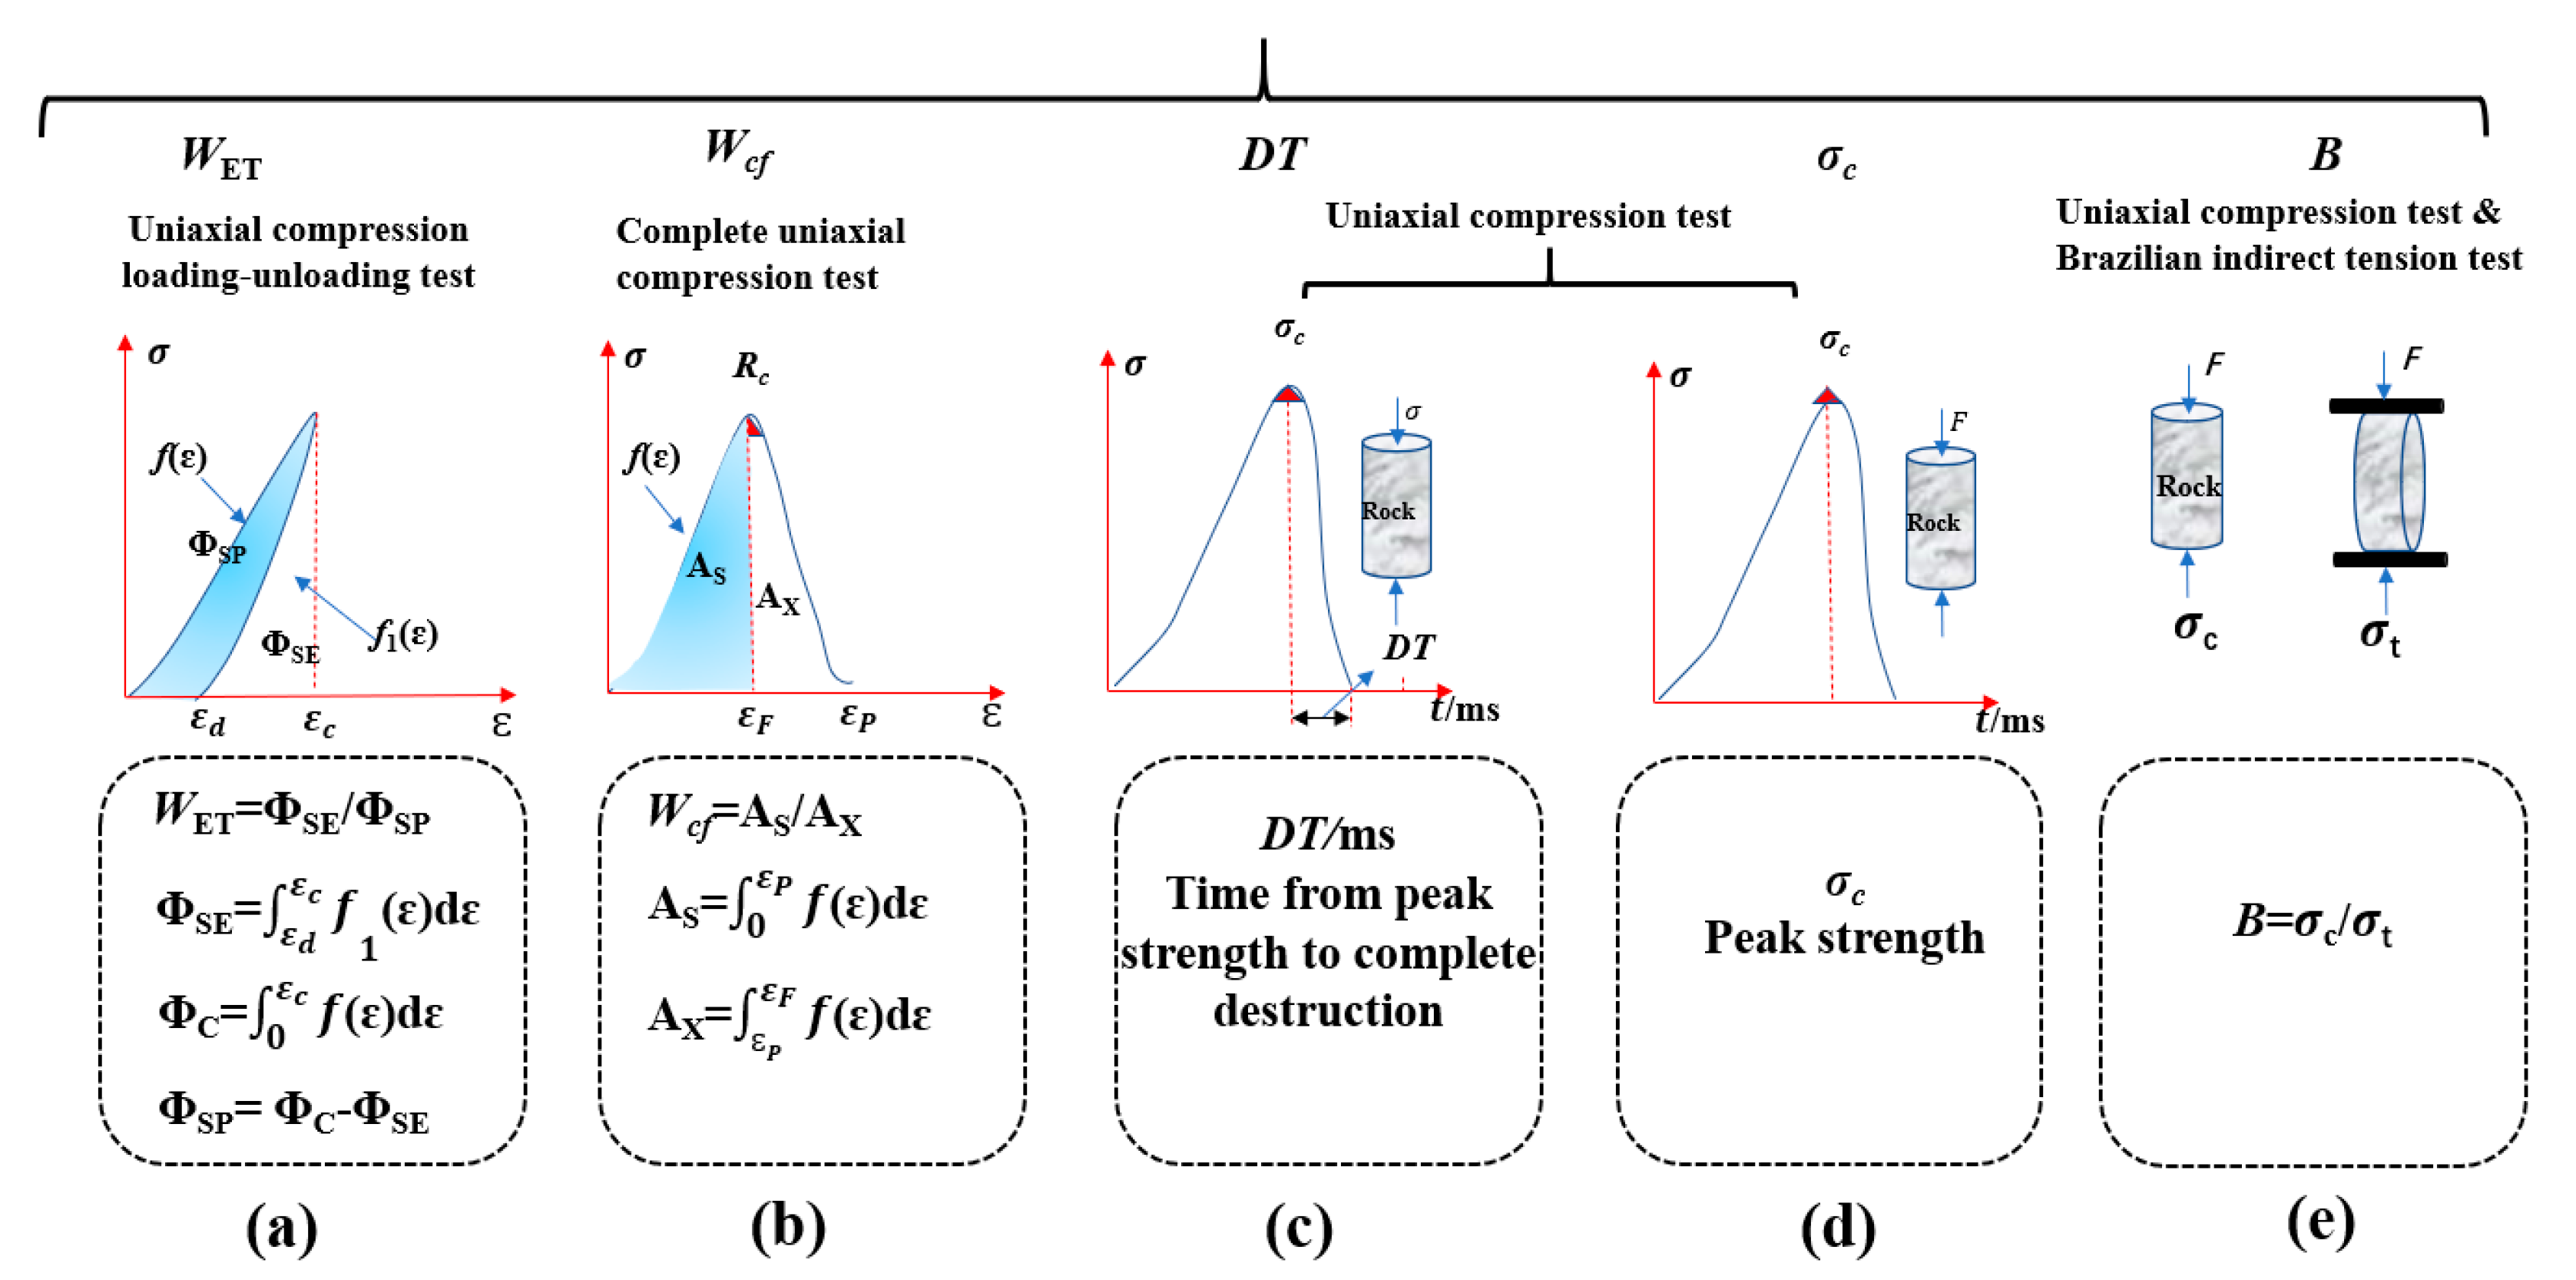
3.1. Calculation Principle
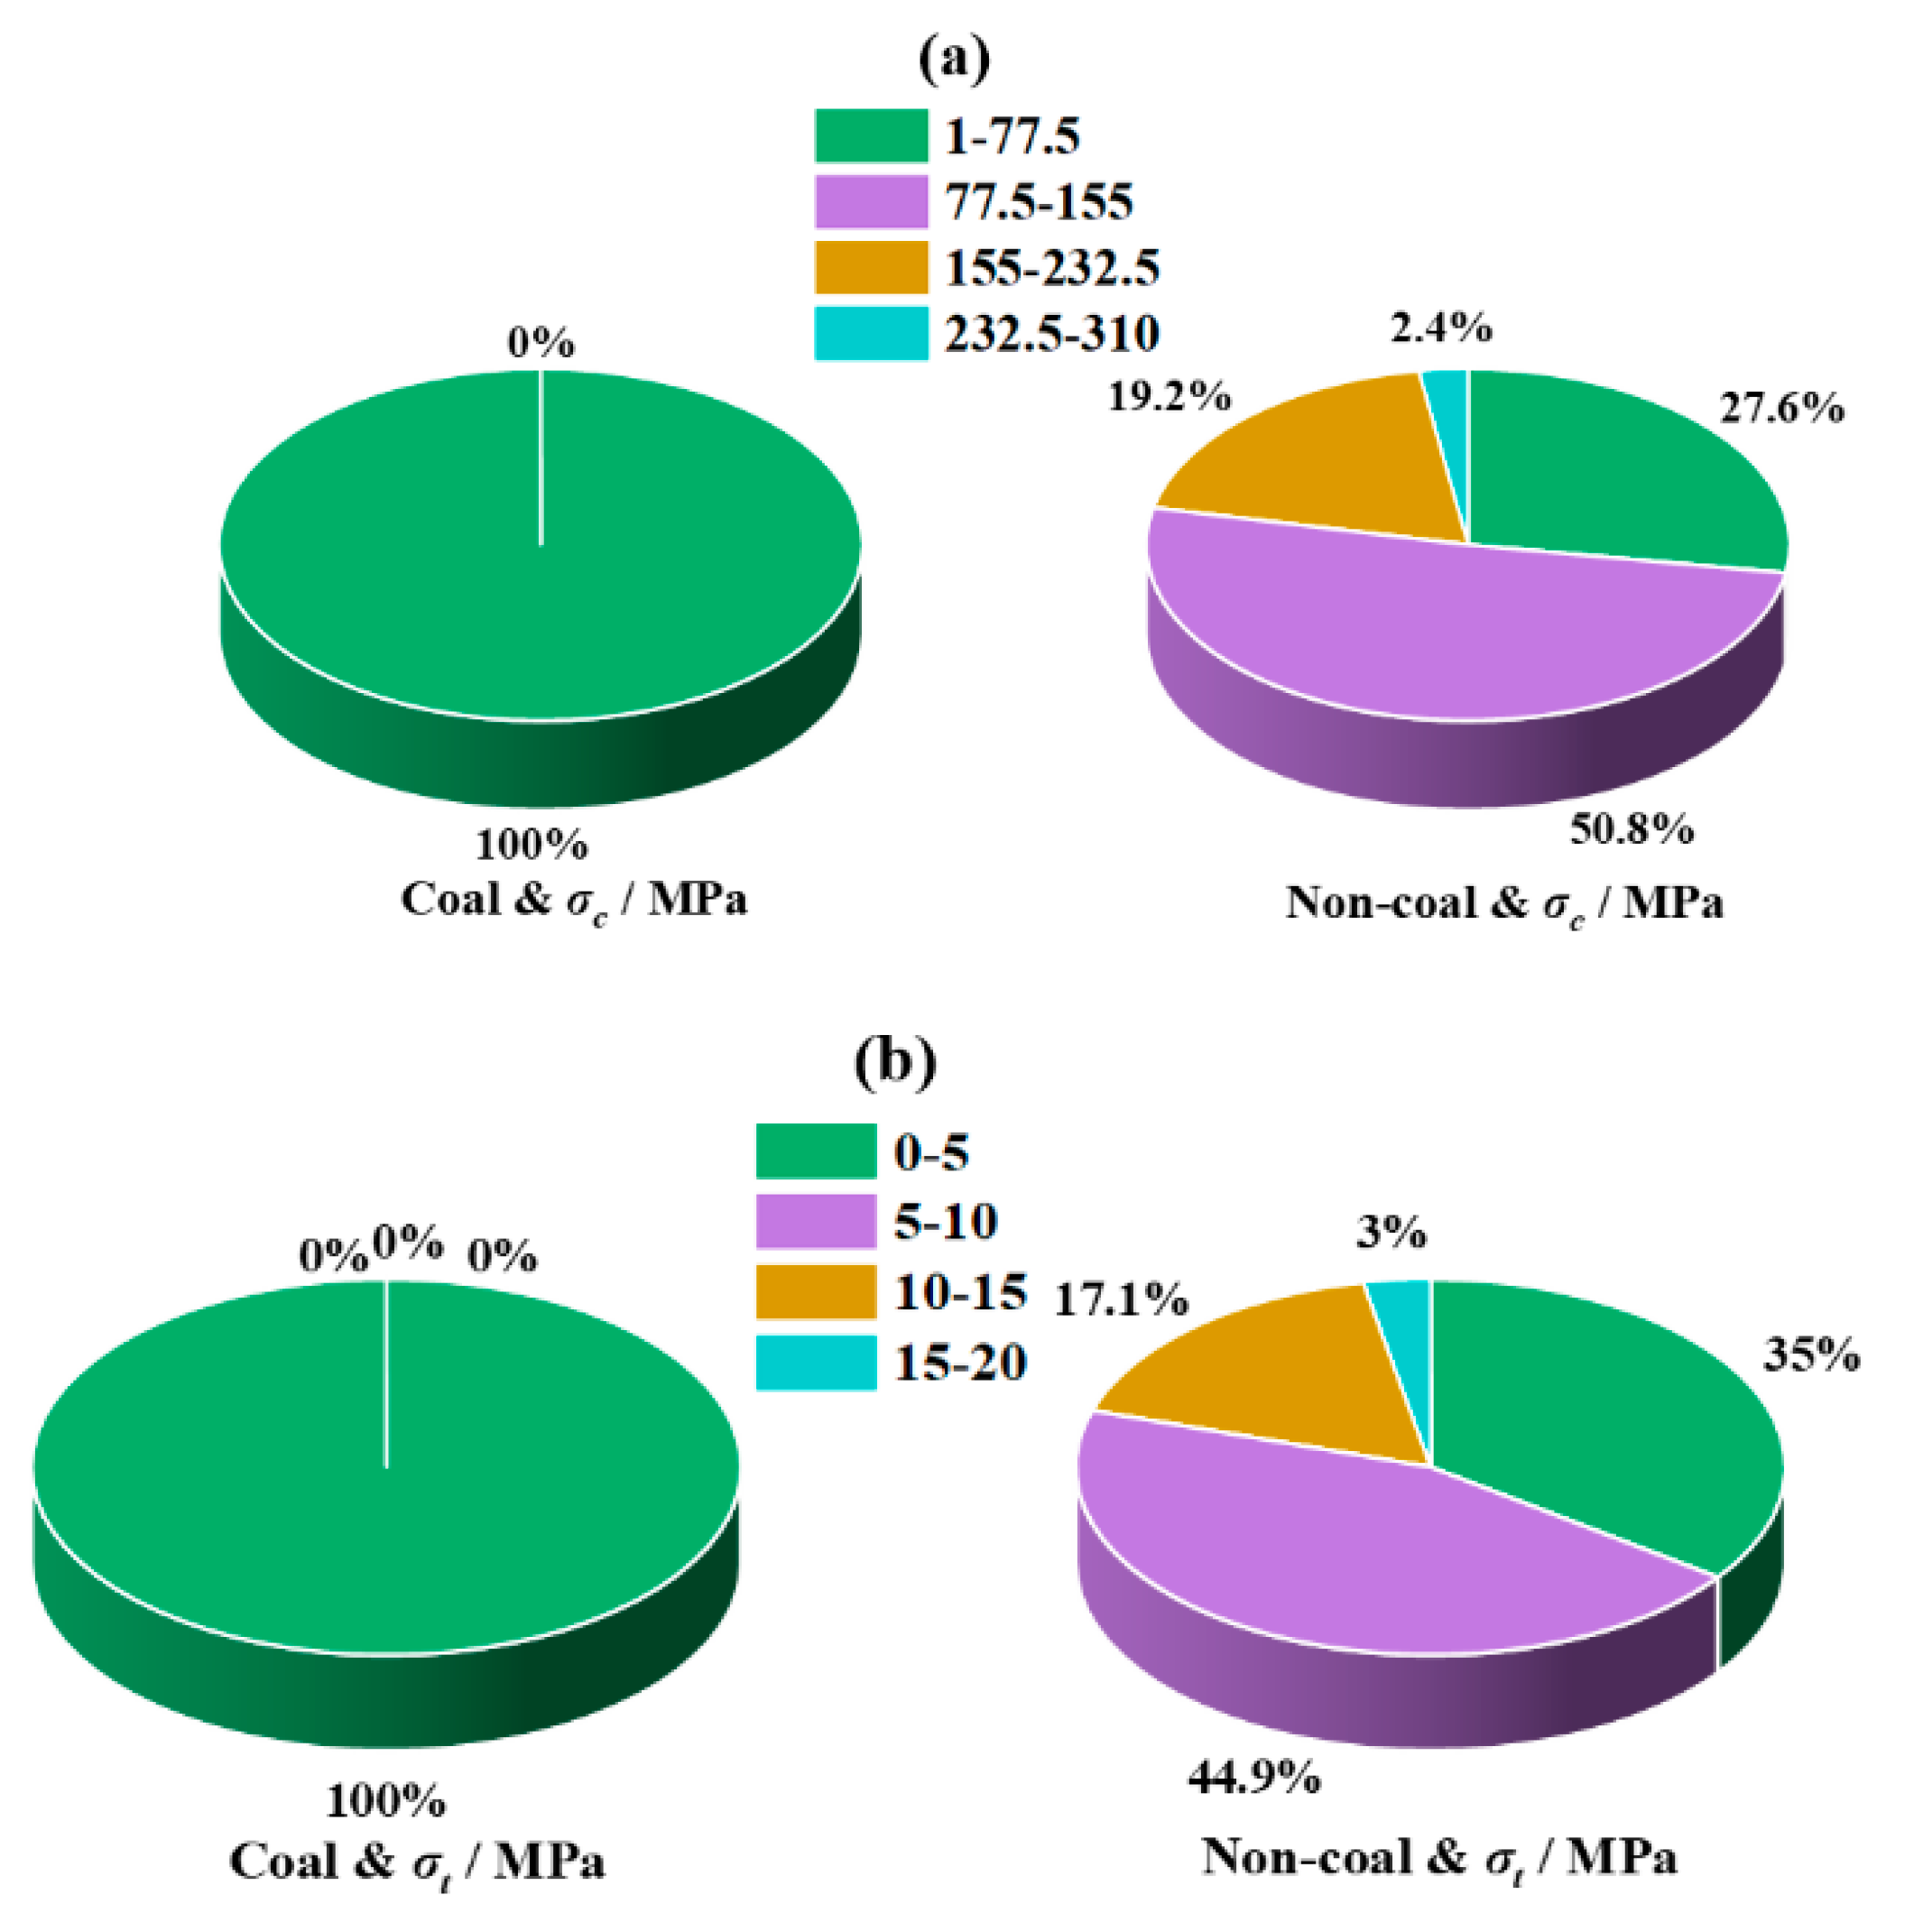
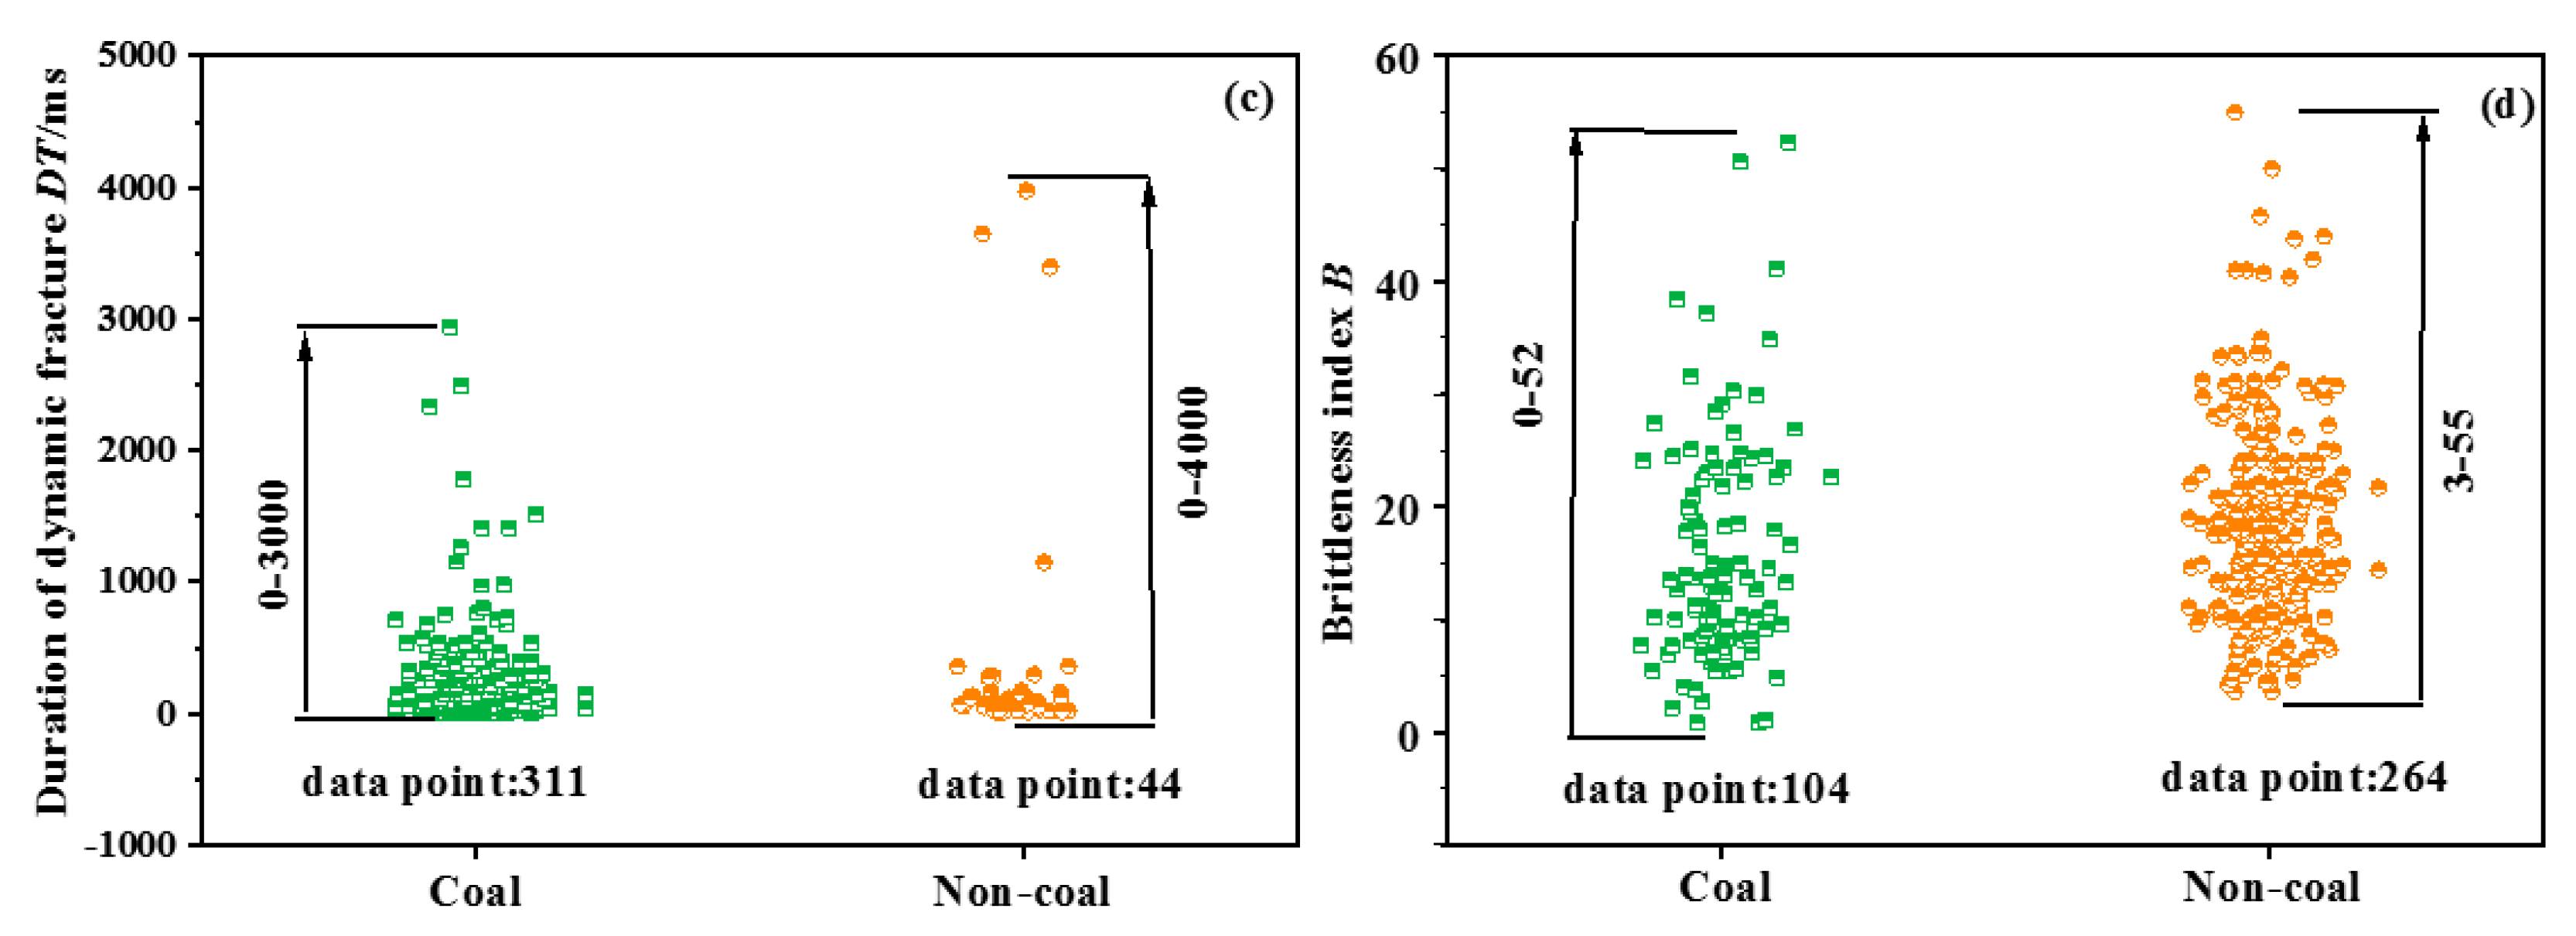
3.2. Distribution Range
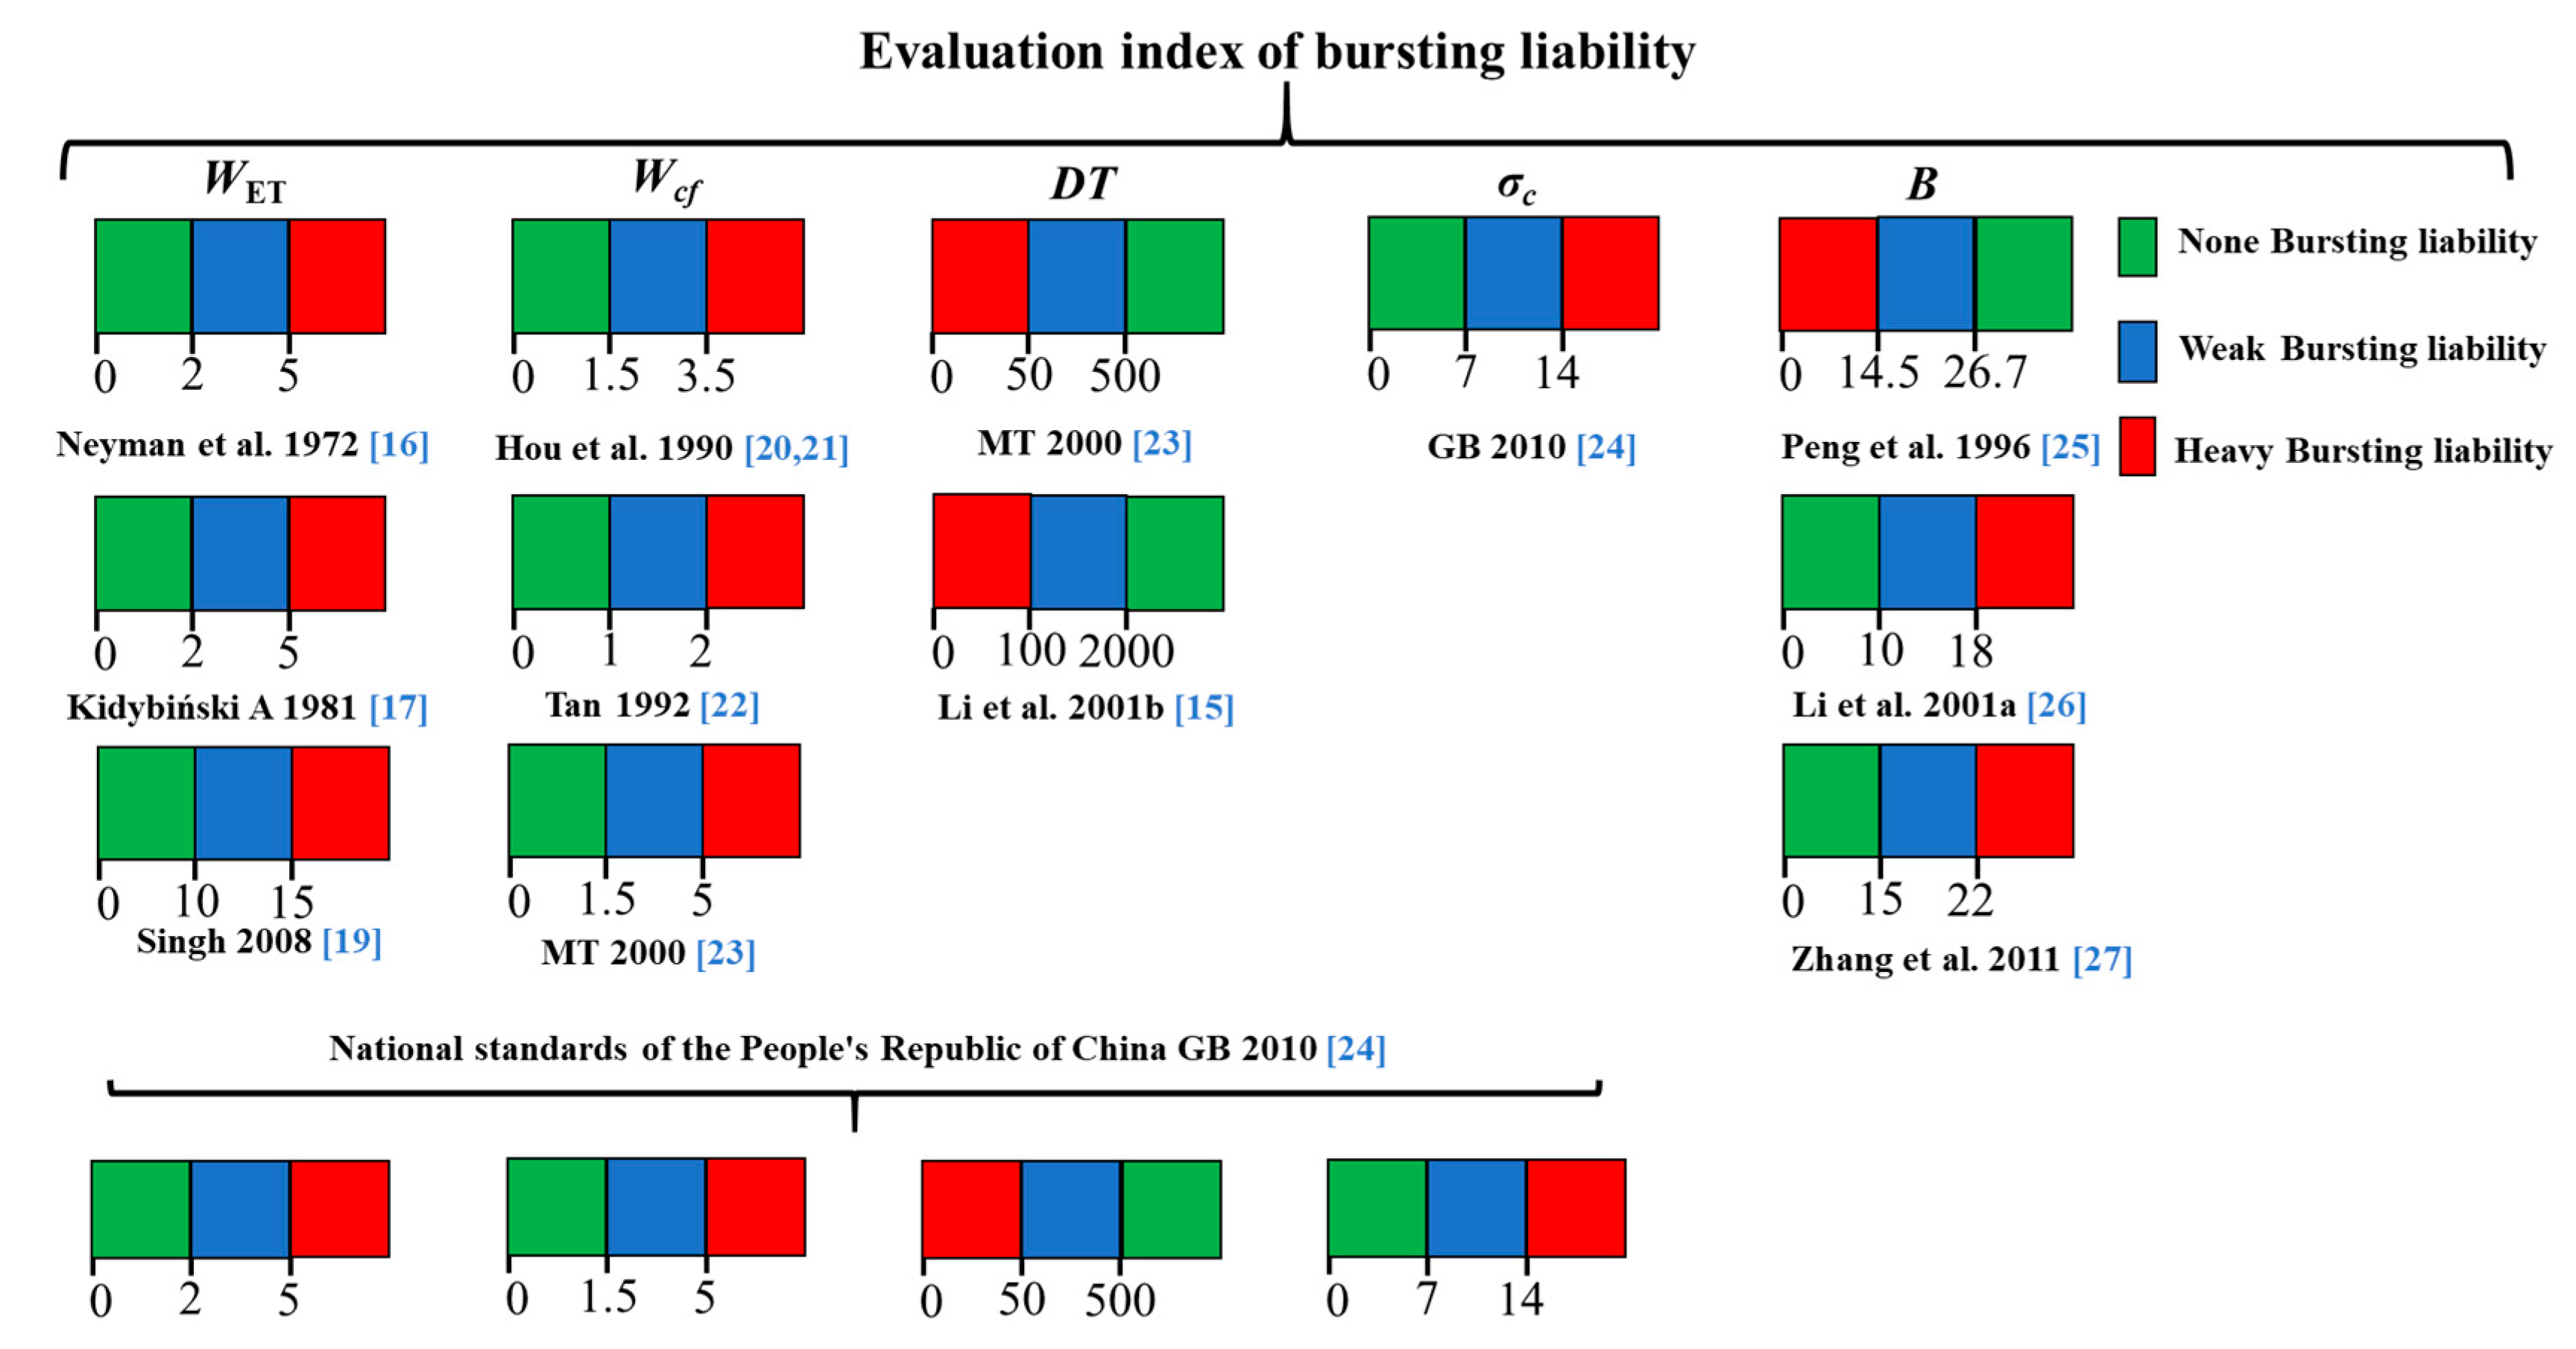
4. Classification Standards of Bursting Liability Indices
4.1. Applicability and Uniformity of Bursting Liability
4.1.1. Bursting Liabilities of Non-Coal Rocks Using Classification Criterions of Coals
4.1.2. Uniformity of Bursting Liability Classification Results Using Different Indices
4.2. Classification Criterions of Bursting Liabilities for Non-Coal Rocks
4.2.1. Bursting Liability Criteria of Elastic Strain Energy Index WET and Bursting Energy Index Wcf
4.2.2. Bursting Liability Criterion of Brittleness Index B
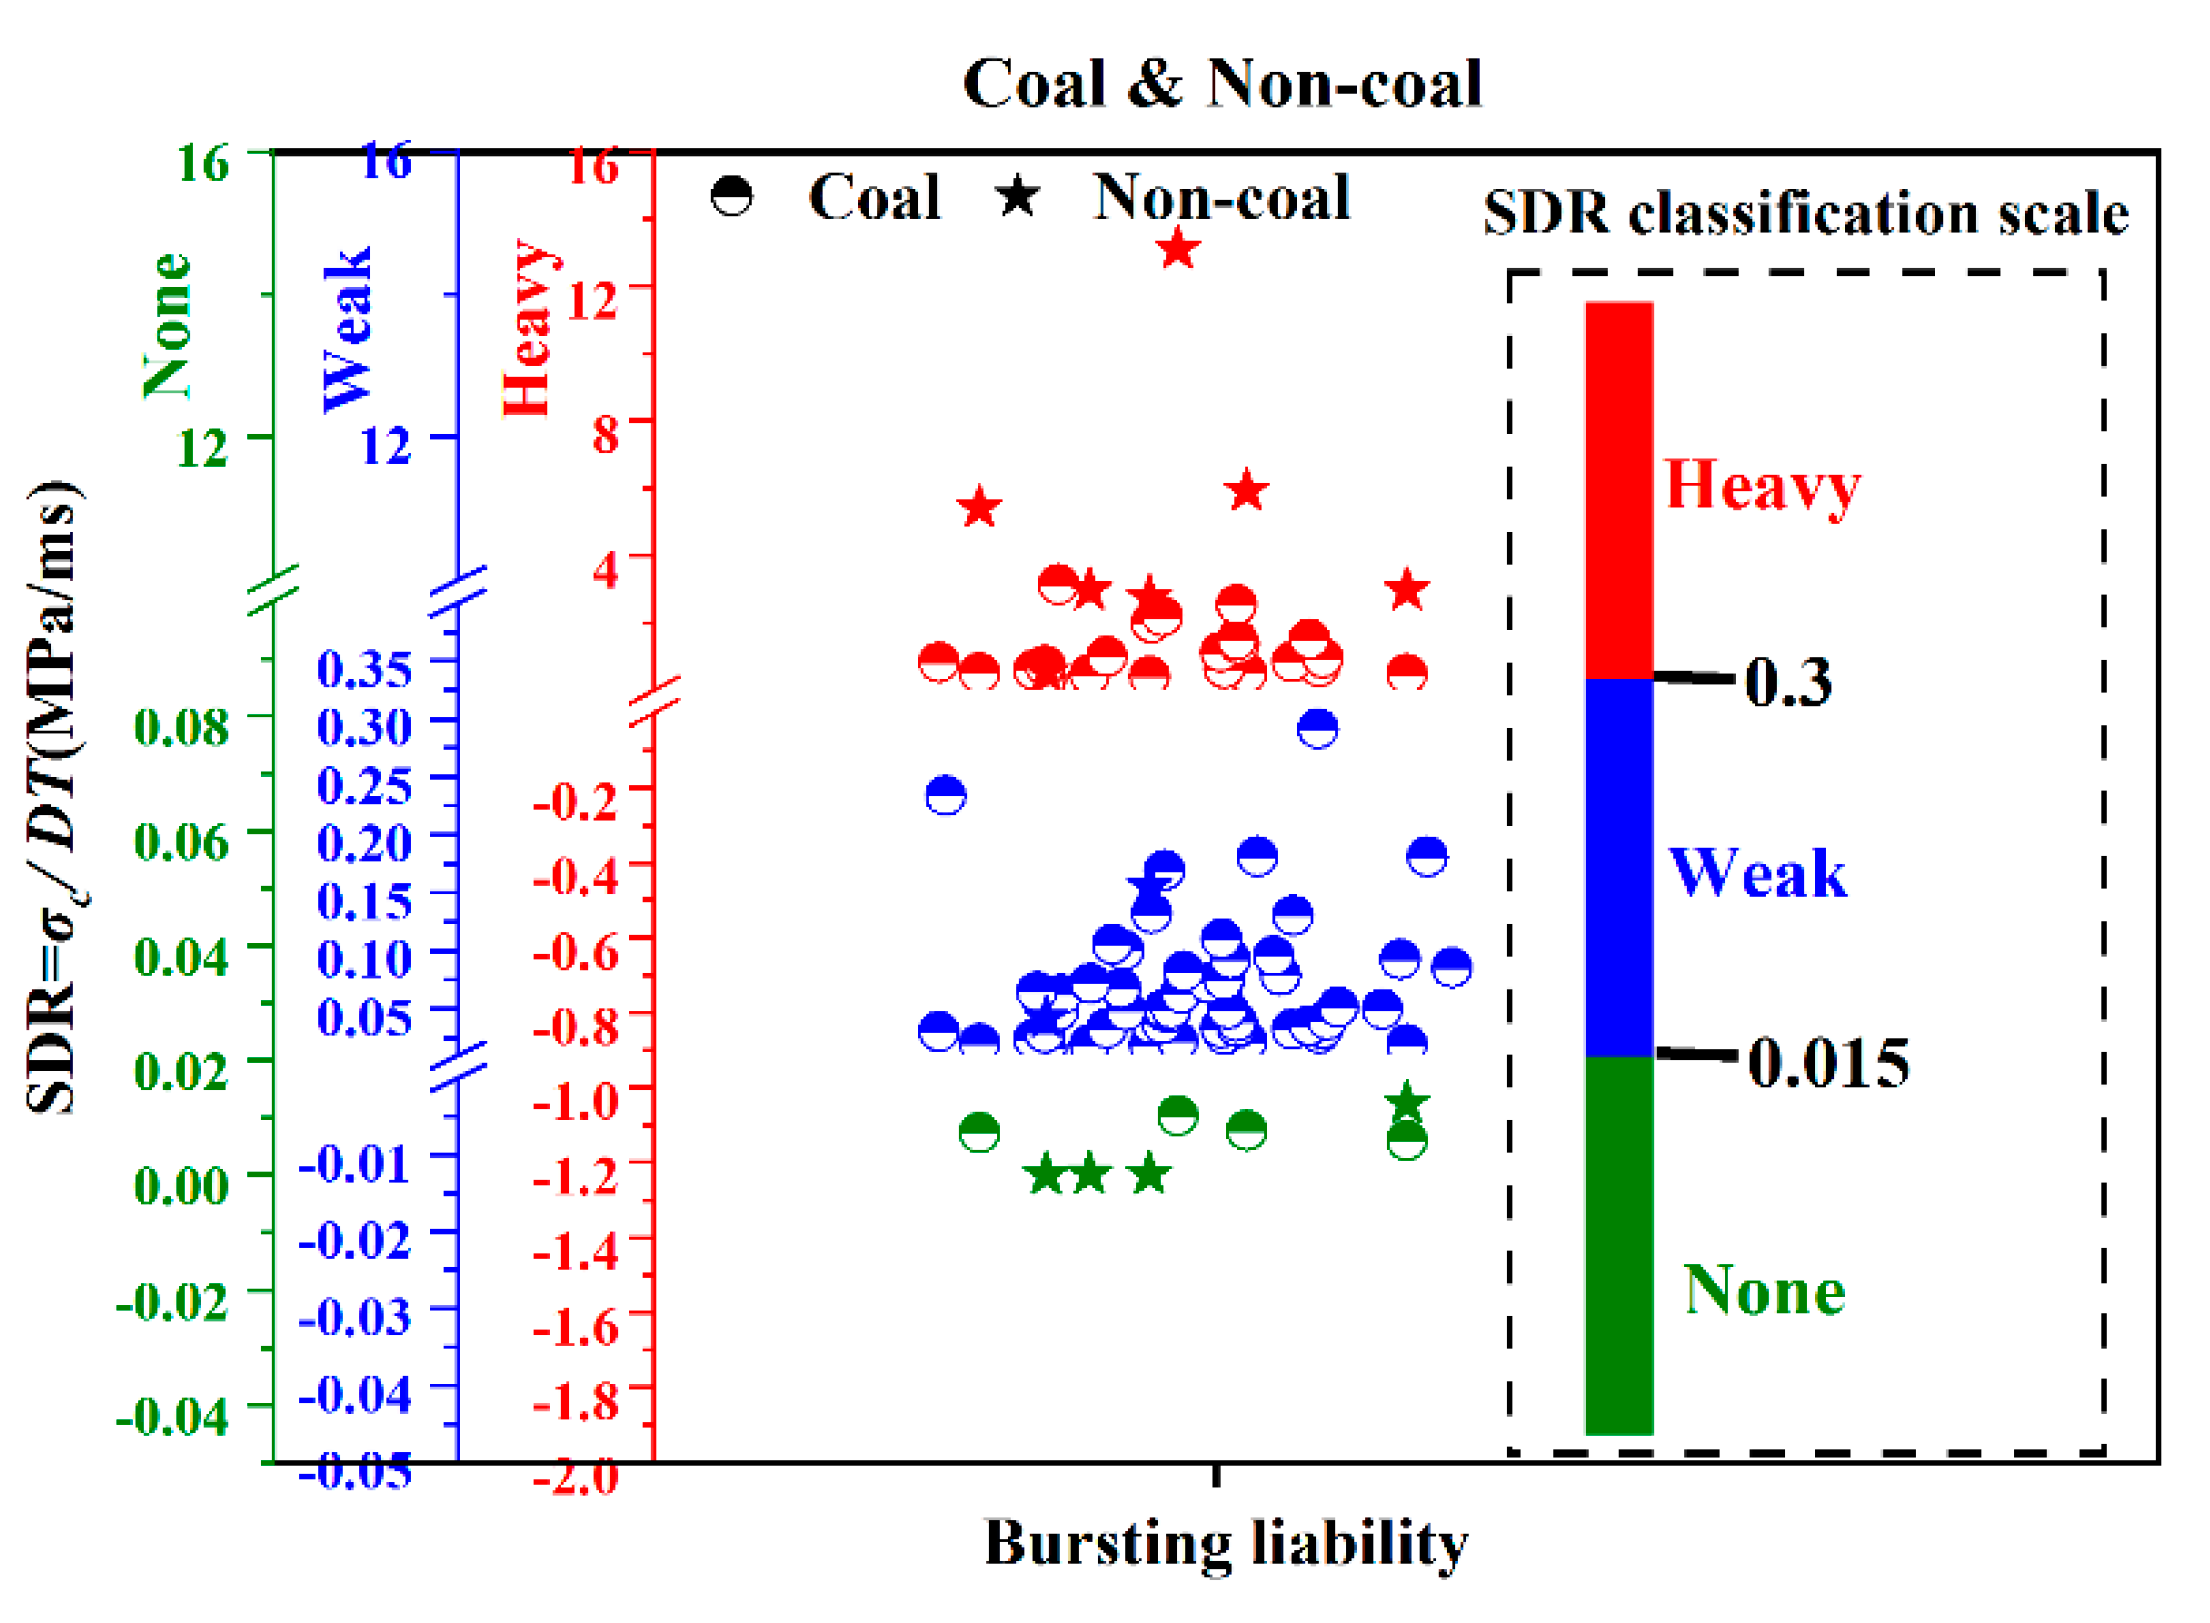
4.2.3. Bursting Liability Criterion of Strength Decrease Rate SDR
5. Discussion
5.1. Comprehensive Bursting Liability Rating of Rock
5.2. Geo-Stress Factors
6. Conclusions
- (1)
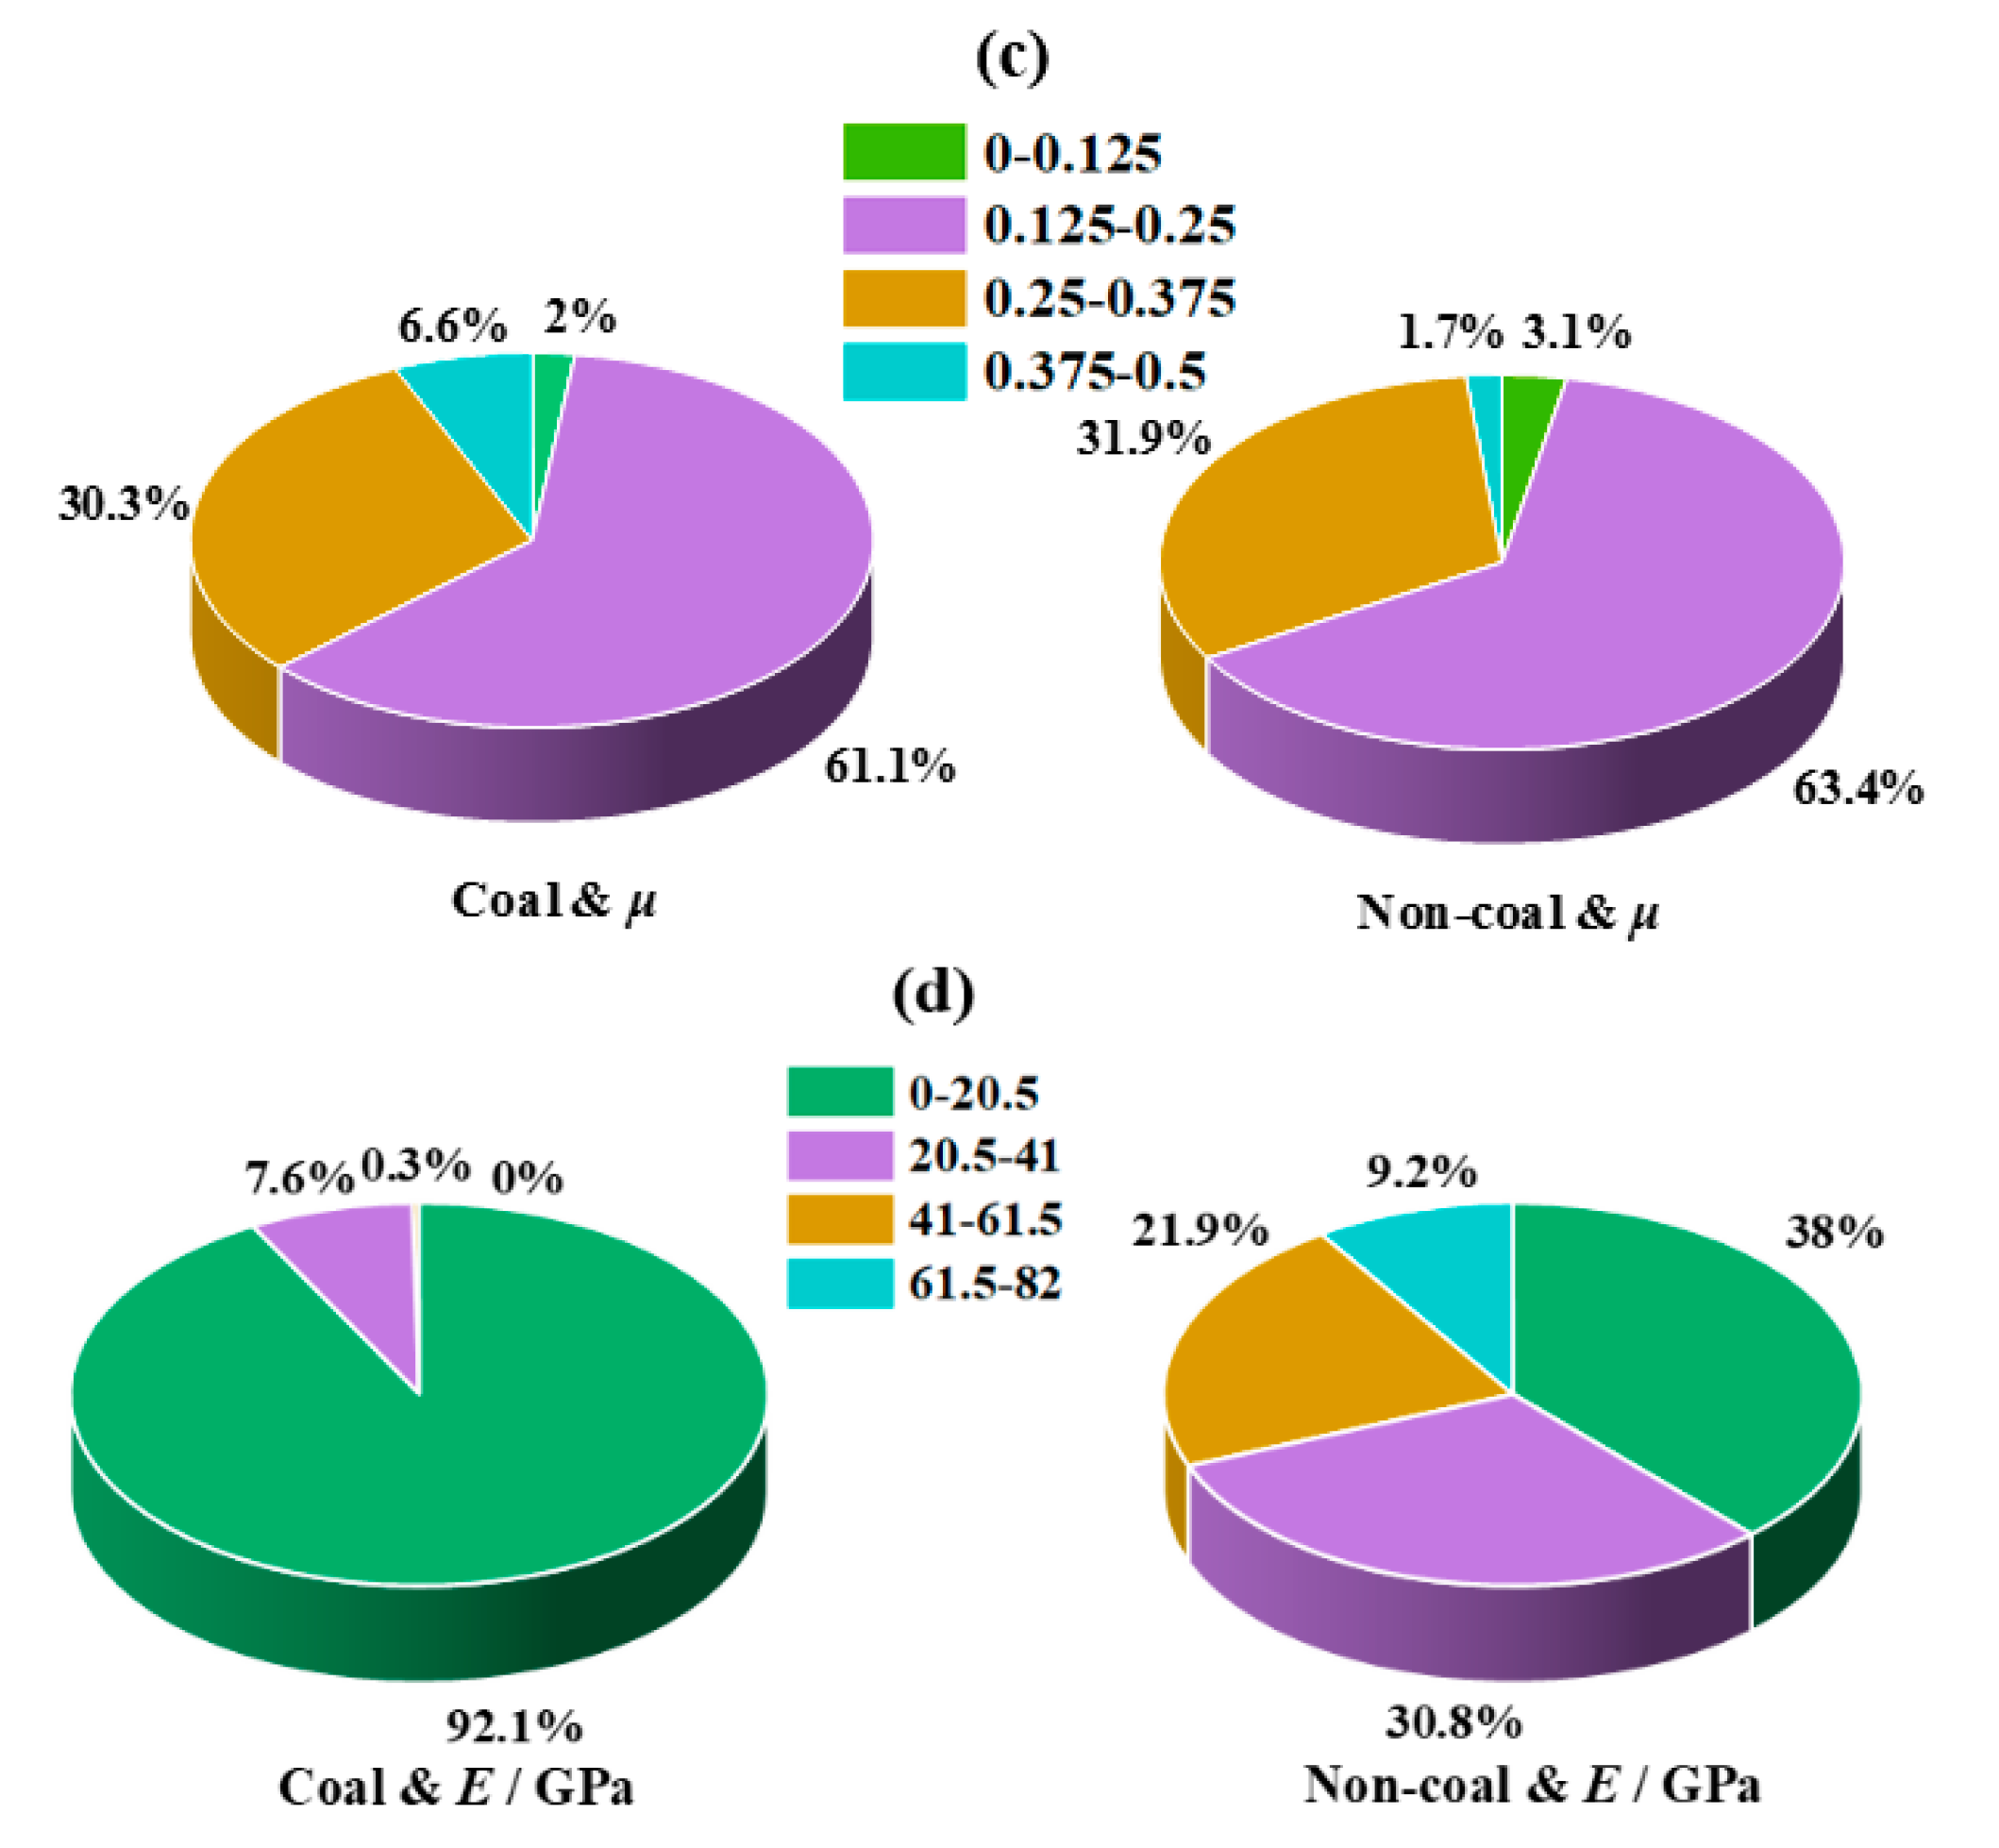
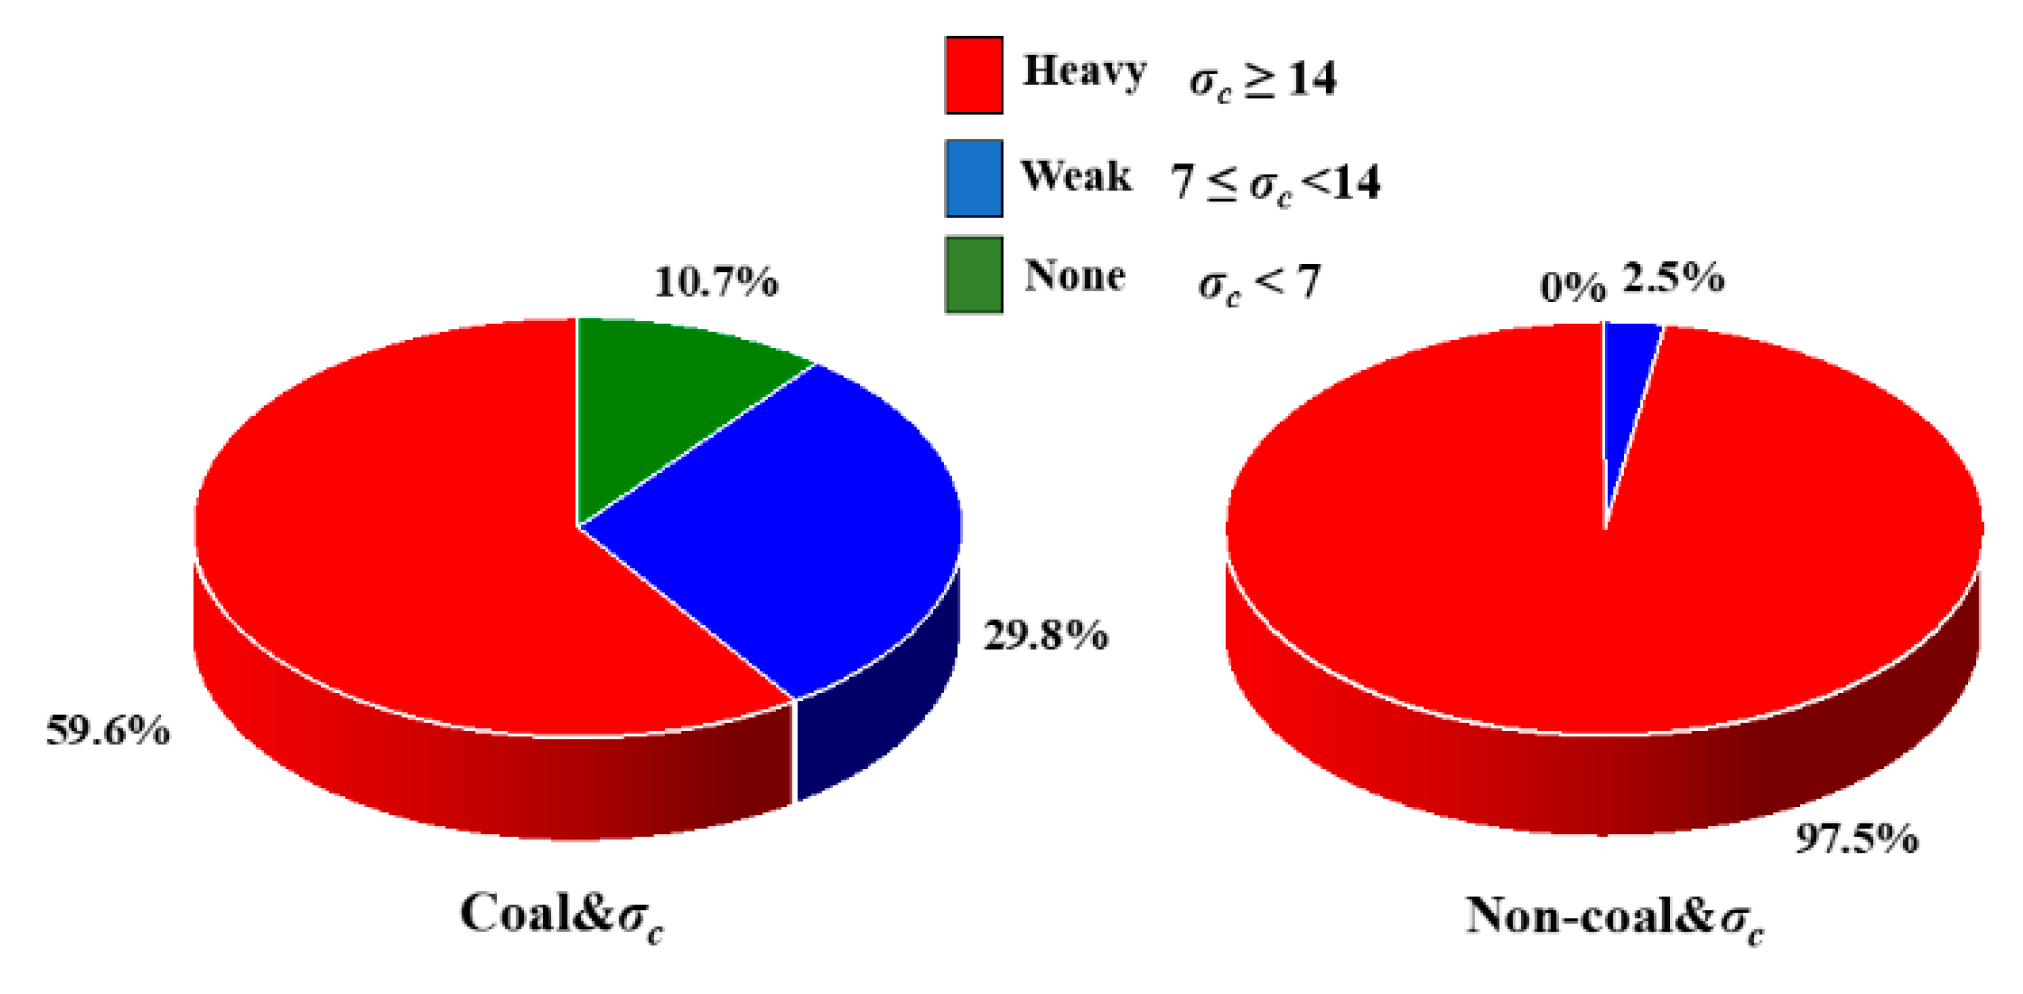
- The basic mechanical parameters (σc, E, and σt) of coal and non-coal rocks are quite different in distribution range. The σc, E, and σt maximum values of coals are 50 MPa, 46 GPa, 4 MPa, respectively. The maximum value of σc of non-coal rocks is six times higher than that of coals, and the maximum values of E and σt of non-coal rocks are about two and five times higher than that of coals, respectively. The μ values of coal and non-coal rocks share a similar distribution range.
- (2)
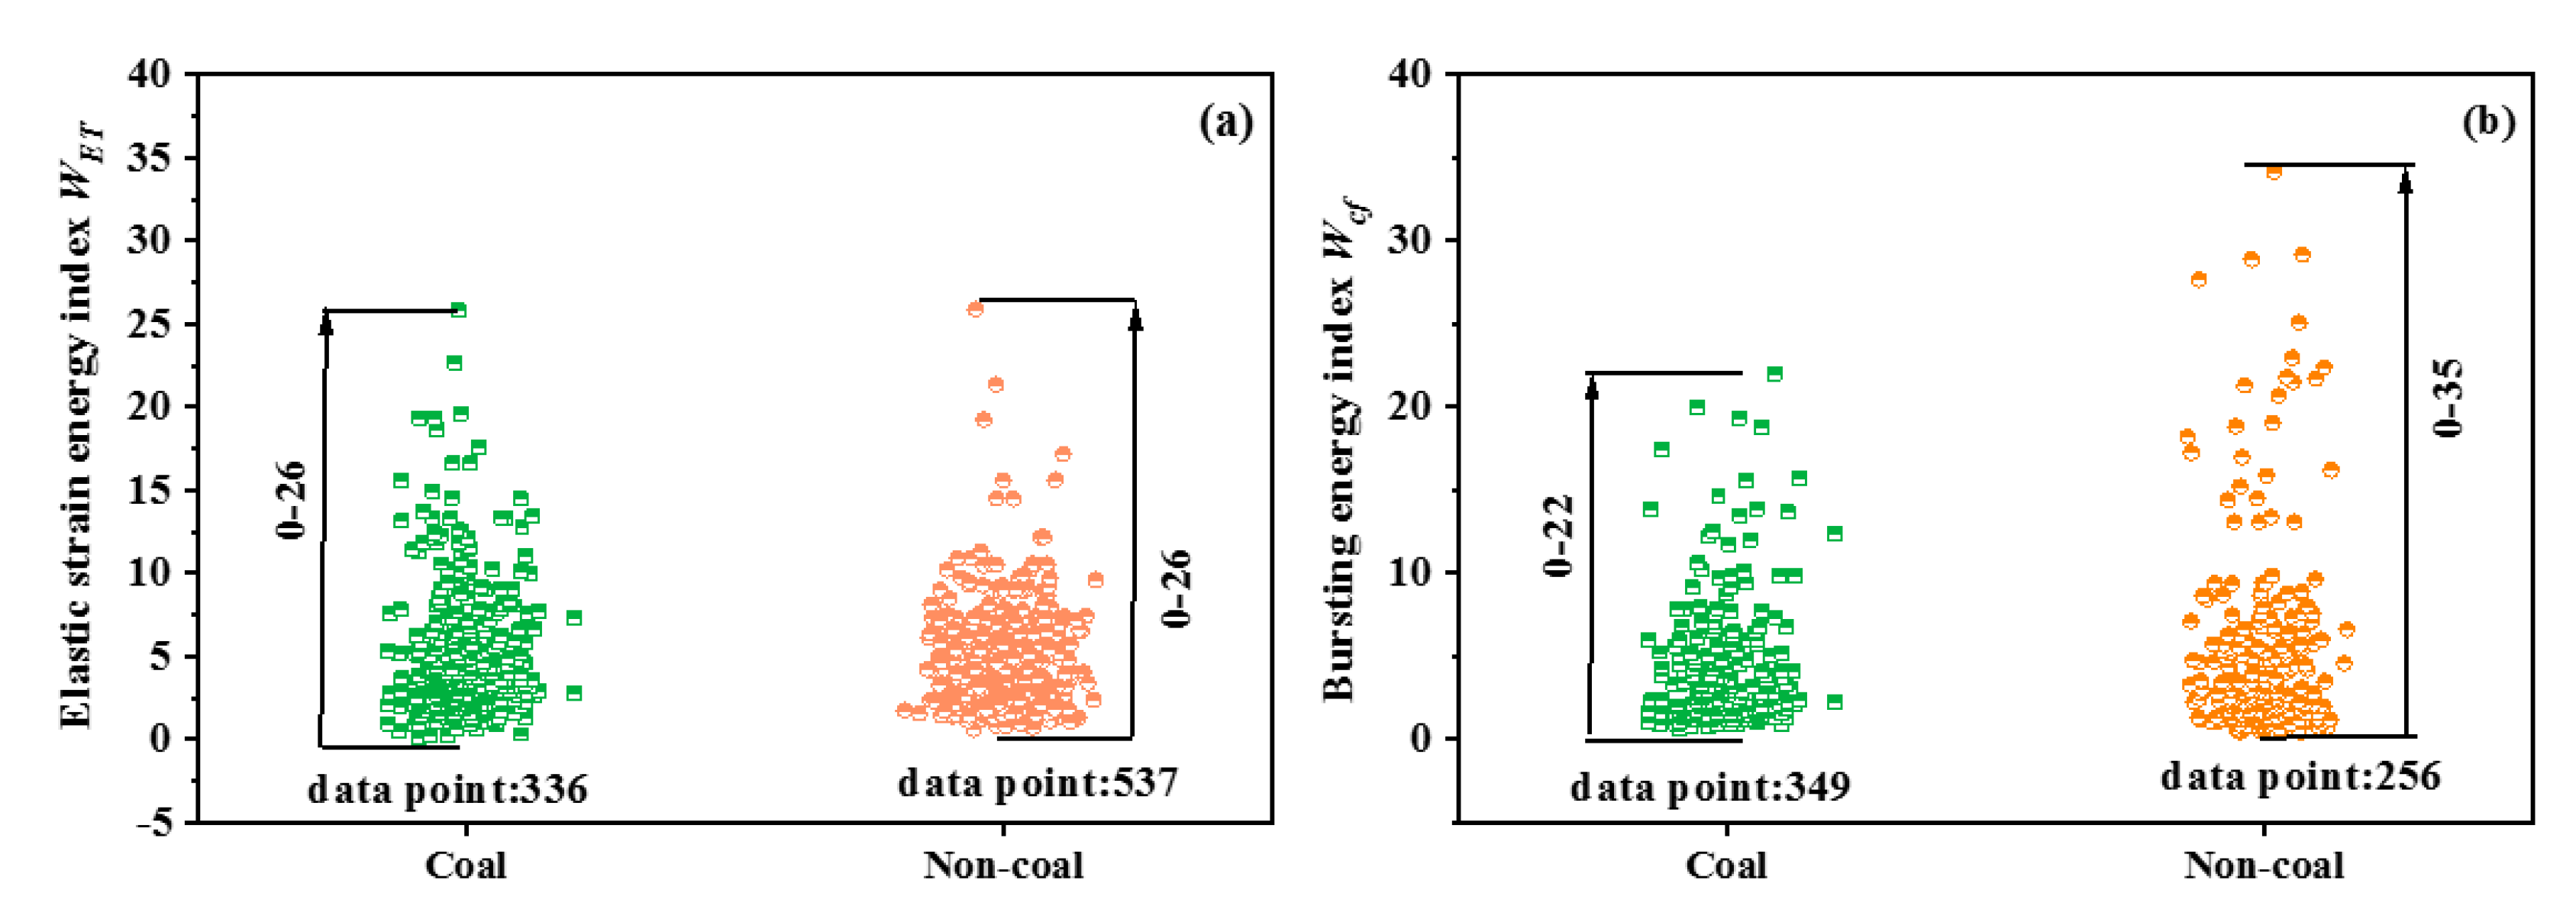
- The WET, Wcf and B of coals and non-coal rocks share similar distribution ranges, and the distribution ranges of σc and DT for coals are much smaller than these for non-coal rocks. It can be concluded that the classification criteria of WET and Wcf for coals are suitable for non-coal rocks, while that of σc and DT are not suitable.
- (3)
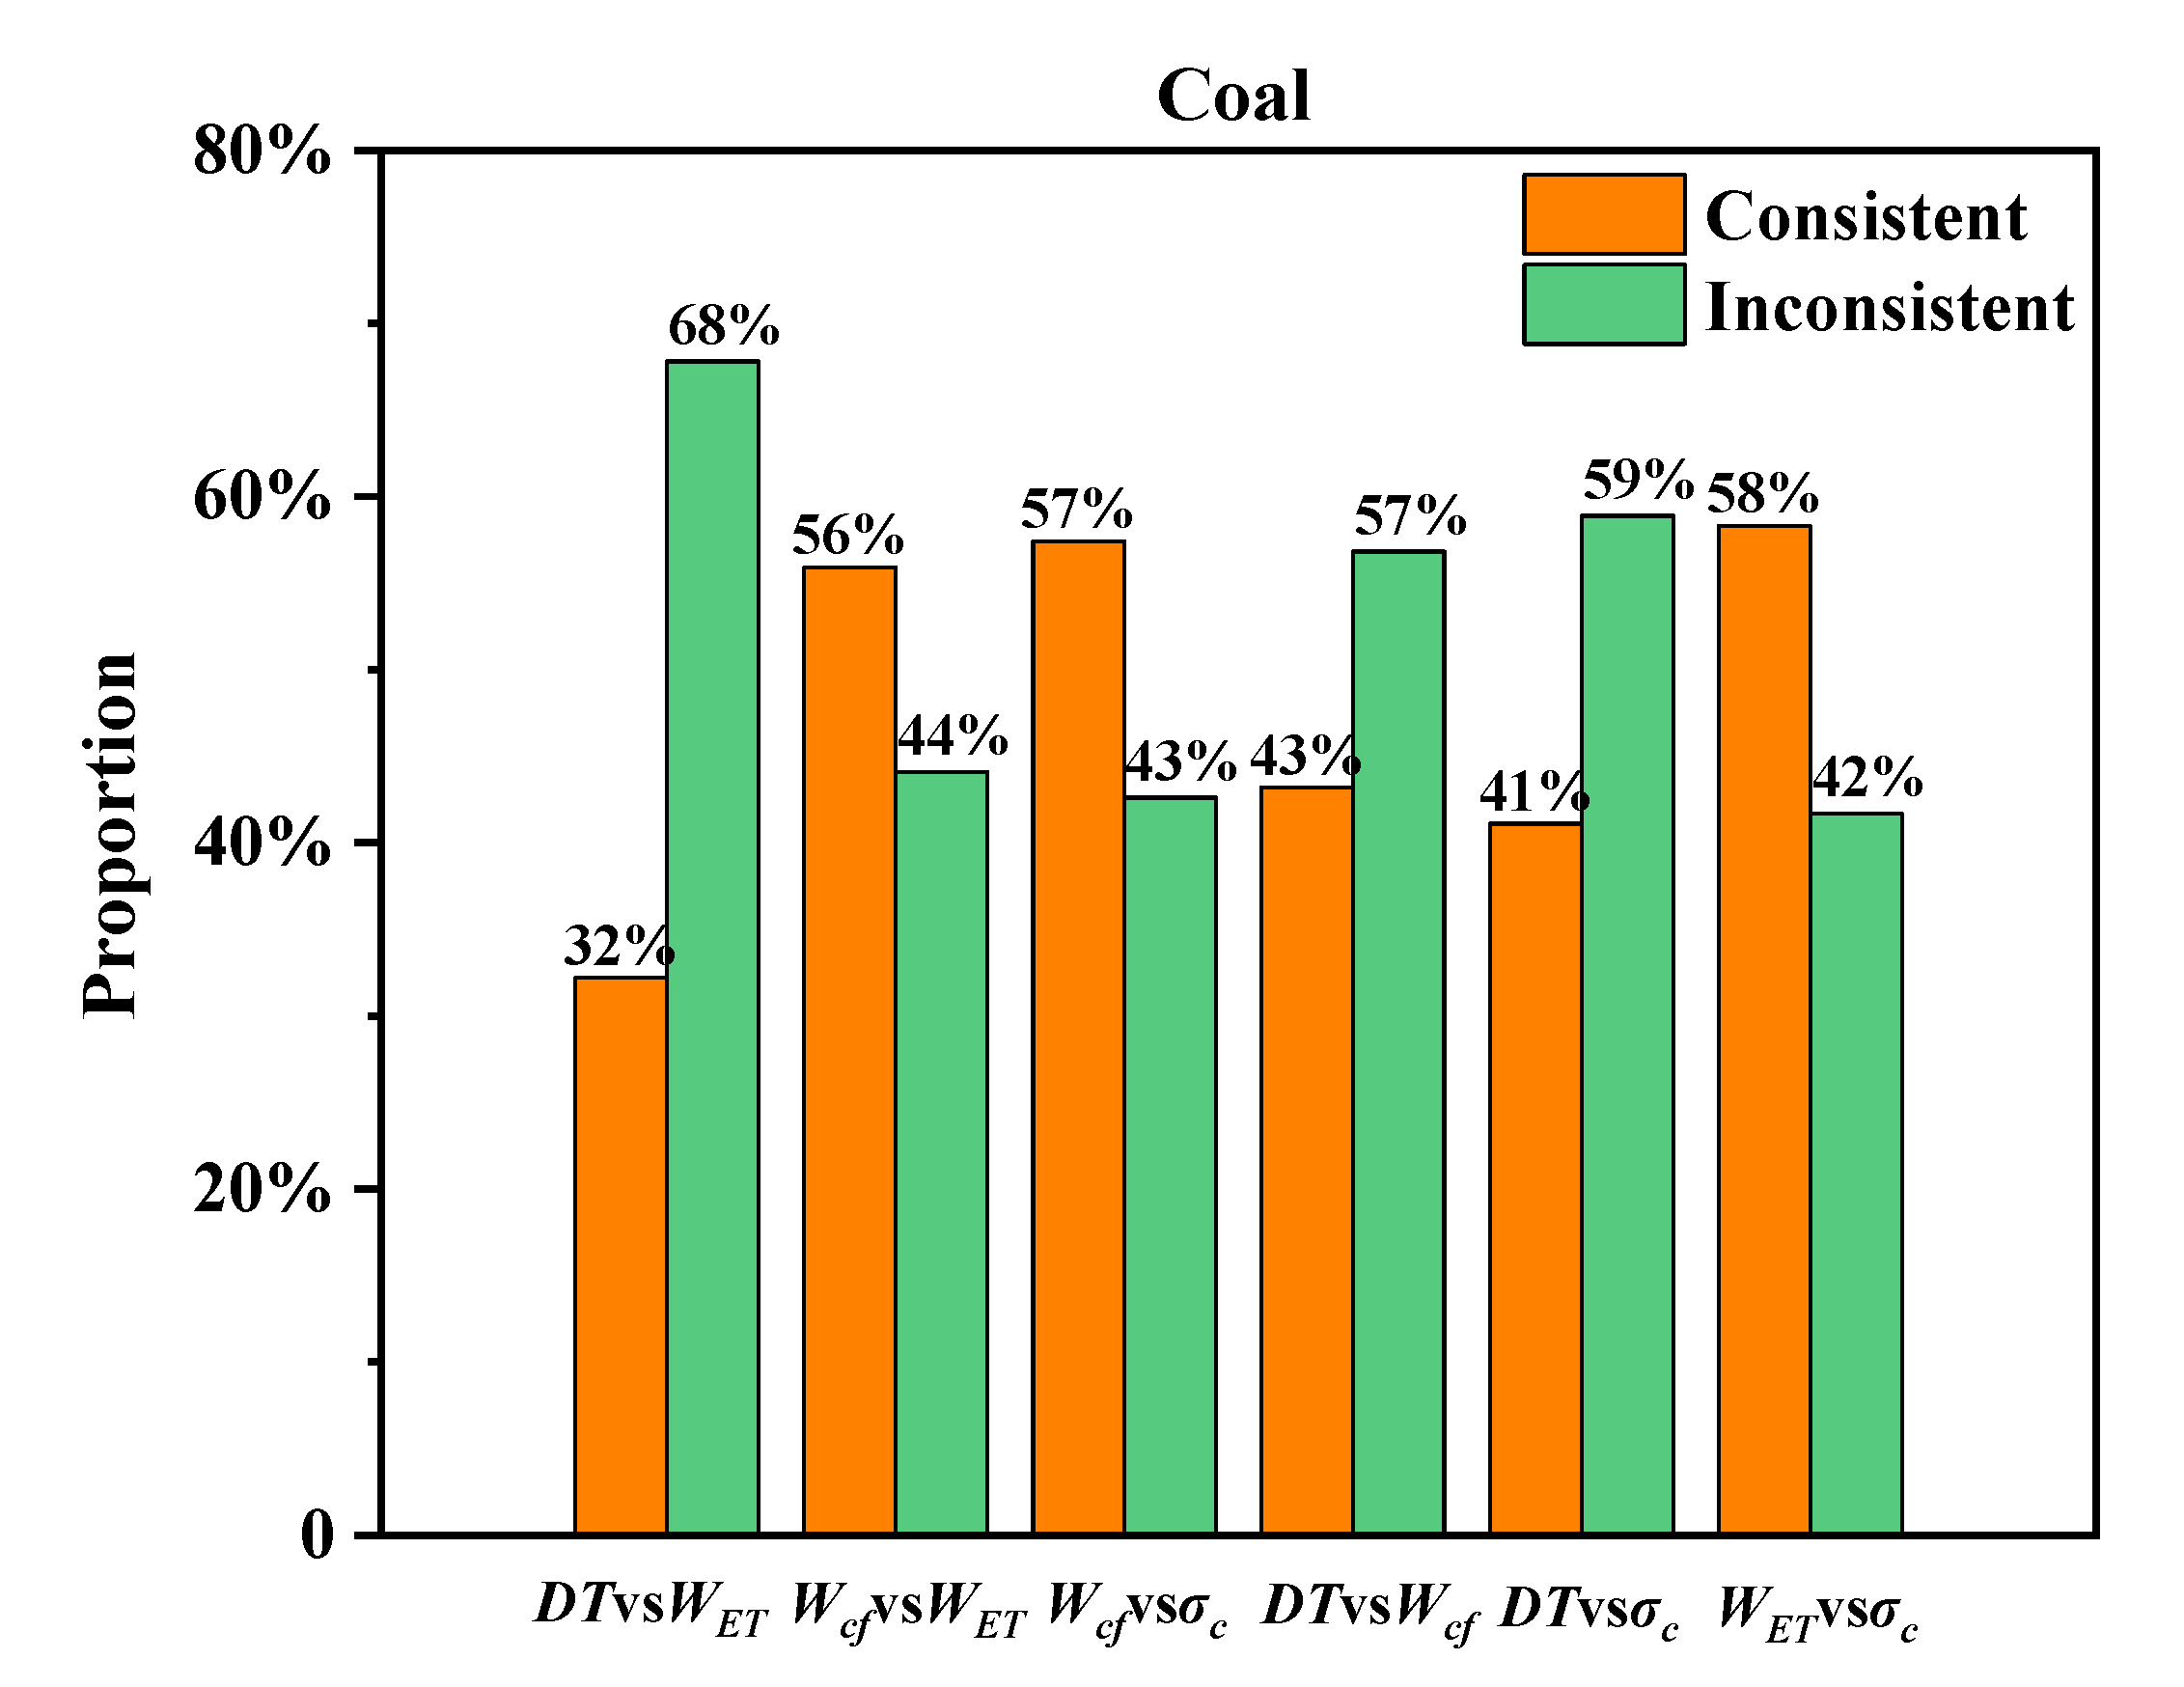
- The consistency rate of the bursting liability evaluation results of coals is only about 32–58%, and it is necessary to define a comprehensive method to evaluate the bursting liability of rocks.
- (4)
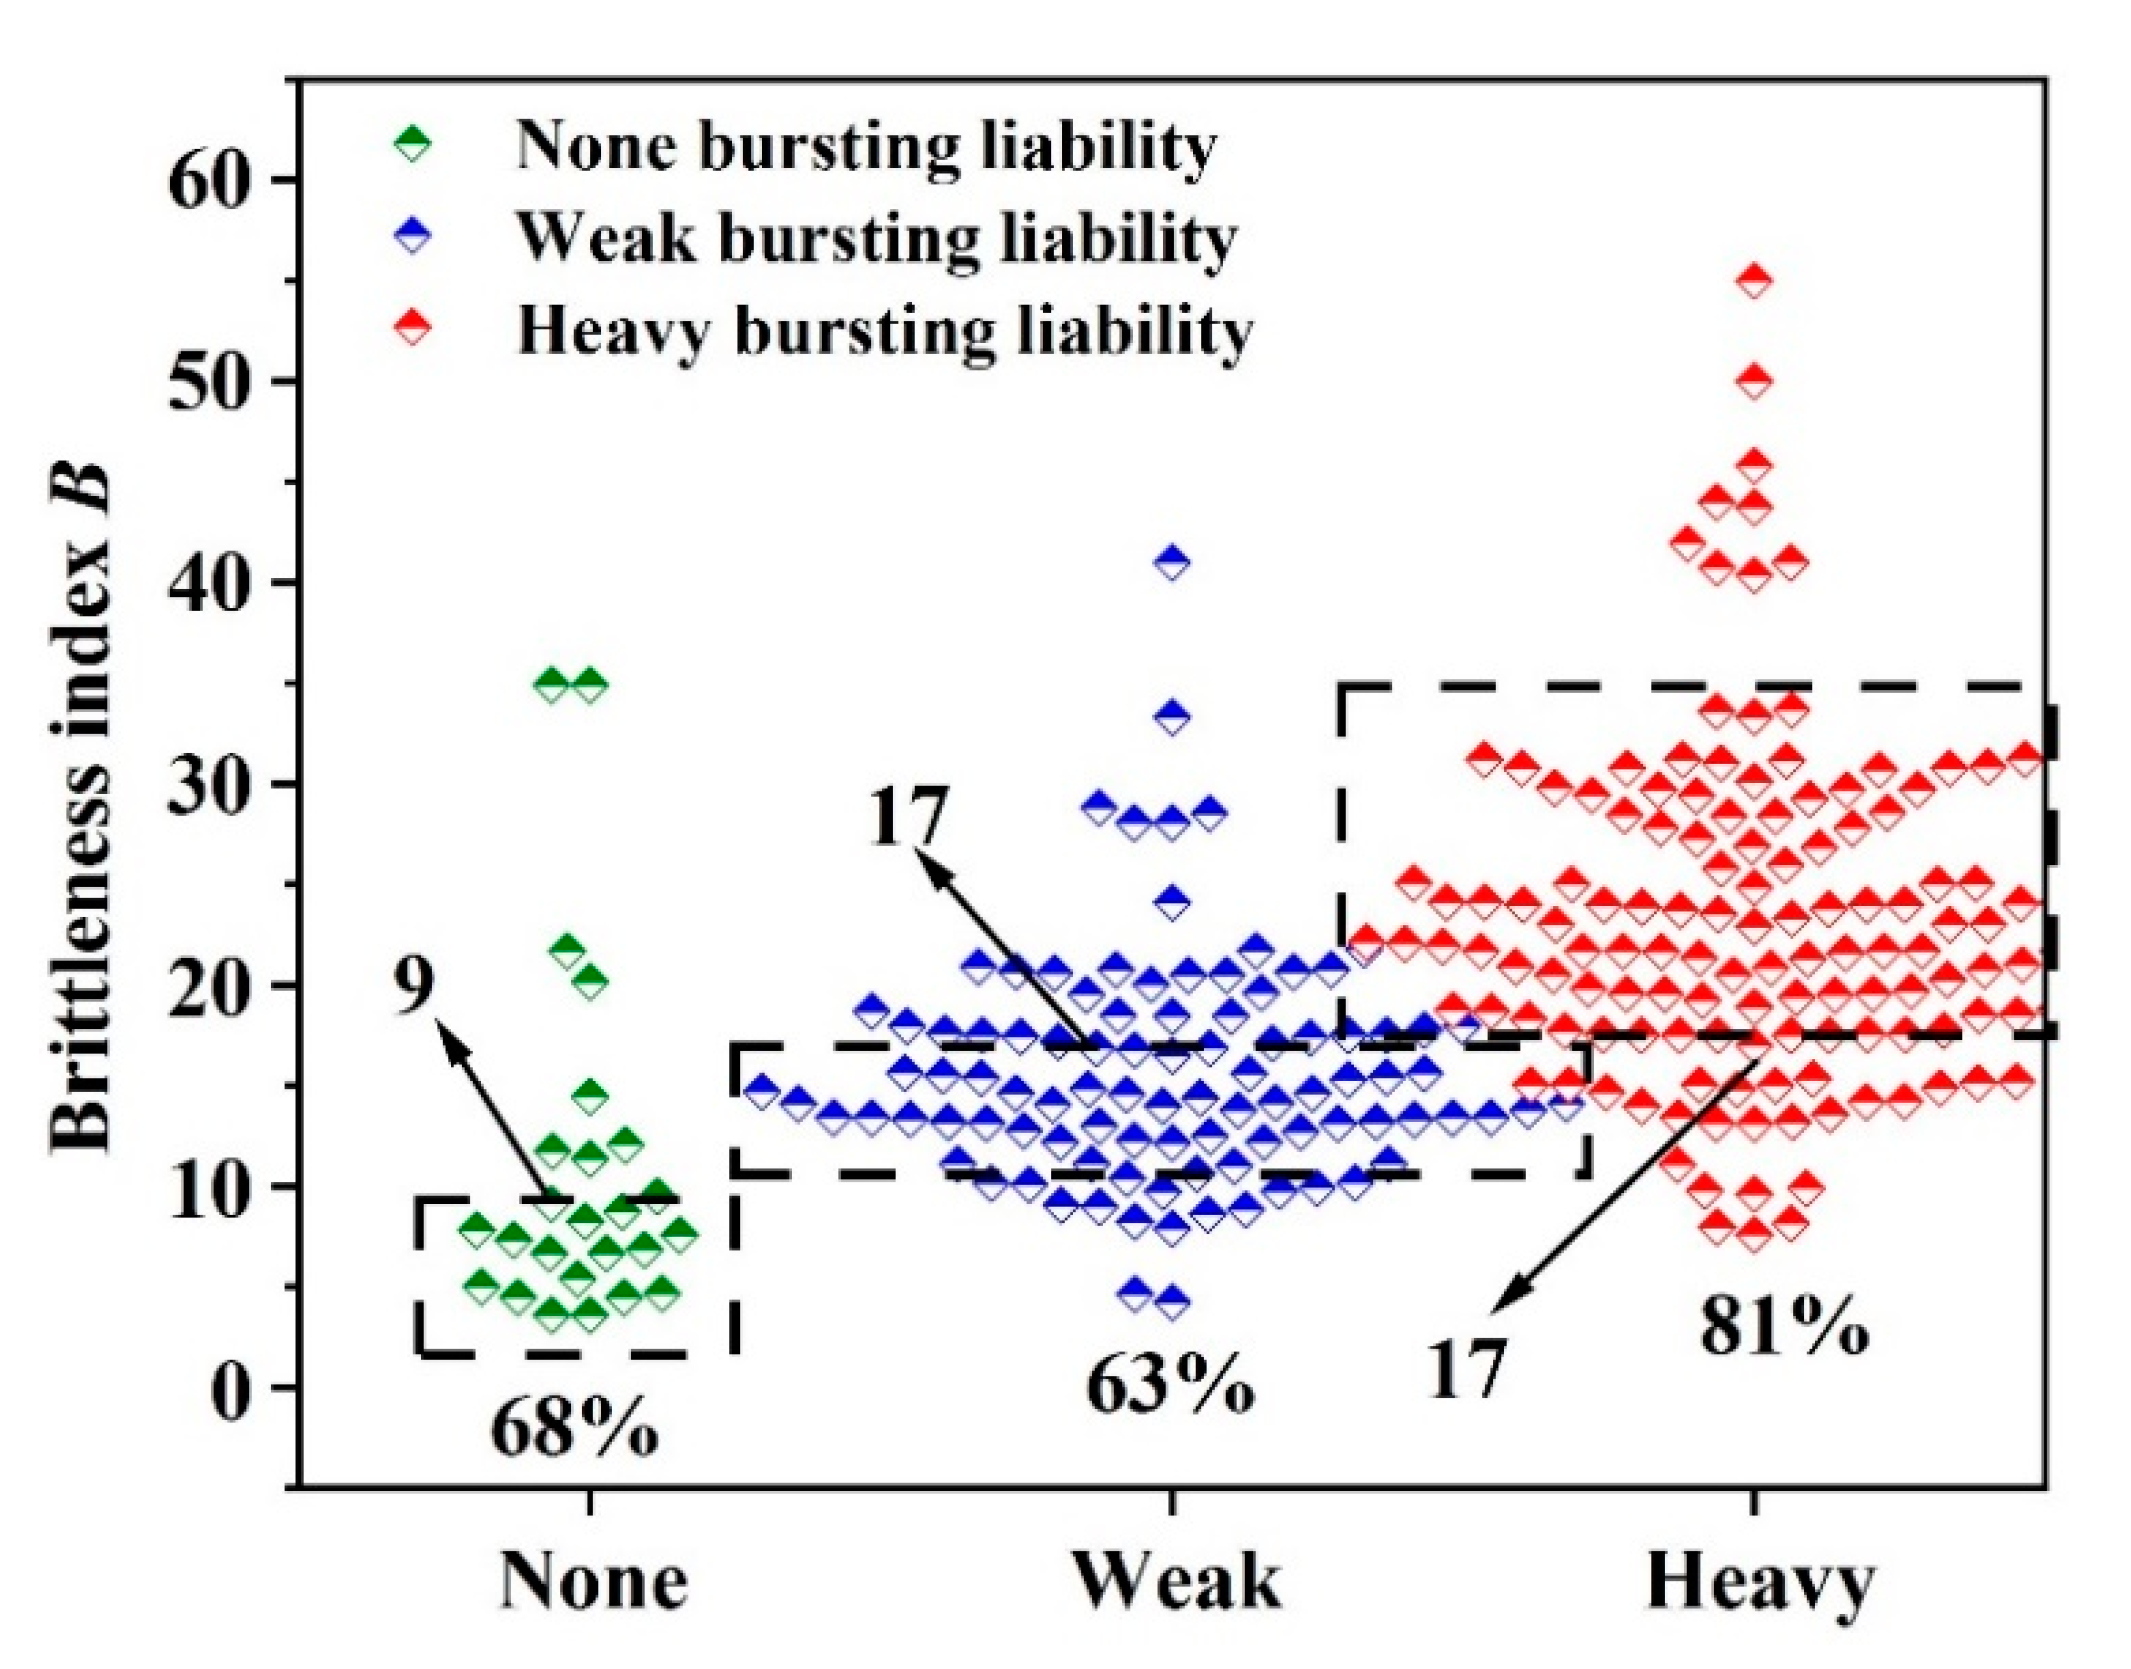
- For non-coal rocks, the classification criterions of brittleness index B and strength decreases rate SDR (the ratio of uniaxial compressive strength σc and fracture duration time DT) have been redefined in this study as follows:
- The classification criterion of the brittleness index B: heavy bursting liability with B ≥ 17; weak bursting liability with 9 ≤ B < 17; no bursting liability with B < 9.
- The classification criterion of the strength decrease rate SDR: heavy bursting liability with SDR > 0.3 MPa/ms; weak bursting liability with 0.015 < SDR ≤ 0.3 MPa/ms; no bursting liability with 0 < SDR ≤ 0.015 MPa/ms.
Supplementary Materials
Author Contributions
Funding
Institutional Review Board Statement
Informed Consent Statement
Data Availability Statement
Conflicts of Interest
References
- Gong, F.; Wu, W.; Li, T.; Si, X. Experimental simulation and investigation of spalling failure of rectangular tunnel under different three-dimensional stress states. Int. J. Rock Mech. Min. Sci. 2019, 122, 104081. [Google Scholar] [CrossRef]
- Gong, F.Q.; Yan, J.Y.; Luo, S.; Li, X.B. Investigation on the linear energy storage and dissipation laws of rock materials under uniaxial compression. Rock Mech. Rock Eng. 2019, 52, 4237–4255. [Google Scholar] [CrossRef]
- Cai, X.; Zhou, Z.; Du, X. Water-induced variations in dynamic behavior and failure characteristics of sandstone subjected to simulated geo-stress. Int. J. Rock Mech. Min. Sci. 2020, 130, 104339. [Google Scholar] [CrossRef]
- Qi, Q.X.; Li, Y.Z.; Zhao, S.K. Seventy years development of coal mine rockburst in China: Establishment and consideration of theory and technology system. Coal Sci. Technol. 2019, 47, 1–40. [Google Scholar]
- Jiang, R.; Dai, F.; Liu, Y.; Li, A. Fast marching method for microseismic source location in cavern-containing rockmass: Performance analysis and engineering application. Engineering. 2021. [Google Scholar] [CrossRef]
- Singh, S.P. The influence of rock properties on the occurrence and control of rockbursts. Min. Sci. Technol. 1987, 5, 11–18. [Google Scholar] [CrossRef]
- Cai, X.; Zhou, Z.; Zang, H. Water saturation effects on dynamic behavior and microstructure damage of sandstone: Phenomena and mechanisms. Eng. Geol. 2020, 276, 105760. [Google Scholar] [CrossRef]
- Qiu, J.; Li, X.; Li, D.; Zhao, Y.; Hu, C.; Liang, L. Physical Model Test on the Deformation Behavior of an Underground Tunnel Under Blasting Disturbance. Rock Mech. Rock Eng. 2020. [Google Scholar] [CrossRef]
- Lizhong, T.; Wenxing, W. New rock burst proneness index. Chin. J. Rock Mech. Eng. 2002, 21, 874–878. [Google Scholar]
- Du, K.; Li, X.; Yang, C.; Zhou, J.; Chen, S.; Manoj, K. Experimental investigations on mechanical performance of rocks under fatigue loads and biaxial confinements. J. Cent. South Univ. 2020, 27, 2985–2998. [Google Scholar] [CrossRef]
- Gong, F.; Yan, J.; Li, X.; Luo, S. A peak-strength strain energy storage index for rock burst proneness of rock materials. Int. J. Rock Mech. Min. Sci. 2019, 117, 76–89. [Google Scholar] [CrossRef]
- Liu, N.; Zhang, C.S.; Chu, W.J.; Wu, X.M.; Zhang, C.Q. Influence of mechanical characteristics of deep-buried marble on rockburst occurrence conditions. Rock Soil Mech. 2013, 34, 2638–2643. [Google Scholar]
- Du, K.; Yang, C.; Su, R.; Tao, M.; Wang, S. Failure properties of cubic granite, marble, and sandstone specimens under true triaxial stress. Int. J. Rock Mech. Min. Sci. 2020, 130, 104309. [Google Scholar] [CrossRef]
- Zhang, W.B.; Wang, S.; Teng, X. Progress of research for prevention of rock burst in China. J. China Coal Soc. 1992, 17, 27–36. [Google Scholar]
- Lin, L.S. Experimental Study of Dynamics Damage on Rock Burst Tendency. J. Liaoning Tech. Univ. 2001, 436–438. [Google Scholar]
- Neyman, B.; Szecówka, Z.; Zuberek, W. Effective methods for fighting rock burst in Polish collieries. In Proceedings of the Fifth International Strata Control Conference, London, UK, 21 August 1972. [Google Scholar]
- Kidybiński, A. Bursting liability indices of coal. Int. J. Rock Mech. Min. Sci. 1981, 18, 295–304. [Google Scholar] [CrossRef]
- Cook, N.G.W. The basic mechanics of rockbursts. Min. Metall. 1966, 66, 56–70. [Google Scholar]
- Singh, S.P.; Sharma, A.; Wei, L. Alleviation of Rock Bursts by Identifying Burst-Prone Mine Workings. In Proceedings of the 27th International Conference on Ground Control in Mining, Morgantown, WV, USA, 29–31 July 2008. [Google Scholar]
- Hou, F.-L.; Song, Y.-L. The complete Stress-strain Respons on the Rock and the Analysis of Rockburst Tendency Index. In Proceedings of the CSME Mechanical Engineering Forum 1990, Toronto, ON, Canada, 3–9 June 1990. [Google Scholar]
- Hou, F.-L.; Liu, X.-M.; Wang, M. Genetic reanalysis and intensity division of rockburst. In Proceedings of the 3rd National Academic Conference on Rock Mechanics, Guilin, China, November 1992. [Google Scholar]
- Yi-an, T. Discussion on energy impact index of rock bursting rock. Hydrogeol. Eng. Geol. 1992, 19, 10–12. (In Chinese) [Google Scholar]
- MT/T174-2000. Classification and Laboratory Test Method on Bursting Liability of Coal; PRC Coal Industry Standard: Beijing, China, 2000. (In Chinese) [Google Scholar]
- GB/T25217.2-2010. Methods for Test, Monitoring and Prevention of Rock Burst Part 2: Classification and Laboratory Test Method on Bursting Liability of Coal; Standards Press of China: Beijing, China, 2010. (In Chinese) [Google Scholar]
- Zhu, P.; Yuanhan, W.; Tingjie, L. Griffih theory and the criteria of rock burst. Chin. J. Rock Mech. Eng. 1996, 15, 491–495. [Google Scholar]
- Li, S.L.; Feng, X.T.; Wang, Y.J.; Yang, N.G. Evaluation of Rockburst Proneness in a Deep Hard Rock Mine. J. Northeast. Univ. 2001, 2, 60–63. [Google Scholar]
- Zhang, J.J.; Fu, B.J.; Li, Z.K.; Song, S.W.; Shang, Y.J. Criterion and Classification for Strain Mode Rockbursts Based on Five-Factor Comprehensive Method; The Chinese Society for Rock Mechanics and Engineering: Beijing, China; The Society for Rock Mechanics & Engineering Geology: Singapore, 2011. [Google Scholar]
- Lee, P.K.; Tsui, Y.; Tham, L.G.; Li, W.D. Method of fuzzy comprehensive evaluations for rock burst prediction. Chin. J. Rock Mech. Eng. 1998, 17, 493–501. [Google Scholar]
- Dou, L.M.; He, X.Q. Theory and Technology of Rock Burst Prevention and Control; China University of Mining and Technology Press: Beijing, China, 2001. [Google Scholar]
- Du, K.; Su, R.; Tao, M.; Yang, C.; Momeni, A.; Wang, S. Specimen shape and cross-section effects on the mechanical properties of rocks under uniaxial compressive stress. Bull. Eng. Geol. Environ. 2019, 78, 6061–6074. [Google Scholar] [CrossRef]
- Du, K.; Liu, M.; Yang, C.; Tao, M.; Feng, F.; Wang, S. Mechanical and Acoustic Emission (AE) Characteristics of Rocks under Biaxial Confinements. Appl. Sci. 2021, 11, 769. [Google Scholar] [CrossRef]
- Wang, S.; Sun, L.; Li, X.; Wang, S.; Kun, D.; Xiang, L.; Fan, F. Experimental investigation of cuttability improvement for hard rock fragmentation using conical cutter. Int. J. Geomech. 2021, 21, 06020039. [Google Scholar] [CrossRef]
- Wang, S.; Huang, L.; Li, X. Analysis of rockburst triggered by hard rock fragmentation using a conical pick under high uniaxial stress. Tunn. Undergr. Space Technol. 2020, 96, 103195. [Google Scholar] [CrossRef]
- Wang, S.; Li, X.; Yao, J.; Gong, F.; Li, X.; Du, K.; Tao, M.; Huang, L.; Du, S. Experimental investigation of rock breakage by a conical pick and its application to non-explosive mechanized mining in deep hard rock. Int. J. Rock Mech. Min. Sci. 2019, 122, 104063. [Google Scholar] [CrossRef]
- Pan, J.-F.; Jian, J.-F.; Liu, S.-H.; Zhao, W.-G.; Yuan, S.-S.; Wang, H.-T.; Liu, H. Geological Characteristic and Control of Rock Burst of Huanglong Jurassic Coal Mine Field. J. Min. Strat. Control Eng. 2019, 24, 110–115. [Google Scholar]
- Liu, J.-X. Analysis of induced factors of “7.15” rock burst accident in Chengshan Mine. Nonferrous Met. Eng. 2013, 3, 53–56. [Google Scholar]
- Li, H.; An, Q.-M.; Ma, Y.-C. Study on Relativity between Rock Burst Stand Stress State in Deep Tunnel. In Proceedings of the 9th National Symposium on Rock Dynamics; Committee of Rock Dynamics of Chinese Society of Rock Mechanics and Engineering, Chinese Society of Rock Mechanics and Engineering: Beijing, China, 2005. [Google Scholar]
- Zheng, J.-G. Study on Rockburst Mechanism and Geomechanically Model of Traffic Auxiliary Tunnel in Jinping II Hydropower Station; Chengdu University of Technology: Chengdu, China, 2005; p. 55. [Google Scholar]
- Cao, J.-H. Analysis of Ground Stress and Rock Burst Problems in Deeply Buried Tunnels; Shanxi Water Conservancy Science and Technology: Taiyuan, China, 1997. [Google Scholar]


| Statistical Parameter | Rock Type | σc/MPa | σt/MPa | E/GPa | μ |
|---|---|---|---|---|---|
| Variance | coal | 94.19 | 0.68 | 58.41 | 0.005 |
| non-coal | 1964.89 | 12.89 | 385.65 | 0.003 | |
| Standard deviation | coal | 9.71 | 0.82 | 7.64 | 0.067 |
| non-coal | 44.33 | 3.59 | 19.64 | 0.056 | |
| Median | coal | 15.85 | 1.08 | 3.41 | 0.24 |
| non-coal | 94.10 | 6.48 | 26.23 | 0.23 | |
| Maximum | coal | 50.00 | 3.89 | 45.126 | 0.45 |
| non-coal | 313.00 | 19.07 | 81.381 | 0.455 | |
| Mean | coal | 17.46 | 1.18 | 5.87 | 0.26 |
| non-coal | 97.38 | 7.05 | 30.47 | 0.24 | |
| Minimum | coal | 1.36 | 0.07 | 0.039 | 0.09 |
| non-coal | 10.19 | 1.34 | 1.00 | 0.03 |
| Statistical Parameter | Mines | DT/ms | WET | Wcf | B |
|---|---|---|---|---|---|
| Variance | coal | 131544.10 | 16.48 | 13.56 | 81.92 |
| non-coal | 872103.17 | 8.44 | 33.01 | 77.47 | |
| Standard deviation | coal | 362.69 | 4.01 | 3.65 | 10.36 |
| non-coal | 933.86 | 2.90 | 5.75 | 8.80 | |
| Median | coal | 158.00 | 3.89 | 2.73 | 13.54 |
| non-coal | 86.03 | 4.22 | 2.84 | 17.50 | |
| Maximum | coal | 2943.00 | 25.80 | 22.00 | 52.31 |
| non-coal | 3977.00 | 25.89 | 34.18 | 55.00 | |
| Mean | coal | 261.89 | 5.19 | 4.07 | 16.42 |
| non-coal | 378.13 | 4.77 | 5.00 | 18.53 | |
| Minimum | coal | 0.09 | 0.15 | 0.66 | 2.19 |
| non-coal | 4.87 | 0.60 | 0.44 | 3.60 |
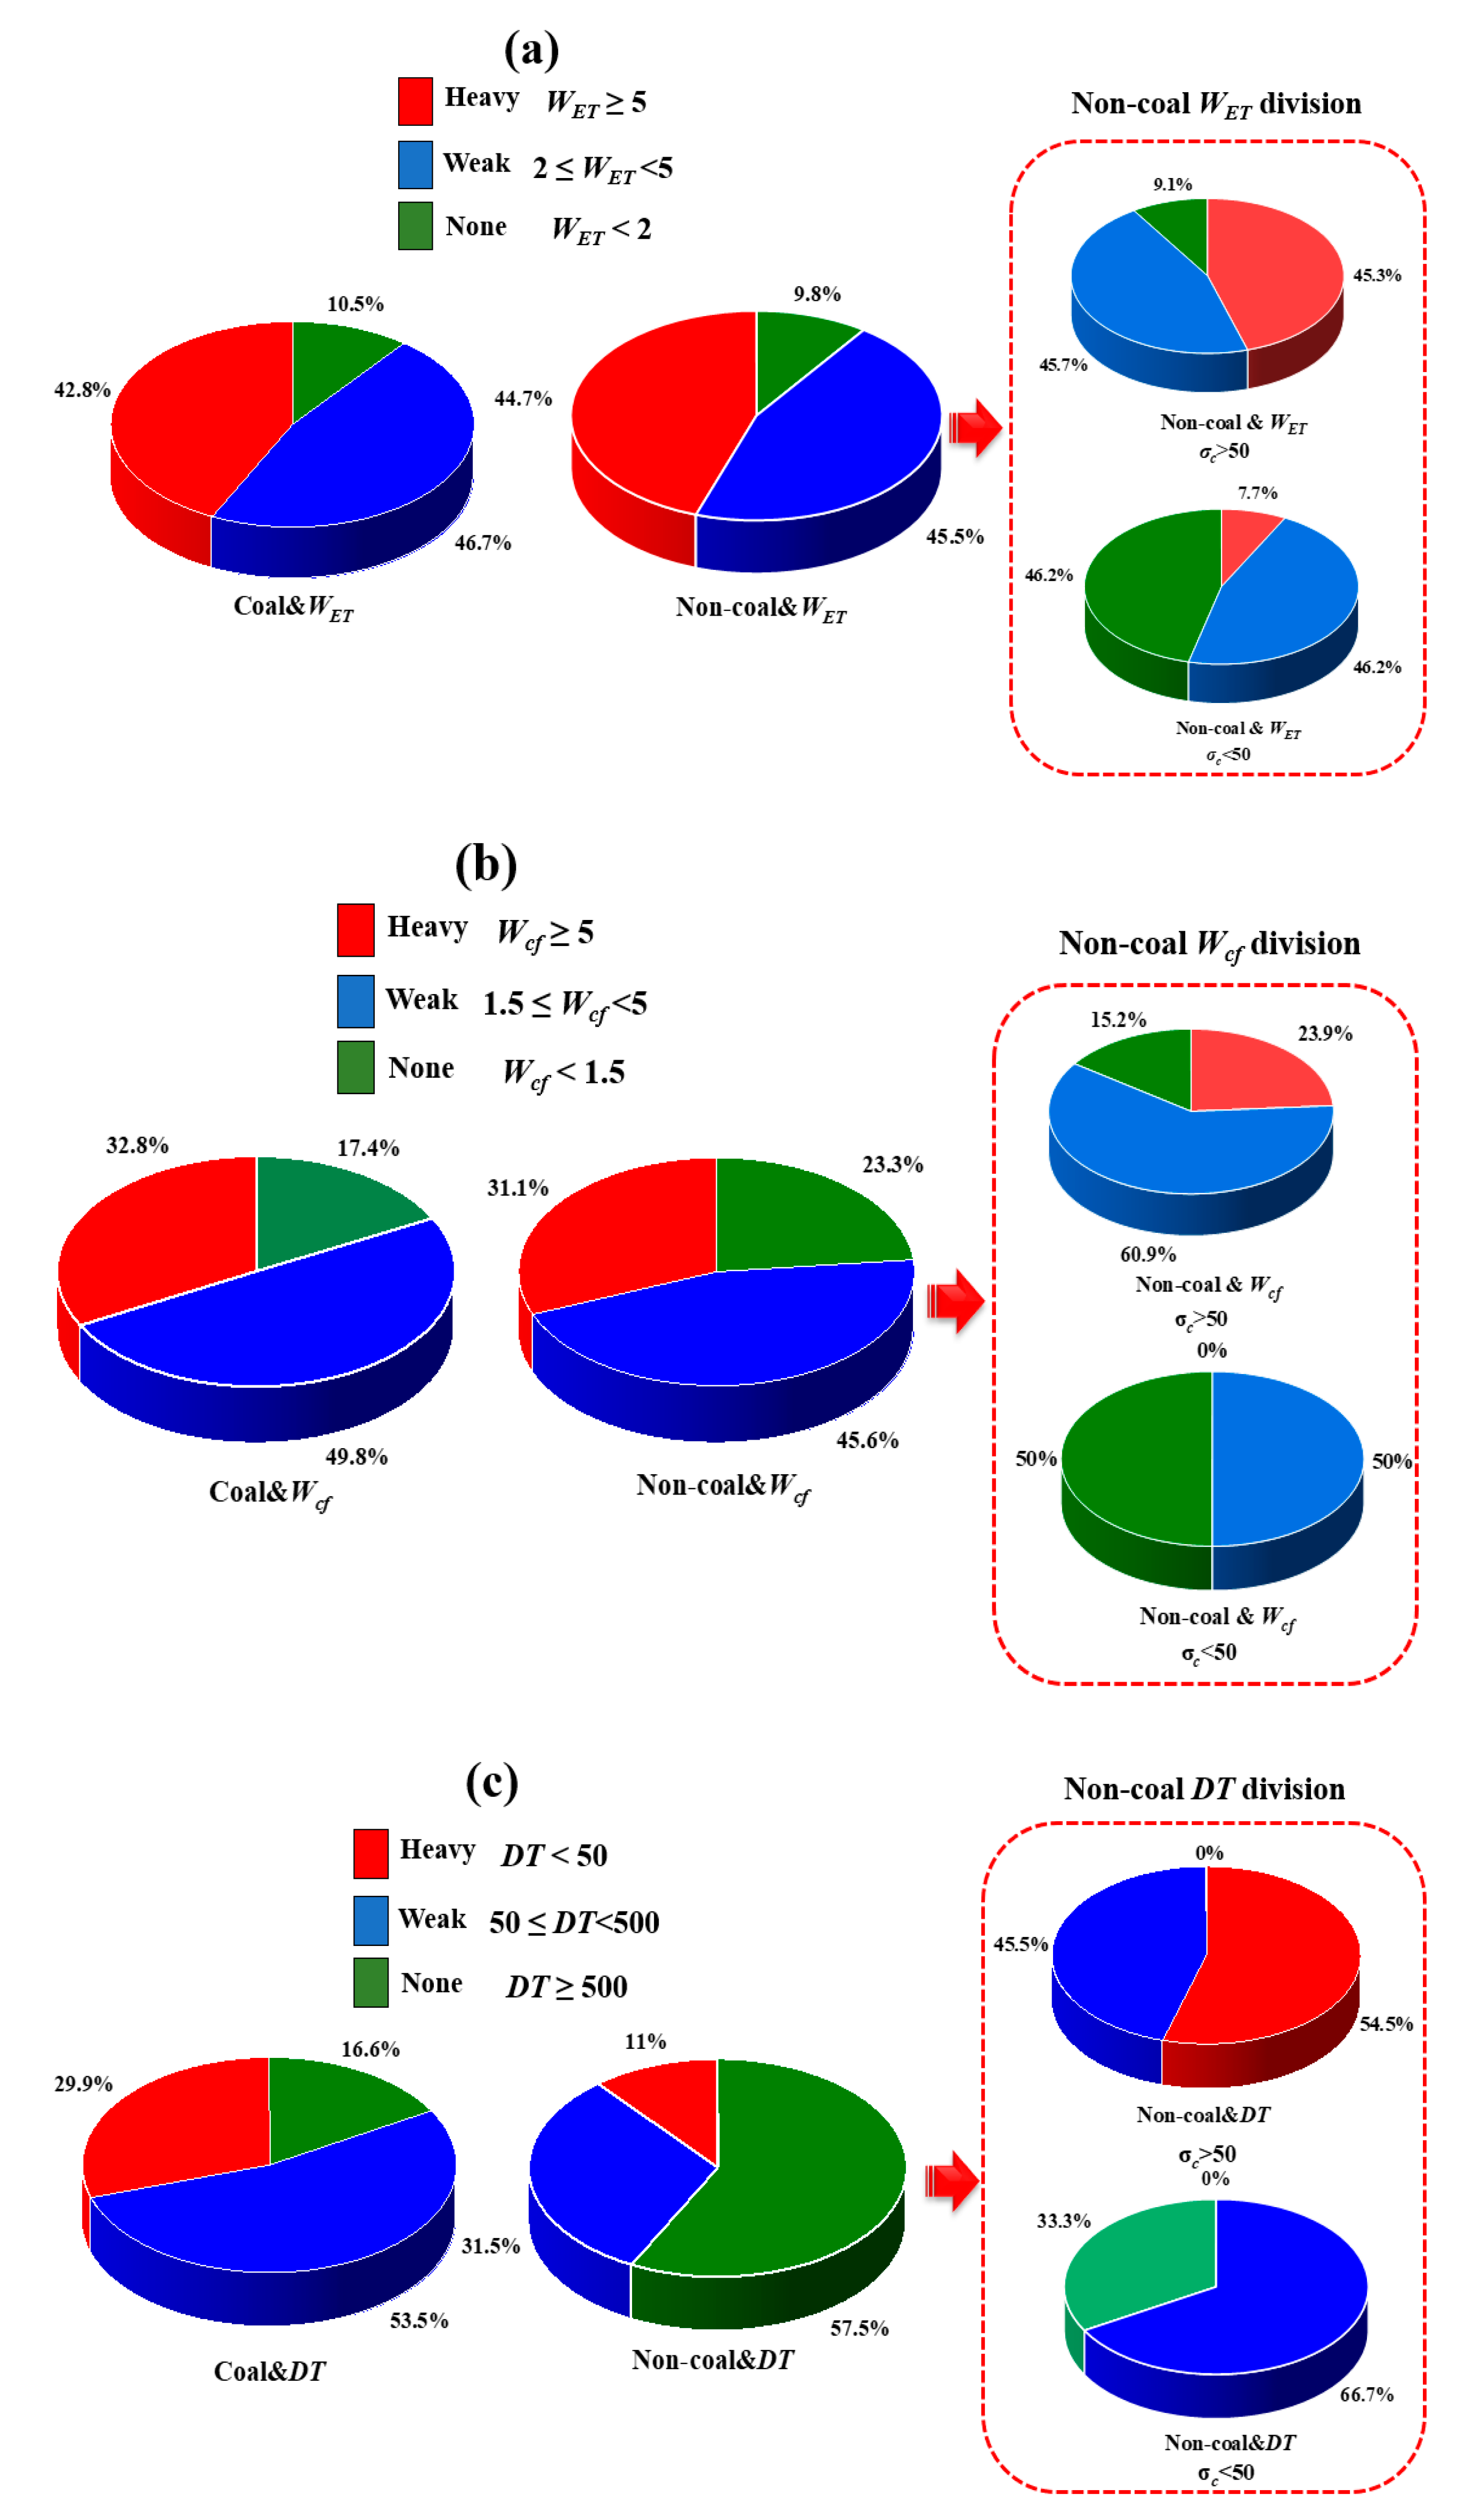
| Rock Type | Index | Rockburst Tendency Proportion | Approximate Ratio | ||
|---|---|---|---|---|---|
| Heavy | Weak | None | |||
| Coal | WET | 42.8% | 46.7% | 10.5% | 9:9:2 |
| Wcf | 32.8% | 49.8% | 17.4% | 3:5:2 | |
| DT | 29.9% | 53.5% | 16.6% | 3:5:2 | |
| Non-coal rocks | WET | 44.7% | 45.5% | 9.8% | 9:9:2 |
| Wcf | 31.1% | 45.6% | 23.3% | 6:9:5 | |
| DT | 11% | 31.5% | 57.5% | 1:3:6 | |
| Rock Type | DT/ms | σc/MPa | SDR(MPa/ms) | Rockburst Tendency |
|---|---|---|---|---|
| Yellow sandstone | 187.17 | 44.96 | 0.240203275 | Weak |
| White sandstone | 297.29 | 36.87 | 0.124020317 | Weak |
| Red sandstone | 259.7534 | 74.96 | 0.288581401 | Weak |
| Brown sandstone | 392.884 | 67.54 | 0.171908248 | Weak |
| Purple sandstone | 121.6186 | 92.8 | 0.76304118 | Heavy |
| Grey sandstone | 110.1074 | 76.75 | 0.697046702 | Heavy |
| Green sandstone | 373.3643 | 69.14 | 0.185181068 | Weak |
| Coarse marble | 179.6753 | 64.7 | 0.360094014 | Heavy |
| Fine marble | 645.6298 | 99.2 | 0.153648422 | Weak |
| Coarse granite | 357.8491 | 76.27 | 0.213134531 | Weak |
| Granite | 94.0918 | 110.54 | 1.174810132 | Heavy |
| Andesite | 153.6499 | 193.43 | 1.258900917 | Heavy |
| Coal | 56.5551 | 39.55 | 0.69931801 | Heavy |
| Rock Type | Underground Engineering | Geo-Stress (the Max)/MPa | σc/MPa | Depth/m | Rockburst (y/n) | Literature |
|---|---|---|---|---|---|---|
| Coal | Gaojiapu Coal Mine | 37.29–38.67 | 18.18–20.47 | 820–1089 | y | [35] |
| Hujiahe Coal Mine | 18.04–33.87 | 24.27–24.35 | 600–750 | y | ||
| Mengcun coal mine | 26.24–37.62 | 19.37–26.88 | 700–800 | y | ||
| Ningnan coal mine | 13.90–17.00 | 16.68–37.06 | 400–800 | y | ||
| Xiaozhuang coal mine | 21.23–30.17 | 13.23–20.62 | 487–691 | y | ||
| Yadian coal mine | 12.30–28.10 | 13.43–13.67 | 430–760 | y | ||
| Zhaoxian coal mine | 19.45–32.46 | 12.97–13.97 | 232–632 | y | ||
| Chengshan coal mine | 20–24 | 10 | 580 | y | [36] | |
| Non-coal rock | Jinping II Hydropower Station | 11.2 | 44.6–150.6 | 130 | n | [37,38] |
| 22.3 | 44.6–150.6 | 300 | n | |||
| 44.77 | 44.6–150.6 | 1800 | y | |||
| 38.6 | 44.6–150.6 | 2700 | y | |||
| 43 | 44.6–150.6 | 3005 | y | |||
| Wanjiazhai Project | 25 | 81–153 | 370 | n | [39] | |
| 29.5 | 70–20 | 460 | y | |||
| 30 | 70–20 | 480 | y | |||
| 29.5 | 70–20 | 460 | y | |||
| 30 | 70–20 | 480 | y |
Publisher’s Note: MDPI stays neutral with regard to jurisdictional claims in published maps and institutional affiliations. |
© 2021 by the authors. Licensee MDPI, Basel, Switzerland. This article is an open access article distributed under the terms and conditions of the Creative Commons Attribution (CC BY) license (http://creativecommons.org/licenses/by/4.0/).
Share and Cite
Du, K.; Sun, Y.; Yang, S.; Lv, S.; Wang, S. Differences of Mechanical Parameters and Rockburst Tendency Indices between Coal and Non-Coal Rocks and Modified Rockburst Tendency Classification Criteria for Non-Coal Rocks. Appl. Sci. 2021, 11, 2641. https://doi.org/10.3390/app11062641
Du K, Sun Y, Yang S, Lv S, Wang S. Differences of Mechanical Parameters and Rockburst Tendency Indices between Coal and Non-Coal Rocks and Modified Rockburst Tendency Classification Criteria for Non-Coal Rocks. Applied Sciences. 2021; 11(6):2641. https://doi.org/10.3390/app11062641
Chicago/Turabian StyleDu, Kun, Yu Sun, Songge Yang, Shizhan Lv, and Shaofeng Wang. 2021. "Differences of Mechanical Parameters and Rockburst Tendency Indices between Coal and Non-Coal Rocks and Modified Rockburst Tendency Classification Criteria for Non-Coal Rocks" Applied Sciences 11, no. 6: 2641. https://doi.org/10.3390/app11062641