
Transient Cold Flow Simulation of Fast-Fluidized Bed Air Reactor with Hematite as an Oxygen Carrier for Chemical Looping Combustion


Abstract
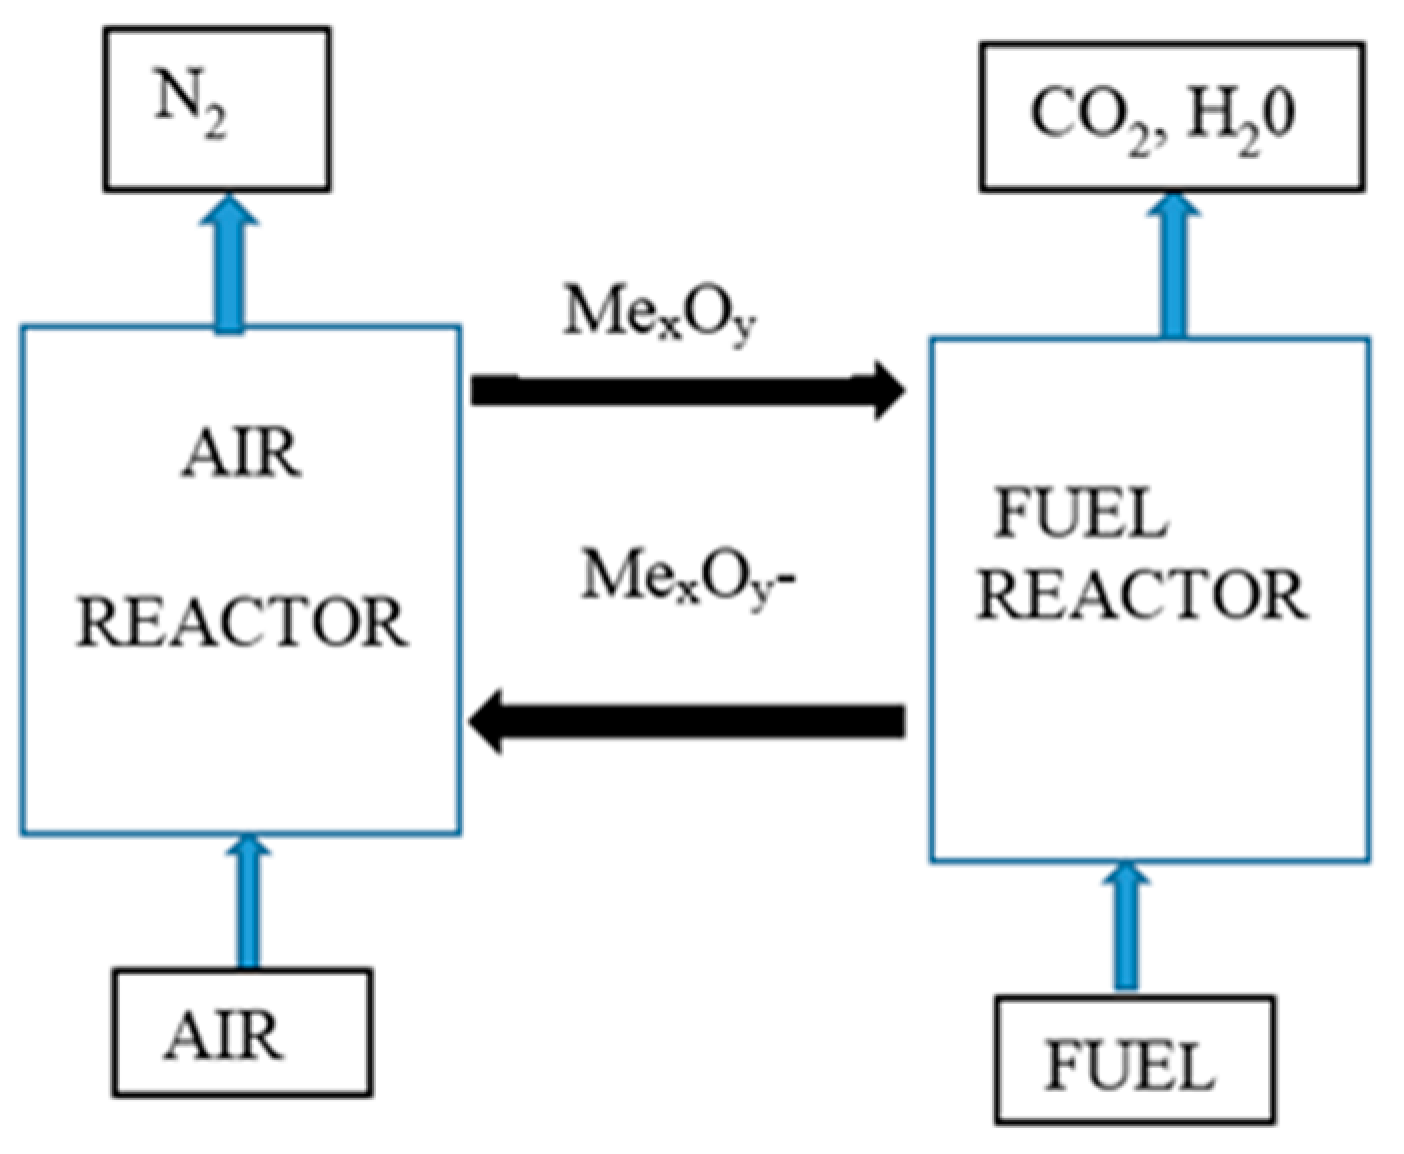
:1. Introduction
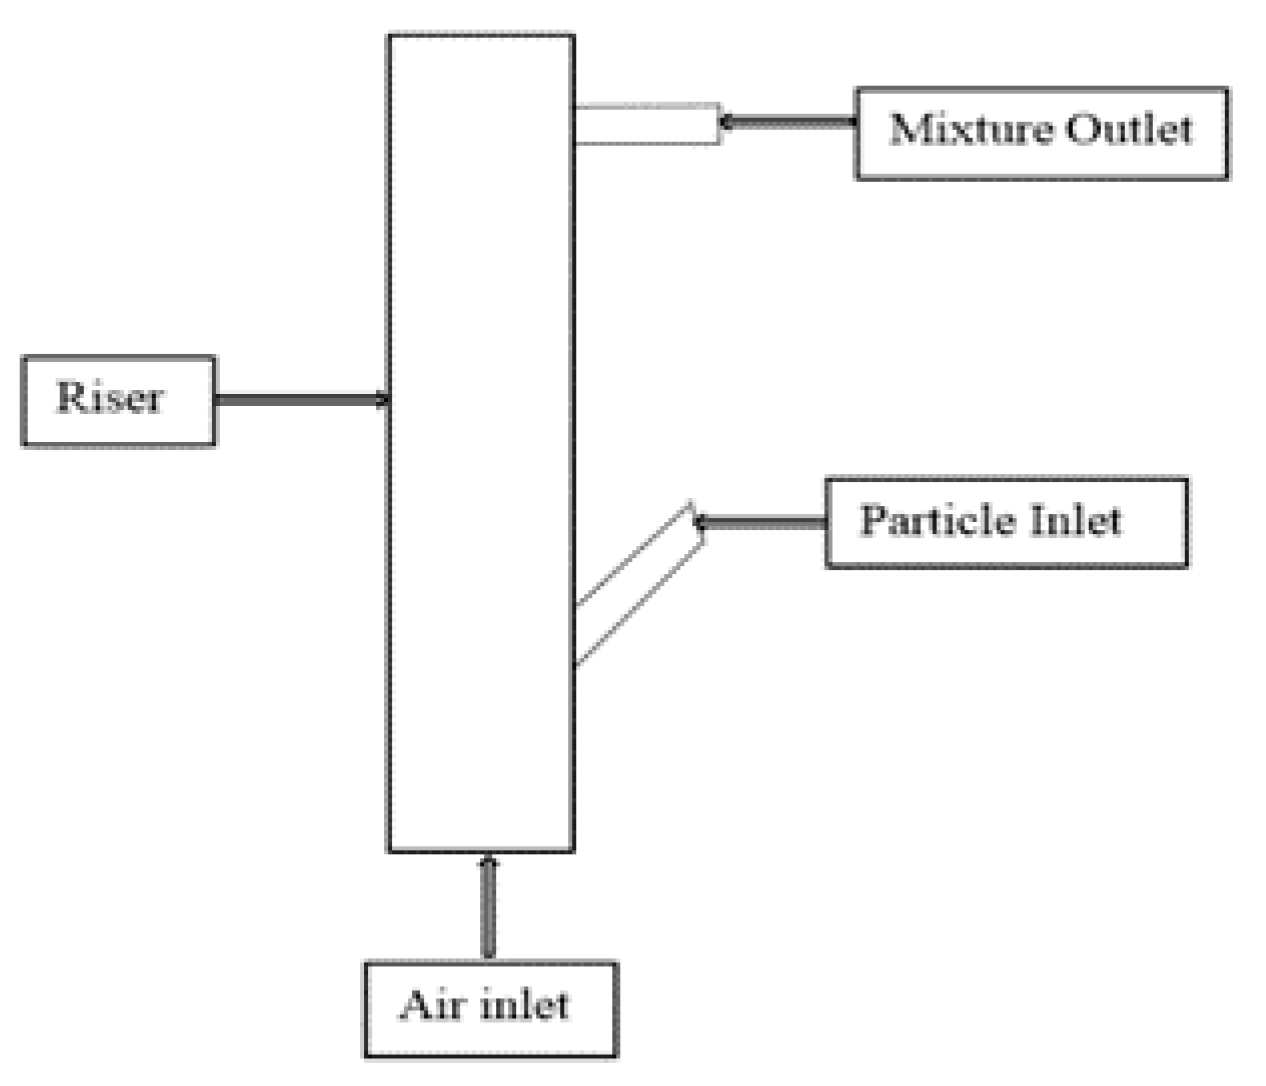
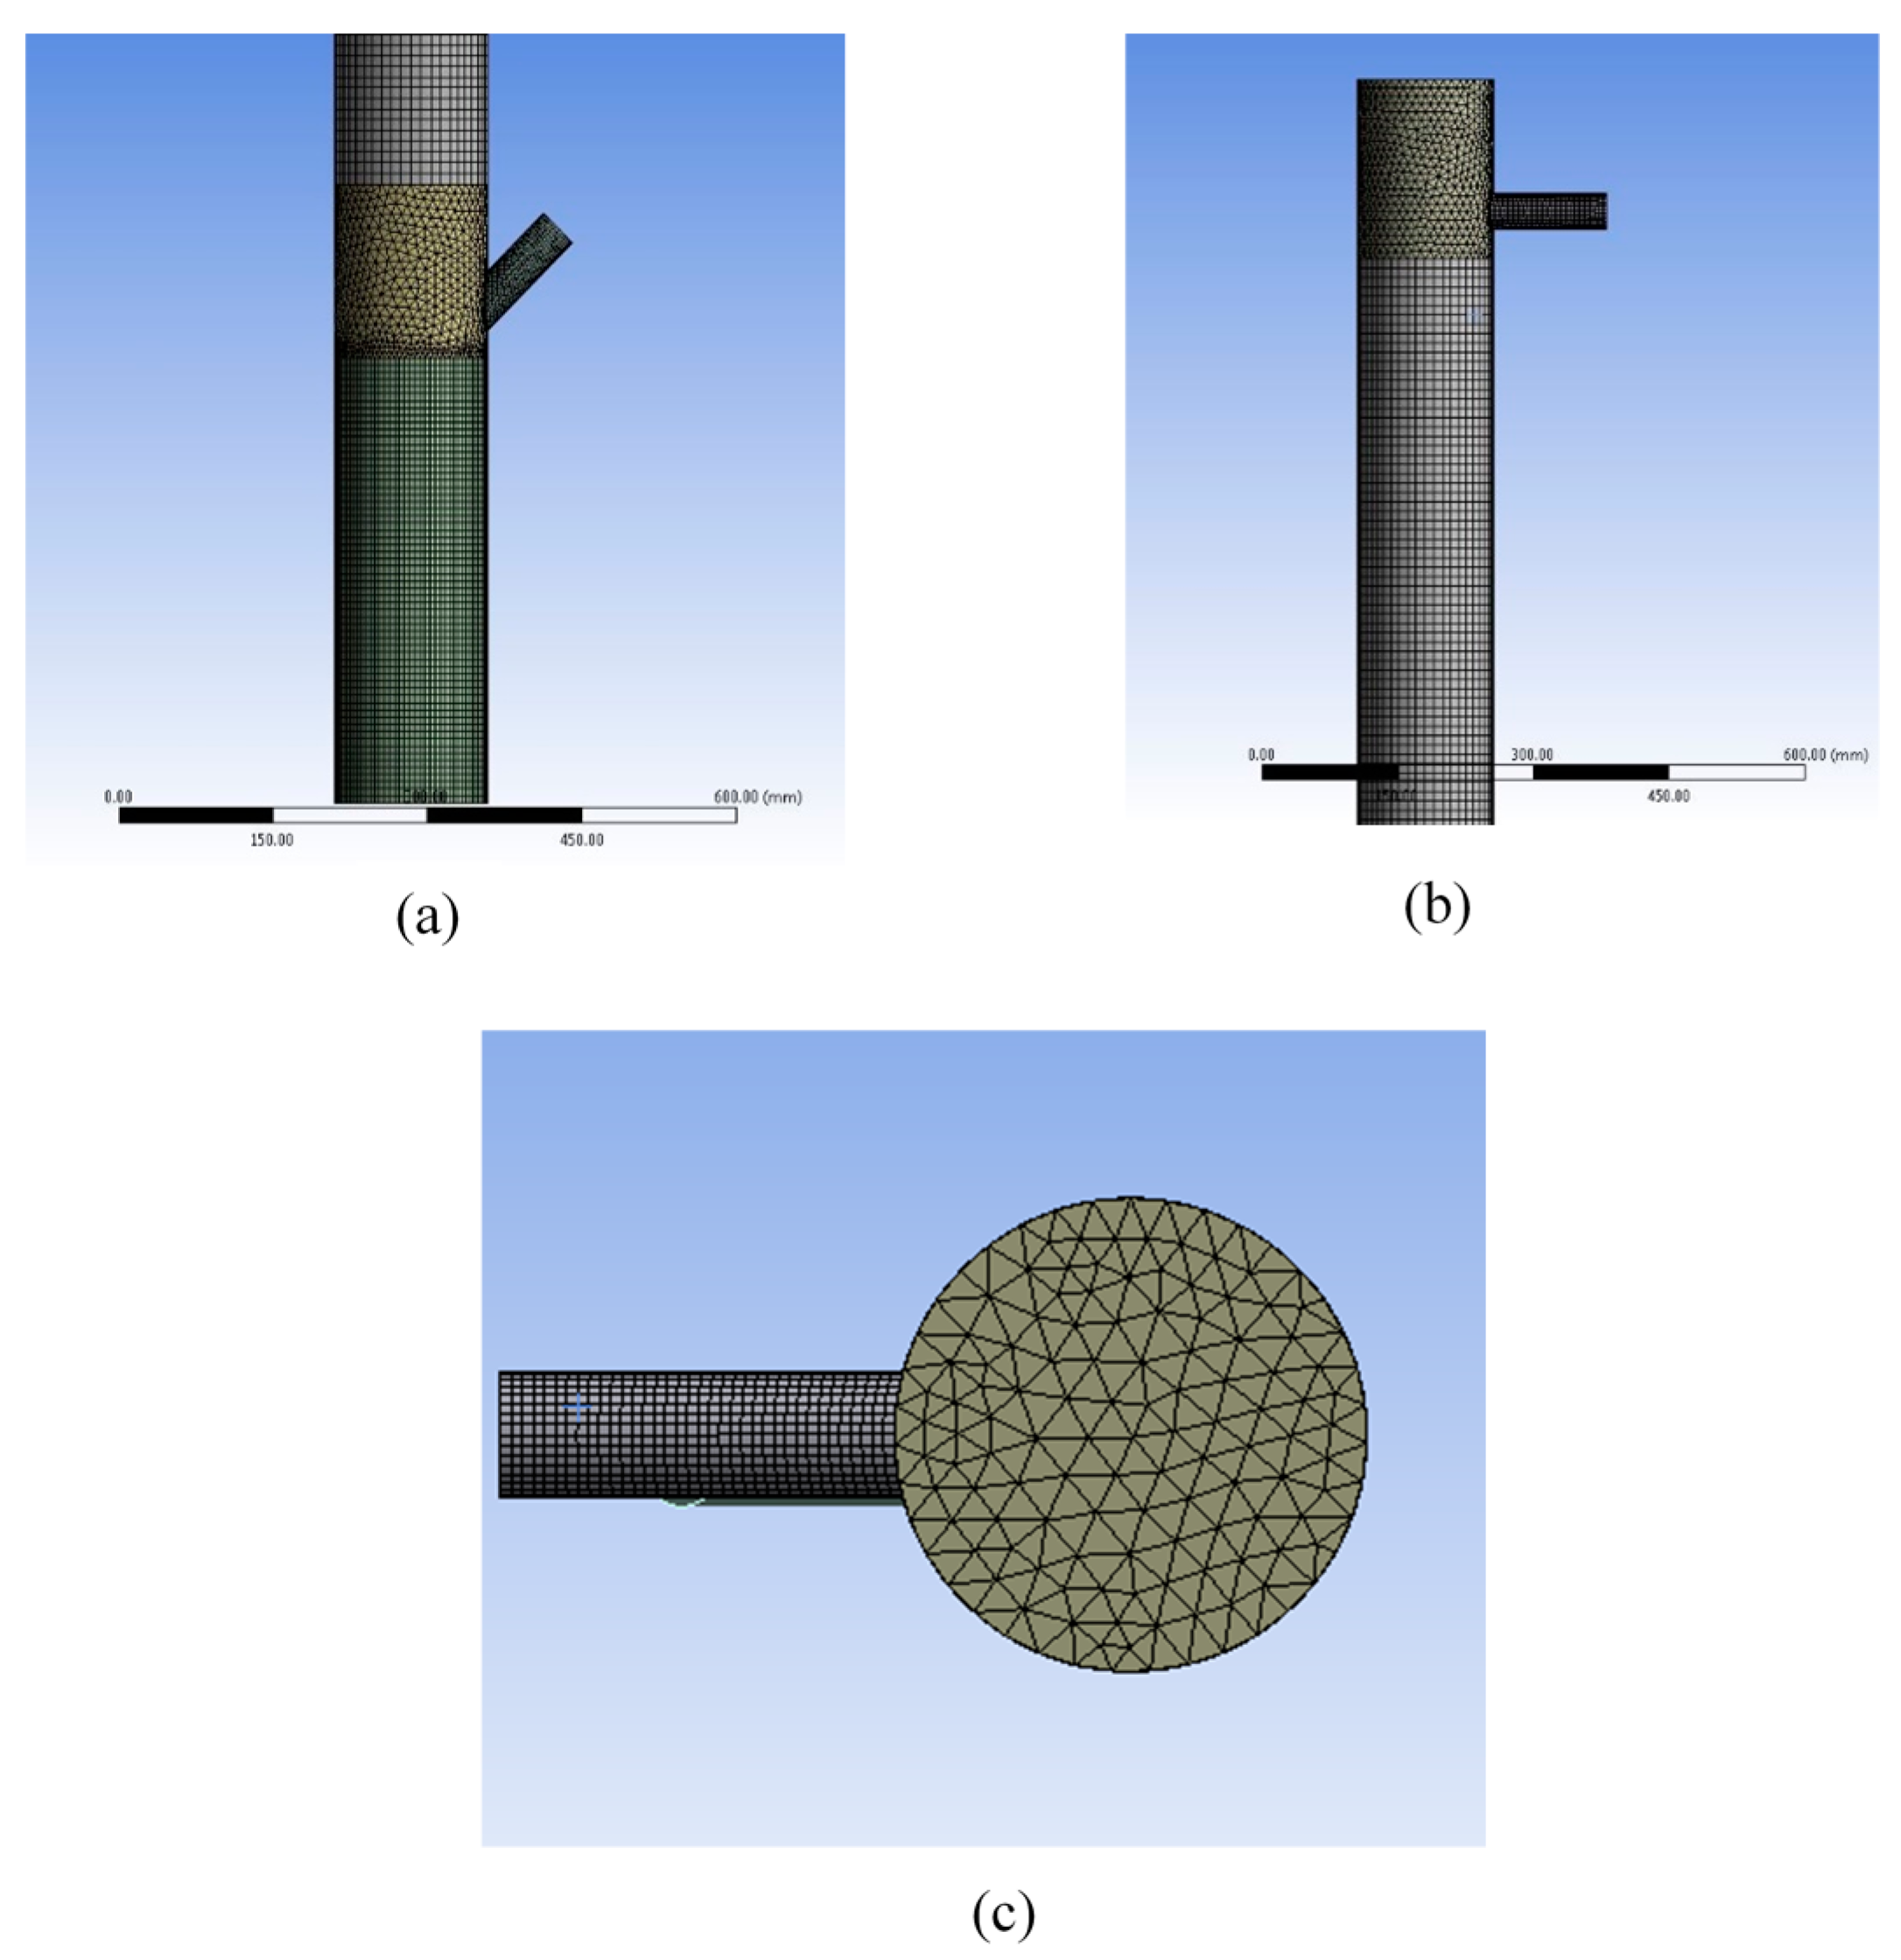
2. Materials and Methods
2.1. Continuity Equation
2.2. Momentum Equation
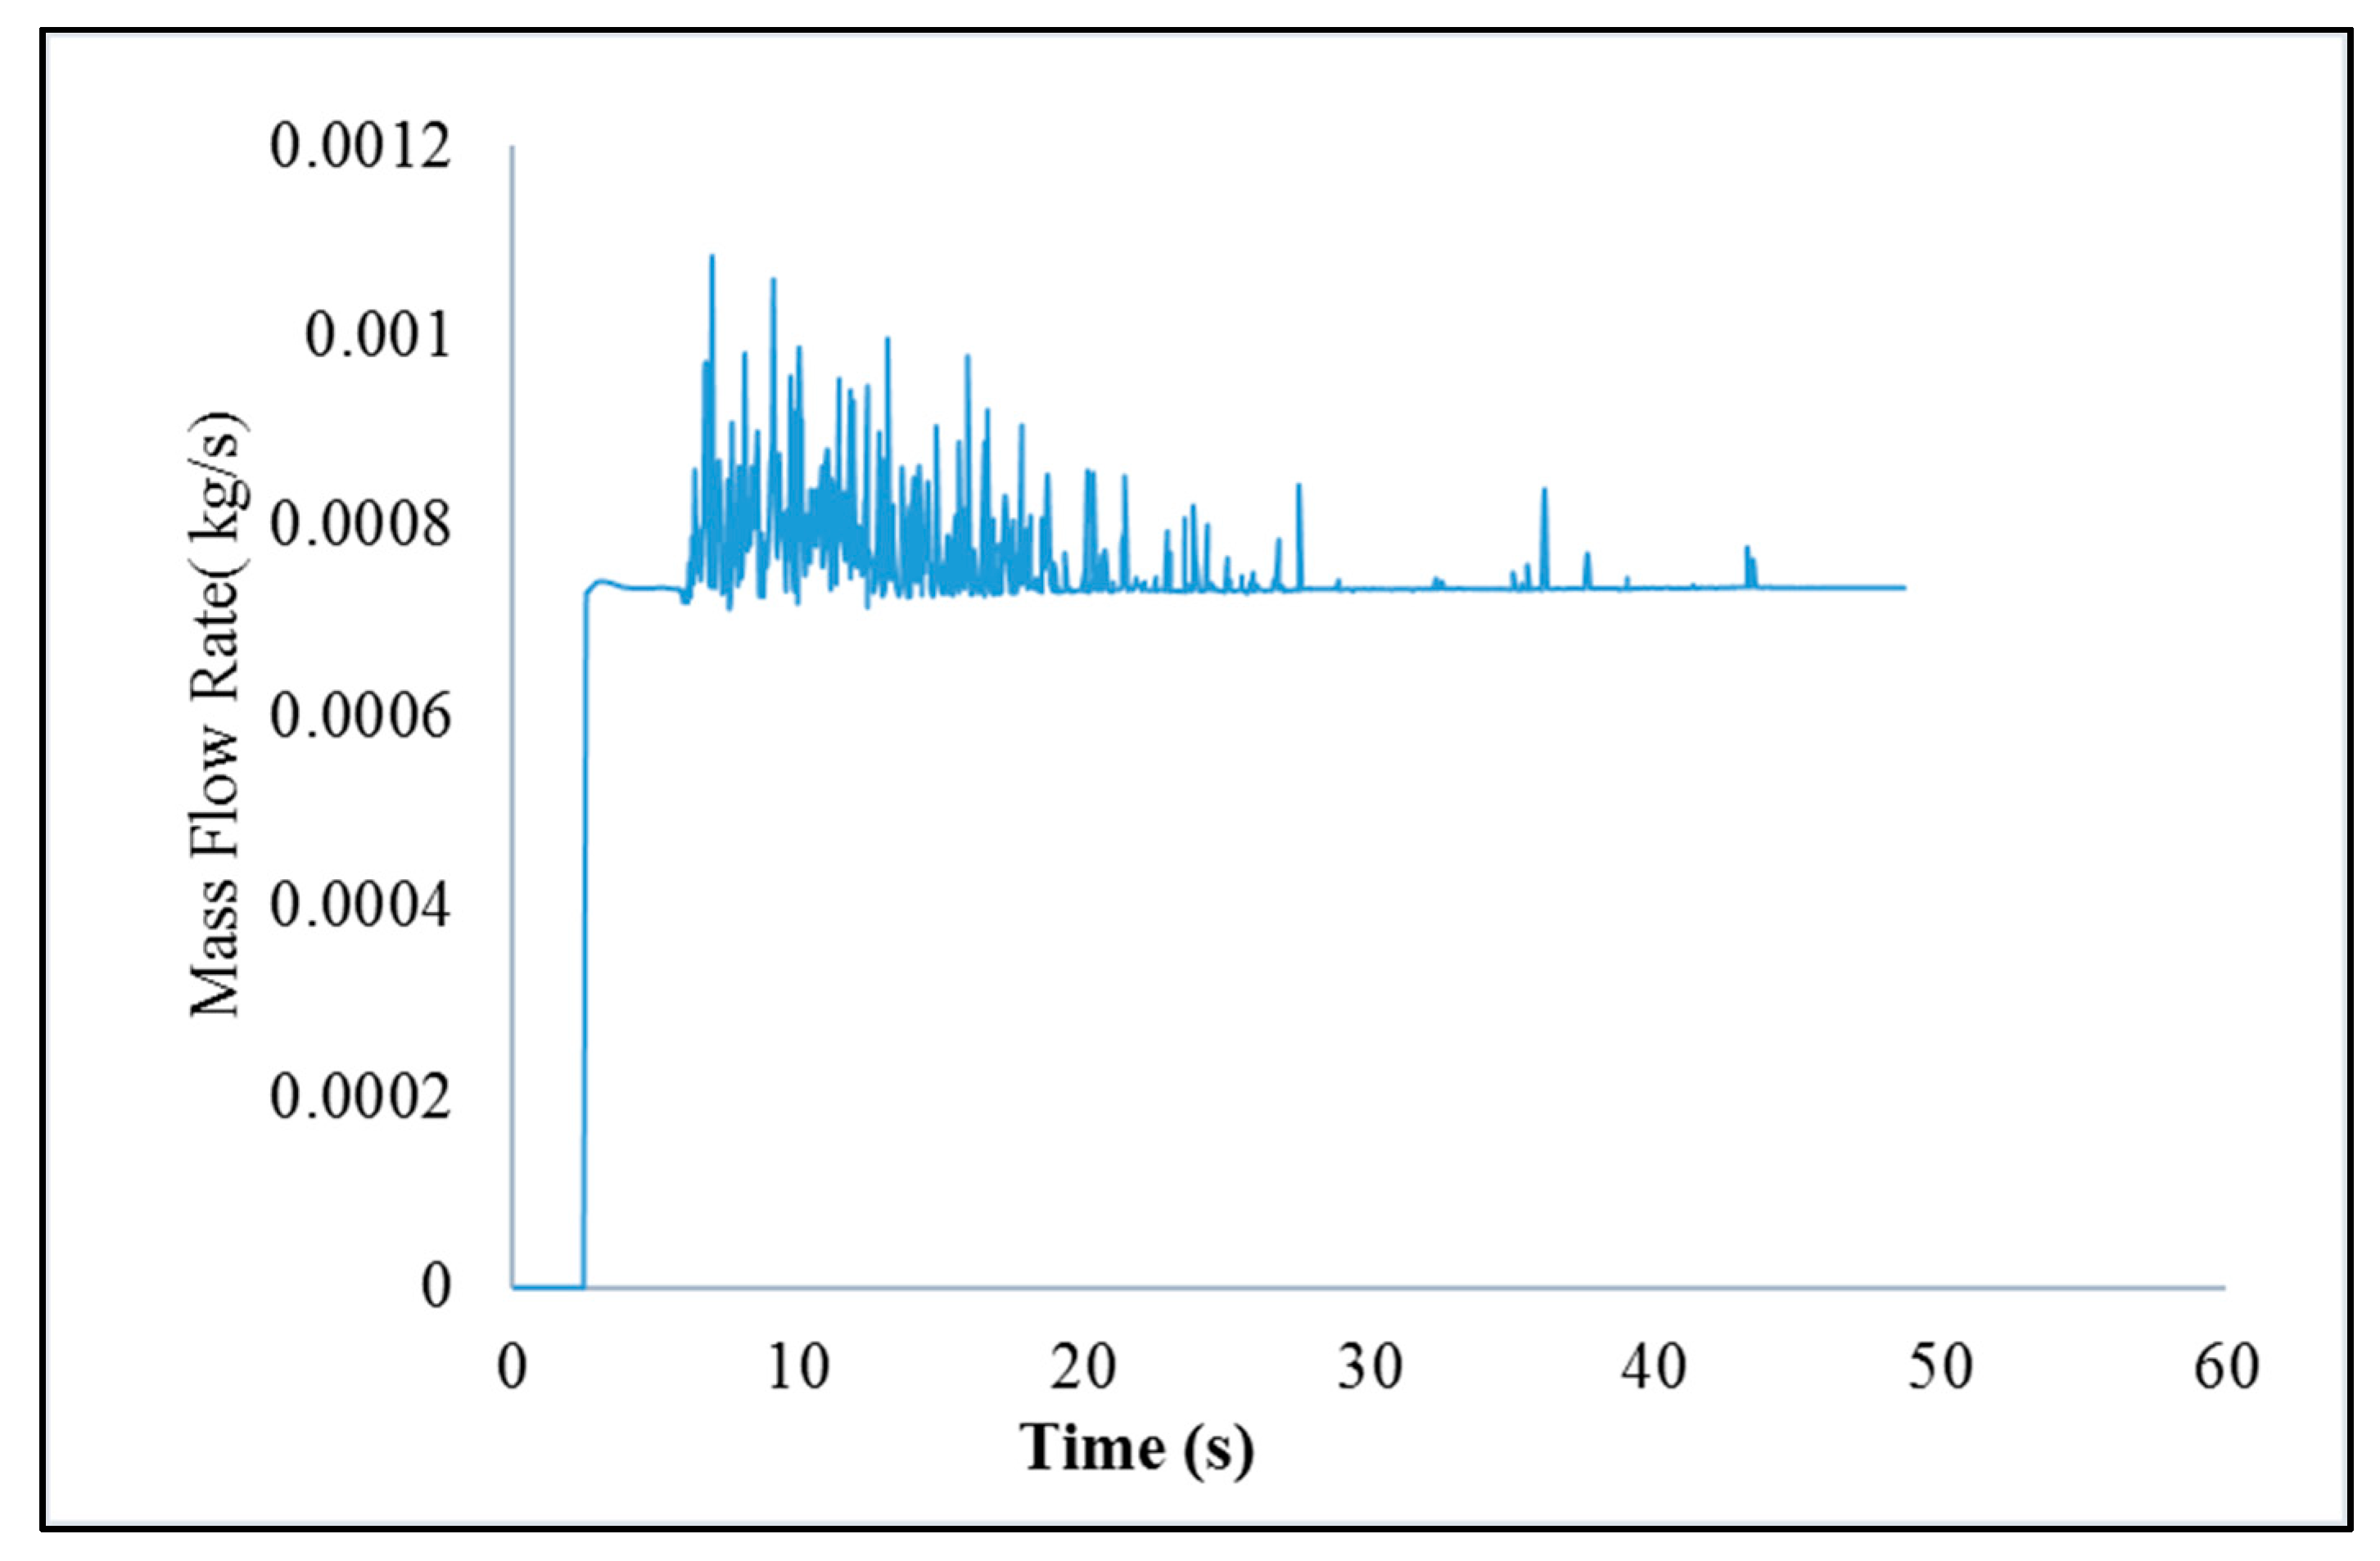
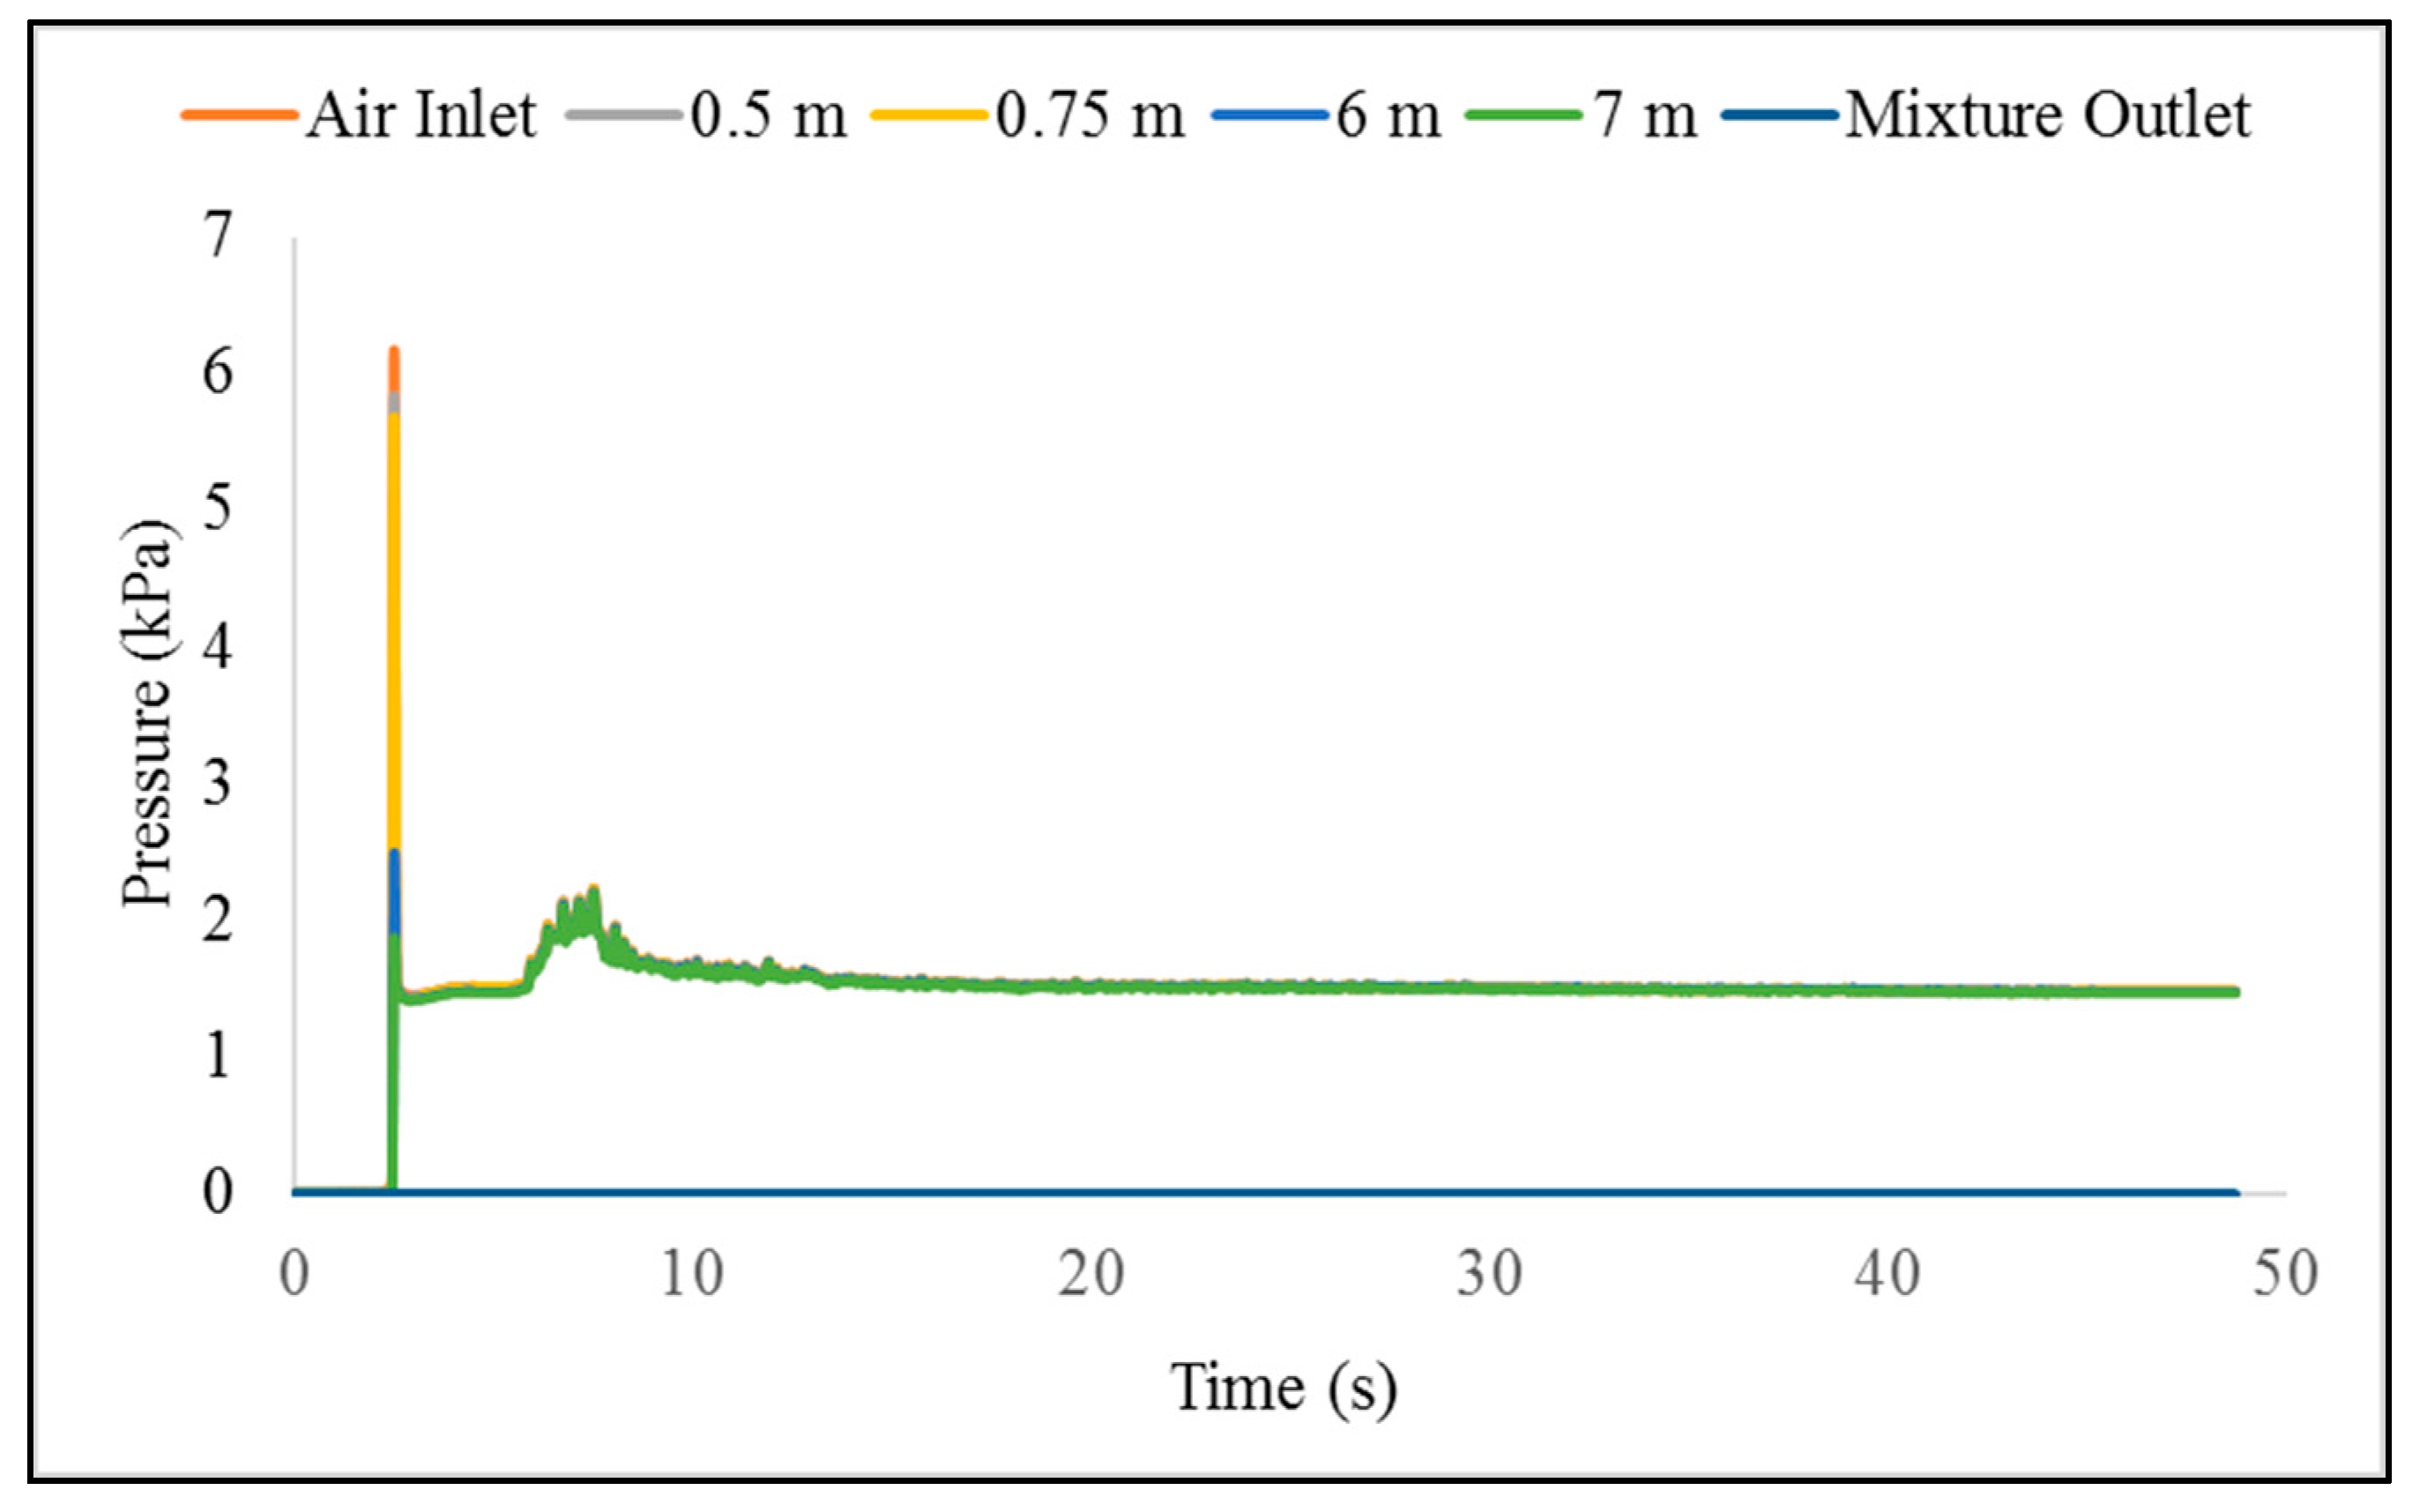
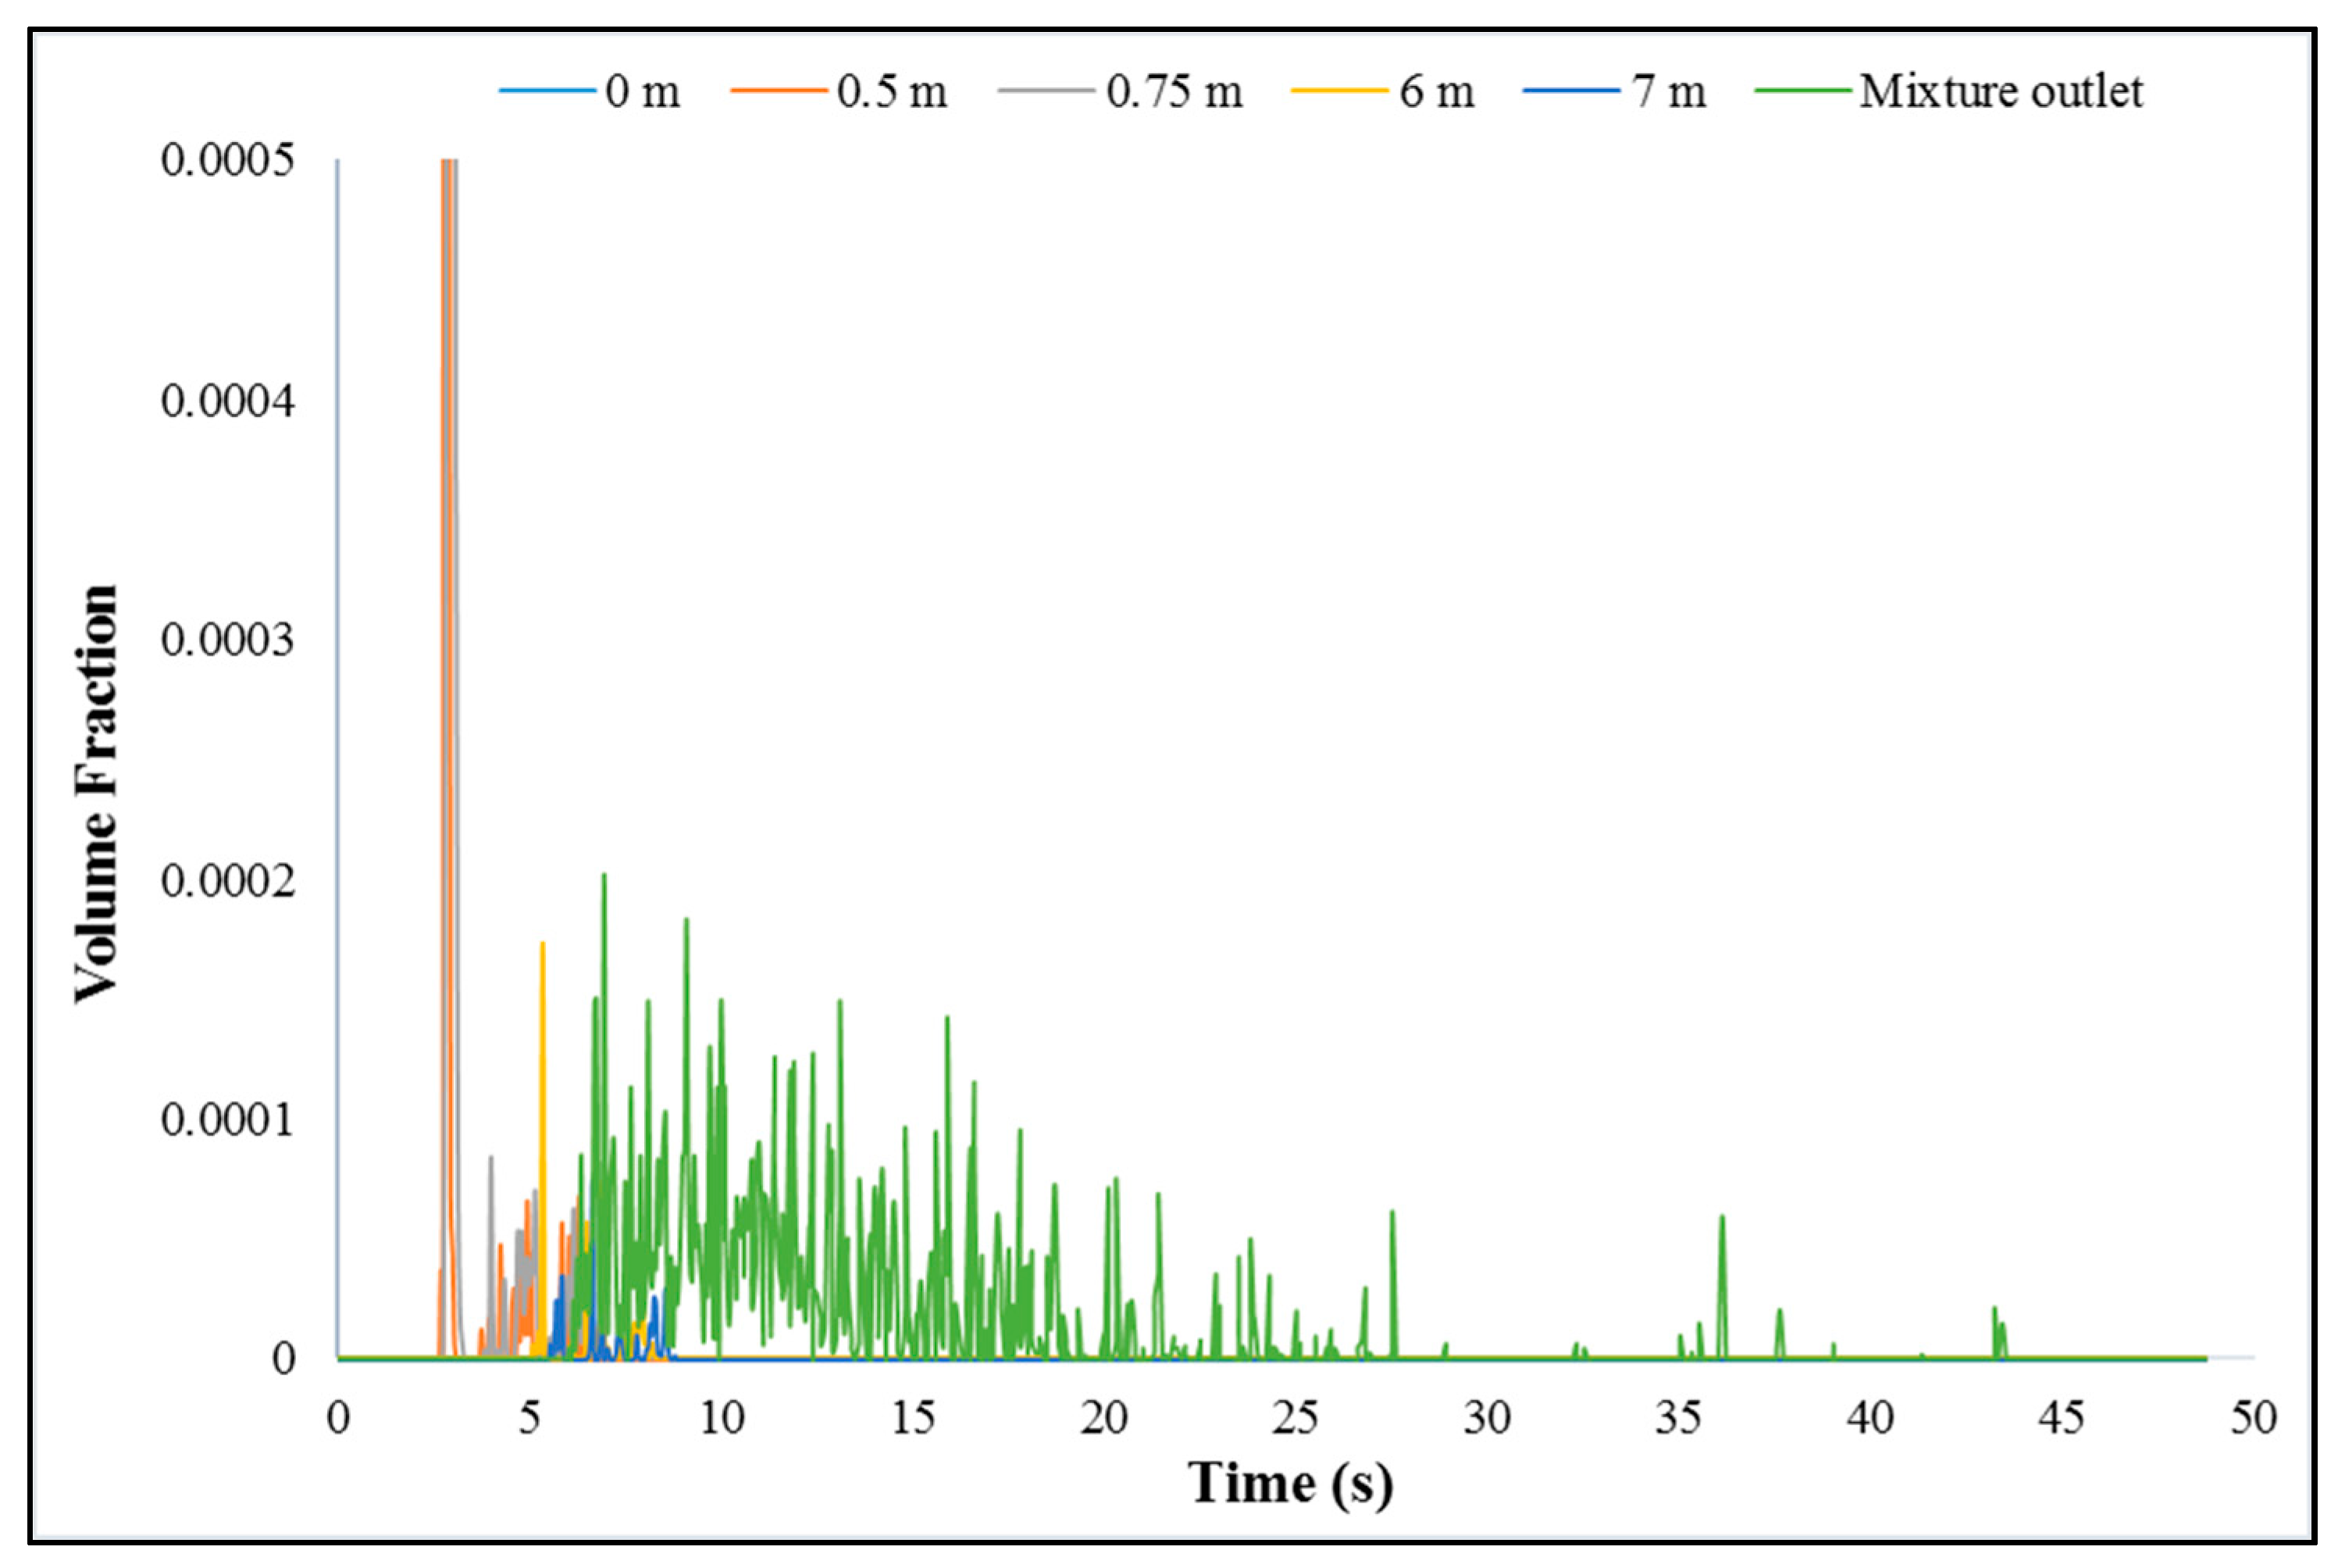
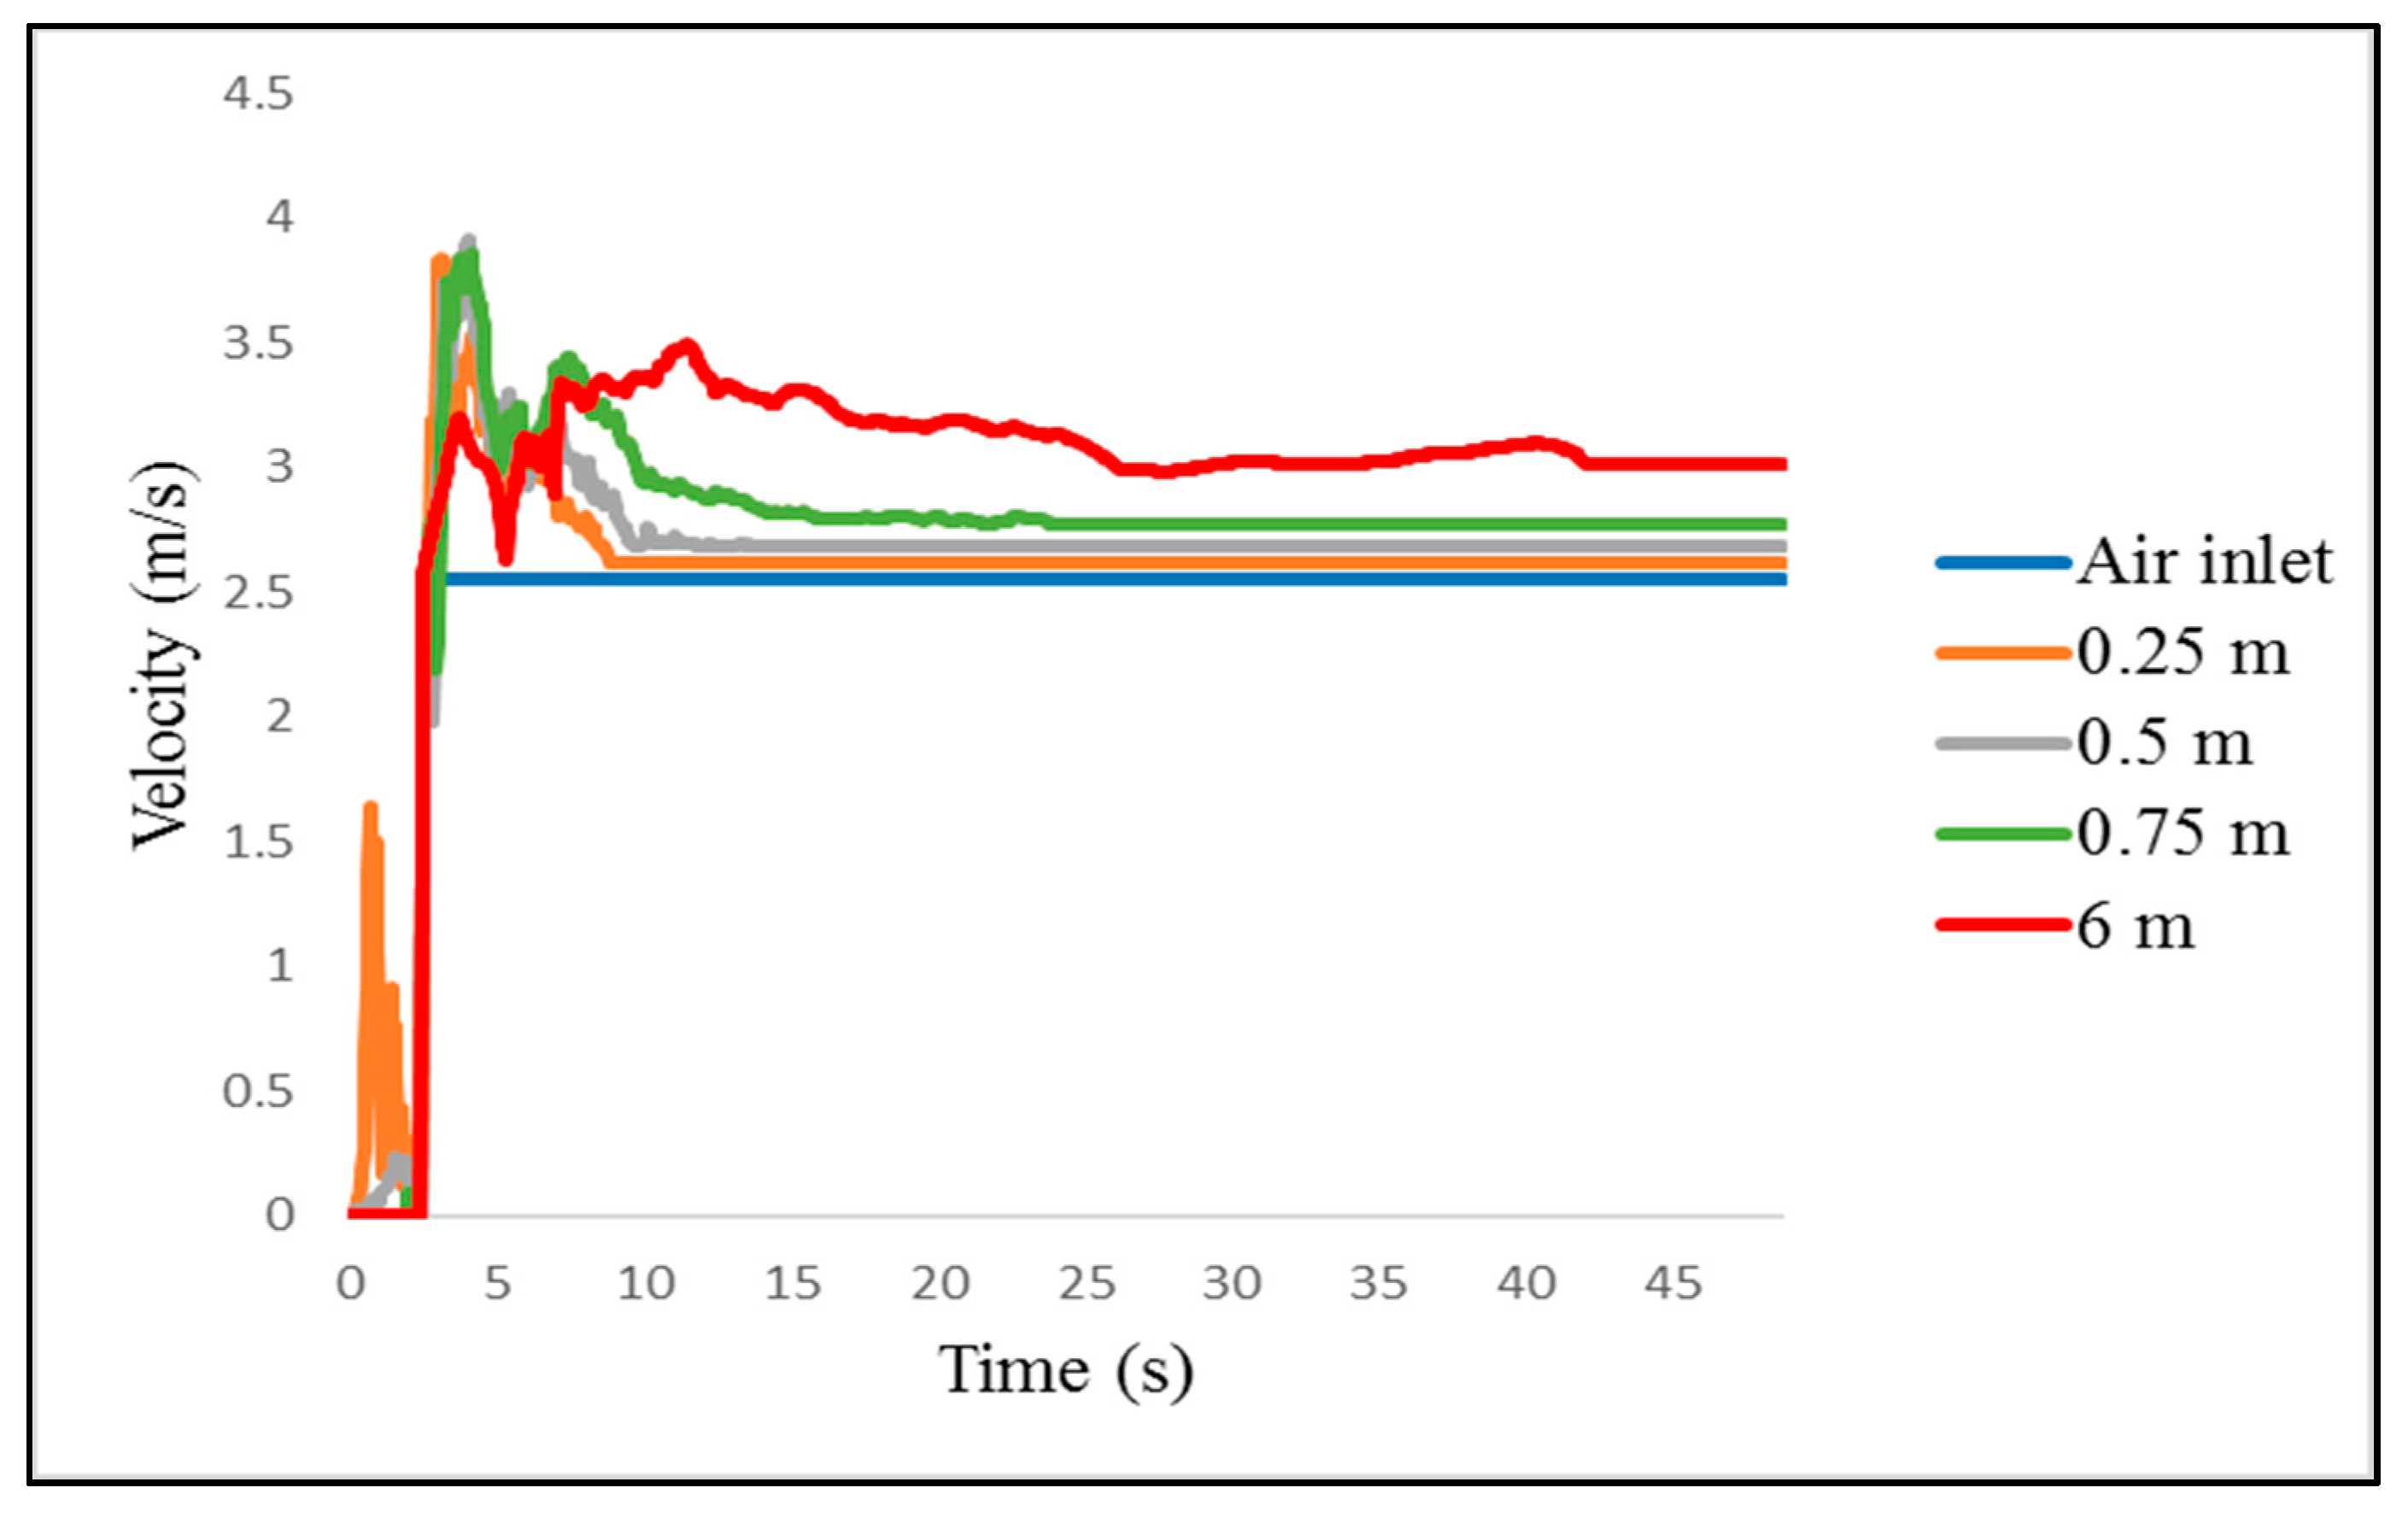
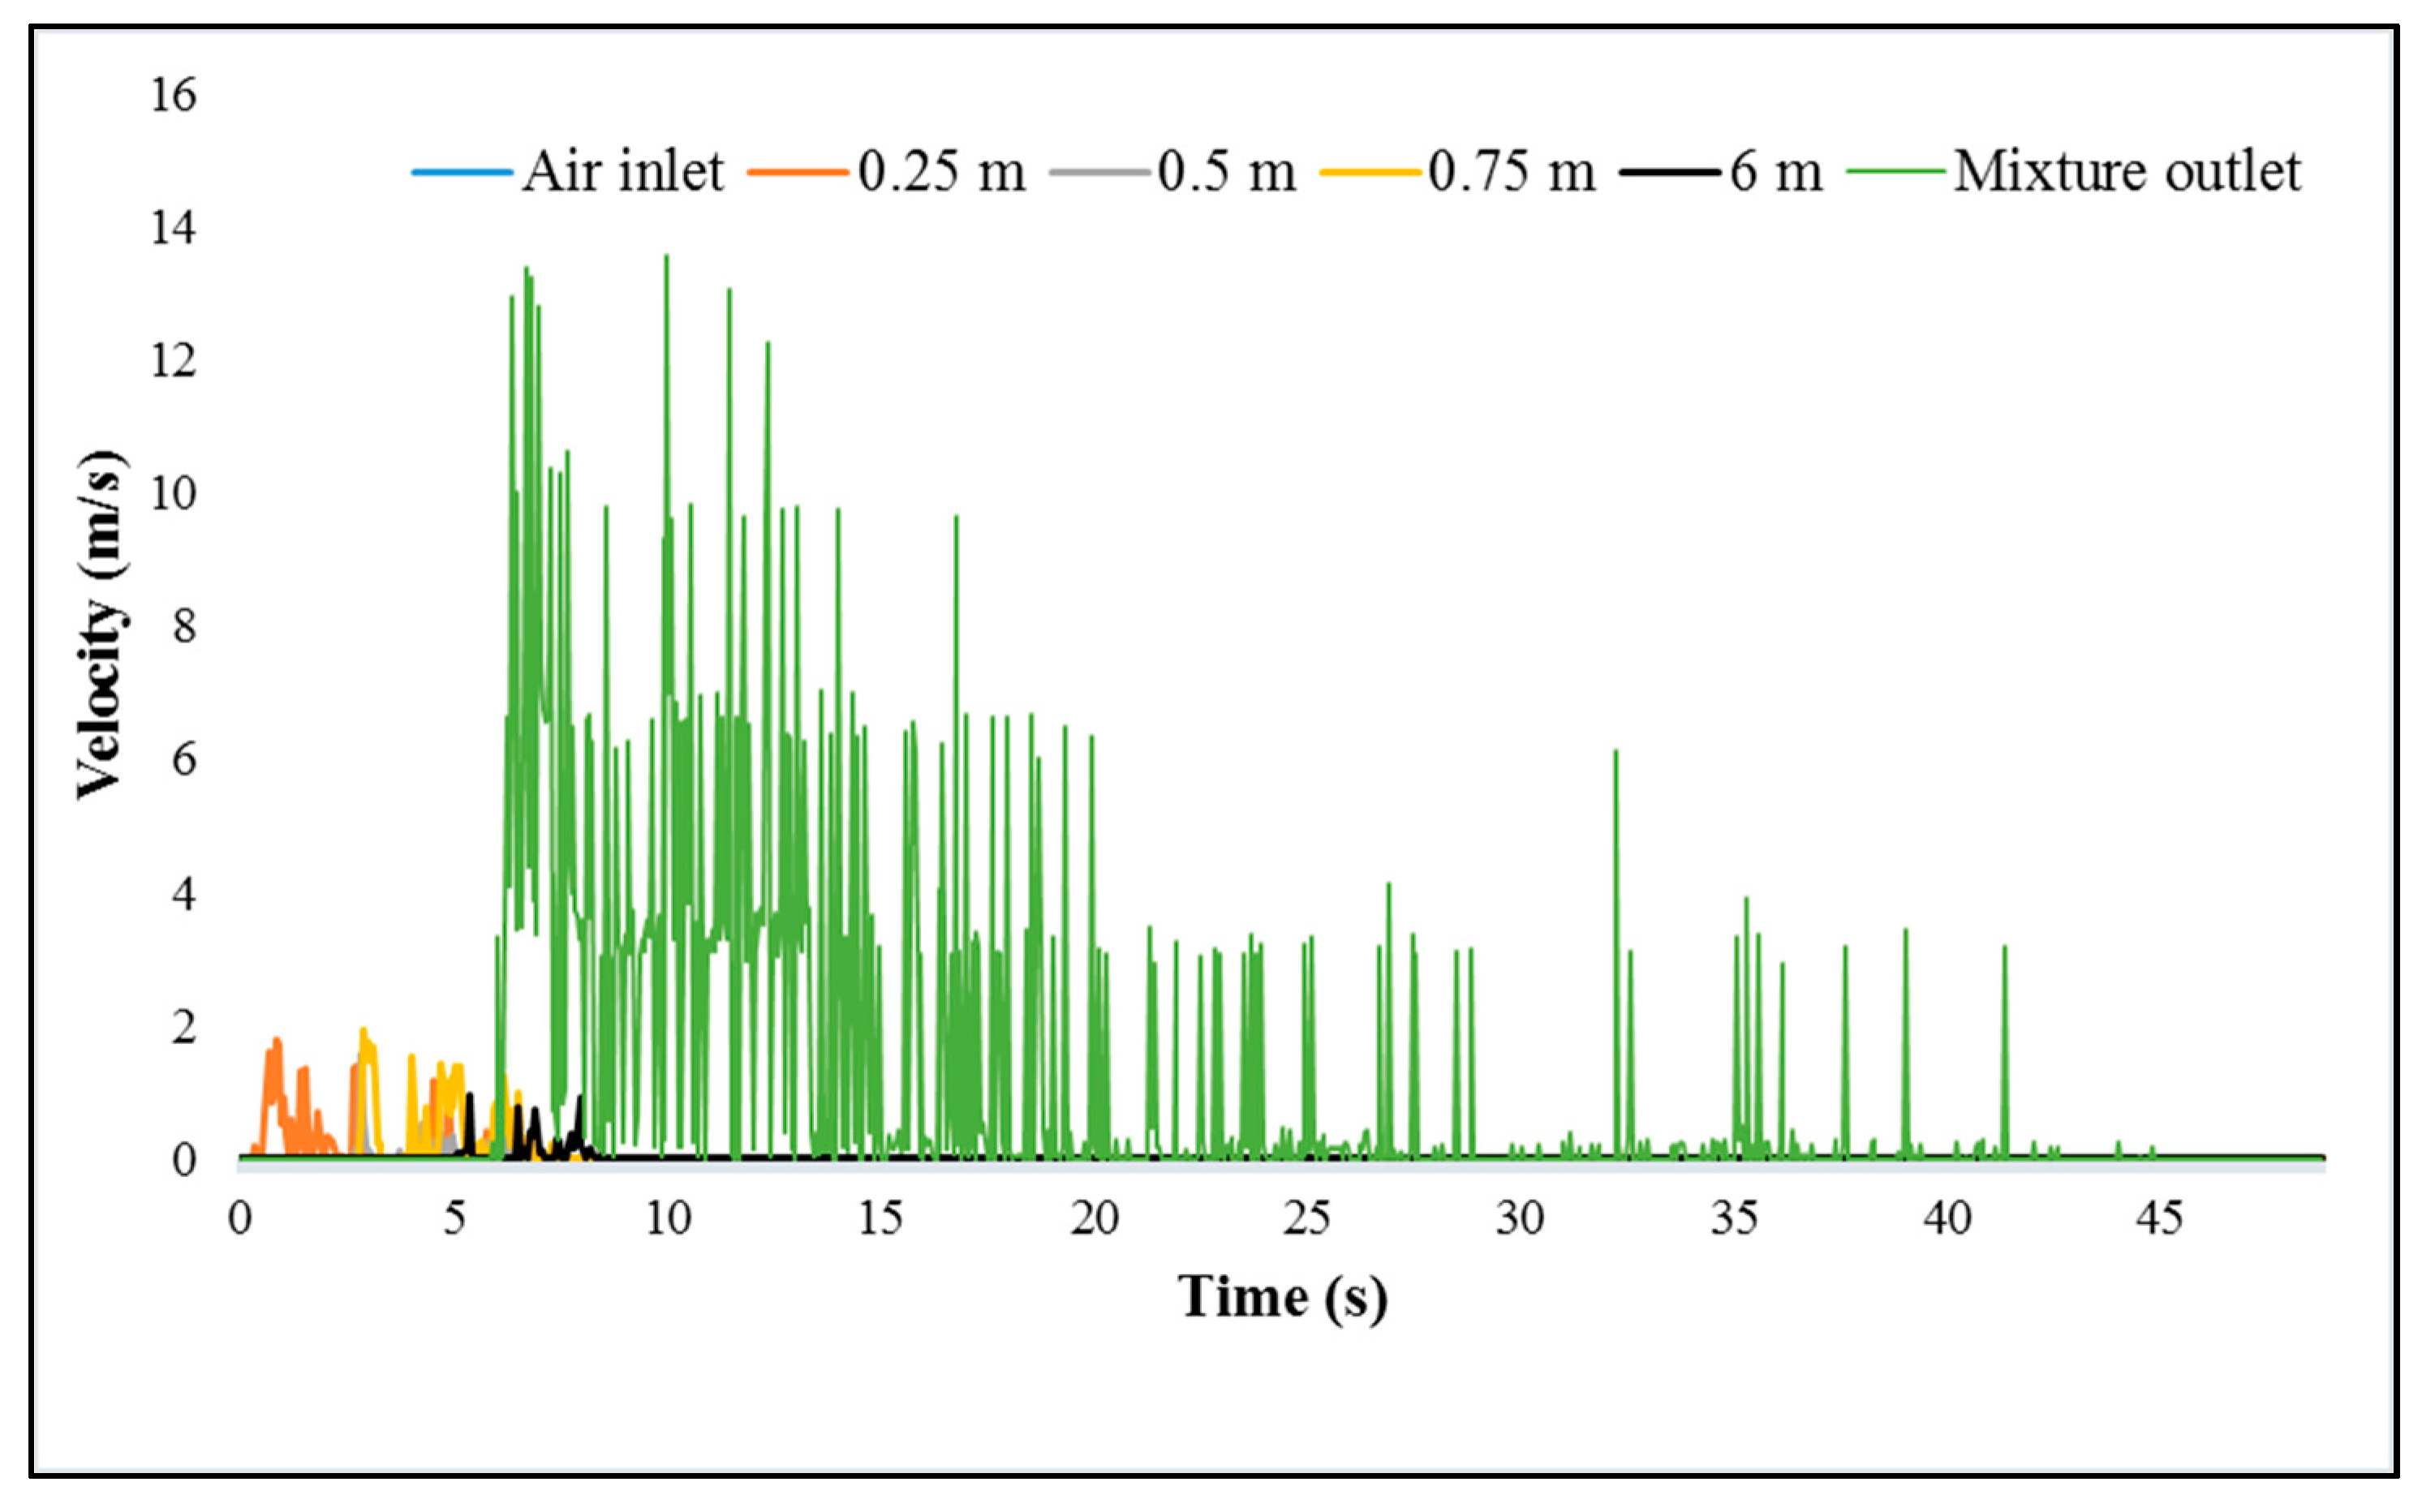
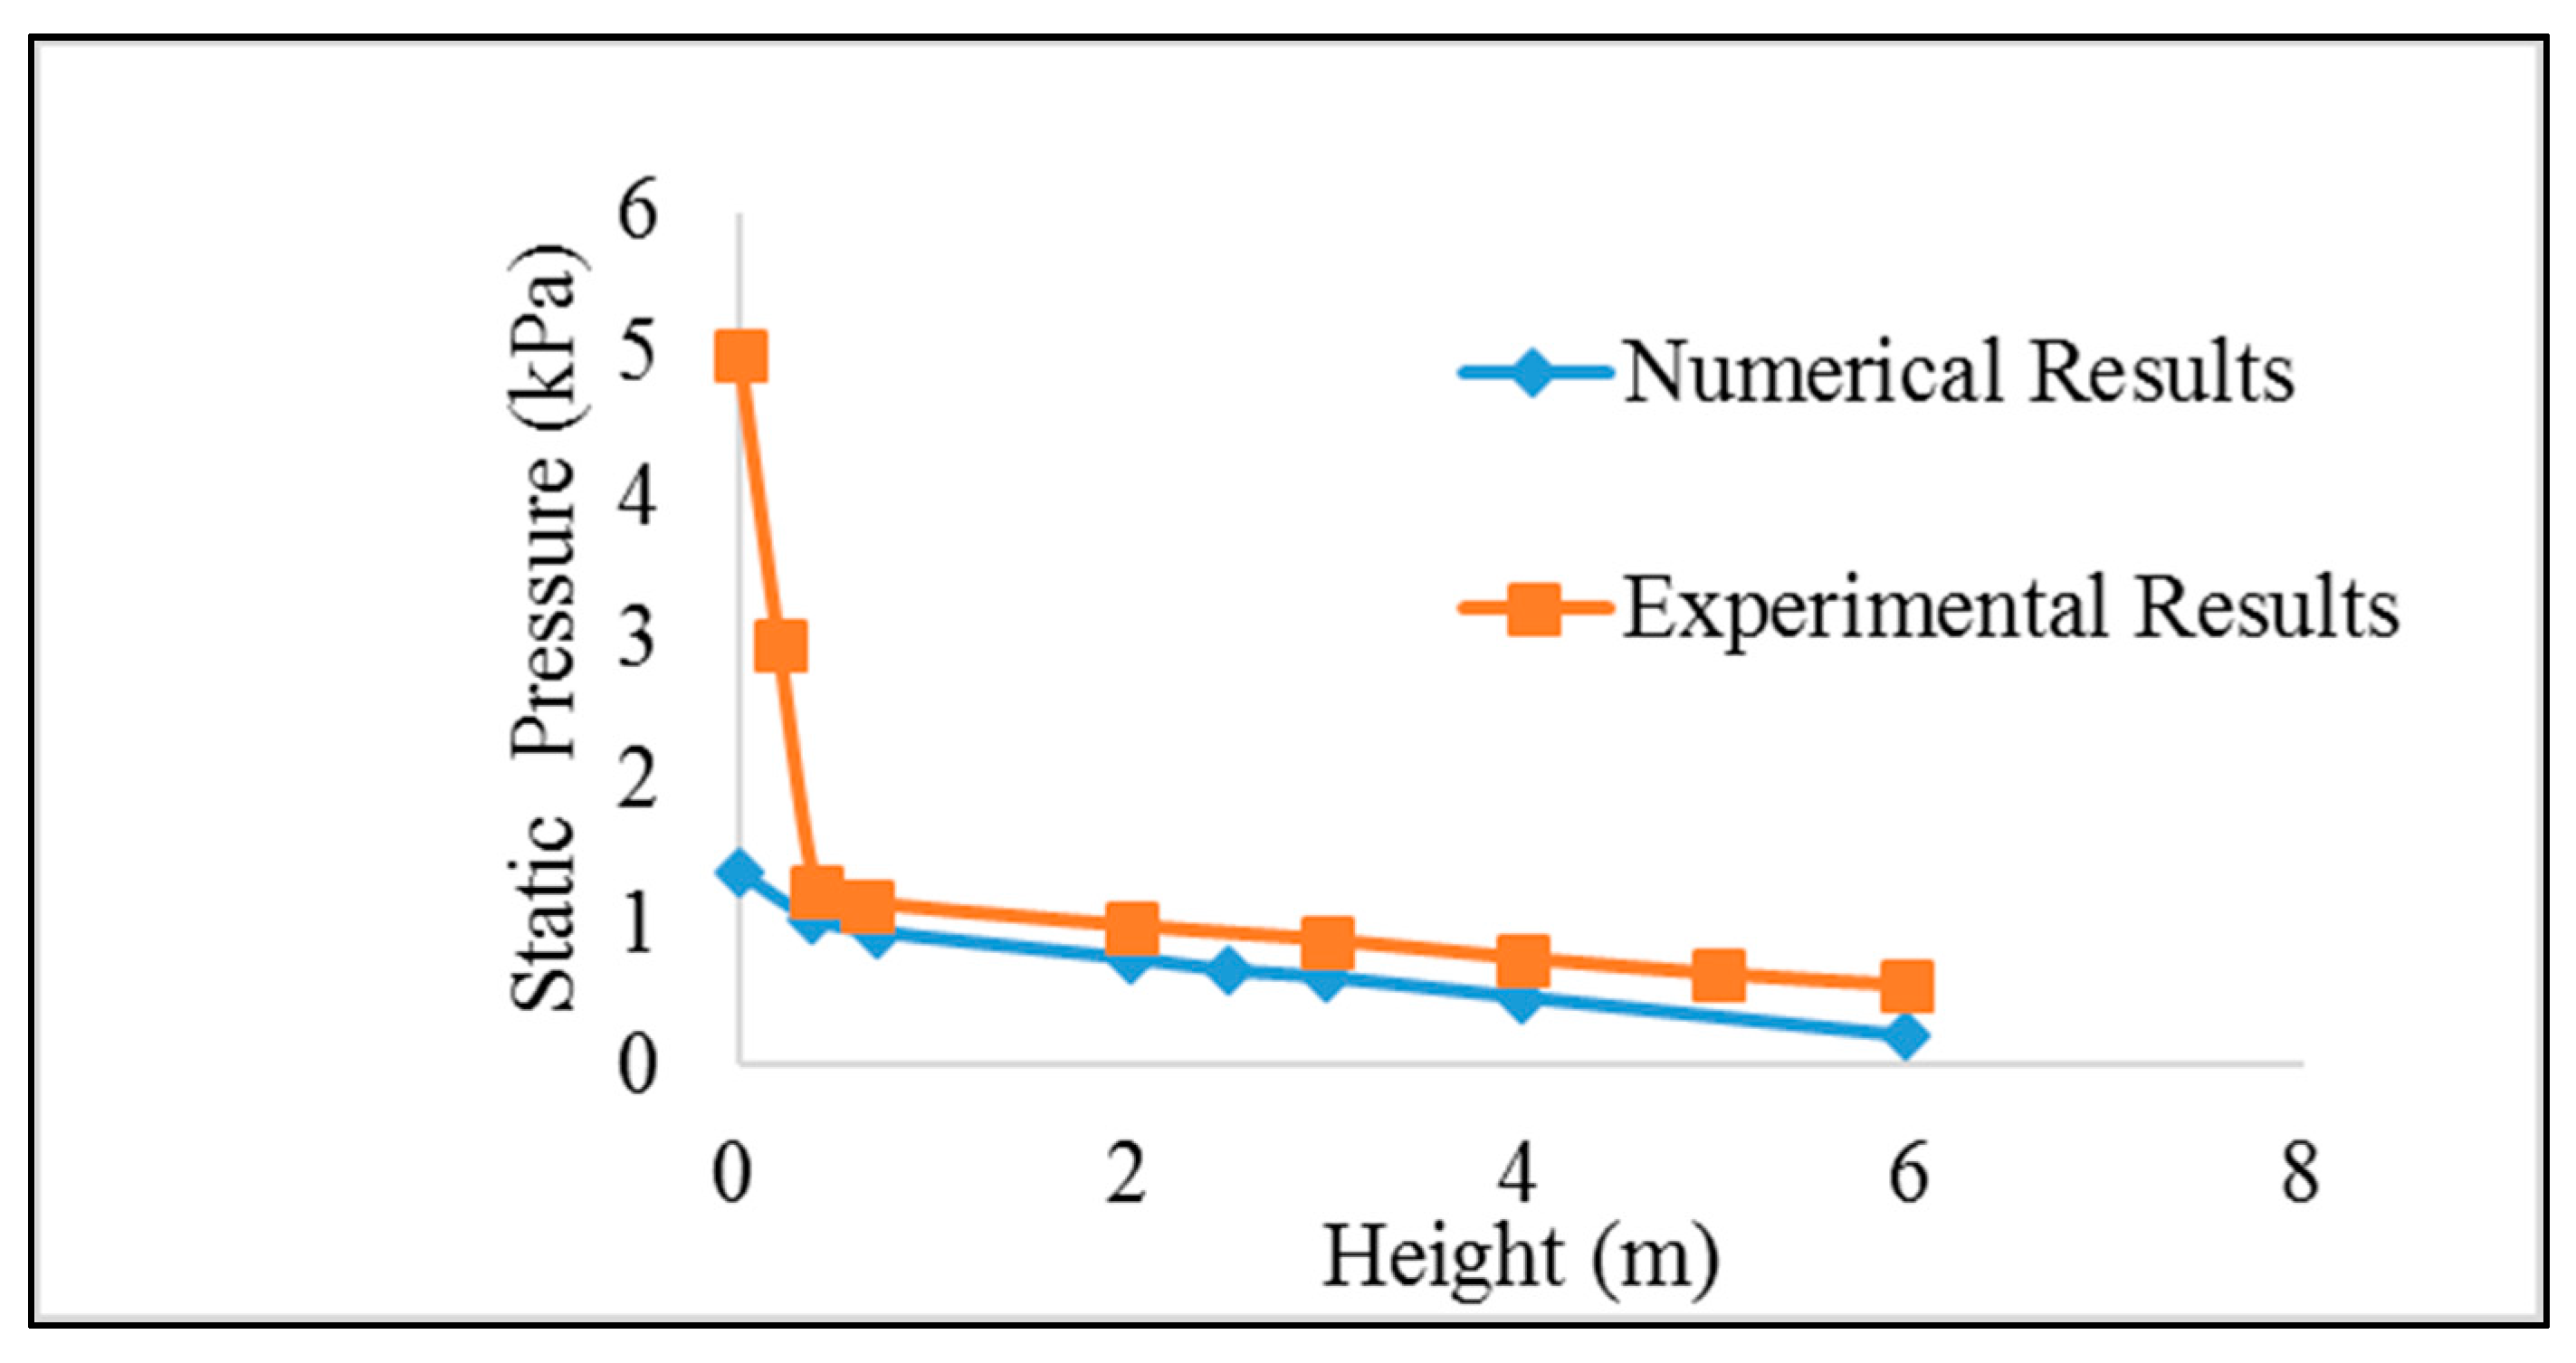
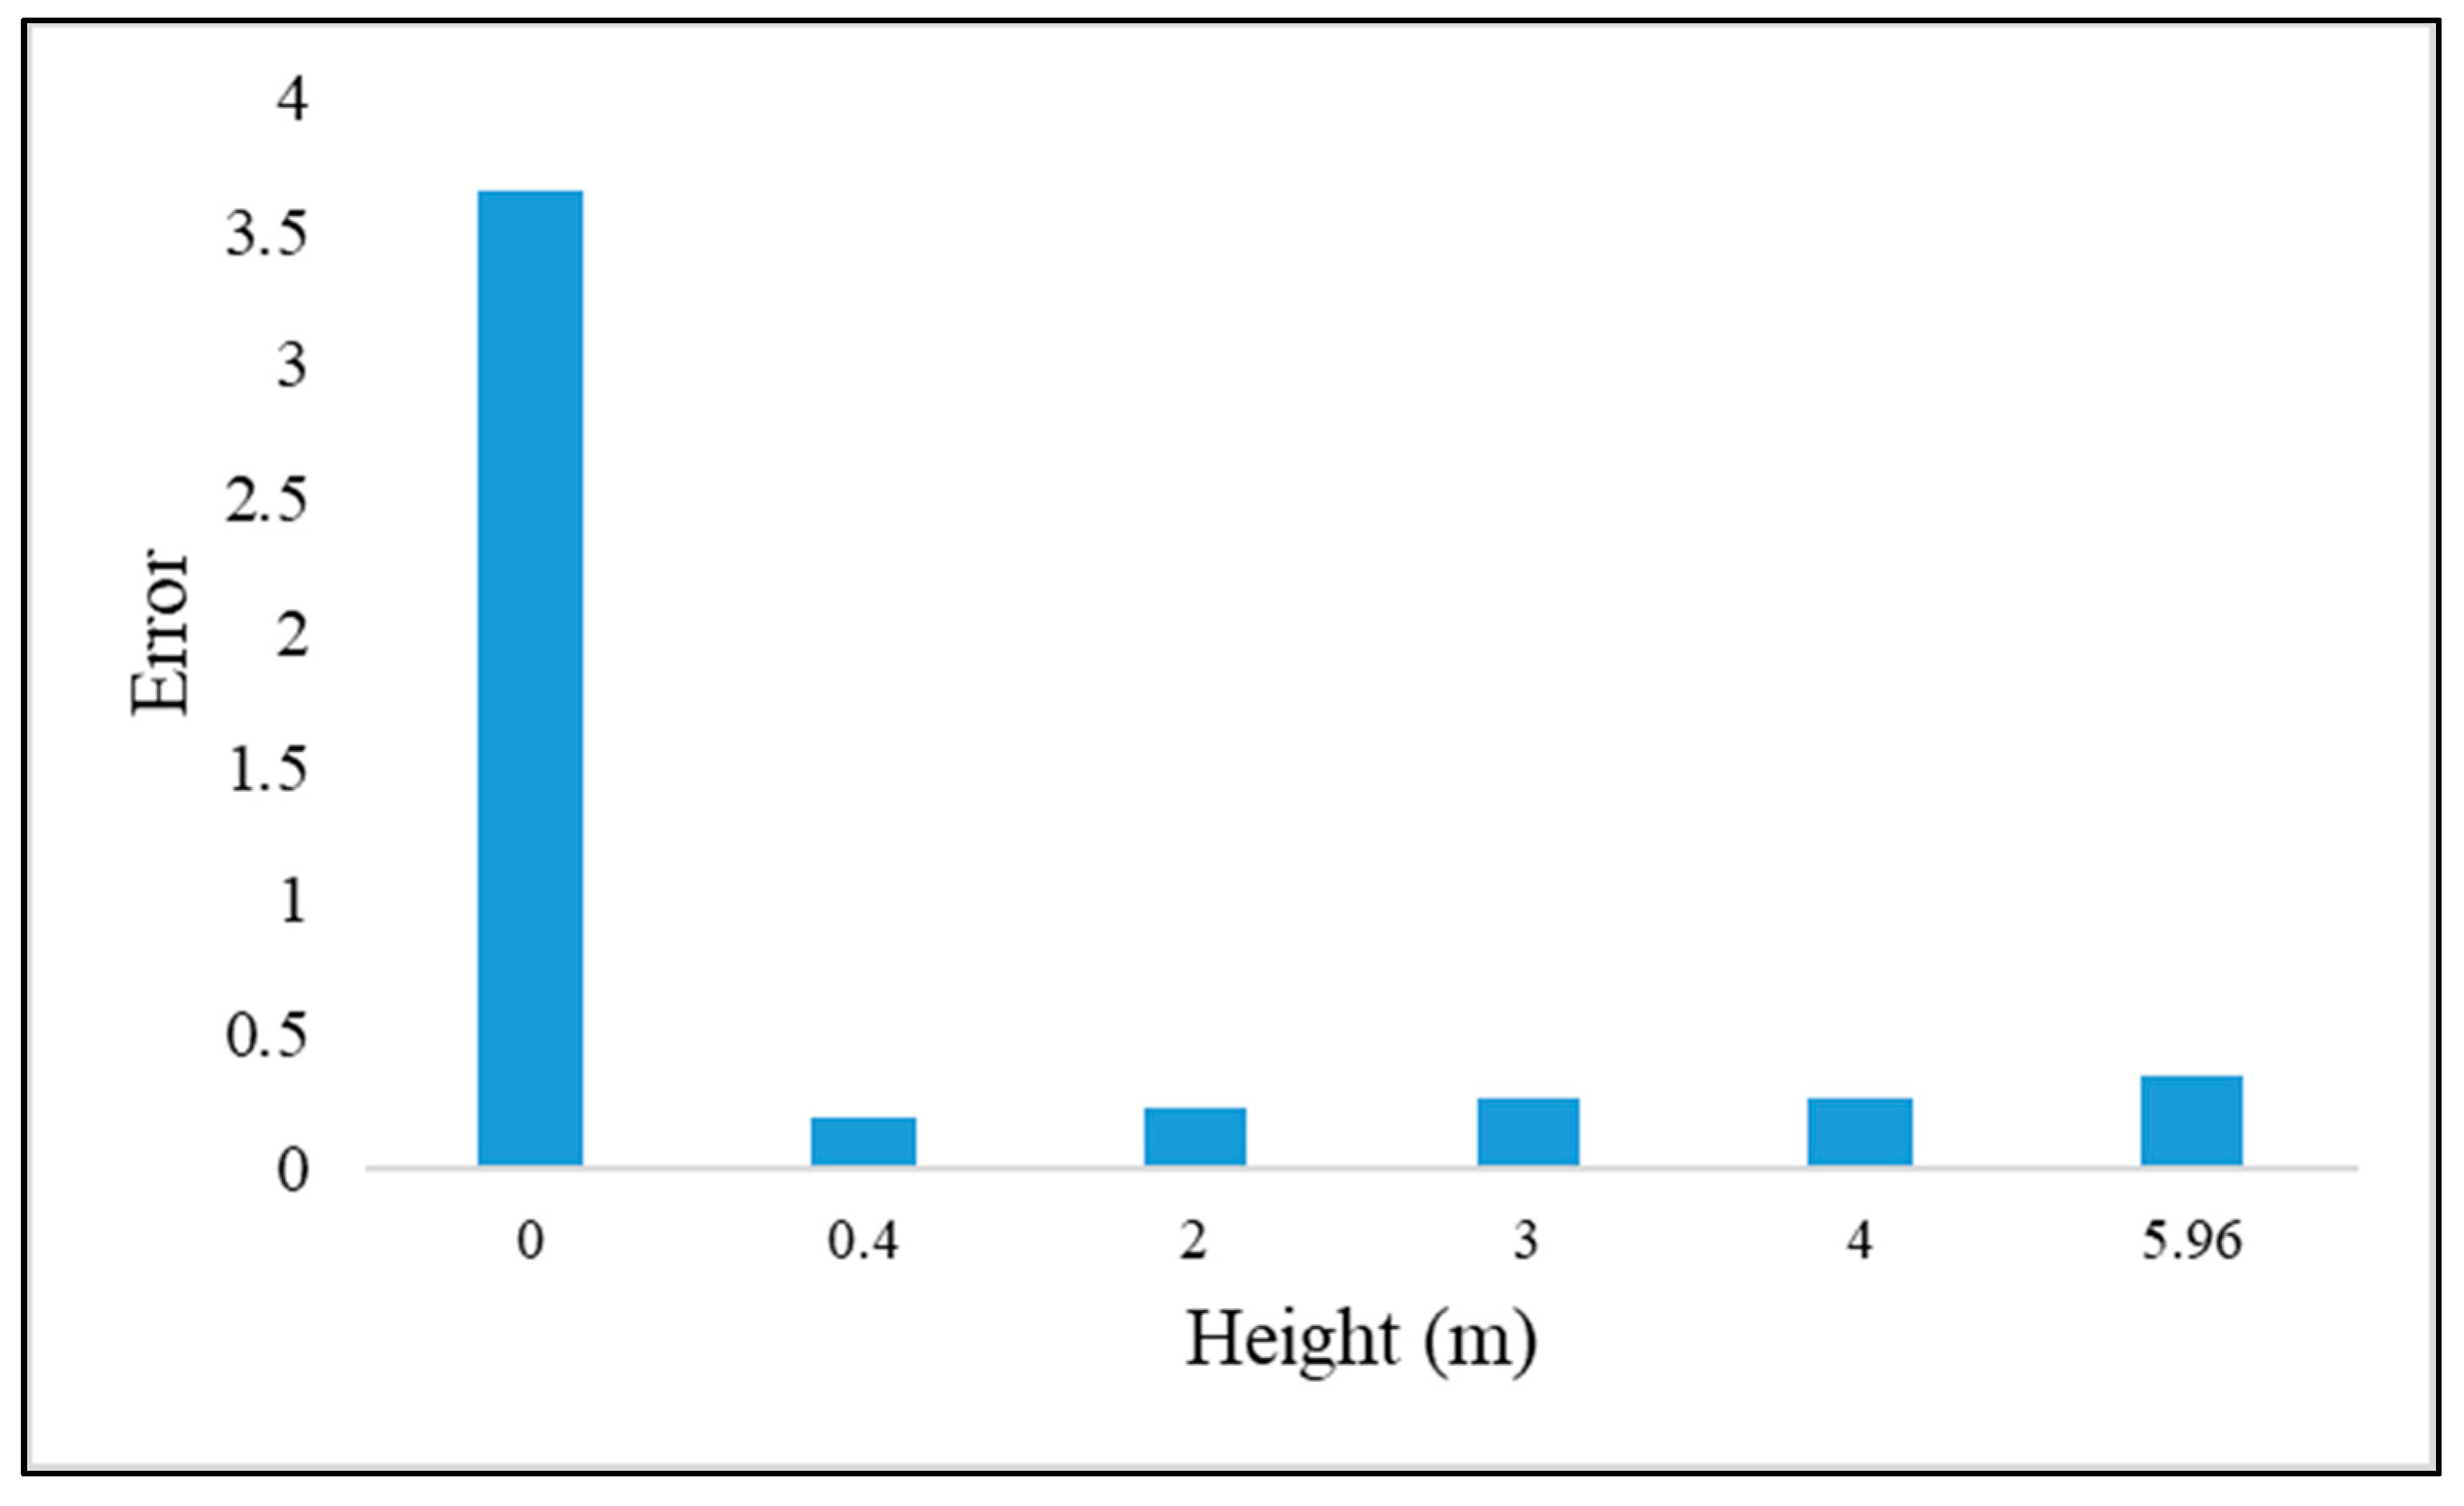
3. Results
4. Conclusions
Author Contributions
Funding
Institutional Review Board Statement
Informed Consent Statement
Data Availability Statement
Conflicts of Interest
References
- Mauna Loa Observatory Hawaii. Measurements of the Concentration of Carbon Dioxide. Available online: https://www.co2.earth/daily-co2 (accessed on 31 January 2021).
- CEA. All India Installed Capacity (in MW) of Power Stations. CEA Report January 2020. Available online: http://cea.nic.in/reports/monthly/installedcapacity/2020/installed_capacity-01.pdf (accessed on 20 December 2020).
- A report published by ZEP. A European Technology and Innovation Platform (ETIP) under the Commission’s Strategic Energy Technologies Plan. Available online: https://zeroemissionsplatform.eu/about-ccs-ccu/what-is-ccs/co2-capture/ (accessed on 18 December 2020).
- Carbon Monitoring for Action. Report Published by Centre for Global Development. 2017. Available online: https://www.cgdev.org/topics/carbon-monitoring-action (accessed on 20 November 2020).
- Ishida, M.; Jin, H. A novel chemical-looping combustor without NOx formation. Ind. Eng. Chem. Res. 1996, 35, 2469–2472. [Google Scholar] [CrossRef]
- Cuadrat, A.; Abad, A.; García, L.F.; Gayán, P.; de Diego, L.F.; Adánez, J. Relevance of the coal rank on the performance of the in situ gasification chemical-looping combustion. Chem. Eng. J. 2012, 195, 91–102. [Google Scholar] [CrossRef] [Green Version]
- Leion, H.; Mattisson, T.; Lyngfelt, A. Solid fuels in chemical-looping combustion. Int. J. Greenh. Gas. Cont. 2008, 2, 180–193. [Google Scholar] [CrossRef]
- Lu, H.; Gidaspow, D.; Bouillard, J.; Wentie, L. Hydrodynamic simulation of gas–solid flow in a riser using kinetic theory of granular flow. Chem. Eng. J. 2003, 95, 1–13. [Google Scholar]
- Abad, A.; García-Labiano, F.; de Diego, L.F.; Gayán, P.; Adánez, J. Reduction kinetics of Cu-, Ni-, and Fe-based oxygen carriers using syngas (CO + H2) for chemical-looping combustion. Energy Fuels 2007, 21, 1843–1853. [Google Scholar] [CrossRef] [Green Version]
- Jung, J.; Gamwo, I.K. Multiphase CFD-based models for chemical looping combustion process: Fuel reactor modeling. Powder Technol. 2008, 183, 401–409. [Google Scholar] [CrossRef]
- Wang, X.F.; Jin, B.S.; Zhong, W.Q. Three-dimensional simulation of fluidized bed coal gasification. Chem. Eng. Process. 2009, 48, 695–705. [Google Scholar] [CrossRef]
- Chen, X.Z.; Shi, D.P.; Gao, X.; Luo, Z.H. A fundamental CFD study of the gas–solid flow field in fluidized bed polymerization reactors. Powder Technol. 2011, 205, 276–288. [Google Scholar] [CrossRef]
- Su, M.Z.; Zhao, H.B.; Ma, J.C. Computational fluid dynamics simulation for chemical looping combustion of coal in a dual circulation fluidized bed. Energy Convers. Manag. 2015, 105, 1–12. [Google Scholar] [CrossRef]
- Deng, Z.Y.; Xiao, R.; Jin, B.S.; Song, Q.L. Numerical simulation of chemical looping combustion process with CaSO4 oxygen carrier. Int. J. Greenh. Gas. Control. 2009, 3, 368–375. [Google Scholar] [CrossRef]
- Parker, J.M. CFD model for the simulation of chemical looping combustion. Powder Technol. 2014, 265, 47–53. [Google Scholar] [CrossRef]
- Han, L.; Bollas, G.M. Dynamic optimization of fixed bed chemical-looping combustion processes. Energy 2016, 112, 1107–1119. [Google Scholar] [CrossRef] [Green Version]
- Zhang, Y.W.; Chao, Z.X.; Hugo, A.J. Modelling and simulation of chemical looping combustion process in a double loop circulating fluidized bed reactor. Chem. Eng. J. 2017, 320, 271–282. [Google Scholar] [CrossRef] [Green Version]
- Haus, J.; Hartge, E.U.; Heinrich, S.; Werther, J. Dynamic flowsheet simulation for chemical looping combustion of methane. Int J. Greenh. Gas. Control. 2018, 72, 26–37. [Google Scholar] [CrossRef]
- Hamidouche, Z.; Masi, E.; Fede, P.; Simonin, O.; Mayer, K.; Penthor, S. Unsteady three-dimensional theoretical model and numerical simulation of a 120-kW chemical looping combustion pilot plant. Chem. Eng. Sci. 2019, 193, 102–119. [Google Scholar] [CrossRef] [Green Version]
- Arjmand, M.; Leion, H.; Mattisson, T.; Lyngfelt, A. Investigation of different manganese ores as oxygen carriers in chemical-looping combustion (CLC) for solid fuels. Appl. Energy 2014, 113, 1883–1894. [Google Scholar] [CrossRef]
- Menon, K.G.; Patnaikuni, V.S. CFD simulation of fuel reactor for chemical looping combustion of Indian coal. Fuel. 2017, 203, 90–101. [Google Scholar] [CrossRef]
- Haider, S.K.; Duan, L.; Patchigolla, K.; Anthony, E. A hydrodynamic study of a fast-bed dual circulating fluidized bed for chemical looping combustion. Energy Technol. 2016, 4, 1254–1262. [Google Scholar] [CrossRef] [Green Version]
- Singh, R.I.; Brink, A.; Hupa, M. CFD modeling to study fluidized bed combustion and gasification. App. Therm. Eng. 2013, 52, 585–614. [Google Scholar] [CrossRef]
- Shuai, W.; Guodong, L.; Huilin, L.; Juhui, C.; Yurong, H.; Jiaxing, W. Fluid dynamic simulation in a chemical looping combustion with two interconnected fluidized beds. Fuel Process. Technol. 2011, 92, 385–393. [Google Scholar] [CrossRef]
- Hamidouche, Z.; Ku, X.; Lin, J.; Wang, J. Numerical simulation of a chemical looping combustion of biomass: Hydrodynamic investigation. Fuel Process. Technol. 2020, 207, 106486. [Google Scholar] [CrossRef]
- Fan, F.; Zhang, M.; Peng, Z.; Chen, J.; Su, M.; Moghtaderi, B.; Doroodchi, E. Direct Simulation Monte Carlo Method for Acoustic Agglomeration under Standing Wave Condition. Aerosol Air Qual. Res. 2017, 17, 1073–1083. [Google Scholar] [CrossRef] [Green Version]
- Mahalatkar, K.; Kuhlman, J.; Huckaby, E.D.; O’Brien, D. CFD Simulation of a chemical looping fuel reactor utilizing solid fuel. Chem. Eng. Sci. 2011, 66, 3617–3627. [Google Scholar] [CrossRef]
- Yang, M.; Banerjee, S.; Agarwal, R.K. Transient Cold Flow Simulation of Fast Fluidized Bed Fuel Reactors for Chemical-Looping Combustion. ASME J. Energy Resour. Technol. 2018, 140. [Google Scholar] [CrossRef]
- Syamlal, M.; O’Brien, T. Computer simulation of bubbles in a fluidized bed. AIChE Symp. Ser. 1989, 85, 22–31. [Google Scholar]
- Peng, Z.; Doroodchi, E.; Alghamdi, Y.; Moghtaderi, B. Mixing and segregation of solid mixtures in bubbling fluidized beds under conditions pertinent to the fuel reactor of a chemical looping system. Powder Technol. 2013, 235, 823–837. [Google Scholar] [CrossRef]
- Peng, Z.; Doroodchi, E.; Alghamdi, Y.A.; Shah, K.; Luo, C.; Moghtaderi, B. CFD–DEM simulation of solid circulation rate in the cold flow model of chemical looping systems. Chem. Eng. Res. Design. 2015, 95, 262–280. [Google Scholar] [CrossRef]
- Peng, Z.; Alghamdi, Y.A.; Moghtaderi, B.; Doroodchi, E. CFD-DEM investigation of transition from segregation to mixing of binary solids in gas fluidised beds. Adv. Powder Technol. 2016, 27, 2342–2353. [Google Scholar] [CrossRef]


| Parameters | Value |
|---|---|
| Particle diameter | 60 μm |
| Density of particles | 5150 kg/m3 |
| Material in primary phase | Air |
| Material in discreet phase | Hematite |
| Discretization scheme | Second-order Upwind |
| Particle inlet boundary condition | Wall, 0.04 kg/s |
| Gas inlet boundary condition | Velocity inlet at 2.50 m/s |
| Outlet boundary condition | Pressure Outlet |
| Numerical scheme | Phase Coupled Simple |
| Drag model | Syamlal–O’Brien |
| Time step | Fluid: 10−3 s, Particle: 10−4 s |
Publisher’s Note: MDPI stays neutral with regard to jurisdictional claims in published maps and institutional affiliations. |
© 2021 by the authors. Licensee MDPI, Basel, Switzerland. This article is an open access article distributed under the terms and conditions of the Creative Commons Attribution (CC BY) license (http://creativecommons.org/licenses/by/4.0/).
Share and Cite
Kumar, P.; Parwani, A.K.; Gupta, D.K.; Vitankar, V. Transient Cold Flow Simulation of Fast-Fluidized Bed Air Reactor with Hematite as an Oxygen Carrier for Chemical Looping Combustion. Appl. Sci. 2021, 11, 2288. https://doi.org/10.3390/app11052288
Kumar P, Parwani AK, Gupta DK, Vitankar V. Transient Cold Flow Simulation of Fast-Fluidized Bed Air Reactor with Hematite as an Oxygen Carrier for Chemical Looping Combustion. Applied Sciences. 2021; 11(5):2288. https://doi.org/10.3390/app11052288
Chicago/Turabian StyleKumar, Pulkit, Ajit K. Parwani, Dileep Kumar Gupta, and Vivek Vitankar. 2021. "Transient Cold Flow Simulation of Fast-Fluidized Bed Air Reactor with Hematite as an Oxygen Carrier for Chemical Looping Combustion" Applied Sciences 11, no. 5: 2288. https://doi.org/10.3390/app11052288