
Criticality Analysis for BWR Spent Fuel Based on the Burnup Credit Evaluation from Full Core Simulations


1
School of Engineering, University of Liverpool, Liverpool L69 3GH, UK
2
National Nuclear Laboratory, Chadwick House, Warrington WA3 6AE, UK
*
Author to whom correspondence should be addressed.
Appl. Sci. 2021, 11(4), 1498; https://doi.org/10.3390/app11041498
Submission received: 6 January 2021
/
Revised: 2 February 2021
/
Accepted: 4 February 2021
/
Published: 7 February 2021
(This article belongs to the Special Issue Nuclear Wastes Management)
Abstract
:This study performed criticality analysis for the GBC-68 storage cask loaded with boiling water reactor (BWR) spent fuel at the discharged burnups obtained from the full-core simulations. The analysis was conducted for: (1) different reloading scenarios; (2) target burnups; and (3) two fuel assembly types—GE14 and SVEA100—to estimate the impact each of the three factors has on the cask reactivity. The BWR spent fuel composition was estimated using the results of the nodal analysis for the advanced boiling water reactor (ABWR) core model developed in this study. The nodal calculations provided realistic operating data and axial burnup and coolant density profiles, for each fuel assembly in the reactor core. The estimated cask’s keff were compared with the fresh fuel and peak reactivity standards to identify the benefit of the burnup credit method applied to the BWR spent fuel at their potential discharge burnups. The analysis identified the significant cask criticality reduction from employing the burnup credit approach compared to the conventional fresh fuel approach. However, the criticality reduction was small compared to the peak reactivity approach, and could even disappear for low burnt fuel assemblies from non-optimal reloading patterns. In terms of cask manufacturing, the potential financial benefit from using the burnup credit approach was estimated to be USD 3.3 million per reactor cycle.
Keywords:
burnup credit; BWR; GBC-68 cask; spent fuel storage; criticality analysis; nodal calculations; GE14; SVEA1001. Introduction
Criticality safety analysis is a mandatory procedure for all facilities and activities dealing with fissile material [1]. It determines if the system of interest is subcritical, critical, or supercritical for both normal and accident conditions. Most often, the safety limits for the analysed system are defined by the value of the effective multiplication factor (keff). In the current project, the authors will focus on the criticality analysis of the storage cask loaded with boiling water reactor (BWR) spent fuel (SF).
In general, criticality analysis is based on different approximations which take into account the uncertainties in the initial data [2]. The most traditional and conservative approach regarding criticality analysis for operations involving spent fuel is the so-called “fresh fuel approach”, where the fuel in the system is modelled as unirradiated and without burnable absorber present. The limitations of the fresh fuel approach become obvious when the fuel enrichment is high [3], as with a higher initial fissile material content, the assembly criticality also increases, and thus additional safety measures are required for the spent fuel handling. The advantage of the fresh fuel approach is that it does not require sophisticated calculations or extensive nuclear codes’ verification and validation. As computational tools have been improved and more experimental information has been accumulated about spent fuel properties [4], it has become possible to perform reliable estimations of spent fuel properties or, in other words, to take credit for the reactivity reduction in the nuclear fuel during irradiation. This approach of the criticality analysis is called burnup credit (BUC) method. Application of the burnup credit method can reduce costs of spent fuel management, for example, by increasing storage or transport casks capacity or by removing absorbing panels and thereby reducing the costs associated with cask manufacturing [4].
The burnup credit method can be applied on different levels such as actinides only, actinides and fission products or integral burnable absorber [5]. On the first two levels, credit is taken for the set of specific nuclides (major actinides on the first level, and additional minor actinides and fission products on the second level) defined in [6] as suitable for burnup credit as they play a major role in the system’s reactivity reduction and have a comprehensive experimental data. On the last, integral burnable absorber level, the credit is taken for the reactivity reduction at the maximum reactivity value of the fuel assembly (FA) with burnable absorber (poison) in comparison with the fresh fuel approach. For poisoned FAs (gadolinia in the case of BWRs), the initially low reactivity increases up to certain value (peak reactivity) and then declines after the absorber is burnt. The given BUC approach is often referred to as peak reactivity. The safety criteria for burnup credit are based on the loading curve of the analysed system. The loading curve determines the minimal fuel assembly burnup as a function of its initial enrichment under which the assembly can be placed into the storage or transport system [7]. The loading curve should be estimated for each licensing condition, such as different assembly cooling times. Another important part of the BUC analysis is the validation of the codes used for depletion and criticality analysis along with their nuclear data libraries. The study [8] performed as the part of this project showed that even well-known lattice codes can produce noticeably different results. Hence, the burnup credit method is more complicated in comparison with fresh fuel approach in terms of regulatory requirements, computational methods, as well as software verification and validation, but can potentially gain a significant benefit for spent fuel management.
BWRs are of particular interest for the burnup credit analysis due to their complex assembly design (e.g., multiple rod geometries and compositions per fuel assembly) in comparison with pressurised water reactors (PWRs) and being less researched, despite the global deployment of BWR technology [9]. Moreover, some future Generation III+ reactor designs such as advanced boiling water reactor (ABWR) or economic simplified boiling water reactor (ESBWR) [10] are based on BWR technology. The most recent extensive research regarding burnup credit application to transport and storage of BWR spent fuel was performed by Oak Ridge National Laboratory (ORNL) as a part of their five-year program with the US Nuclear Regulatory Commission (NRC) [11]. The project had two phases: (1) burnup credit analysis for BWR spent fuel near the peak reactivity; and (2) for the burnups beyond peak reactivity or so-called extended BUC. The authors investigated the effect of design and operating parameters of BWR systems on the final storage and transport cask criticality, along with verification and validation of the utilised tools [11]. Although the effect of axial burnup and moderator densities profiles were studied during the project, the limitation of the tools did not allow to track changes of these profiles over the cycle, so analysis was performed using the cycle-averaged data [12]. The different modules and versions of SCALE [13] nuclear code were used for the project. Another recent study [14], investigated the compound effect: the effect of the variation of the several operating parameters on burnup credit for various assembly burnups. The authors showed the correlation between effective multiplication factor (keff) of the storage cask and fuel burnup for single and compound effects of the operating parameters variation. However, the study included a range of assumptions and simplifications regarding fuel assembly design and operating parameters.
Other research on the BWR BUC is presented in a series of works [15,16]. In the first part of the study [15], the authors created an advanced 3D model of the BWR fuel assembly with complex design and compounding operating parameters for depletion analysis and compared it to the simplified 2D lattice models. The results showed substantial changes in the criticality curve and U-235 and Gd-155 depletion when using the advanced model. The second part of this research [16] was focused on the criticality analysis and uncertainty quantification (UQ) for the cask loaded with BWR spent fuel discharged at the peak reactivity using depletion models developed in the first part of the research [15]. Authors concluded that the advanced 3D model of the BWR fuel assembly is highly beneficial for the burnup credit since it can incorporate parameters which significantly affect the cask criticality such as axial burnup or coolant density profiles.
Uncertainty analysis is an essential part of the burnup credit method. Fuel depletion in criticality analysis leads to many additional uncertainties in comparison with the fresh fuel approach. The isotopic prediction is viewed as a possible primary source of uncertainties related to the fuel burnup [17]. There have been several studies on uncertainty analysis associated with BWRs in recent years [18,19,20,21]. The work [18] related to the isotopic uncertainty, comparing two approaches for the uncertainty analysis: (1) computational (uncertainty in the input parameters), and (2) data-driven (usage of the experimental data and previous expertise in the criticality assessment). The authors identified that the data-driven approach provides a larger contribution to the uncertainty value than the computational approach.
The present study is an extension of the work [22] which was focused on creating the BWR reactor core model for the nodal analysis using the Advanced BWR design [23] to get the spent fuel (SF) data for further criticality analysis of the BWR transport and storage cask. The nodal calculations were performed for various core loading strategies to estimate the possible range of the assemblies’ discharge burnups. In this part of the study, the authors will focus on applying the results of the full-core simulations to the extended burnup credit for BWR spent fuel. The study will also investigate the impact of the loading strategy (refuelling process in particular), target burnup and assembly type on the results of the BUC. In summary, the authors pose the following research question: “Will further investigation into the application of new modelling and simulation techniques benefit existing burnup credit strategies?”.
The paper is structured as follows: Section 2 gives an overview of the utilised computational tools. Section 3 describes the FAs models, reactor core design and storage cask design. Section 4 outlines the methods for the nodal reactor core analysis and criticality analysis sequence of the storage cask. Section 5 describes and discusses the criticality analysis results for different FAs designs, refuelling scenarios, and target burnups. Section 6 summarises conclusions of the study.
2. Computational Tools
The current study utilises the SCALE 6.2 code system as the main tool for the reactor physics and criticality calculations. The SCALE 6.2 package is developed and supported by Oak Ridge National Laboratory (ORNL), USA, and distributed by the OECD/NEA databank [13]. The 2D lattice physics calculations were performed using the Polaris module of SCALE, which employs the method of characteristics as the transport solver [24,25]. The self-shielding effect is calculated using embedded self-shielding method (ESSM). Polaris is optimised for light water reactor analysis and can be used with 252 and 56 multigroup ENDF/B-VII.1 based cross-section libraries. In this research, Polaris was utilised for the homogenised two-group cross-section preparation for use in nodal analysis with DYN3D code [26] and estimation of the spent fuel composition of BWR fuel assemblies for further criticality analysis.
Polaris is internally combined with the ORIGEN module to conduct depletion and decay calculations on fuel assembly level [13]. This calculation sequence is referred to as the Polaris/ORIGEN sequence in this study when referring to fuel isotopic predictions due to depletion/decay processes. The OPUS module, which parses results from the ORIGEN binary concentration files, is utilised here for spent fuel composition extraction after lattice physics calculations in Polaris. KENO V.a, another module within the SCALE package, is used to perform criticality estimations for the storage cask filled with BWR spent fuel assemblies. KENO is a 3D Monte Carlo module within the SCALE package which can estimate effective multiplication factor (keff), flux densities and other parameters of interest in 3D systems [13]. It can perform criticality analysis based on multigroup or continuous nuclear data libraries. KENO V.a is an earlier version of KENO VI module and has less flexible geometry capabilities but has a significantly lower computation burden and was therefore employed in this study.
The reactor core analysis was performed using DYN3D nodal core simulator [26] developed by Helmholtz-Zentrum Dresden-Rossendorf (HZDR), Germany. Two-group macroscopic cross-section library was used to provide fully coupled neutronic/thermal-hydraulic analysis based on the nodal approach. DYN3D produced axial burnup profiles of the discharged FAs and axial coolant density distributions for FAs during the reactor operation used in further depletion calculations.
3. Models Description
3.1. Fuel Assembly Design
3.1.1. BWR GE14 10 × 10
The work presented here considered two different fuel assembly designs: (1) BWR GE14 10 × 10; and (2) SVEA-100, for the full core and criticality analysis. The BWR GE14 assembly was set as a reference, while SVEA-100 was used to estimate the effect of the FA design change on the results of the analysis. BWR fuel assemblies are often non-uniformly enriched. To simply the modelling approach, the current study used an averaged radial fuel enrichment. Work presented in [15] showed that averaging fuel enrichment only has a small impact on the keff and isotopic composition in BWR spent fuel. As a real-life fuel enrichment patterns are rarely available in the open literature for the modern BWR fuel assembly designs, that would be of high interest to investigate their behaviour if the operator provides detailed data.
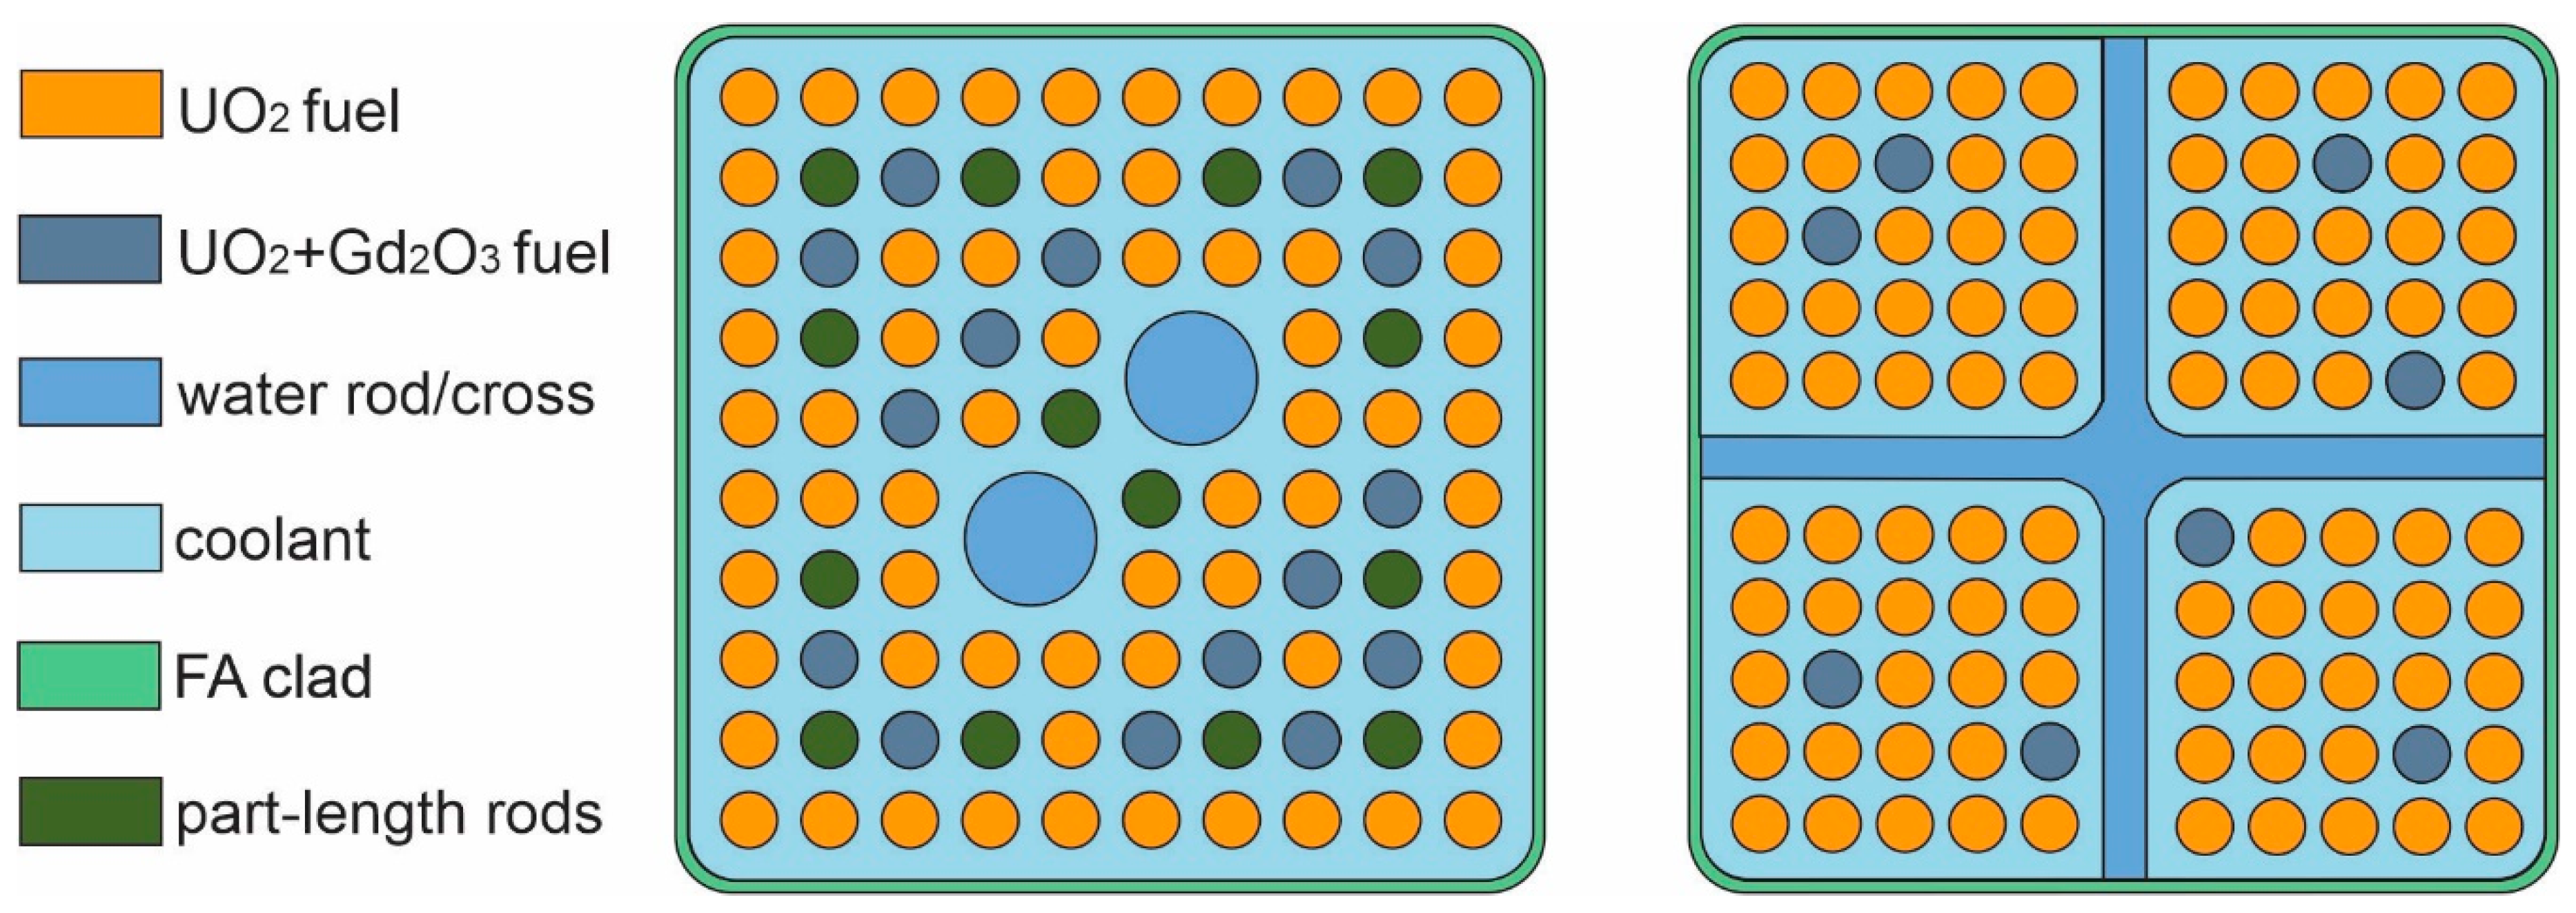
The fuel in BWR GE14 assembly has a U-235 content of 4.5 wt.%, and gadolinia rods contain in addition 7 wt.% Gd2O3. The fuel assembly consists of 92 fuel rods in total out of which 14 are the part-length rods dividing the FA into two lattices—dominant and vanished, and 15 are burnable poison rods (Figure 1). The assembly design parameters are explicitly described in the first part of this study [22] with the key data summarised in Table 1.
3.1.2. SVEA-100
The considered SVEA-100 fuel assembly design is based on the data from the Swedish Forsmark Unit 3 reactor description [28,29]. The fuel is enriched to 3 wt.% U-235 and contains 8 burnable poison rods (Figure 1) with 4.4 wt.% Gd2O3. The FA consists of 100 fuel rods separated by a water cross which splits FA into four sub-bundles of 5 × 5 size each, as shown in Figure 1. The summary of the main SVEA-100 FA parameters is also presented in Table 1. The SVEA-100 FA design is significantly less complex than the GE14 design, and pellet radii, as well as assembly height values, are lower than in the GE14 assembly design, leading to an approximately 6.5% lower total fuel volume.
3.2. Reactor Core Design
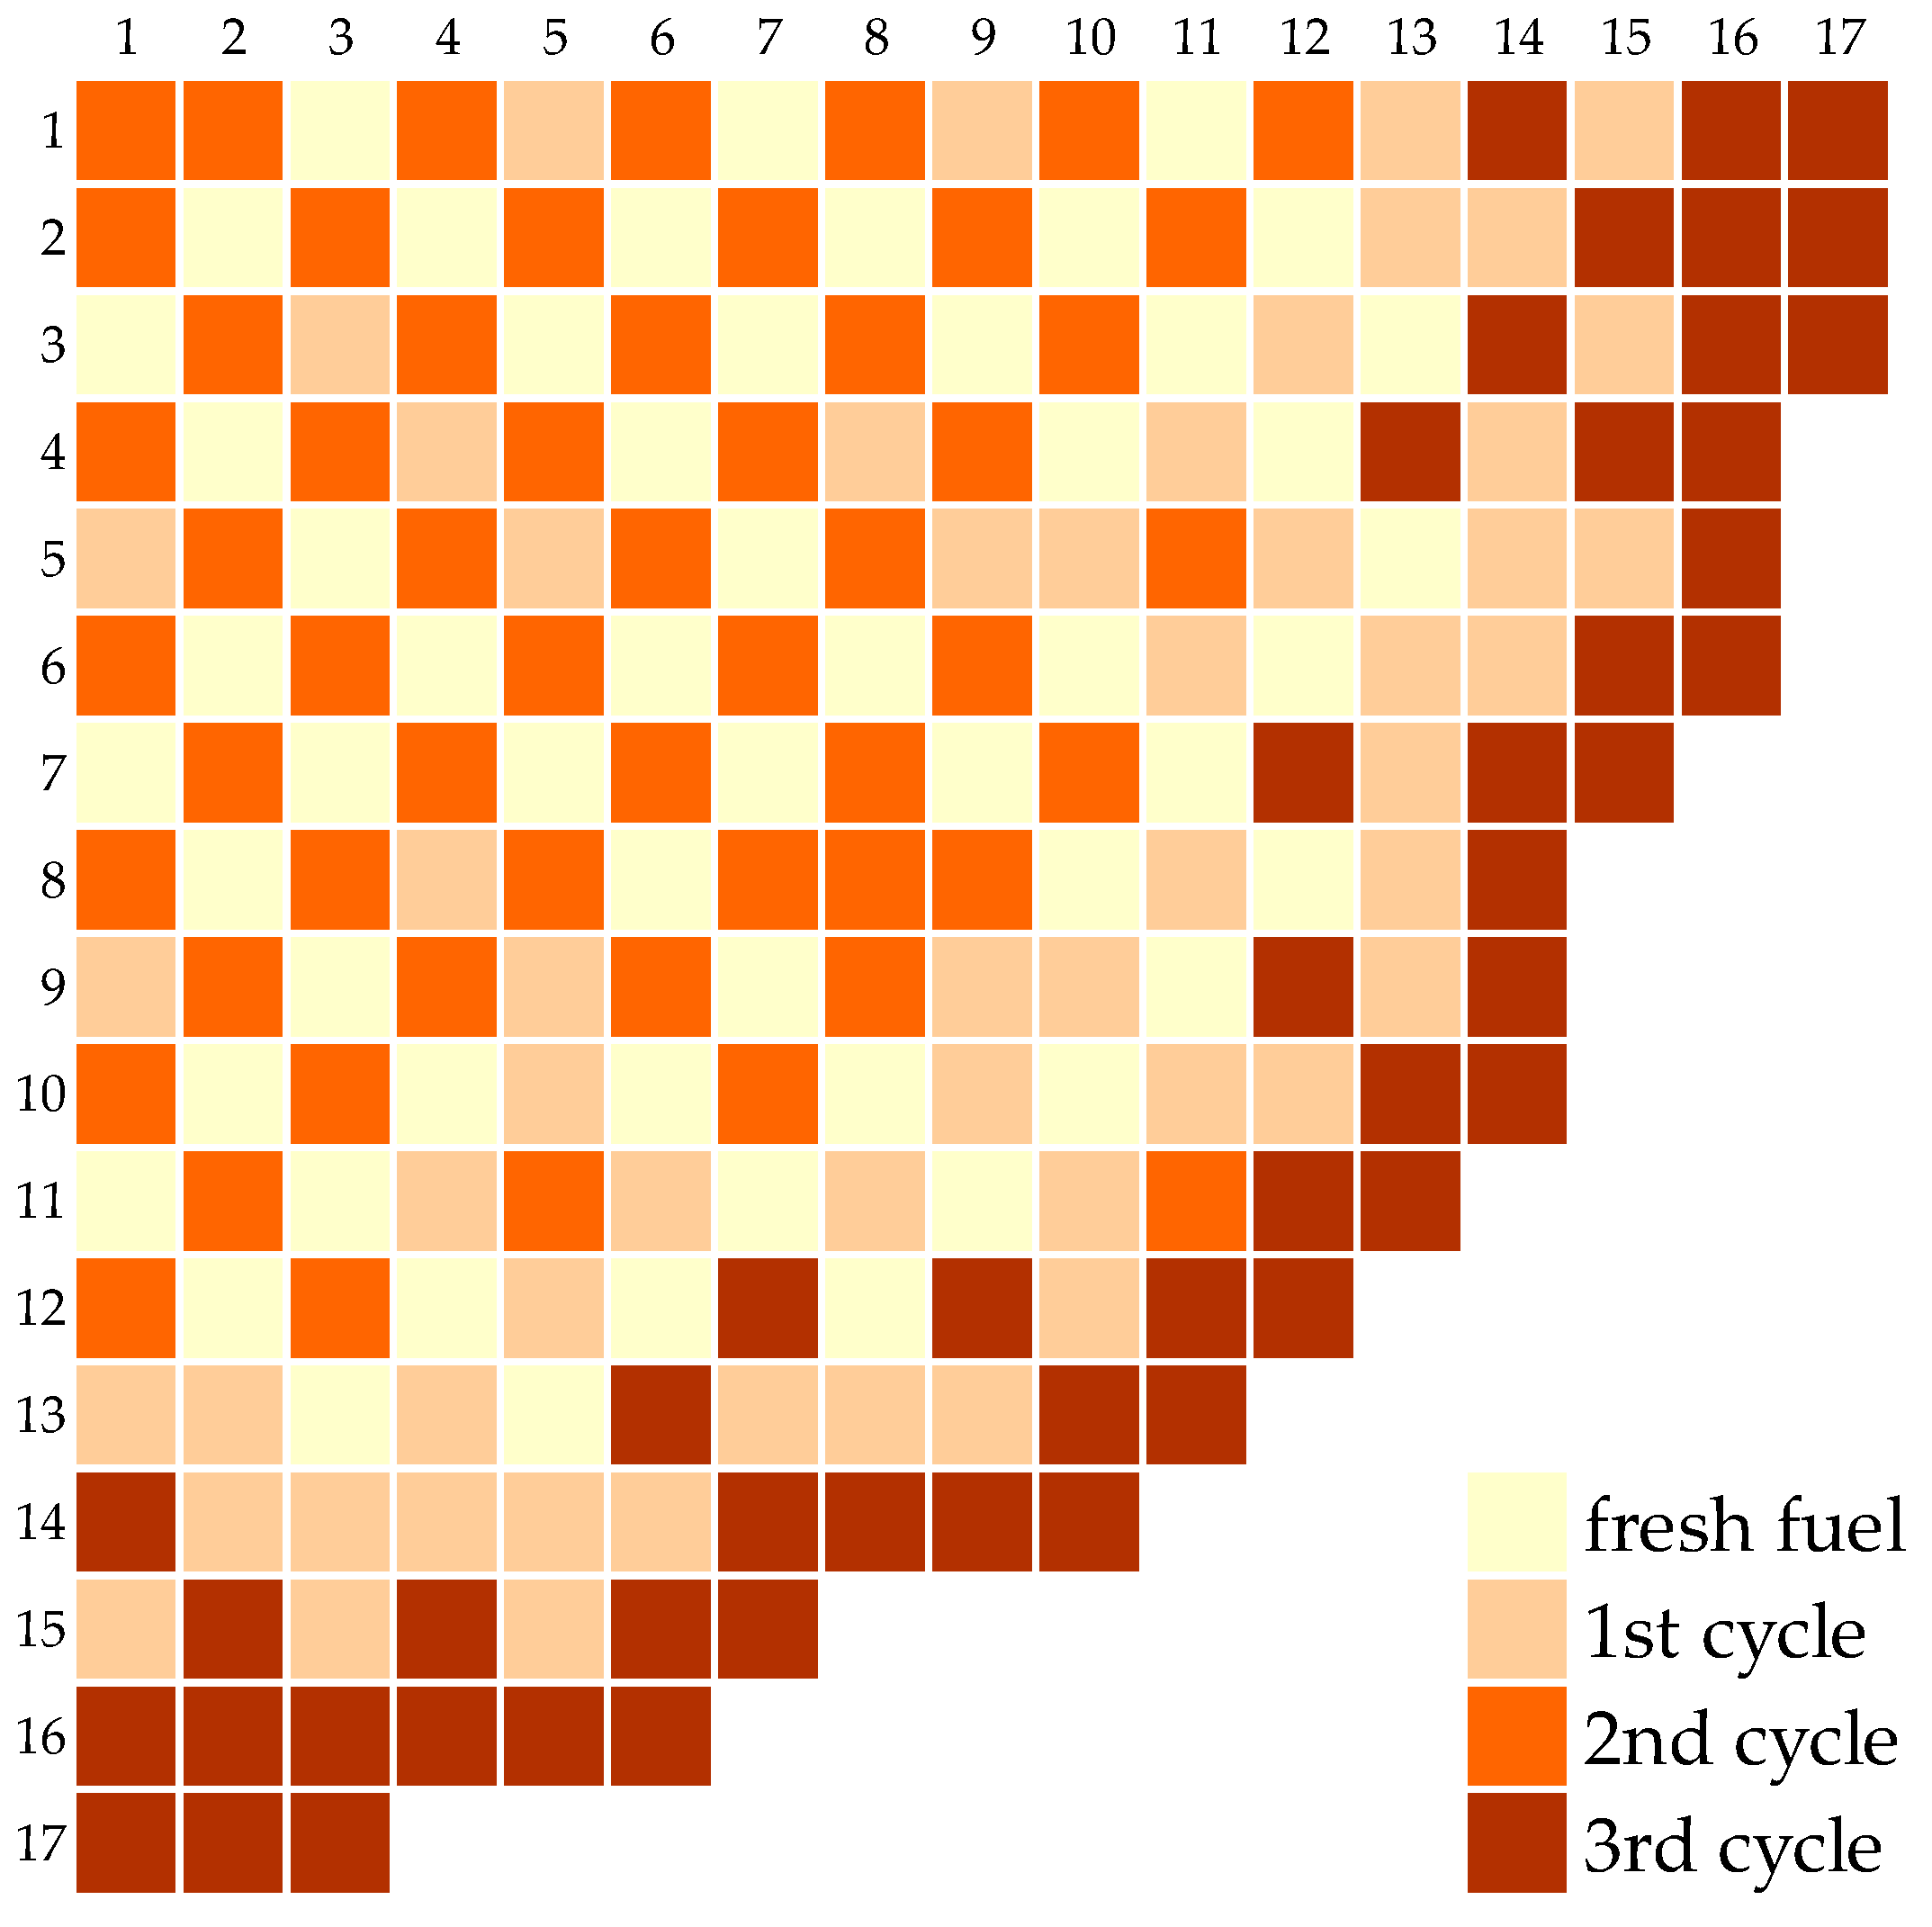
The current study uses the BWR full core model based on Ref. [23] but with a modified core layout, as outlined in [22]. The reactor core comprises 872 fuel assemblies of four fuel cycles, with the core layout shown in Figure 2. The number of fresh, first and second cycle assemblies is equal to 224, while only 200 fuel assemblies are used in the third cycle (224 × 3 + 200 = 872). In contrast to an industrial standard model, the full core model considered in this study aims to reproduce the general behaviour of the FA in the core, thus only a reduced number of safety parameters were controlled during the simulation.
3.3. GBC-68 Storage Cask Design
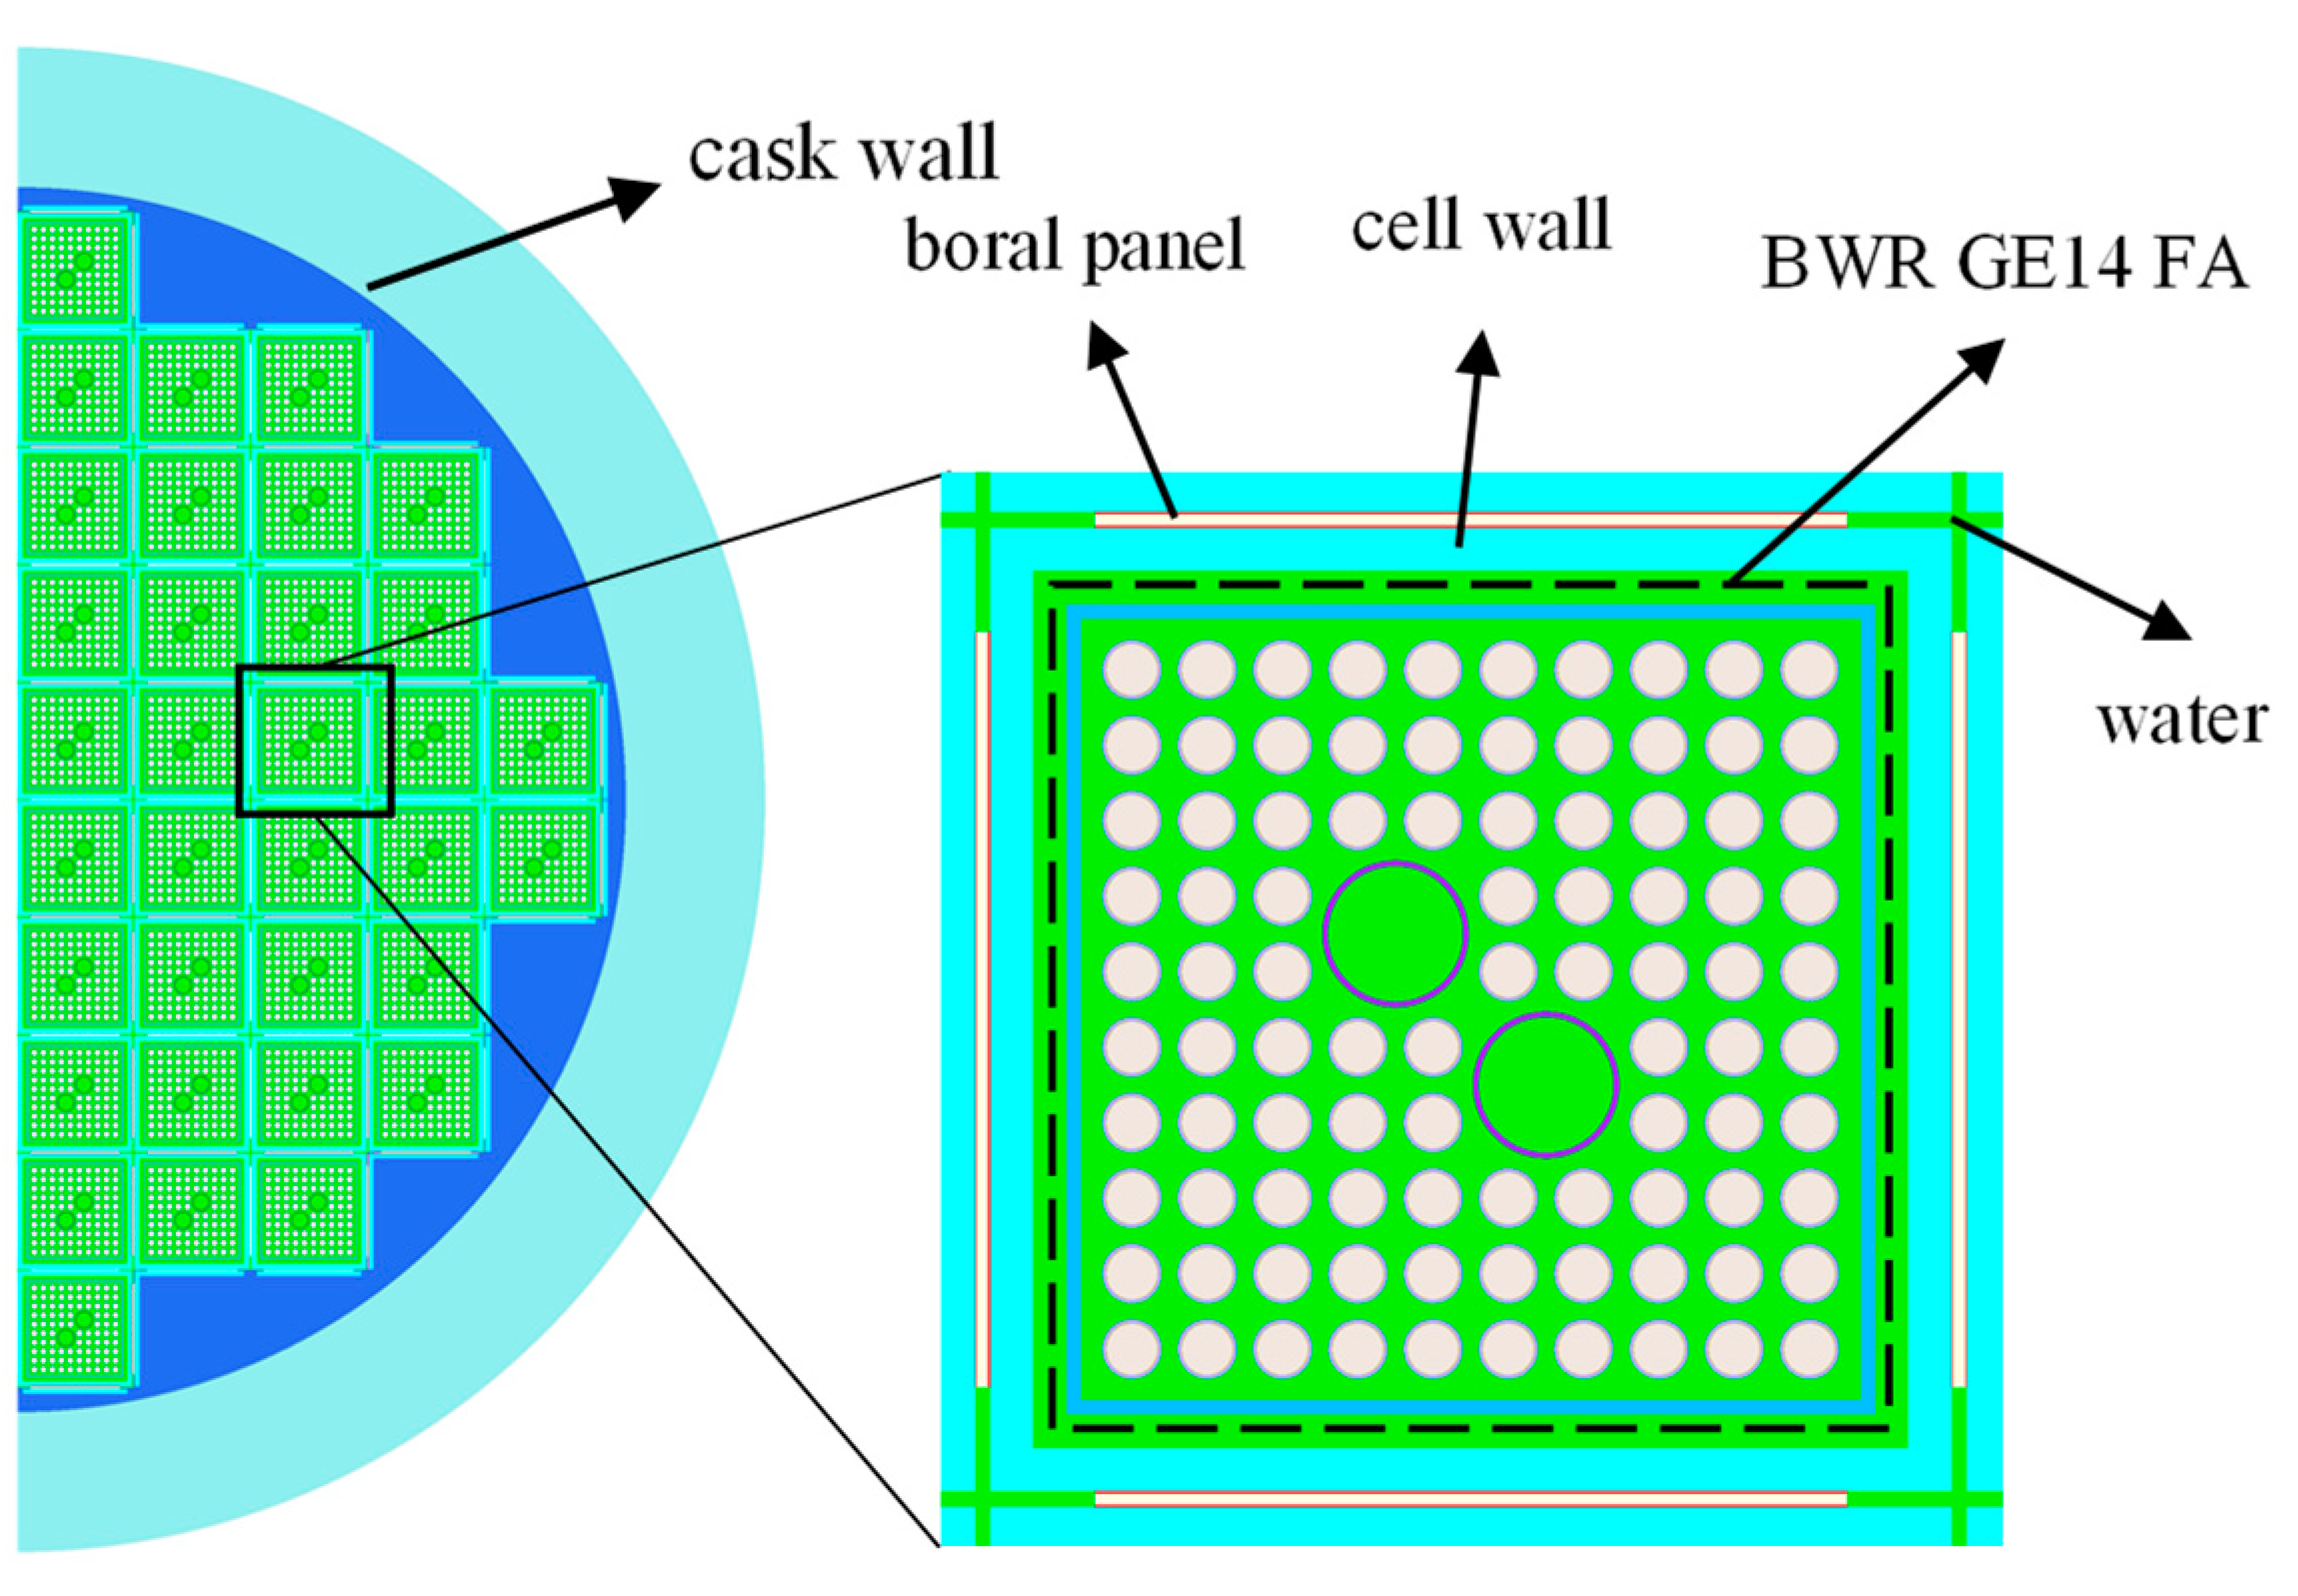
The capacity of the storage and transport casks for BWR spent fuel varies significantly for different suppliers (44 to 89 FAs per cask) [27], with all designs including neutron absorber panels. The generic storage cask design GBC-68 with 68 FA capacity was proposed for BWR burnup credit analysis in the study [27]. The main parameters of GBC-68 cask are presented in Table 2. Figure 3 shows the GBC-68 cask model loaded with GE14 FAs in 180 -degree symmetry. Each fuel assembly is placed in a separate cell which surrounds the FA with four stainless steel (SS304) walls. The boral panels (B4C/Al) are located between the cells and play an important role as a neutron absorber. The cask wall material is SS304 stainless steel. The cask is flooded with unborated water to imitate accident conditions [30].
4. Computational Methods
4.1. Reactor Core Analysis
Two-group homogenised cross-section sets for the fuel assemblies and reflectors were prepared using Polaris with 56-group ENDF/B-VII.1 master library of the SCALE system. In the case of the GE14 fuel assembly, cross-section sets were produced for dominant and vanished lattices, while in the case of SVEA-100, for a single lattice. The branch conditions were applied to the coolant density and fuel temperature, while the coolant temperature remained constant due to its little change during the normal reactor operation. The nodal data obtained with Polaris was converted to the DYN3D cross-section library format for further nodal reactor analysis. The full-core analysis results, such as coolant density and burnup profiles, were used further for the lattice depletion and criticality calculations using Polaris and KENO modules, respectively (see Section 4.2).
The vital information about reactor operation such as refuelling process is limited in the open literature. Hence, the authors developed their own refuelling model [22]. After each cycle, the fuel assemblies were arranged from low to high burnup using a Python script. They were then moved according to the specific pattern described by one of four hypothetical shuffling procedures (SP)—SP_A, SP_B, SP_C and SP_D [22]. The different strategies are based on:
- SP_A shuffling procedure which moves FAs with the highest burnup from cycle i (i = 0, N where N—is the number of cycles) to the positions of the lowest burnt FAs from the cycle (i + 1) and so on, is an optimal one.
- SP_B shuffling procedure follows the opposite pattern and moves FAs with the lowest burnup of the cycle i to the positions of the FAs with highest burnup of the cycle (i + 1).
- SP_C shuffling procedure, which is also the least optimal strategy, moves the FAs with the lowest burnup from cycle i to the position of the FAs with lowest burnup of the cycle (i + 1) and so on or, in other words, the FA saves its burnup position.
- SP_D procedure repeats the pattern of the SP_C, but at the (N − 1) cycle it follows the SP_B pattern by moving least burnt FAs to the positions of highest burnt ones from the cycle N.
The above shuffling procedures but for 4 cycle reactor operation are described in more details in the first part of the research [22]. Five scenarios of the reactor operation were considered based on single or mix of two shuffling procedures: four of them are based on SPs with the same name and SP_E case, is on altering SP_A and SP_B after each cycle. The nodal core model consisted of 27 axial layers in total, 25 of which represented the FA and 2 represented the top and bottom reflectors. The nodal analysis was performed with 5-day burnup steps for four cycles of reactor operation. The neutron flux distribution over the core was evaluated after each burnup step.
4.2. Criticality Analysis
The traditional depletion analysis in the lattice (2D) or Monte Carlo (2D-3D) codes cannot reflect real operational parameters of the fuel assembly in the reactor core since they simulate the fuel assembly in radially reflective boundary conditions. In addition, data like water density and fuel temperature are based on an initial estimate since neither thermodynamic nor thermal-hydraulic models are incorporated into the lattice codes. To overcome these limitations, the authors performed depletion analysis of the BWR fuel assembly using axial coolant density distributions and axial burnup profiles obtained with the nodal analysis of the reactor core. The BWR spent fuel composition resulting from these calculations were used in further criticality analysis of the GBC-68 storage cask.
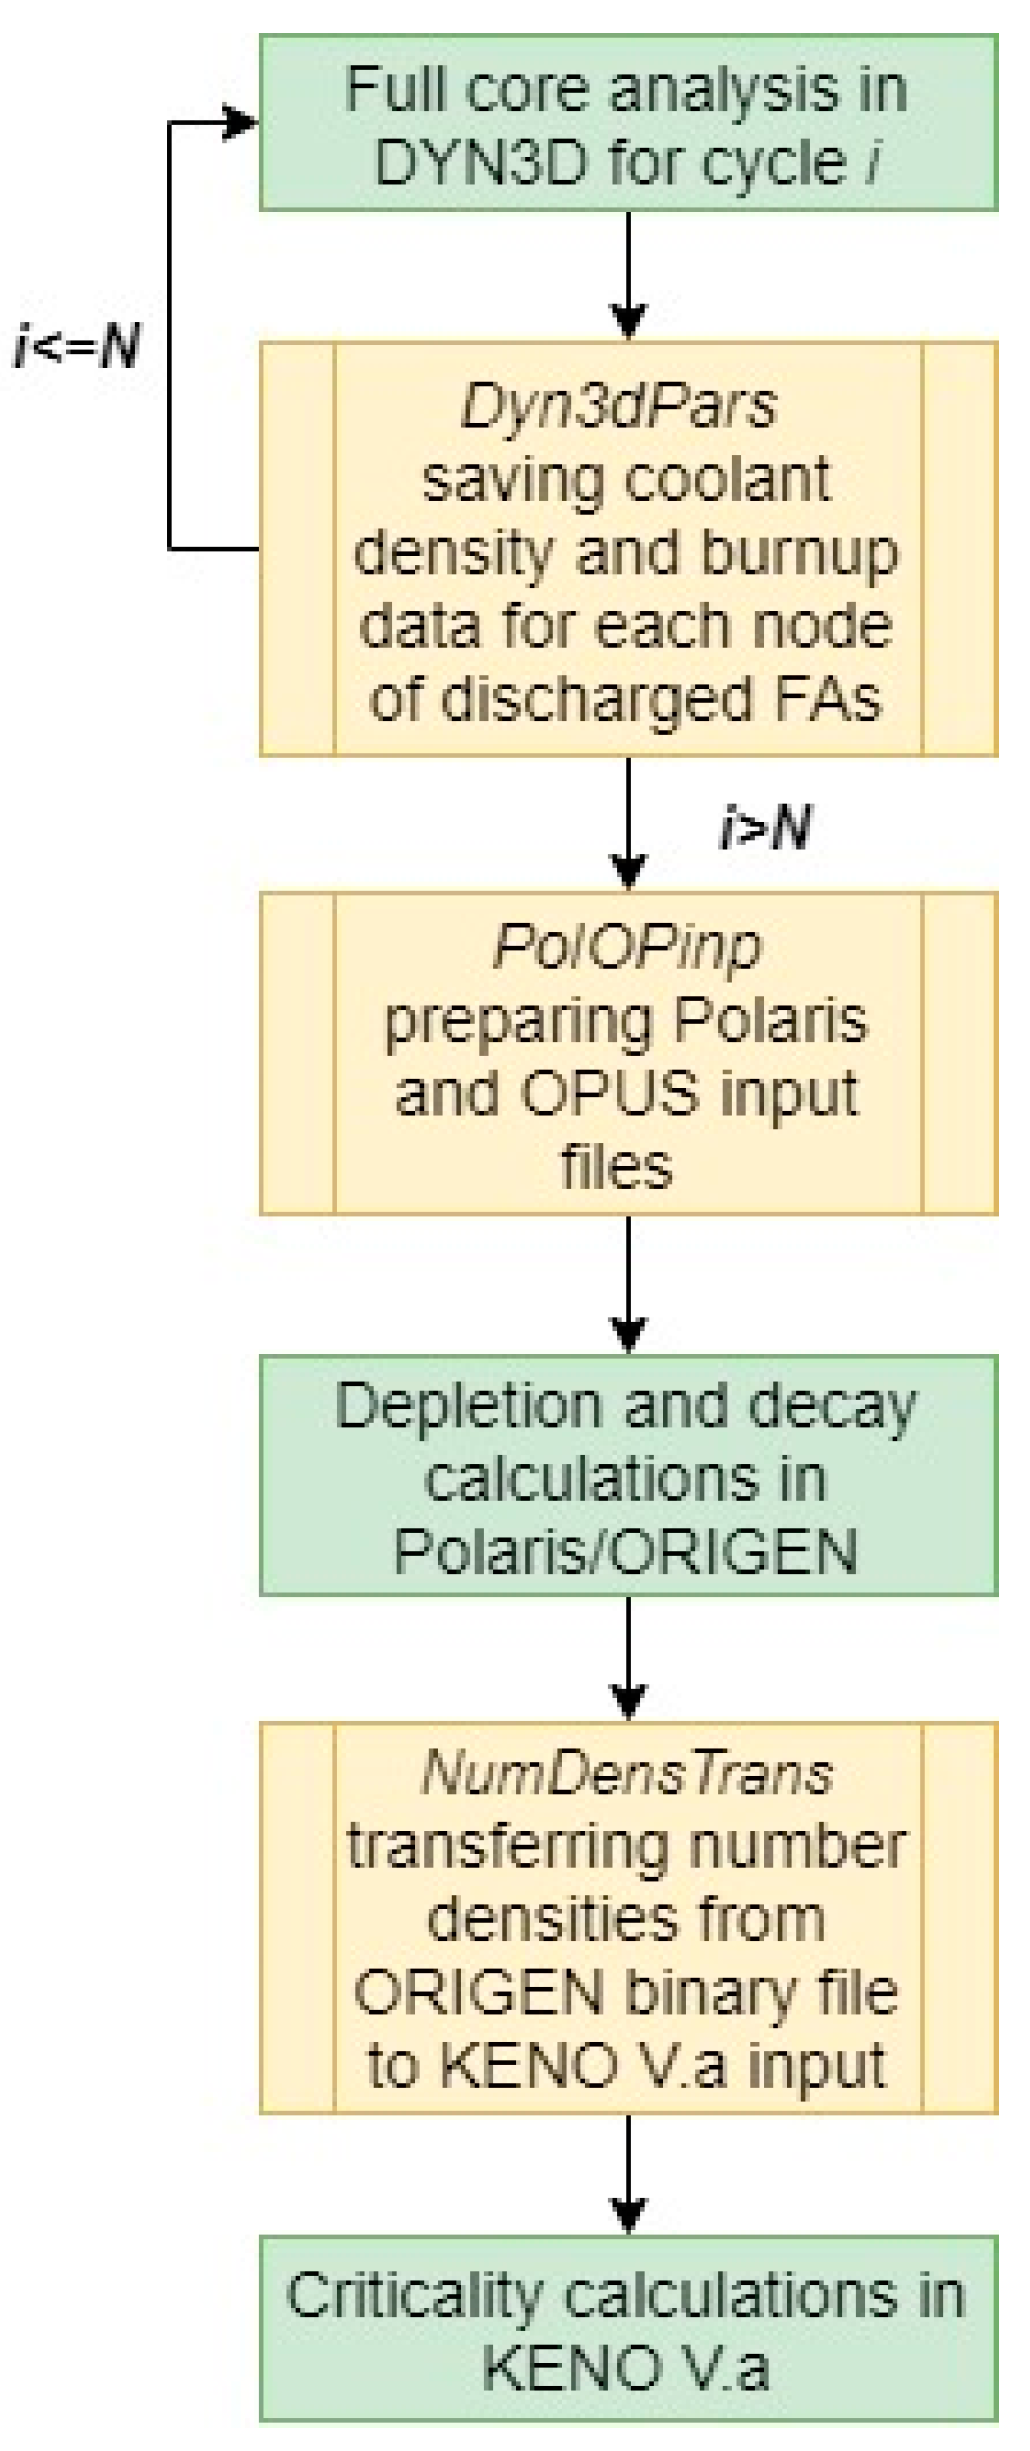
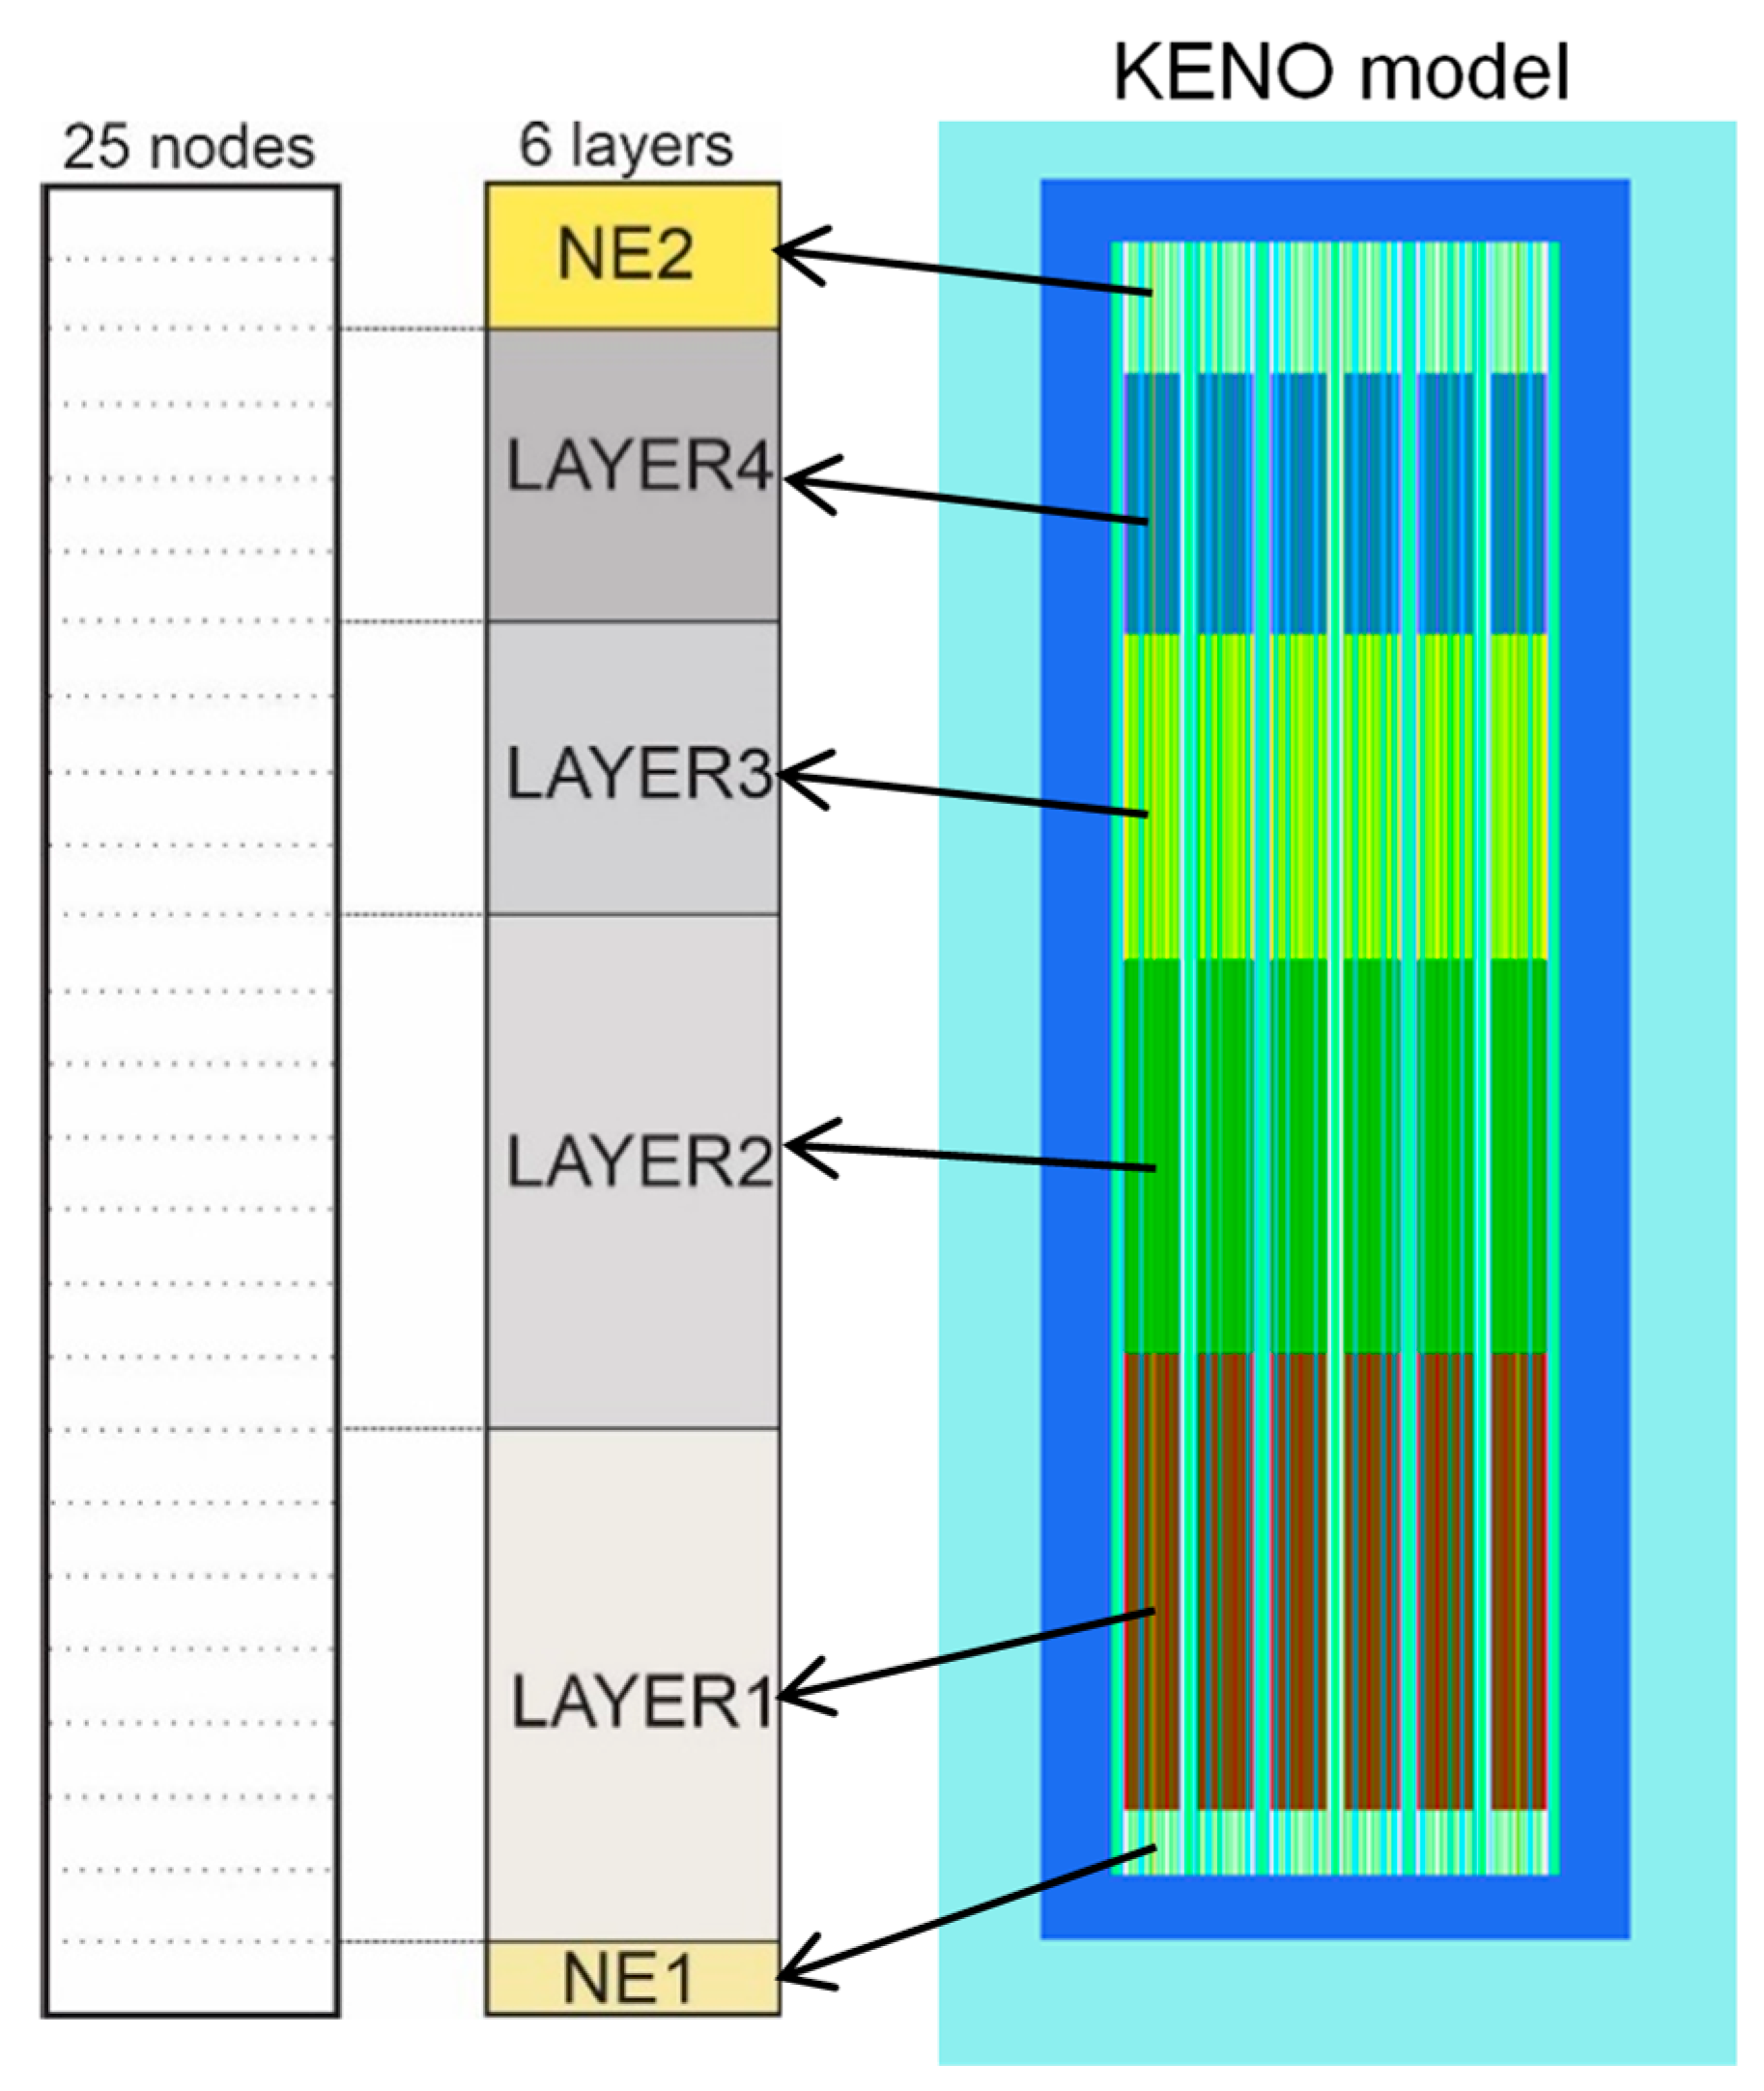
A series of Python scripts were developed to transfer data from the nodal calculations into the KENO Monte Carlo solver used for the cask modelling. The flowchart of the modelling sequence is presented in Figure 4. After each simulation of the operational cycle in DYN3D, the coolant density and burnup profiles of the discharged FAs are extracted from the code’s output file and saved to the text file by the Dyn3dPars script. When the required number of cycles N has been simulated, the saved data is used by the PolOPinp script to create input files for the depletion and decay calculations in Polaris/ORIGEN sequence. At this point, Polaris is used again to produce an isotopic composition for the BWR spent fuel for further criticality analysis with KENO. The PolOPinp script also performed an automatic composition extraction from the ORIGEN binary concentration file using the OPUS post-processor. To reduce the required amount of calculations, the PolOPinp also averages burnup and coolant density obtained for each of 25 axial layers in DYN3D down to 6 layers for the KENO cask model–top and bottom natural uranium blankets and the 4 layers within the FA as shown in Figure 5. Next, Polaris/ORIGEN performs depletion/decay calculations for each layer in the traditional lattice approach, with layer’s corresponding to coolant density and burnup value, as well as with a fixed set of cooling times. The fuel temperature is equal to 900 K as the estimated average for BWR fuel simulations during normal operation [27], and 560 K, for the coolant [31]. Then, the NumDensTrans script converts number densities obtained with Polaris/ORIGEN for each layer from the binary concentration file to KENO V.a input.
This study considered the set of 28 leading nuclides for criticality analysis—major and minor actinides and major fission products (AFP set) as presented here:
The AFP set is formed from nuclides playing the most important role for burnup credit analysis of LWR spent fuel [6].
5. Results and Discussion
5.1. Depletion Analysis of BWR GE14 and SVEA100 Fuel Assemblies
To estimate the difference in BWR GE14 and SVEA100 fuel assemblies’ behaviour during the irradiation, the depletion analysis has been performed for burnups up to 60 GWd/tU [27] for both assembly types. The study considered the following FA models used in first part of the study [22]:
- 2D lattice model of the fuel assembly without burnable poison (M1).
- 2D lattice model of the fuel assembly with Gd burnable poison (M2). M1 and M2 configurations estimate criticality of the FA in reflective boundary conditions with constant fuel temperature, coolant density and coolant temperature.
- 3D nodal model of realistic fuel assembly with thermal-hydraulics coupling (M3). The FA configuration includes natural uranium blankets and has reflector from top and bottom. The FA is modelled with reflective boundary conditions in a radial direction, and vacuum at the assembly’s ends. The coolant density along with fuel and coolant temperatures are non-uniformly distributed and obtained by the nodal code.
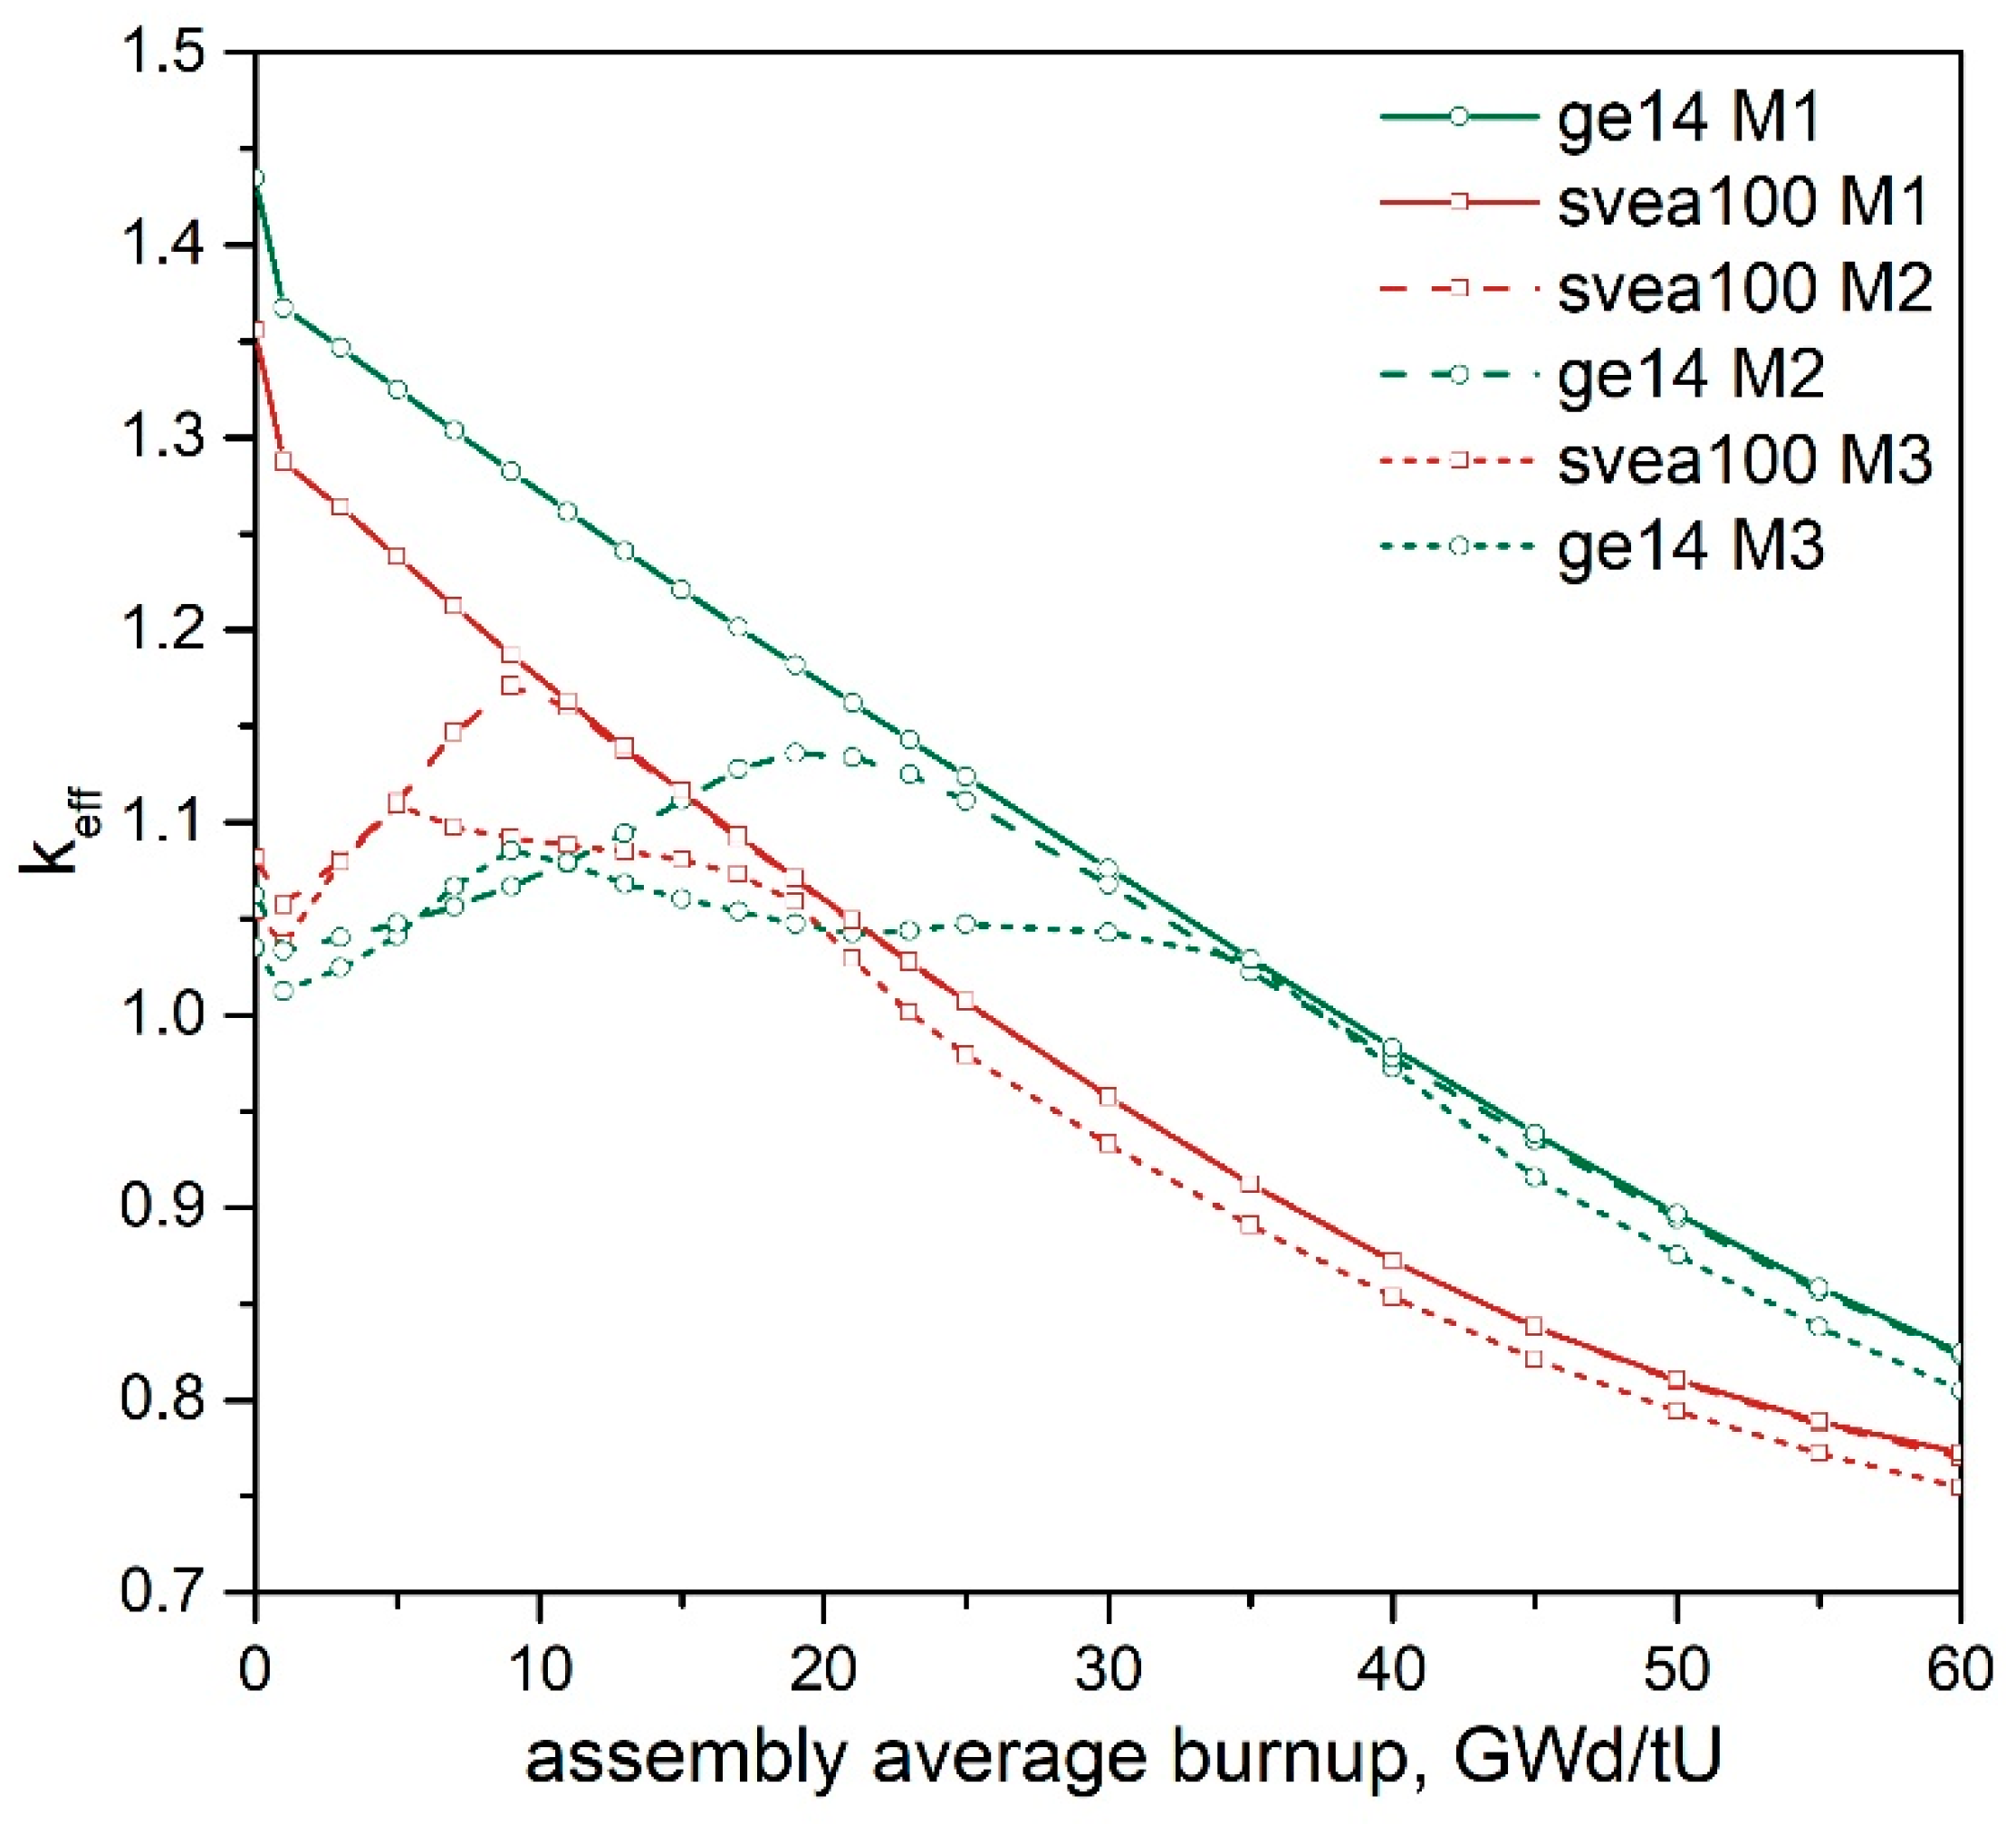
The so-called leading bottom layer of the FA mainly defines the final criticality [22], so the lattice models had coolant density as average for that layer of 0.6 g/cm3. Fuel and coolant temperatures were set as average for BWRs, 900 K and 560 K, respectively [27,31]. The criticality curves for both FA types and all considered models are presented in Figure 6.
The SVEA100 fuel assembly has lower average initial enrichment than GE14 fuel assembly. Consequently, the SVEA100 criticality curve obtained with M1 model (UO2 fuel only) is lower than of GE14. The difference between infinite multiplication factors (kinf) at the beginning of life (BoL) is 6%. At the same time, the criticality at the reactivity peak obtained with the M2 model, which contains gadolinium, is 3% higher and occurs ~10 GWd/tU earlier in the burnup for the SVEA100 fuel assembly due to lower initial gadolinia content compared to the GE14 fuel assembly. For the realistic nodal model M3, the difference in keff between first reactivity peaks decreased to 2% with SVEA100 peak being higher and occurring 5 GWd/tU earlier in comparison with the GE14 FA. It is seen that for both FA types the peak reactivity appears earlier for the 3D realistic model M3 than for simplified 2D lattice model M2. This is due to the non-uniform coolant density profile considered in the M3 model. In this case, the power is mostly concentrated at the bottom part of the FA [22] resulting in intensive depletion of the burnable poison there and consequently, in the earlier peak reactivity appearance compared to the lattice approach. A similar outcome was also demonstrated in the work summarised in Ref. [15]. Overall, the SVEA100 FA criticality reduces faster than for GE14 due to the lower initial fissile content, so its average discharged burnup should also be lower. The typical discharged burnups for FAs enriched up to 3% is less than 40 GWd/tU according to [27], and around 50 GWd/tU for higher enriched FAs (up to 5%) [32].
5.2. GBC-68 Cask Criticality Analysis
5.2.1. The Impact of the Refuelling Scenario on Cask Criticality
The first part of the research outlined the effect of the different shuffling procedures on final burnup distribution of the BWR fuel assemblies discharged from a reactor core [22]. This section investigates the shuffling procedure’s impact on the cask reactivity. The full-core calculations were performed for five refuelling scenarios SP_A, SP_B, SP_C, SP_D and SP_E (see Section 4.1), four cycles of reactor operation and GE14 fuel assembly. The criticality analysis of the GBC-storage cask was carried out for two loads from the obtained burnup distributions:
- 68 fuel assemblies from the centre (L68);
- 5% least burnt fuel assemblies (L5%L).
L68 and L5%L cask loads are of interest for the criticality analysis since the first one represents the typical cask load since it contains FAs from the burnup distribution centre. The second is the worst-case load as it has the FAs with the lowest burnup and, thus, most critical. The different cooling times were introduced to estimate the effect of the fuel assemblies’ storage time in the cooling pond on the later cask criticality. Five years is the minimum cooling time in the US before spent fuel can be moved to further transport or dry storage [33]. However, shorter times can be permitted in other countries such as Germany with a nine months minimum storage time before loading and an average storage time of approximately three years [34]. Here, five-year cooling time was considered a reference, with one- and ten-year lower and upper boundaries.
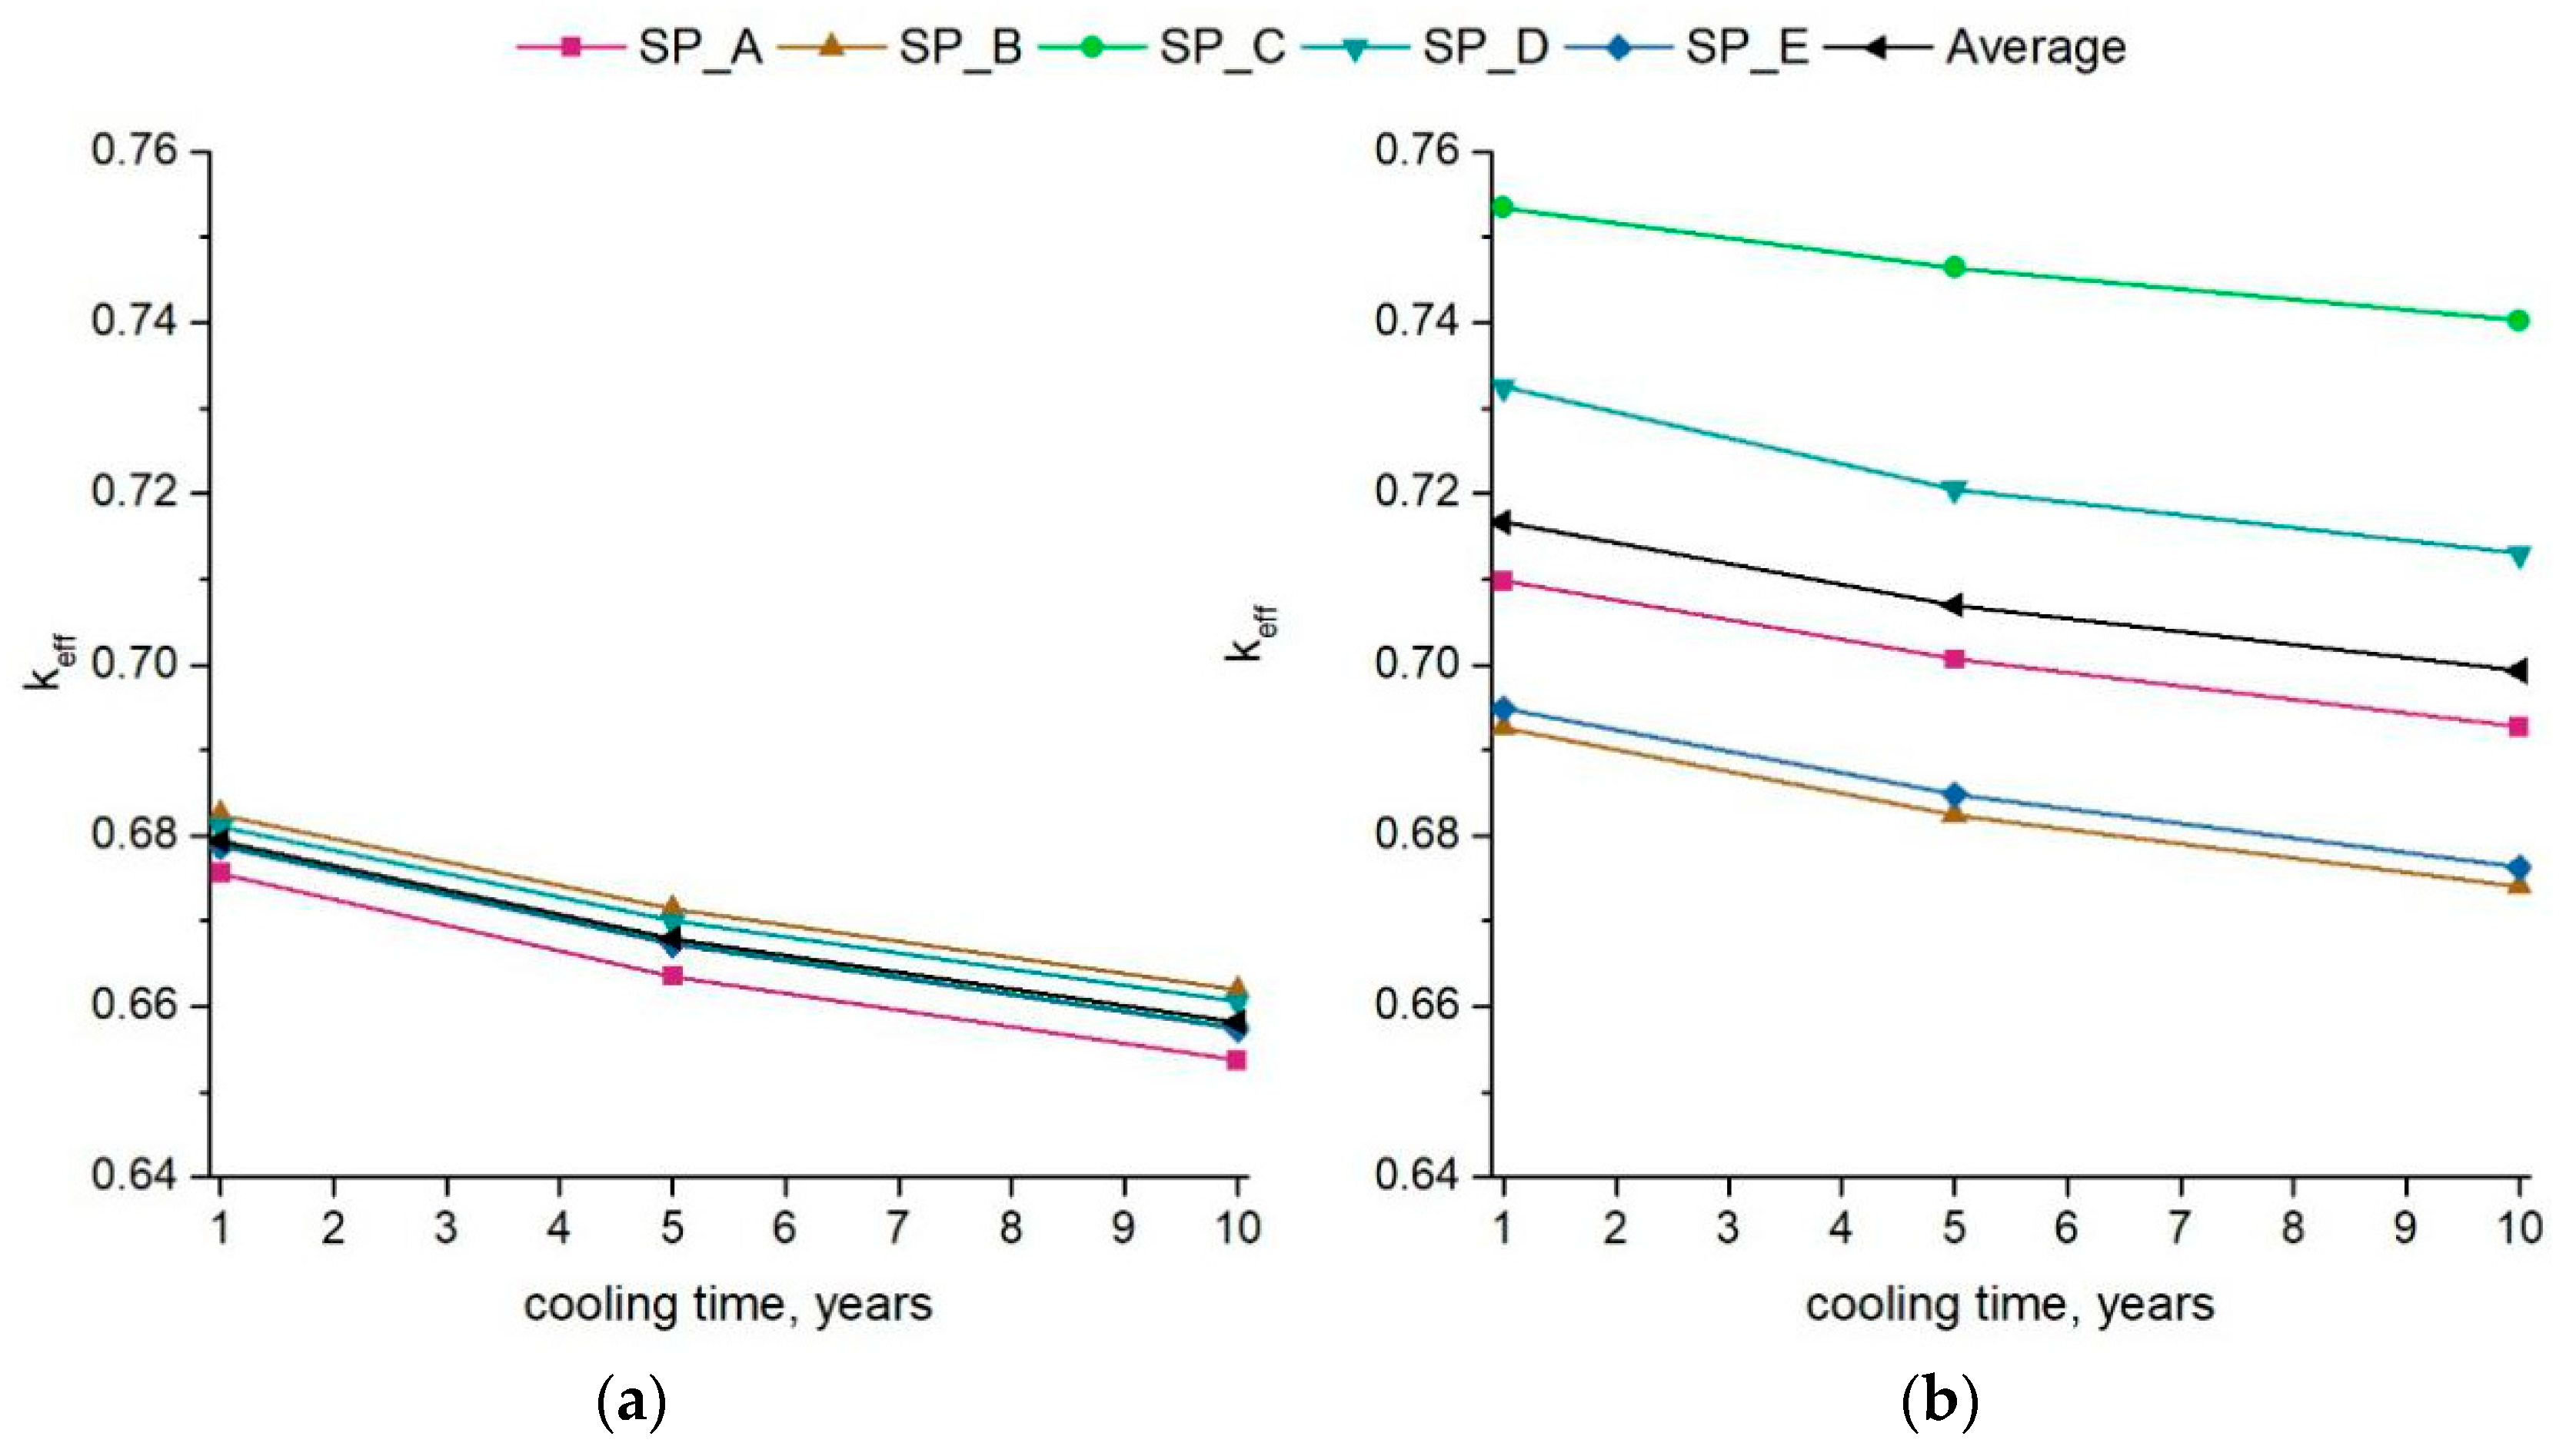
Figure 7 represents the effective multiplication factor as a function of cooling time for the GBC-68 cask filled with BWR GE14 FA from L68 and L5%L loads from the five considered loading patterns. The average line provides with the averaged for the five refuelling scenarios keff for the considered cask load. In the case of 68 typically burnt FAs (Figure 7a), the keff deviates at a maximum of 0.7% at the highest cooling time ten years compared to the average for five distributions. This demonstrates that the average fuel burnup of the different refuelling scenarios exhibits limited variation, with slight advantages for the SP_A and a slight disadvantage for the SP_B which coincides with the conclusions from [22], where the maximum difference between average discharged burnups of different loading patterns were 1 GWd/tU. For the 5% least burnt FAs (Figure 7b) the difference is significantly higher, up to 3.7%. It means that the choice of shuffling procedure mainly affects the cask’s criticality for the worst-case study (L5%L load) compared to the typical fuel assemblies (L68 load). These differences can be explained by the significantly lower than average burnups of the least burnt fuel assemblies in some of the refuelling patterns, for example, SP_C [22].
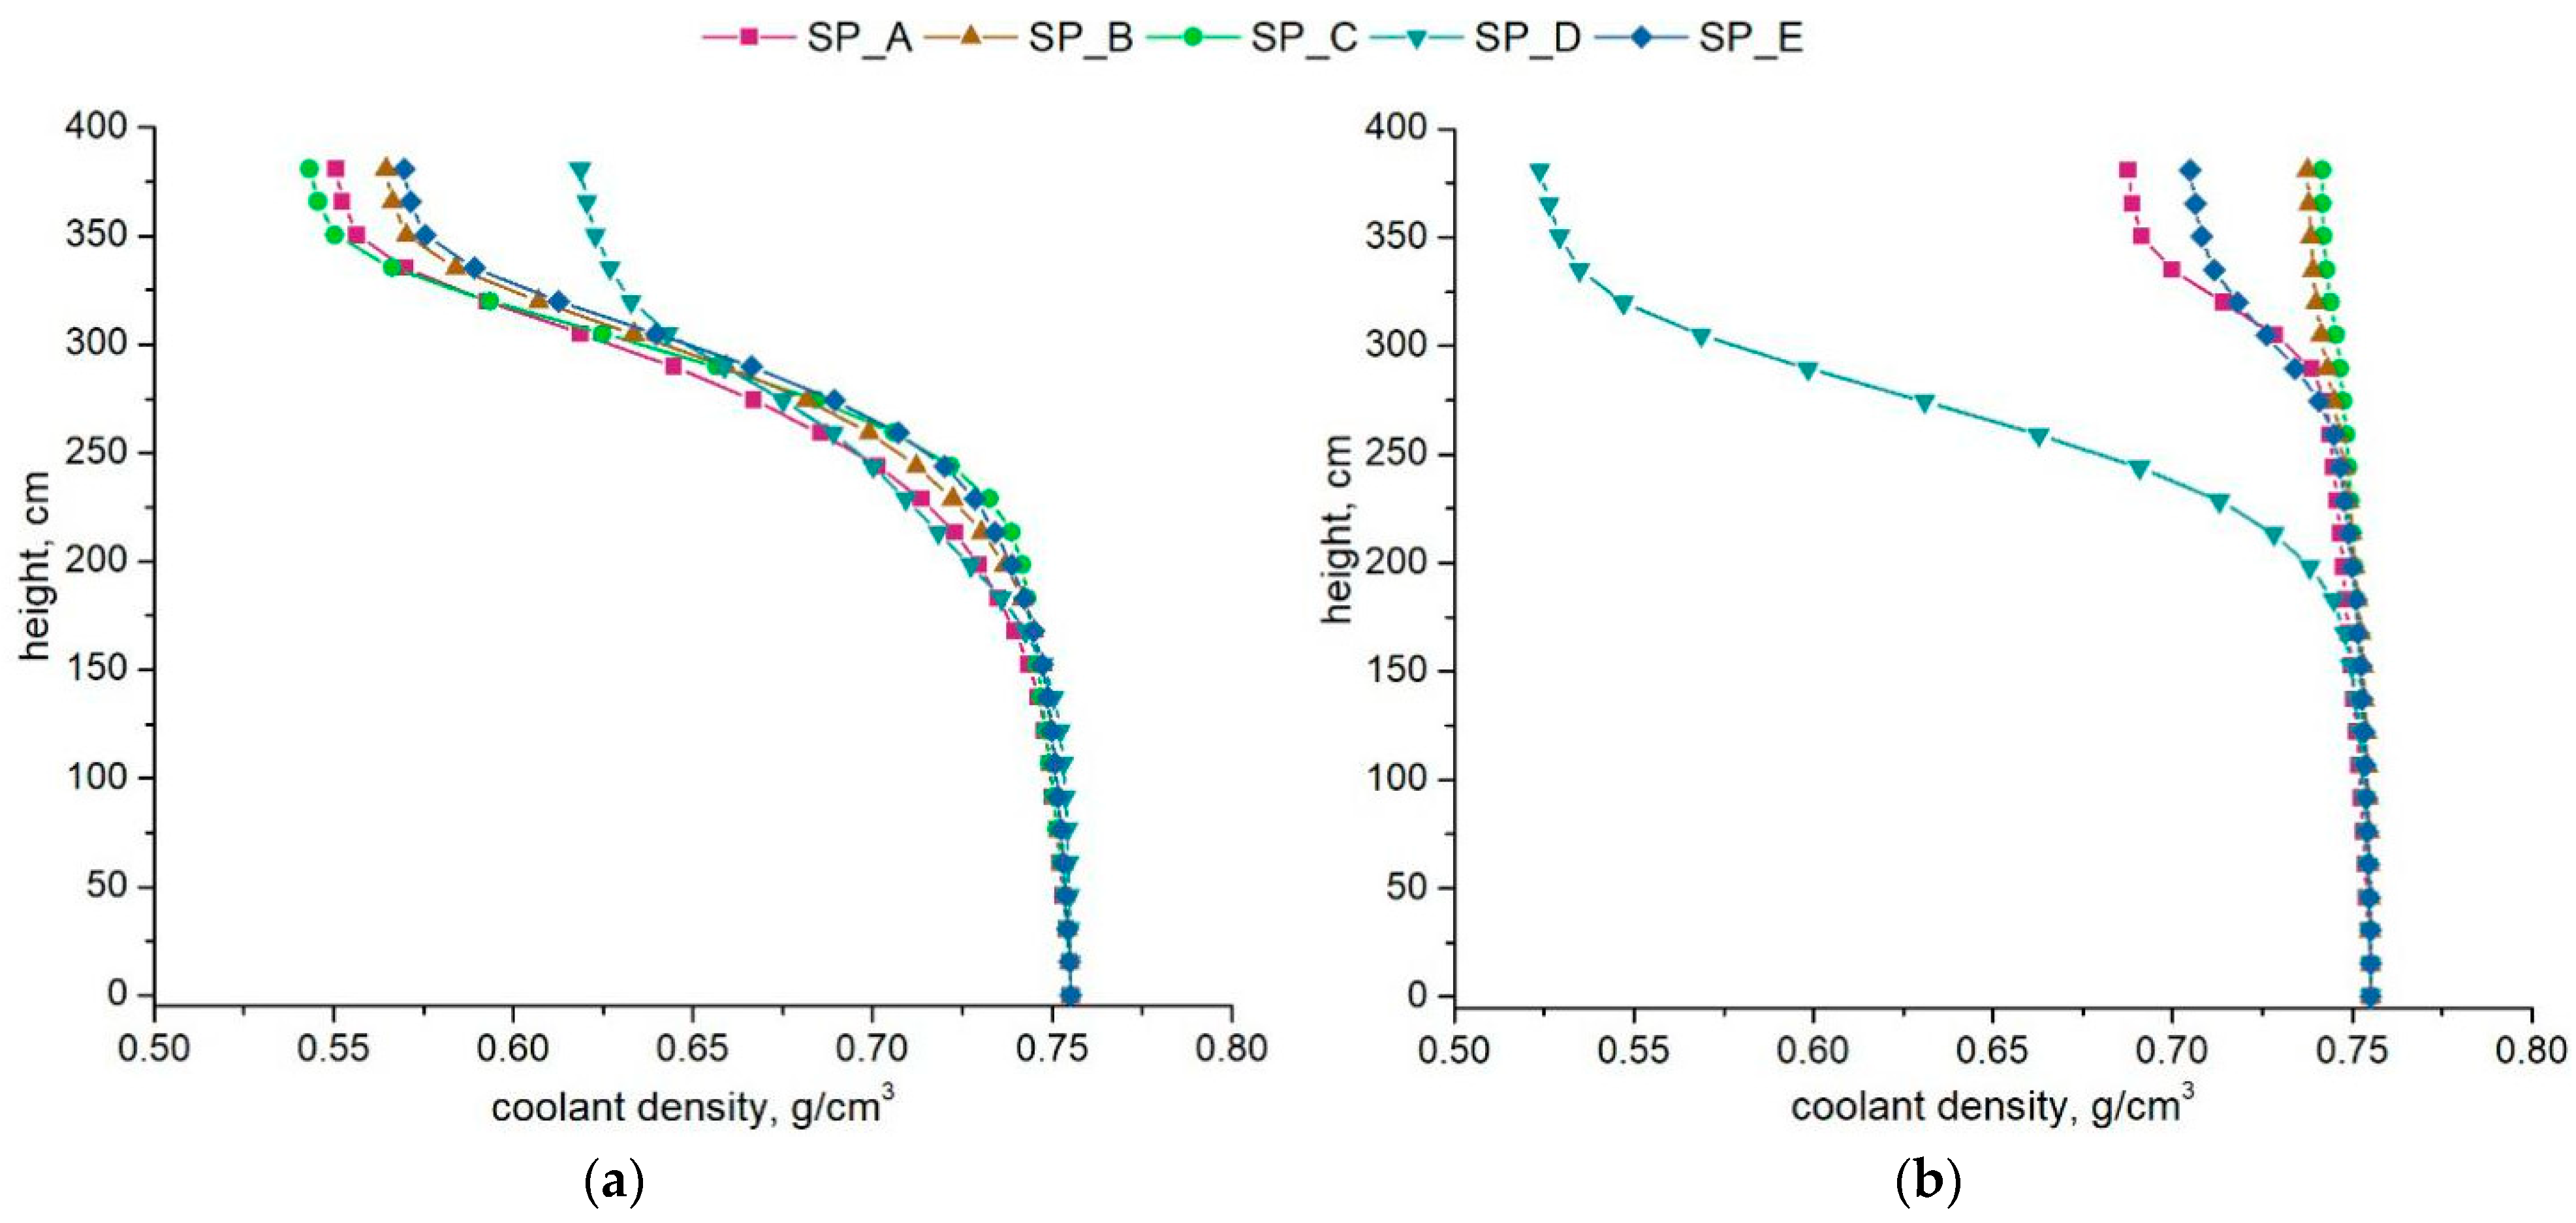
Another reason for the wider keff spread for L5%L load is that the FAs from L68 load see closer axial coolant density profiles for different refuelling scenarios (Figure 8a). Hence, it does not affect the cask criticality as much as in the case of L5%L load where the profiles are more spread (Figure 8b). Since fuel assemblies see different operational conditions under various refuelling scenarios, their final axial burnup profiles will also vary. The difference between coolant density profiles can also explain why some scenarios with higher burnup values (Table 3) have higher keff. The general trend is that fuel with higher burnup has lower criticality. Ref. [12] highlighted that the criticality at the upper layers of some BWR fuel assembly at their average discharge burnups increases with lowering the coolant density. Here, this effect is seen between, for example, SP_B and SP_D burnup distributions for L68 load and SP_B and SP_E burnup distributions for L5%L load. In the first case, the SP_B coolant density is lower than for SP_D (Figure 8a) for L68 load, and keff of SP_B scenario is higher than of SP_D despite having the higher burnup. In the second case, the coolant density on the upper layers is lower for SP_E than for SP_B scenario for L5%L load, but keff and burnup are higher. It is also seen that for optimal distribution SP_A, keff values of the L68 load are the lowest ones out of all distributions, while for L5%L, they are close to average values. For the least optimal, SP_C distribution, the effective multiplication factor of L68 load is close to average and has the highest keff values for L5%L load.
To summarise, the choice of shuffling procedure mainly affects the criticality of the cask filled with least burnt FAs (worst case) due to the significantly lower than average burnups for some shuffling procedures. Another reason could be a substantial difference between axial coolant density profiles which FAs see during the reactor operation under different reloading scenarios.
5.2.2. The Impact of Targeted Discharged Burnup on Cask Criticality
In the first part of this study, the burnup distributions for discharged fuel assemblies of several different reshuffling strategies were provided for an identical target burnup of approximately 50 GWd/tU for all cases or as we call it here, the reference target burnup. To evaluate the effect of the target burnup on the final burnup distribution and the cask criticality, the full core analysis was performed for the most (SP_A) and least optimal (SP_C) shuffling procedures and BWR GE14 fuel assembly type but with the reduced cycle length 10.3 GWd/tU instead of 11.75 GWd/tU for the reference case leading to a lower target burnup. In this case, the target burnup was decreased to approximately 44.5 GWd/tU burnup, which corresponds to the maximum assembly average burnup limit of 53 GWd/tU used in Germany for BWRs [35]. This new target burnup is called the modified target burnup.
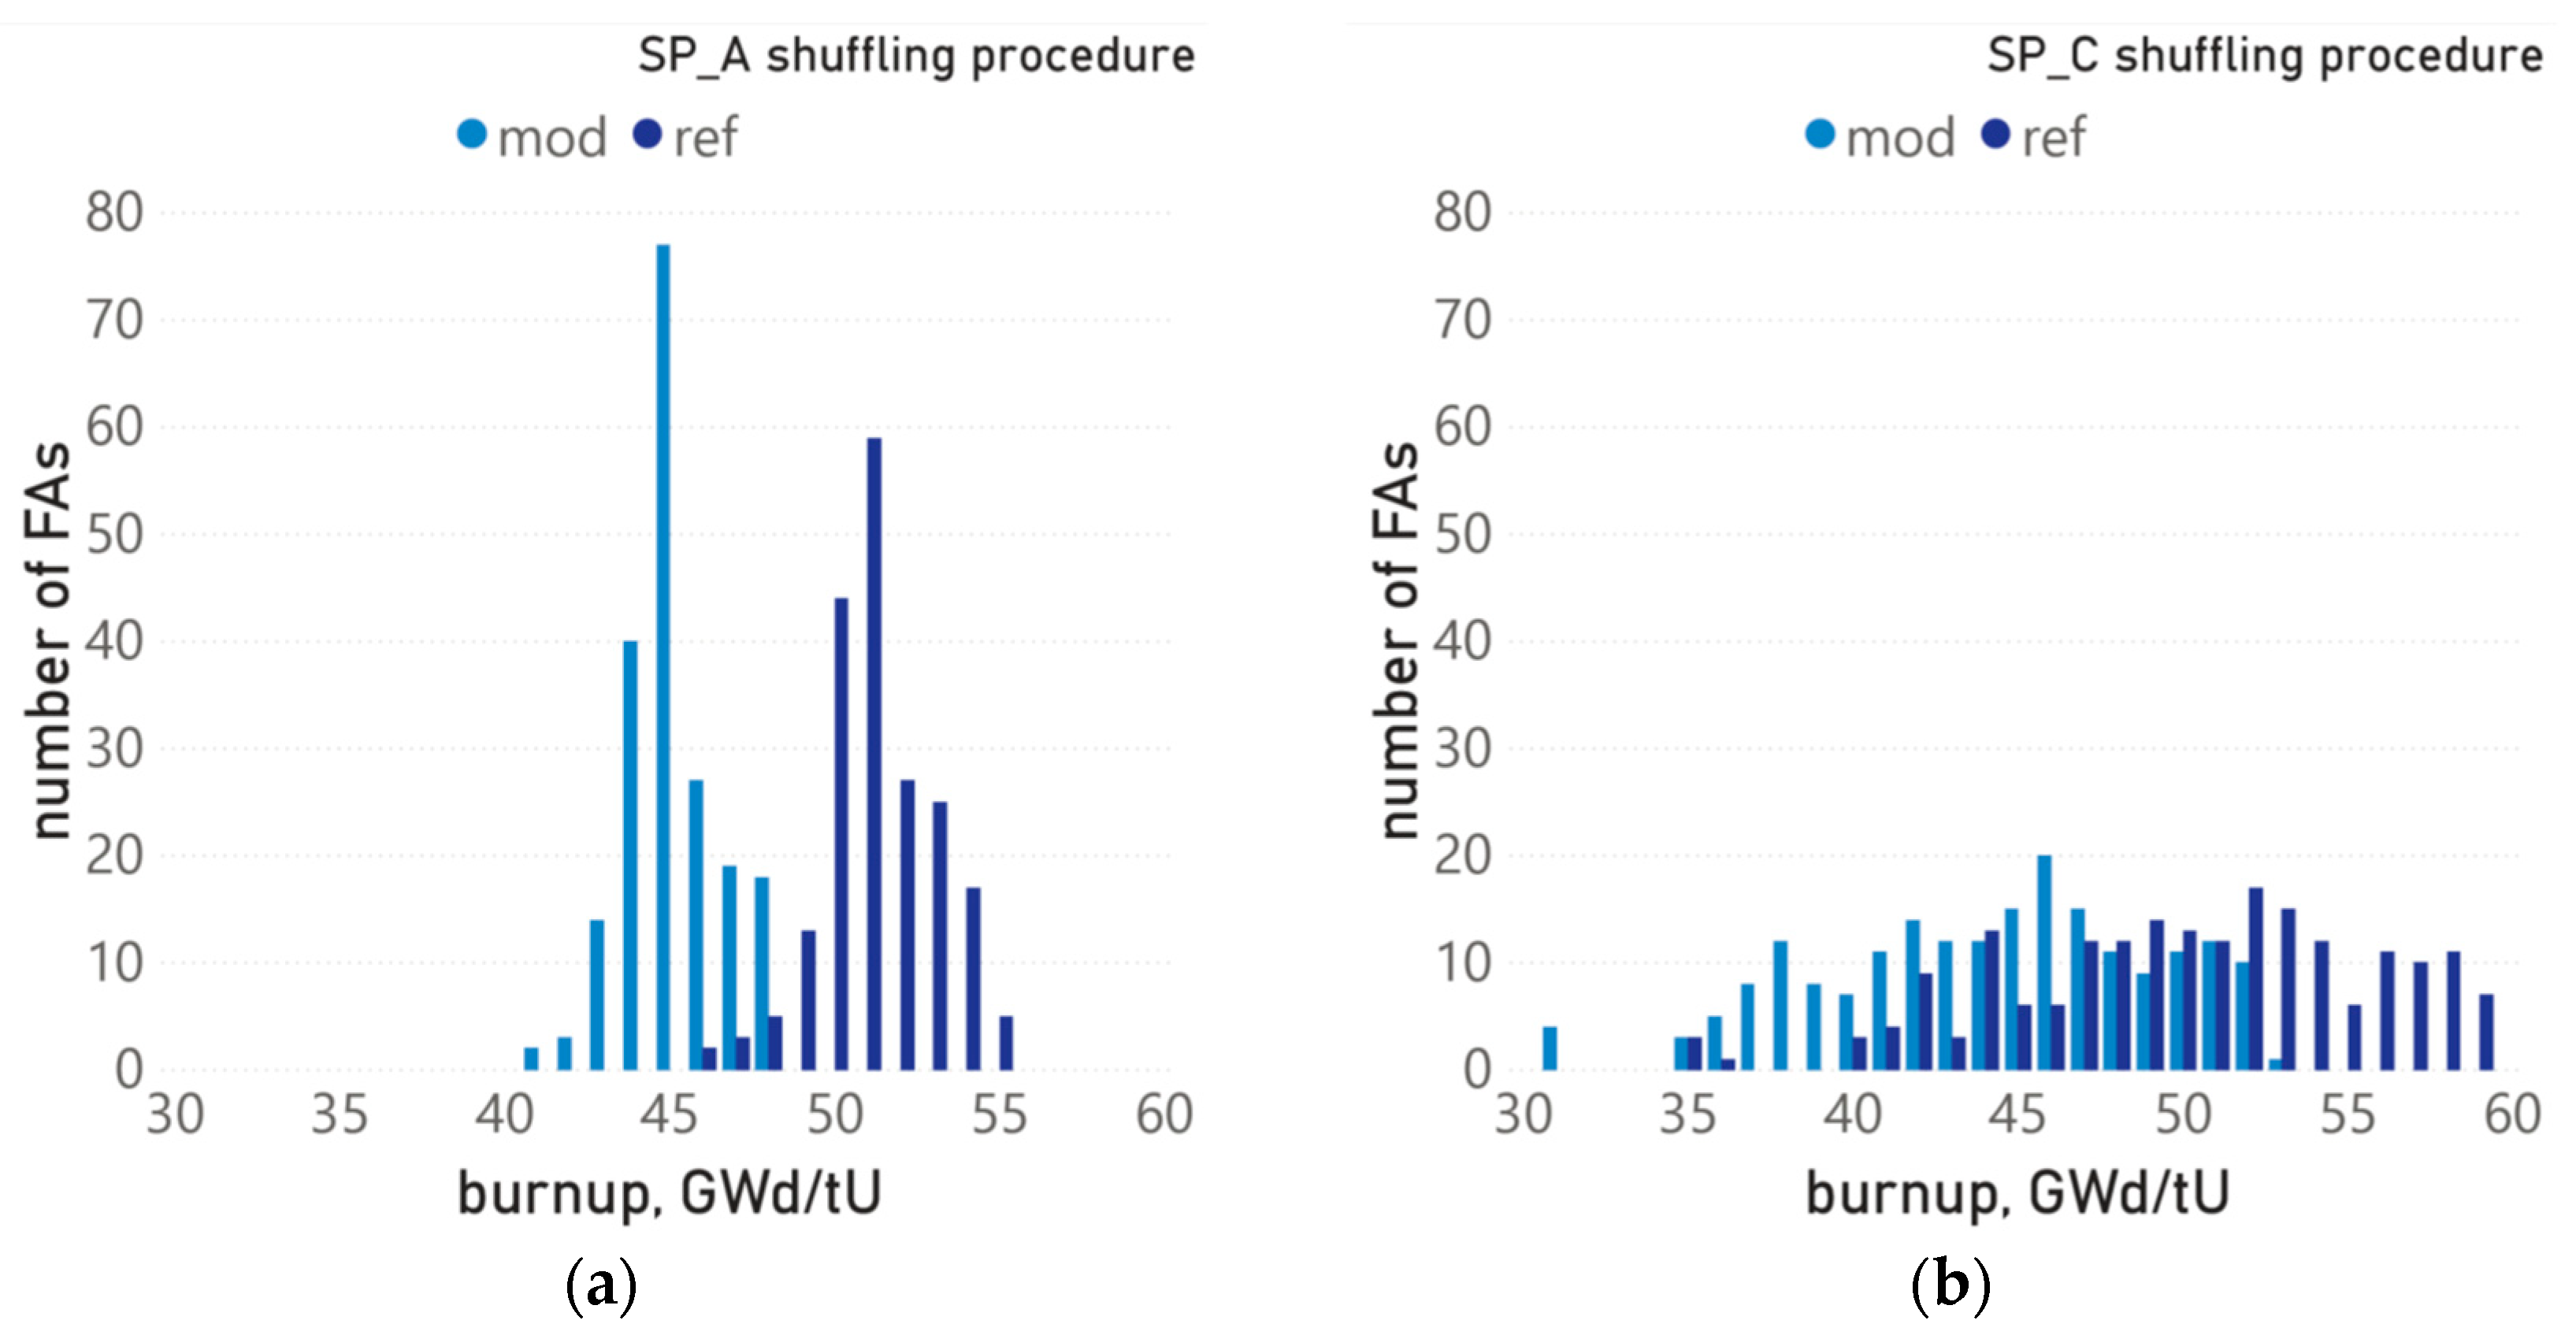
Figure 9 represents four burnup distributions obtained for SP_A and SP_C shuffling procedures with reference and modified target burnups. First, it indicates that the shape of burnup distribution does not change significantly with the target burnup decrease. However, the burnup range, the difference between the minimum and maximum burnups of the distribution, becomes slightly lower. At the same time, the number of FAs in the highest bin increases by 30% for optimal SP_A distribution, and by 18% for the least optimal SP_C in the modified target burnup case. The average, maximum and minimum burnups along with FA number in the highest bin of the SP_A and SP_C distributions with reference and modified target burnups are presented in Table 4.
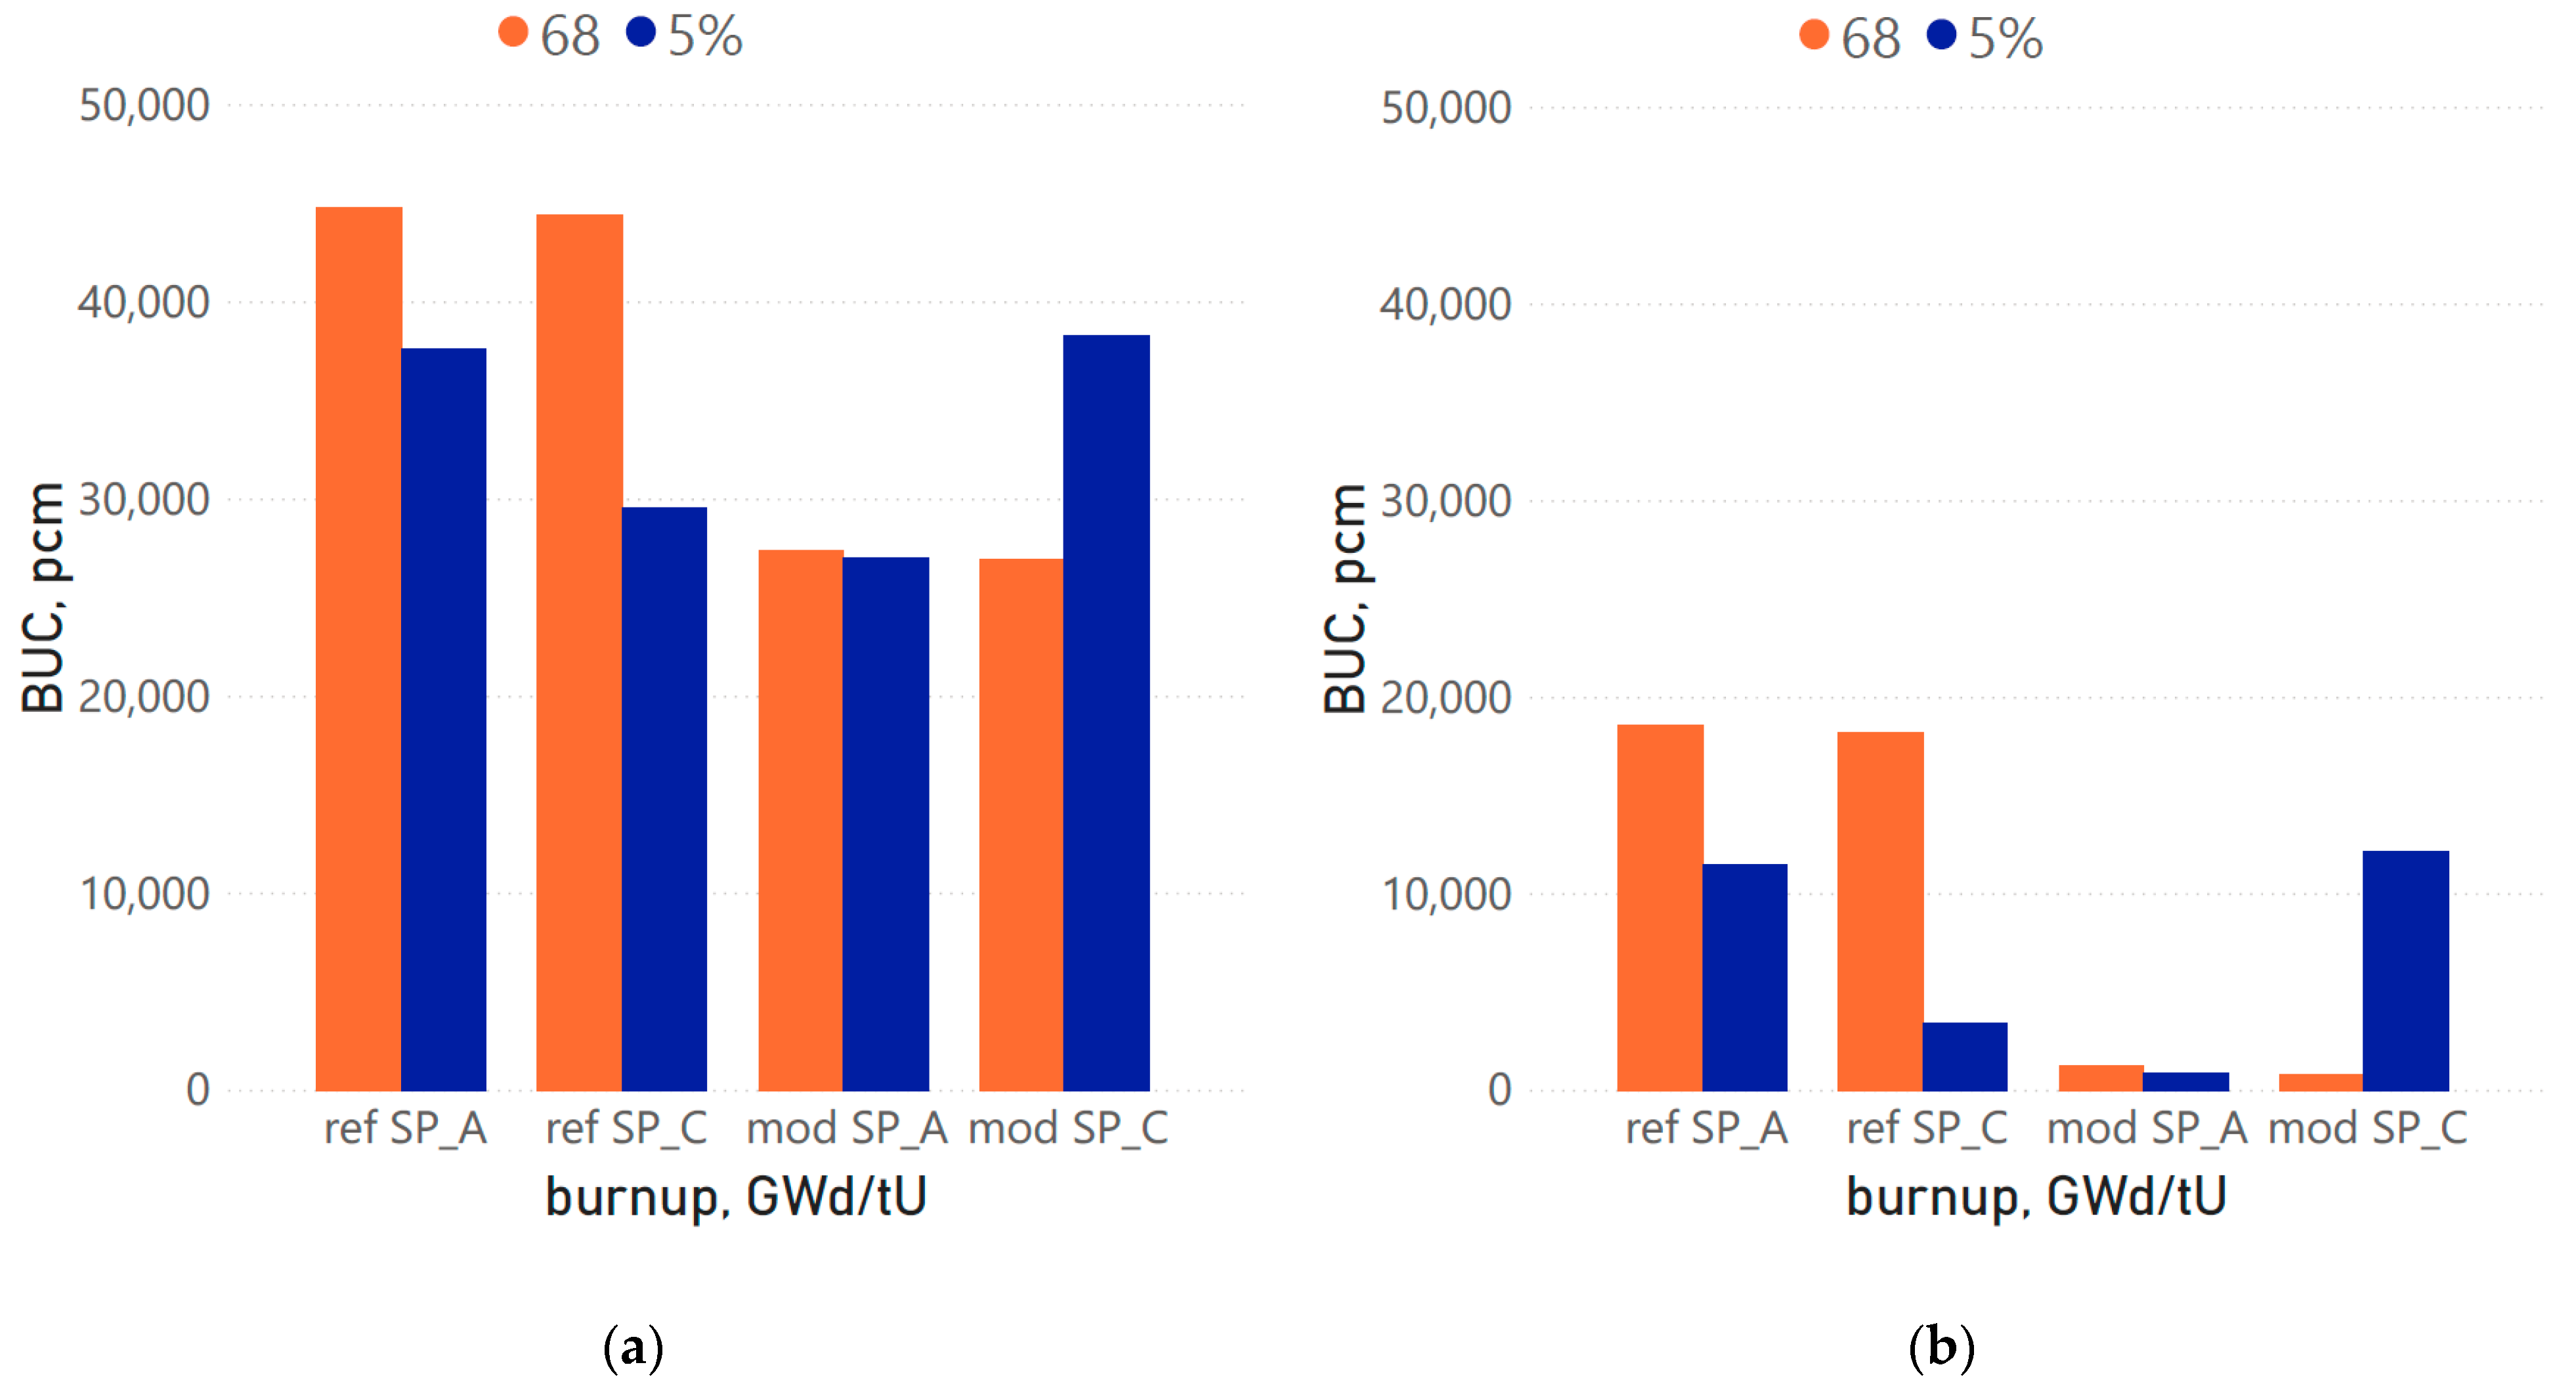
Figure 10 represents burnup credit from applying realistic FA data (ARD) in comparison with fresh fuel (a) and peak reactivity (b) approaches for L68 and L5%L cask loads, produced using optimal and least optimal shuffling procedures and reference and modified target burnups at one-year cooling time. The ARD is defined as:
where kj is keff of the GBC-68 cask filled with fresh or at their peak reactivity BWR fuel assemblies, ki is of the GBC-68 cask filled with BWR fuel assemblies from L68 or L5%L load of specific burnup distribution.
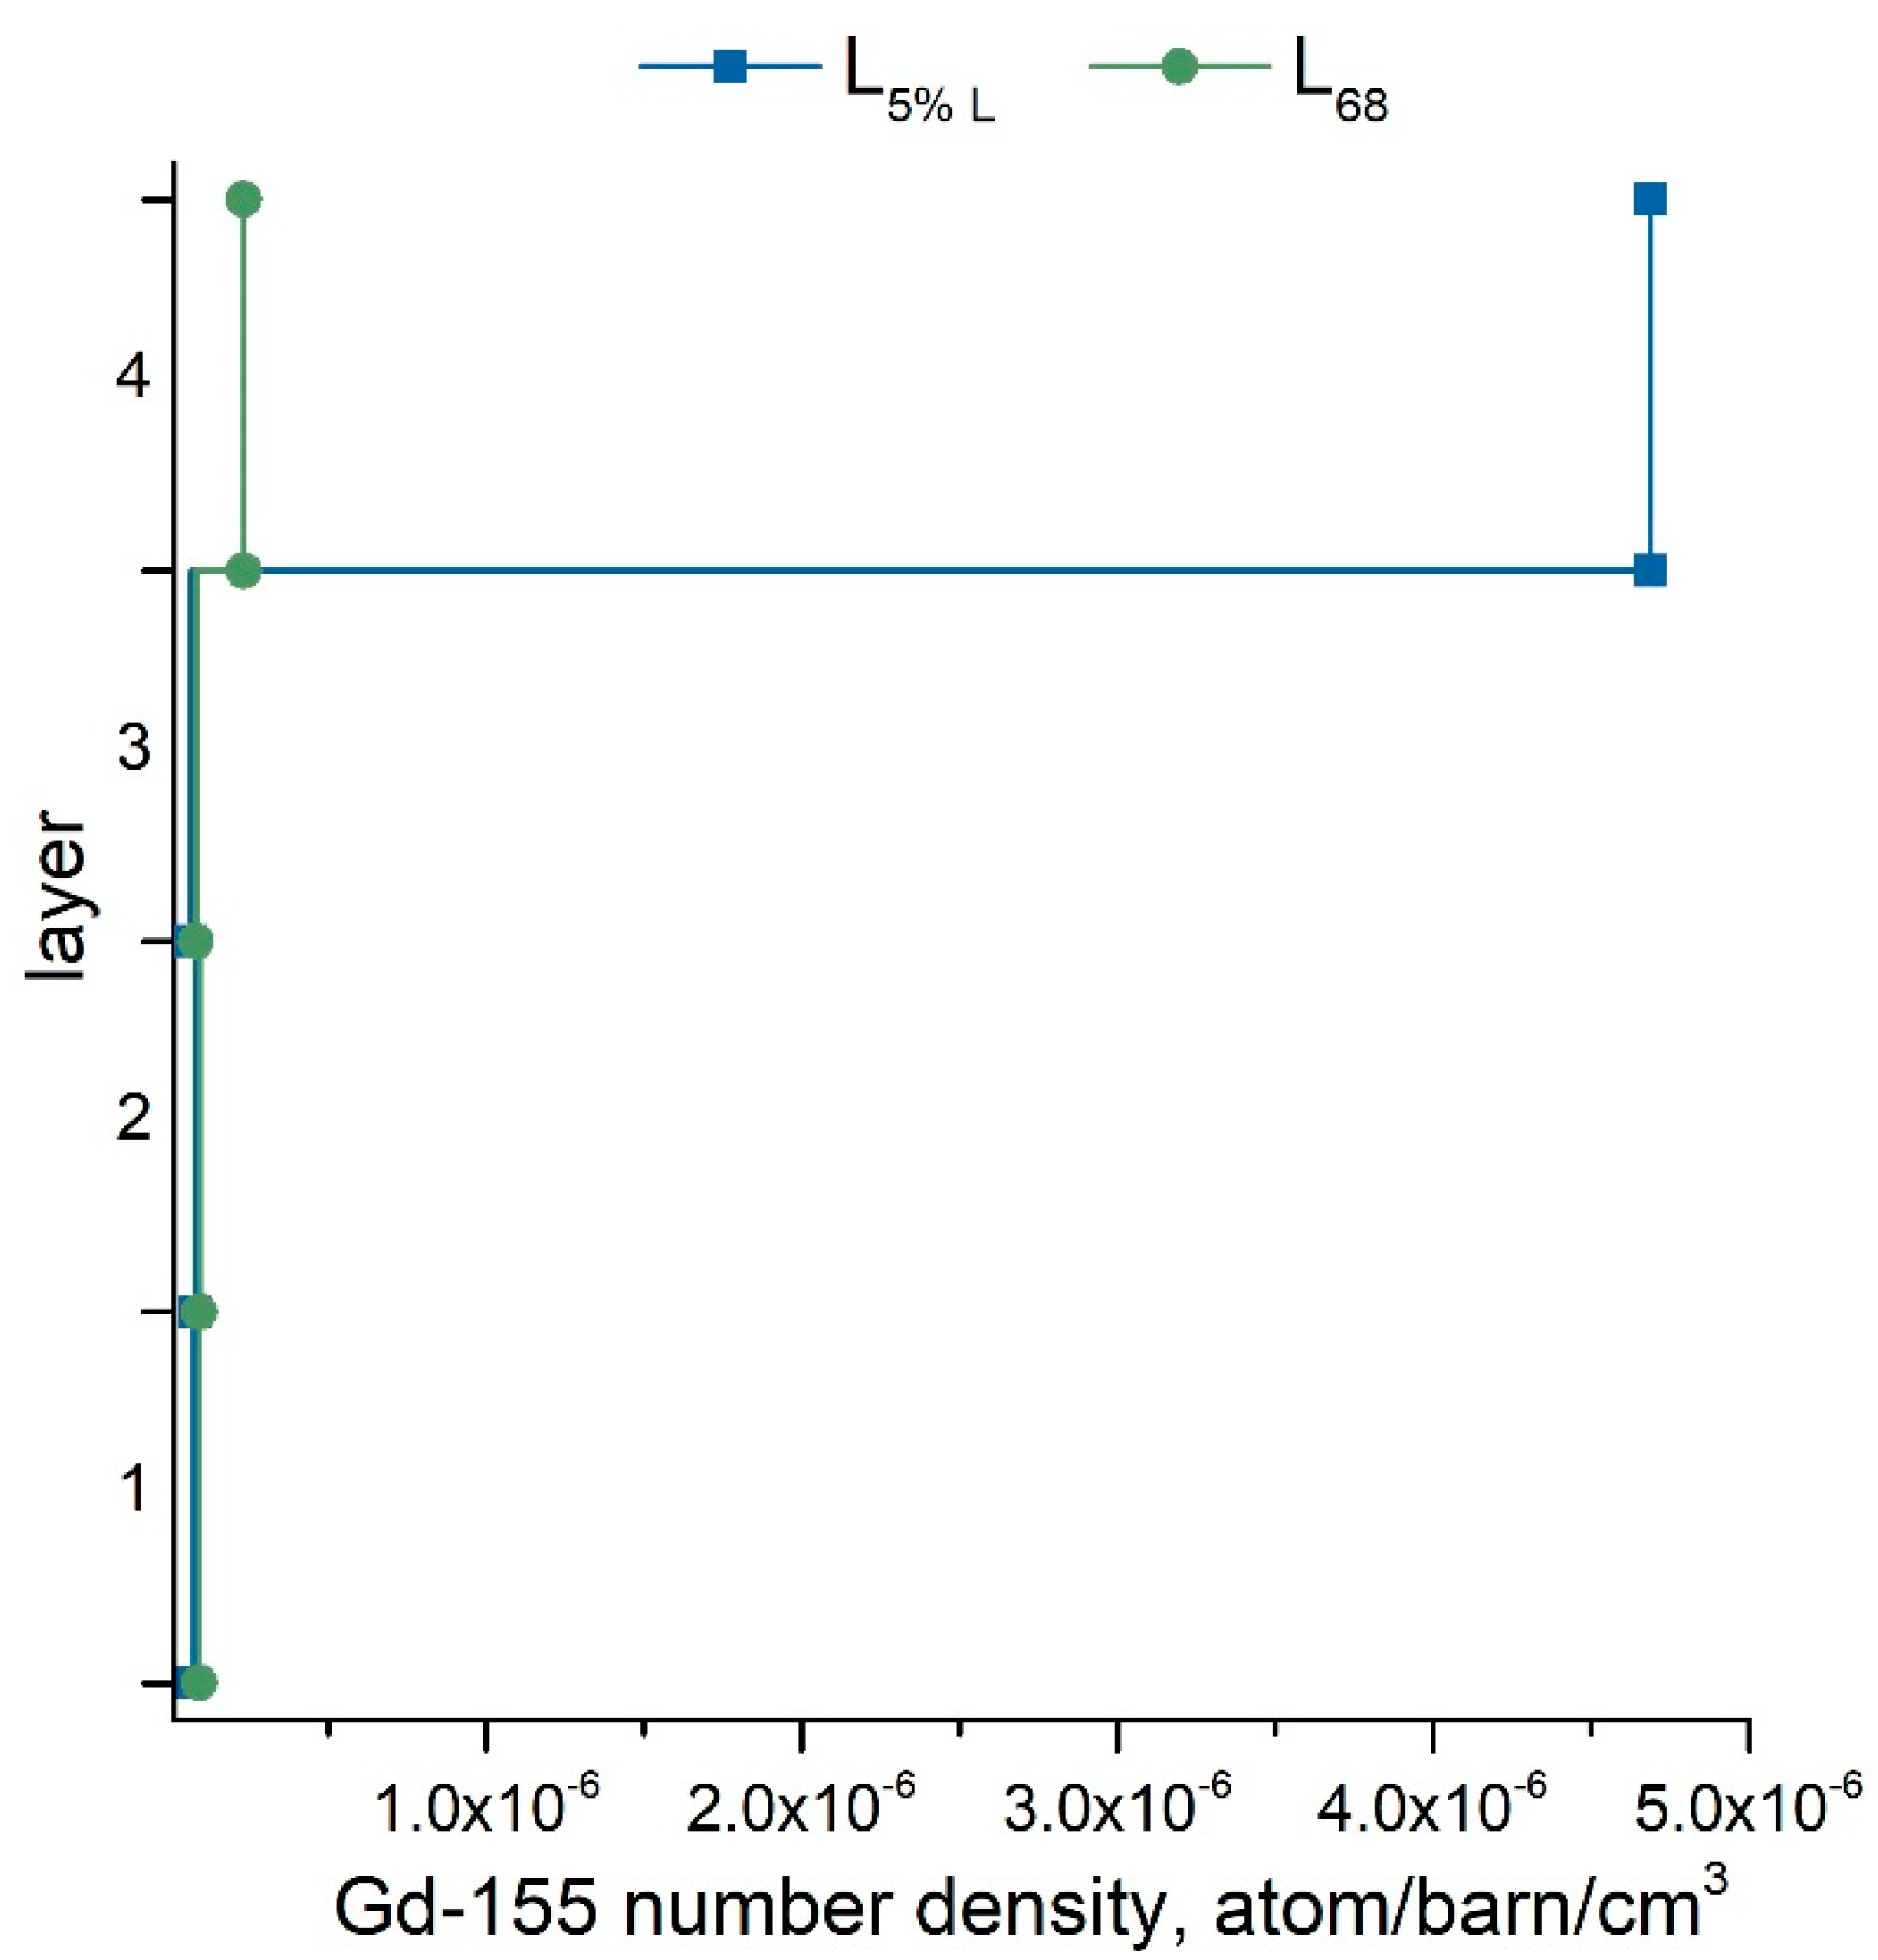
It is seen that in the case with modified target burnup and least optimal shuffling procedure (mod SP_C), the burnup credit from ARD for both fresh fuel and peak reactivity approaches is higher for the L5%L cask load (labelled as 5% in Figure 10) in comparison with L68 load (68 in Figure 10). However, it was expected that all ARDs would be lower for L5%L than for L68 load as in the case with reference target burnup (ref SP_C) since the fuel burnups of L5%L load are lower. Further analysis revealed that the presence of significant gadolinia concentrations in the upper parts of the fuel assemblies from L5%L load causes this issue (see Figure 11).
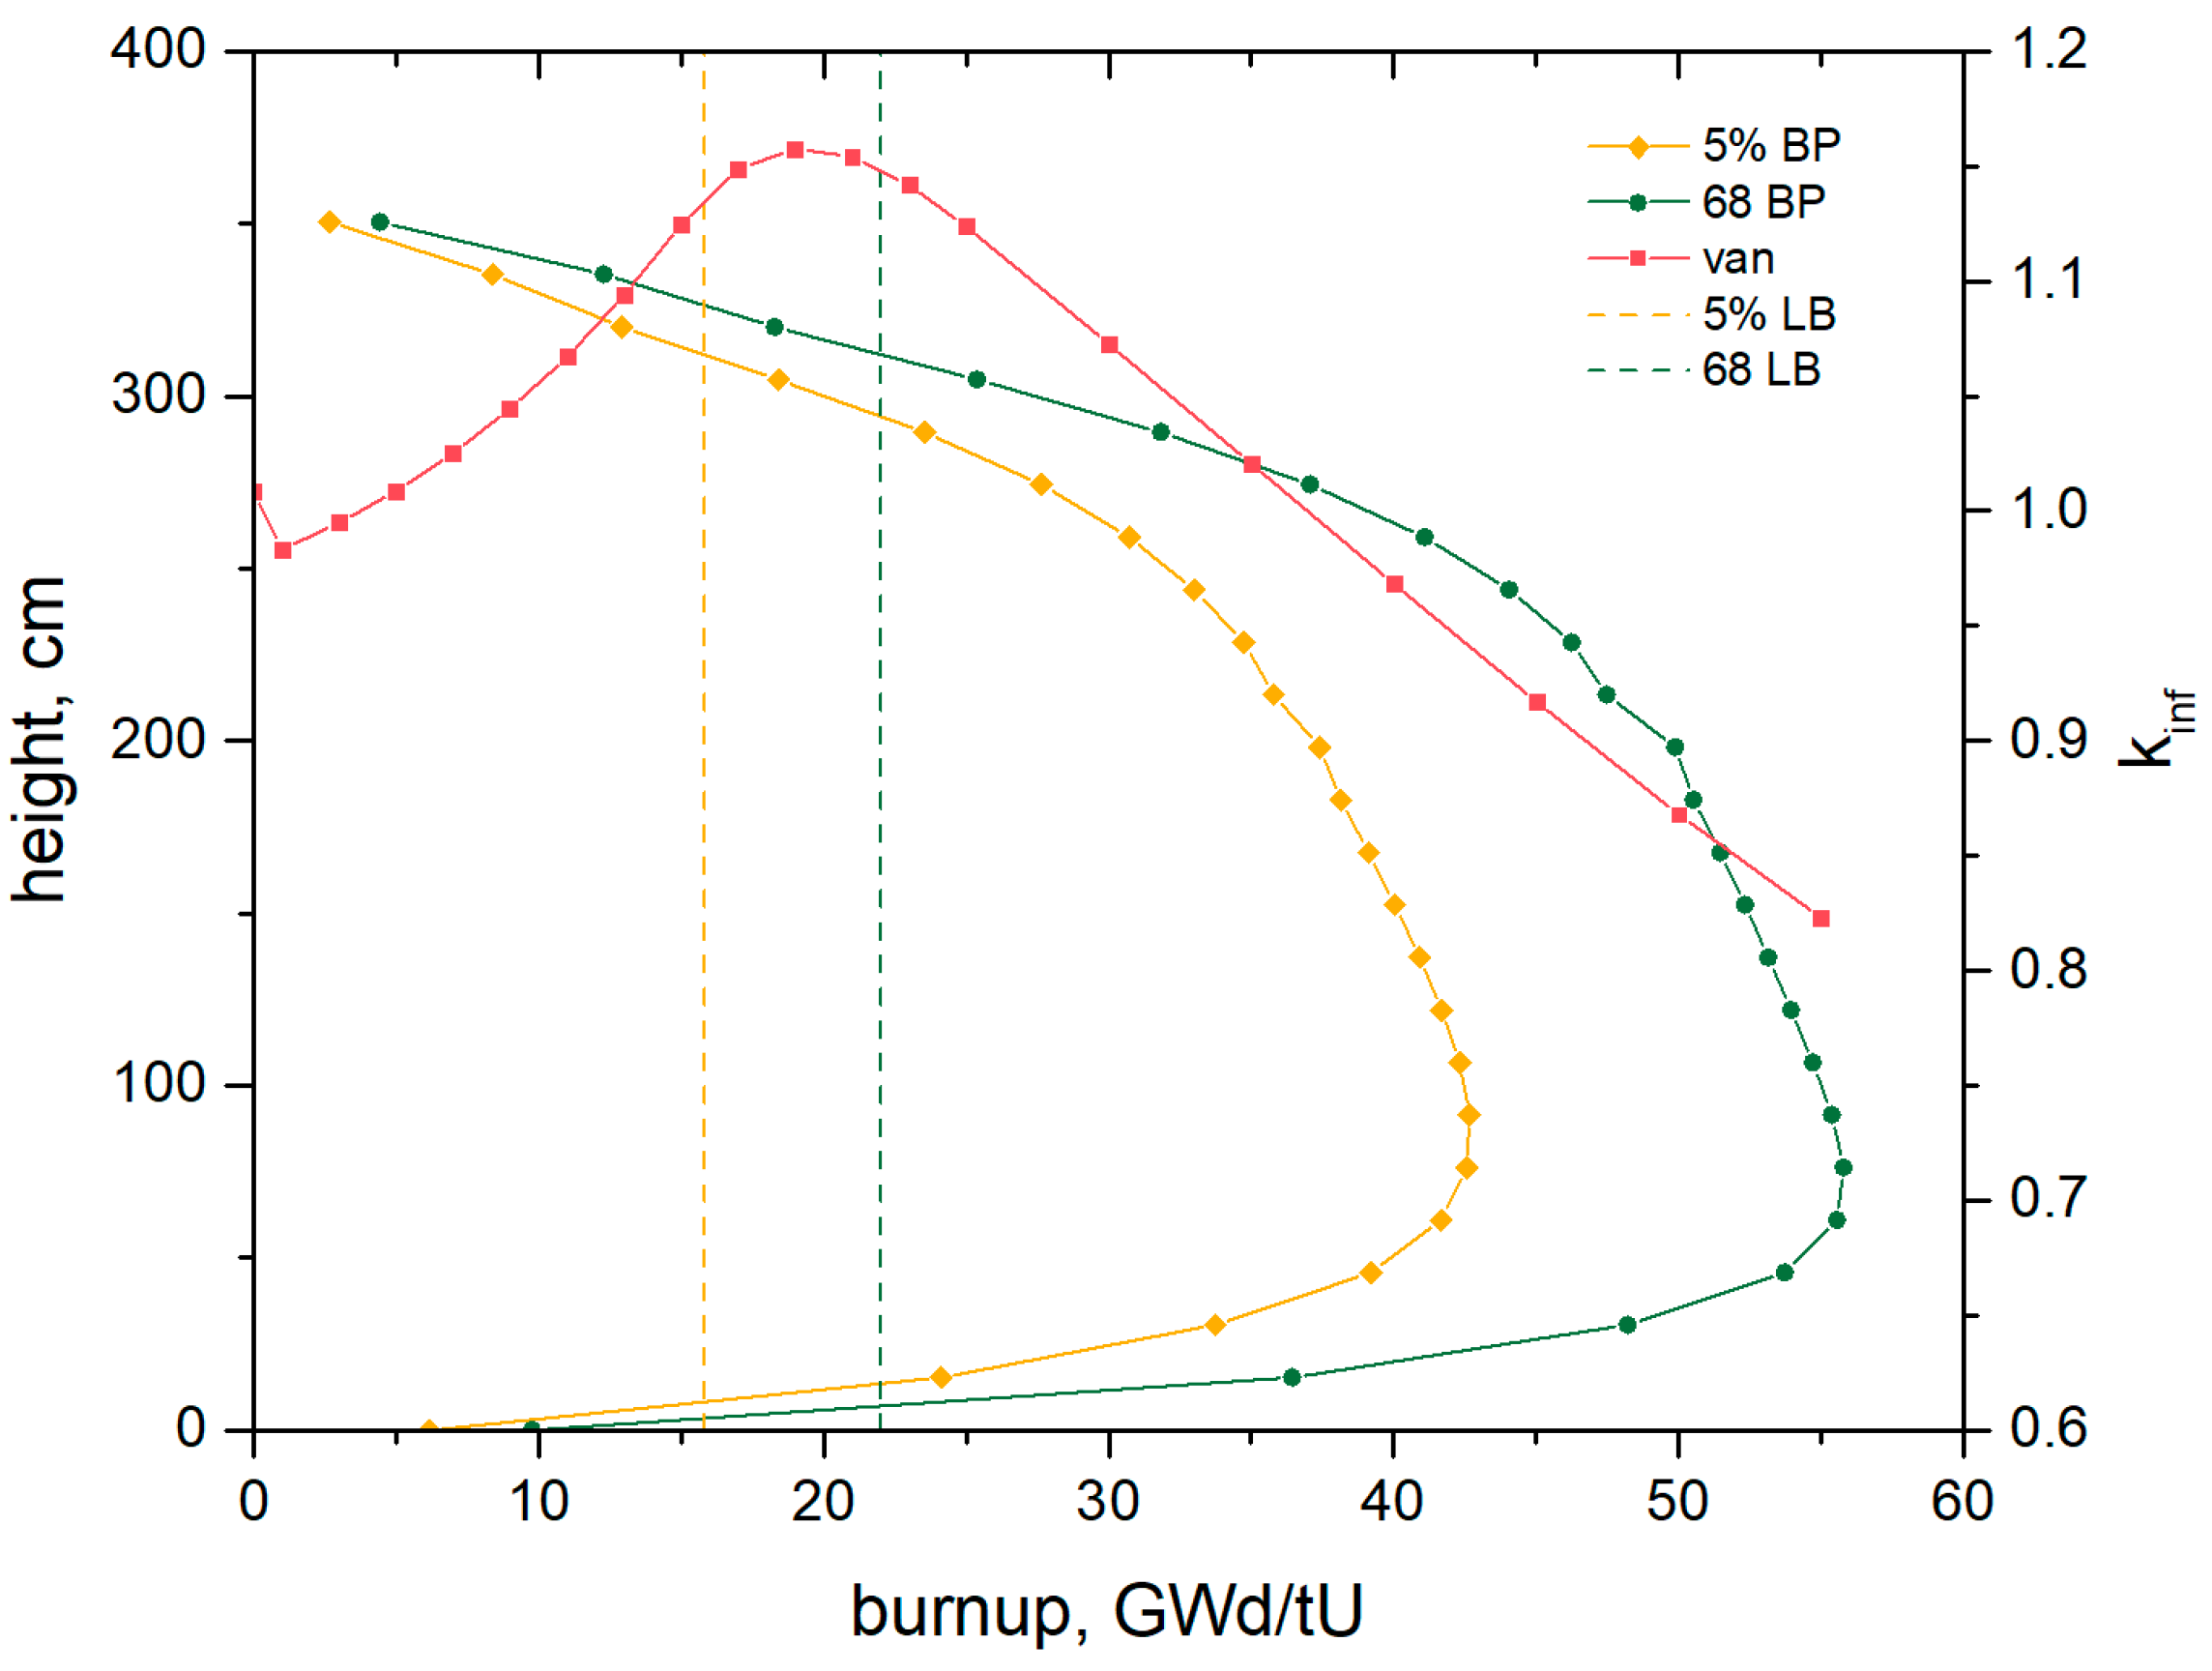
To understand the reason of the residual Gd presence, the axial burnup profiles of the FAs from L68 and L5%L loads (green and yellow lines, respectively, in Figure 12) and criticality curve (red line) for the vanished layer of the GE14 fuel assembly were investigated. Figure 12 shows that the burnup of the fuel assembly’s upper layer (layer 4) from L5%L load (5% LB yellow dash line) is around 15.8 GWd/tU. It corresponds to the part on criticality curve of the vanished layer (van) where gadolinia is still present, which means that fuel assemblies have not even reached the highest criticality level (peak reactivity). On the other hand, the upper layer burnup of the FAs from L68 load is 22 GWd/tU (68 LB green dash line) which corresponds to the part of the criticality curve where Gd is burnt (after the peak reactivity). Thus, for the least optimal burnup distribution SP_C with modified target burnup, the least burnt fuel assemblies are strongly underburned on the upper layer and therefore will be called here underburned fuel assemblies. This effect can occur if fuel assemblies designed for a much higher target burnup are not burnt close enough to it. The considered here GE14 fuel assembly variation is intended for a higher average burnup than the one from the modified target burnup case. Thus, this economically unsustainable approach would have somewhat surprising additional implications on the storage of the fuel assemblies due to the insufficient reduction of the burnable poison caused by the too low burnup.
The criticality inconsistency related to the underburned fuel assemblies disappears when considering the major actinides only set which is used for burnup criticality analysis on actinide-only level. This is due to the removal of gadolinia and fission products from the analysis. In the case of least optimal SP_C distribution obtained for the modified targeted burnup (mod SP_C), the ARD in comparison with fresh fuel approach is 13,400 and 18,700 pcm for L5%L and L68 load, respectively. Hence, the results repeat the expected pattern: lower ARD values for lower discharged burnups. Thus, the different approaches to the burnup credit analysis, such as the choice of the isotopic set can lead to different conclusions.
To sum up, as expected, the reduction of target burnup of a fuel assembly without reducing the initial enrichment (under burning the FA) leads to a substantial change in final assembly reactivity (increase in most cases) and consequently increase the reactivity of the storage system. In the classical 2D lattice approach, the criticality of the FA decreases with time for UO2 fuel, while in case of poisoned fuel, this behaviour is observed after the peak reactivity. This outcome will consequently be propagated to the criticality analysis of the systems with the spent fuel composition estimated from lattice calculations. The criticality analysis of the GBC-68 cask performed here uses isotopic data of the fuel obtained from the nodal calculations. For this case, the described above trend can be reversed as shown in this section for actinides plus fission product set, while it will follow the expected trend for major actinides set.
5.2.3. The Impact of the FA Type on the Cask Criticality
This section will explore the effect of the different FAs on burnup credit. For this part of the study, the additional BWR SVEA-100 fuel assembly design was considered. The four-cycle core map used for the full-core simulations is unsuitable for FAs of this type since the fuel is low enriched and normally its average burnup does not go above 40 GWd/tU. However, for the comparison, the current core layout with the already established reshuffling schemes but reduce the cycle length was used. To make sure that both reactor cores, one with GE14 fuel assembly type and another with SVEA-100, are burnt to the same extent, the cycle length was chosen, so the core criticality after the last cycle is similar for both cases. The cycle length for SVEA-100 FA was estimated as 8.5 GWd/tU, which is 33% lower than for the reference GE14 assembly.
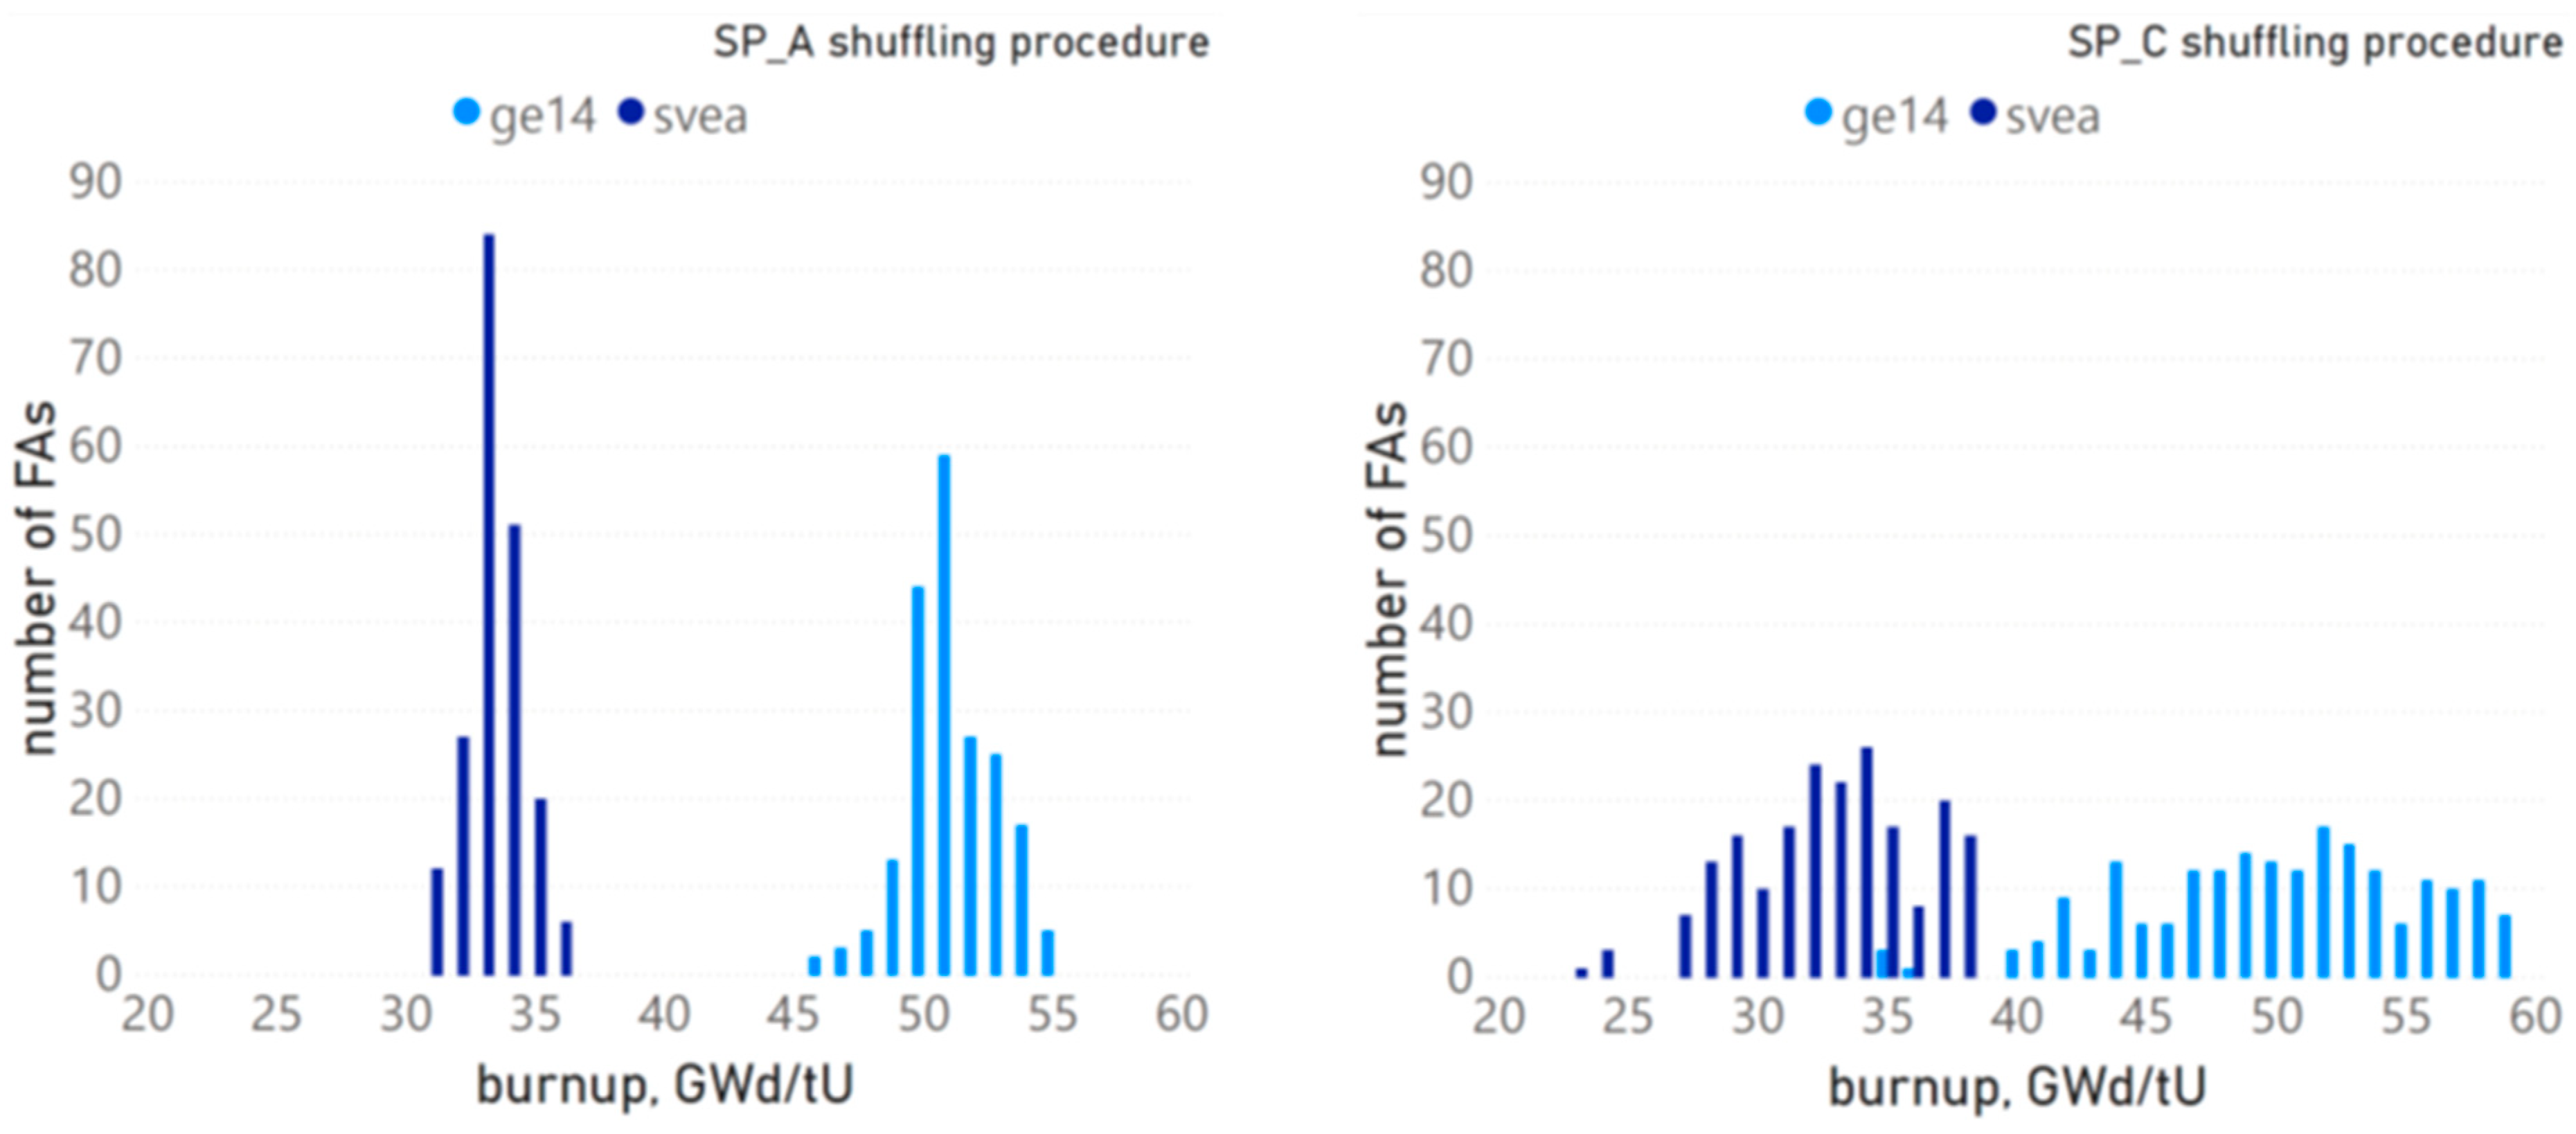
Figure 13 shows a comparison between the burnup distributions for the reactor core with the different FA types for SP_A and SP_C shuffling procedures. The target burnup in the case with SVEA-100 assembly is 32.5 GWd/tU and 50 GWd/tU for GE14. The burnup range decreases by 30% in the case with SVEA-100 for optimal and least optimal shuffling procedures, while the height of the distribution increases. This narrower burnup distribution suggests that the loading scheme is more optimal for the SVEA fuel assemblies with the lower target burnup. However, there are two things to be kept in mind. First, the very short cycle time for the SVEA-100 would not be attractive; thus, in reality, the FA would not be operated in four cycles, but more probably in three cycles. Second, the short cycle time created by the four-cycle scheme and the relatively low burnup increase per cycle has also helped to achieve this very favourable result. Thus, the four-cycle scheme designed for the GE14 fuel assembly seems to favour the SVEA-100 FA, which has a much shorter lifetime than a higher enriched GE14 configuration.
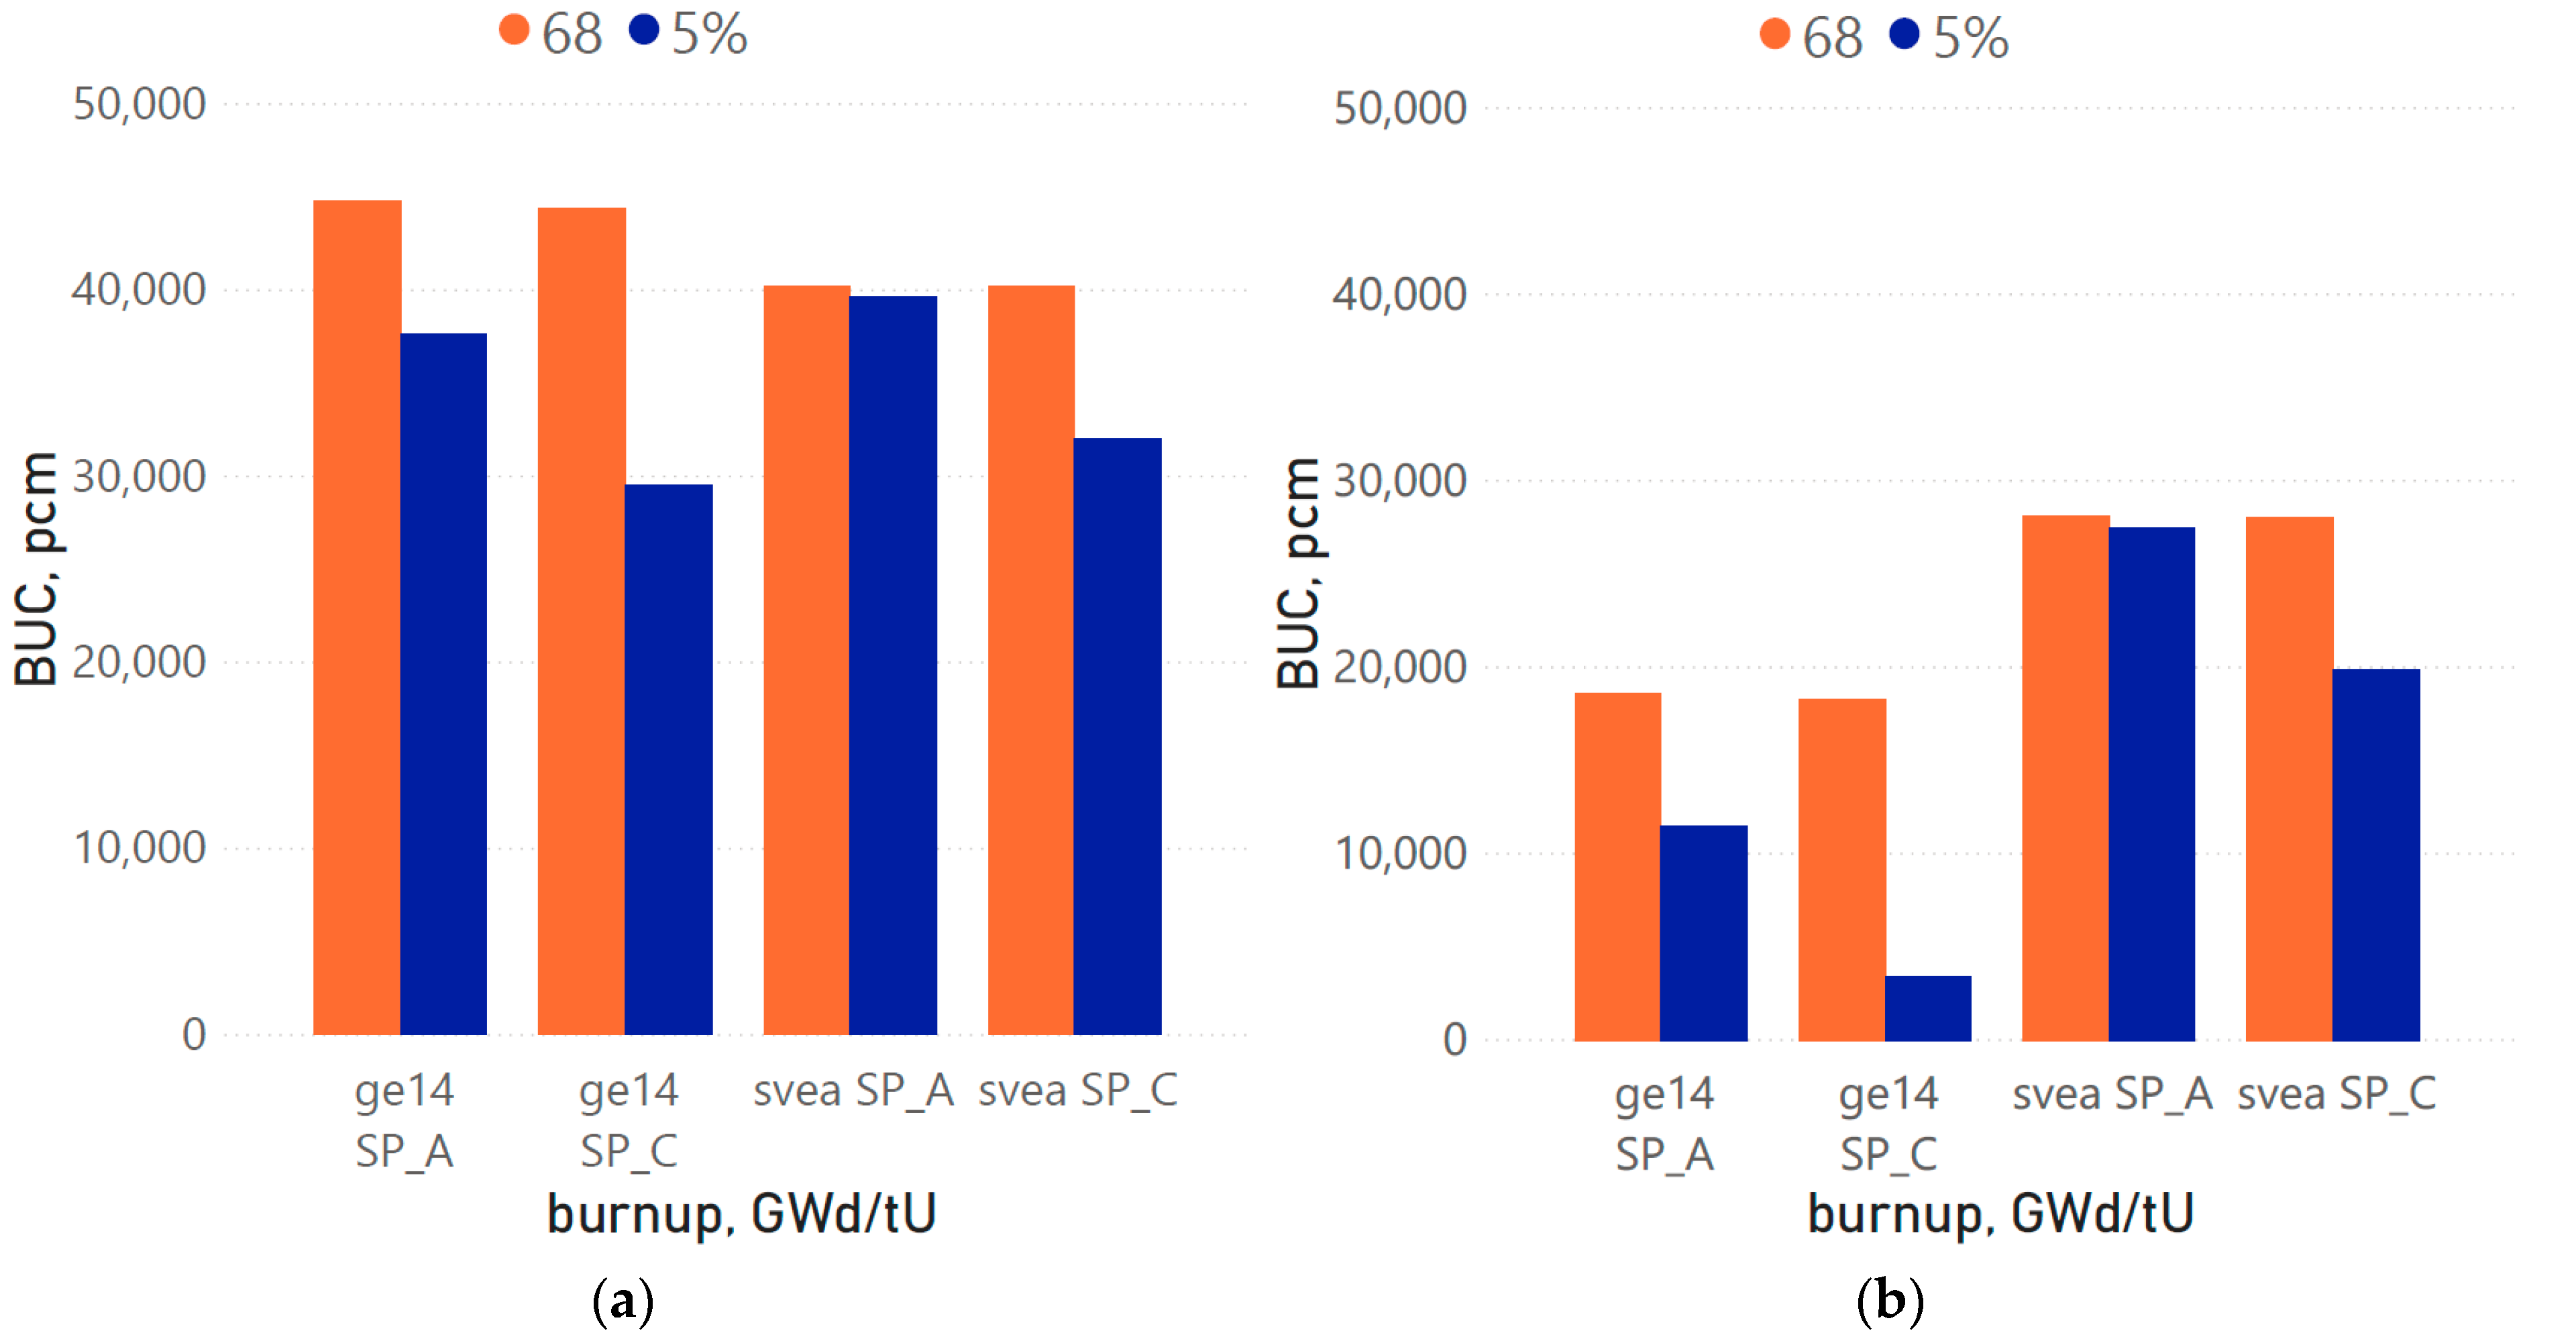
Figure 14 compares burnup credit from applying realistic FA data (Equation (1)) between the two different assembly types. It is seen that ARD in comparison with fresh fuel approach (Figure 14a) for both shuffling procedures SP_A and SP_C is slightly higher for GE14 assembly than for SVEA in case of L68 load (4300 pcm on average) and slightly lower (2200 pcm on average), for L5%L. The L68 load could be better in the case with GE14 FA since its design is much more sophisticated than the SVEA-100 fuel assembly design and is optimised to achieve higher burnup and improve the economic performance of the fuel: part length rods, higher initial enrichment and heavy Gd load. The SVEA100 assembly is better in the case of L5%L load due to narrower structure of the burnup distribution, which makes the burnup of the 5% least burnt FAs slightly closer to the average discharge burnup.
Compared to the peak reactivity approach, the ARD is lower for GE14 assembly than for SVEA-100 (Figure 14b). The difference in ARDs between GE14 and SVEA-100 FAs is 9600 pcm on average in the L68 load, and 16,200 pcm for L5%L. This is due to the higher peak reactivity value of the SVEA100 criticality curve (Figure 6). Thus, the benefit from applying realistic assembly conditions instead of the peak reactivity approach is lower for GE14 assembly, which represents here a modern BWR fuel assembly design, than for the previous generation SVEA100 assembly design. On the other hand, the ARD for fresh fuel approach is approximately at the same level for both FA types with a slight advantage of GE14 assembly.
In conclusion, although the burnup credit from applying realistic assembly data in comparison with the fresh fuel approach is substantial for modern BWR GE14 assembly design, it does not show the same level of benefit compared to the peak reactivity approach. The peak reactivity is achieved much later in the burnup history of the GE14 assembly; thus, there is less time to create differences between the peak reactivity approach and the more detailed full-core analysis. Considering that the reactor core was burnt to the similar extent for both FA types, in this research, the modern GE14 FA design did not show the significant increase in burnup credit values in comparison with older SVEA100 FA design. However, this outcome requires further investigation, and the first point would be developing a three-cycle reloading scheme which seems to be more appropriate for the SVEA-100.
5.2.4. Removal of Boral Panels from the GBC-68 Cask
This section explores the possibility of removal of boral panels from the storage cask filled with BWR spent fuel with realistic characteristics. The criticality analysis was performed for the GBC-68 storage cask loaded with 5% least burnt BWR GE14 fuel assemblies from the least optimal SP_C distribution with target burnup 50 GWd/tU and one year cooling time which represents the worst-case scenario for the reactor core and shuffling procedures investigated here.
The effective multiplication factor of the described above cask loading was determined to be 0.8622 compared to 0.7529 with the same loading but with boral panels present, 0.9684 for the fresh fuel approach and 0.7728 for the peak reactivity. The keff of the cask without boral panels with spent fuel from L5%L load is 10,700 pcm lower than the NRC requirements of 0.95 keff value for accident conditions (storage rack flooded with unborated water) [30], and 27,000 pcm lower when boral panels are included. The fresh fuel approach exceeds the safety limit by 2000 pcm, while the peak reactivity approach results are 24,000 pcm lower.
According to the estimation of the 2005 year, the cost of installation and manufacturing of the absorber panel is approximately USD 7000 [36,37]. The calculations were performed for MetamicTM panels containing Al-B4C mix, similar to boral panels used in this study [37]. The GBC-68 storage cask contains 156 panels resulting in a total cost 156 × USD 7000 = USD 1,092,000 for one cask. Considering that reactor core described here has 200 FAs from the third cycle, around three casks are needed to store the discharged fuel after one cycle of the reactor operation and may result in a cost of 3 × USD 1,092,000 = USD 3,276,000 per cycle. It should be noted that the estimation of the costs is approximate and presented here for illustrative purposes.
To summarise, the application of the model developed here based on the realistic spent fuel properties can potentially reduce SF transport and storage costs. It is also necessary to invest in the burnup credit method development, especially for high-enriched modern BWR assembly configurations. For example, the safety limit under the conservative fresh fuel approach was exceeded for GBC-68 storage cask loaded with GE14 fuel assembly.
5.3. The Modelling Approximations Impact on the Cask Criticality
One of the main modelling approximations here was the data averaging of 25 DYN3D nodes to six layers (Figure 5) within the fuel assembly. A series of calculations with a 25-layer FA model was performed to evaluate this approximation effect on the GBC-68 storage cask criticality. The criticality calculations were conducted for L68 and L5%L loads of the least optimal burnup distribution SP_C with BWR GE14 fuel assembly with one-year cooling time. The six-layer model underestimated cask keff by approximately 3800 pcm or 2.6% compared to 25-layer in case of L68 load and overestimated it by 4800 pcm or 3.6% in case of L5%L load. These values give a good approximation of the expected uncertainty from reducing the number of the layer. Thus, the estimated burnup credit value for six-layer model can be higher for L68 load and lower for L5%L. Overall, the current research focuses on creating a general understanding of the benefit from the BUC method using a best estimate approach. Thus, this level of discrepancy was considered as acceptable.
Recent research [15,16] developed and utilised for the burnup credit analysis a detailed 3D model of the BWR GE14 fuel assembly to reflect on various operational difficulties of the BWRs. Although the current research is also focused on developing a realistic BWR FA model, there are substantial differences between the approaches outlined in this investigation and those from studies [15,16]. For example, the authors of the above study performed depletion calculations using only one coolant density profile. However, the given study used the data obtained from the full core analysis and, thus, considered a more realistic FA behaviour in the reactor core. Another difference is that the BUC method in the research [15,16] was applied to the fuel discharged at the peak reactivity while, in this study, realistic discharged burnups were considered. Another recent study [14] investigated the effect of the variation of the several operating parameters (compound effect) on the burnup credit using the BWR GE14 fuel assembly design. The study included a wide range of assumptions and simplifications regarding the fuel assembly design and operating parameters, such as lack of part-length rods or gadolinia rods.
In general, the current modelling approach provides a much more realistic model of the fuel assembly during the operation compared to the studies in Refs. [14,15,16] since it uses more realistic axial coolant density distributions and burnup profiles delivered by the thermal-hydraulics module of the coupled core simulation.
6. Conclusions
This paper has investigated the potential benefit of applying the burnup credit method for BWR spent fuel using the data obtained from the full-core calculations. The criticality analysis for the GBC-68 storage cask filled with BWR spent fuel was performed for five different refuelling scenarios developed by the authors in the last part of the research, two target burnups and two fuel assembly types: modern GE14 and the previous generation SVEA100. The BUC analysis results were based on a realistic FA model and compared with fresh fuel, and peak reactivity approaches.
The depletion analysis for both GE14 and SVEA100 FAs, using both lattice and nodal modelling approaches, showed that while the SVEA100 assembly has lower initial enrichment and hence mostly lower criticality, its peak reactivity is higher and occurs earlier than for GE14 fuel assembly due to the lower initial gadolinia content. Further analysis showed that the refuelling scenario substantially affects the cask criticality of the loads formed from least burnt fuel assemblies. The target burnup decrease leads to the expected increase in cask criticality and reduces the benefit of the BUC except for underburned FAs, which still contain a significant amount of gadolinia in an upper FA layer leading to a reduction in cask criticality. Comparison of cask criticality filled with different FA types—GE14 and SVEA100—revealed that if FAs are burnt up to their typical target burnup, the benefit from the applying BUC is at the relatively same level in comparison with fresh fuel approach for both L68 and L5%L loads. However, the burnup credit for the realistic model of SVEA100 assembly shows better results compared to the peak reactivity approach. This is due to the reactivity peak appearing earlier on the criticality curve and having a higher criticality value than for GE14 assembly. It was also estimated that the potential saving costs in terms of the cask manufacturing due to the burnup credit method application could potentially reach several million US dollar savings per reactor operational cycle.
In conclusion, despite that development of the burnup credit method for BWRs is a complex problem, our research showed that it is worth investing in it due to potential savings. The burnup credit method is especially beneficial for more complex and higher enriched modern BWR fuel assembly designs.
Author Contributions
Conceptualisation, A.D. and B.M.; methodology, A.D. and D.L.; software, A.D.; formal analysis, A.D.; investigation, A.D.; data curation, A.D.; writing—original draft preparation, A.D.; writing—review and editing, A.P., D.L. and B.M.; visualisation, A.D.; supervision, B.M. and A.P. All authors have read and agreed to the published version of the manuscript.
Funding
This research received no external funding.
Institutional Review Board Statement
Not applicable.
Informed Consent Statement
Not applicable.
Data Availability Statement
Not applicable.
Conflicts of Interest
The authors declare no conflict of interest.
References
- International Atomic Energy Agency. Criticality Safety in the Handling of Fissile Material; IAEA Safety Standards Series No. SSG-27; IAEA: Vienna, Austria, 2014. [Google Scholar]
- Hanlon, D.; Richards, S.; Ware, T.; Lindley, B.; Porter, J.; Raap, M.B. Use of Burn-up Credit in the Assessment of Criticality Risk; Amec Foster Wheeler: London, UK, 2017. [Google Scholar]
- Crossland, I. Nuclear Fuel Cycle Science and Engineering; Elsevier: Amsterdam, The Netherlands, 2012. [Google Scholar]
- International Atomic Energy Agency. Advances in Applications of Burnup Credit to Enhance Spent Fuel Transportation, Storage, Reprocessing and Disposition, IAEA-TECDOC-CD-1547. In Proceedings of the Technical Meeting, London, UK, 29 August–2 September 2005. [Google Scholar]
- International Atomic Energy Agency. Implementation of Burnup Credit in Spent Fuel Management Systems, IAEA-TECDOC-1013. In Proceedings of the Advisory Group Meeting, Vienna, Austria, 20–24 October 1997. [Google Scholar]
- Parks, C.V.; DeHart, M.D.; Wagner, J.C. Review and Prioritisation of Technical Issues Related to Burn-up Credit for LWR Fuel; Oak Ridge National Laboratory: Oak Ridge, TN, USA, 2000; NUREG/CR-6665 (ORNL/TM-1999/303).
- Division of Spent Fuel Storage and Transportation. Burn-up Credit in the Criticality Safety Analyses of PWR Spent Fuel in Transportation and Storage Casks. In Division of Spent Fuel Storage and Transportation Interim Staff Guidance–8 Revision 3; US Nuclear Regulatory Commission: Rockville, MD, USA, 2012. [Google Scholar]
- Detkina, A.; Peakman, A.; Litskevich, D.; Liang, J.-H.; Merk, B. Evaluation of BWR Burnup Calculations Using Deterministic Lattice Codes SCALE-6.2, WIMS-10A and CASMO5. Energies 2020, 13, 2573. [Google Scholar] [CrossRef]
- International Atomic Energy Agency. Nuclear Power Reactors in the World, 39th ed.; International Atomic Energy Agency: Vienna, Austria, 2019. [Google Scholar]
- Fennern, L. Design evolution of BWRs: Dresden to generation III. Prog. Nucl. Energy 2018, 102, 38–57. [Google Scholar] [CrossRef]
- Marshall, W.J.; Ade, B.J.; Gauld, I.C.; Ilas, G.; Mertyurek, U.; Clarity, J.B.; Radulescu, G.; Betzler, B.R.; Bowman, S.M.; Gonzalez, M. Overview of the Recent BWR Burnup Credit Project at Oak Ridge National Laboratory; Oak Ridge National Lab: Oak Ridge, TN, USA, 2019.
- Marshall, W.; Ade, B.J.; Bowman, S.M.; Martinez-Gonzalez, J.S. Axial Moderator Density Distributions, Control Blade Usage, and Axial Burnup Distributions for Extended BWR Burnup Credit; US Nuclear Regulatory Commission, Office of Nuclear Regulatory Research: Rockville, MD, USA, 2016.
- Rearden, B.; Jessee, M. SCALE Code System, ORNL/TM-2005/39, Version 6.2.2; Oak Ridge National Laboratory: Oak Ridge, TN, USA, 2017.
- Wu, S.C.; Chao, D.S.; Liang, J.H. Compound effects of operating parameters on burnup credit criticality analysis in boiling water reactor spent fuel assemblies. Nucl. Eng. Technol. 2018, 50, 18–24. [Google Scholar] [CrossRef]
- Radaideh, M.I.; Price, D.; O’grady, D.; Kozlowski, T. Advanced BWR criticality safety part I: Model development, model benchmarking, and depletion with uncertainty analysis. Prog. Nucl. Energy 2019, 113, 230–246. [Google Scholar] [CrossRef]
- Price, D.; Radaideh, M.I.; O’Grady, D.; Kozlowski, T. Advanced BWR criticality safety part II: Cask criticality, burnup credit, sensitivity, and uncertainty analyses. Prog. Nucl. Energy 2019, 115, 126–139. [Google Scholar] [CrossRef]
- Gauld, I.C. Strategies for Application of Isotopic Uncertainties in Burnup Credit; Oak Ridge National Laboratory: Oak Ridge, TN, USA, 2003; ORNL/TM-2001/257.
- Radaideh, M.I.; Price, D.; Kozlowski, T. On using computational versus data-driven methods for uncertainty propagation of isotopic uncertainties. Nucl. Eng. Technol. 2020, 52, 1148–1155. [Google Scholar] [CrossRef]
- Ilas, G.; Liljenfeldt, H. Decay heat uncertainty for BWR used fuel due to modeling and nuclear data uncertainties. Nucl. Eng. Des. 2017, 319, 176–184. [Google Scholar] [CrossRef]
- Radaideh, M.I.; Price, D.; Kozlowski, T. Criticality and uncertainty assessment of assembly misloading in BWR transportation cask. Ann. Nucl. Energy 2018, 113, 1–14. [Google Scholar] [CrossRef]
- Rochman, D.; Dokhane, A.; Vasiliev, A.; Ferroukhi, H.; Hursin, M. Nuclear data uncertainties for core parameters based on Swiss BWR operated cycles. Ann. Nucl. Energy 2020, 148, 107727. [Google Scholar] [CrossRef]
- Detkina, A.; Litskevitch, D.; Peakman, A.; Merk, B. Burnup Credit Evaluation for BWR Spent Fuel from Full Core Calculations. Appl. Sci. 2020, 10, 7549. [Google Scholar] [CrossRef]
- Peakman, A.; Grove, C.; Fitzgerald, K.; Gregg, R. Development of an equilibrium loading pattern and whole-core fuel performance assessment in the Advanced Boiling Water Reactor (ABWR) with UO2 and U3Si2 fuels. Prog. Nucl. Energy 2019, 117, 103053. [Google Scholar] [CrossRef]
- Jessee, M.A.; Wieselquist, W.A.; Mertyurek, U.; Kim, K.S.; Evans, T.M.; Hamilton, S.P.; Gentry, C. Lattice physics calculations using the embedded self-shielding method in Polaris, Part I: Methods and implementation. Ann. Nucl. Energy 2020, 150, 107830. [Google Scholar] [CrossRef]
- Mertyurek, U.; Jessee, M.A.; Betzler, B.R. Lattice physics calculations using the embedded self-shielding method in polaris, Part II: Benchmark assessment. Ann. Nucl. Energy 2020, 150, 107829. [Google Scholar] [CrossRef]
- Rohde, U.; Kliem, S.; Grundmann, U.; Baier, S.; Bilodid, Y.; Duerigen, S.; Fridman, E.; Gommlich, A.; Grahn, A.; Holt, L.; et al. The reactor dynamics code DYN3D–models, validation and applications. Prog. Nucl. Energy 2016, 89, 170–190. [Google Scholar] [CrossRef]
- Mueller, D.E.; Scaglione, J.M.; Wagner, J.C.; Bowman, S.M. Computational Benchmark for Estimated Reactivity Margin from Fission Products and Minor Actinides in BWR Burnup Credit; ORNL Report to the NRC; Oak Ridge National Laboratory: Oak Ridge, TN, USA, 2013.
- Zwicky, H. Isotopic Data of Sample F3F6 from a Rod Irradiated in the Swedish Boiling Water Reactor Forsmark 3; Zwicky Consulting: Remigen, Switzerland, 2008; ZC-08/001. [Google Scholar]
- Karnbranslehantering, S. Measurements of Decay Heat in Spent Nuclear Fuel at the Swedish Interim Storage Facility, Clab, R-05-62; Swedish Nuclear Fuel and Waste Management Co.: Stockholm, Sweden, 2006. [Google Scholar]
- NRC. 10 CFR 50.68 Criticality Accident Requirements. Available online: https://www.nrc.gov/reading-rm/doc-collections/cfr/part050/part050-0068.html (accessed on 15 October 2020).
- IAEA. Status Report 97—Advanced Boiling Water Reactor (ABWR). Available online: https://aris.iaea.org/PDF/ABWR.pdf (accessed on 30 August 2020).
- Brown, C.; Hartley, K.; Hulsman, J. Extended Power Uprates and 2-yr Cycles for BWRs—Where Do We Go from Here? Nucl. Technol. 2005, 151, 120–125. [Google Scholar] [CrossRef]
- Marshall, W.B.; Ade, B.J.; Bowman, S.M.; Gauld, I.C.; Ilas, G.; Mertyurek, U.; Radulescu, G. Technical Basis for Peak Reactivity Burnup Credit for BWR Spent Nuclear Fuel in Storage and Transportation Systems; Oak Ridge National Lab (ORNL): Oak Ridge, TN, USA, 2015.
- Merk, B.; Broeders, C.H.M. Overview of the amounts of plutonium generated against the background of the fixed electricity amount regulated by law in Germany. Actin. Fission Prod. Partit. Transmutat. 2007, 663–671. [Google Scholar]
- OECD. Nuclear Fuel Safety Criteria; Technical Review; OECD Nuclear Energy Agency: Paris, France, 2012. [Google Scholar]
- Electric Power Research Institute. Cost Impact of Using ISG-8 Rev. 3 for PWR Spent Fuel Pool Criticality Analysis; Technical Report; Electric Power Research Institute: Palo Alto, CA, USA, 2012. [Google Scholar]
- Holtec International. Holtec Report HI-2043149 (Non-Proprietary); ADAMS Accession No. ML060900259; Holtec International: Marlton, NJ, USA, 2005. [Google Scholar]
Figure 1.
BWR GE14 10 × 10 (left) and SVEA-100 (right) fuel assembly designs.

Figure 2.
BWR full-core layout (1/4).

Figure 3.
SCALE model of GBC-68 storage cask filled with BWR GE14 spent fuel assemblies.

Figure 4.
Flowchart of the modelling sequence from the full core nodal analysis to the cask criticality evaluation.
Figure 4.
Flowchart of the modelling sequence from the full core nodal analysis to the cask criticality evaluation.

Figure 5.
GBC-68 cask model in KENO V.a and the transformation of the layer structure form the core simulation to the cask model (NE—natural uranium blanket, LAYER—the FA layer).
Figure 5.
GBC-68 cask model in KENO V.a and the transformation of the layer structure form the core simulation to the cask model (NE—natural uranium blanket, LAYER—the FA layer).

Figure 6.
keff vs. burnup for three different models BWR GE14 and SVEA100 fuel assemblies.

Figure 7.
keff of the GBC-68 cask filled with FAs from (a) L68 and (b) L5%L loads vs. cooling time for different refuelling scenarios.
Figure 7.
keff of the GBC-68 cask filled with FAs from (a) L68 and (b) L5%L loads vs. cooling time for different refuelling scenarios.

Figure 8.
The coolant density profiles of the FAs from (a) L68 and (b) L5%L cask loads for different refuelling scenarios.
Figure 8.
The coolant density profiles of the FAs from (a) L68 and (b) L5%L cask loads for different refuelling scenarios.

Figure 9.
Burnup distributions for reference and modified target burnups for (a) SP_A and (b) SP_C shuffling procedures.
Figure 9.
Burnup distributions for reference and modified target burnups for (a) SP_A and (b) SP_C shuffling procedures.

Figure 10.
BUC in comparison with fresh fuel approach (a) and peak reactivity approach (b).

Figure 11.
Gd-155 concentration in FA layers for L5%L and L68 loads.

Figure 12.
Burnup profile (BP) for FAs from L5%L load and L68 loads and kinf as a function of the average burnup of layer 4 of the GE14 FA model (van).
Figure 12.
Burnup profile (BP) for FAs from L5%L load and L68 loads and kinf as a function of the average burnup of layer 4 of the GE14 FA model (van).

Figure 13.
Burnup distribution for two FA types SVEA100 and GE14 and SP_A and SP_C shuffling procedures.
Figure 13.
Burnup distribution for two FA types SVEA100 and GE14 and SP_A and SP_C shuffling procedures.

Figure 14.
BUC in comparison with fresh fuel (a) and peak reactivity (b) approach.


| Parameter | GE14 10 × 10 | SVEA-100 |
|---|---|---|
| Fuel pellet radius, cm | 0.438 | 0.4095 |
| Zr clad radius, cm | 0.513 | 0.481 |
| Fuel rod pitch, cm | 1.295 | 1.24 |
| Fuel rods number | 92 | 100 |
| Assembly pitch, cm | 15.24 | 15.475 |
| Assembly height, cm | 381 | 375 |
Table 2.
GBC-68 cask parameters [27].
Table 2.
GBC-68 cask parameters [27].
| Parameter | Value, cm |
|---|---|
| Outer diameter | 215 |
| Inner diameter | 175 |
| Inside height | 410.76 |
| Lid thickness | 20 |
| Cell pitch | 16.8 |
| Boral panel thickness | 0.2565 |
Table 3.
The summary of parameters for five refuelling scenarios.
| Distribution Parameter | Refuelling Scenario | ||||
|---|---|---|---|---|---|
| SP_A | SP_B | SP_C | SP_D | SP_E | |
| L68 load burnup, GWd/tU | 50.5 | 49.9 | 50.3 | 49.8 | 50.1 |
| L5%L load burnup, GWd/tU | 46.9 | 47.0 | 38.0 | 45.7 | 47.3 |
Table 4.
The summary of parameters of the SP_A and SP_C distributions with reference and modified target burnups.
Table 4.
The summary of parameters of the SP_A and SP_C distributions with reference and modified target burnups.
| Distribution Parameter | Distribution | |||
|---|---|---|---|---|
| SP_A_ref | SP_A_mod | SP_C_ref | SP_C_mod | |
| Average burnup, GWd/tU | 50.7 | 44.6 | 49.7 | 43.7 |
| Minimum burnup, GWd/tU | 45.7 | 40.9 | 34.5 | 30.1 |
| Maximum burnup, GWd/tU | 54.5 | 47.8 | 58.7 | 52.5 |
| FA number in the highest bin | 59 | 77 | 17 | 20 |
Publisher’s Note: MDPI stays neutral with regard to jurisdictional claims in published maps and institutional affiliations. |
© 2021 by the authors. Licensee MDPI, Basel, Switzerland. This article is an open access article distributed under the terms and conditions of the Creative Commons Attribution (CC BY) license (http://creativecommons.org/licenses/by/4.0/).
Share and Cite
MDPI and ACS Style
Detkina, A.; Litskevitch, D.; Peakman, A.; Merk, B. Criticality Analysis for BWR Spent Fuel Based on the Burnup Credit Evaluation from Full Core Simulations. Appl. Sci. 2021, 11, 1498. https://doi.org/10.3390/app11041498
AMA Style
Detkina A, Litskevitch D, Peakman A, Merk B. Criticality Analysis for BWR Spent Fuel Based on the Burnup Credit Evaluation from Full Core Simulations. Applied Sciences. 2021; 11(4):1498. https://doi.org/10.3390/app11041498
Chicago/Turabian StyleDetkina, Anna, Dzianis Litskevitch, Aiden Peakman, and Bruno Merk. 2021. "Criticality Analysis for BWR Spent Fuel Based on the Burnup Credit Evaluation from Full Core Simulations" Applied Sciences 11, no. 4: 1498. https://doi.org/10.3390/app11041498
Note that from the first issue of 2016, this journal uses article numbers instead of page numbers. See further details here.