1. Introduction
The knee is an anatomically and biomechanically complex joint that serves as the basis for the mobility and stability of the human body. This joint undergoes various static and dynamic stresses that make it subject to several degenerative diseases, including knee osteoarthritis (OA). The World Health Organization (WHO) estimates that 10% of the adult population in developed countries suffers from OA, 6.1% of which affects the knee [
1]. In Canada, hundreds of thousands of people suffer from knee OA, which affects their functional abilities and undermines their quality of life [
2].
Although there are protocols and clinical guidelines for the management of knee osteoarthritis, several studies showed that treatments are far from optimal and that significant clinical gaps exist in the therapeutic management of knee OA [
3,
4]. Osteoarthritis can be diagnosed by a physician (typically a general practitioner, an orthopedic surgeon or a rheumatologist) after a musculoskeletal evaluation that can be combined with an imaging assessment (X-ray). Radiographic examinations collect information on the integrity of knee structures but because they are performed in a static condition, they do not provide information on the knee’s functional status. Although such examinations allow to assess the impact of an injury on anatomical structures, they do not provide clinicians with information to support whether a conservative treatment, such as physical exercises, should be prescribed or not.
In this context, a dynamic functional evaluation of the knee provides valuable clinical information (e.g., misalignments during gait) [
5]. This evaluation can be completed with a knee kinesiography exam which measures the three-dimensional rotation angles (3D kinematics) during gait, allowing to identify mechanical biomarkers directly related to the progression of the disease and the patient’s symptoms. This objective assessment allows clinicians to recommend personalized exercises targeting the previously identified mechanical biomarkers. This type of evaluation can easily be performed in a clinical setting using the KneeKG
TM system (EMOVI Inc., Montreal, QC, Canada;
Figure 1). This system consists of passive motion sensors fixed on the knee harness, an infrared motion capture system and a computer equipped with an acquisition software. The harness is fixed quasi-rigidly on the thigh and calf to measure tibial and femoral rotation [
6]. Several studies have demonstrated the accuracy, validity and reproducibility of 3D knee movements measured with this technology [
6,
7,
8].
Exercises are among the non-surgical treatment options with the most research evidence supporting their effectiveness [
9]. Overall, they aim to strengthen muscles and improve flexibility and balance in order to alleviate symptoms and improve joint function [
10]. However, the factors that could predict which patients would be more likely to respond to such a treatment have yet to be determined. Indeed, the vast majority of studies on predictive models in knee OA populations have focused on identifying risk factors to help predict disease progression [
11,
12,
13]. Notably, age, body mass index (BMI), or radiographic grading appeared to play an important role, and thus they were mainly used as the only possible predictors in the few studies which actually predicted the impact of physical exercise programs on knee OA [
14,
15].
To our knowledge, only two studies assessed the role of knee kinematics as predictors of patient response to exercises and both suggested that they can be useful to optimize exercise recommendations [
16,
17]. However, these studies did not assess 3D kinematics with a high degree of accuracy. Therefore, the aim of the present study was to investigate whether 3D kinematic data can be efficiently used to objectively predict the impact of a physical exercise program.
2. Materials and Methods
The methodology used is described in the block diagram presented in
Figure 2 and involves the following steps: (1) establishing a database of knee OA patients with 3D knee kinematics measurements at baseline and at the completion of a 6-month exercise program, (2) identifying patients according to the improvement in their condition, (3) extracting biomechanical factors from their kinematic data, and (4) building a prediction model based on decision trees.
2.1. Participants and Exercise Program
The data used in this study were collected in a cluster randomized controlled trial (RCT) approved by the institutional ethics committees of the University of Montreal Hospital Research Center (Reference numbers: CE 10.001-BSP and BD 07.001-BSP), and of the École de technologie supérieure (Reference numbers: H20100301 and H20170901). All subjects provided informed consent before participation.
Of all the participants with knee osteoarthritis who took part in this RCT [
18], 221 patients completed a 6-month personalized home-based exercise program and were included in this study. The demographic characteristics (age, sex, and BMI) and one clinical feature, the radiographic OA severity grade measured by the Kellgren-Lawrence scale (KL; grade 2: mild; grade 3: moderate; grade 4: severe) [
19] were collected for all participants. KL grades were evenly distributed within the cohort (KL2: 61; KL3: 82; KL4: 78).
Each patient completed a knee kinesiography exam at baseline. For each one of them, a physical therapist then created a unique program of five to ten land-based exercises. It had to combine strengthening, stretching, and gait retraining exercises addressing the mechanical biomarkers previously identified with the knee kinesiography exam (e.g., varus thrust, dynamic flexion contracture...). Each exercise was recommended with a patient-specific number of repetitions (or duration) and had to be achievable at home without supervision. Patients were simply encouraged to “do them regularly” and were asked if they followed their exercise program after 3 months and at the 6-month follow-up. Further details about the program (therapist training, examples of exercises...) are published elsewhere [
18].
2.2. Identification of Patients According to the Improvement in Their Condition
The patients underwent a clinical assessment at baseline and after six months, using the Knee Injury and Osteoarthritis Outcome Score (KOOS) [
20]. This questionnaire assesses five domains: the patient’s knee pain (9 items), other symptoms (7 items), function in daily life (17 items), sport and recreation (5 items) and knee-related quality of life (4 items). Each one of them can be analyzed individually with a score which ranges from 0 (indicating the worst-case scenario) and 100 (indicating the absence of knee symptomatology).
Patient improvement was determined based on the KOOS questionnaire. Based on a literature review and a preliminary study [
21], the KOOS
pain subscale was identified as the most representative score and therefore its variation between baseline and 6 months was used to determine whether a patient’s condition improved (Class I) or not (Class nI). A growing consensus in the knee OA literature suggests that identifying a single threshold to define a meaningful change in the KOOS
pain score across varying OA severity and follow-up periods is problematic [
22,
23]. Furthermore, a recent meta-analysis [
24] supports that estimated thresholds increase along with patient baseline severity, and that relative changes may be a better approach than absolute differences. Based on the authors’ conclusions and the variability in our participants’ clinical characteristics (KL grades 2, 3, and 4), we considered that a patient’s condition was improved if the KOOS
pain score at 6 months exceeded the baseline score by 10% or more, as this value is both “intuitive and consistent with estimates for other instruments” [
24].
Hence, the participants were divided into two classes based on the evolution of their KOOSpain between baseline and 6-month follow-up: one class of patients whose condition improved (I) and one class of patients whose condition did not improve (nI).
In other words, for each patient, the variable
was computed as follows:
and, the assigned condition (class) was then:
Based on this assessment, the participants were categorized according to their improvement status.
Table 1,
Table 2 and
Table 3 summarize the demographic characteristics of the two classes (i.e., I and nI) for all participants, the male and female population respectively. There was no statistical difference in terms of age and BMI distributions between classes regardless of the population considered (
T-tests: all
p > 0.68). Statistical processing was implemented via SPSS 18.0 (Statistical Package for Social Sciences). A
p-value of 0.05 was set as the criterion for statistical significance.
2.3. Biomechanical Factors Extraction
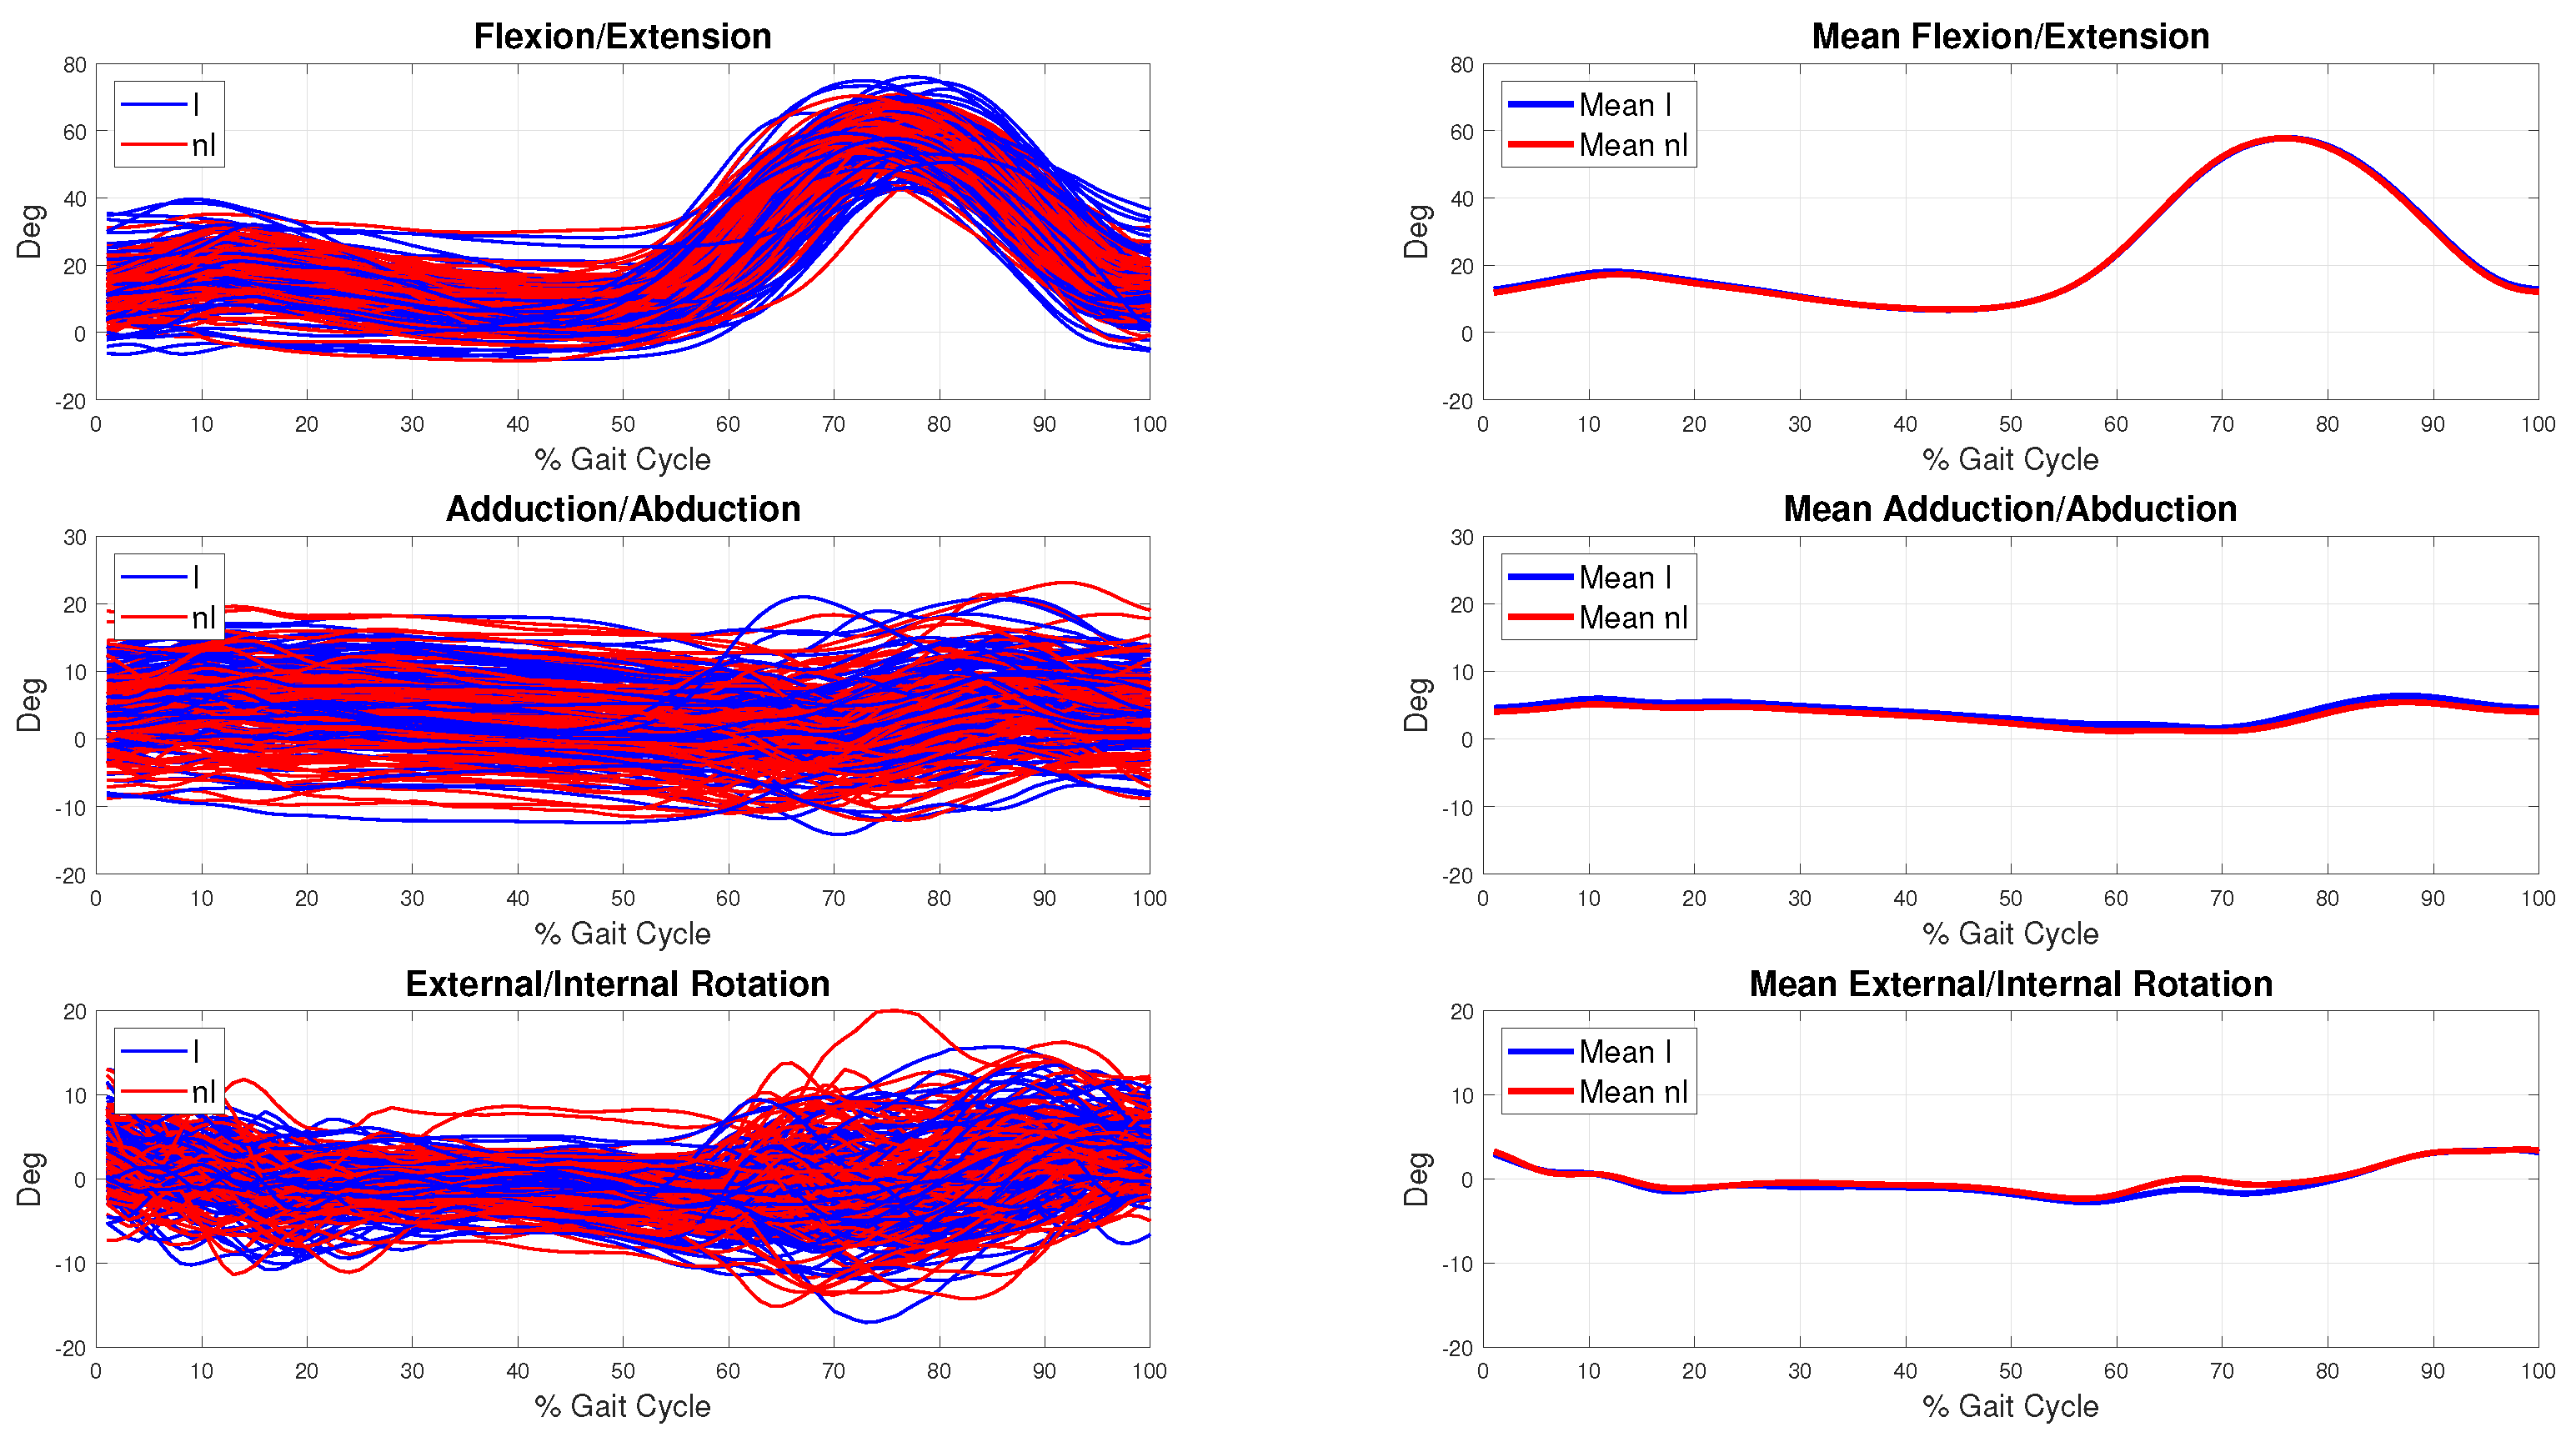
Kinematic data describe the joint angles between the tibia and the femur in the three-dimensional space. These are in the form of 3D curves corresponding to flexion-extension in the sagittal plane, adduction-abduction in the frontal plane and external-internal rotation in the transverse plane. These curves are mean patterns of multiple gait cycles collected per subject and normalized to a range from 1% to 100% of the gait cycle (GC). The beginning of the GC (1%) corresponds to the heel contact which is identified by the first minimum of the flexion/extension curve (
Figure 3).
A set of 69 biomechanical parameters of interest was then extracted from these 3D kinematic curves for data analysis. The parameters chosen for extraction were based on variables routinely assessed in biomechanical studies of knee OA populations, such as maximums, minimums, varus and valgus thrust, angles at initial contact, mean values and ranges of motion (ROM) throughout GCs or GC sub-phases (i.e., loading, stance, swing, etc.) [
25,
26].
2.4. Prediction Model
In order to predict patient improvement (I or nI), we developed a supervised classification system based on decision trees. The decision trees were built using the Classification And Regression Tree (CART) algorithm that can be used for classification or regression predictive modeling problems.
The algorithm to build a binary decision tree using CART operates node by node, running through the
M attributes (
) one by one, starting with
and continuing on to
. For each attribute, it explores all possible tests (splits) and chooses the best split, that is, the one that maximizes impurity (uncertainty) reduction. Then, it compares the best
M splits to select the best one. The function that measures impurity will necessarily reach its maximum when the instances are evenly distributed among the different classes and its minimum when one class contains all the examples (the node is then considered pure). In order to build the most discriminating nodes, questions are generated by the Gini index [
27].
This index measures the frequency with which a random element in the set would be misclassified if its label was randomly selected based on the label distribution in the sub-set. The index ranges from 0 to 1 and reaches its minimum value (zero) when all the elements from the set are in the same class as the target variable. The Gini diversity index used by the CART algorithm can be calculated with the following formula: on a node
t with a probability distribution for the classes in this node
, we have [
28]:
where
is the proportion of individuals belonging to class
j and
is the proportion function to measure the impurity
.
It should be noted that the decision trees were pruned by the post-pruning method to avoid over-learning. This approach proceeds as follows: after completing the decision tree building process, the tree is pruned. To this end, classification errors are estimated at each node. The subset is replaced by a leaf (class) or by the most frequent branch. We then start at the bottom of the tree and examine each of the sub-trees (non-folio) to see whether replacing the sub-tree by a leaf or its most frequent branch would result in a lower error rate. If so, we trim the sub-tree using the replacement [
28].
2.5. Evaluation of the Prediction Model
The evaluation of the classification system was carried out by two cross validation methods. The first is a K-fold cross validation where the database is divided into two sub-databases: a training database and a test database. This division allows the model to be developed and tested on different data to verify its relevance. In our study, we opted for and divisions to evaluate the model’s stability.
The second evaluation method is a the Leave-one-out cross validation (LOOCV) which is a K-fold cross validation taken to its logical extreme, with K equal to N, the number of data points in the set, that is to say the number of participants.
After model training, we considered the classification rate as an evaluation criterion. This rate is the ratio between the total number of well-classified data points and the total number of data points as described in Equation (
3). The classification rate is computed for each fold and the average used to evaluate the model.
The confusion matrix can also be presented for a better interpretation of the results. This is a matrix representation that determines the classification error from a set of test data. The confusion matrix is a square matrix of
size where
C is the number of classes. The columns of this matrix correspond to the number of occurrences of an estimated class, while the rows correspond to the number of occurrences of an actual class.
Table 4 shows an example of a confusion matrix with two classes. The precision of the classifier is calculated by Formula (4), and the sensitivity and specificity by Formulas (5) and (6), respectively [
29].
True Positive (TP) is the number of patients that improved and were classified in the class I. True Negative (TN) includes the patients that did not improved and were classified as nI patients. False Positive (FP) describes patients that not improved but were classified as I patients. False Negative (FN) is the number of patients that improved but were classified in the class nI.
To be considered accurate, a classifier must be both highly sensitive and highly specific. The accuracy, sensitivity and specificity were computed according to the following mathematical formulas:
Significant differences in 3D knee kinematics between men and women have been reported in the literature, both in healthy and knee OA subjects [
30,
31]. Therefore, three different prediction systems were trained: one each for the male and the female population and one for the overall data-set (male and female together) to account for the sex-specific aspects of kinematics. The receiver operating characteristic (ROC) curve was generated to illustrate the performance of the prediction models, using the area under the curve (AUC) [
32].
3. Results
Prediction models were developed using the CART algorithm. The training input vectors consisted of the 69 biomechanical parameters (F1, F2,...,F69), patients’ age (F70), BMI (F71), radiographic OA severity grade measured by the Kellgren-Lawrence scale (F72), and the KOOSpain (F73). The training input measurements were evaluated at baseline as required by the principle of a prediction model. Analyses were undertaken with Matlab R2019b software (Mathworks, MA, USA). Specifically, we used the Toolbox Statistics and Machine Learning Toolbox.
Table 5 summarizes the classification rates of the three models developed for each validation method. Given that the prediction performances were better when the two sexes were analyzed separately, the prediction model focused on the impact of the physical exercise program for each group independently.
Figure 4 displays the ROC curve and the AUC for both the male and female prediction models.
The confusion matrices using the LOOCV are presented in
Table 6 and
Table 7. For instance, the prediction model within the male population reached a sensitivity of 85.4% and a specificity of 70.3%.
For a more in-depth analysis, we identified the discriminant features retained within the 69 biomechanical factors for each prediction model (
Table 8).
Figure 5 shows the decision trees for each of the prediction models for both the male and female populations. Training and validation were performed independently for each population.
4. Discussion
Results showed that regardless of the validation technique used, the classification rates were higher when the male and the female population were considered separately. Indeed, using a 10-fold validation, the prediction performance reached 84.4% for men and 75.5% for women but it was limited to 71 % when the two sexes were grouped together. This confirms that prediction models should be sex-specific to achieve better results and supports previous studies highlighting the differences in kinematics between men and women [
30,
31].
The analysis of the confusion matrices and the ROC curves showed that the specificities and the sensitivities led to accurate prediction models (i.e., 70% or higher). In both cases sensitivity (85.4% and 76.5% respectively for men and women prediction models) was better than specificity (70.3% and 70.7% respectively for men and women prediction models). Therefore, the models were better at predicting a not-Improved (nI) condition than an Improved (I) condition. Unlike many classification methods, decision trees are intuitive and provide a graphic, meaningful and easy-to-read representation compared to other well-known prediction and classification methods such as neural networks and support vector machine. The prediction model was enhanced by implementing a user-friendly graphical interface allowing clinicians to query patient characteristics and improve their understanding of the classification system’s decision.
The three discriminant features retained for the male prediction model were entirely different from the three chosen for the female model, confirming that sex-specific analyses were appropriate. Interestingly, among the 69 features that were measured on 3D kinematic curves at baseline, the features retained for both decision trees were closely linked to OA progression [
33]. Varus thrust is a sudden lateral shift of the knee when the weight on the limb increases during the loading phase at the beginning of the gait cycle (frontal plane). It is well known that this mechanism is associated with pain and increase risk of OA progression [
34,
35]. Its significant role was also highlighted in another study assessing the impact of knee kinematics on the response to exercises [
17]. As shown in this study, patients with a higher varus thrust at baseline were more likely to respond to a physical exercise program. Furthermore, a lower KOOS
pain at baseline (<62.5) appeared to be predictive of an improvement for male patients. This was also observed by Kobsar et al. [
16] who used a predictive model based on principal component analysis, as well as being reported in the hip OA literature [
36]. Notably, the discriminant features retained in the male prediction model were related to frontal and sagittal plane kinematics, whereas features in the female prediction model were all related to tibial rotation.
These results reached a state-of-the-art accuracy and compared favorably with others that have considered the prediction of the impact of physical exercise. Indeed, the purpose of Reference [
16] was to use pre-intervention gait kinematics and patient-reported outcome measures to predict post-intervention response to a 6-week hip strengthening exercise intervention in patients with mild-to-moderate knee OA. Using a discriminant analysis on a small dataset (39 patients), the classification accuracy was 85.4%.
Being male is associated with higher odds of presenting with a varus thrust [
37], which could help explain the important role of this feature played in the male prediction model. This study suggests that exercises efficiently reduce pain in patients with varus thrust, supporting their relevance as a conservative treatment especially in the presence of this mechanical biomarker. Tibial rotation, which corresponds to external/internal rotation of the shank with respect to the thigh (transverse plane), was the most discriminant movement for the female model. To our knowledge, there has only been one other report of this feature but it was as a possible factor to discriminate surgical from non-surgical knee OA female patients [
38]. Future studies exploring the biomechanical significance of movements in the transverse plane could help improve our understanding of their clinical relevance in the response to exercise programs.
Although the radiographic severity grade measured by the Kellgren-Lawrence scale (F72) was incorporated as an input variable during the models’ training phase, it was not identified as a discriminant variable. In the same way, for both decision trees, the age and BMI were not identified as discriminant variables, suggesting that these patient characteristics cannot be used to predict the knee OA patient response to a physical exercise program. Furthermore, the statistical analysis showed that there was no statistical difference on age and BMI between I and nI participants within the whole dataset.
This study has some limitations. First, results were based on a 10% improvement threshold on the KOOS to determine whether patients improved or not, which can be subject to debate. However, this choice was based on data from the literature and the use of this threshold showed that decision trees could help predict the patient response to an exercise program. Additional analyses with different thresholds could be performed to study their impact on prediction models. Similarly, the prediction models were only based on the KOOS
pain subscale, while other subscales could have been of interest to better understand the predictors of the response to a physical exercise program on other knee OA aspects. Although the KneeKG™ system used to capture the 3D knee kinematics is a validated and reliable tool, its accuracy in the transverse plane is
[
6], which may have influenced the actual classification rate of the female prediction model. This limitation could affect overall decision tree methodology as the classification at each node is based on a single value and does not account for variations. Further analyses are needed to determine the impact of this variation in future algorithms. Finally, there was a notable difference between the total number of men and women included in this study (78 vs. 143), which may have impacted the performance of both prediction models.

 ,
, 


