Single-Leg Landings Following a Volleyball Spike May Increase the Risk of Anterior Cruciate Ligament Injury More Than Landing on Both-Legs


Abstract
:1. Introduction
2. Materials and Methods
2.1. Participants
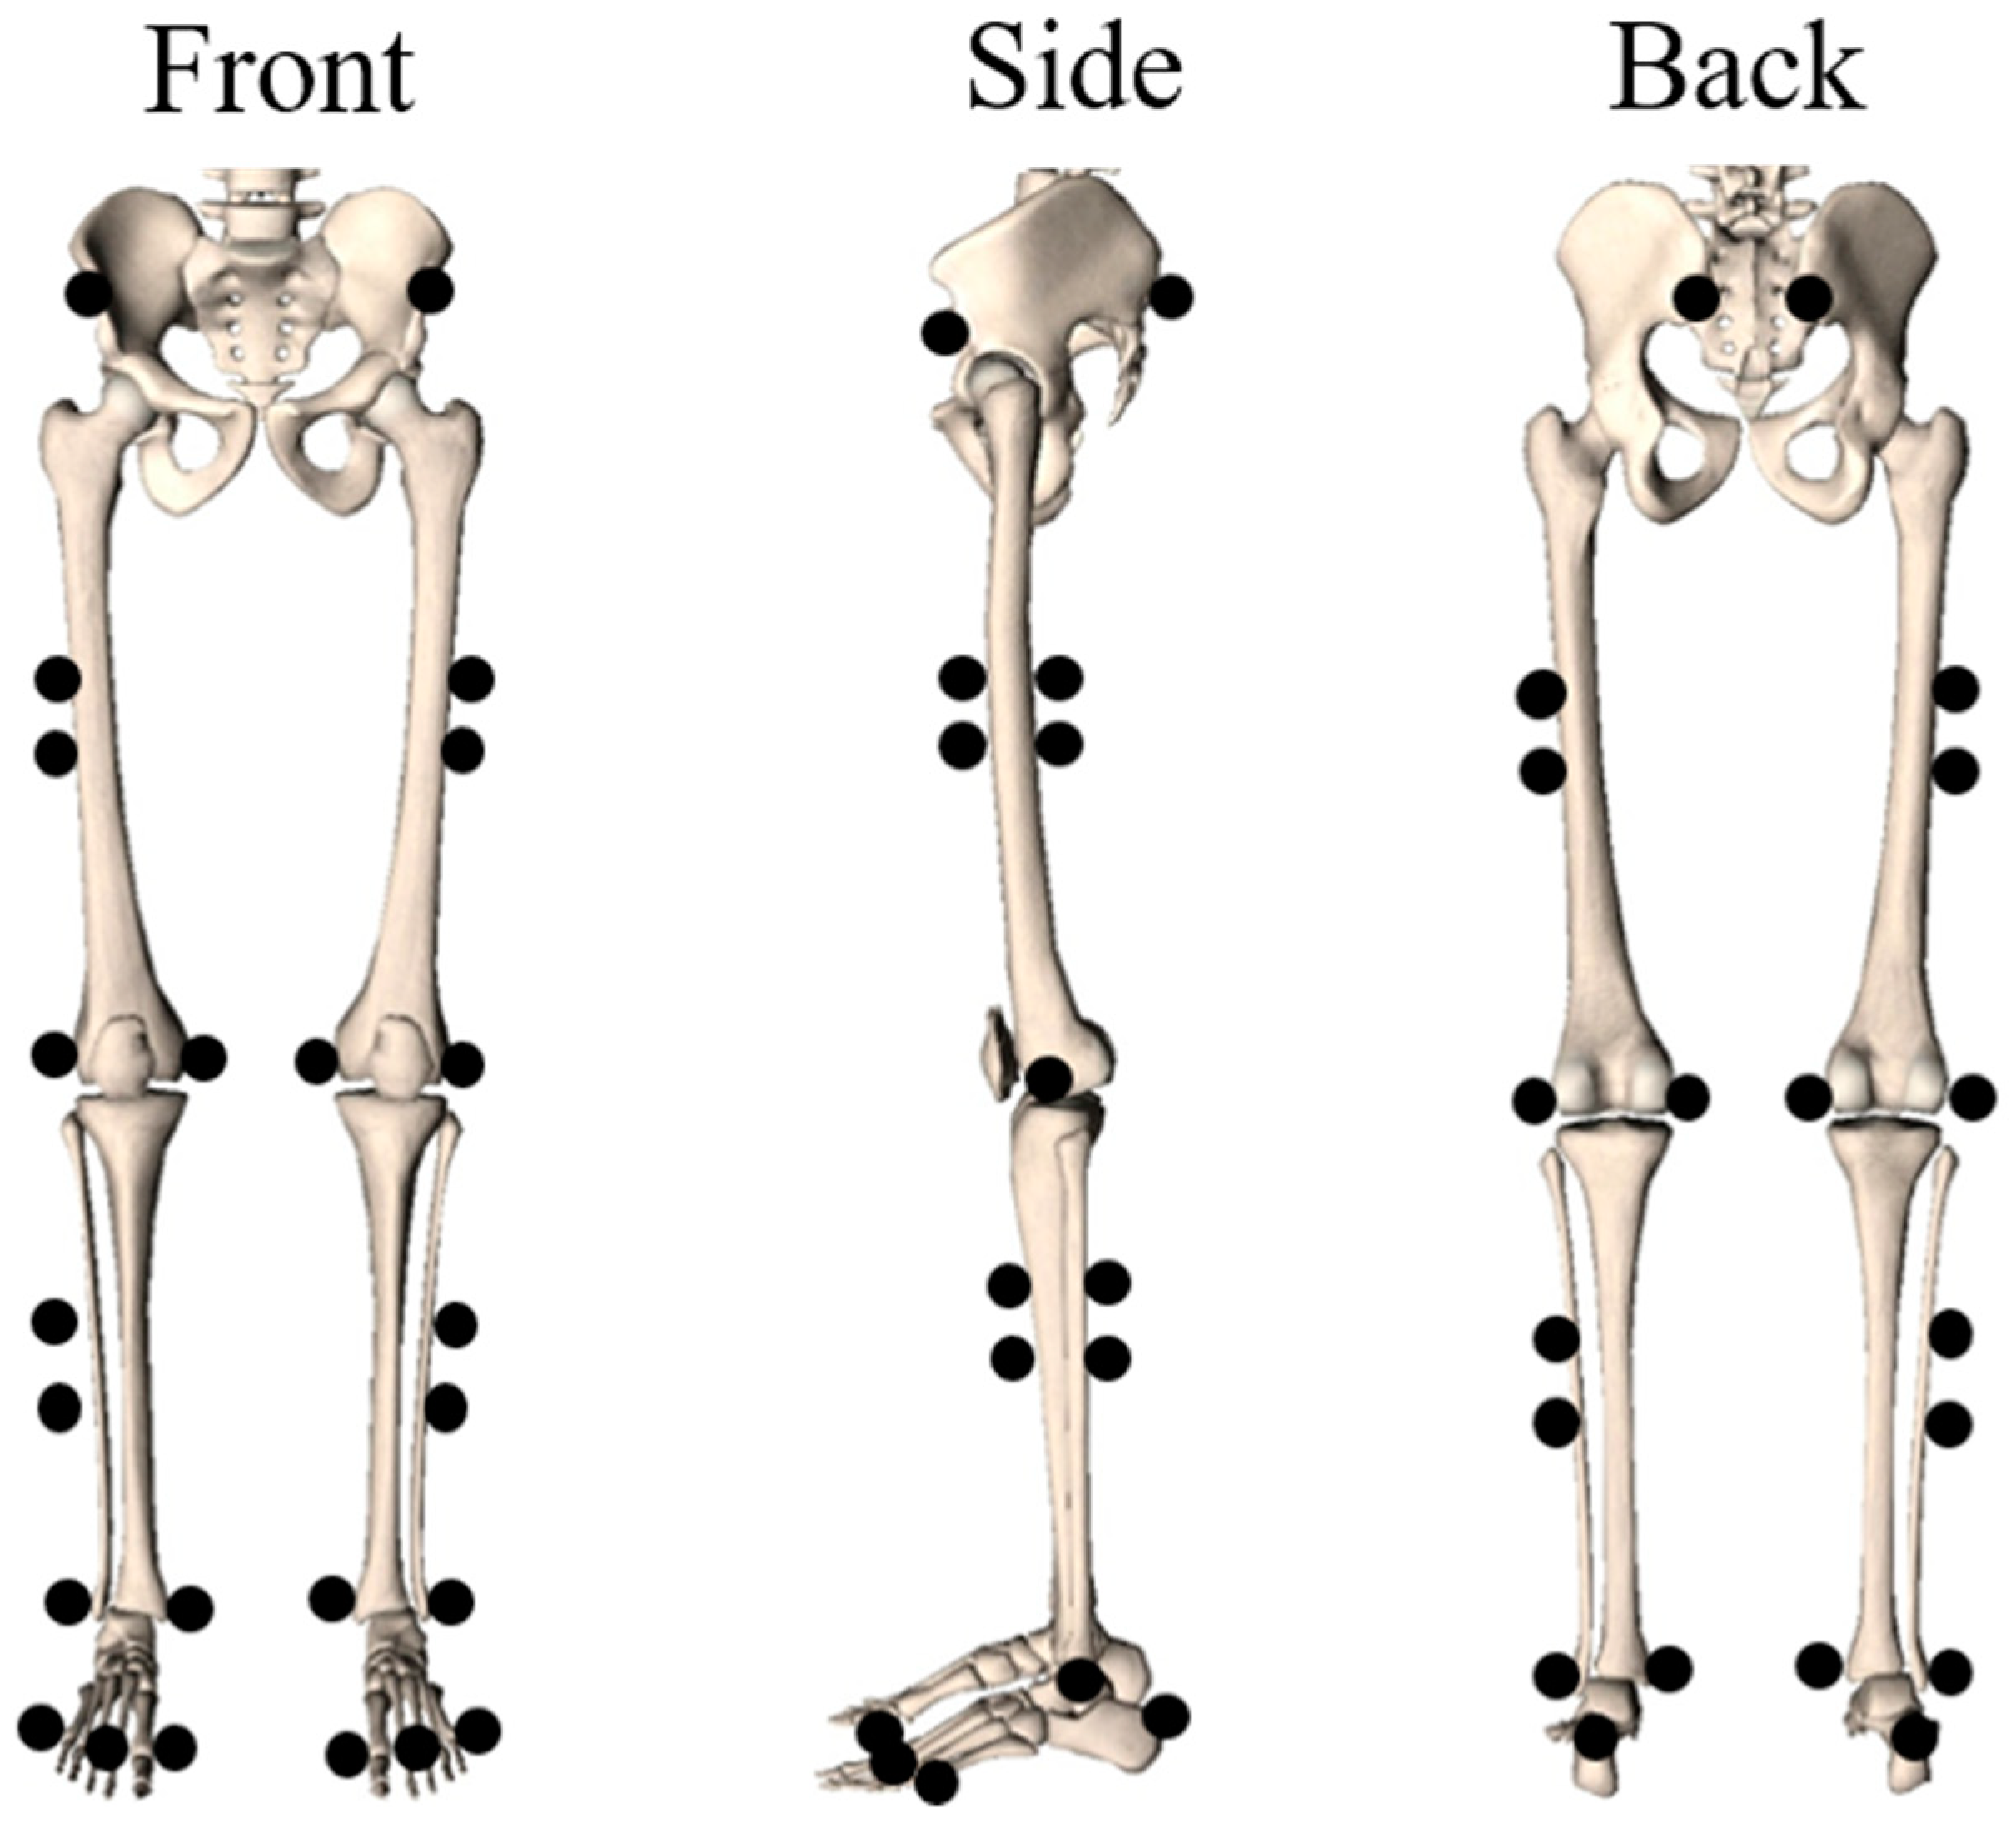
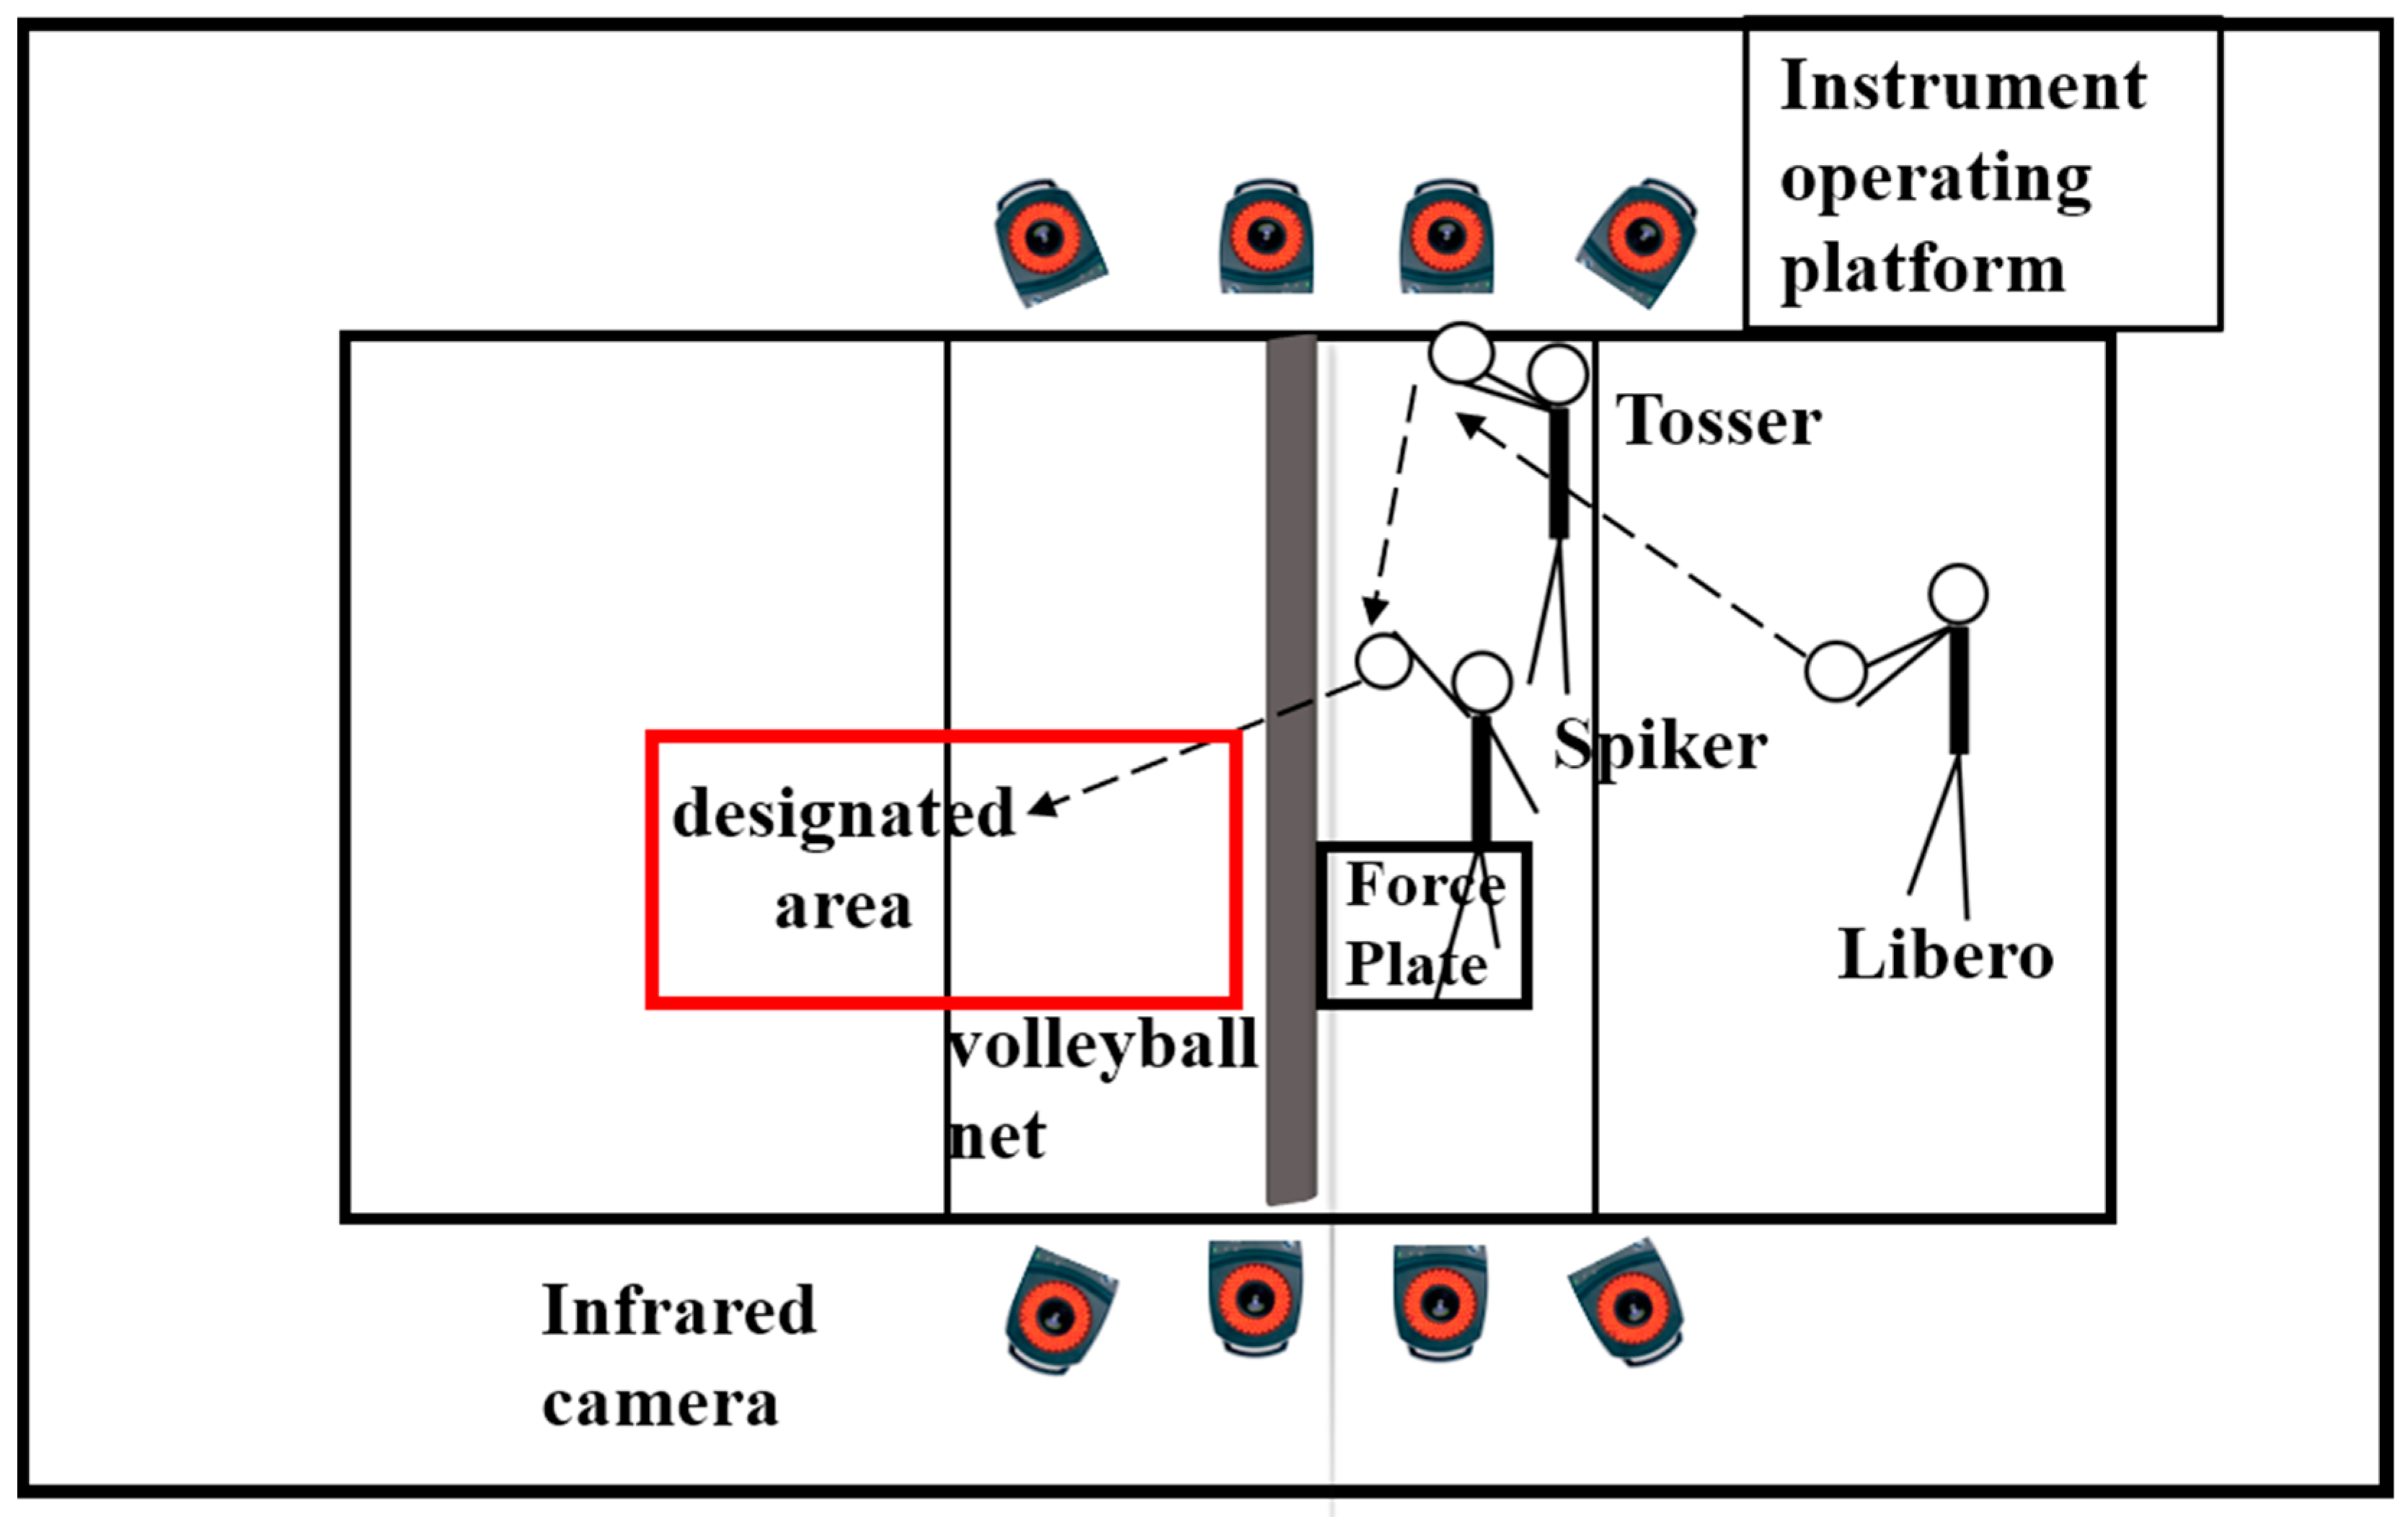
2.2. Instrumentation
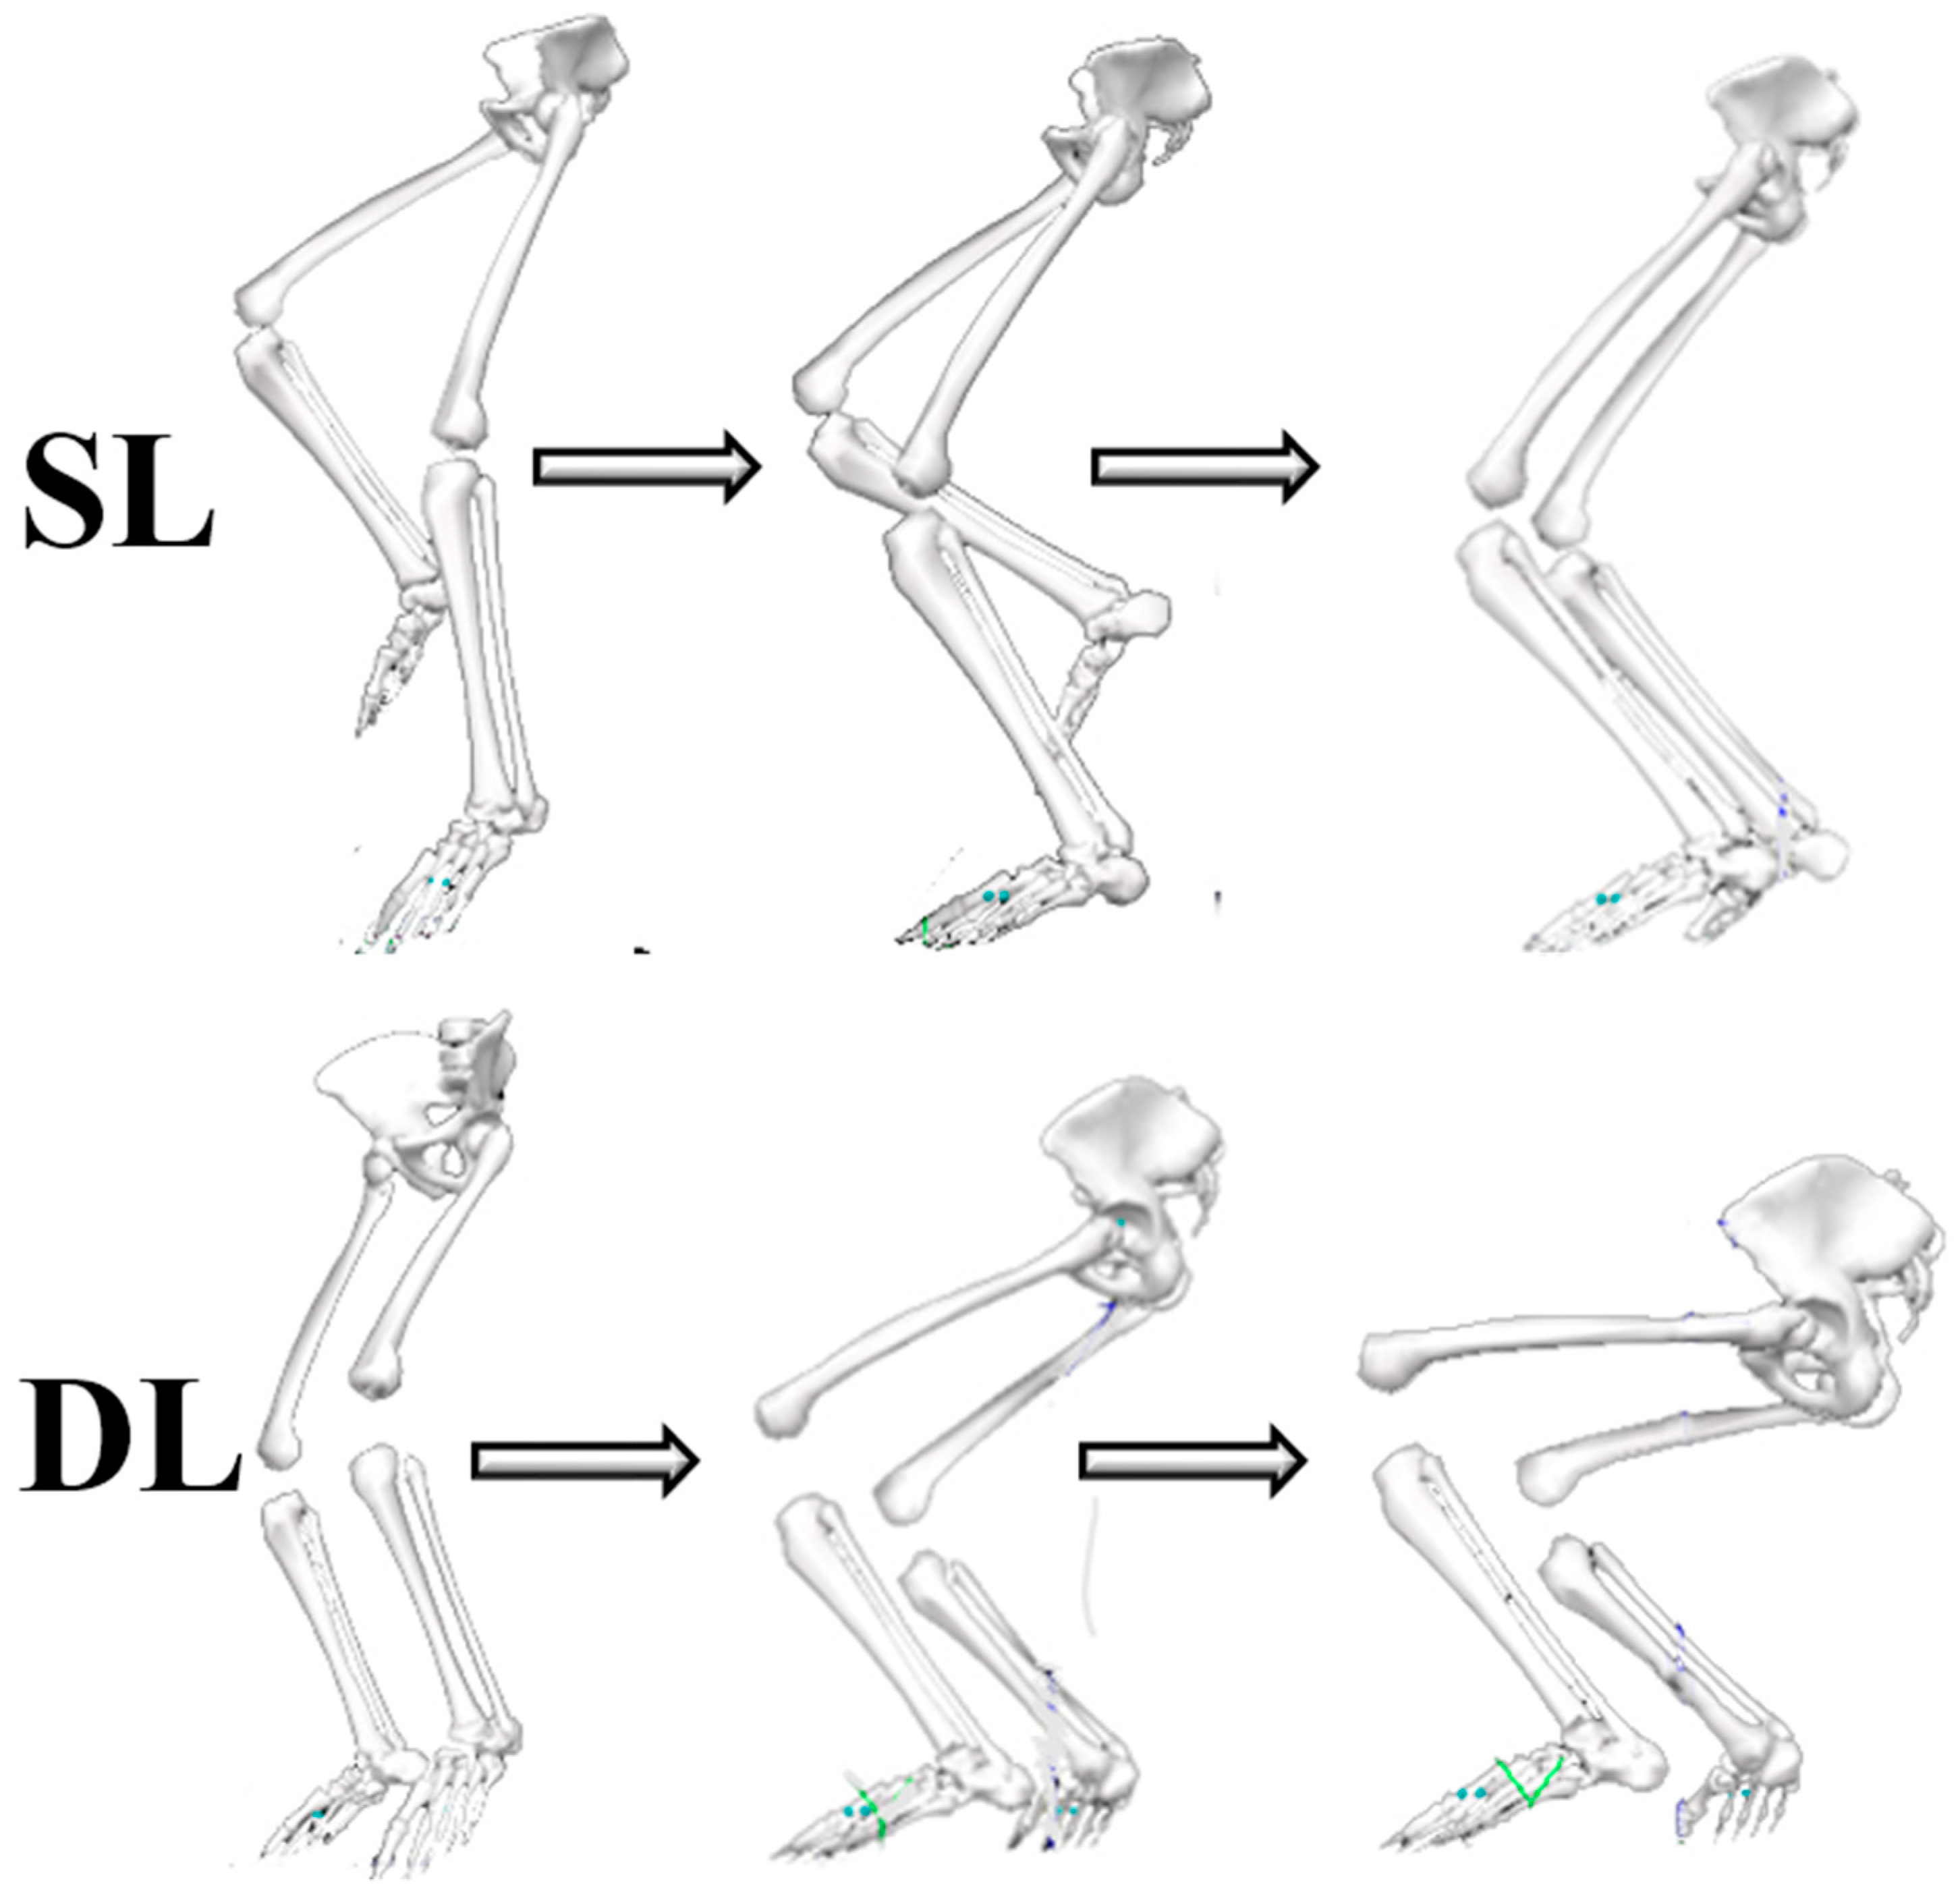
2.3. Experimental Procedure
2.4. Data Collection and Processing
2.5. Statistical Analysis
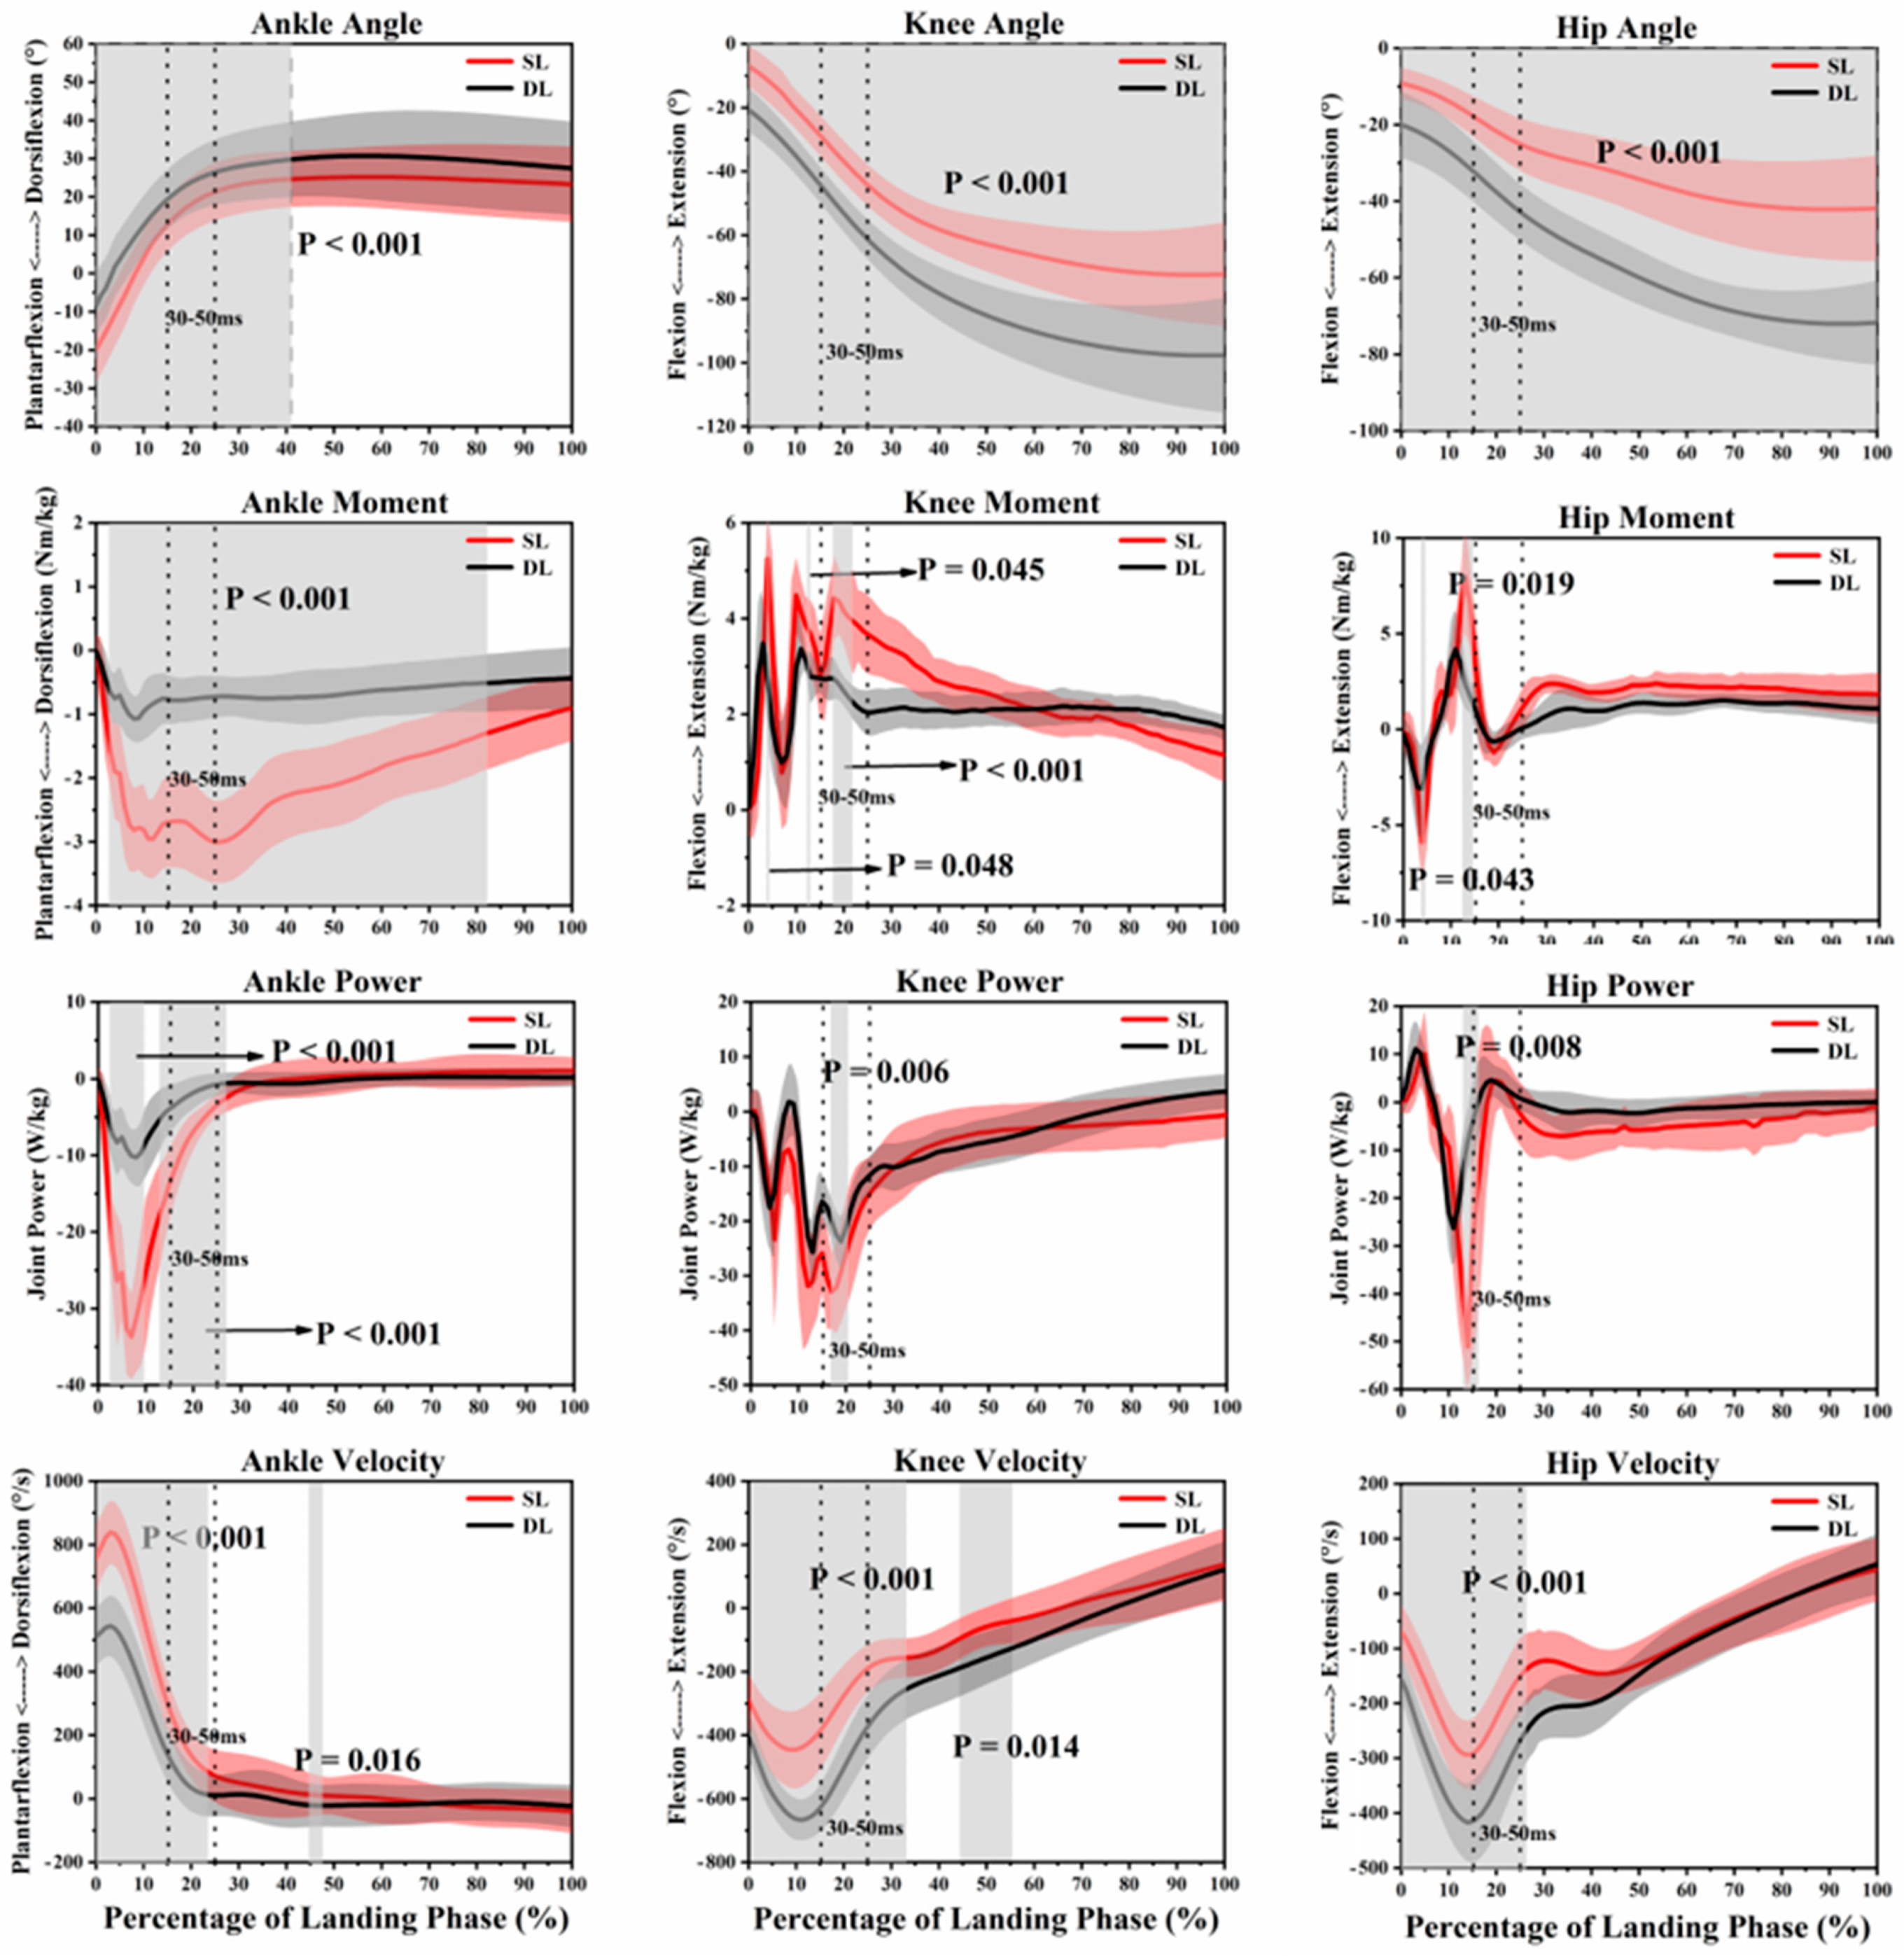
3. Results
4. Discussion
5. Conclusions
Author Contributions
Funding
Data Availability Statement
Conflicts of Interest
Appendix A

| Section/Topic | Item Number | Recommendation |
|---|---|---|
| Title and abstract | 1 | Provide in the abstract an informative and balanced summary of “The Risk of Anterior Cruciate Ligament Injury (ACL) Following Different Volleyball Spike Landing Ways” |
| Introduction | ||
| Background/rationale | 2 | Explain the scientific background and rationale about ACL injury following different volleyball spike landing ways for the investigation being reported |
| Objectives | 3 | State specific objectives, including any prespecified hypotheses |
| Methods | ||
| Participants | 4 | Report numbers of individuals of study (e.g., numbers potentially eligible, examined for eligibility, confirmed eligible, included in the study) |
| Instrumentation | 5 | Describe the hardware and software equipment used to complete the study (e.g., Vicon motion capture system, AMTI force plate, MATLAB R2019a) |
| Study design | 6 | Present key elements of this experimental procedure |
| Data collection and processing | 7 | Describe the data collection and processing process of this study |
| Statistical analysis methods | 8 | Describe all statistical analysis method |
| Results | ||
| Main results | 9 | Present main results of this study |
| Visual data | 10 | Present figures and tables of key data |
| Discussion | ||
| Key results | 11 | Summarize key results with reference to study objectives |
| Limitations | 12 | Discuss limitations of the study, taking into account sources of potential bias (e.g., lack of female subjects, small sample size) |
| Conclusion | 13 | Provide a general interpretation of results and discuss a landing strategy to avoid ACL injury |
| Other information | ||
| Author contributions | 14 | Describe author contributions of this study |
| Funding | 15 | Present the funding of this study |
References
- Briner, W.; Benjamin, H.J. Managing acute and overuse disorders. Phys. Sportsmed. 1999, 27, 48. [Google Scholar] [CrossRef] [PubMed]
- Bere, T.; Kruczynski, J.; Veintimilla, N.; Hamu, Y.; Bahr, R. Injury risk is low among world-class volleyball players: 4-year data from the FIVB Injury Surveillance System. Br. J. Sports Med. 2015, 49, 1132–1137. [Google Scholar] [CrossRef] [PubMed] [Green Version]
- Kabacinski, J.; Murawa, M.; Dworak, L.B.; Maczynski, J. Differences in ground reaction forces during landing between volleyball spikes. Trends Sport Sci. 2017, 24, 87–92. [Google Scholar]
- Salci, Y.; Kentel, B.B.; Heycan, C.; Akin, S.; Korkusuz, F. Comparison of landing maneuvers between male and female college volleyball players. Clin. Biomech. 2004, 19, 622–628. [Google Scholar] [CrossRef] [PubMed]
- Ferretti, A.; Papandrea, P.; Conteduca, F.; Mariani, P.P. Knee ligament injuries in volleyball players. Am. J. Sports Med. 1992, 20, 203–207. [Google Scholar] [CrossRef]
- Griffin, L.Y.; Agel, J.; Albohm, M.J.; Arendt, E.A.; Dick, R.W.; Garrett, W.E.; Garrick, J.G.; Hewett, T.E.; Huston, L.; Ireland, M.L. Noncontact anterior cruciate ligament injuries: Risk factors and prevention strategies. J. Am. Acad. Orthop. Surg. 2000, 8, 141–150. [Google Scholar] [CrossRef] [PubMed] [Green Version]
- Caraffa, A.; Cerulli, G.; Projetti, M.; Aisa, G.; Rizzo, A. Prevention of anterior cruciate ligament injuries in soccer. Knee Surg. Sports Traumatol. Arthrosc. 1996, 4, 19–21. [Google Scholar] [CrossRef]
- McNair, P.; Marshall, R.; Matheson, J. Important features associated with acute anterior cruciate ligament injury. N. Z. Med. 1990, 103, 537–539. [Google Scholar] [CrossRef]
- Bakker, R.; Tomescu, S.; Brenneman, E.; Hangalur, G.; Laing, A.; Chandrashekar, N. Effect of sagittal plane mechanics on ACL strain during jump landing. J. Orthop. Res. 2016, 34, 1636–1644. [Google Scholar] [CrossRef]
- Ali, N.; Robertson, D.G.; Rouhi, G. Sagittal plane body kinematics and kinetics during single-leg landing from increasing vertical heights and horizontal distances: Implications for risk of non-contact ACL injury. Knee 2014, 21, 38–46. [Google Scholar] [CrossRef]
- Xu, D.; Cen, X.; Wang, M.; Rong, M.; István, B.; Baker, J.S.; Gu, Y. Temporal Kinematic Differences between Forward and Backward Jump-Landing. Int. J. Environ. Res. Public Health 2020, 17, 6669. [Google Scholar] [CrossRef] [PubMed]
- Devita, P.; Skelly, W.A. Effect of landing stiffness on joint kinetics and energetics in the lower extremity. Med. Sci. Sports Exerc. 1992, 24, 108–115. [Google Scholar] [CrossRef] [Green Version]
- Yu, B.; Lin, C.F.; Garrett, W.E. Lower extremity biomechanics during the landing of a stop-jump task. Clin. Biomech. 2006, 21, 297–305. [Google Scholar] [CrossRef] [PubMed]
- Zhang, S.N.; Bates, B.T.; Dufek, J.S. Contributions of lower extremity joints to energy dissipation during landings. Med. Sports Exerc. 2000, 32, 812–819. [Google Scholar] [CrossRef] [PubMed]
- Aizawa, J.; Ohji, S.; Koga, H.; Masuda, T.; Yagishita, K. Correlations between sagittal plane kinematics and landing impact force during single-leg lateral jump-landings. J. Phys. Ther. Sci. 2016, 28, 2316–2321. [Google Scholar] [CrossRef] [Green Version]
- Zhou, H.; Ugbolue, U.C. Is There a Relationship Between Strike Pattern and Injury During Running: A Review. Phys. Act. Health 2019, 3, 127–134. [Google Scholar] [CrossRef] [Green Version]
- Yeow, C.H.; Lee, P.V.; Goh, J.C. An investigation of lower extremity energy dissipation strategies during single-leg and double-leg landing based on sagittal and frontal plane biomechanics. Hum. Mov. Sci. 2011, 30, 624–635. [Google Scholar] [CrossRef]
- Jaarsma, E.; Smith, B. The Development and Evaluation of a Participant Led Physical Activity Intervention for People with Disabilities Who Intend to Become More Active. Phys. Act. Health 2019, 3, 89–107. [Google Scholar] [CrossRef]
- Taylor, J.B.; Ford, K.R.; Nguyen, A.-D.; Shultz, S.J. Biomechanical comparison of single-and double-leg jump landings in the sagittal and frontal plane. Orth. J. Sport Med. 2016, 4, 2325967116655158. [Google Scholar] [CrossRef] [Green Version]
- Tillman, M.D.; Hass, C.J.; Brunt, D.; Bennett, G.R. Jumping and landing techniques in elite women’s volleyball. J. Sports Sci. Med. 2004, 3, 30–36. [Google Scholar]
- Krosshaug, T.; Slauterbeck, J.R.; Engebretsen, L.; Bahr, R. Biomechanical analysis of anterior cruciate ligament injury mechanisms: Three-dimensional motion reconstruction from video sequences. Scand. J. Med. Sci. Sports 2007, 17, 508–519. [Google Scholar] [CrossRef] [PubMed]
- Markolf, K.L.; O’Neill, G.; Jackson, S.R.; McAllister, D.R. Effects of applied quadriceps and hamstrings muscle loads on forces in the anterior and posterior cruciate ligaments. Am. J. Sports Med. 2004, 32, 1144–1149. [Google Scholar] [CrossRef] [PubMed]
- Hewett, T.E.; Myer, G.D.; Ford, K.R.; Heidt, R.S., Jr.; Colosimo, A.J.; McLean, S.G.; Bogert, A.J.; Paterno, M.V.; Succop, P. Biomechanical measures of neuromuscular control and valgus loading of the knee predict anterior cruciate ligament injury risk in female athletes: A prospective study. Am. J. Sports Med. 2005, 33, 492–501. [Google Scholar] [CrossRef] [PubMed] [Green Version]
- Zwerver, J.; Gouttebarge, V.; Verhagen, E.; Maas, M.; Kilic, O. Incidence, aetiology and prevention of musculoskeletal injuries in volleyball: A systematic review of the literature. Eur. J. Sport Sci. 2017, 17, 1–29. [Google Scholar] [CrossRef] [Green Version]
- Wang, L.; Peng, H. Biomechanical comparisons of single-and double-legged drop jumps with changes in drop height. Int. J. Sports Med. 2014, 35, 522–527. [Google Scholar] [CrossRef]
- Donohue, M.R.; Ellis, S.M.; Heinbaugh, E.M.; Stephenson, M.L.; Zhu, Q.; Dai, B. Differences and correlations in knee and hip mechanics during single-leg landing, single-leg squat, double-leg landing, and double-leg squat tasks. Res. Sports Med. 2015, 23, 394–411. [Google Scholar] [CrossRef]
- Gu, Y.; Ren, X.; Li, J.; Lake, M.; Zhang, Q.; Zeng, Y. Computer simulation of stress distribution in the metatarsals at different inversion landing angles using the finite element method. Int. Orthop. 2010, 34, 669–676. [Google Scholar] [CrossRef] [Green Version]
- Lim, B.; An, K.O.; Cho, E.; Lim, S.T.; Cho, J. Differences in anterior cruciate ligament injury risk factors between female dancers and female soccer players during single-and double-leg landing. Sci. Sports 2020. [Google Scholar] [CrossRef]
- Wang, L.I. The lower extremity biomechanics of single-and double-leg stop-jump tasks. J. Sports Sci. Med. 2011, 10, 151–156. [Google Scholar] [PubMed]
- Jiang, C. The Effect of Basketball Shoe Collar on Ankle Stability: A Systematic Review and Meta-Analysis. Phys. Act. Health 2020, 4, 11–18. [Google Scholar] [CrossRef] [Green Version]
- Hébert-Losier, K.; Pini, A.; Vantini, S.; Strandberg, J.; Abramowicz, K.; Schelin, L.; Häger, C.K. One-leg hop kinematics 20 years following anterior cruciate ligament rupture: Data revisited using functional data analysis. Clin. Biomech. 2015, 30, 1153–1161. [Google Scholar] [CrossRef] [PubMed]
- Smeets, A.; Malfait, B.; Dingenen, B.; Robinson, M.A.; Vanrenterghem, J.; Peers, K.; Nijs, S.; Vereecken, S.; Staes, F.; Verschueren, S. Is knee neuromuscular activity related to anterior cruciate ligament injury risk? A pilot study. Knee 2019, 26, 40–51. [Google Scholar] [CrossRef] [PubMed] [Green Version]
- Pataky, T.C.; Robinson, M.A.; Vanrenterghem, J. Vector field statistical analysis of kinematic and force trajectories. J. Biomech. 2013, 46, 2394–2401. [Google Scholar] [CrossRef] [Green Version]
- Pataky, T.C. Generalized n-dimensional biomechanical field analysis using statistical parametric mapping. J. Biomech. 2010, 43, 1976–1982. [Google Scholar] [CrossRef]
- Cappozzo, A.; Cappello, A.; Croce, U.D.; Pensalfini, F. Surface-marker cluster design criteria for 3-D bone movement reconstruction. Bio-Med. Mater. Eng. 1997, 44, 1165–1174. [Google Scholar] [CrossRef]
- Bosco, C.; Luhtanen, P.; Komi, P.V. A Simple Method for Measurement of Mechanical Power in Jumping. Eur. J. Appl. Physiol. 1983, 50, 273–282. [Google Scholar] [CrossRef] [PubMed]
- McNitt-Gray, J.; Hester, D.; Mathiyakom, W.; Munkasy, B. Mechanical demand and multijoint control during landing depend on orientation of the body segments relative to the reaction force. J. Biomech. 2001, 34, 1471–1482. [Google Scholar] [CrossRef]
- Winter, D.A. Biomechanics and Motor Control of Human Movement, 2nd ed.; John Wiley & Sons, Inc.: New York, NY, USA, 1990; pp. 154–219. [Google Scholar] [CrossRef]
- Cohen, J. Statistical Power Analysis for the Behavioral Sciences, 2nd ed.; Lawrence Erlbaum Associates: Hillsdale, NJ, USA, 1990; pp. 19–32. [Google Scholar]
- Boden, B.P.; Dean, G.S.; Feagin, J.A.; Garrett, W.E. Mechanisms of anterior cruciate ligament injury. Orthopedics 2000, 23, 573–578. [Google Scholar] [CrossRef]
- Lephart, S.M.; Ferris, C.M.; Riemann, B.L.; Myers, J.B.; Fu, F.H. Gender differences in strength and lower extremity kinematics during landing. Clin. Orthop. Relat. Res. 2002, 401, 162–169. [Google Scholar] [CrossRef]
- Olsen, O.E.; Myklebust, G.; Engebretsen, L.; Bahr, R. Injury mechanisms for anterior cruciate ligament injuries in team handball: A systematic video analysis. Am. J. Sports Med. 2004, 32, 1002–1012. [Google Scholar] [CrossRef]
- Yeow, C.H.; Cheong, C.H.; Ng, K.S.; Lee, P.V.S.; Goh, J.C. Anterior cruciate ligament failure and cartilage damage during knee joint compression: A preliminary study based on the porcine model. Am. J. Sports Med. 2008, 36, 934–942. [Google Scholar] [CrossRef] [PubMed]
- Draganich, L.F.; Vahey, J.W. An in vitro study of anterior cruciate ligament strain induced by quadriceps and hamstrings forces. J. Biomech. 1990, 8, 57–63. [Google Scholar] [CrossRef]
- Nunley, R.M.; Wright, D.; Renner, J.B.; Yu, B.; Garrett, W.E., Jr. Gender comparision of patella tendon tibial shaft angle with weight bearing. Res. Sports Med. 2003, 11, 173–185. [Google Scholar] [CrossRef]
- Boden, B.P.; Torg, J.S.; Knowles, S.B.; Hewett, T.E. Video analysis of anterior cruciate ligament injury: Abnormalities in hip and ankle kinematics. Am. J. Sports Med. 2009, 37, 252–259. [Google Scholar] [CrossRef] [PubMed]
- Cerulli, G.; Benoit, D.L.; Lamontagne, M.; Caraffa, A.; Liti, A. In vivo anterior cruciate ligament strain behaviour during a rapid deceleration movement: Case report. Knee. Surg. Sports Traumatol. Arthrosc. 2003, 11, 307–311. [Google Scholar] [CrossRef] [PubMed]
- Shu, Y.; Sun, D.; Hu, Q.L.; Zhang, Y.; Li, J.S.; Gu, Y.D. Lower Limb Kinetics and Kinematics during Two Different Jumping Methods. J. Biomim. Biomater. Biomed. Eng. 2015, 22, 29–35. [Google Scholar] [CrossRef]
- Bates, N.A.; Ford, K.R.; Myer, G.D.; Hewett, T.E. Impact differences in ground reaction force and center of mass between the first and second landing phases of a drop vertical jump and their implications for injury risk assessment. J. Biomech. 2013, 46, 1237–1241. [Google Scholar] [CrossRef] [Green Version]
- Shimokochi, Y.; Ambegaonkar, J.P. Changing sagittal plane body position during single-leg landings influences the risk of non-contact anterior cruciate ligament injury. Knee. Surg. Sports Traumatol. Arthrosc. 2013, 21, 888–897. [Google Scholar] [CrossRef] [Green Version]
- Zhang, B.; Lu, Q. A Current Review of Foot Disorder and Plantar Pressure Alternation in the Elderly. Phys. Act. Health 2020, 4, 95–106. [Google Scholar] [CrossRef]
- Yu, P.; Gong, Z.; Meng, Y.; Baker, J.S.; István, B.; Gu, Y. The Acute Influence of Running-Induced Fatigue on the Performance and Biomechanics of a Countermovement Jump. Appl. Sci. 2020, 10, 4319. [Google Scholar] [CrossRef]
- Decker, M.J.; Torry, M.R.; Wyland, D.J.; Sterett, W.I.; Steadman, J.R. Gender differences in lower extremity kinematics, kinetics and energy absorption during landing. Clin. Biomech. 2003, 18, 662–669. [Google Scholar] [CrossRef]
- Norcross, M.F.; Blackburn, J.T.; Goerger, B.M.; Padua, D.A. The association between lower extremity energy absorption and biomechanical factors related to anterior cruciate ligament injury. Clin. Biomech. 2010, 25, 1031–1036. [Google Scholar] [CrossRef] [PubMed]


| SL | DL | p | ||
|---|---|---|---|---|
| Ankle | Peak Ankle Plantarflexion Angle (°) | −19.88 ± 8.80 * (initial contact) | −8.58 ± 8.28 * (initial contact) | 0.001 |
| Peak Ankle Dorsiflexion Angle (°) | 25.93 ± 7.94 (193.6 ± 29.8 ms) | 34.31 ± 14.49 (197.1 ± 33.4 ms) | 0.058 | |
| Ankle ROM (°) | 45.81 ± 6.38 * | 42.89 ± 7.98 * | 0.023 | |
| Peak Ankle Moment (Nm/kg) | −3.26 ± 0.55 * (24.2 ± 3.2 ms) | −1.12 ± 0.37 * (18.5 ± 2.3 ms) | 0.001 | |
| Peak Ankle Power (W/kg) | −37.97 ± 5.44 * (16.7 ± 2.8 ms) | −11.20 ± 4.15 * (18.7 ± 3.3 ms) | 0.001 | |
| Peak Ankle Angular Velocity (°/s) | 844.91 ± 95.22 * (8.6 ± 1.7 ms) | 559.49 ± 96.93 * (8.4 ± 1.3 ms) | 0.001 | |
| Knee | Peak Knee Flexion Angle (°) | −74.26 ± 15.18 * (193.6 ± 29.8 ms) | −99.83 ± 17.58 * (197.1 ± 33.4 ms) | 0.001 |
| Peak Knee Extension Angle (°) | −6.96 ± 6.39 * (initial contact) | −20.73 ± 6.84 * (initial contact) | 0.003 | |
| Knee ROM (°) | 67.30 ± 10.99 | 79.10 ± 17.33 | 0.056 | |
| Peak Knee Moment (Nm/kg) | 5.52 ± 1.79 * (9.7 ± 3.5 ms) | 3.88 ± 1.50 * (8.5 ± 1.9 ms) | 0.005 | |
| Peak Knee Power (W/kg) | −42.77 ± 5.77 * (26.3 ± 4.1 ms) | −29.44 ± 5.57 (27.8 ± 4.4 ms) | 0.002 | |
| Peak Knee Angular Velocity (°/s) | −464.22 ± 80.49 * (20.6 ± 3.6 ms) | −671.56 ± 77.83 * (24.3 ± 2.8 ms) | 0.001 | |
| Hip | Peak Hip Flexion Angle (°) | −43.01 ± 12.82 * (193.6 ± 29.8 ms) | −74.31 ± 10.87 * (197.1 ± 33.4 ms) | 0.001 |
| Peak Hip Extension Angle (°) | −9.21 ± 4.09 (initial contact) | −20.04 ± 8.61 (initial contact) | 0.021 | |
| Hip ROM (°) | 33.80 ± 9.52 * | 54.27 ± 13.04 * | 0.001 | |
| Peak Hip Moment (Nm/kg) | 7.98 ± 2.93 * (28.2 ± 5.7 ms) | 4.35 ± 1.99 * (24.3 ± 4.5 ms) | 0.007 | |
| Peak Hip Power (W/kg) | −57.90 ± 10.48 * (30.1 ± 6.2 ms) | −30.49 ± 6.91 * (24.7 ± 4.8 ms) | 0.001 | |
| Peak Hip Angular Velocity (°/s) | −302.56 ± 68.56 * (30.2 ± 3.7 ms) | −426.14 ± 75.13 * (29.7 ± 4.3 ms) | 0.001 | |
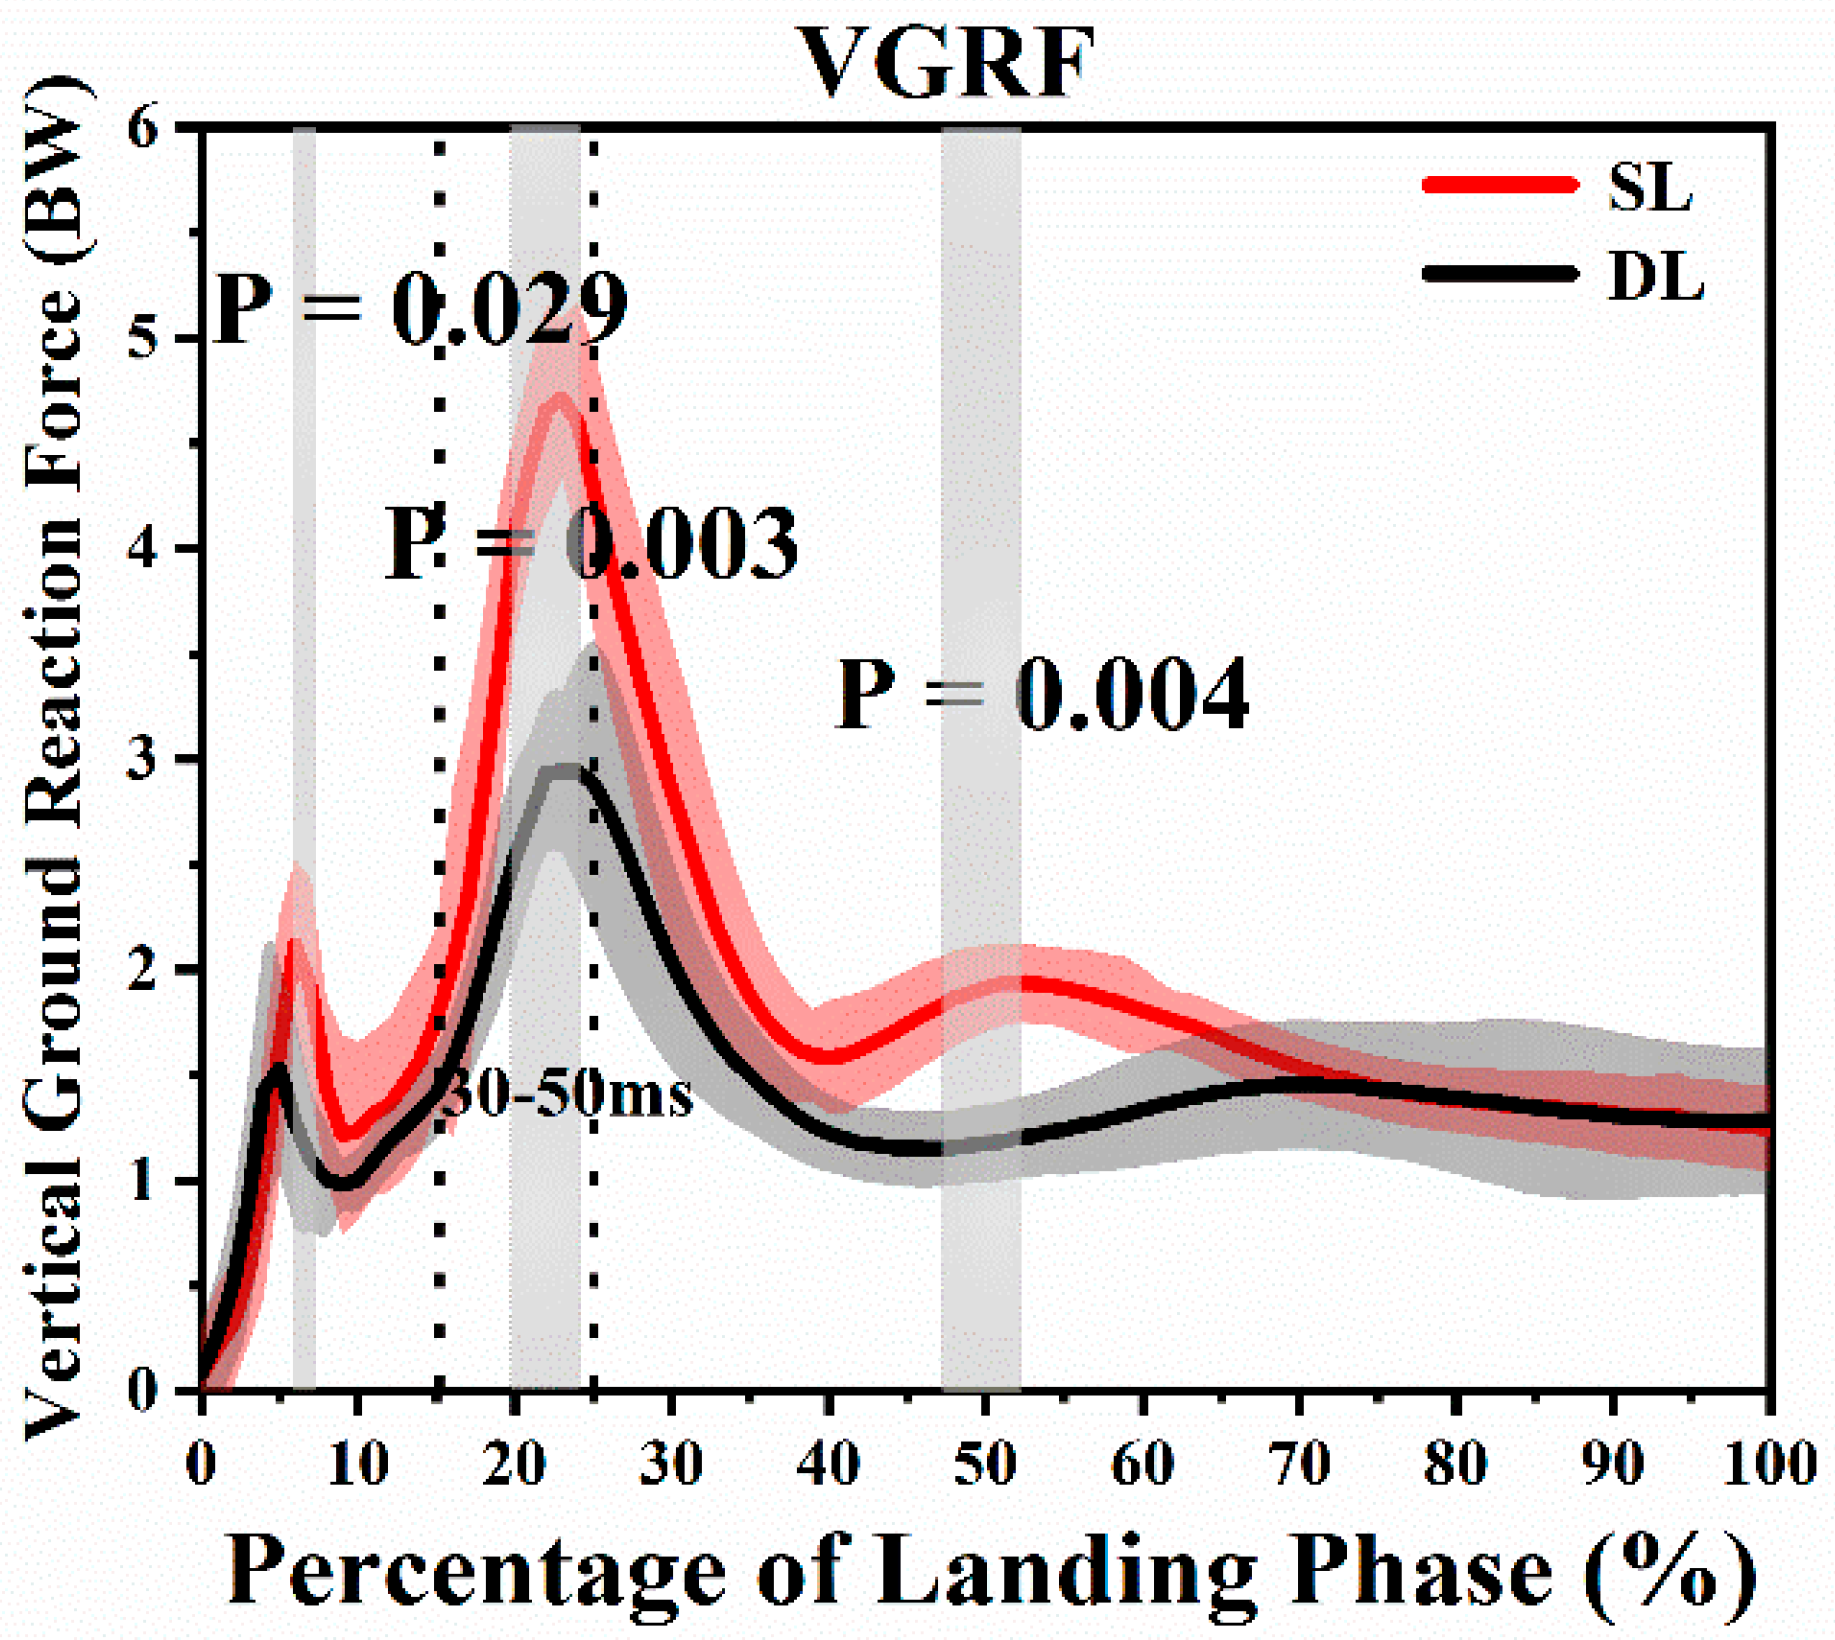
| VGRF | Peak VGRF (BW) | 5.08 ± 0.68 * (48.3 ± 6.6 ms) | 3.31 ± 0.55 * (49.8 ± 7.8 ms) | 0.001 |
| Loading Rate (BW/s) | 187.23 ± 21.11 * | 118.49 ± 14.78 * | 0.001 |
Publisher’s Note: MDPI stays neutral with regard to jurisdictional claims in published maps and institutional affiliations. |
© 2020 by the authors. Licensee MDPI, Basel, Switzerland. This article is an open access article distributed under the terms and conditions of the Creative Commons Attribution (CC BY) license (http://creativecommons.org/licenses/by/4.0/).
Share and Cite
Xu, D.; Jiang, X.; Cen, X.; Baker, J.S.; Gu, Y. Single-Leg Landings Following a Volleyball Spike May Increase the Risk of Anterior Cruciate Ligament Injury More Than Landing on Both-Legs. Appl. Sci. 2021, 11, 130. https://doi.org/10.3390/app11010130
Xu D, Jiang X, Cen X, Baker JS, Gu Y. Single-Leg Landings Following a Volleyball Spike May Increase the Risk of Anterior Cruciate Ligament Injury More Than Landing on Both-Legs. Applied Sciences. 2021; 11(1):130. https://doi.org/10.3390/app11010130
Chicago/Turabian StyleXu, Datao, Xinyan Jiang, Xuanzhen Cen, Julien S. Baker, and Yaodong Gu. 2021. "Single-Leg Landings Following a Volleyball Spike May Increase the Risk of Anterior Cruciate Ligament Injury More Than Landing on Both-Legs" Applied Sciences 11, no. 1: 130. https://doi.org/10.3390/app11010130