1. Introduction
Additive Manufacturing (AM), also known as 3D printing, refers to a form of fabricating three-dimensional objects, where materials are deposited layer-by-layer to ensure even complex shapes. Due to this characteristic, AM has become a major source of paradigm shifts, as seen in various industries. From small and simple tools to industries that require huge sizes and high reliability, such as the aerospace, energy, engine, and biomedical industries, 3D printing technology is gradually expanding [
1,
2,
3,
4]. Despite the various potentials of 3D printing, some defects, such as thermal deformations and geometrical errors, have been major hindrances in AM processes. Such defects cause unnecessary time and cost increases in many manufacturing processes, crucially reducing the efficiency of the manufacturing industry. Therefore, defect minimization and detection, including early detection, are vital regarding increasing the efficiency and reliability of AM processes.
Since it is very important to ensure high reliability and quality in manufacturing, most studies have so far focused on finding optimal process parameters to minimize defects such as thermal deformations and geometrical errors [
5,
6,
7,
8,
9,
10,
11]. Equbal et al. [
5] aimed at optimizing process parameters using fused deposition modeling (FDM). The analysis of variance was also used to study the effect of three main parameters: raster angle, raster width, and raster to raster gap. Sun et al. [
7] experimentally documented the influence of some process parameters on the part quality and micro property in selective laser melting. In this research, the effect of each process parameter on the quality and defect formation in manufacturing processes was described in detail. Although optimizing process parameters improves the overall quality of manufacturing, thus reducing the number of defects, it is still important to monitor the remaining defects. That is, in addition to parameter optimization, accurate defect early detection must also be performed. There are many studies regarding in-situ monitoring and early detection, and they have been the focus of conventional statistical methods [
12,
13]. Wu, Yu, and Wang [
12] attempted to establish a sensor-based monitoring system for the conditions of machines to increase part quality. Generally, the use of acoustic emission sensors and hidden semi-Markov models serves as a diagnostic tool of FDM processes.
Recently, many studies have used machine learning (ML) techniques to detect defects using process parameter information [
14,
15,
16,
17,
18]. Lyu and Manoochehri [
18] presented that the use of artificial neural networks and support vector regression can facilitate the prediction accuracy of many models. In this study, the analysis of the relationship between product geometry, which is affected by defects, and process parameters were described. One of the factors that greatly affect the product geometry is warping deformation, which refers to the phenomenon in which a fabricated part is detached from a built platform. Such deformations usually start from corners, as this defect usually occurs due to thermal residual stresses. Most of these thermal defects, such as warping deformation, determine the final quality and are mainly caused by process parameters. However, it is not easy to forecast warping deformation using only process parameters, even with ML techniques. This is because it is not only difficult to directly identify how each process parameter affects the results but also because many input variables and input data are needed for ML.
Unlike prior research that has mainly focused on the relationship between process parameters and defect forecasting, this study aimed at predicting the defects of thermal time series data using in-situ monitoring. In addition, this study has focused on thermal deformation, especially the warping deformation in FDM, by analyzing thermal time-series patterns. For the in-situ monitoring of the heat data, a thermocouple device was used, and through the K-nearest neighbor (KNN) technique reflecting dynamic time warping (DTW), which is an ML technique, thermal time series data were analyzed to present a method for effectively predicting and detecting warping deformation. In addition, this study explores the feasibility of early detection of warping deformation. Note that early detection of warping deformation can potentially improve the printing quality through real-time introduction of corrective measures or save both time and material cost through halting the printing process, once warping deformation is detected. Additionally, a detailed method for predicting warping deformation through time-series analyses was discussed.
The paper is organized as follows.
Section 2 explains the background of warping deformation and the DTW and KNN technique used in this study.
Section 3 shows the experimental setup, data set, and model framework.
Section 4 shows the results and discussion. Finally,
Section 5 shows the conclusions, including the limitations and future works.
3. Experiments
3.1. Experimental Setup
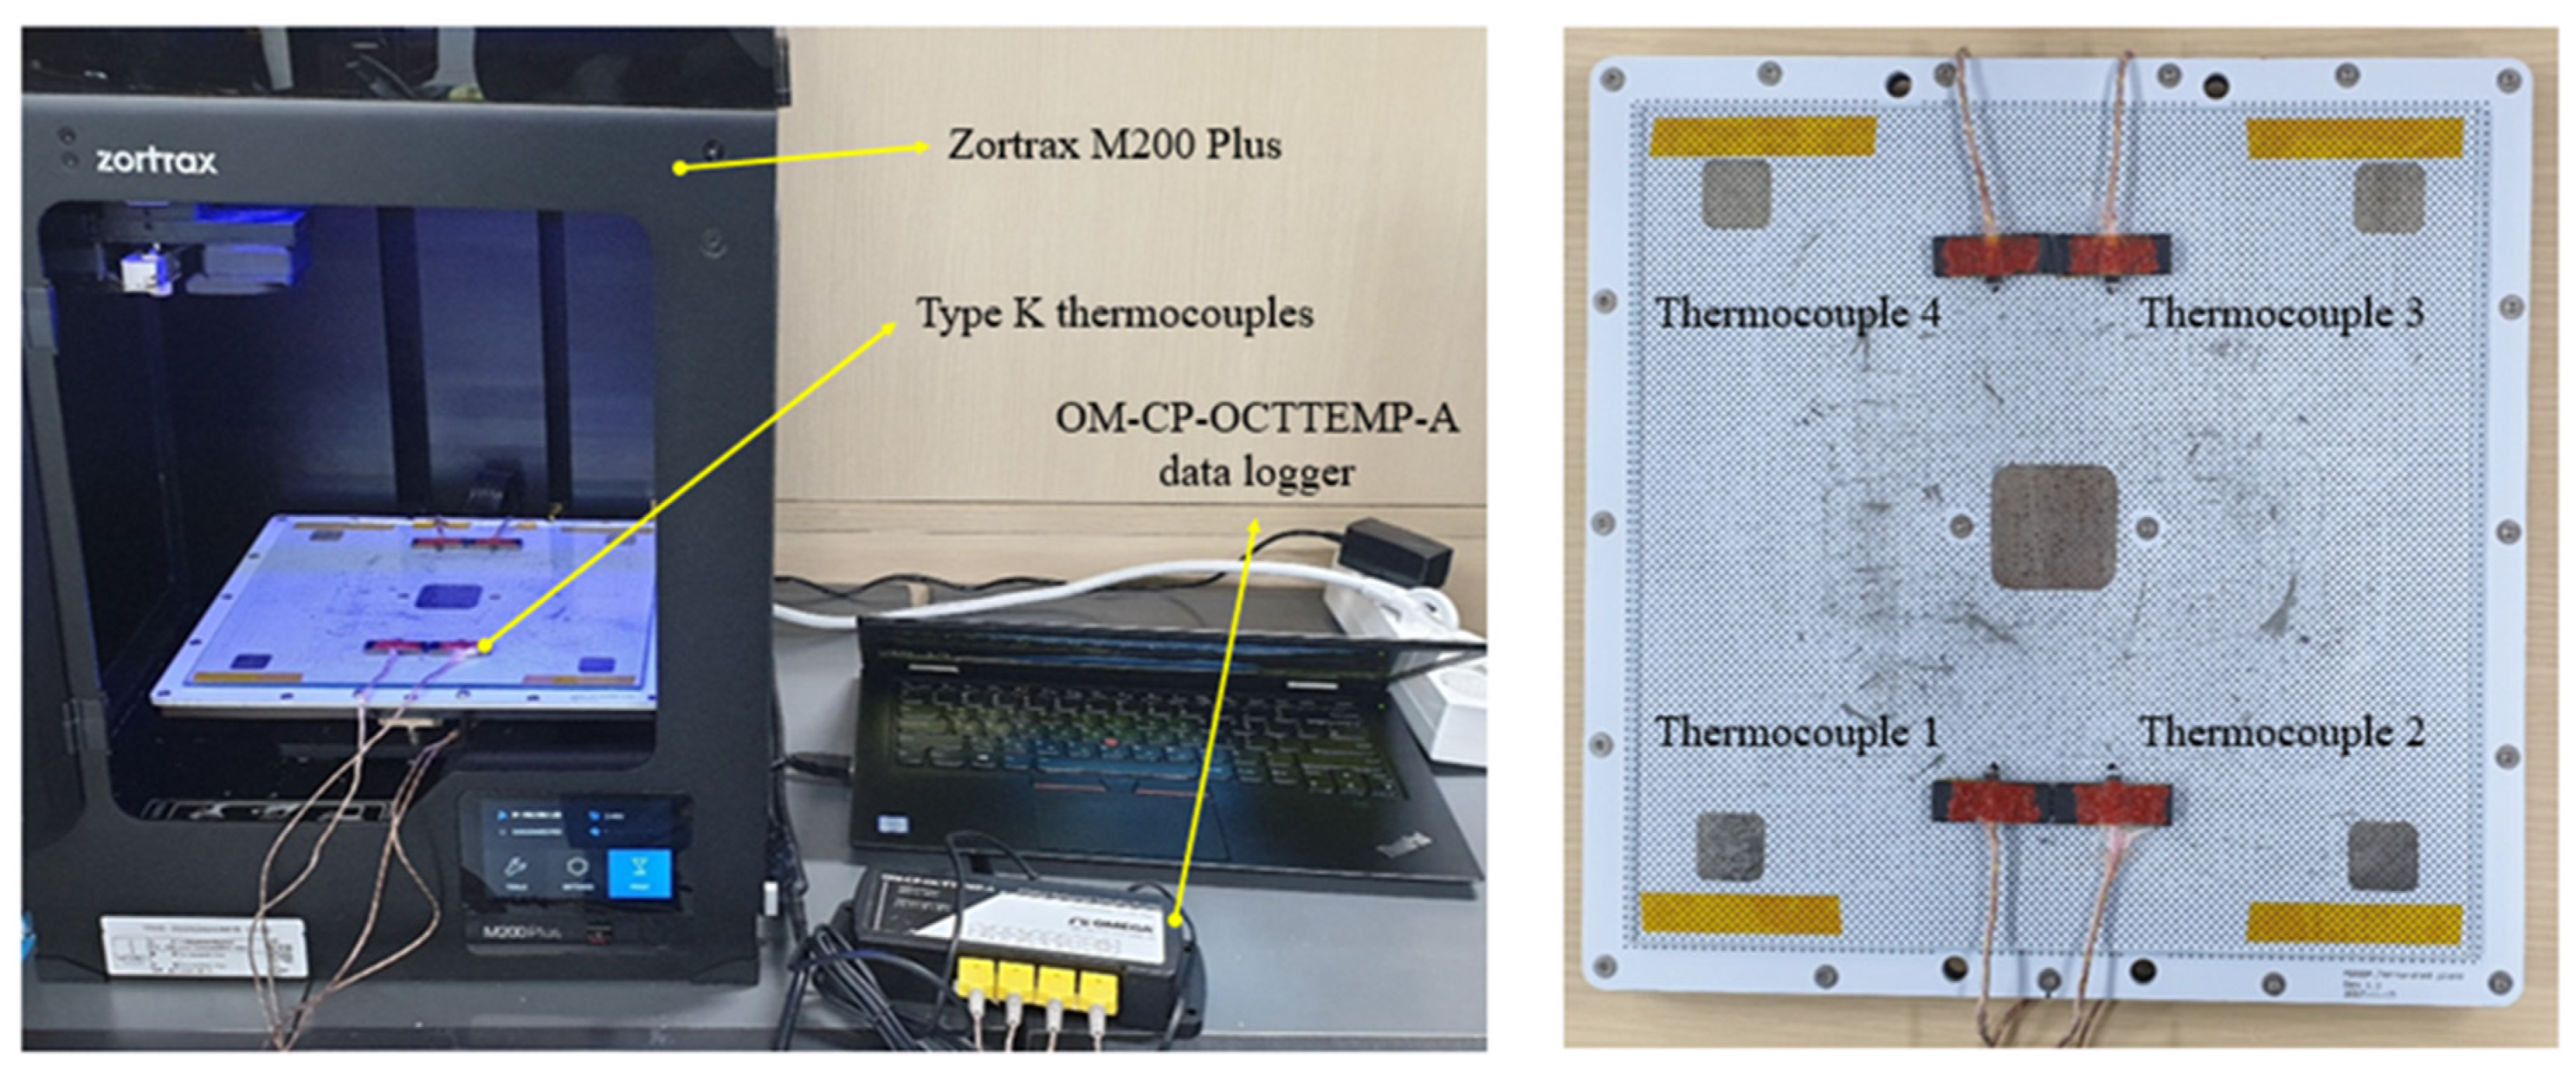
All the experiments in this study were performed using a commercial desktop FDM machine Zortrax M200 Plus. The machine was equipped with four thermocouples operating in continuous mode to measure the specimen temperature during the printing process. The experimental test setup is shown in
Figure 1. Type K thermocouples with 0.1 °C resolution and ±0.5 °C accuracy were mounted on special plastic holders to minimize the noise resulting from the vibration of the machine, and the holders were attached to the build platform at a distance of 10 mm from each specimen corner. The thermocouples were numbered according to their measuring corner. The surrounding temperatures of the specimen were recorded during the entire printing process using an eight-channel thermocouple temperature data logger OM-CP-OCTTEMP-A with a reading rate of 1 Hz, which was connected to a local computer.
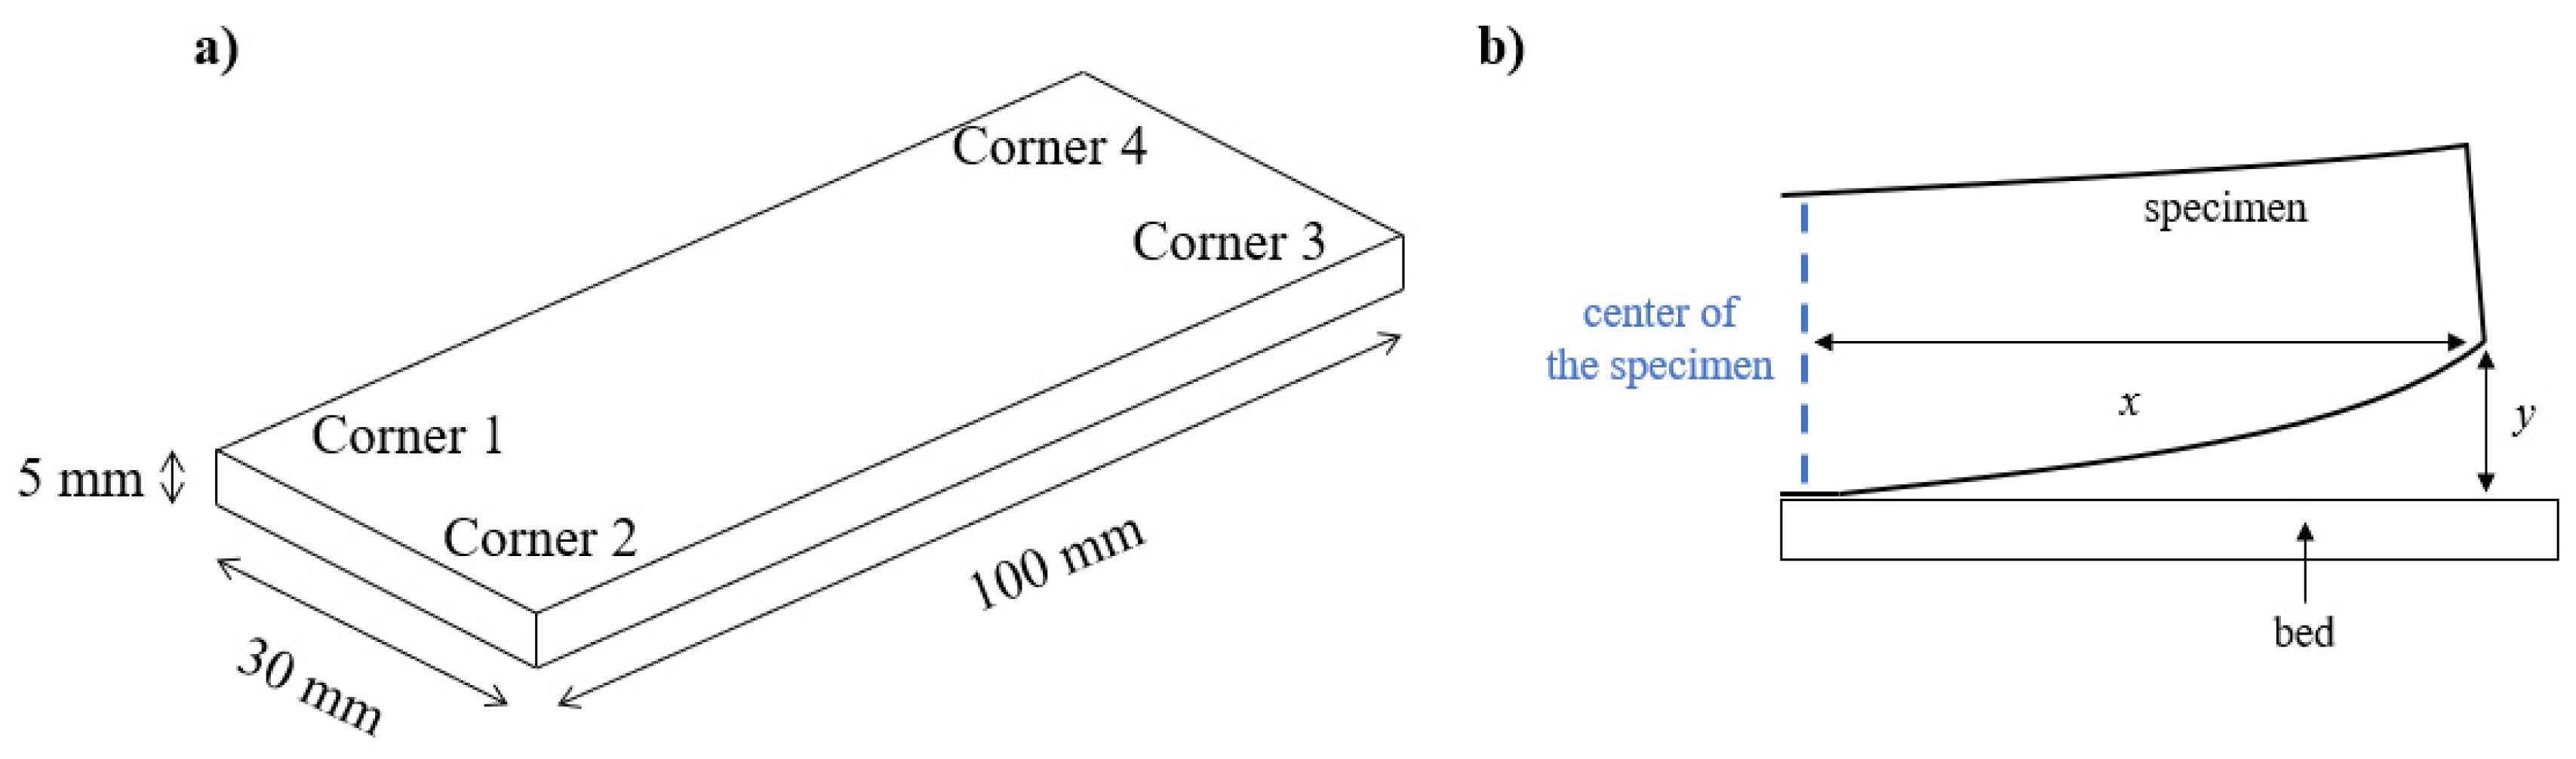
As a specimen, a cuboid model with dimensions of
(
as shown in
Figure 2a was designed based on the works of Alsoufi and Elsayed [
19]. Experiments were conducted with the extrusion temperature varying from 240 °C to 275 °C and platform temperature varying from 50 °C to 90 °C with 5 °C increments. All other manufacturing process parameters were kept constant and they are listed in
Table 1.
3.2. Dataset and Preprocessing
The dataset had a total of 50 samples collected with various process parameter combinations, with each sample consisting of four thermal time series data. The samples were divided into two categories according to the existence or non-existence of warping deformation. After printing a specimen, the warping deformation of the specimen was specified by measuring the angle
at each corner. The corner angle
is obtained using the following equation:
where
is the corner height and
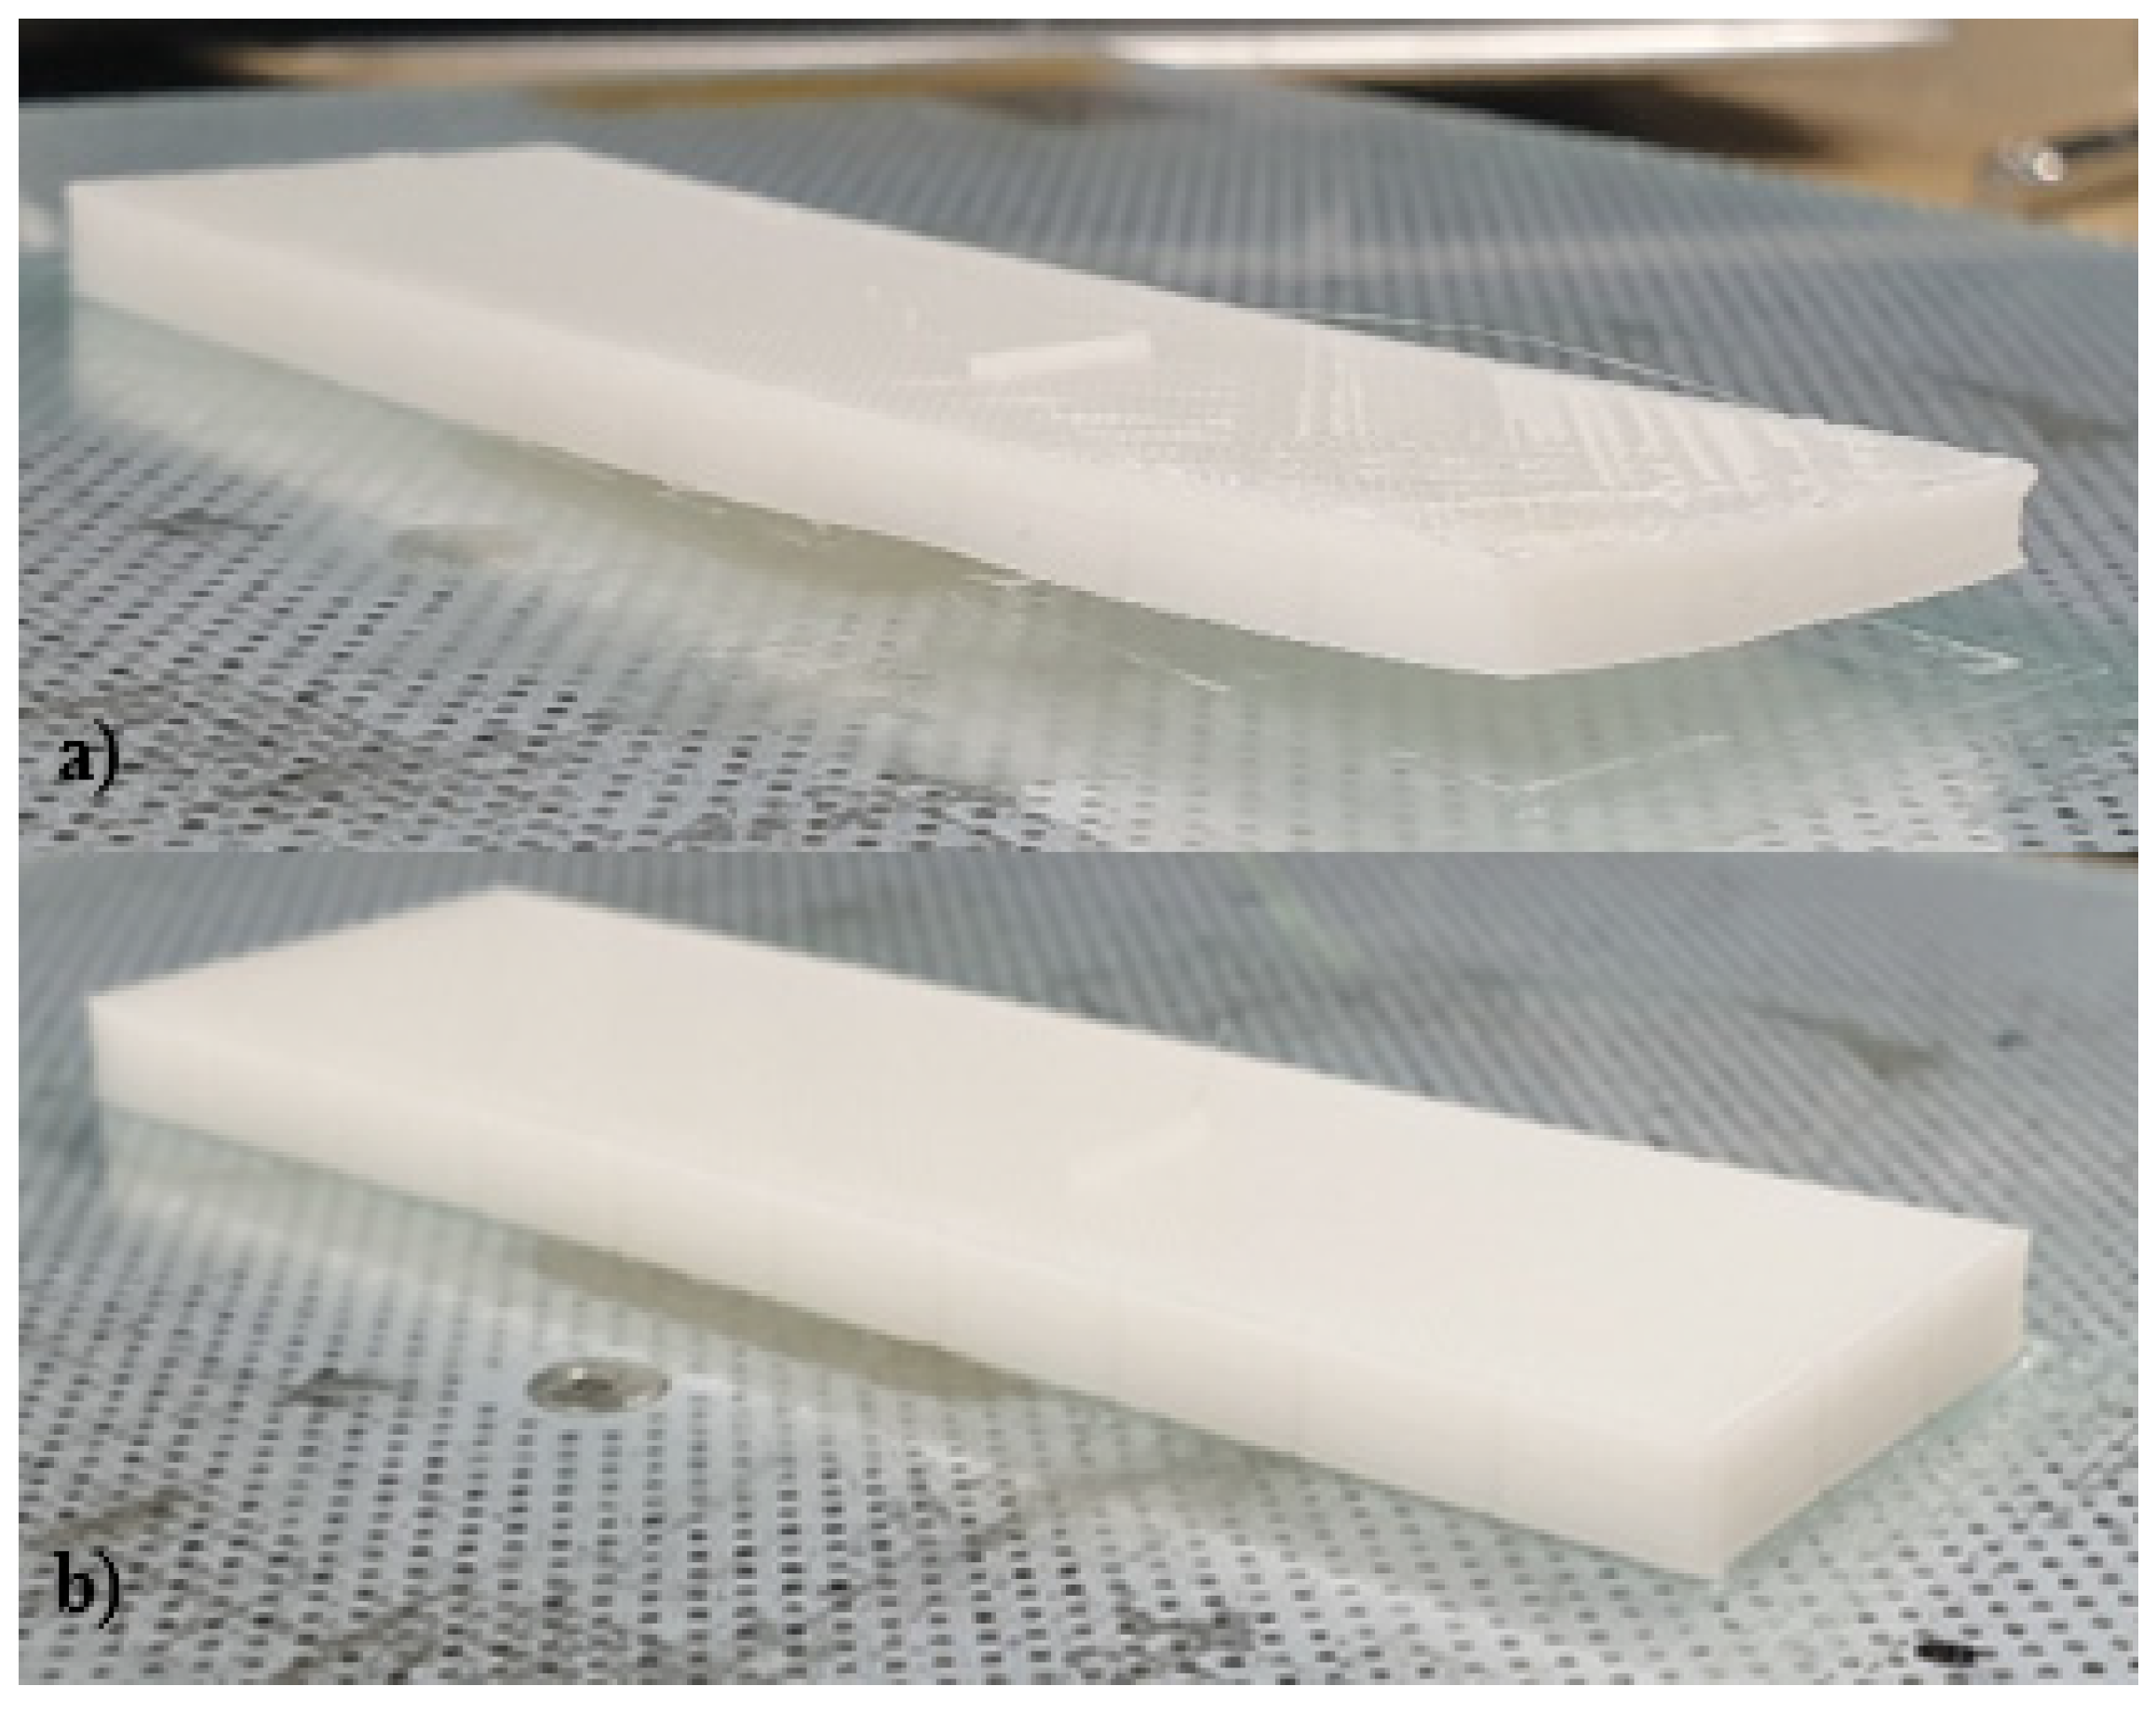
x is the horizontal distance of the corner from the nearest center of the specimen, both measured using a digital vernier caliper. In this work, the center point in between corners 1 and 4 and corners 2 and 3 were considered as the centers of the specimen. The parts peeled away with an angle greater than 1° with the platform were considered to have warping deformation. If a specimen had more than one warped corner, it was classified as a warped specimen. Images of the produced specimens with and without warping deformation are shown in
Figure 3.
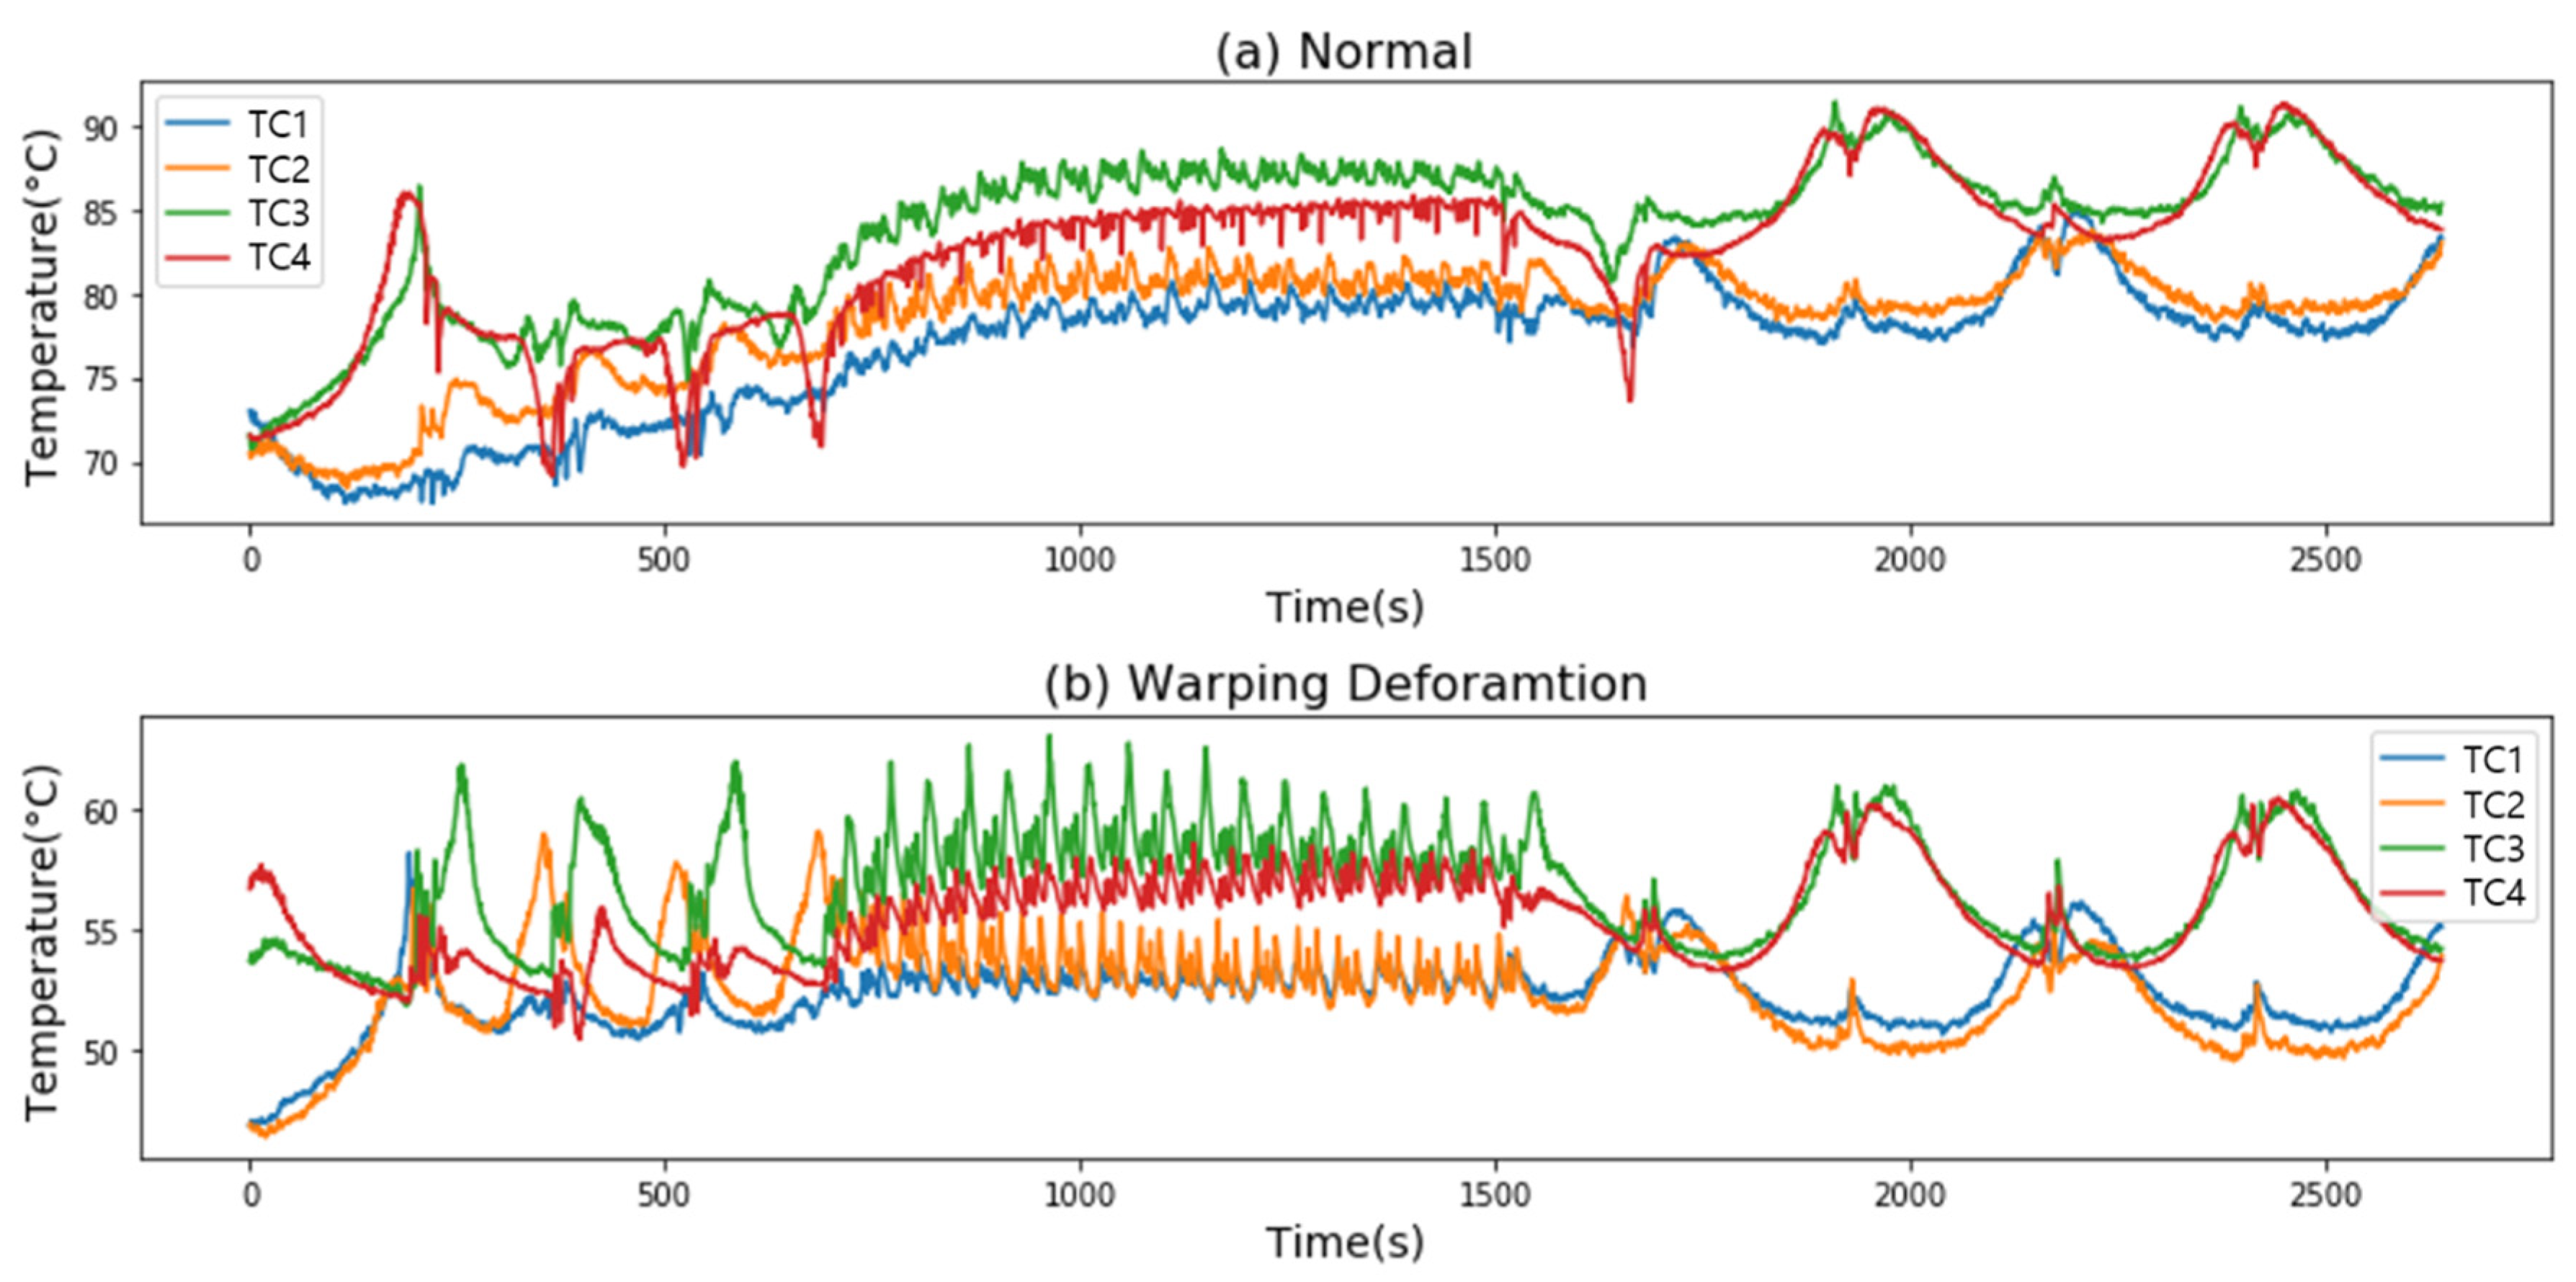
The thermal time series data extracted from the thermocouple sensors installed at the corners of the specimen with and without warping deformation are shown in
Figure 4. As seen in the figure, TC1 and TC2, as well as TC3 and TC4, moved relatively similarly as their corner distance was closer.
The noise data at both ends of the data were removed to extract the patterns of the time series data in a unified interval. The length of each time series data was set as 2640 steps to conduct a model learning and performance evaluation. Min-max normalization was also conducted on the data for more stable learning. In general, min-max normalization is used to prevent certain features from overwhelming others and to make models more stable to learn. The min-max normalization is calculated as in Equation (5).
where
x is the original value, and
and
are the maximum and minimum values of each feature, respectively.
3.3. Model Training
In this paper, the KNN model was trained and evaluated in two different ways using thermal time series data to predict whether warping deformation occurs or not.
First, warping deformation was predicted based on the thermal time series data extracted after the entire printing process was completed. The data collected from the 50 samples were split into training and testing sets of 40 and 10 samples, respectively. 5-fold and 10-fold cross-validations were conducted to generalize the performance.
Another experiment was conducted using partial thermal time series data corresponding to a portion of the whole printing process to predict whether warping deformation occurs in end-products. The entire time-series data were divided into five segments and increased by 20%. The generalized performance was also compared and analyzed through cross-validation.
3.4. Performance Evaluation Methods
In the field of ML, the confusion matrix, also called the error matrix, is generally used to represent the performance of models. A corresponding matrix comprises class labels and subsets as in
Table 2. In this study, the labels were classified into two classes: positive for warped samples and negative for unwarped samples.
Four subsets were considered based on the classified labels. True positive is the correct prediction of a warped sample, and true negative is the correct prediction of an unwarped sample. False positive is the incorrect prediction of an unwarped sample into a warped sample, and false negative is the incorrect prediction of a warped sample into an unwarped sample.
In this experiment, the evaluation metrics defined in Equations (6)–(10) were used based on the above-classified subsets to determine the classification performances of predicting and categorizing the occurrence of warping deformation.
Both the prediction error (ERR) and accuracy (ACC) provided general information on how many samples were misclassified, and they are expressed in Equations (6) and (7), respectively. Error is the sum of incorrect predictions divided by the number of predicted samples, and accuracy is the sum of correct predictions divided by the number of predicted samples. Accuracy has an inverse relationship with prediction error and can be expressed in terms of error as in Equation (7). Precision is the proportion of the warped samples among the ones predicted as warped, while recall is the proportion of the predicted samples as warped among the warped ones. F1-score is the harmonic mean of precision and recall. Higher values of the following three metrics indicate better predictive performances. These metrics are expressed in Equations (8)–(10).
4. Results and Discussion
As mentioned in
Section 3.3, the performances of the warping deformation prediction in the two cases were compared and analyzed through various classification evaluation metrics. The performance results of the DTW-based KNN model are shown in
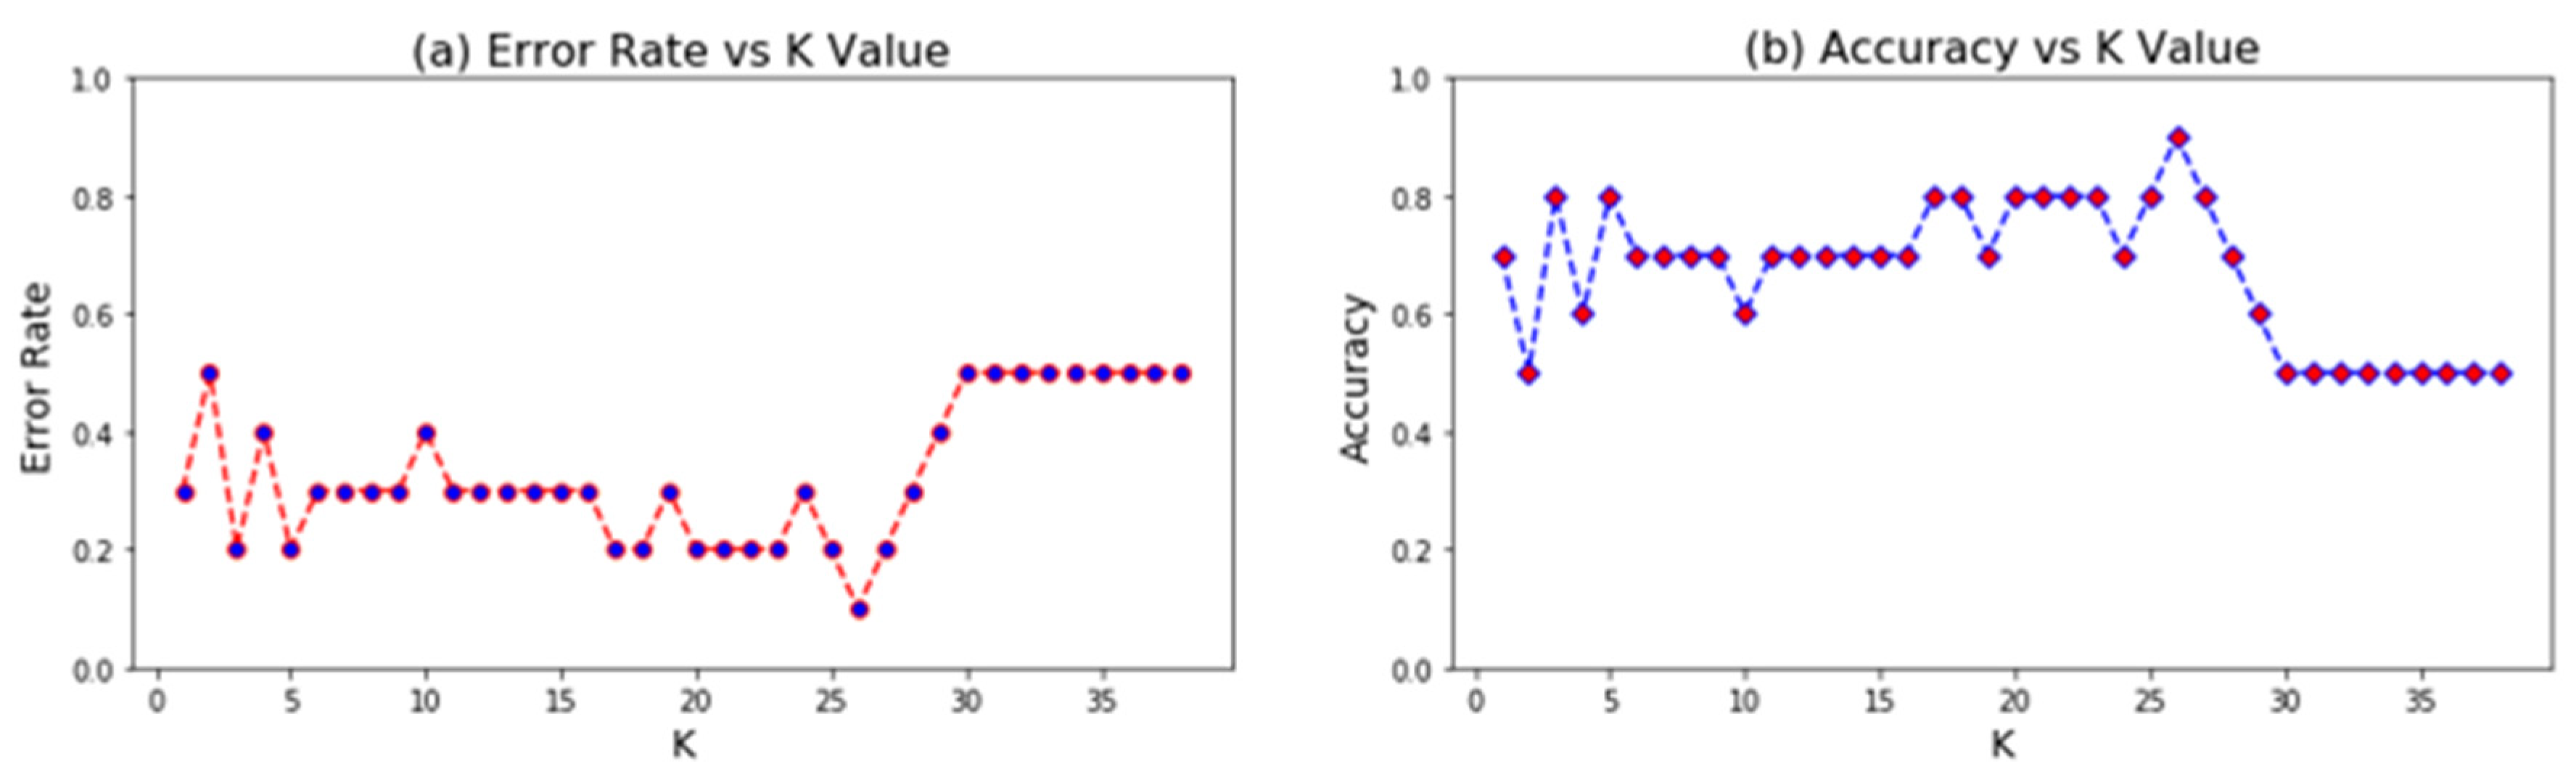
Figure 5. The model was trained with 40 training data (25 warped data and 15 unwarped data) and tested with 10 testing data (5 warped data and 5 unwarped data) for warping prediction according to the K value. K is one of the major hyperparameters of the KNN algorithm. The results showed the lowest error rate of 10% and the highest accuracy of 90% when the K value was 26. Based on
Figure 5 and Equations (6) and (7), the error rate and accuracy have an inverse relationship. The performance of classifying the time series patterns rapidly dropped with a K value greater than the highest performing K value. Once the K value exceeded 30, the DTW-based KNN model completely lost its classification capabilities.
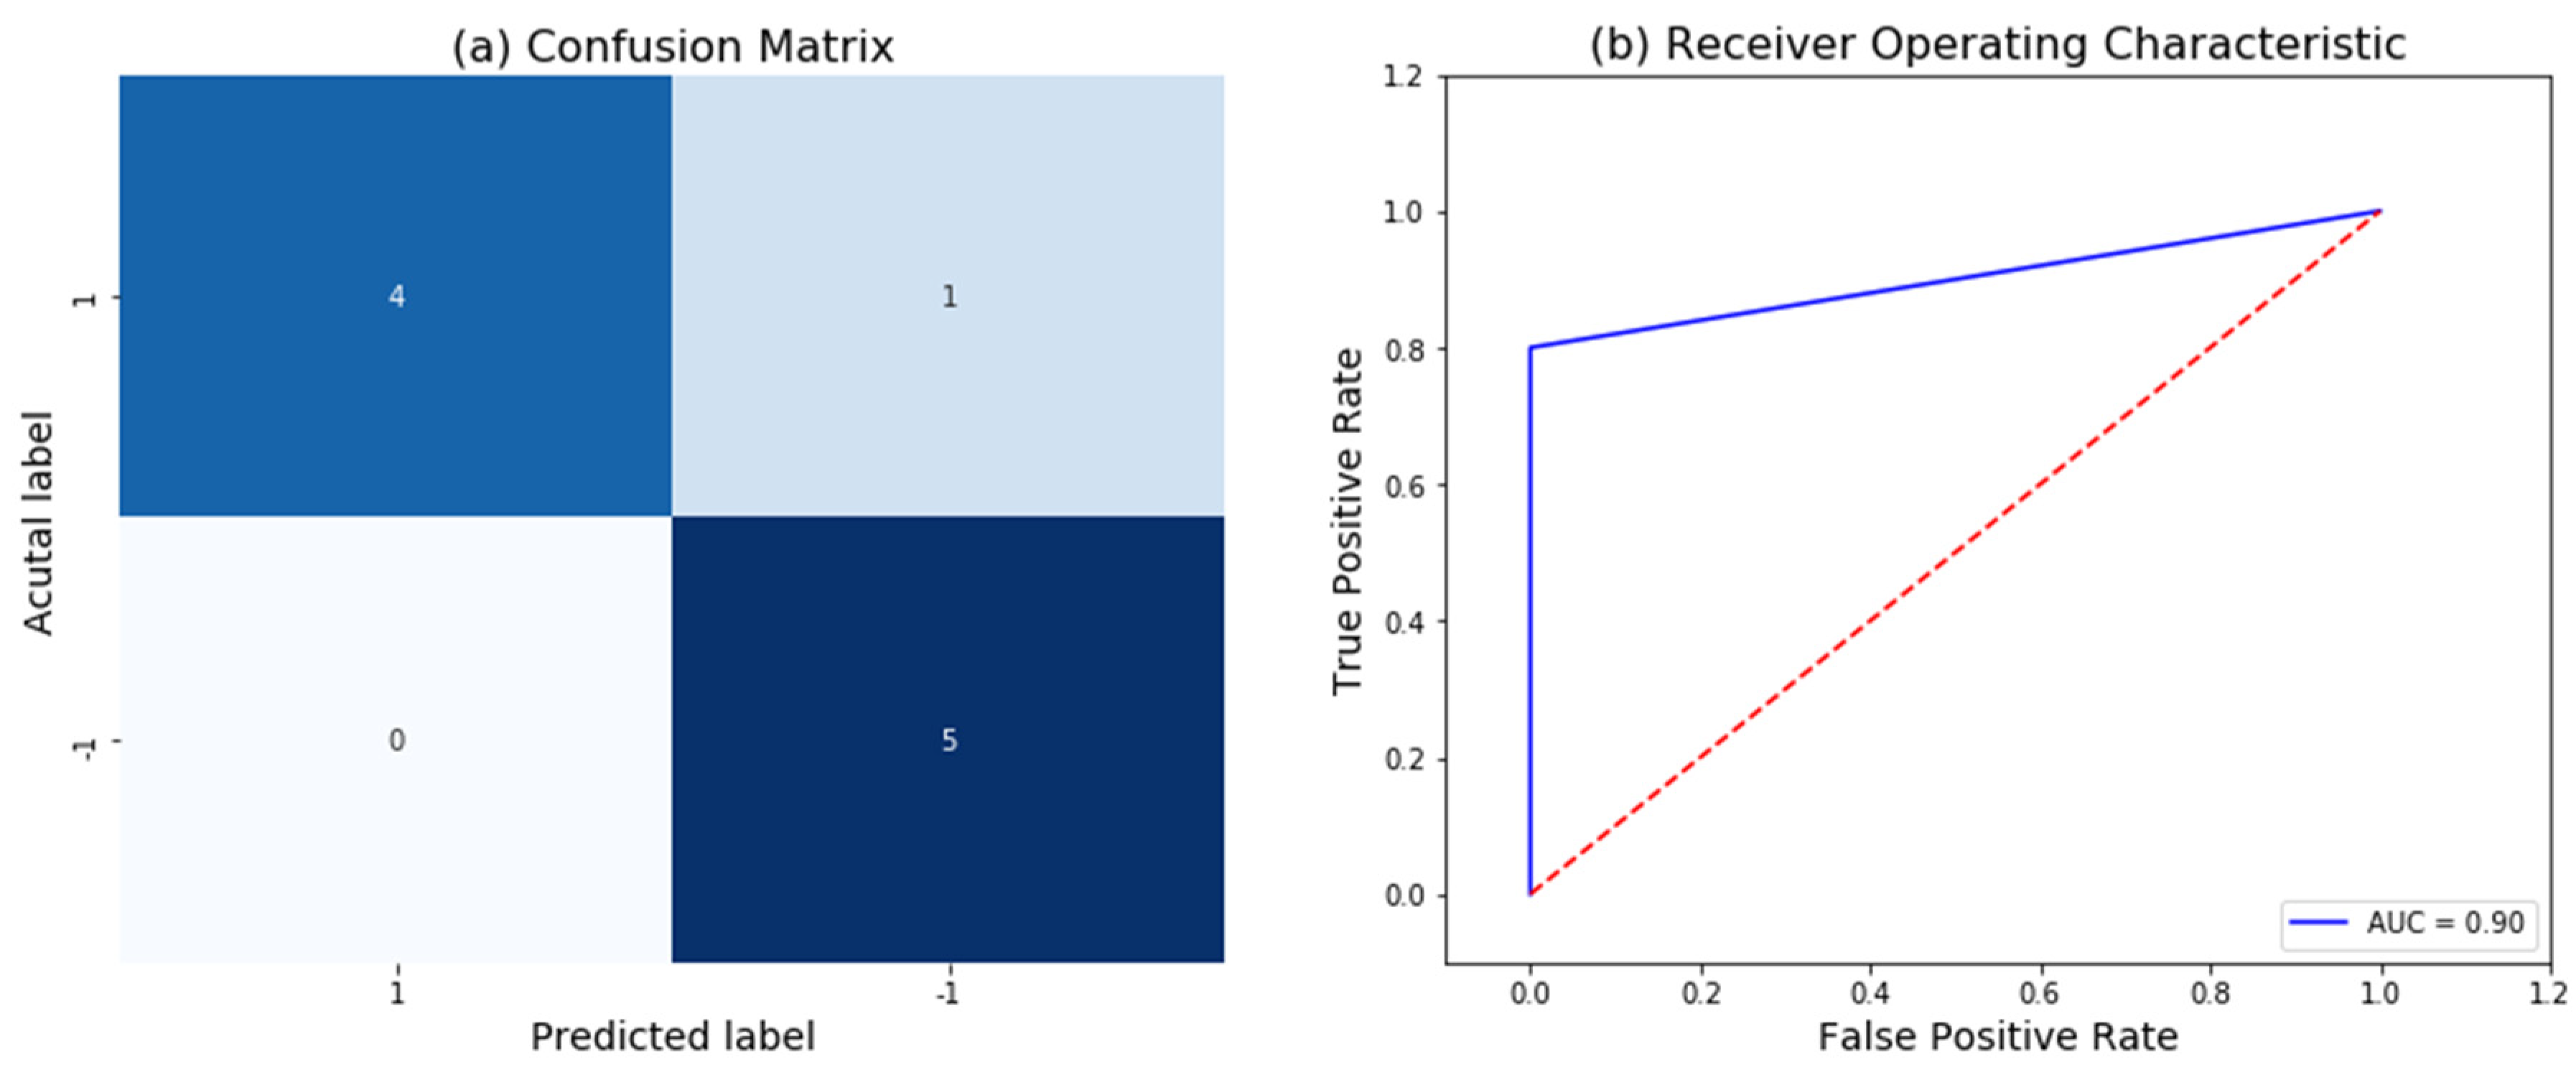
The confusion matrix and receiver operating characteristic (ROC) curve evaluating the testing data using the highest performing K value are shown in
Figure 6. As depicted in
Figure 6a, all five unwarped samples were correctly classified, while one warped sample was classified as an unwarped sample.
The classification performance was as follows when evaluated based on the confusion matrix in the case of the warped data. The precision was 0.83, recall was 1.0, and f1-score was 0.91. However, in the case of the unwarped data, the precision was 1.0, recall was 0.8, and f-1 score was 0.89. The graph in
Figure 6b shows the performance of the classification model at all the thresholds, where the area below the curve is called the area under the curve (AUC). A high AUC value signifies a high model performance. The AUC in this experiment was found to be 0.9, which is consistent with the accuracy.
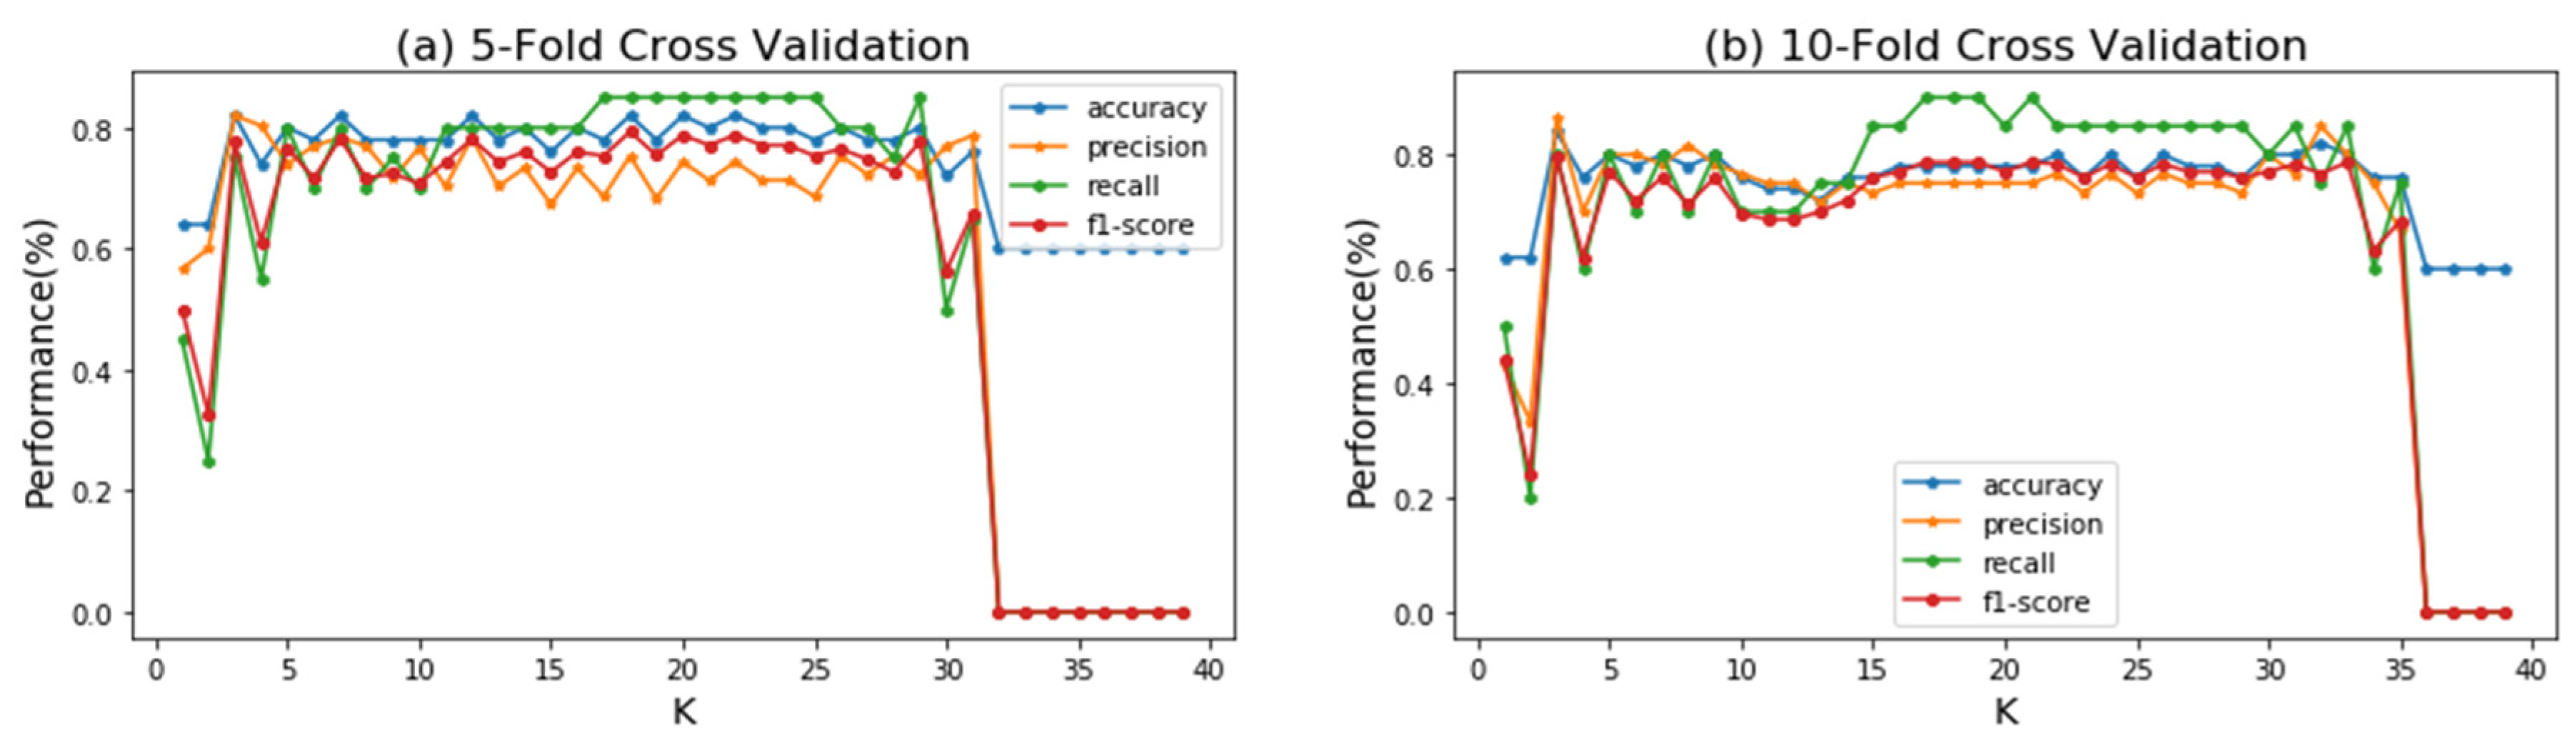
K-fold cross-validation (CV) was performed to avoid any bias in the prediction performance for specific test samples due to the limited data and to generalize the performance. The k values of 5 and 10 were used along with 20% and 10% of the testing data, respectively.
Figure 7 shows the obtained mean accuracy results according to the K values in each CV. At a K value of 3, 82% accuracy for the 5-fold CV and 84% accuracy for the 10-fold CV were obtained. Like the results obtained using a single testing set, the classification performance of the prediction model was drastically reduced as the K value exceeded a specific value (31 for the 5-fold CV and 36 for the 10-fold CV). Although the highest performance of the two CVs did not differ significantly, the k value with the lowest performance was smaller for the 5-fold CV.
The KNN model was also trained using the partial time series data rather than the entire data with the purpose of early detection of the warping deformation. The length of the partial time series data was adjusted by splitting the entire data into five equal sections. The early detection results using the partial time series according to the highest performing K values are listed in
Table 3. The predictive model did not differ much in performance between the CVs, but it showed a difference depending on the length of the time-series data. For both the 5-fold and 10-fold CV, the overall performance of the model was lowest when only 20% of the data were fed, and it was highest when 40% of the data were fed. The experimental results have shown that warping deformation can be early detected with at least 80% accuracy even when using a small length of thermal time series data. The possibility of detecting the warping deformation using as little as 20 percent of the printing process implies two possible conclusions. First possibility is that the warping deformation occurs early in the printing process. The second possibility is that early patterns in heat data possess all the predictive power of warping deformation occurring in later stages of the printing.
5. Conclusions
This paper presented two types of warping deformation prediction methods in FDM based on a DTW-integrated KNN algorithm and multivariate thermal time series data. First, a KNN model was trained using the thermal time series data of a whole printing process to determine whether warping deformation had occurred. Second, only partial thermal time series data were fed into the predictive model to carry an early detection of the warping deformation in the specimens.
To ensure stable performance results, the value of the main parameter K of the KNN algorithm was searched using the K-elbow method. The key classification performance indicators were also compared and analyzed using 5-fold and 10-fold CVs to generalize the performance of the limited number of data.
The results showed 84% accuracy in the 10-fold cross-validation and 82% accuracy in the 5-fold cross-validation when the warping deformation was predicted based on the pattern of the entire thermal time series data. Moreover, the trained model showed a relatively good performance by predicting the warping deformation occurrence with an accuracy of 80% using thermal time series data corresponding to only 20% (one-fifth) of the entire printing time.
The proposed methodologies not only detected the defects in a printed product but also predicted warping deformation with high accuracy. According to the obtained results, this approach can be introduced to actual manufacturing processes as a quality monitoring system to support the inspection process of defective products. This study can also be used as a stepping stone to build a feedback control system for warping prediction that can significantly reduce the unnecessary time and additional cost resulting from printing defective products.
The presented study is limited due to a major element, which is data. In general, machine-learning-based prediction models show stronger performance when fed with more data. However, a limited amount of data was provided to the current model due to physical restraints. Another limitation is unbalanced data, which can lead to biased model prediction due to the data being skewed to particular target values. Although the unbalanced data problem was tackled in this study by printing a similar number of warped and unwarped samples, such a method cannot be applied in actual production processes. Hence, the authors aim to improve the prediction performance by increasing the number of samples and by trying to come up with a solution to the unbalanced data problem. The transfer of the presented results to other AM environments will also be investigated in the near future.


