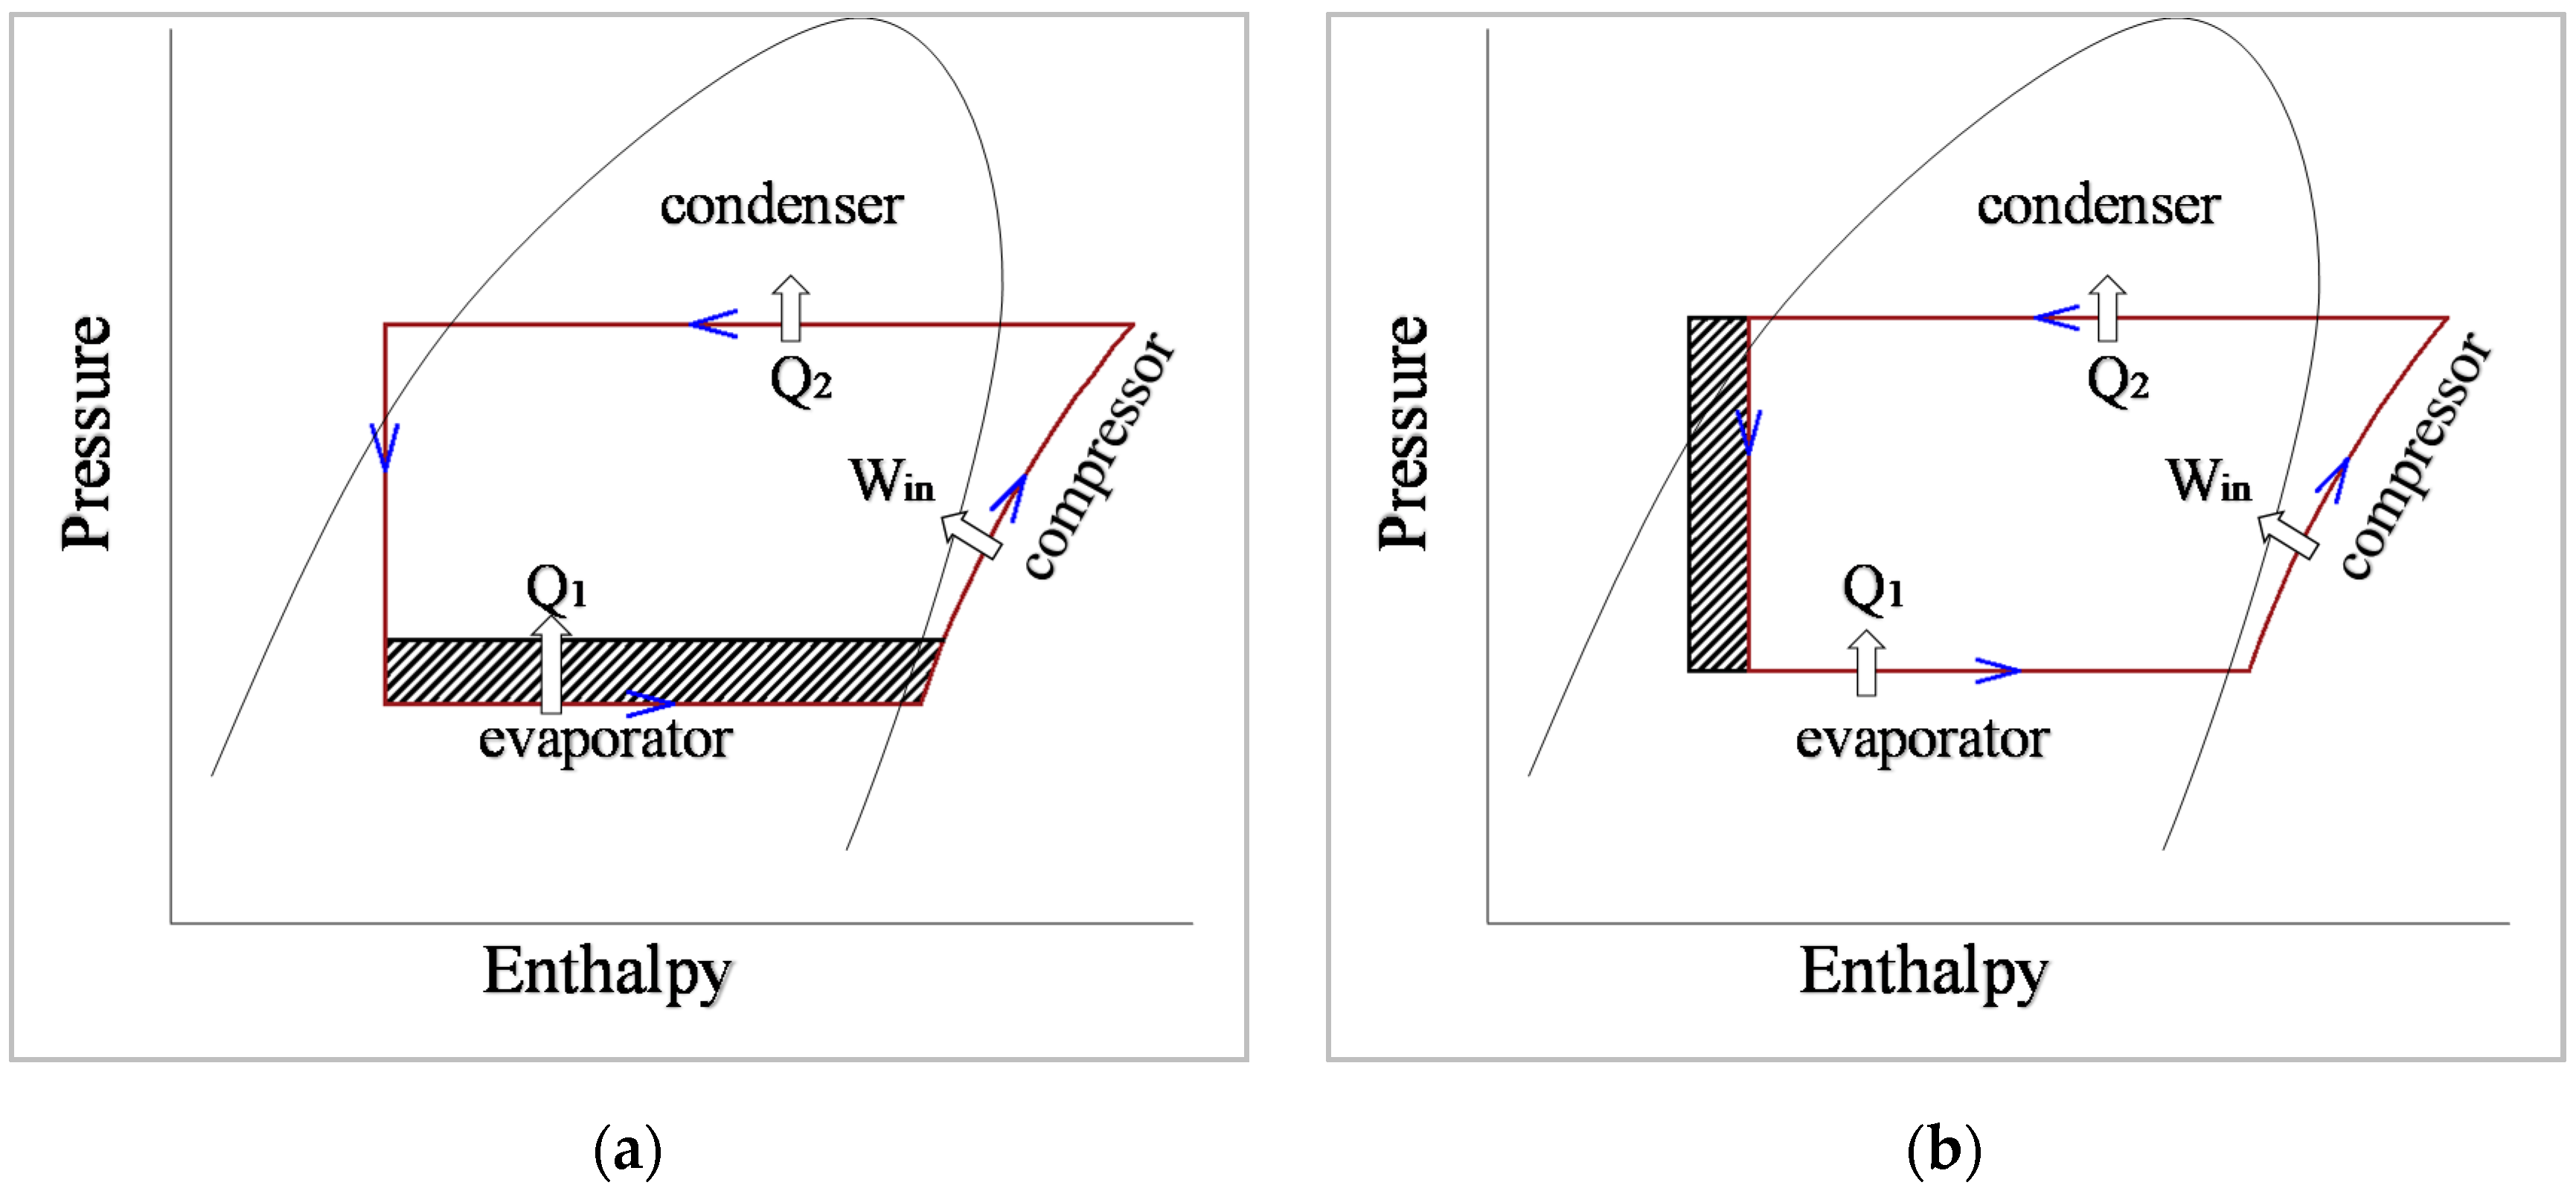
Figure 1.
Pressure-enthalpy diagram of a refrigeration cycle with performance improvement by (a) raised evaporator pressure or (b) increased sub-cooling degree.
Figure 1.
Pressure-enthalpy diagram of a refrigeration cycle with performance improvement by (a) raised evaporator pressure or (b) increased sub-cooling degree.
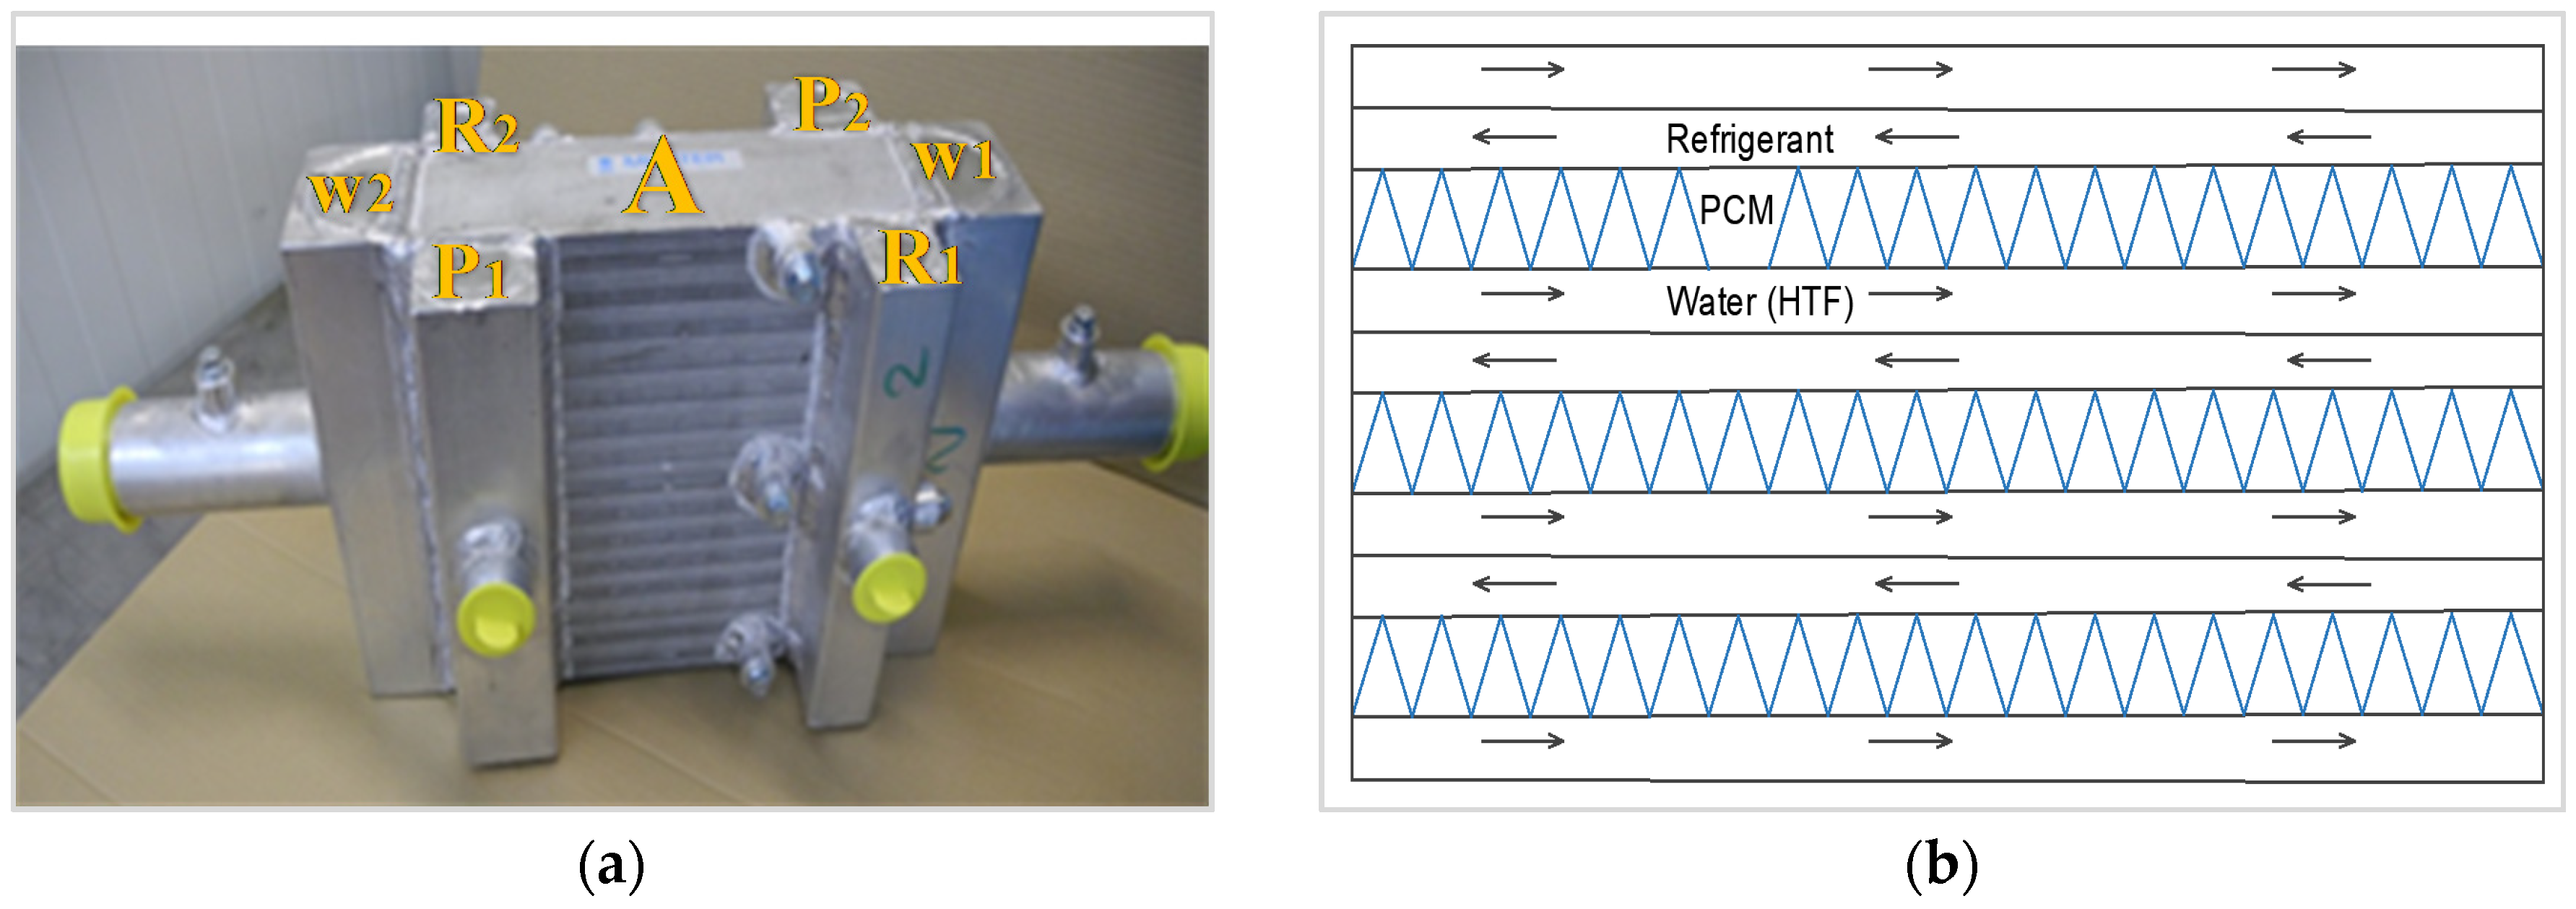
Figure 2.
Innovative refrigerant-phase change material (PCM)-water heat exchanger (AKG, Germany): (a) external structure and (b) internal distribution of the channels.
Figure 2.
Innovative refrigerant-phase change material (PCM)-water heat exchanger (AKG, Germany): (a) external structure and (b) internal distribution of the channels.
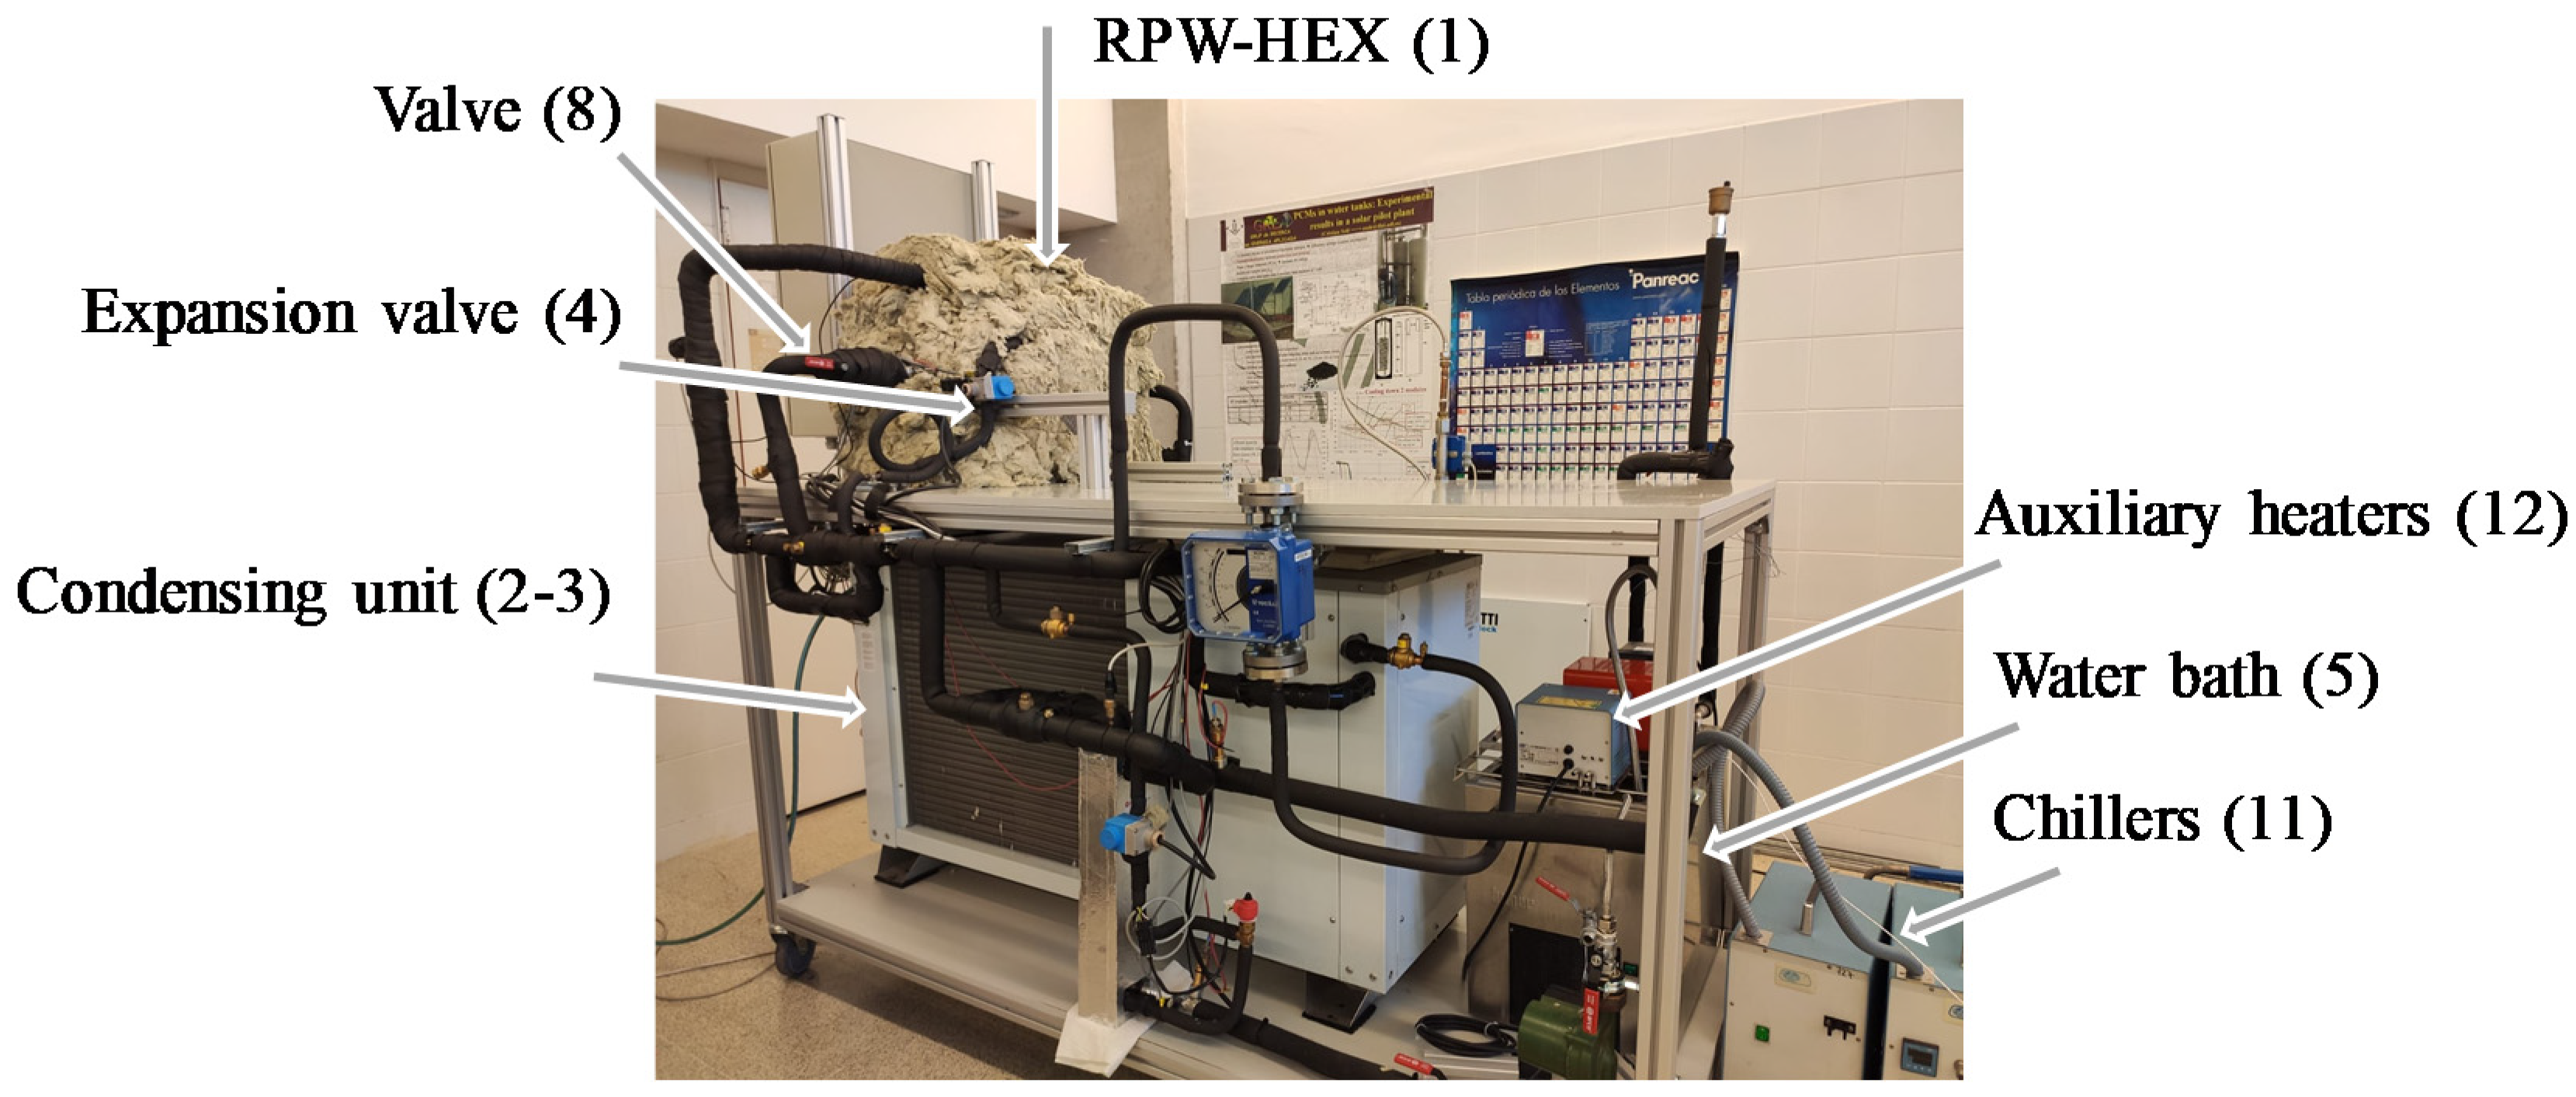
Figure 3.
Experimental setup of the innovative refrigerant-PCM-water heat exchanger integrated into a simple vapour compression system.
Figure 3.
Experimental setup of the innovative refrigerant-PCM-water heat exchanger integrated into a simple vapour compression system.
Figure 4.
Schematic diagram of the experimental setup showing heat transfer fluid (HTF) circuit and the refrigerant circuit.
Figure 4.
Schematic diagram of the experimental setup showing heat transfer fluid (HTF) circuit and the refrigerant circuit.
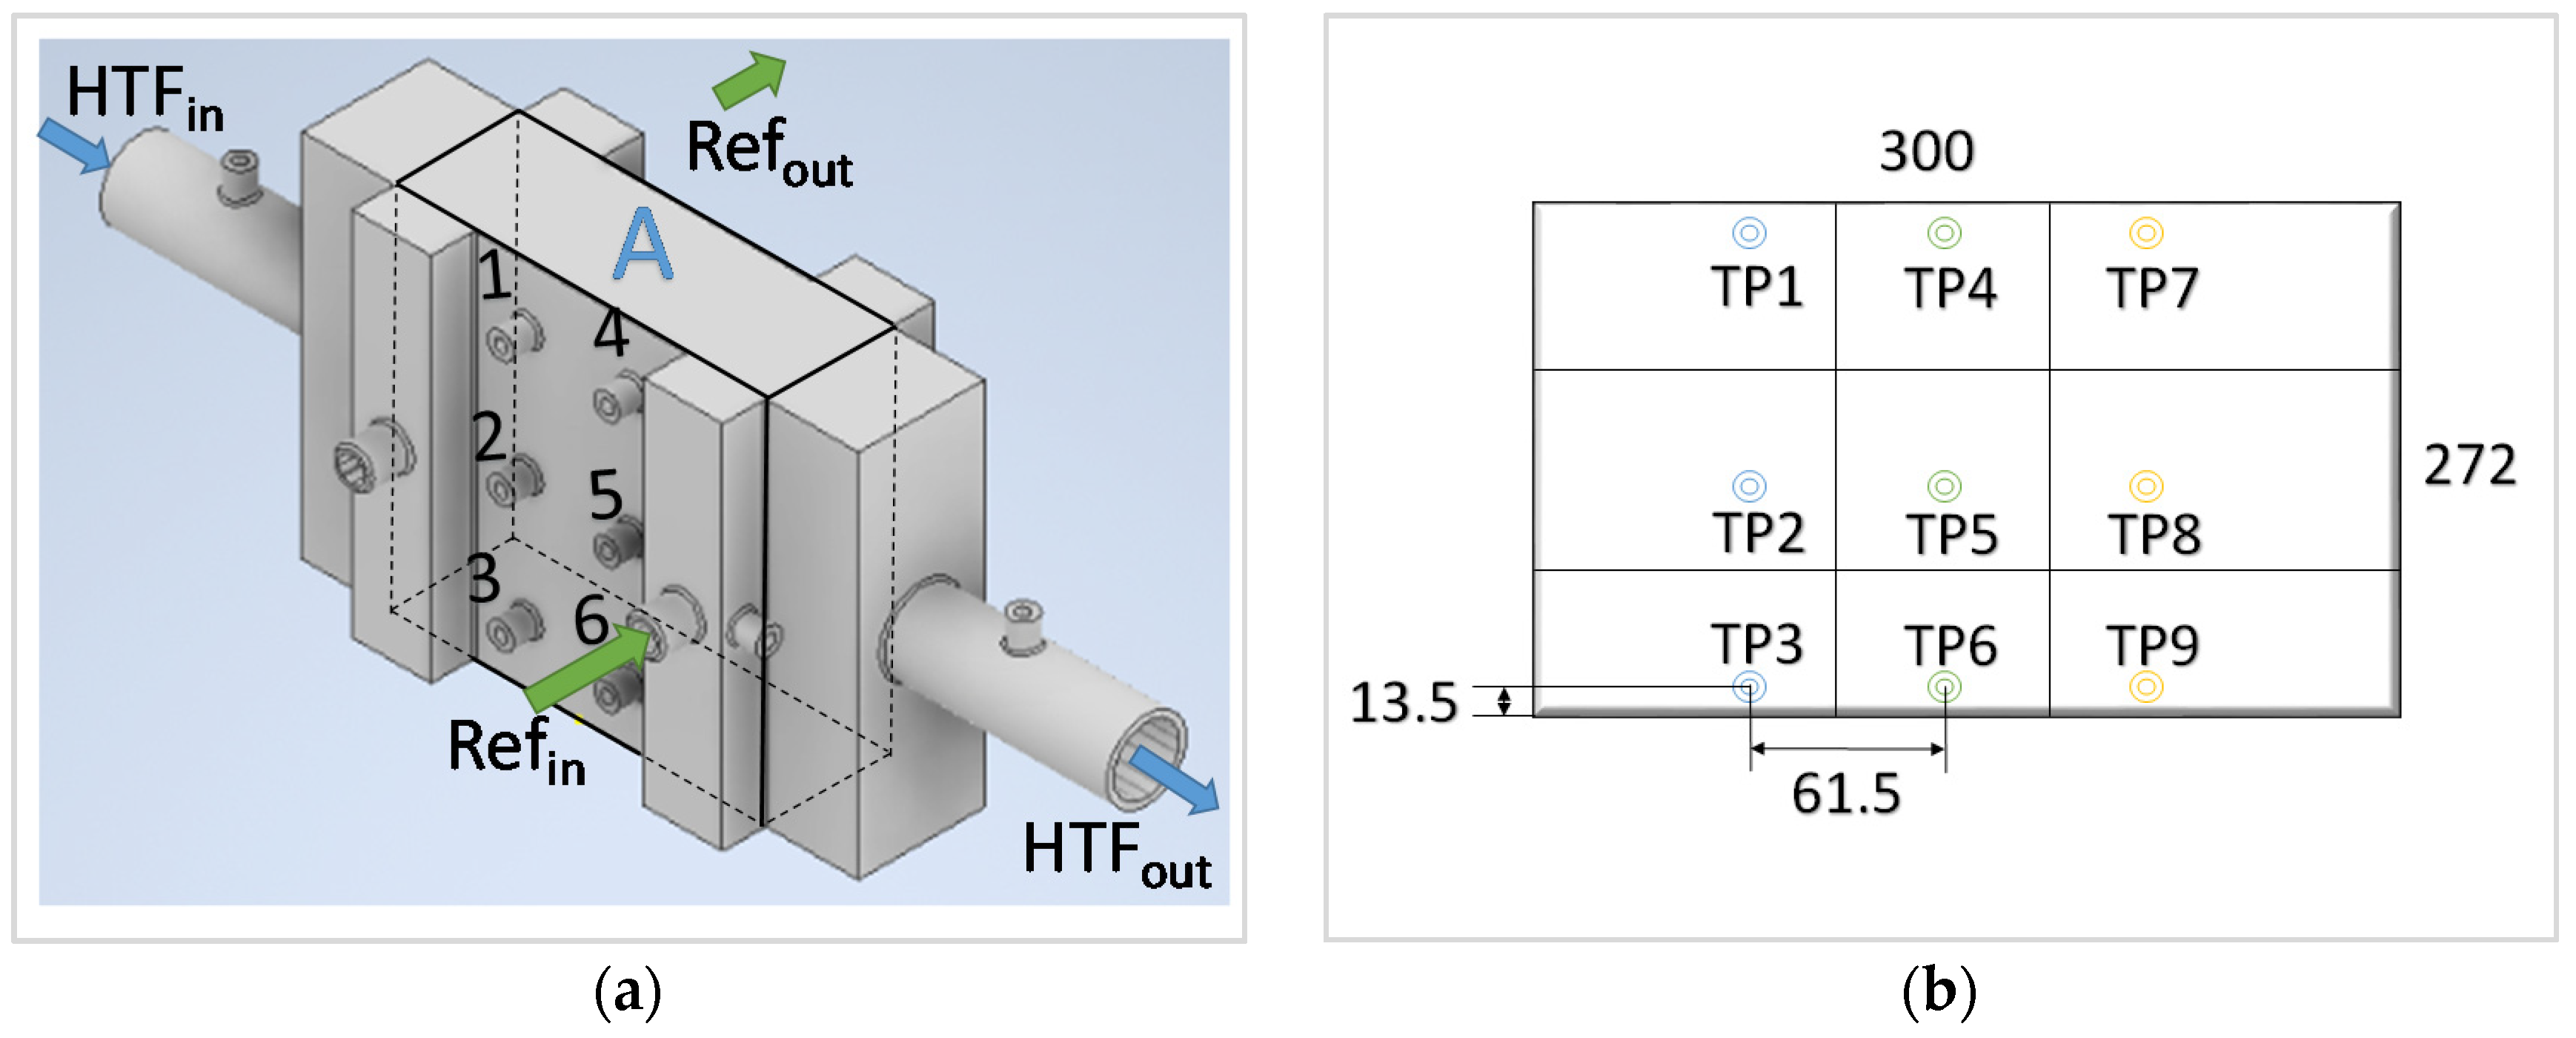
Figure 5.
Position of the sensors in the refrigerant-PCM-water heat exchanger: (a) all sensors and (b) only PCM sensors.
Figure 5.
Position of the sensors in the refrigerant-PCM-water heat exchanger: (a) all sensors and (b) only PCM sensors.
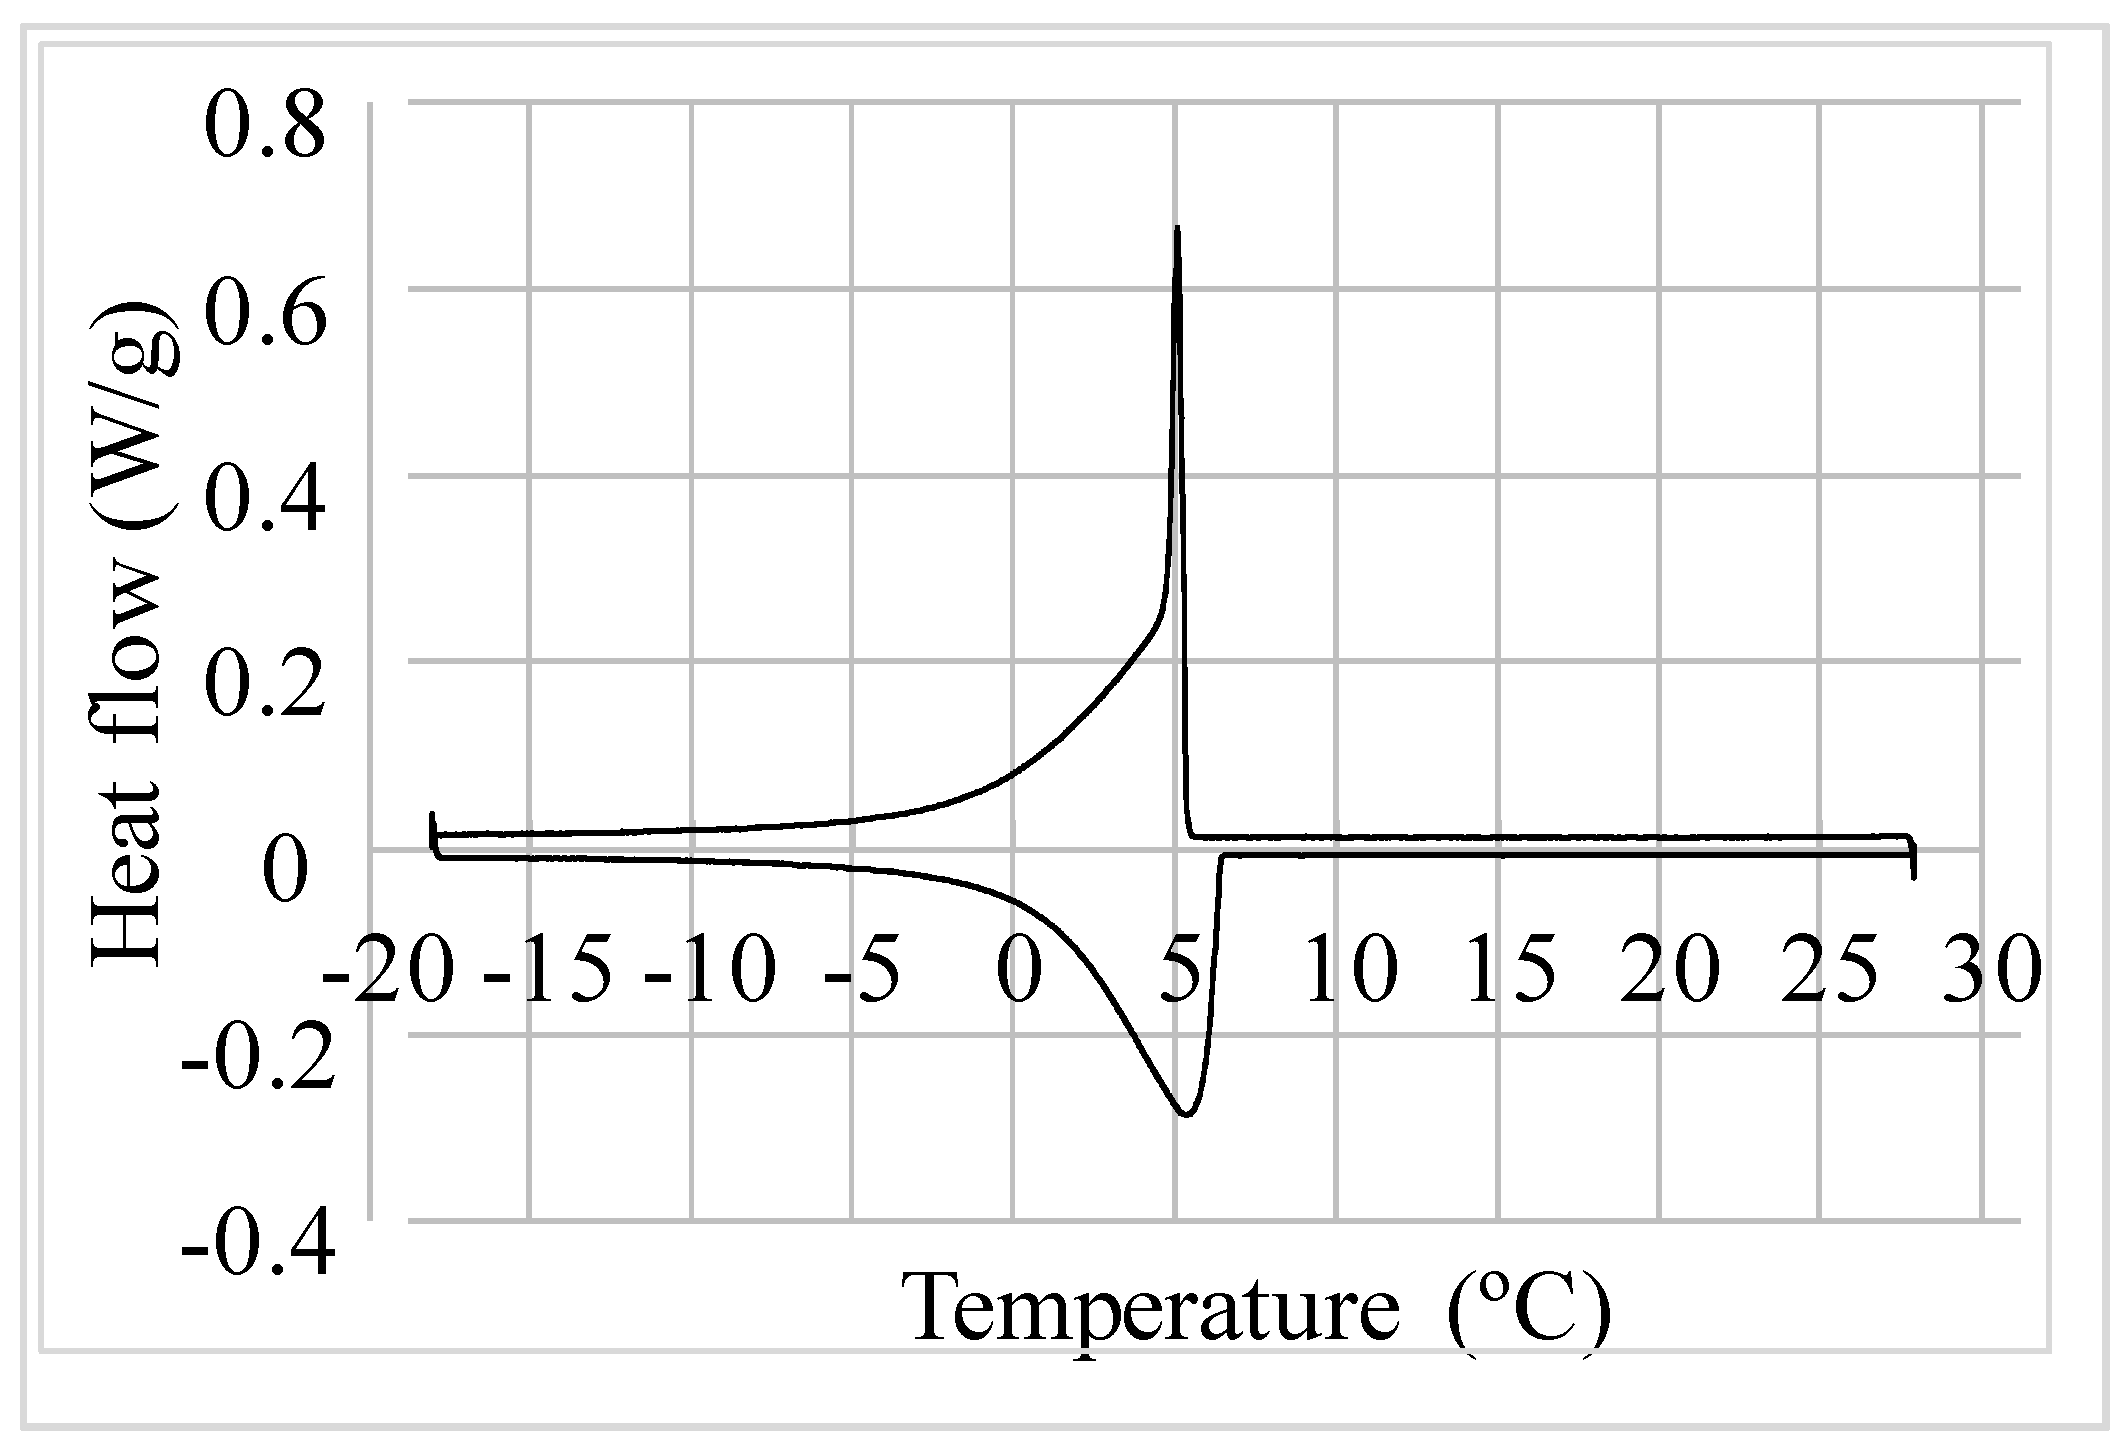
Figure 6.
DSC results of heat flow in charging and discharging of the commercial PCM RT4 (adapted from [
19]).
Figure 6.
DSC results of heat flow in charging and discharging of the commercial PCM RT4 (adapted from [
19]).
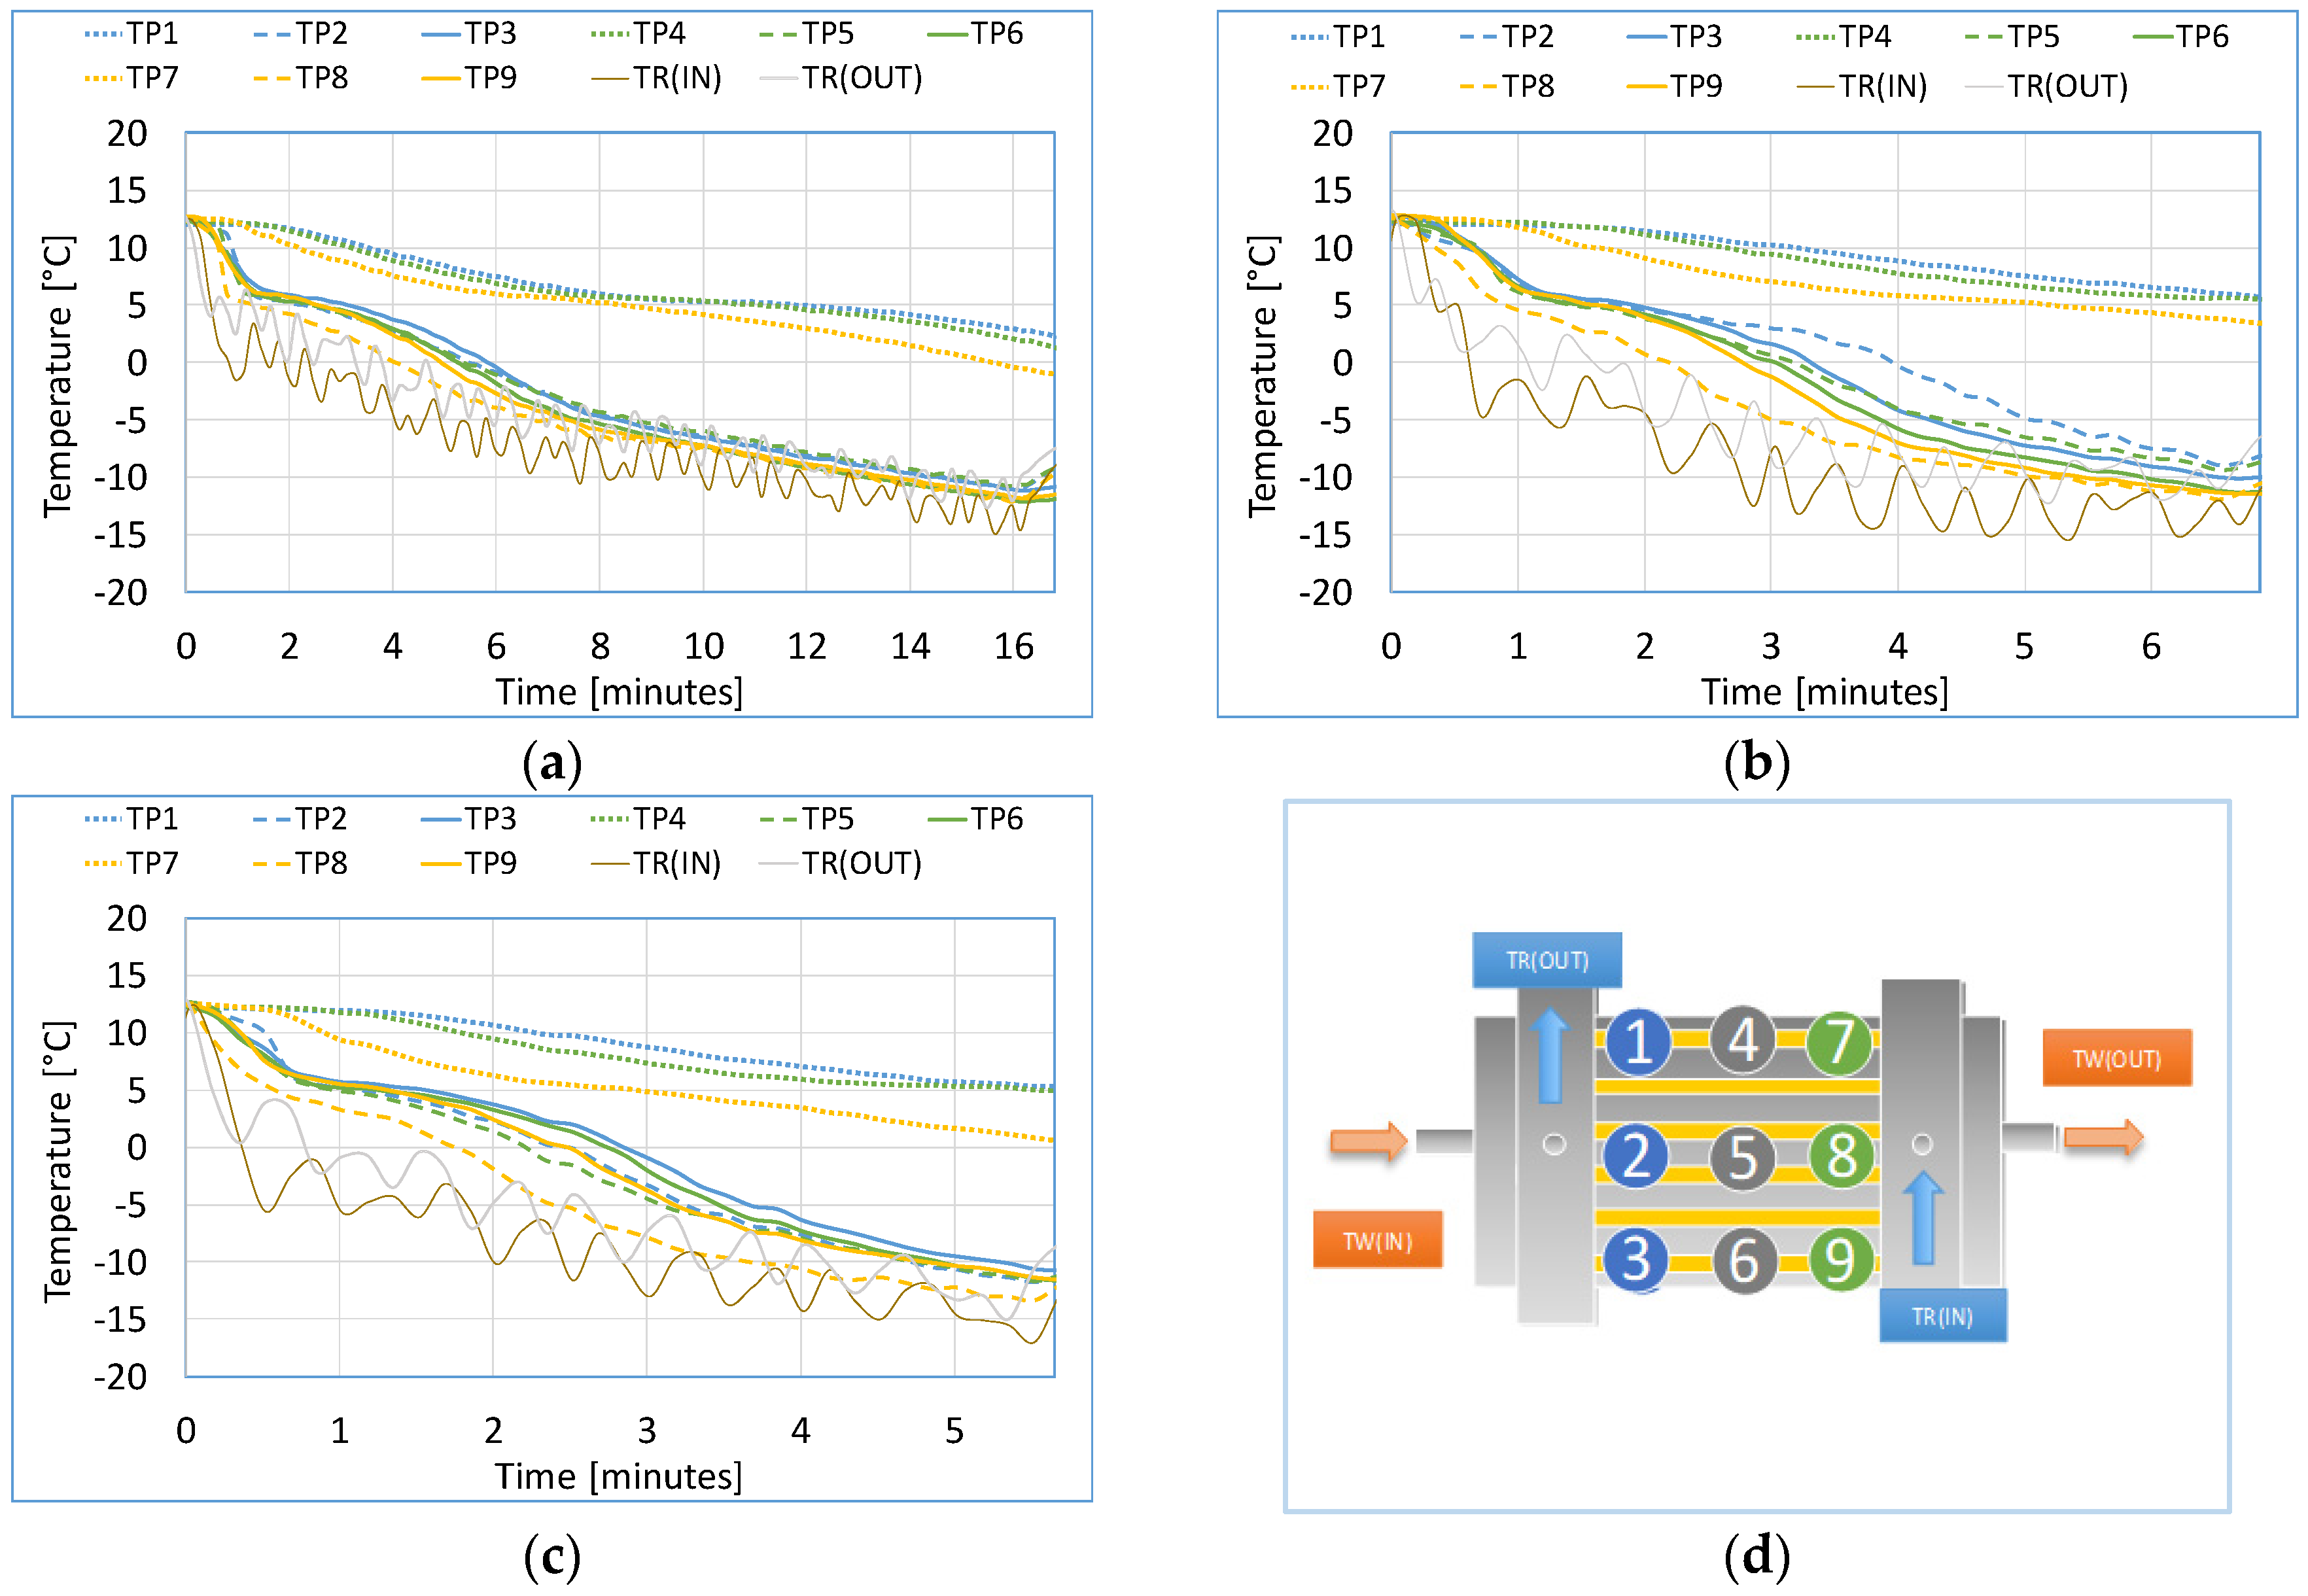
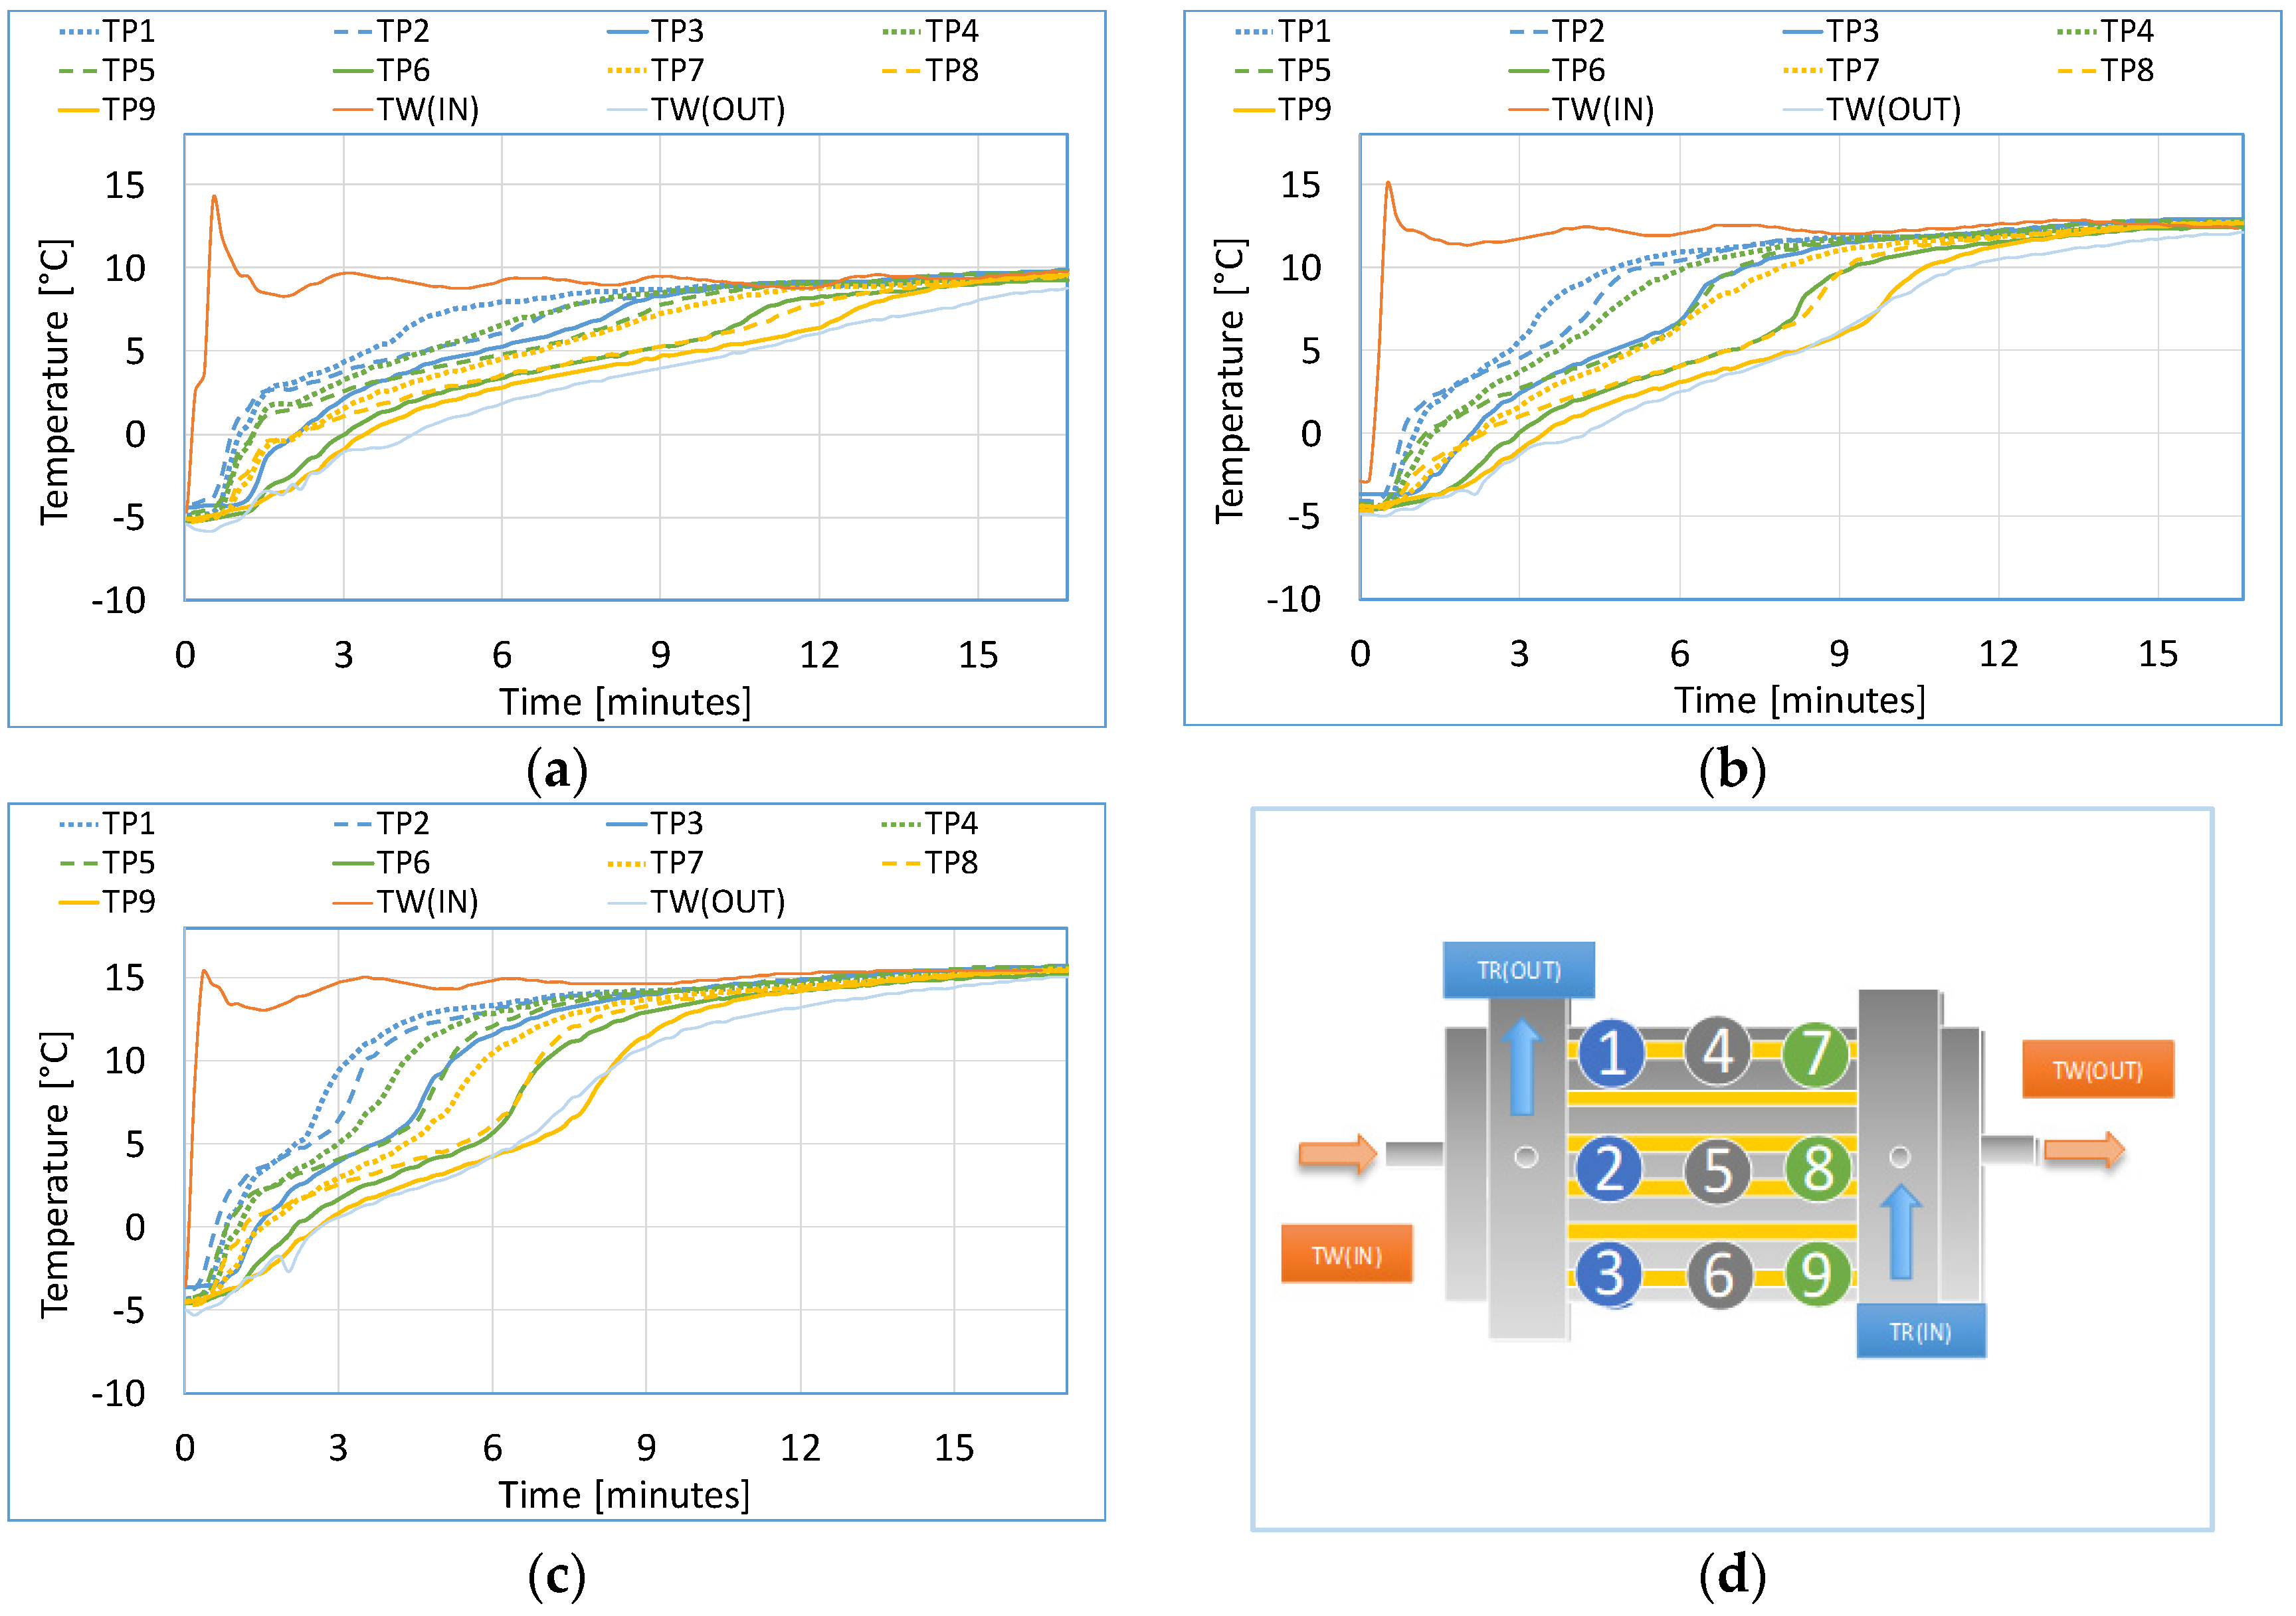
Figure 7.
Temperature profiles in Mode 1 for compressor power at (a) 30%, (b) 45%, (c) 60% and (d) position of the sensors. Dotted lines denote PCM temperature at top level, dashed lines at middle level, and solid lines at the bottom.
Figure 7.
Temperature profiles in Mode 1 for compressor power at (a) 30%, (b) 45%, (c) 60% and (d) position of the sensors. Dotted lines denote PCM temperature at top level, dashed lines at middle level, and solid lines at the bottom.
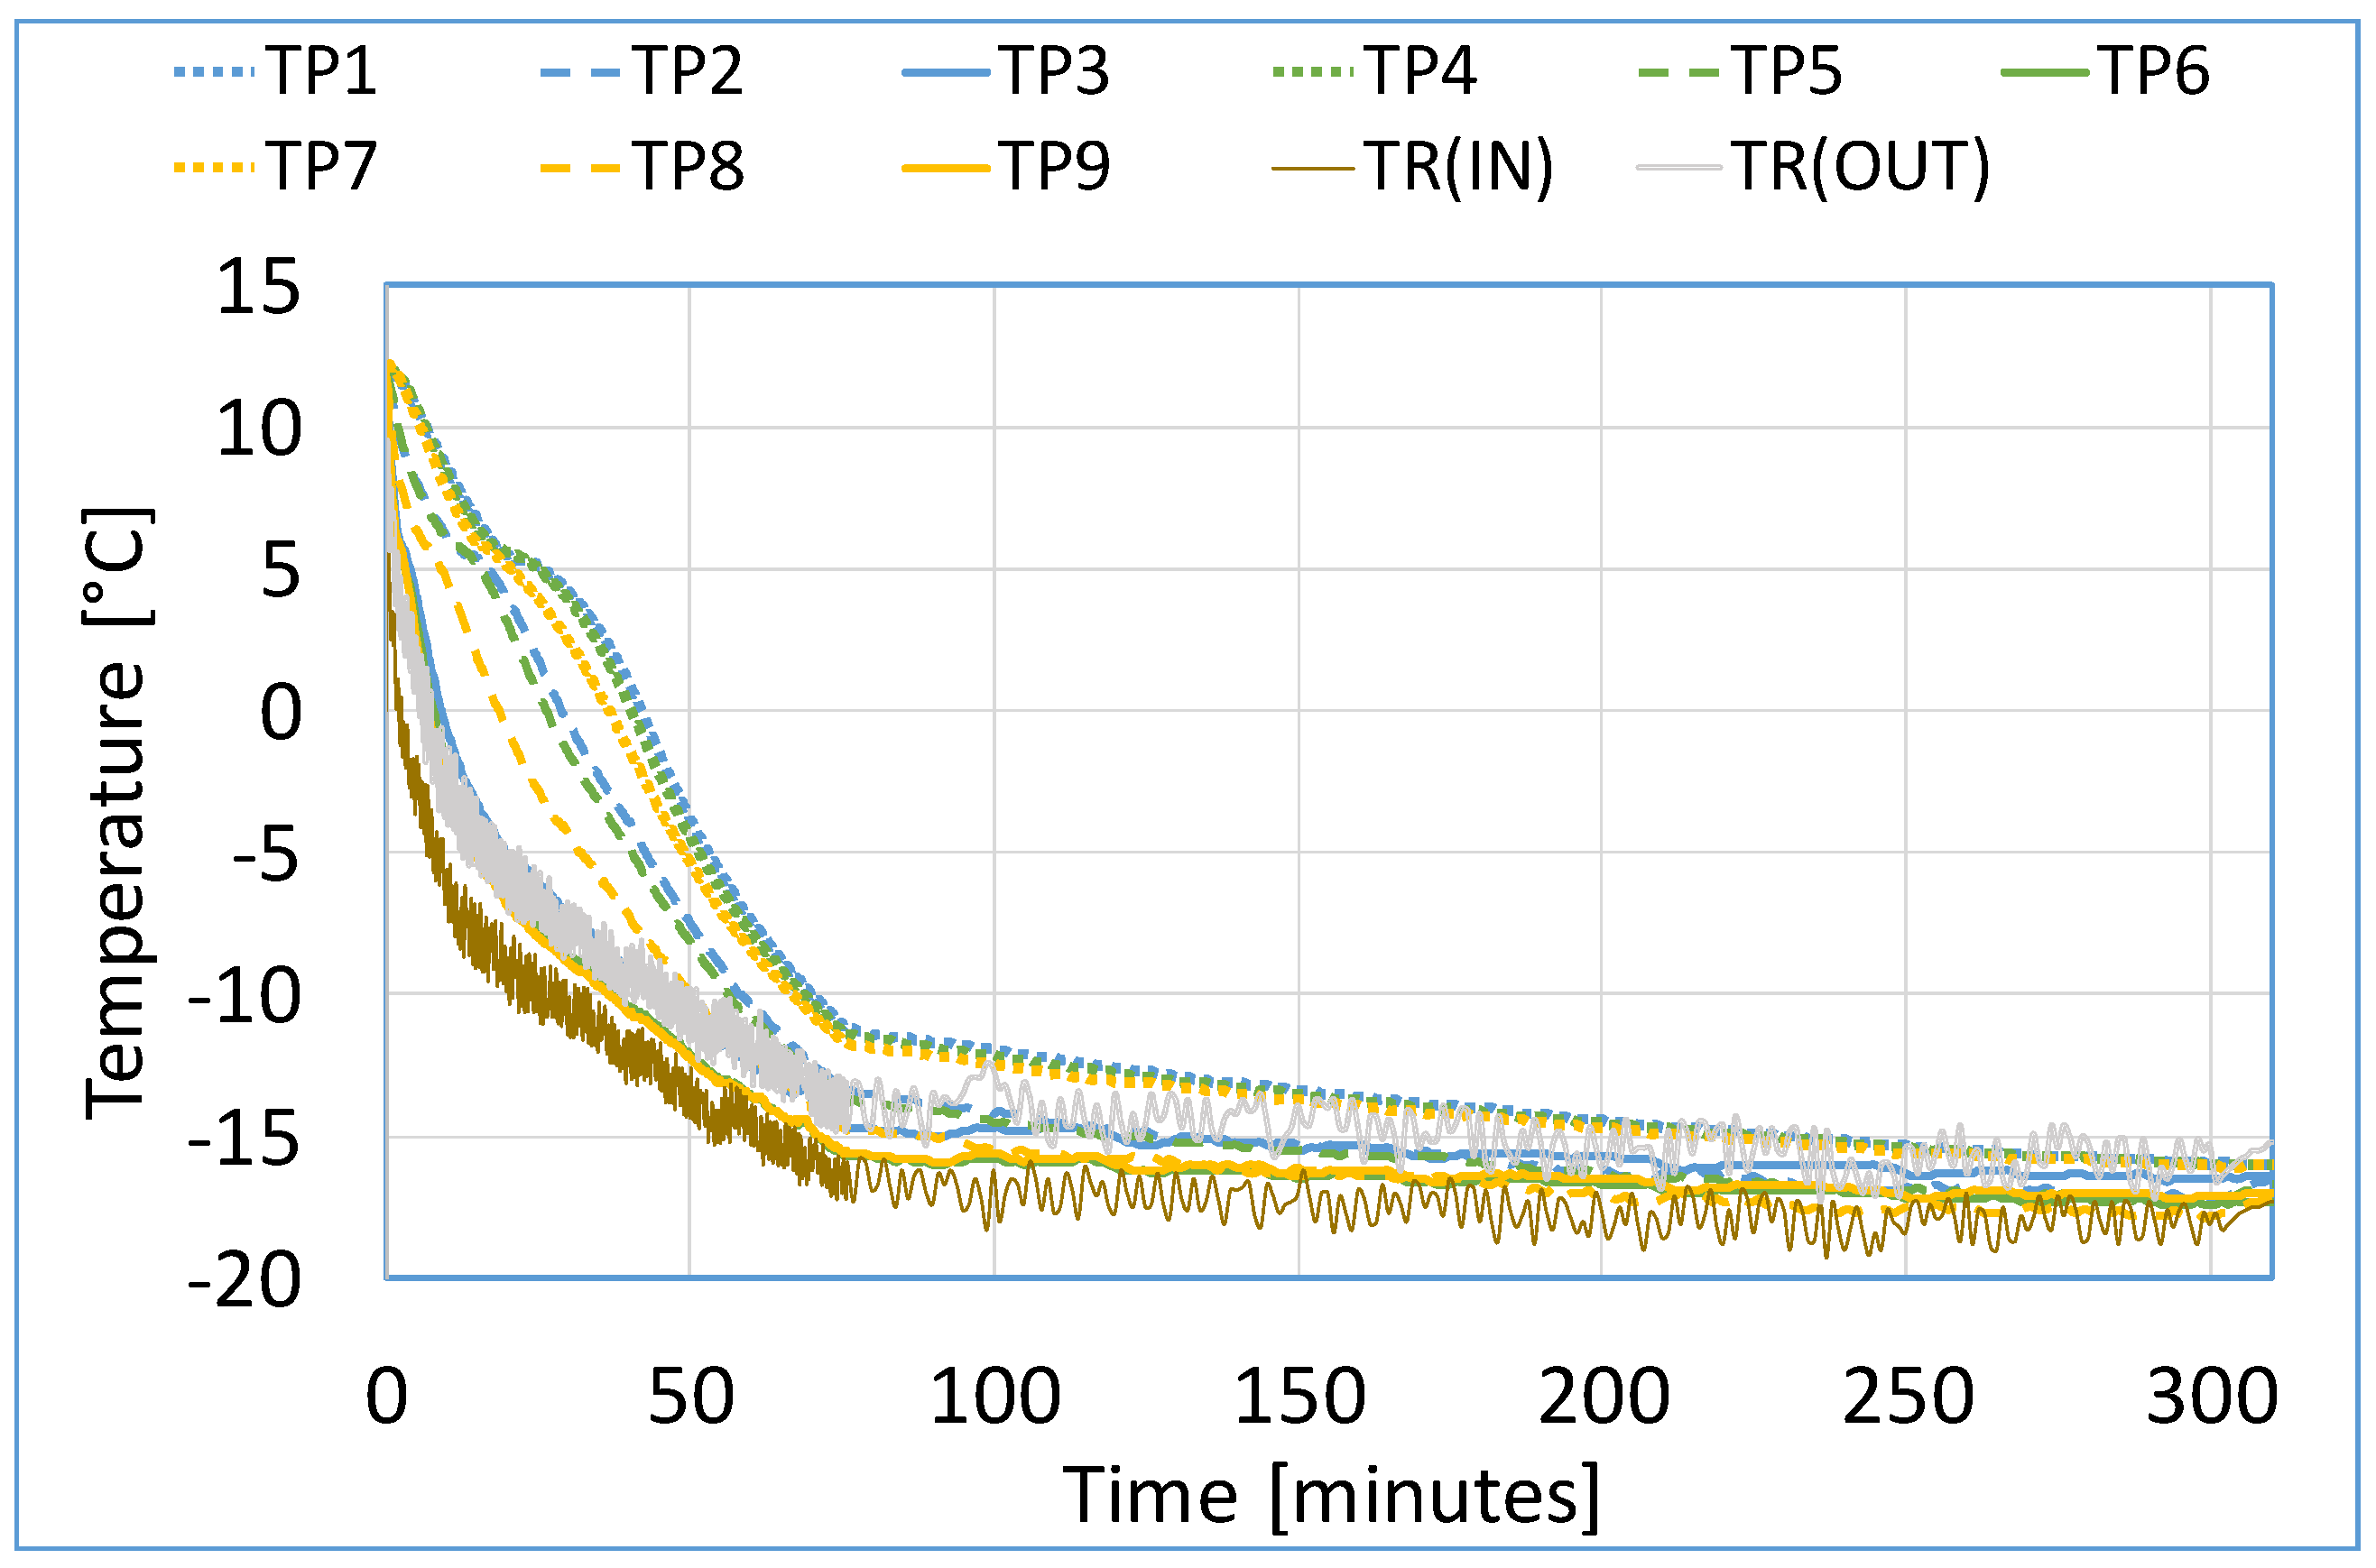
Figure 8.
PCM temperature profile for compressor power at 15% in Mode 1. Dotted lines denote PCM temperature at top level, dashed lines at middle level, and solid lines at the bottom.
Figure 8.
PCM temperature profile for compressor power at 15% in Mode 1. Dotted lines denote PCM temperature at top level, dashed lines at middle level, and solid lines at the bottom.
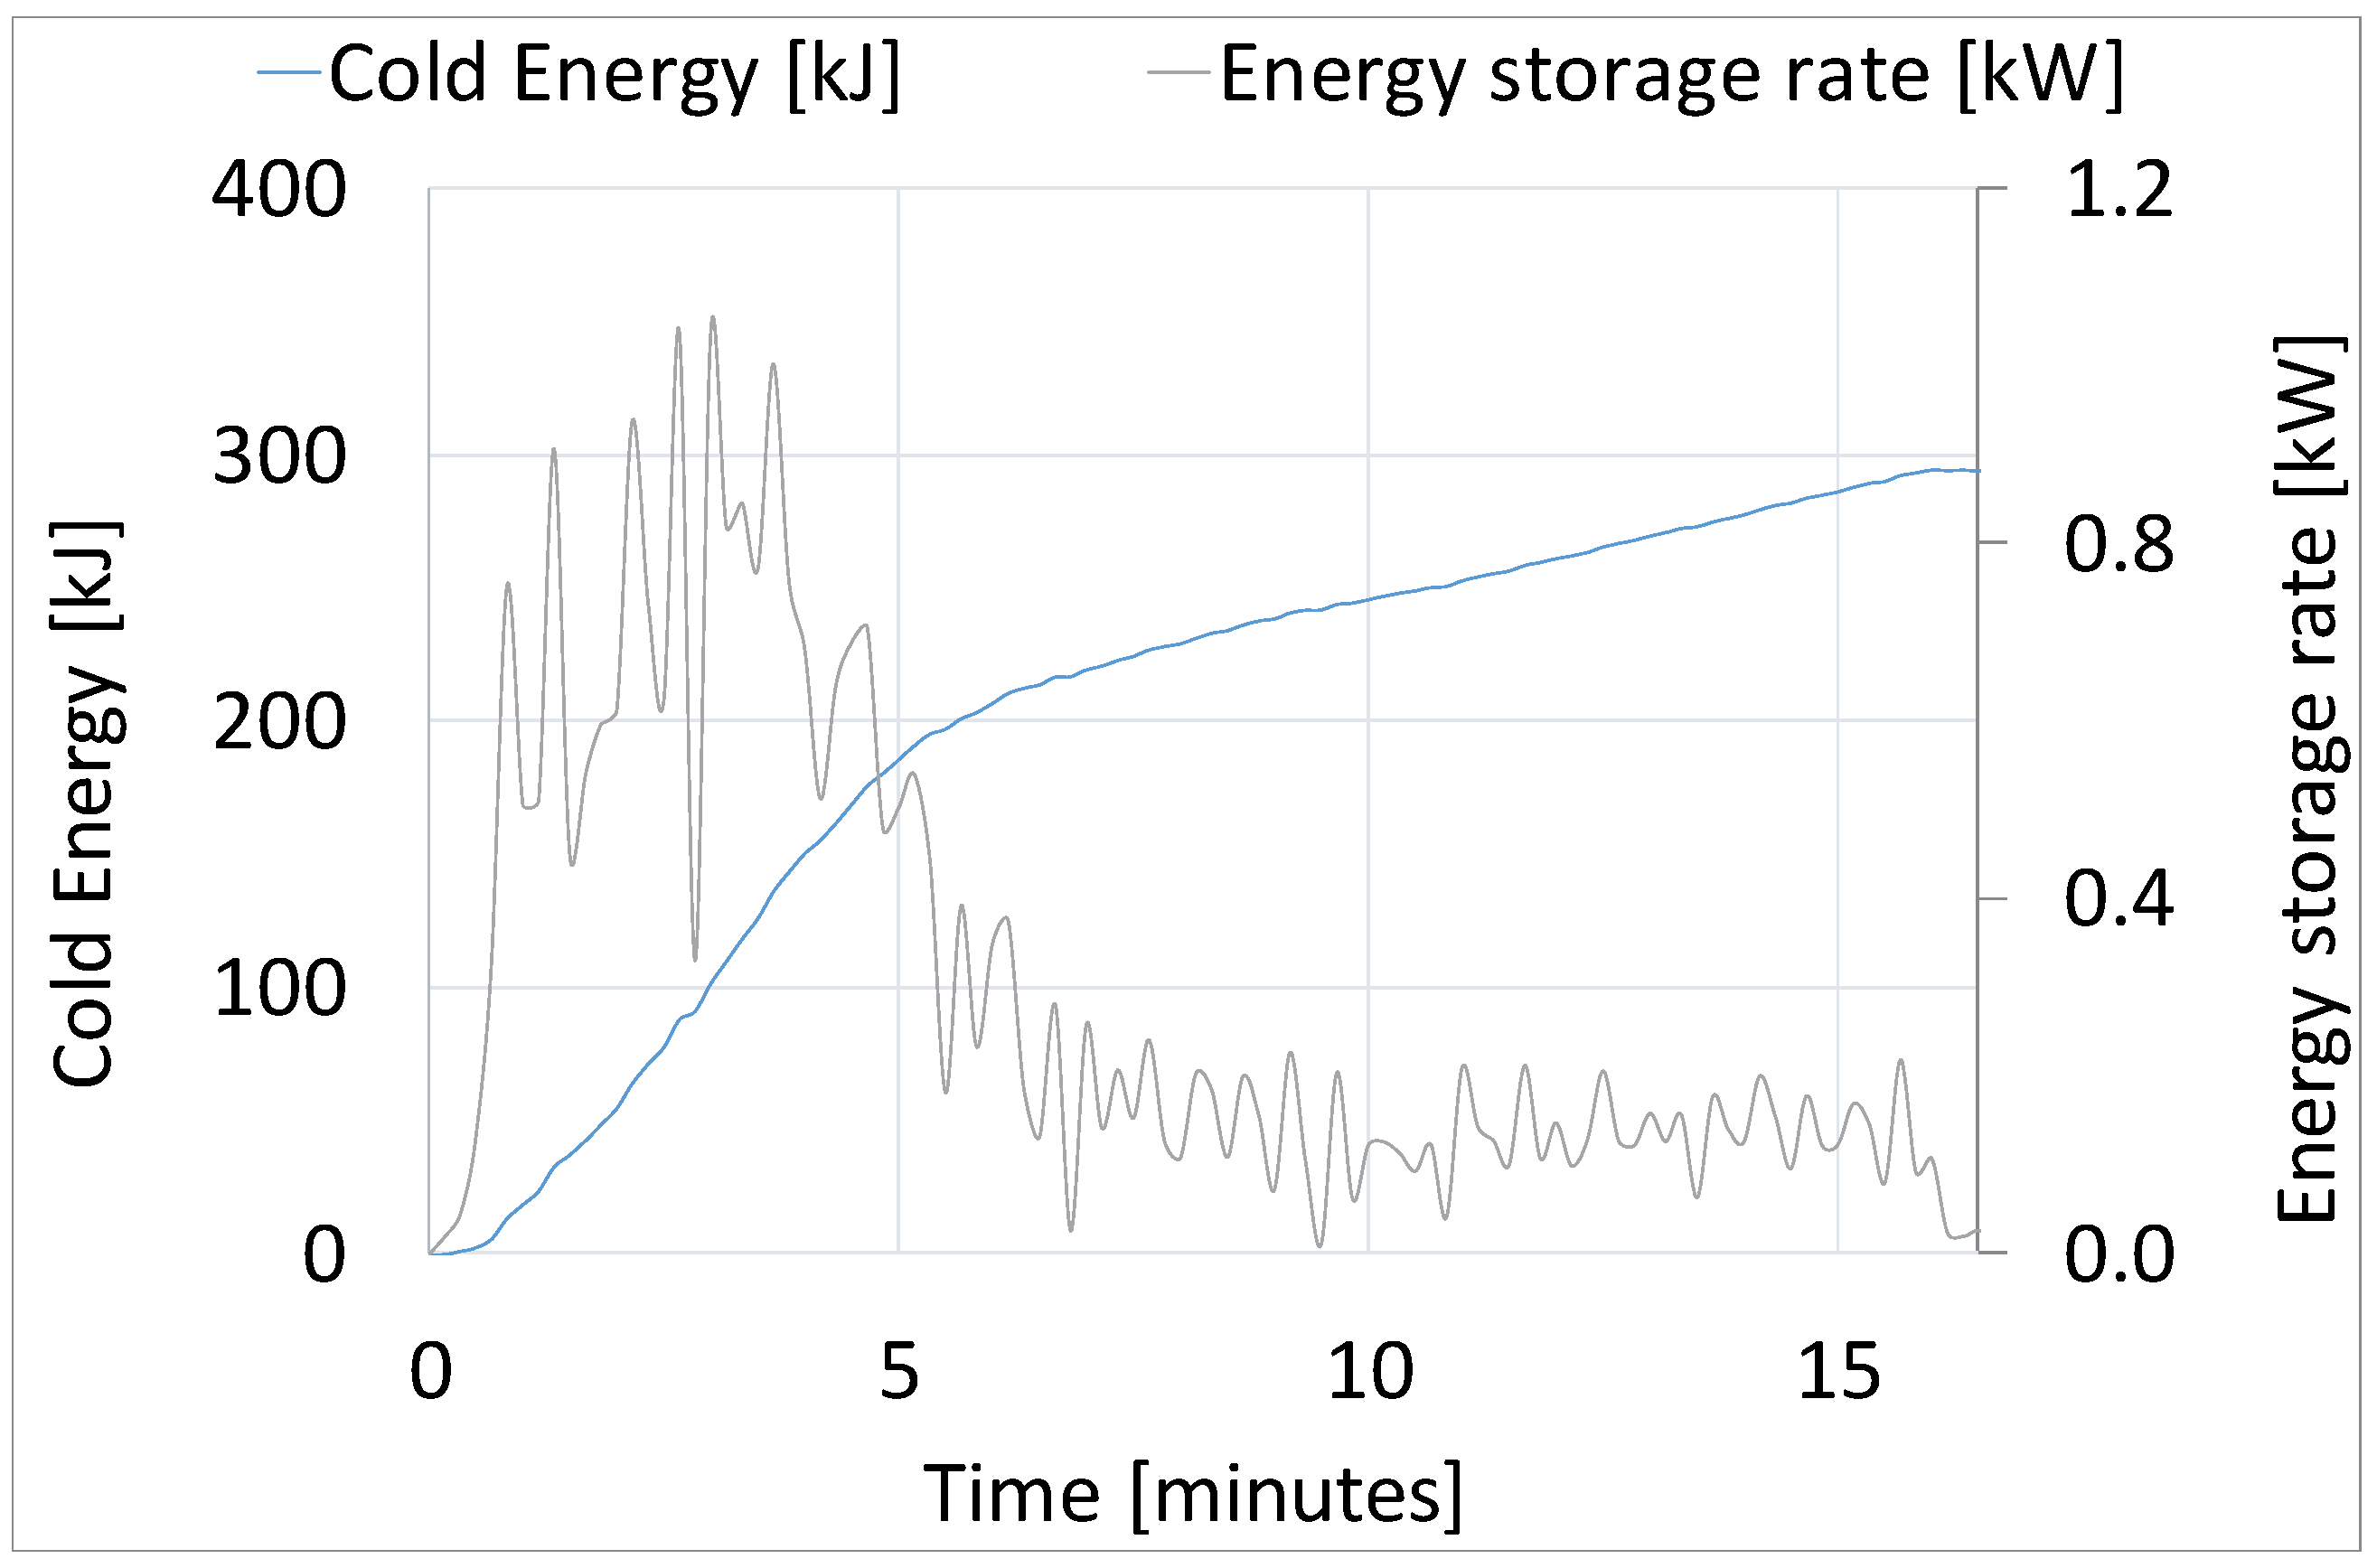
Figure 9.
Cold energy and energy storage rate against time, for PCM charging at 30% compressor power.
Figure 9.
Cold energy and energy storage rate against time, for PCM charging at 30% compressor power.
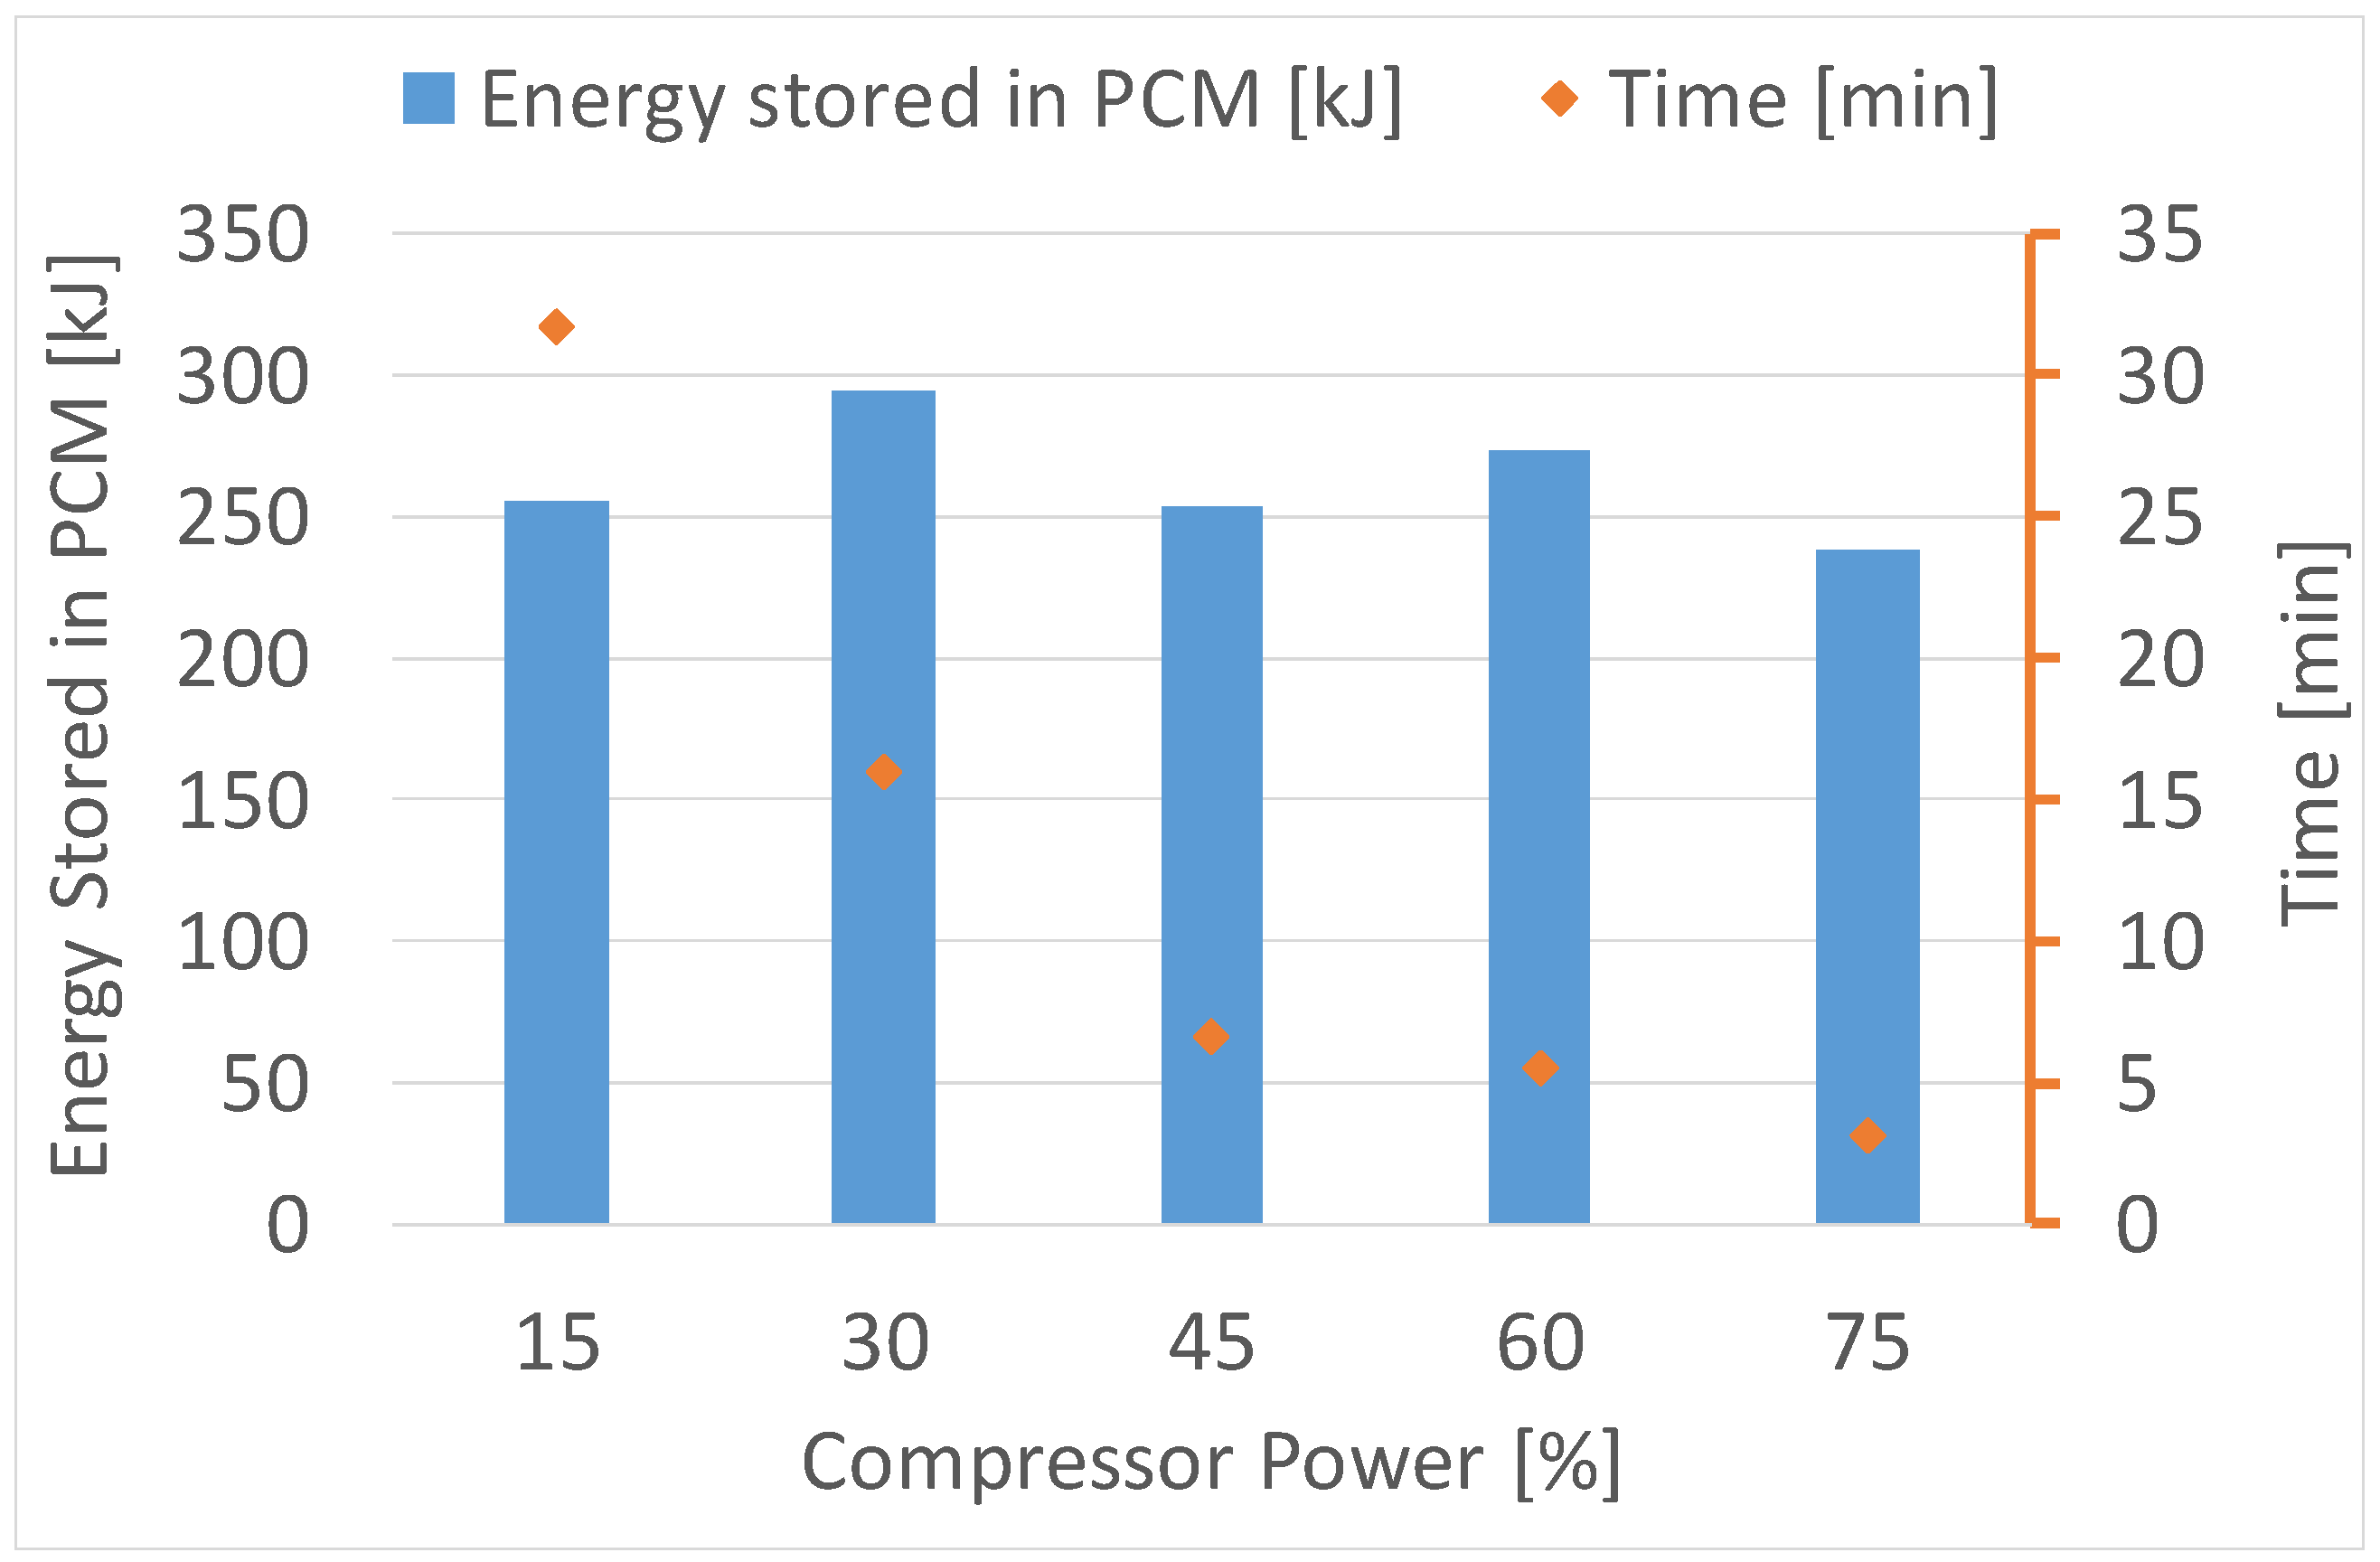
Figure 10.
Influence of compressor power on total cold energy stored in the PCM.
Figure 10.
Influence of compressor power on total cold energy stored in the PCM.
Figure 11.
PCM temperature profile during discharging at 100 L·h−1 with HTF inlet temperature at (a) 9 °C, (b) 12 °C, and (c) 15 °C and (d) position of the sensors. Dotted lines denote PCM temperature at top level, dashed lines at middle level, and solid lines at the bottom.
Figure 11.
PCM temperature profile during discharging at 100 L·h−1 with HTF inlet temperature at (a) 9 °C, (b) 12 °C, and (c) 15 °C and (d) position of the sensors. Dotted lines denote PCM temperature at top level, dashed lines at middle level, and solid lines at the bottom.
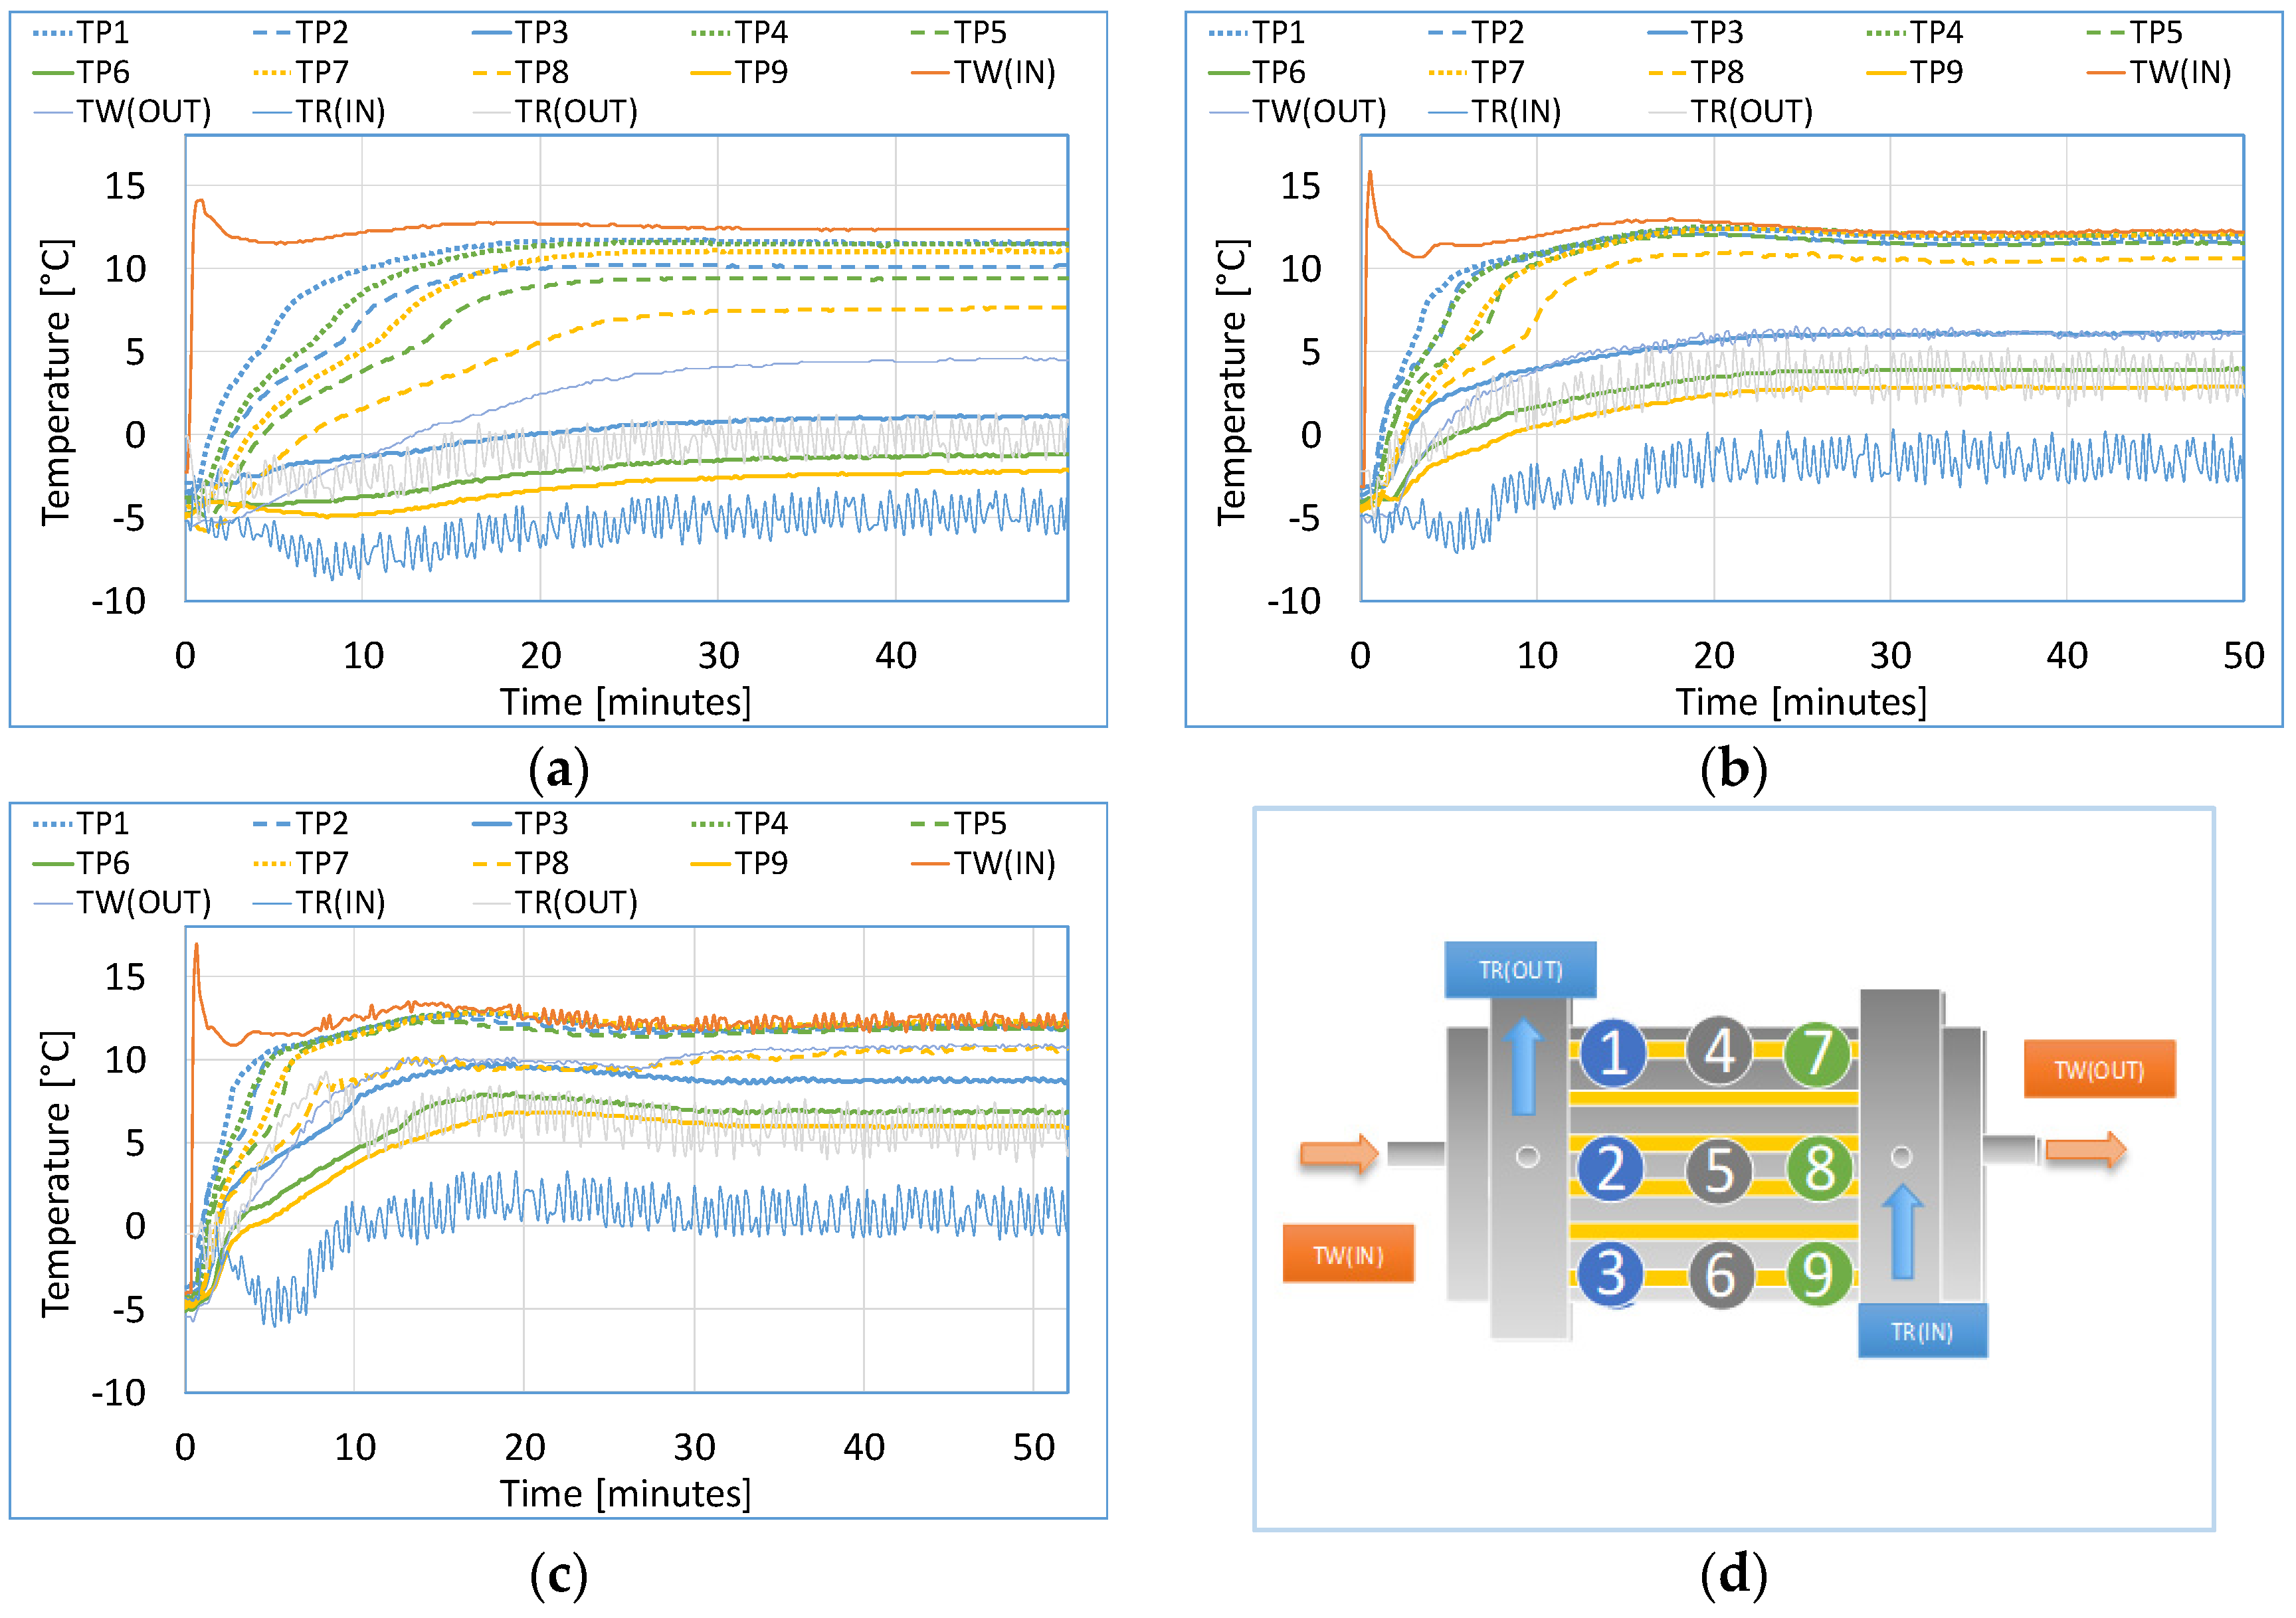
Figure 12.
PCM temperature profile during discharging with HTF inlet temperature at 12 °C and at a flow rate of (a) 50 L·h−1, (b) 100 L·h−1, (c) 150 L·h−1 and (d) position of the sensors. Dotted lines denote PCM temperature at top level, dashed lines at middle level, and solid lines at the bottom.
Figure 12.
PCM temperature profile during discharging with HTF inlet temperature at 12 °C and at a flow rate of (a) 50 L·h−1, (b) 100 L·h−1, (c) 150 L·h−1 and (d) position of the sensors. Dotted lines denote PCM temperature at top level, dashed lines at middle level, and solid lines at the bottom.
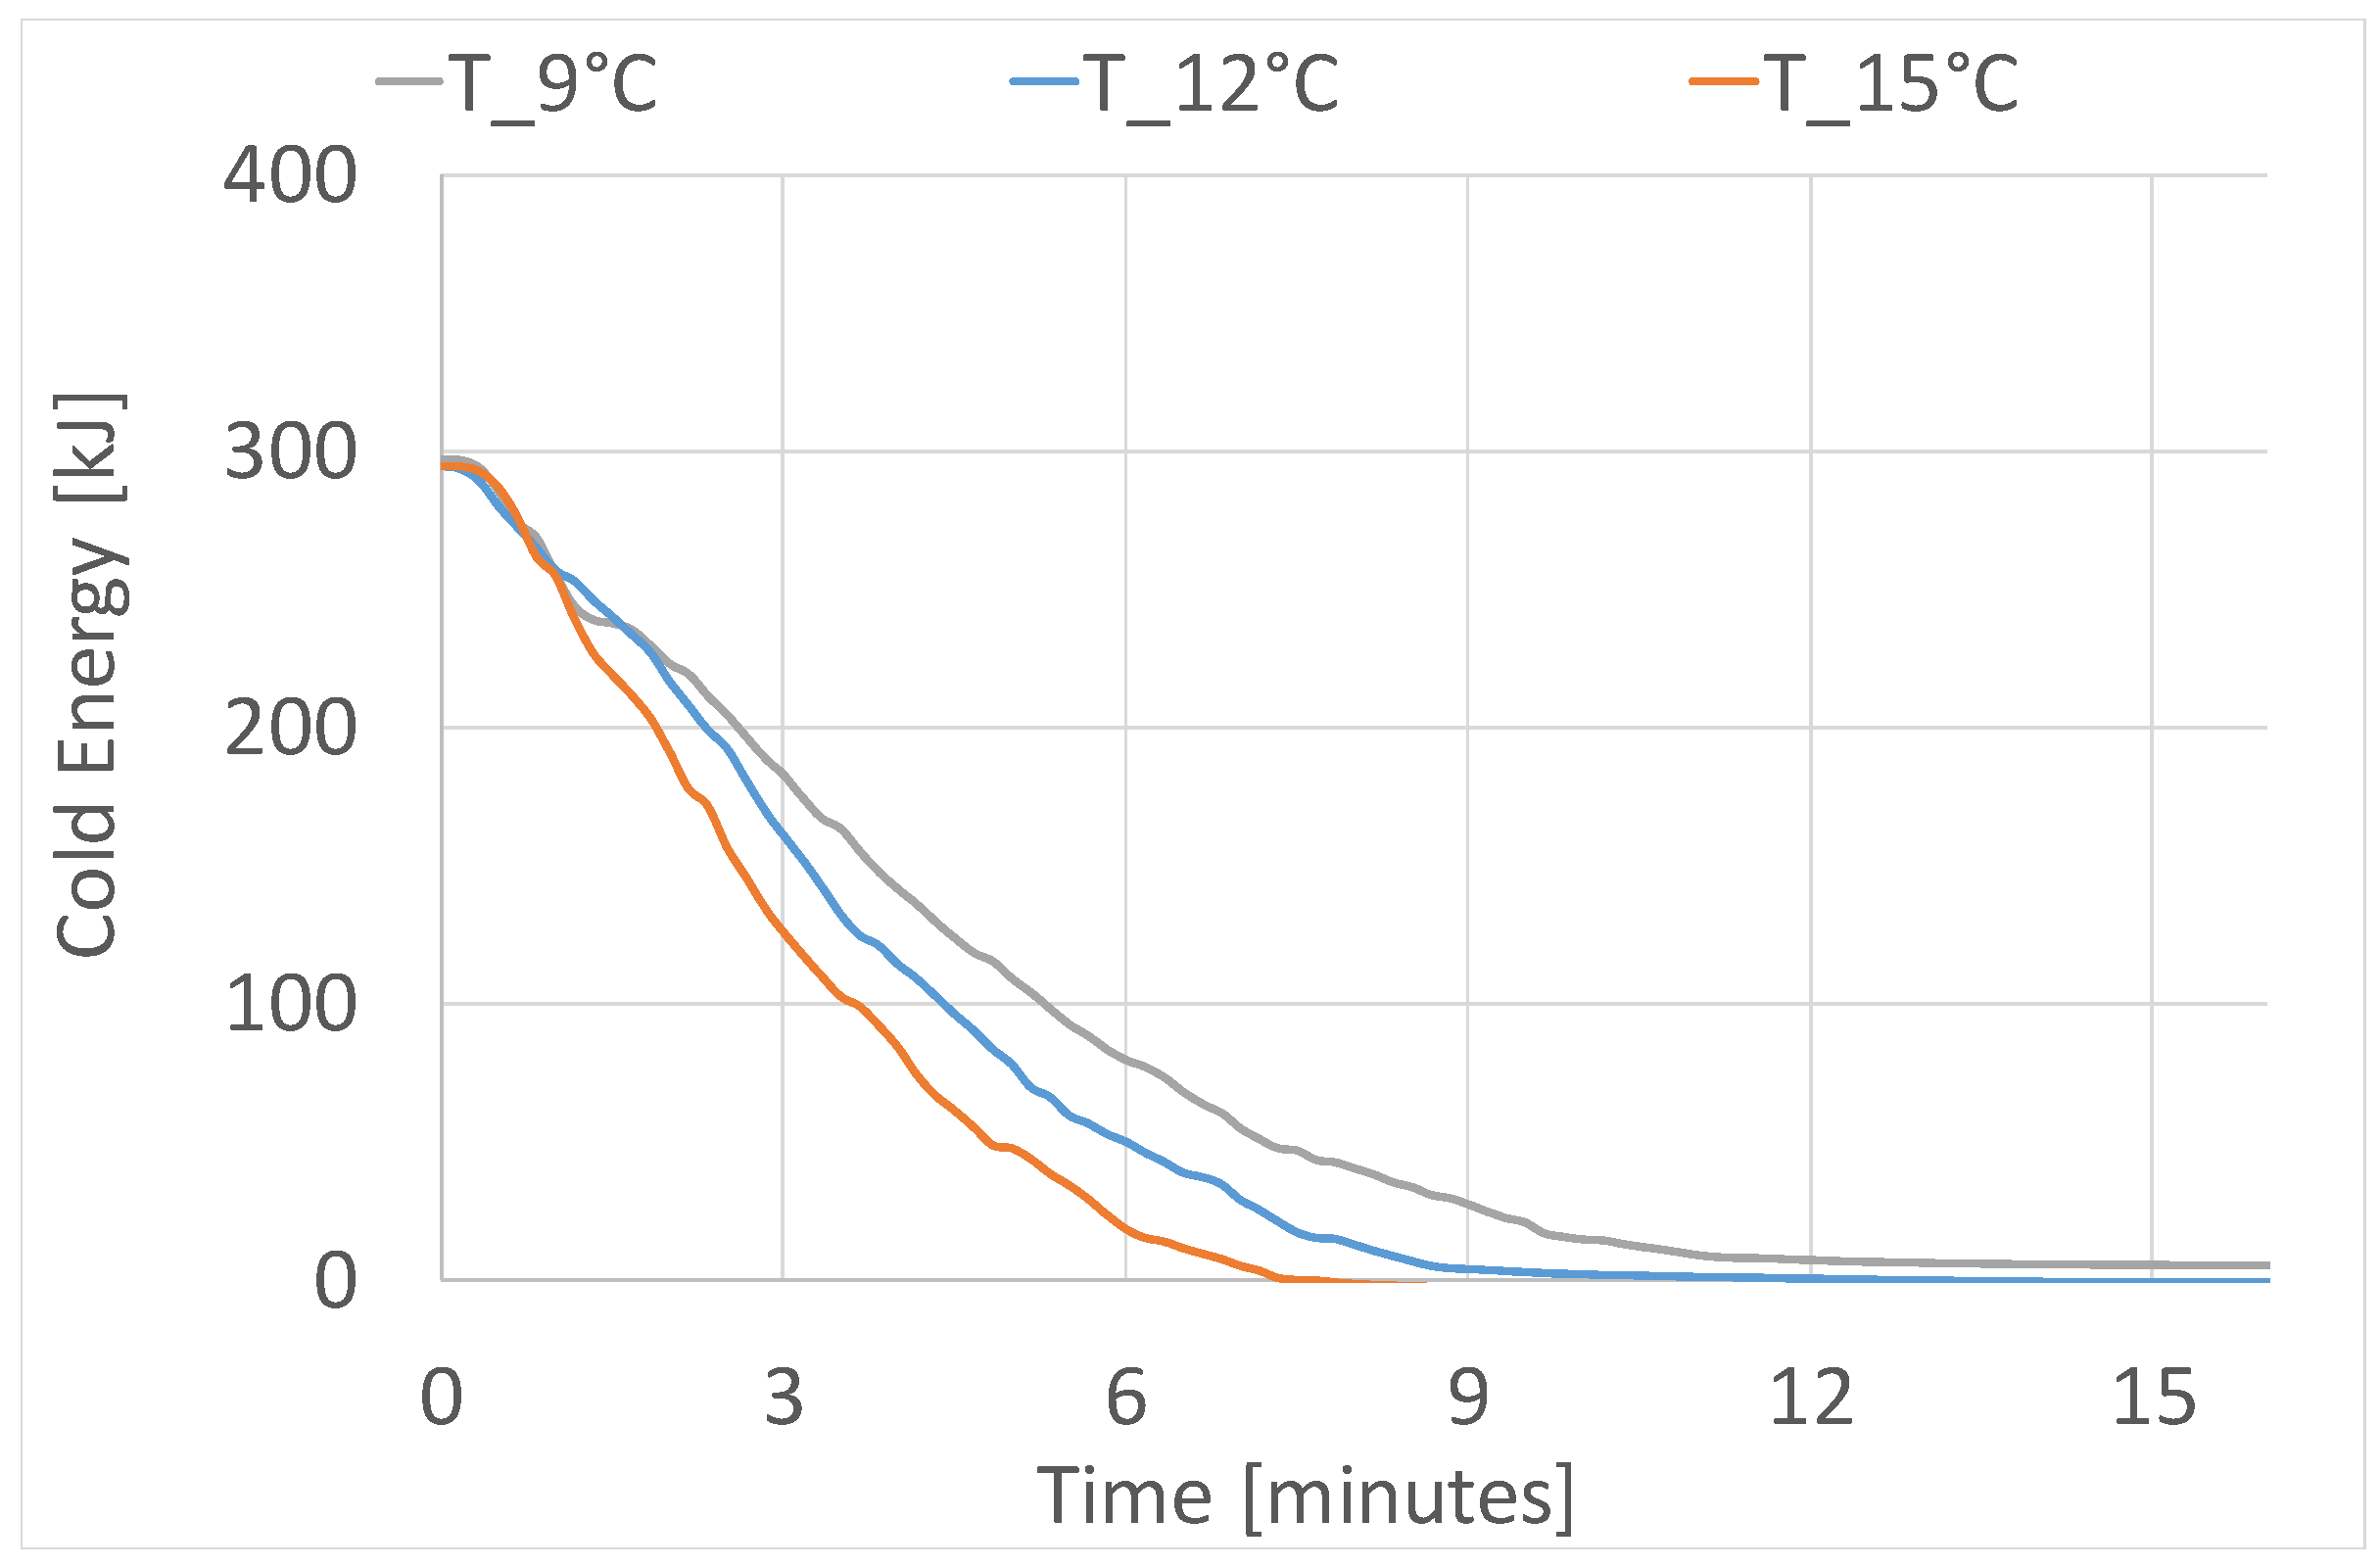
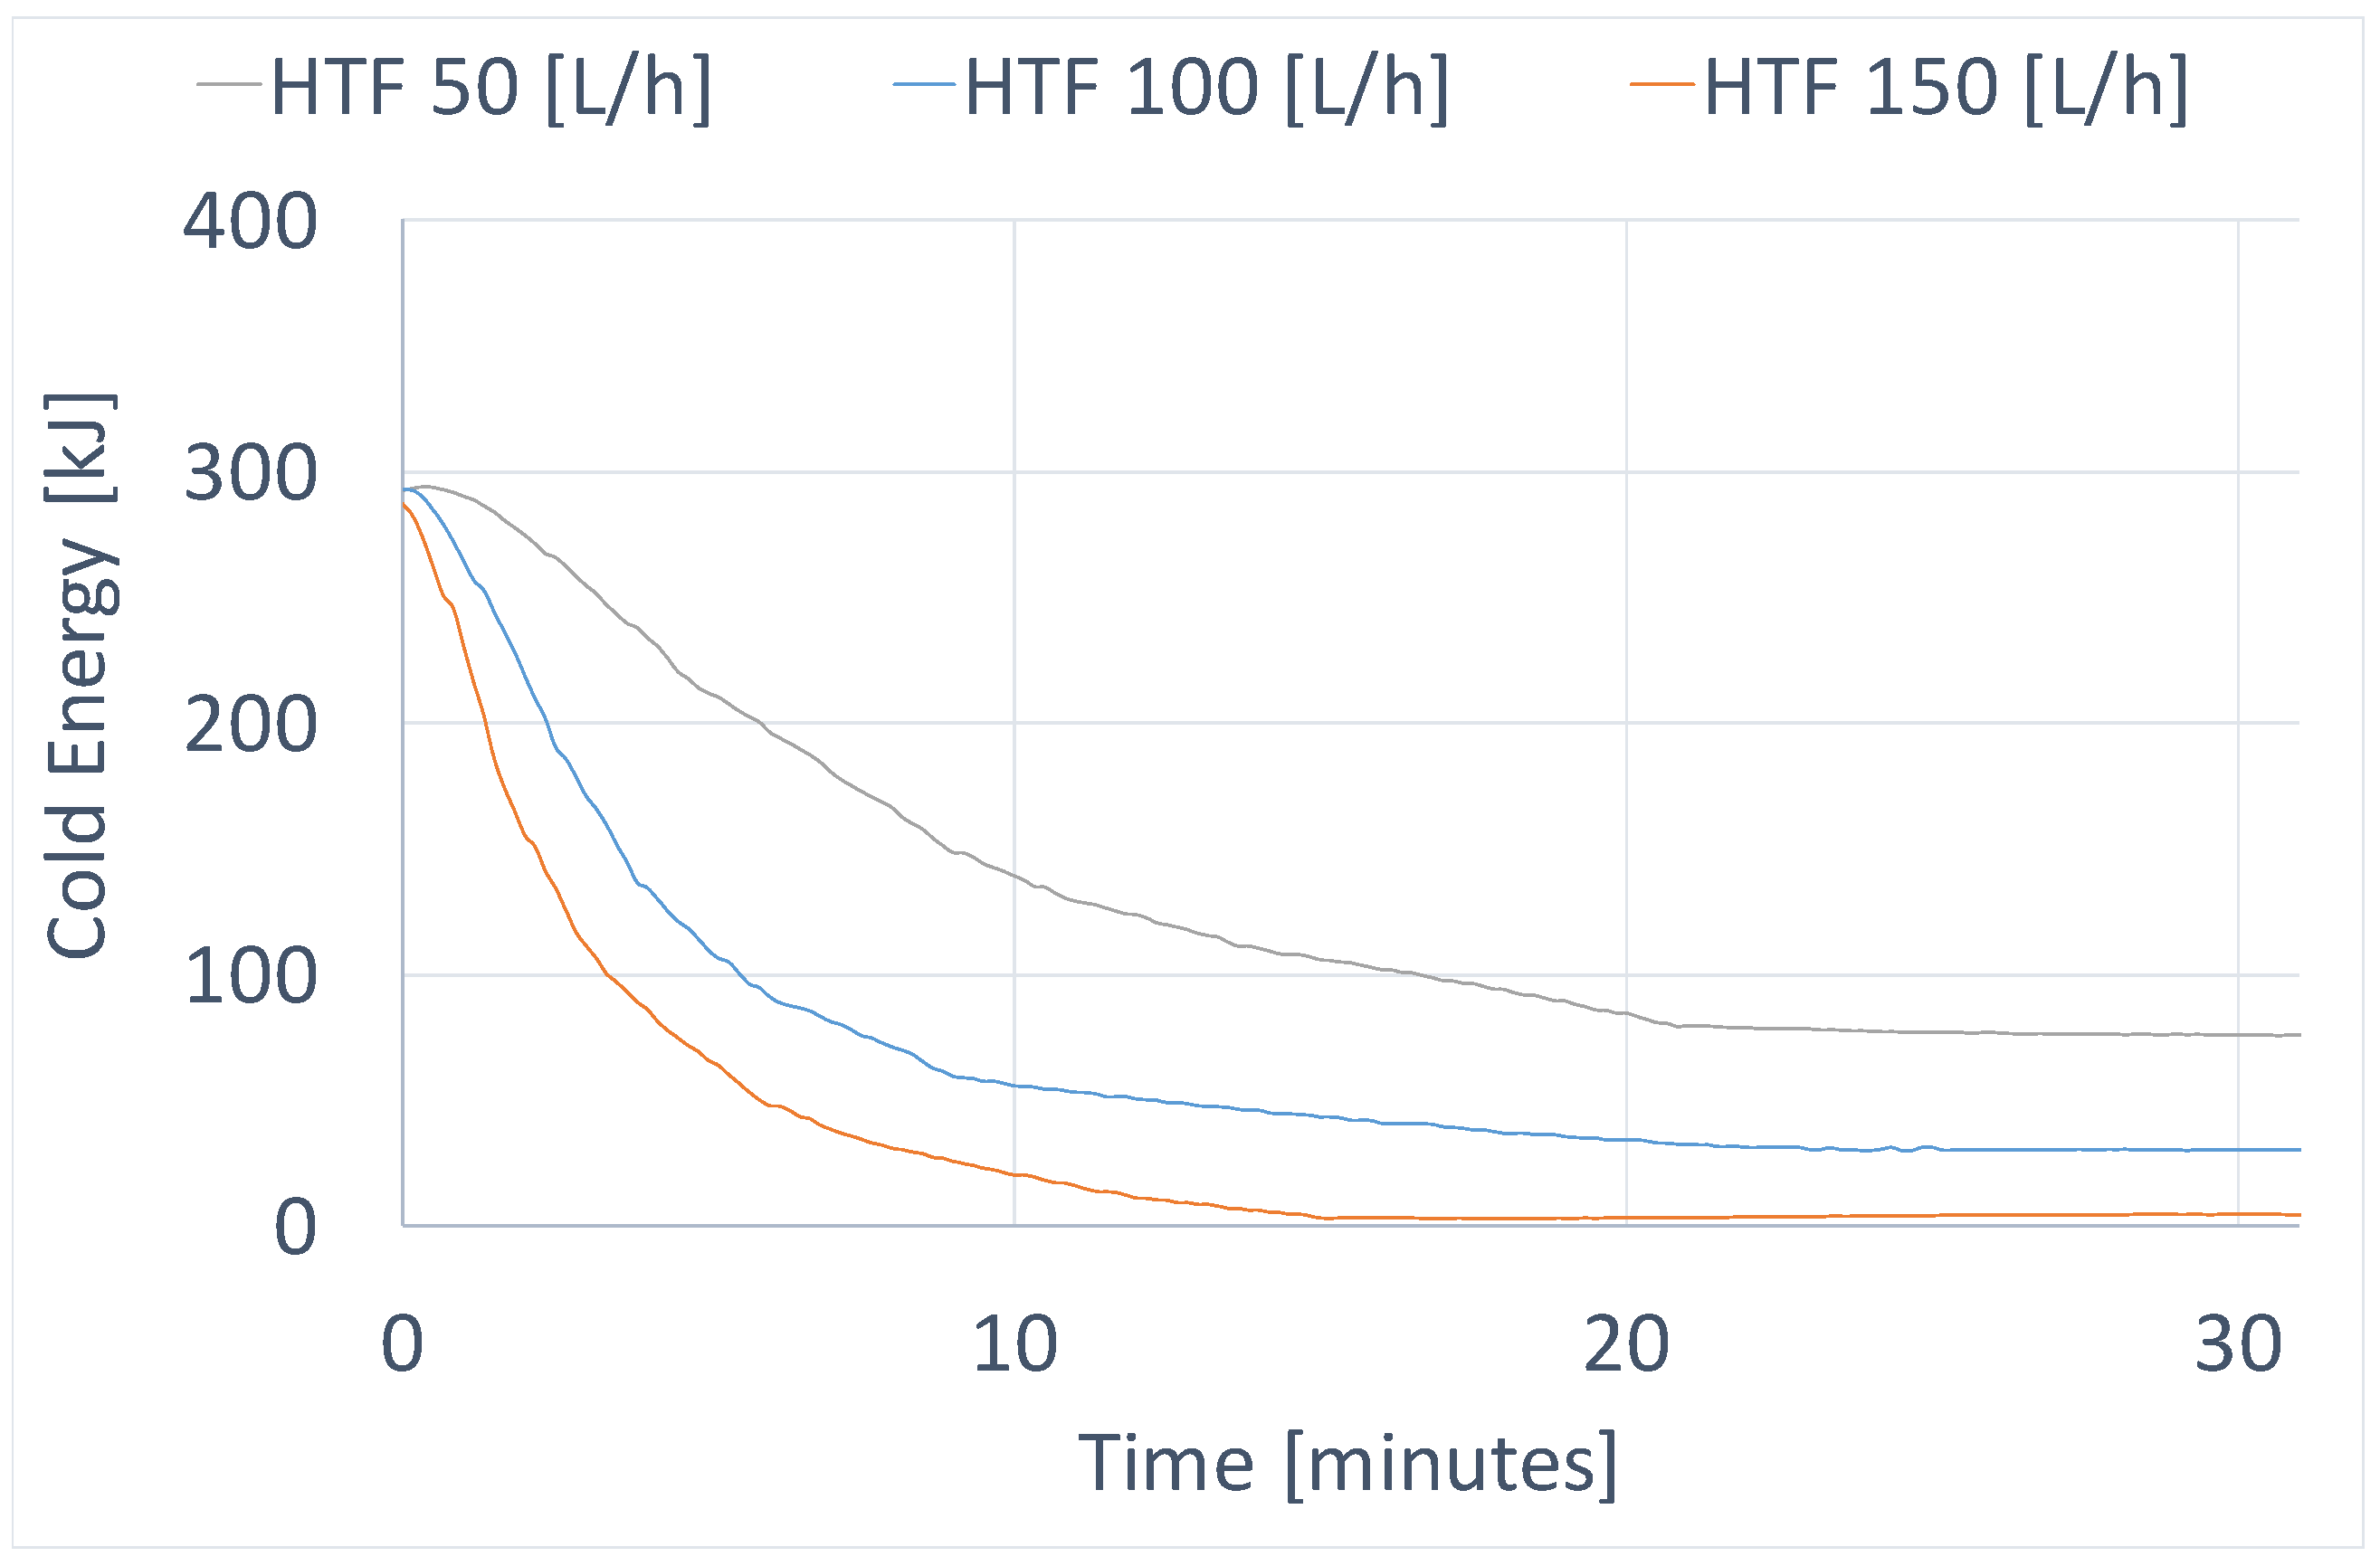
Figure 13.
Influence of HTF inlet temperature on PCM instantaneous cold energy during discharging at constant HTF flow rate of 100 L·h−1.
Figure 13.
Influence of HTF inlet temperature on PCM instantaneous cold energy during discharging at constant HTF flow rate of 100 L·h−1.
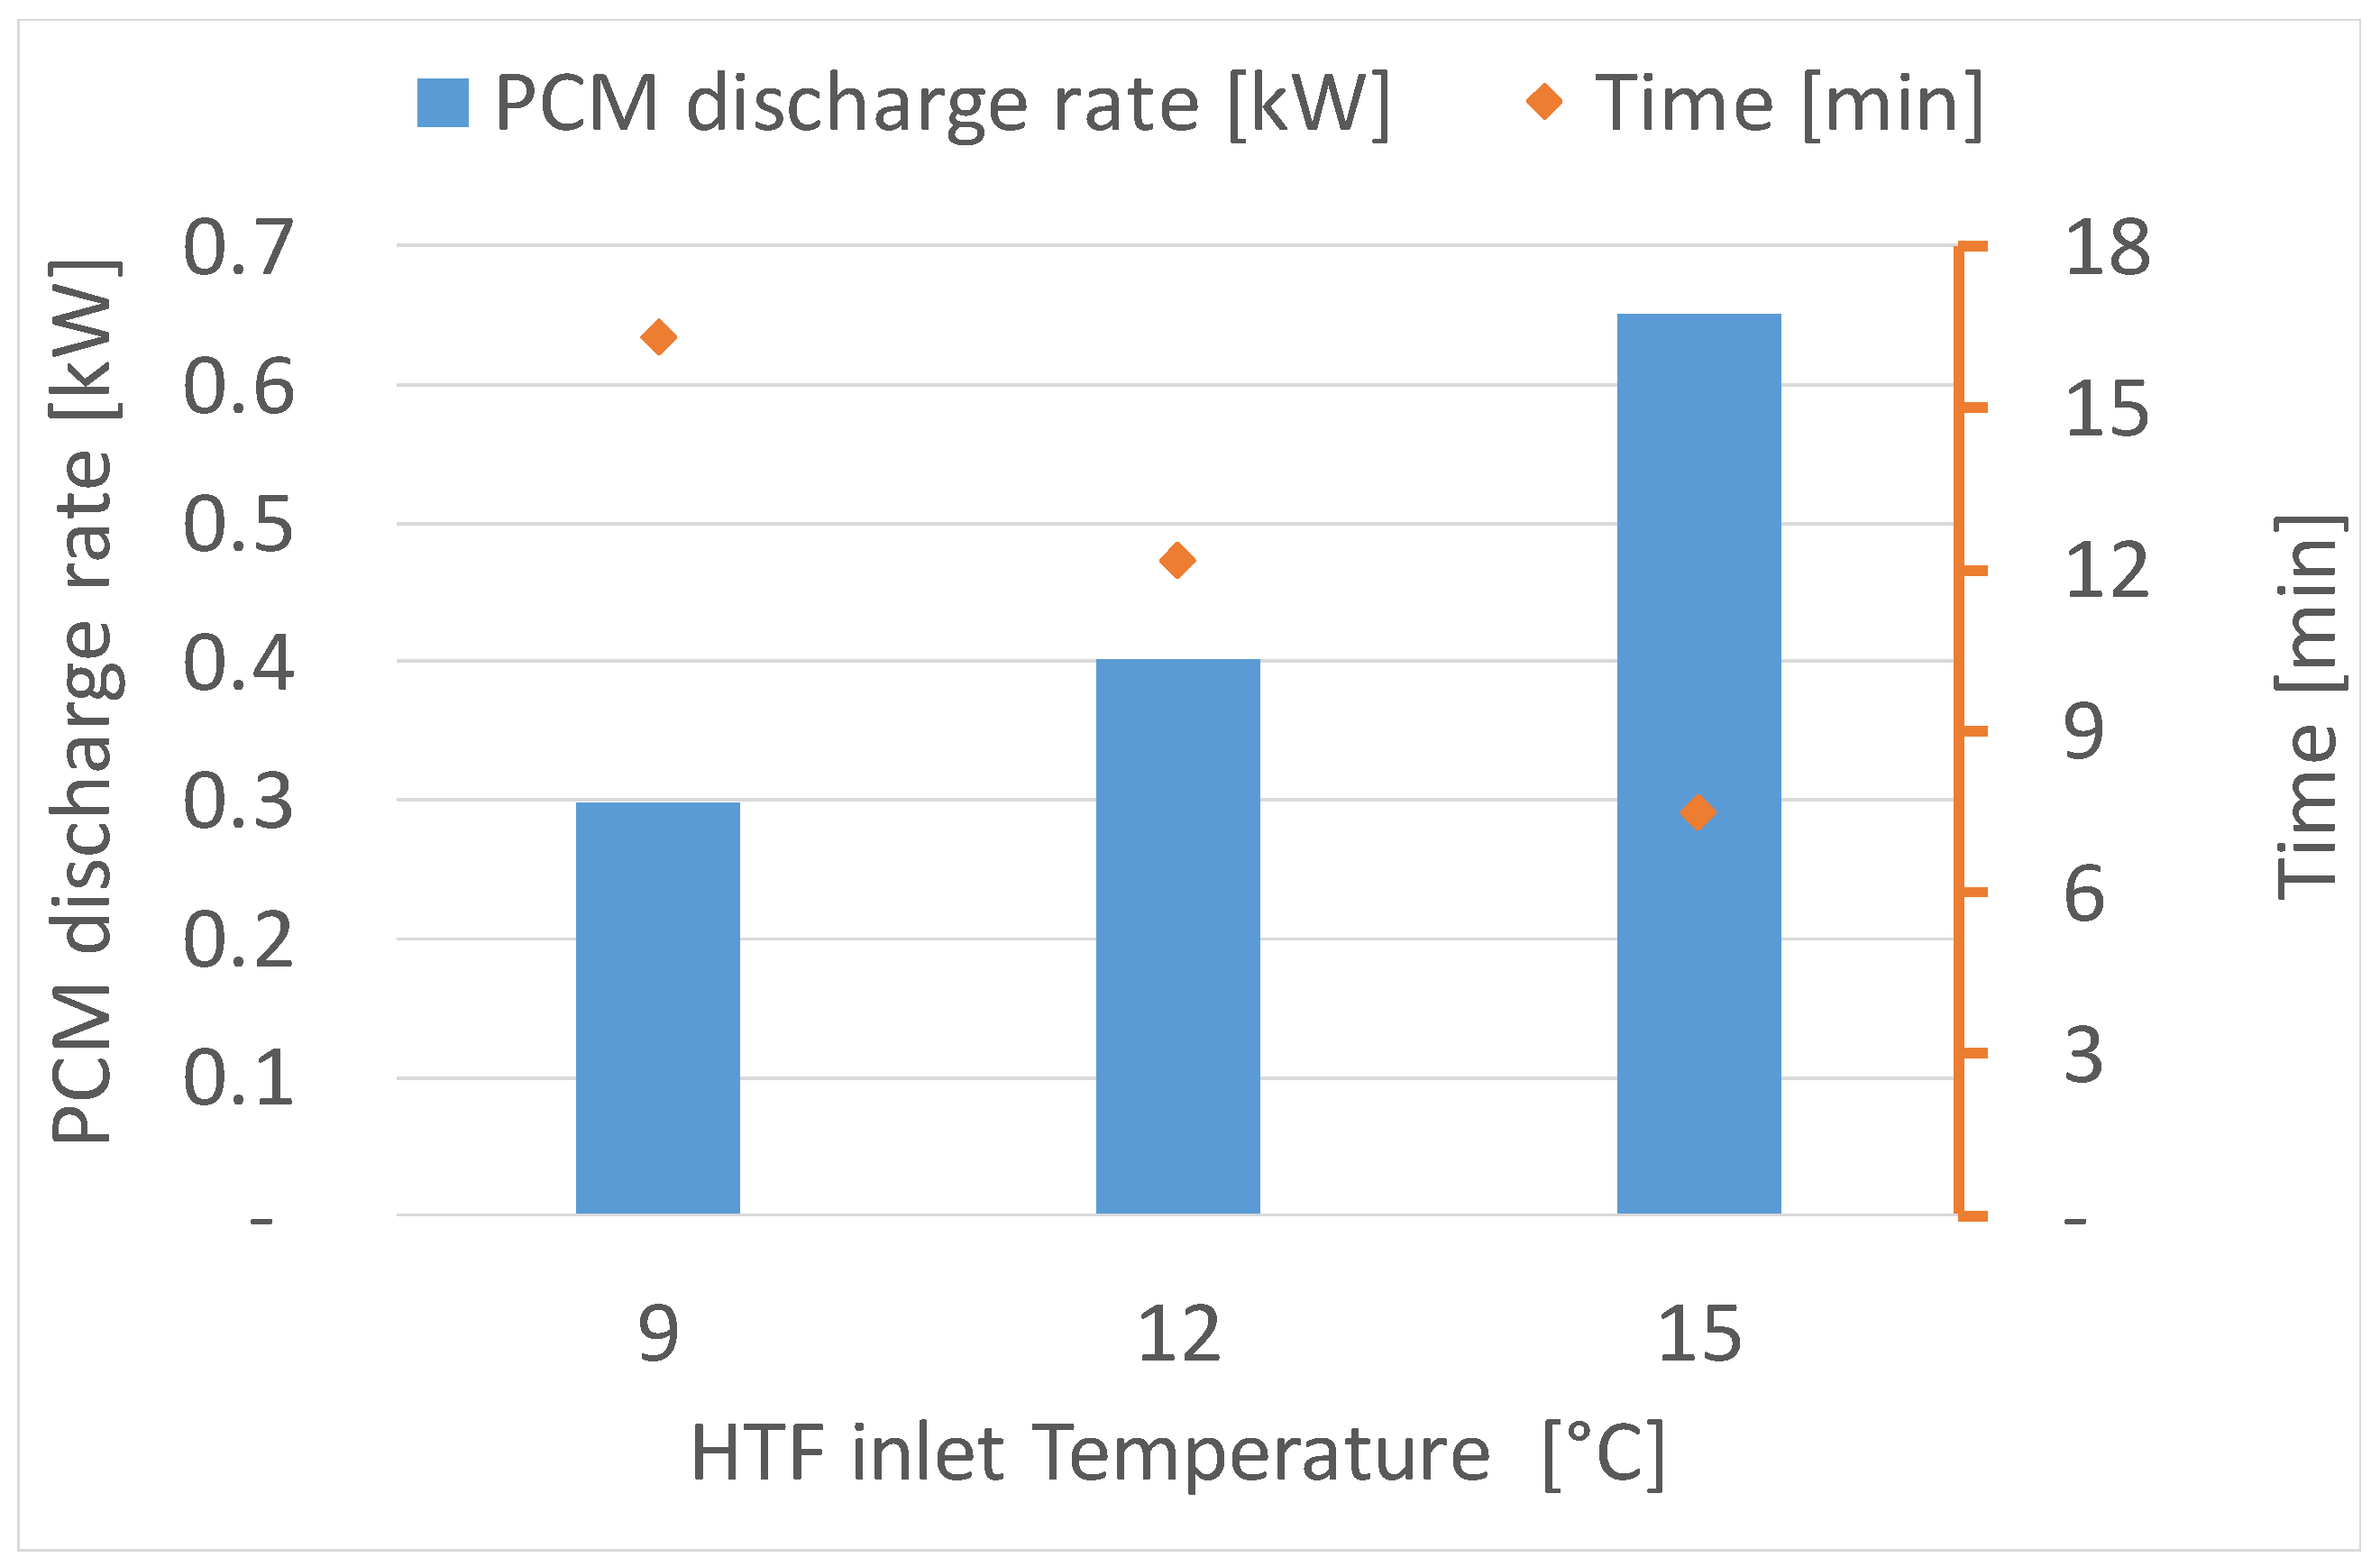
Figure 14.
Influence of HTF inlet temperature on PCM discharge rate and time to complete discharging process at constant HTF flow rate of 100 L·h−1.
Figure 14.
Influence of HTF inlet temperature on PCM discharge rate and time to complete discharging process at constant HTF flow rate of 100 L·h−1.
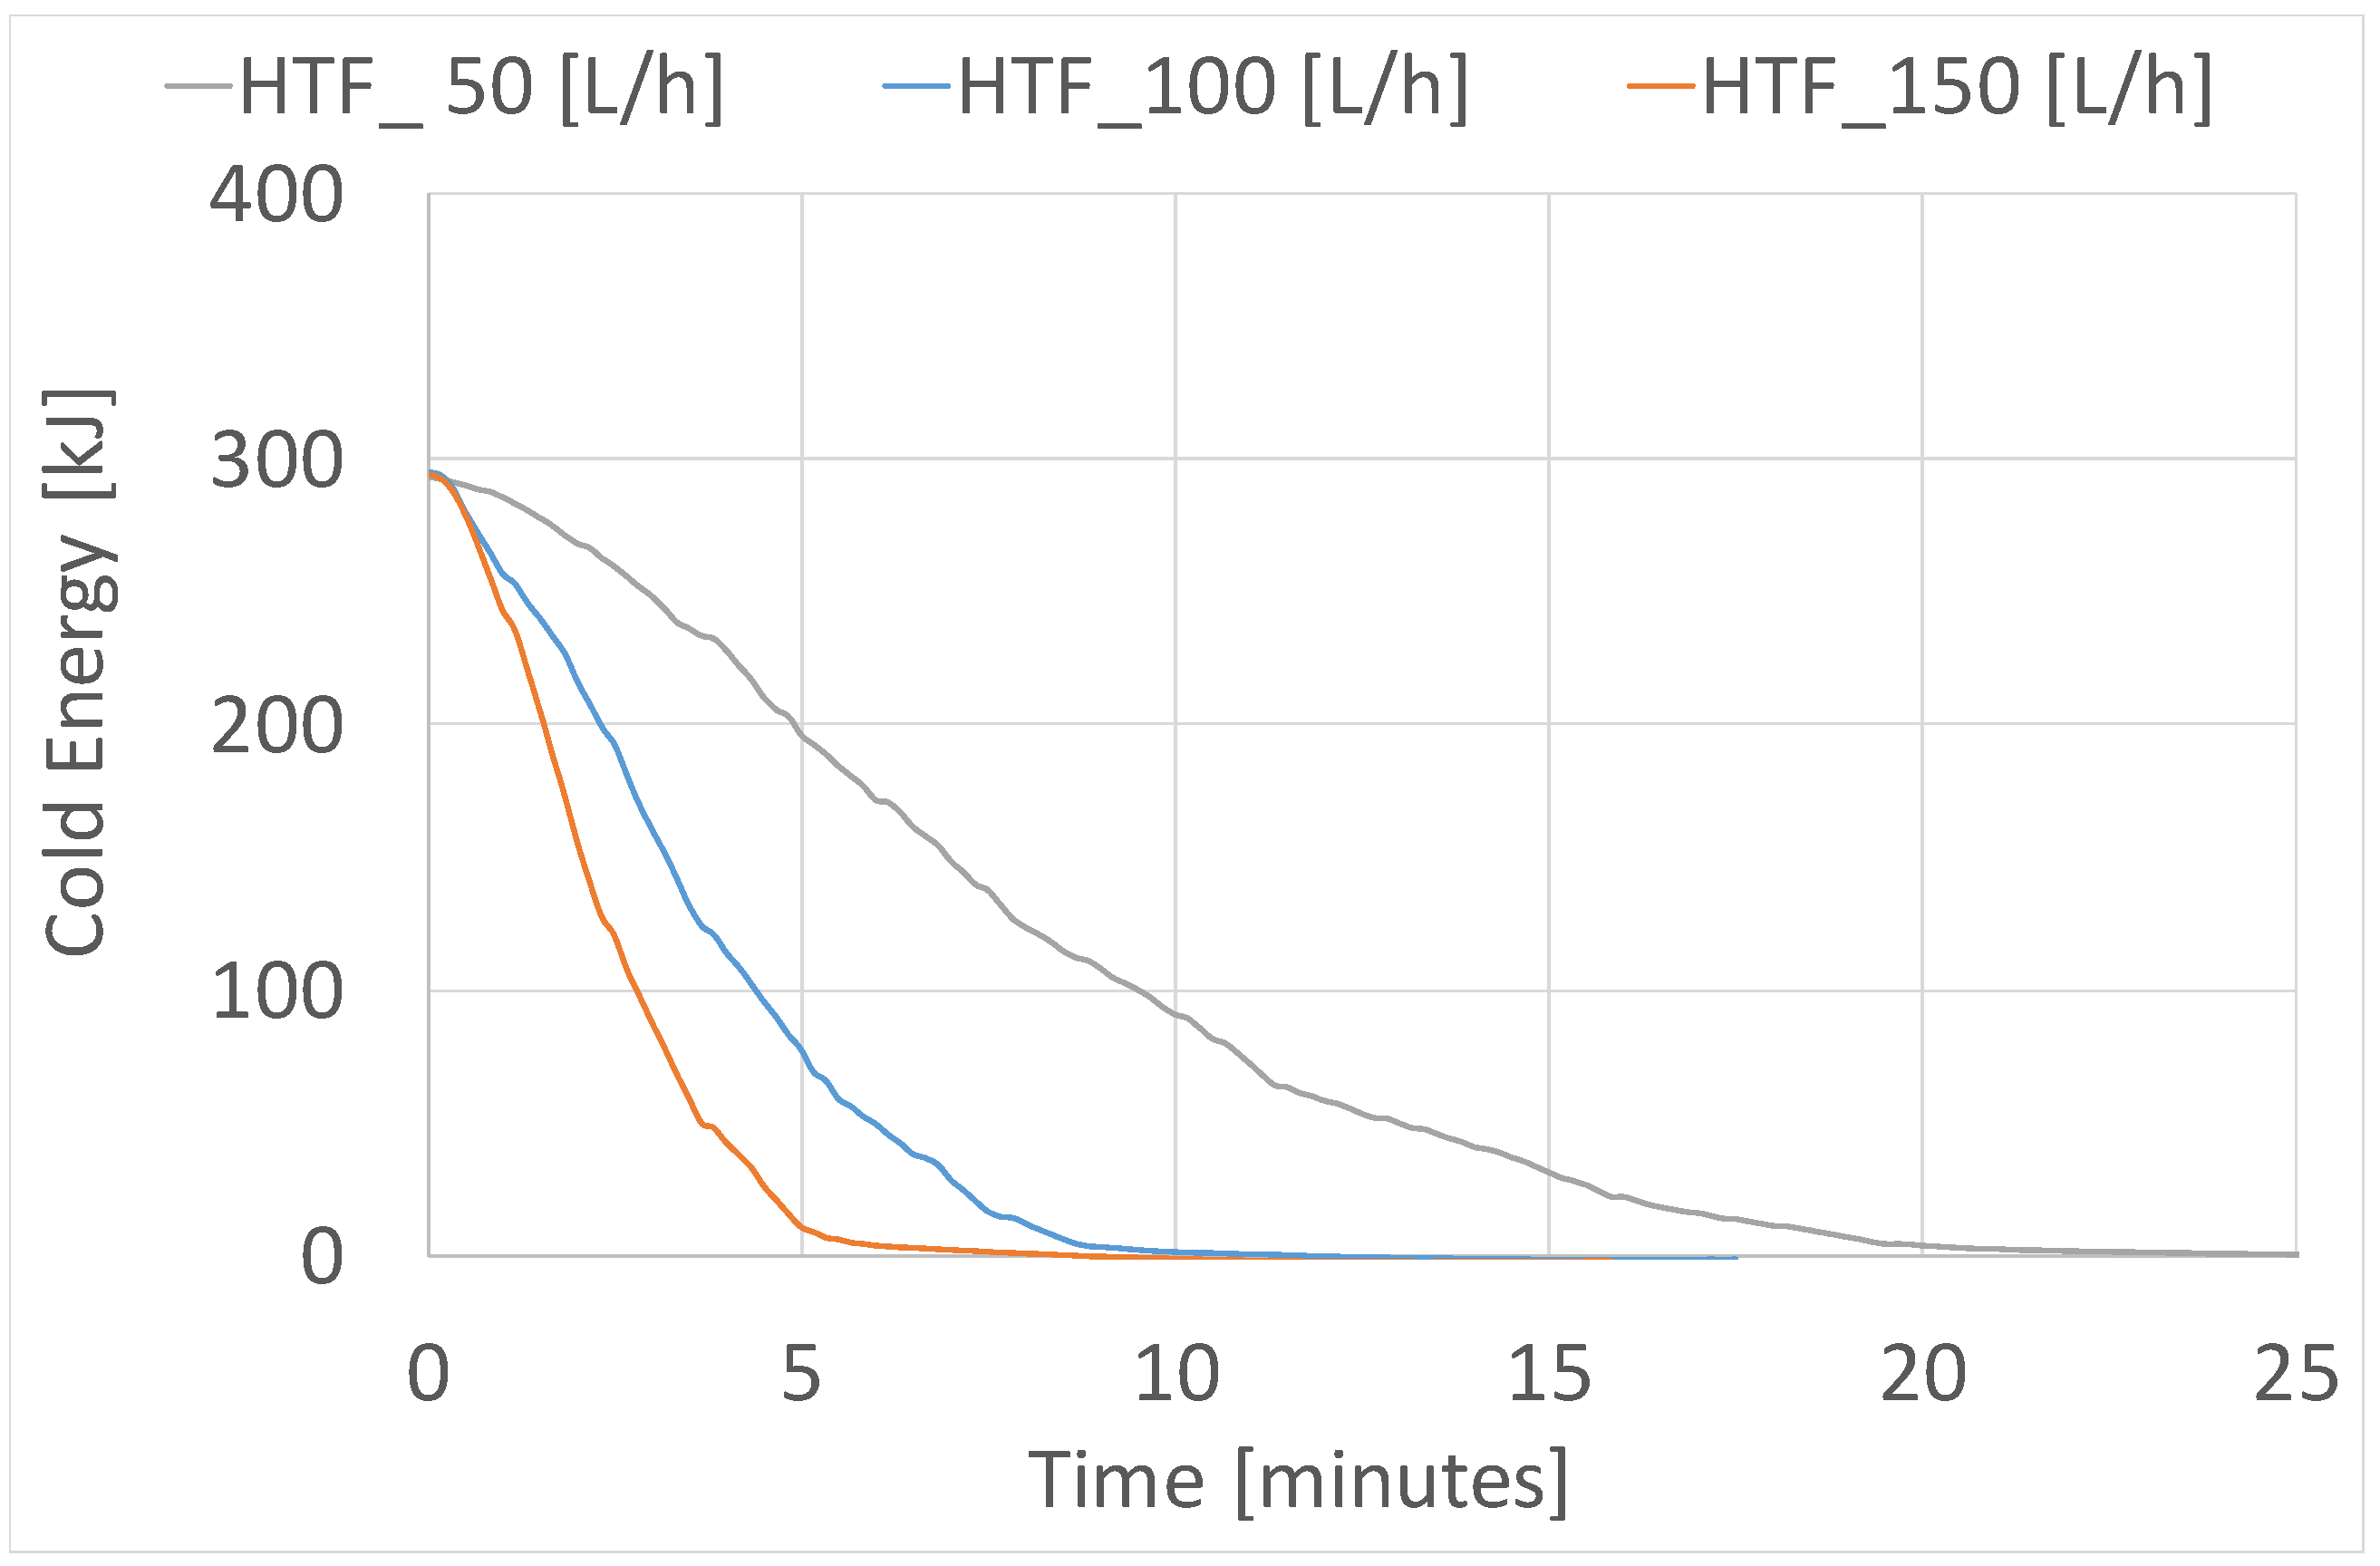
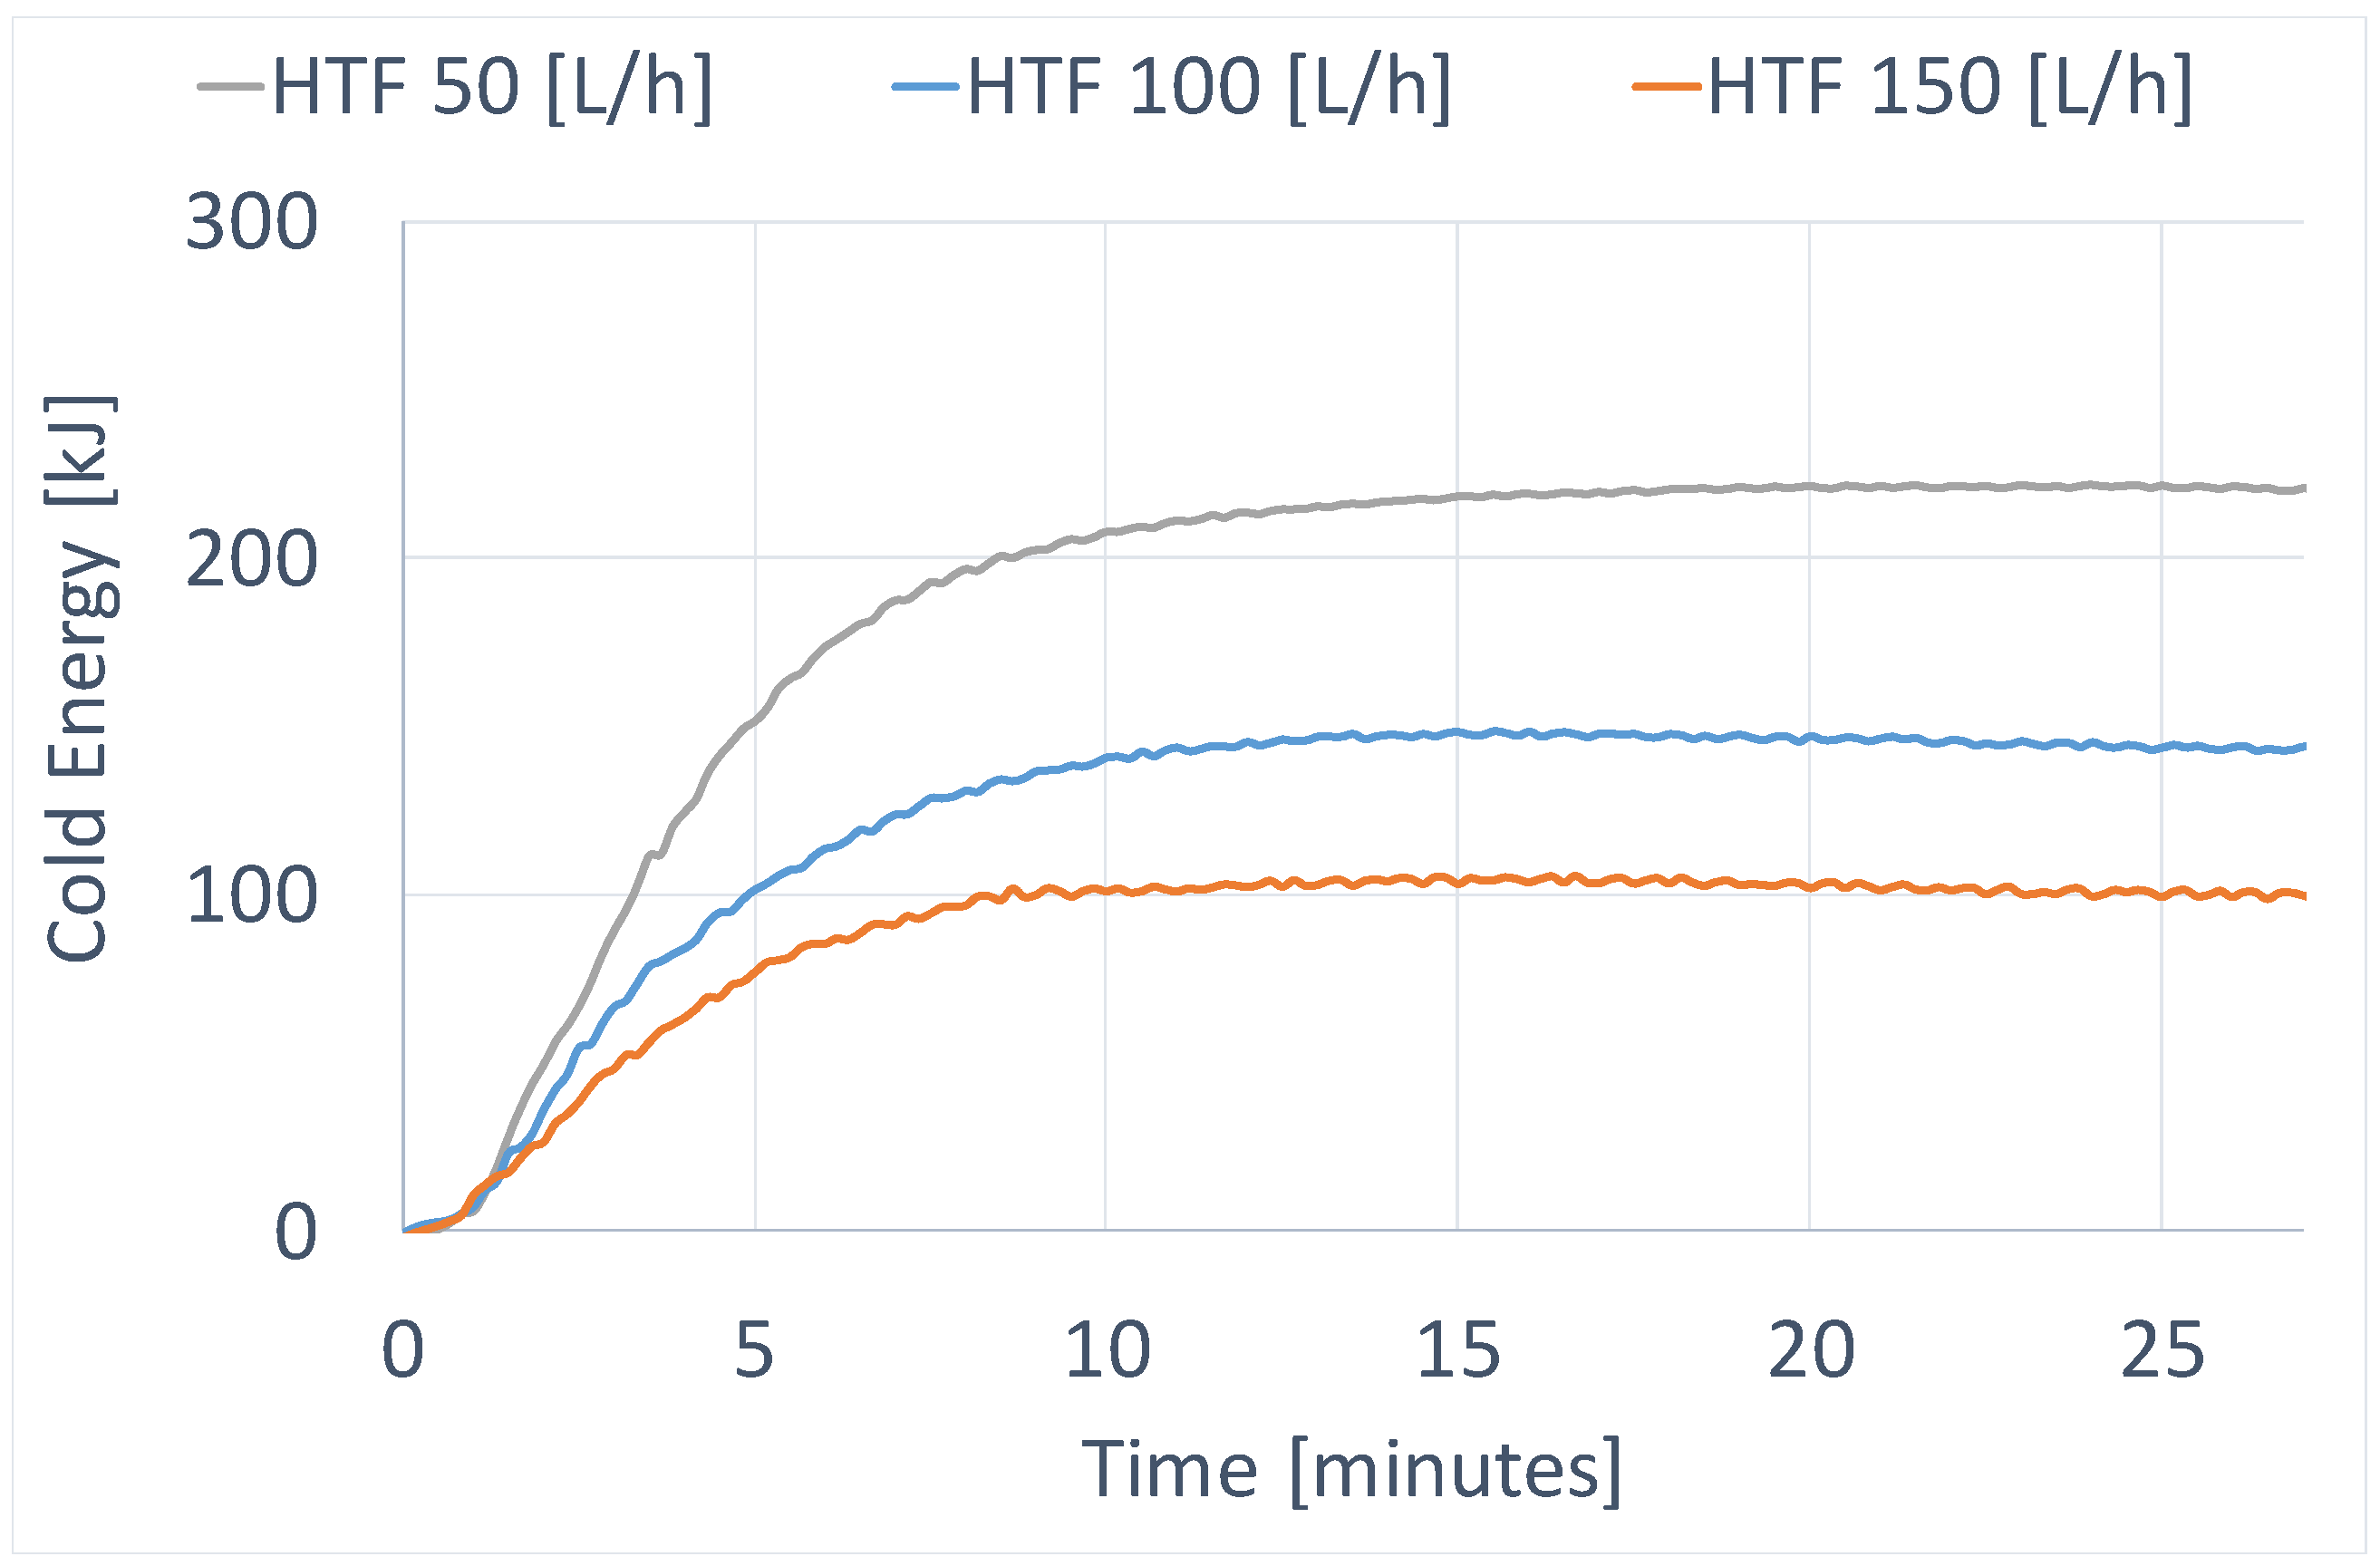
Figure 15.
Influence of the HTF flow rate on the cold energy stored in the PCM during discharging at constant HTF inlet temperature of 12 °C.
Figure 15.
Influence of the HTF flow rate on the cold energy stored in the PCM during discharging at constant HTF inlet temperature of 12 °C.
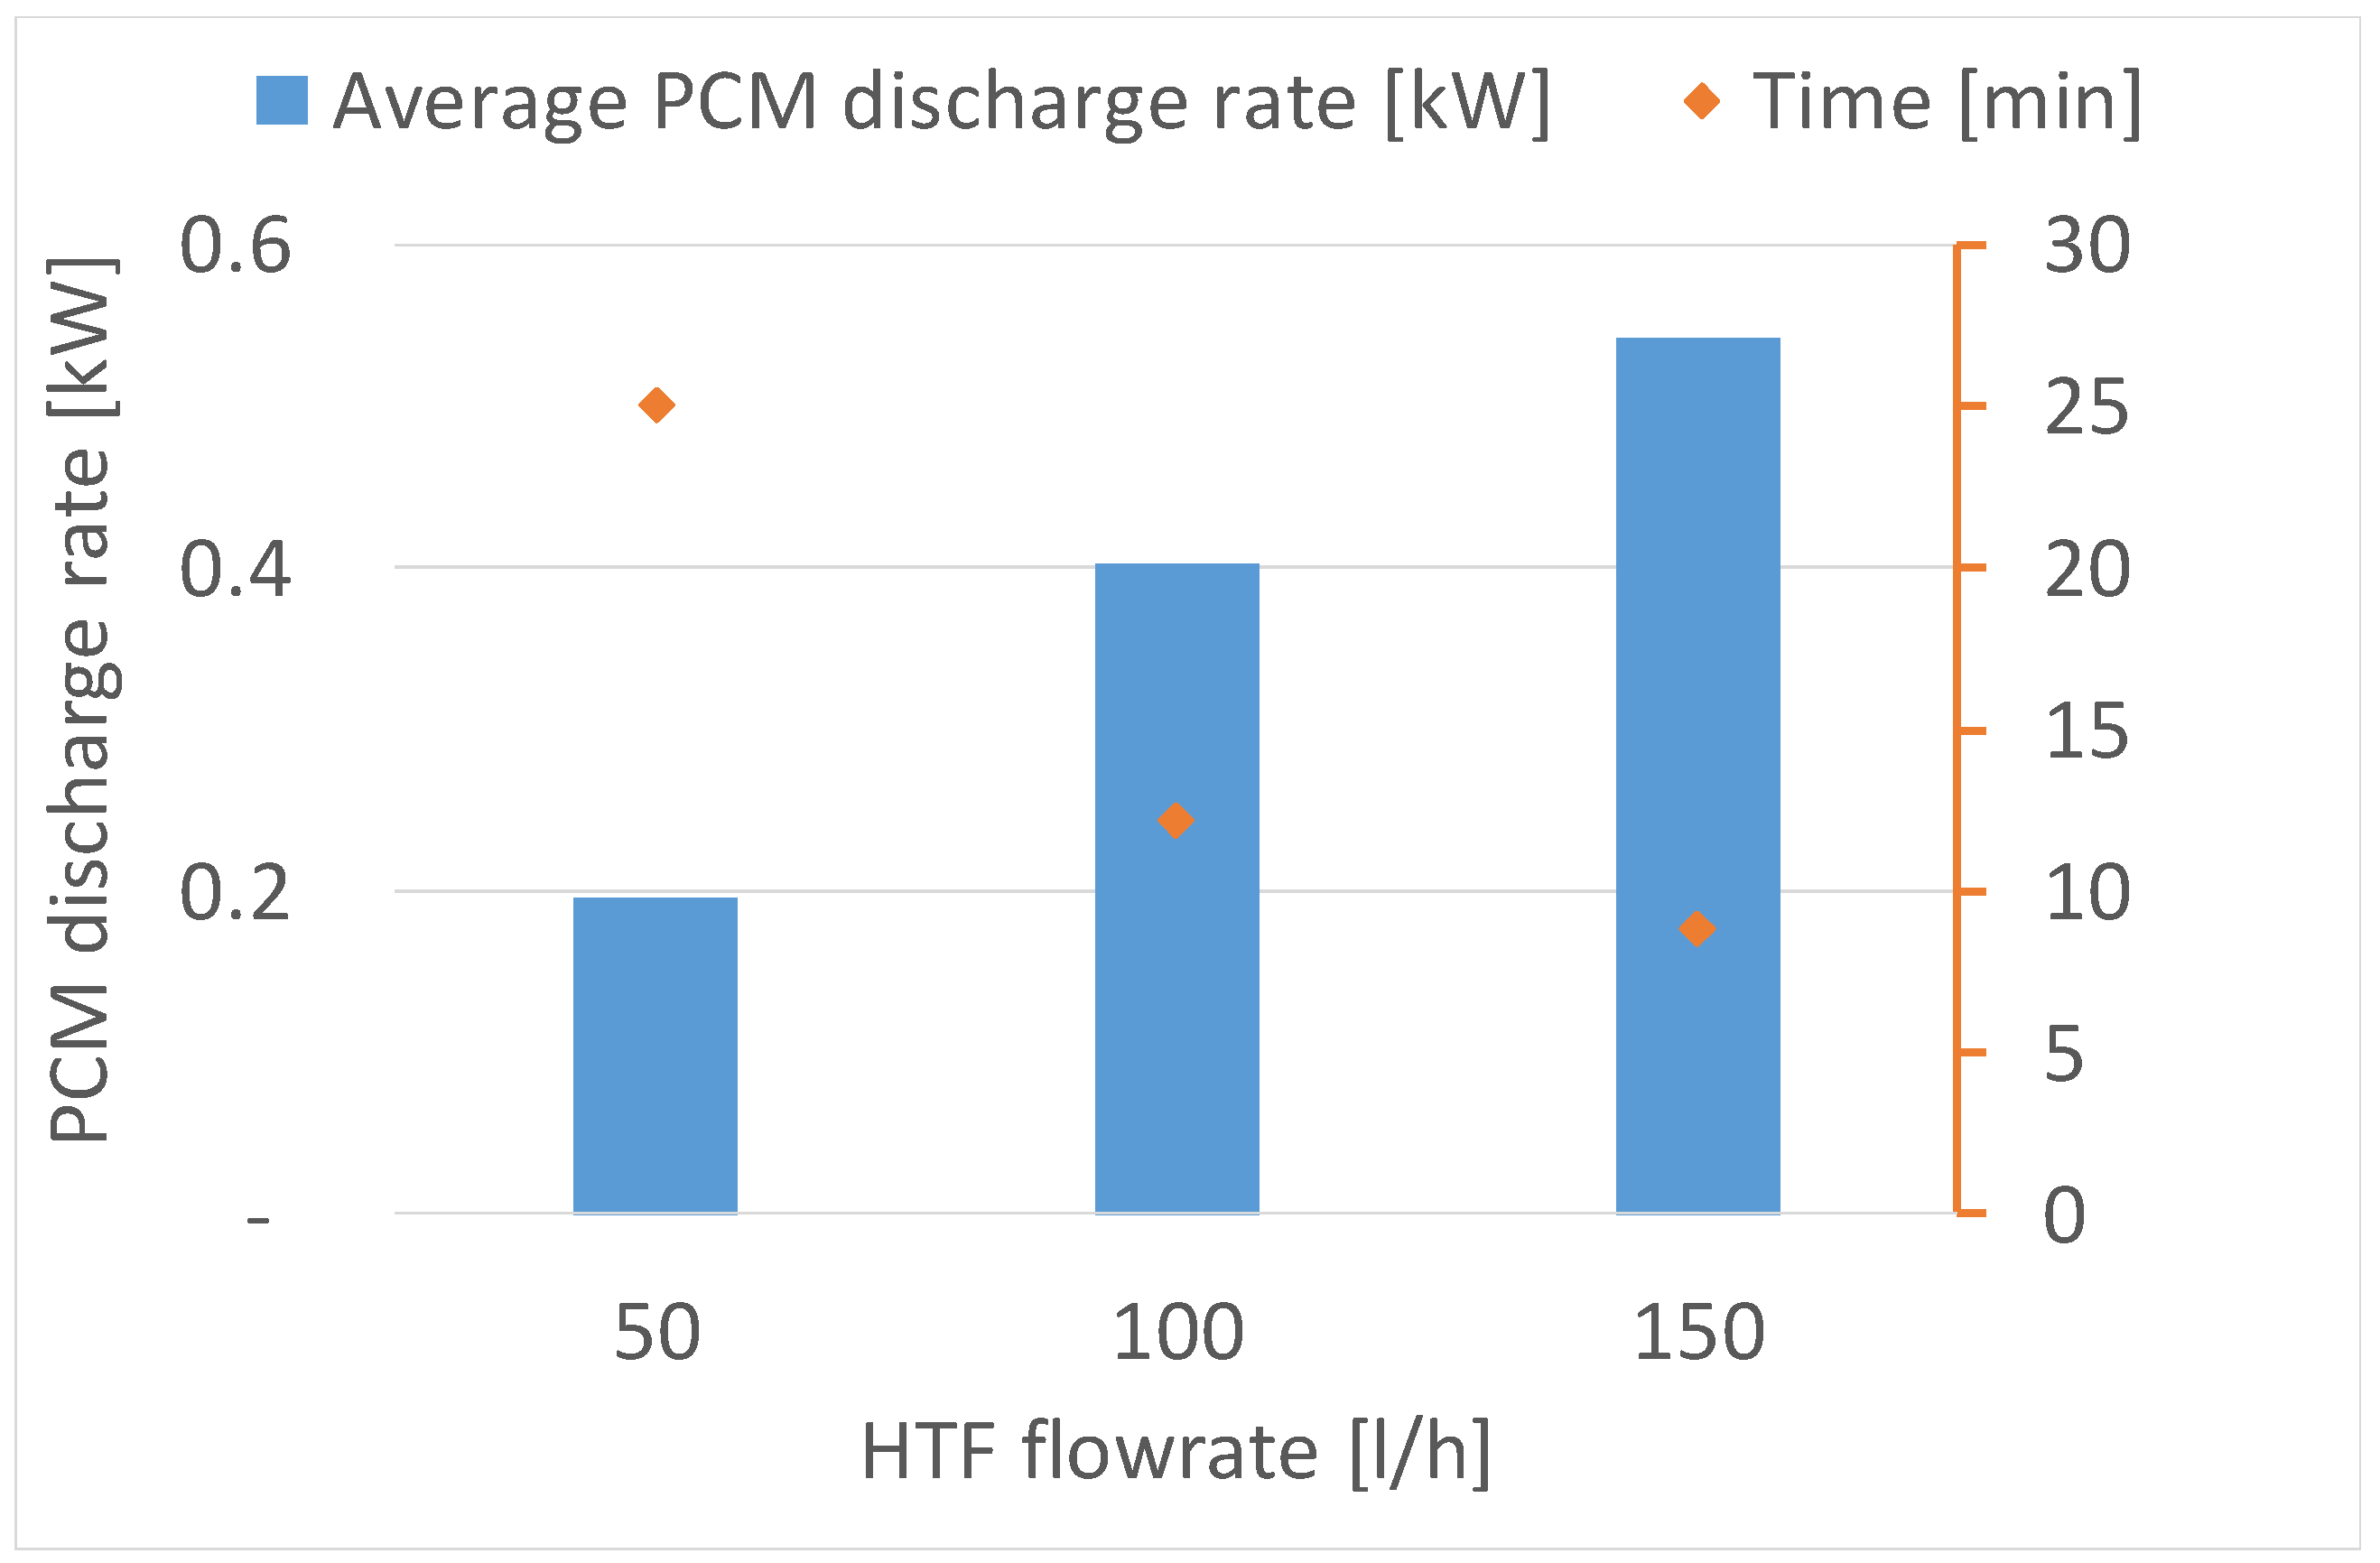
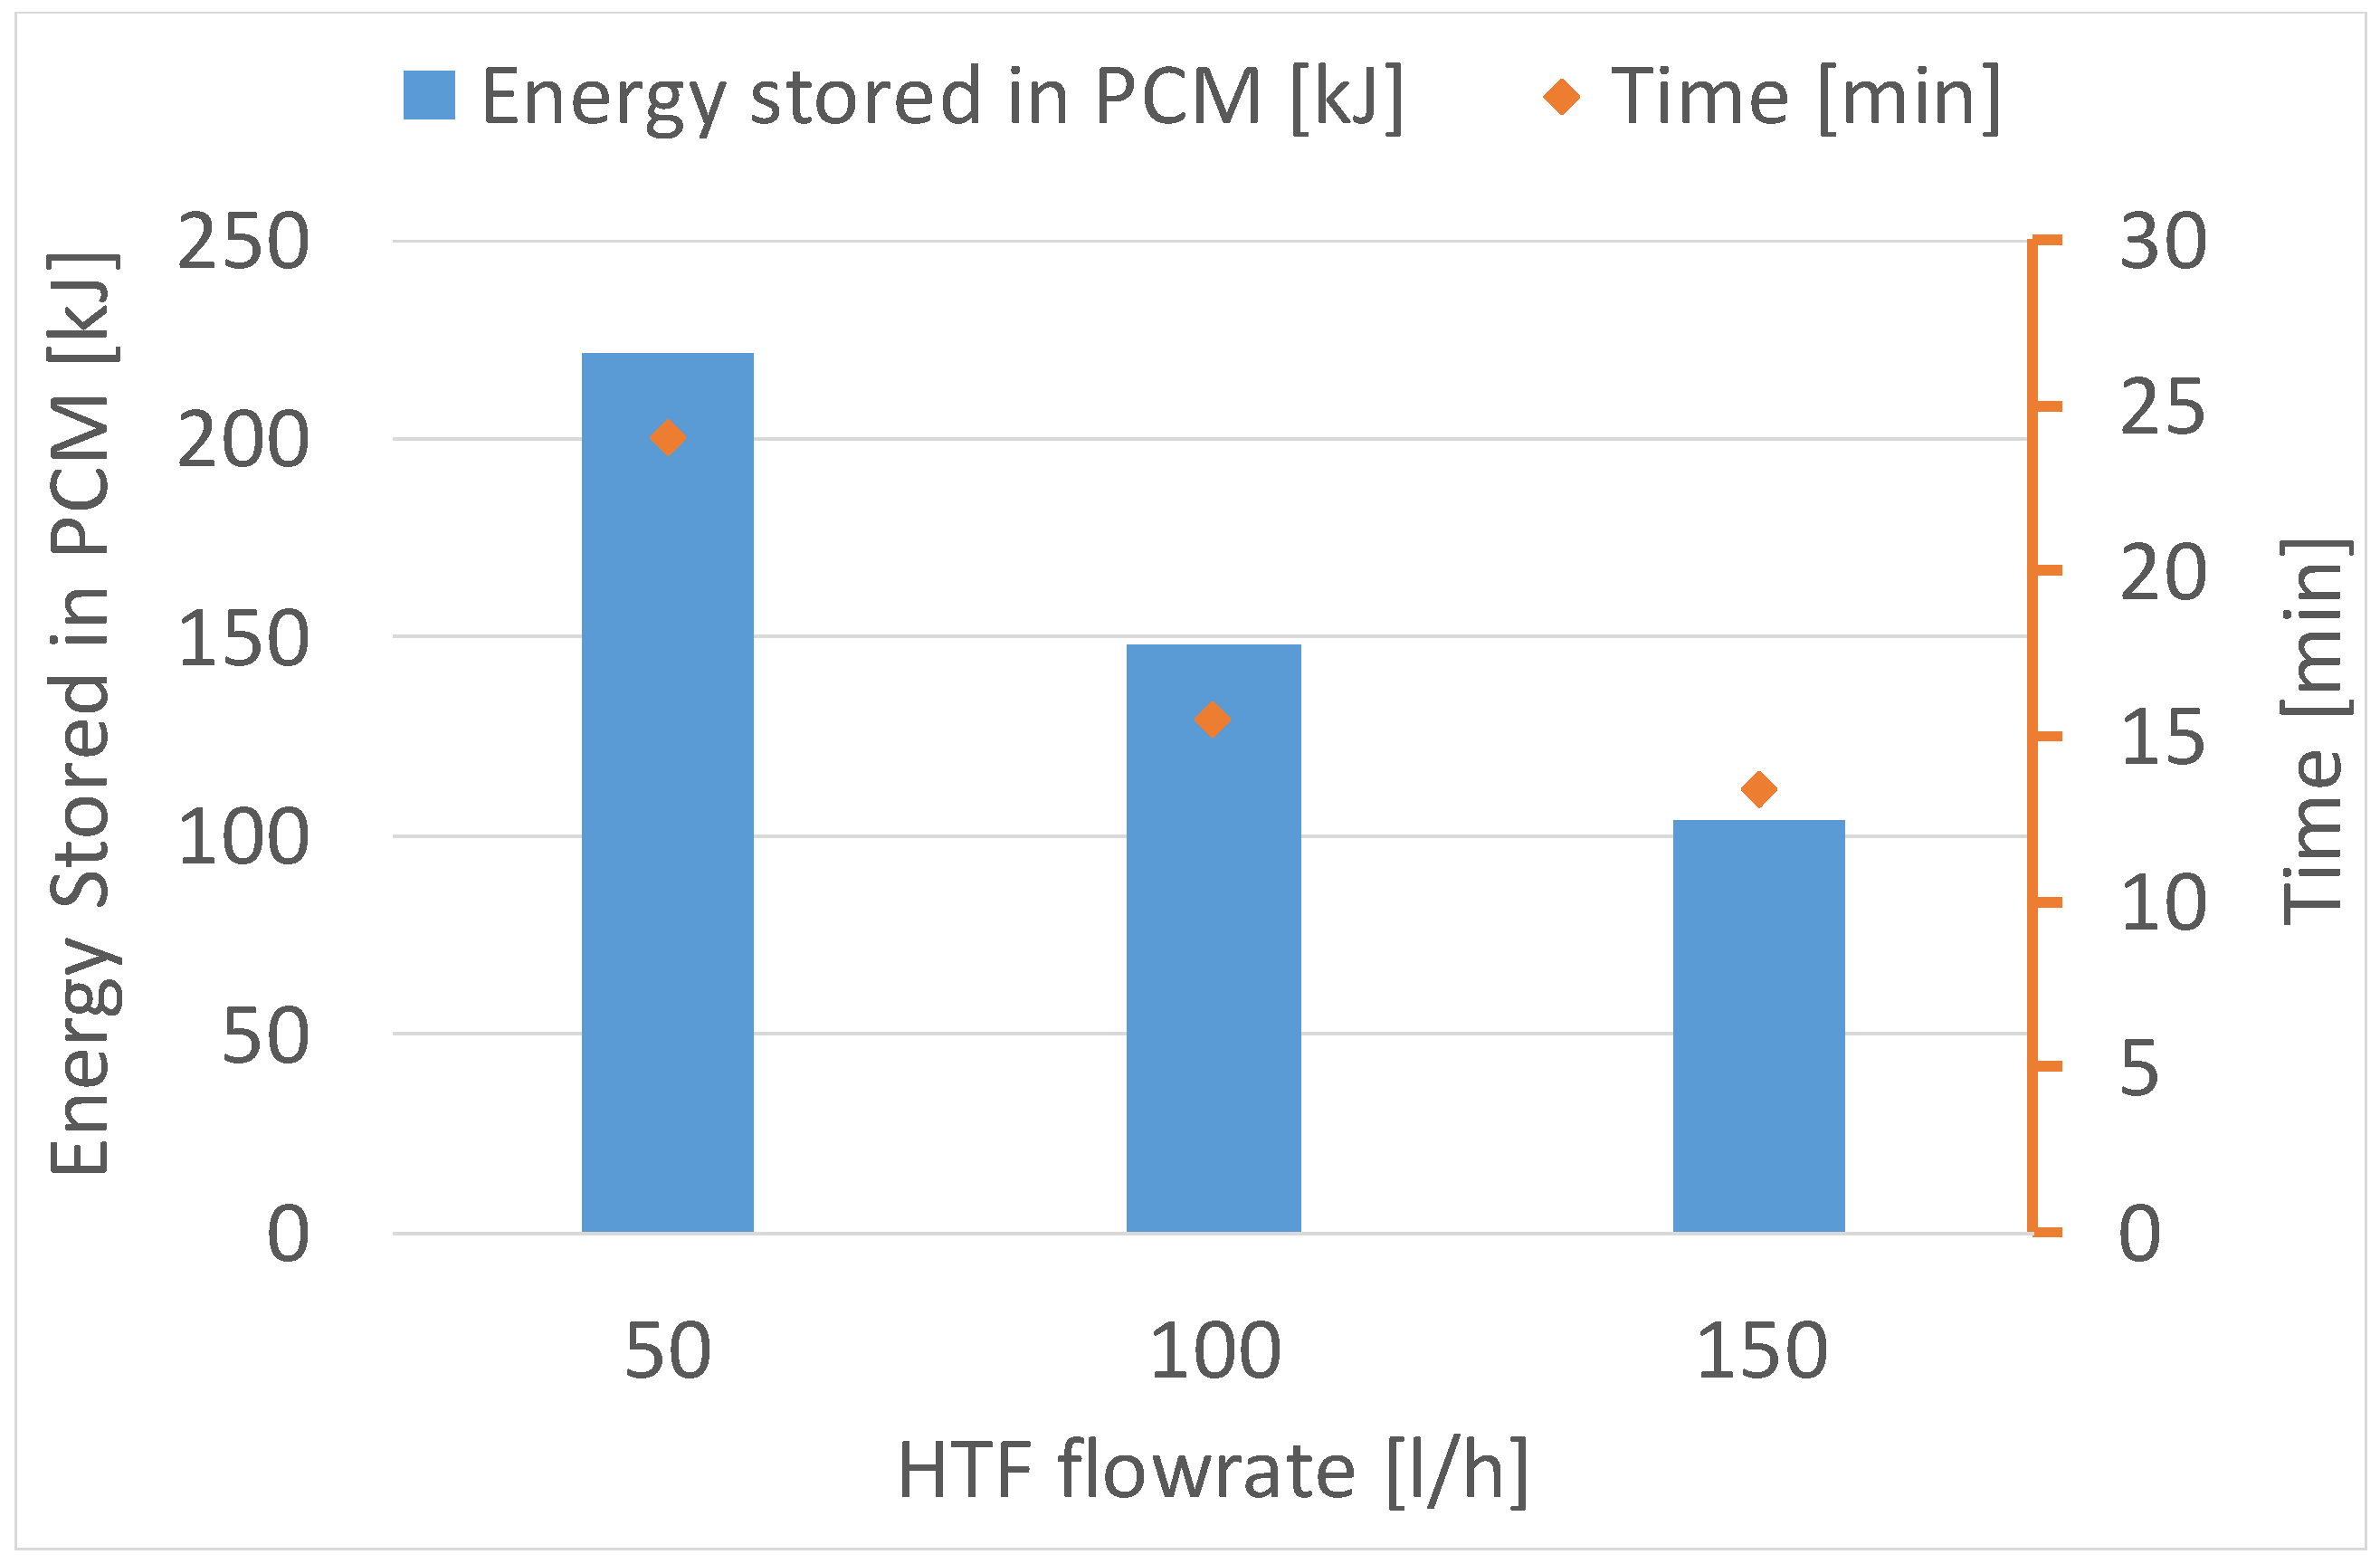
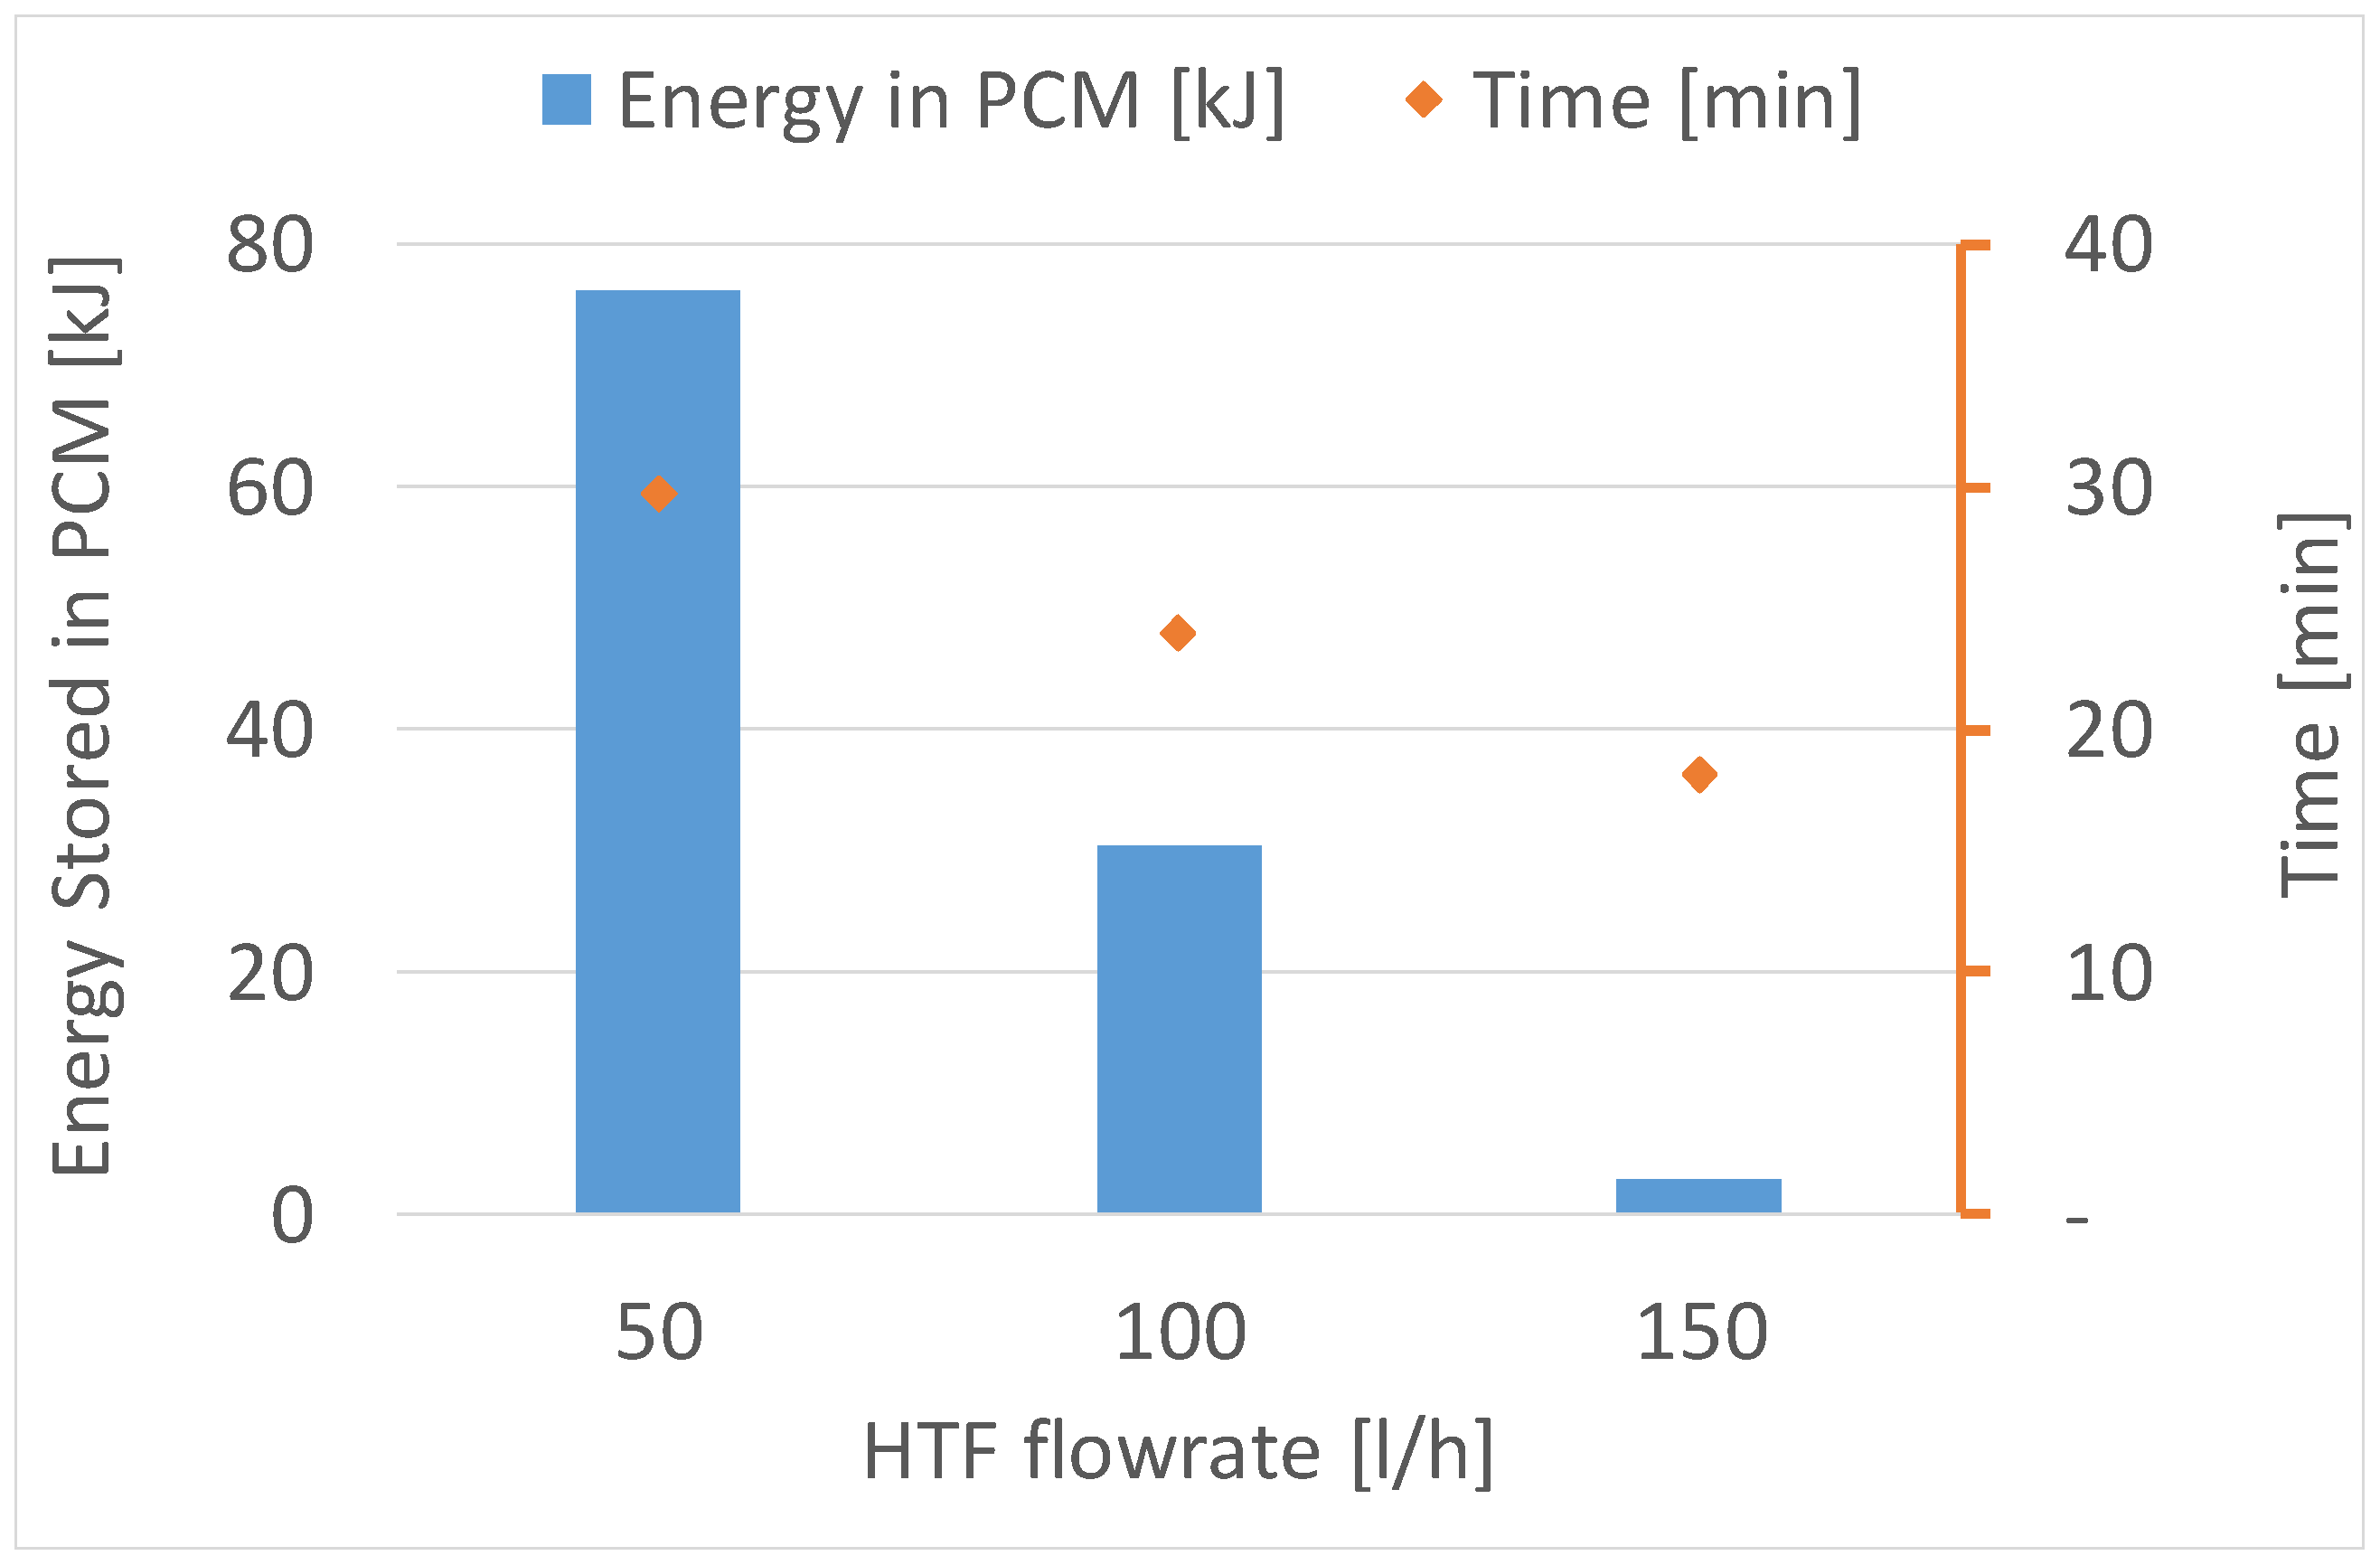
Figure 16.
Influence of the HTF flow rate on the average PCM discharge rate and time of discharging at constant HTF inlet temperature of 12 °C.
Figure 16.
Influence of the HTF flow rate on the average PCM discharge rate and time of discharging at constant HTF inlet temperature of 12 °C.
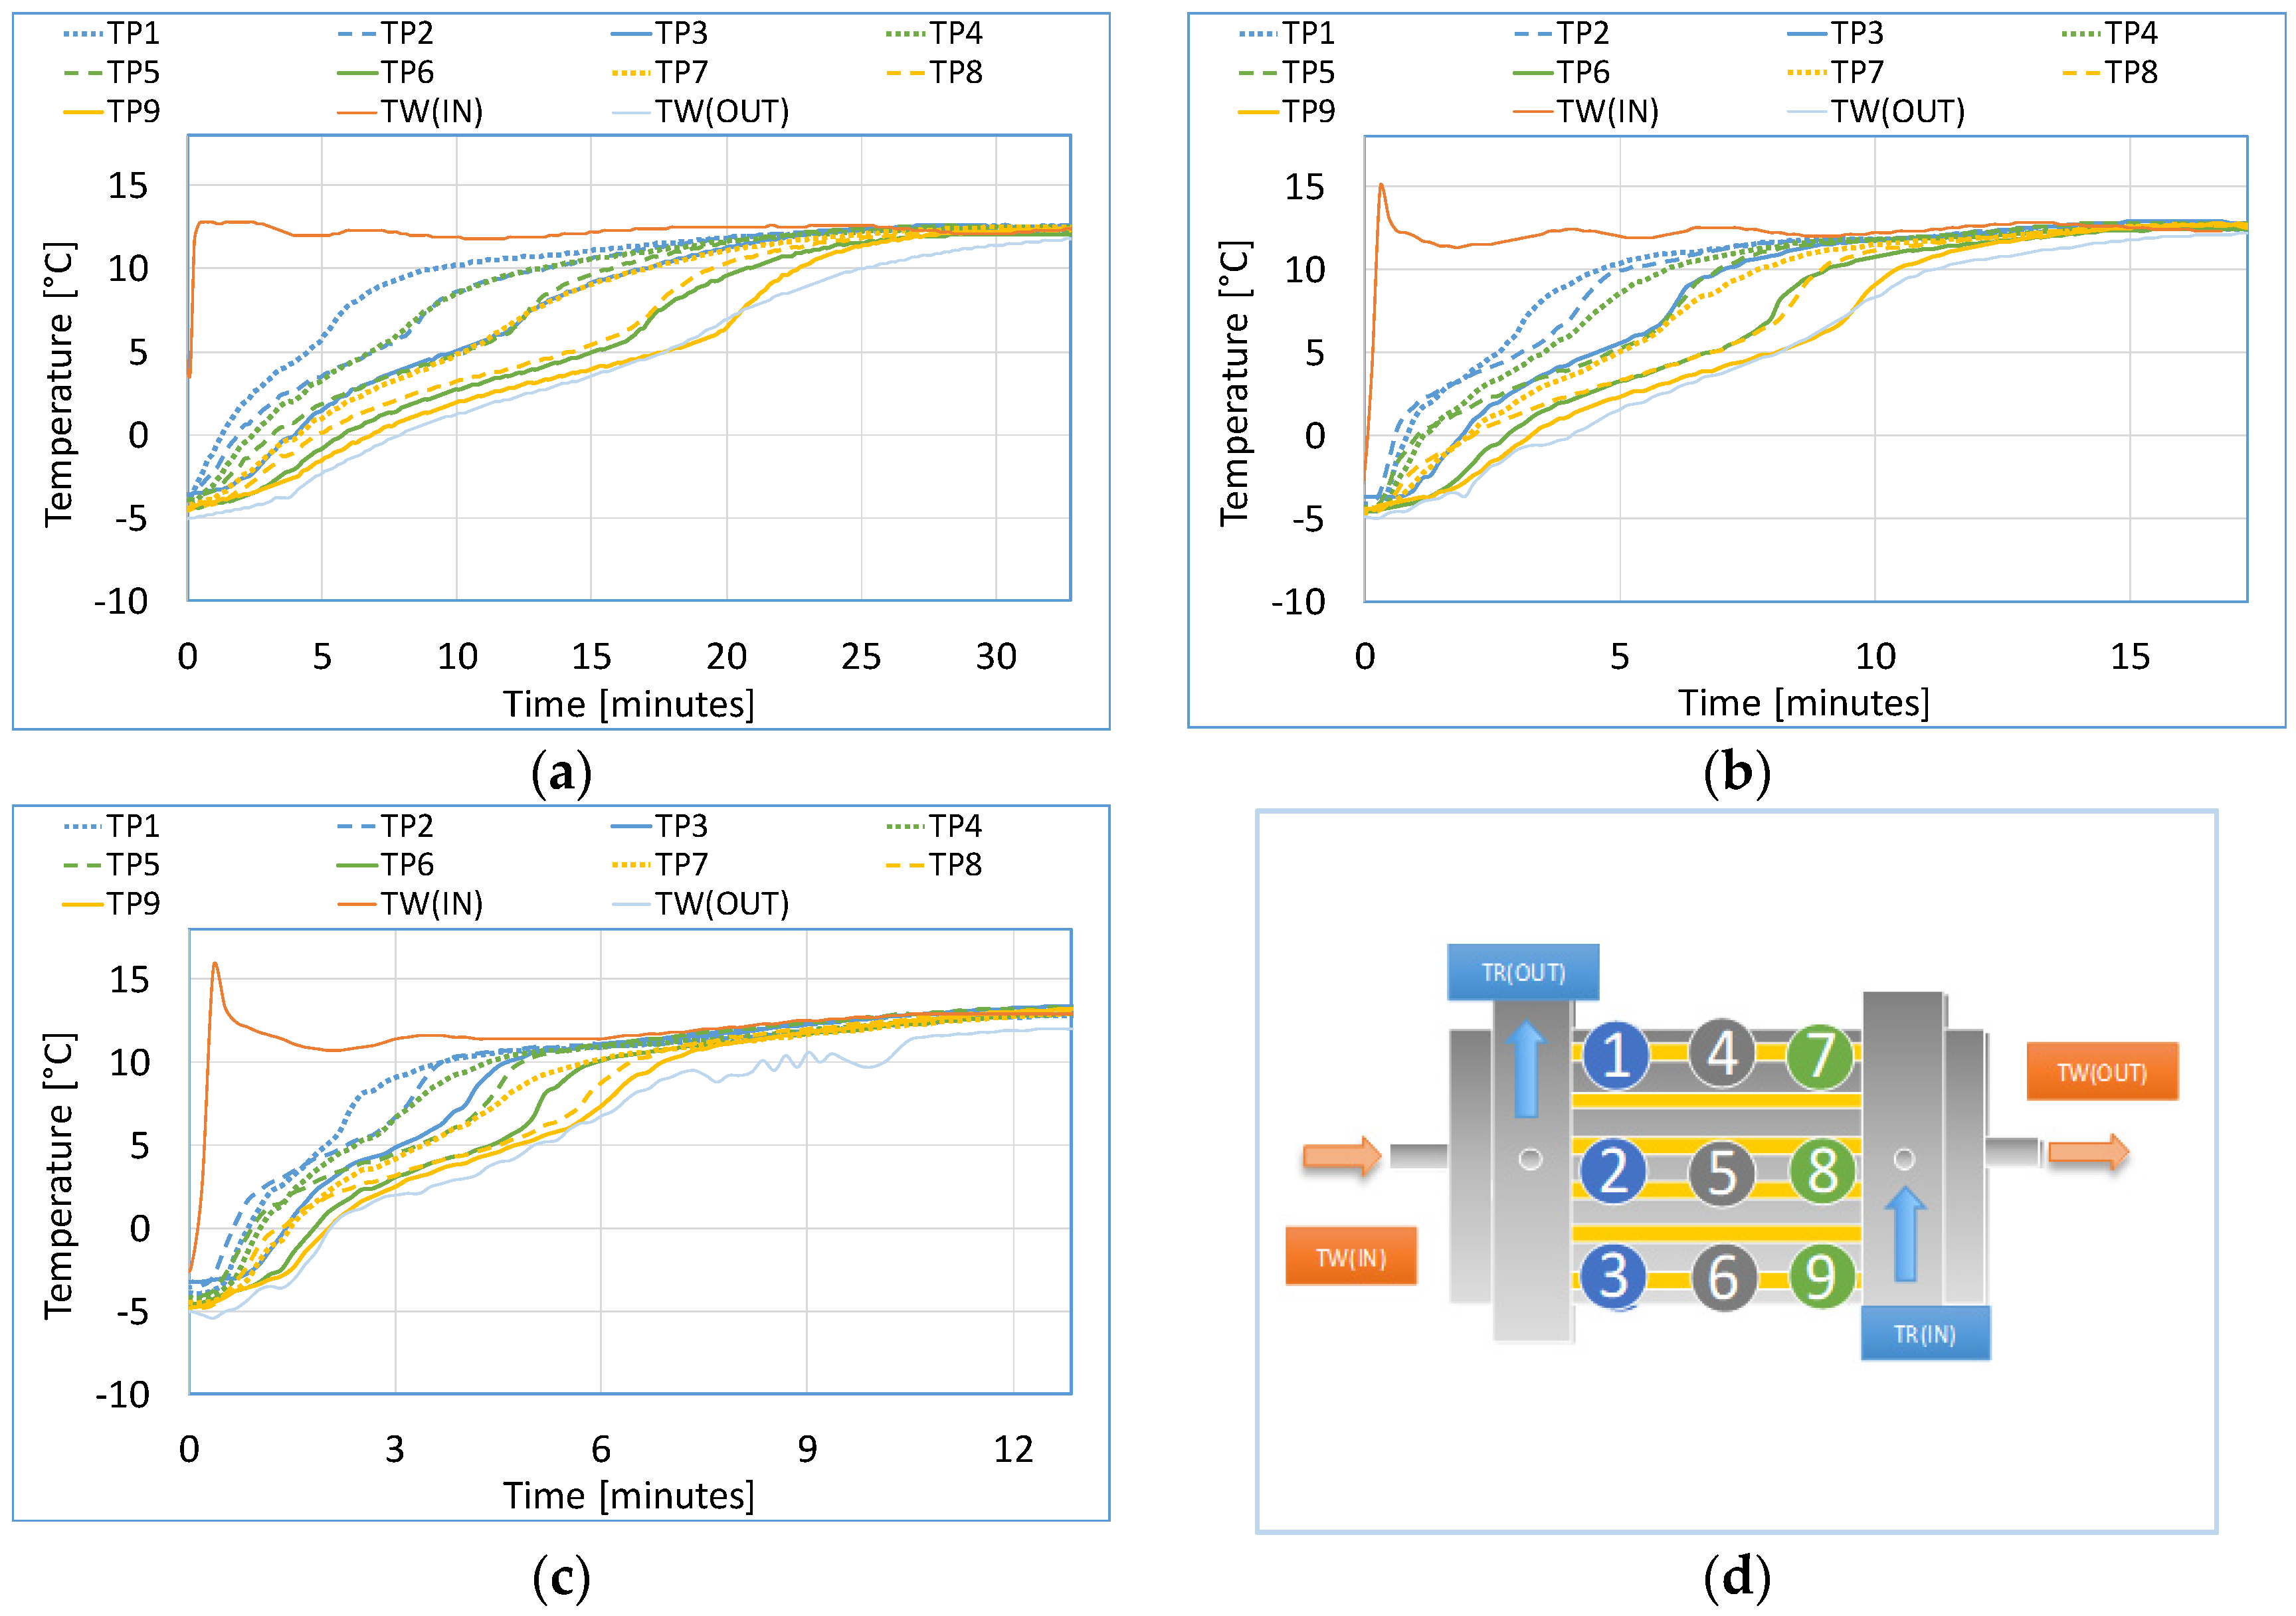
Figure 17.
PCM temperature profile in Mode 3a with HTF inlet temperature at 12 °C and at a flow rate of 100 L·h−1, for compressor power of (a) 30%, (b) 45%, (c) 60% and (d) position of the sensors. Dotted lines denote PCM temperature at top level, dashed lines at middle level, and solid lines at the bottom.
Figure 18.
Influence of compressor power on the instantaneous cold energy stored in the PCM in Mode 3a with HTF inlet temperature at 12 °C and at a flow rate of 100 L·h−1.
Figure 18.
Influence of compressor power on the instantaneous cold energy stored in the PCM in Mode 3a with HTF inlet temperature at 12 °C and at a flow rate of 100 L·h−1.
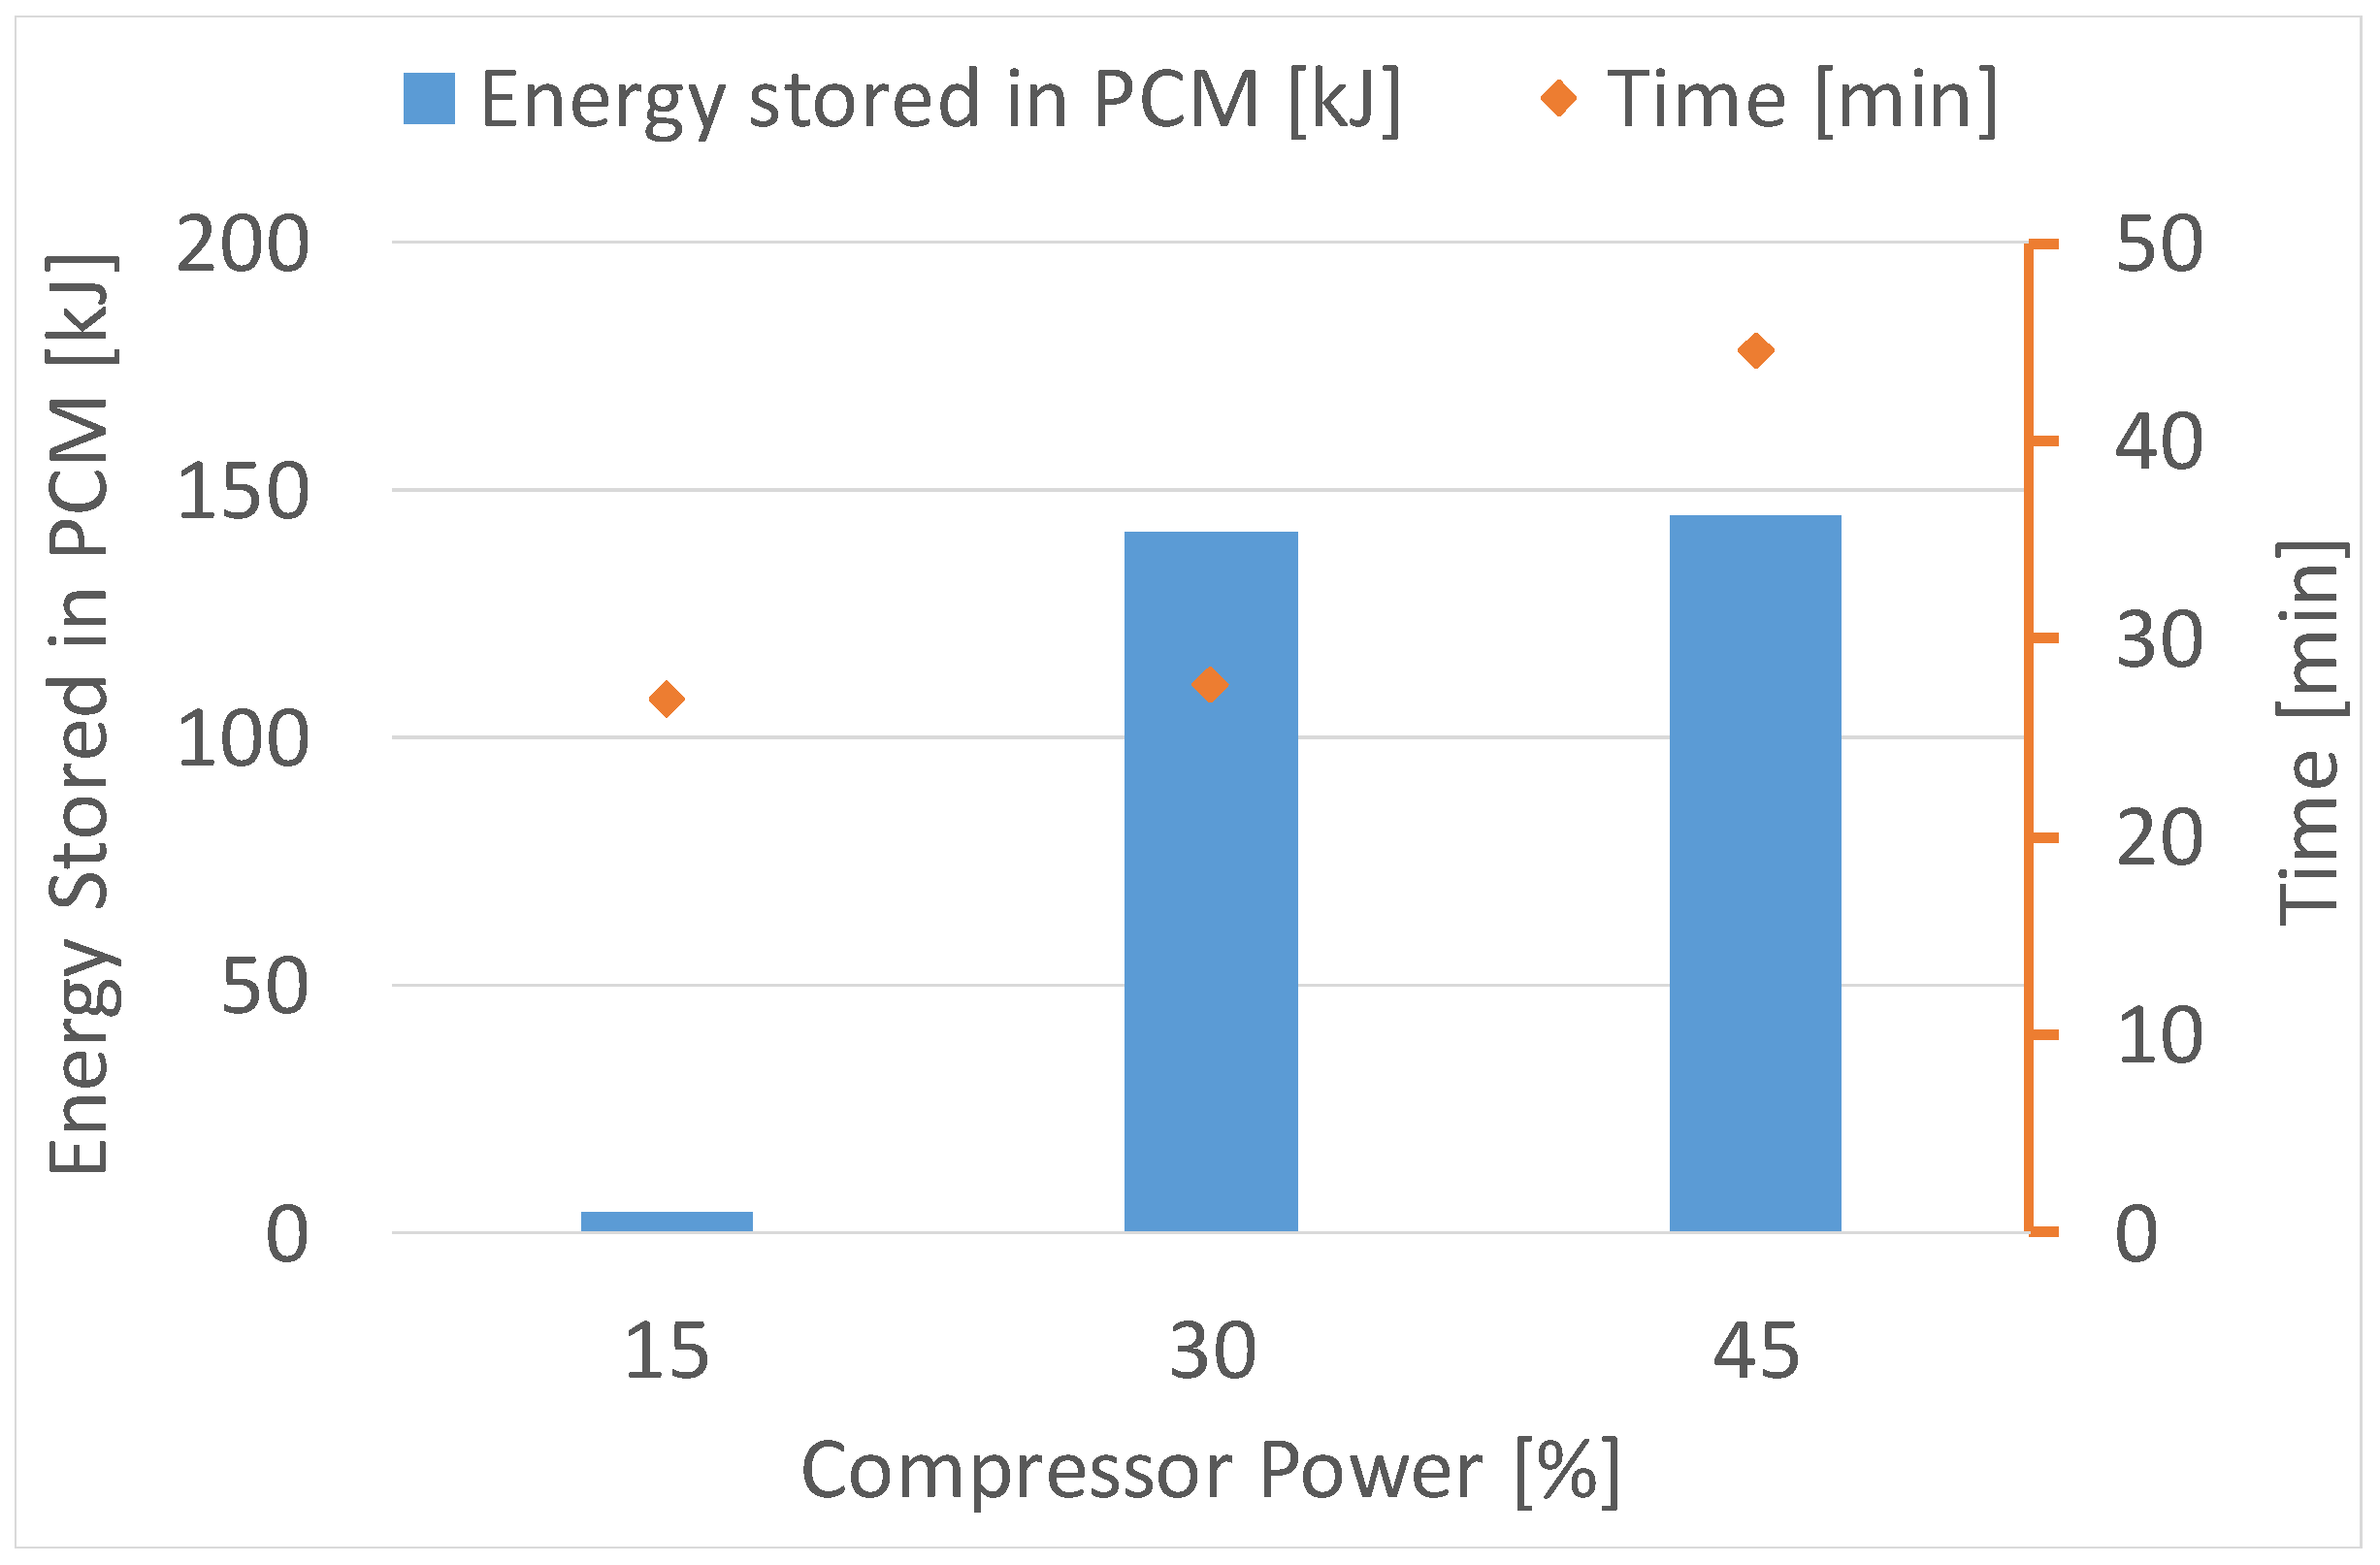
Figure 19.
Influence of compressor power on the total cold energy stored in the PCM and time to reach thermal equilibrium for HTF inlet temperature of 12 °C and at a flow rate of 100 L·h−1.
Figure 19.
Influence of compressor power on the total cold energy stored in the PCM and time to reach thermal equilibrium for HTF inlet temperature of 12 °C and at a flow rate of 100 L·h−1.
Figure 20.
Influence of HTF flow rate on the instantaneous cold energy stored in the PCM in Mode 3a for HTF inlet temperature of 12 °C.
Figure 20.
Influence of HTF flow rate on the instantaneous cold energy stored in the PCM in Mode 3a for HTF inlet temperature of 12 °C.
Figure 21.
Influence of HTF flow rate on the total cold energy storage in the PCM and time to reach equilibrium for HTF inlet temperature at 12 °C.
Figure 21.
Influence of HTF flow rate on the total cold energy storage in the PCM and time to reach equilibrium for HTF inlet temperature at 12 °C.
Figure 22.
PCM temperature profile in Mode 3b for compressor power of 15%, with the HTF inlet temperature at 12 °C and flow rate of (a) 50 L·h−1, (b) 100 L·h−1, (c) 150 L·h−1 and (d) position of the sensors. Dotted lines denote PCM temperature at top level, dashed lines at middle level, and solid lines at the bottom.
Figure 23.
Influence of the HTF flow rate on the instantaneous cold energy stored in the PCM in Mode 3b with the HTF inlet temperature at 12 °C.
Figure 23.
Influence of the HTF flow rate on the instantaneous cold energy stored in the PCM in Mode 3b with the HTF inlet temperature at 12 °C.
Figure 24.
Influence of the HTF flow rate on the total cold energy stored in the PCM and time to reach equilibrium in Mode 3b with the HTF inlet temperature at 12 °C.
Figure 24.
Influence of the HTF flow rate on the total cold energy stored in the PCM and time to reach equilibrium in Mode 3b with the HTF inlet temperature at 12 °C.
Table 1.
Main characteristics of the refrigerant-PCM-water heat exchanger (RPW-HEX).
Table 1.
Main characteristics of the refrigerant-PCM-water heat exchanger (RPW-HEX).
| Characteristic | Refrigerant | HTF | PCM |
|---|
| Number of channels [-] | 14 | 16 | 15 |
| Height of channels [mm] | 3 | 3 | 10 |
| Number of fins [-] | 43 | 43 | 33 |
| Volume of the fluid [L] | 0.65 | 0.8 | 2.5 |
| Core length × width × depth [mm] | 300 × 272 × 94 |
Table 2.
Properties of the commercial RT4 PCM [
18].
Table 2.
Properties of the commercial RT4 PCM [
18].
| Properties | Value | Units |
|---|
| Phase change range | 2–4 | °C |
| Density | 0.88 (solid) | kg·L−1 |
| 0.77 (liquid) |
| Thermal conductivity | 0.2 | W·m−1·K−1 |
| Volume expansion | 12.5 | % |
Table 3.
HTF (water-glycol) properties at different temperatures.
Table 3.
HTF (water-glycol) properties at different temperatures.
| Properties | At T = −4 °C | At T = 12 °C | Units |
|---|
| Density | 1053.5 | 1047.4 | kg·m−3 |
| Viscosity | 4.8 | 2.8 | mPa·s |
| Specific heat | 3579 | 3624 | J·kg−1·K−1 |
| Conductivity | 0.418 | 0.437 | W·m−1·K−1 |
| Freezing Temperature | −18 | °C |
| Boiling temperature | 127 | °C |
Table 4.
Set of experiments in Mode 1.
Table 4.
Set of experiments in Mode 1.
| Initial PCM Temperature [°C] | Compressor Power [%] | Evaporation Set-Point [°C] |
|---|
| 12 | 15 | −10 |
| 30 |
| 45 |
| 60 |
| 75 |
Table 5.
Set of experiments in Mode 2.
Table 5.
Set of experiments in Mode 2.
| Initial PCM Temperature [°C] | HTF Inlet Temperature [°C] | HTF Flow Rate [L·h−1] |
|---|
| −4 | 09 | 150 |
| 12 |
| 15 |
| −4 | 09 | 100 |
| 12 |
| 15 |
| −4 | 09 | 50 |
| 12 |
| 15 |
Table 6.
Set of experiments in Mode 3a.
Table 6.
Set of experiments in Mode 3a.
| Initial PCM Temperature [°C] | Compressor Power [%] | Evaporation Set-Point Temperature [°C] | Inlet HTF Temperature [°C] | HTF Flow Rate [L·h−1] |
|---|
| 12 | 15 | −10 | 12 | 150 |
| 30 |
| 45 |
| 60 |
| 75 |
| 12 | 15 | −10 | 12 | 100 |
| 30 |
| 45 |
| 60 |
| 75 |
| 12 | 15 | −10 | 12 | 50 |
| 30 |
| 45 |
| 60 |
| 75 |
Table 7.
Set of experiments in Mode 3b.
Table 7.
Set of experiments in Mode 3b.
| Initial PCM Temperature [°C] | Compressor Power [%] | Evaporation Set-Point [°C] | Inlet HTF Temperature [°C] | HTF Flow Rate [L·h−1] |
|---|
| −4 | 15 | −10 | 12 | 150 |
| 30 |
| 45 |
| 60 |
| 75 |
| −4 | 15 | −10 | 12 | 100 |
| 30 |
| 45 |
| 60 |
| 75 |
| −4 | 15 | −10 | 12 | 50 |
| 30 |
| 45 |
| 60 |
| 75 |
Table 8.
Feasibility of the set of experiments in Mode 3a.
Table 8.
Feasibility of the set of experiments in Mode 3a.
| Mode 3a: Initial Temperature at 12 °C |
|---|
| Compressor Power [%] | Flow Rate [L·h−1] |
|---|
| 50 | 100 | 150 |
|---|
| 15 | ✔ | ✔ | ✔ |
| 30 | ✔ | ✔ | ✔ |
| 45 | X | ✔ | ✔ |
| 60 | X | ✔ | ✔ |
| 75 | X | X | X |
Table 9.
Feasibility of the set of experiments in Mode 3b.
Table 9.
Feasibility of the set of experiments in Mode 3b.
| Mode 3b: Initial Temperature at −4 °C |
|---|
| Compressor Power [%] | Flow Rate [L·h−1] |
|---|
| 50 | 100 | 150 |
|---|
| 15 | ✔ | ✔ | ✔ |
| 30 | X | X | X |
| 45 | X | X | X |
| 60 | X | X | X |
| 75 | X | X | X |


