Determination of the Long-Term Ground Surface Displacements Using a PSI Technique—Case Study on Wrocław (Poland)

 , , , and
Abstract
:
1. Introduction
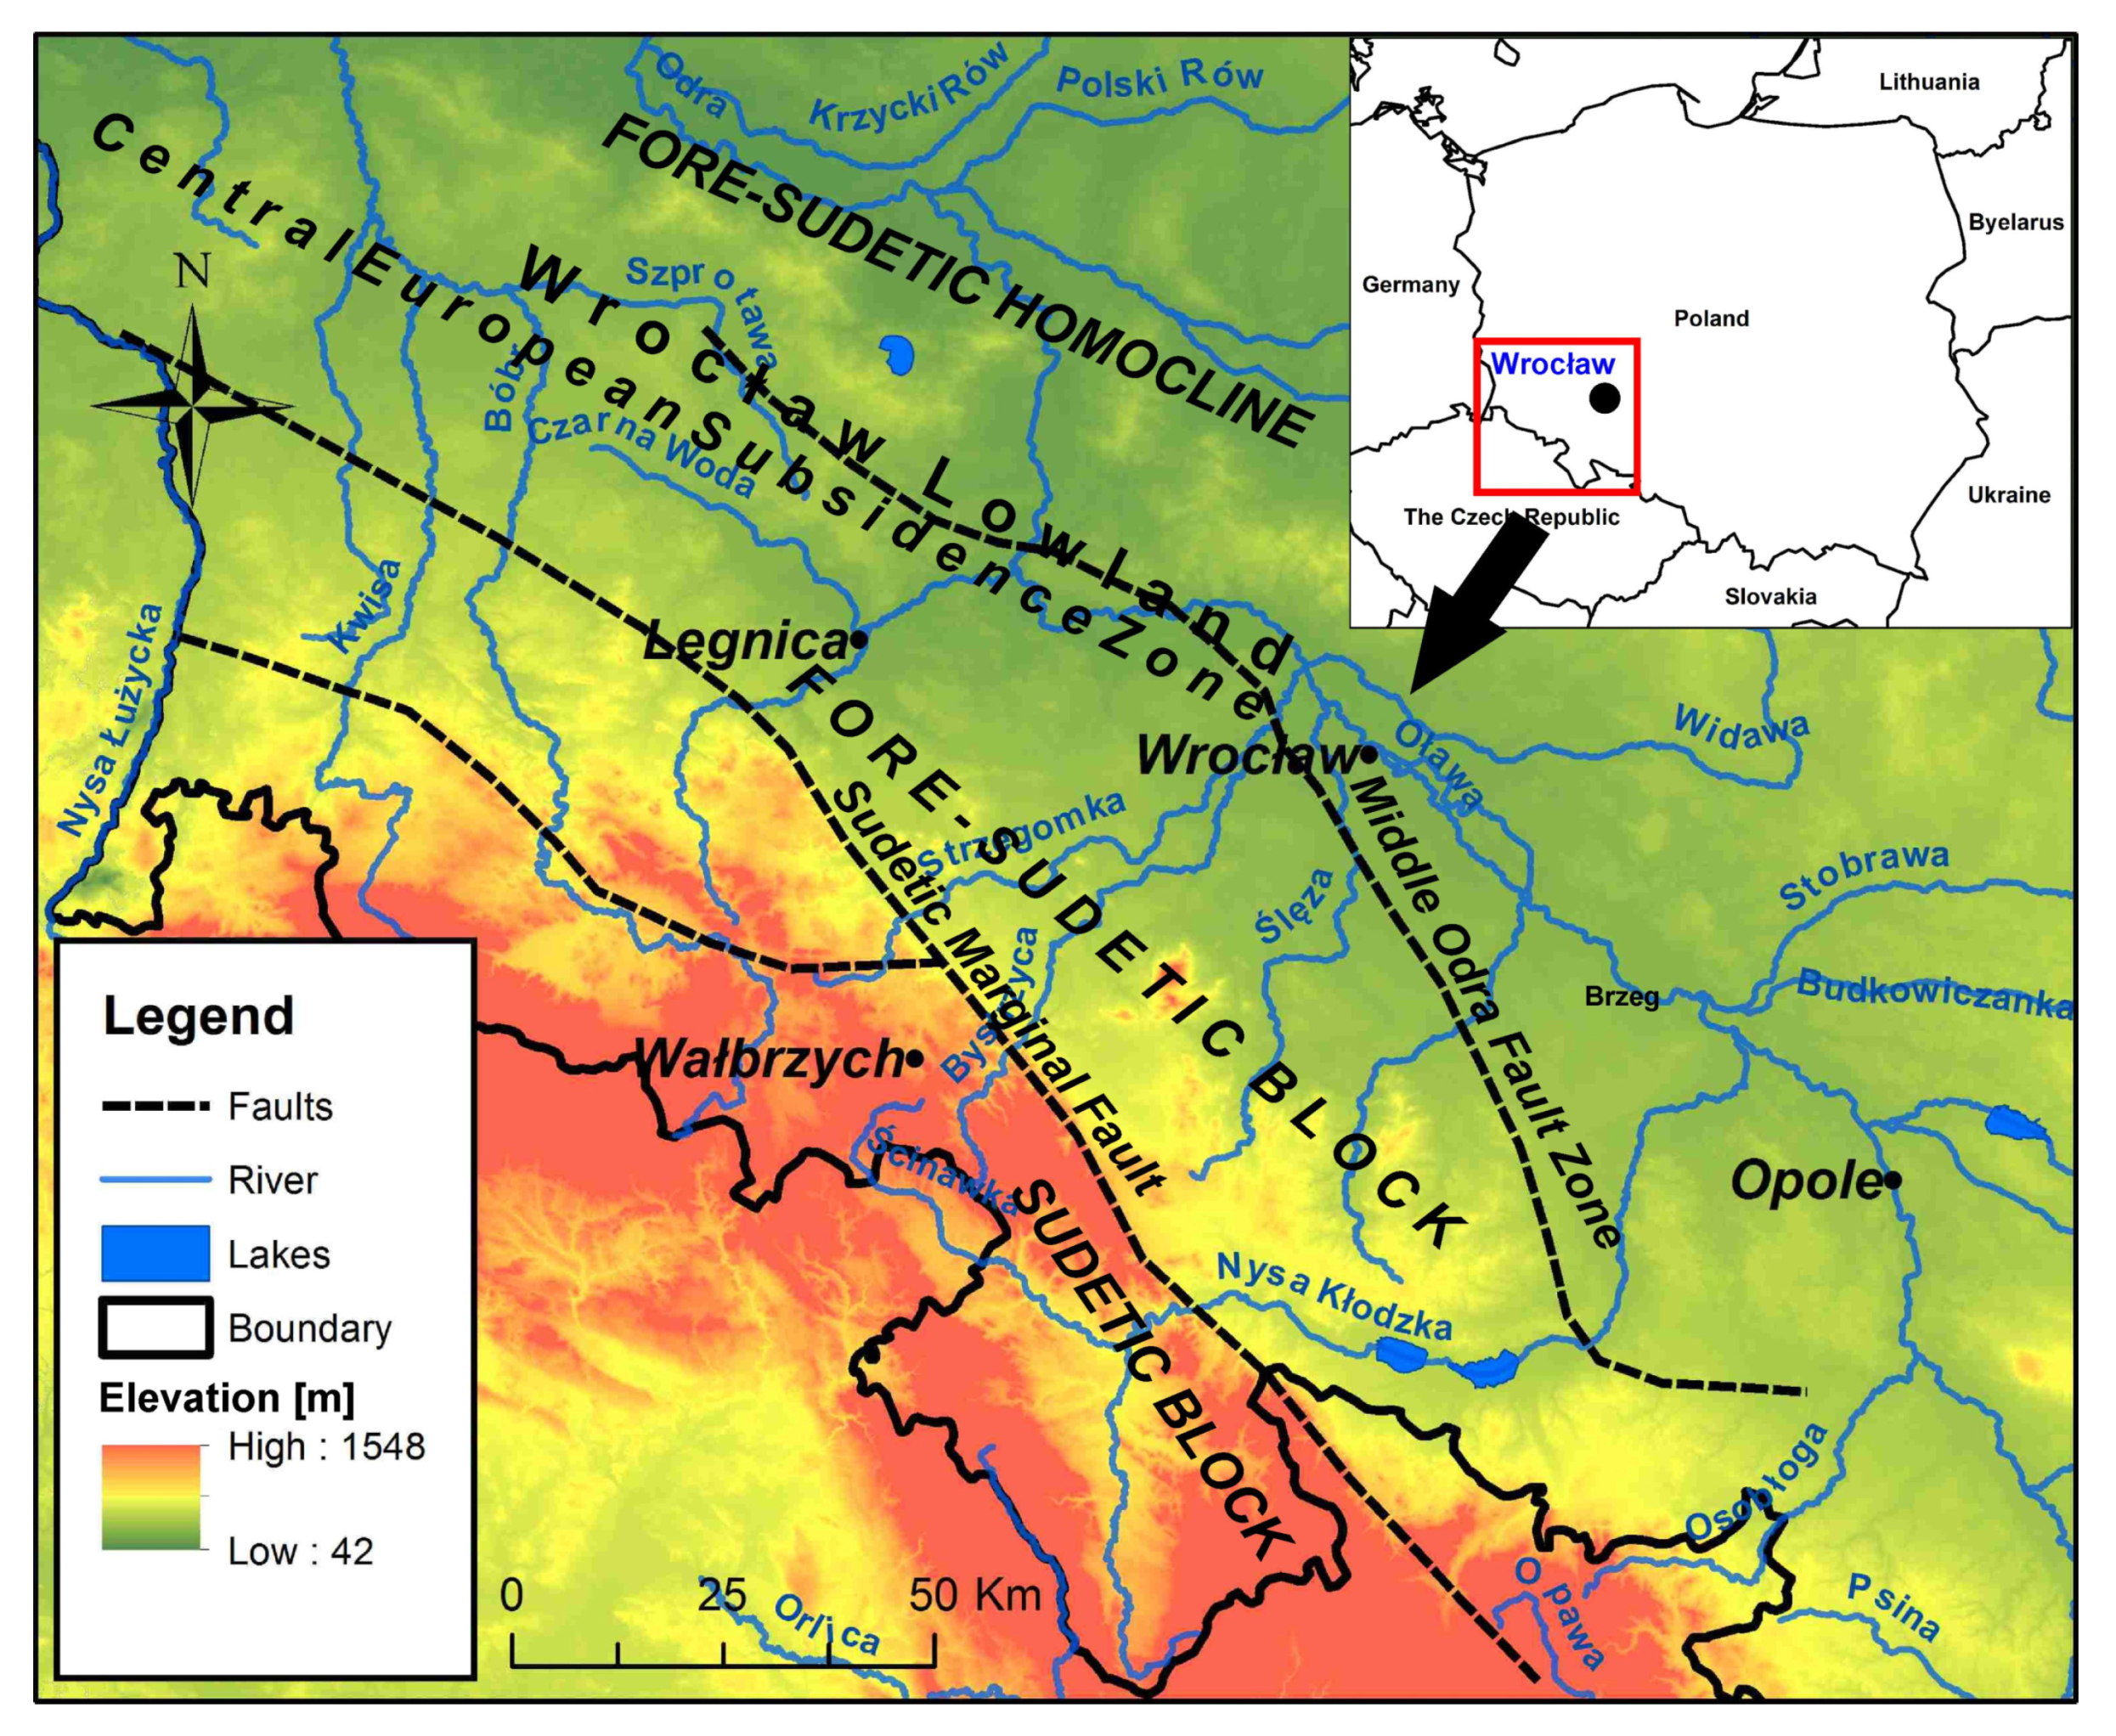
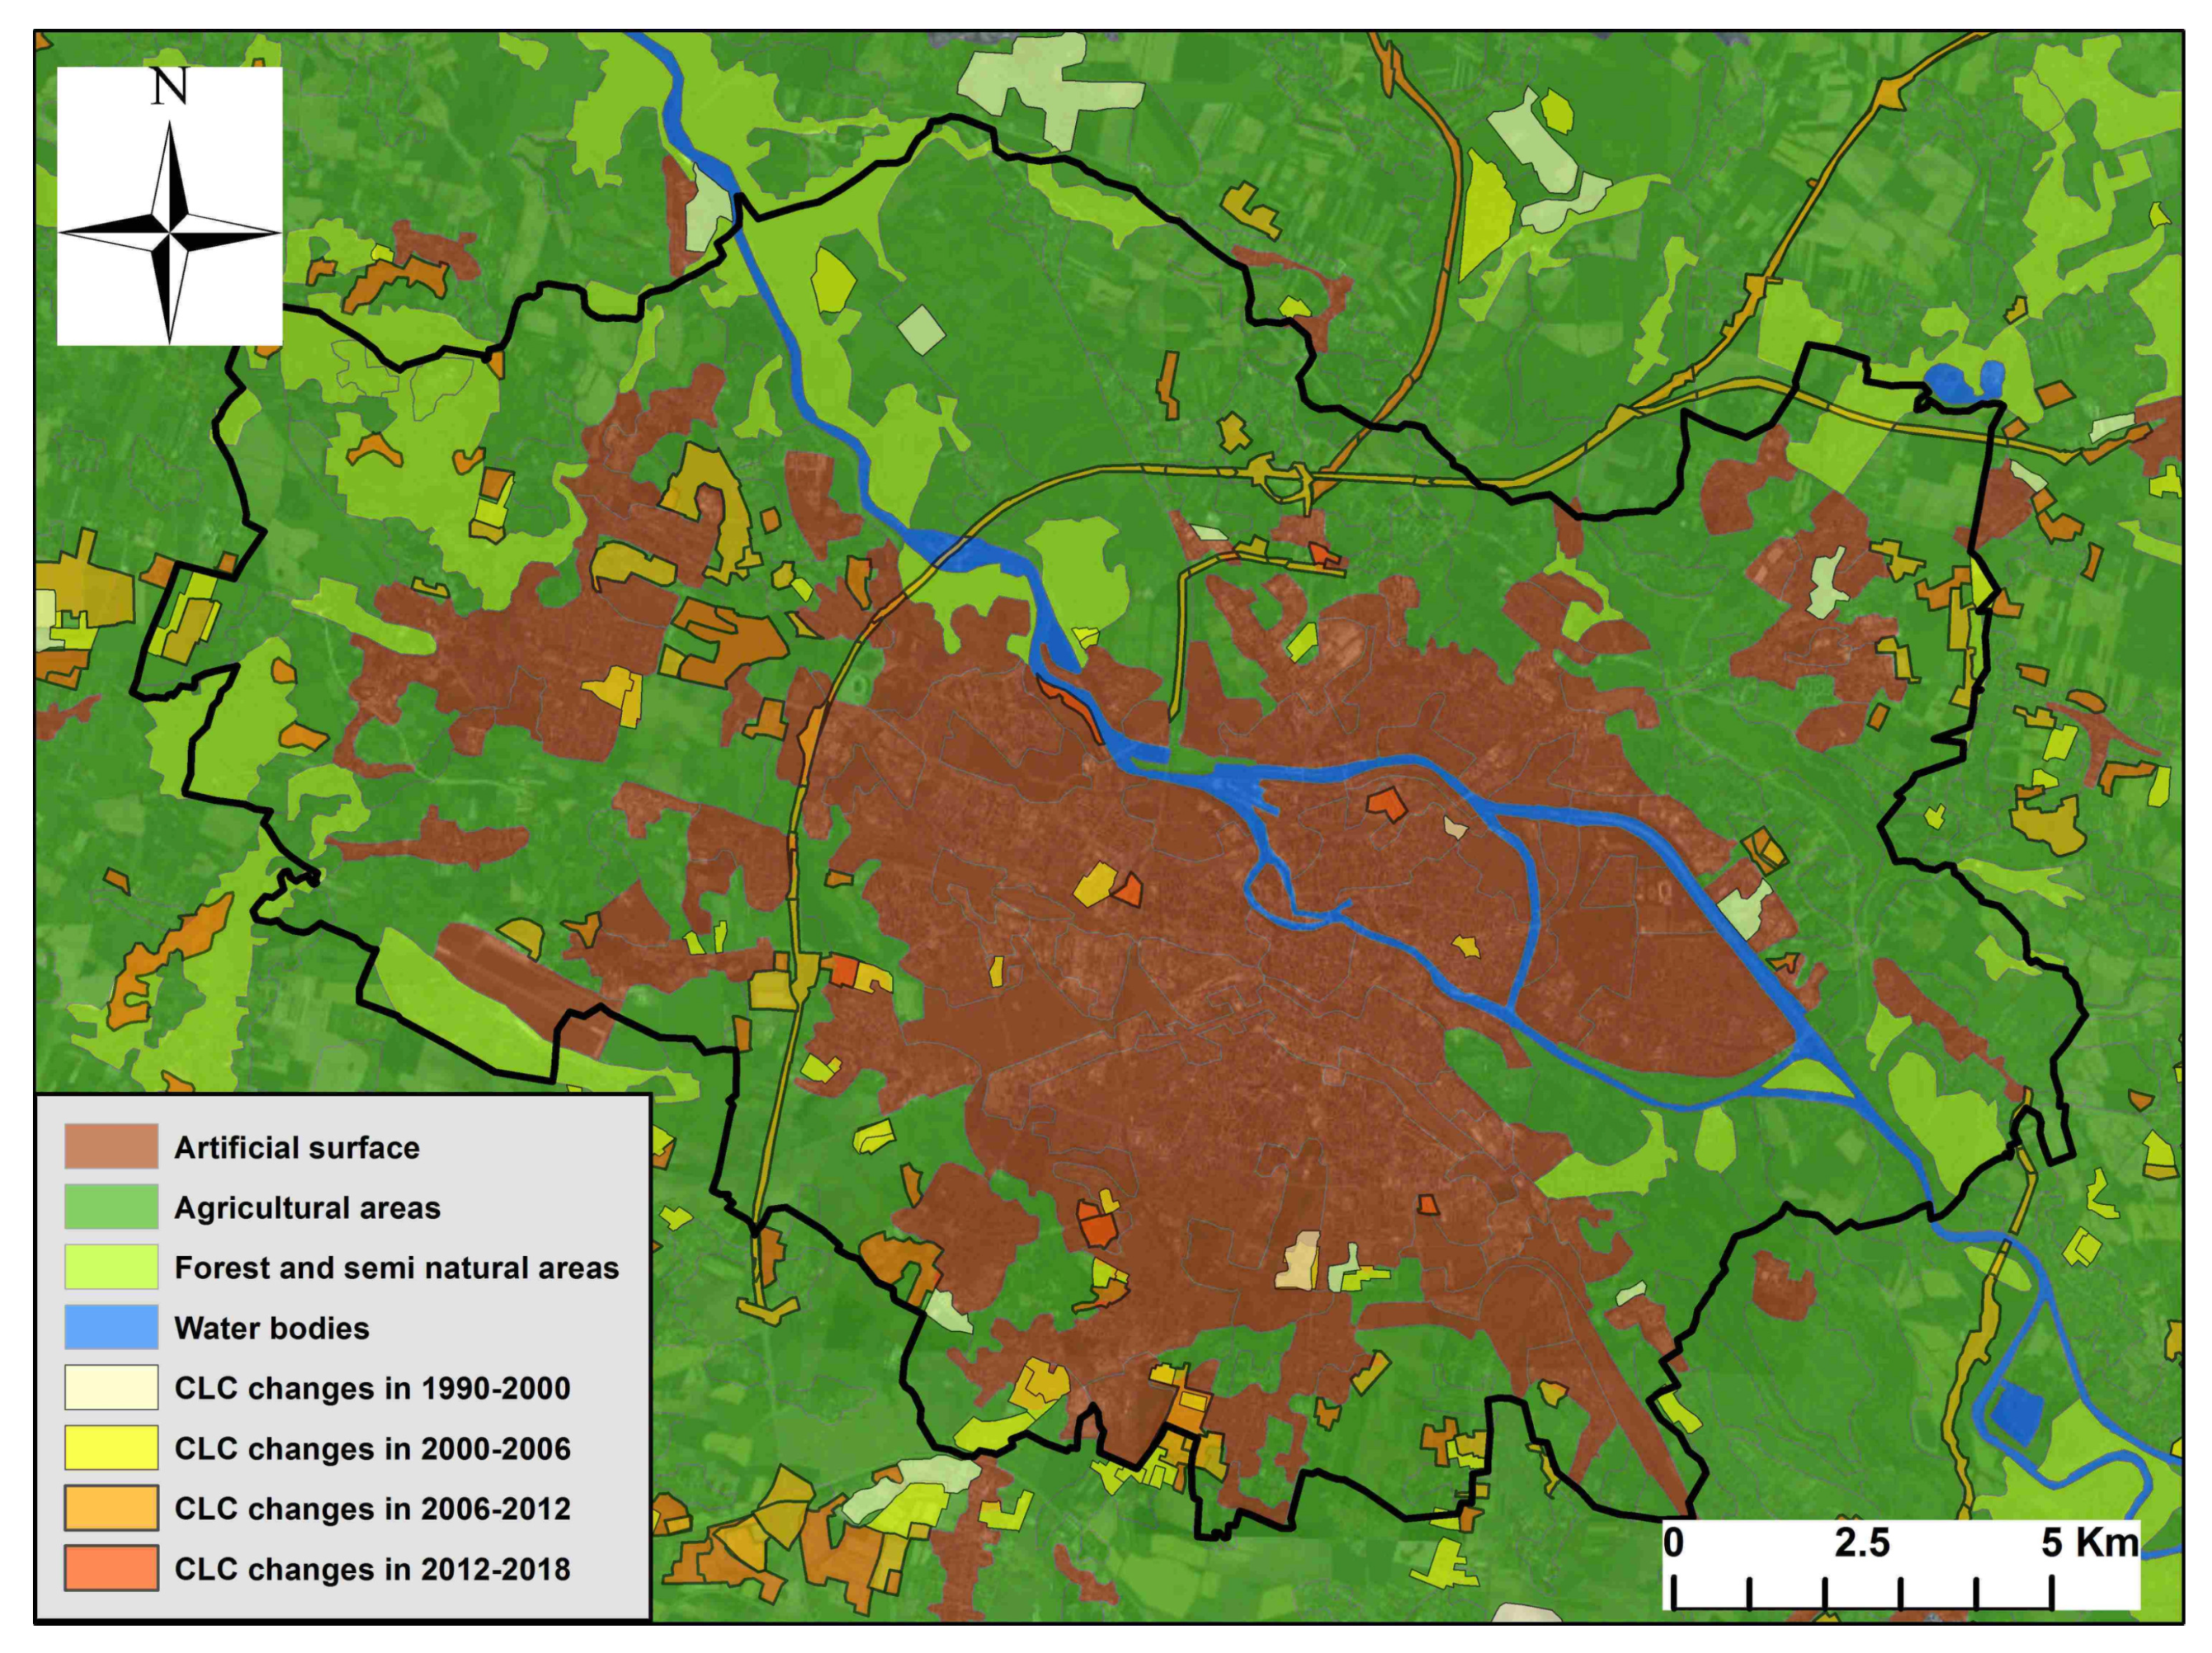
2. Characteristics of the Research Area
3. Data and Methodology
3.1. SAR Data
3.2. PSI Technique and Data Processing
- —phase change due to terrain deformation,
- —phase change due to atmospheric contribution,
- —phase due to orbit inaccuracies,
- —the residual topographic phase due to error in the DEM,
- n—phase noise.
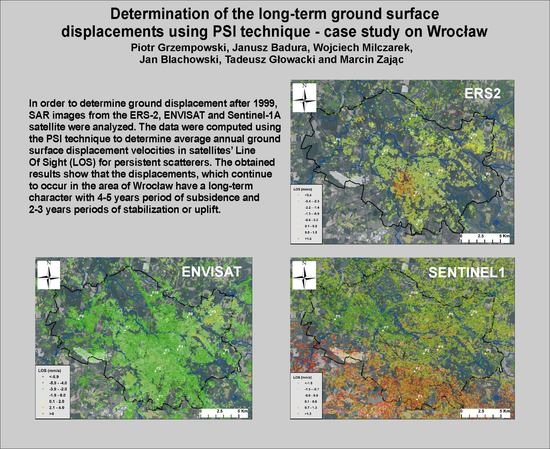
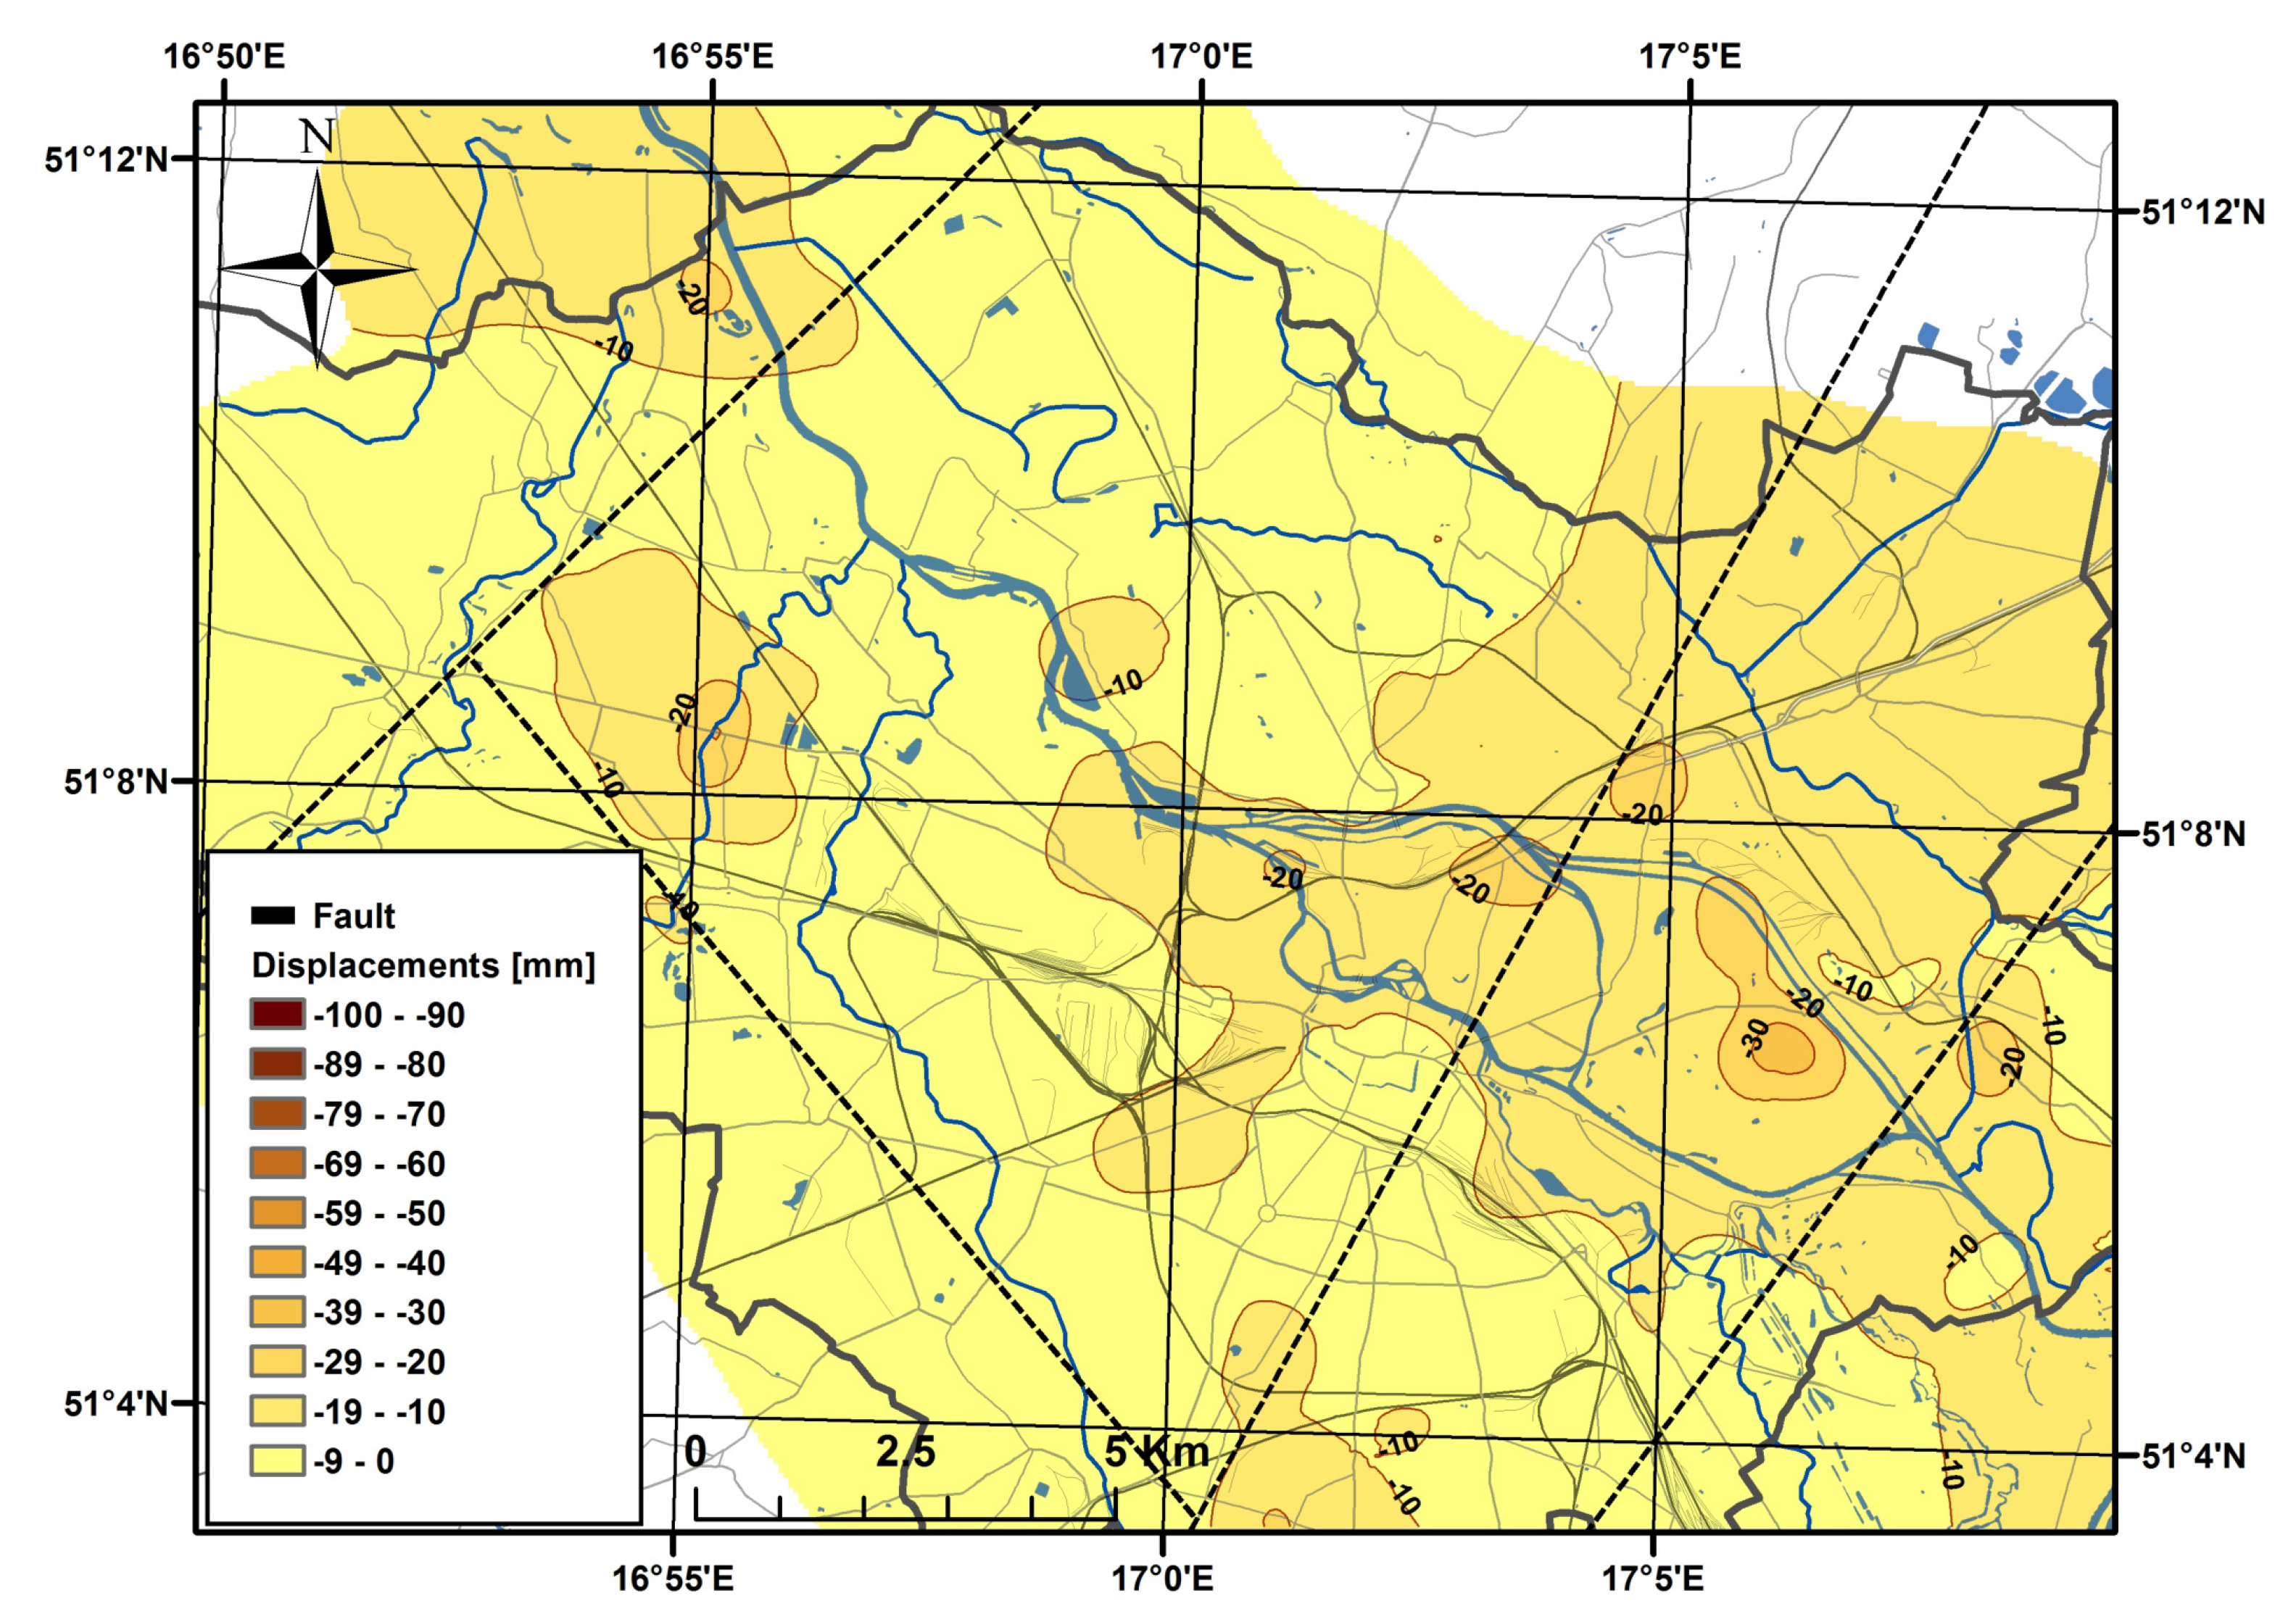
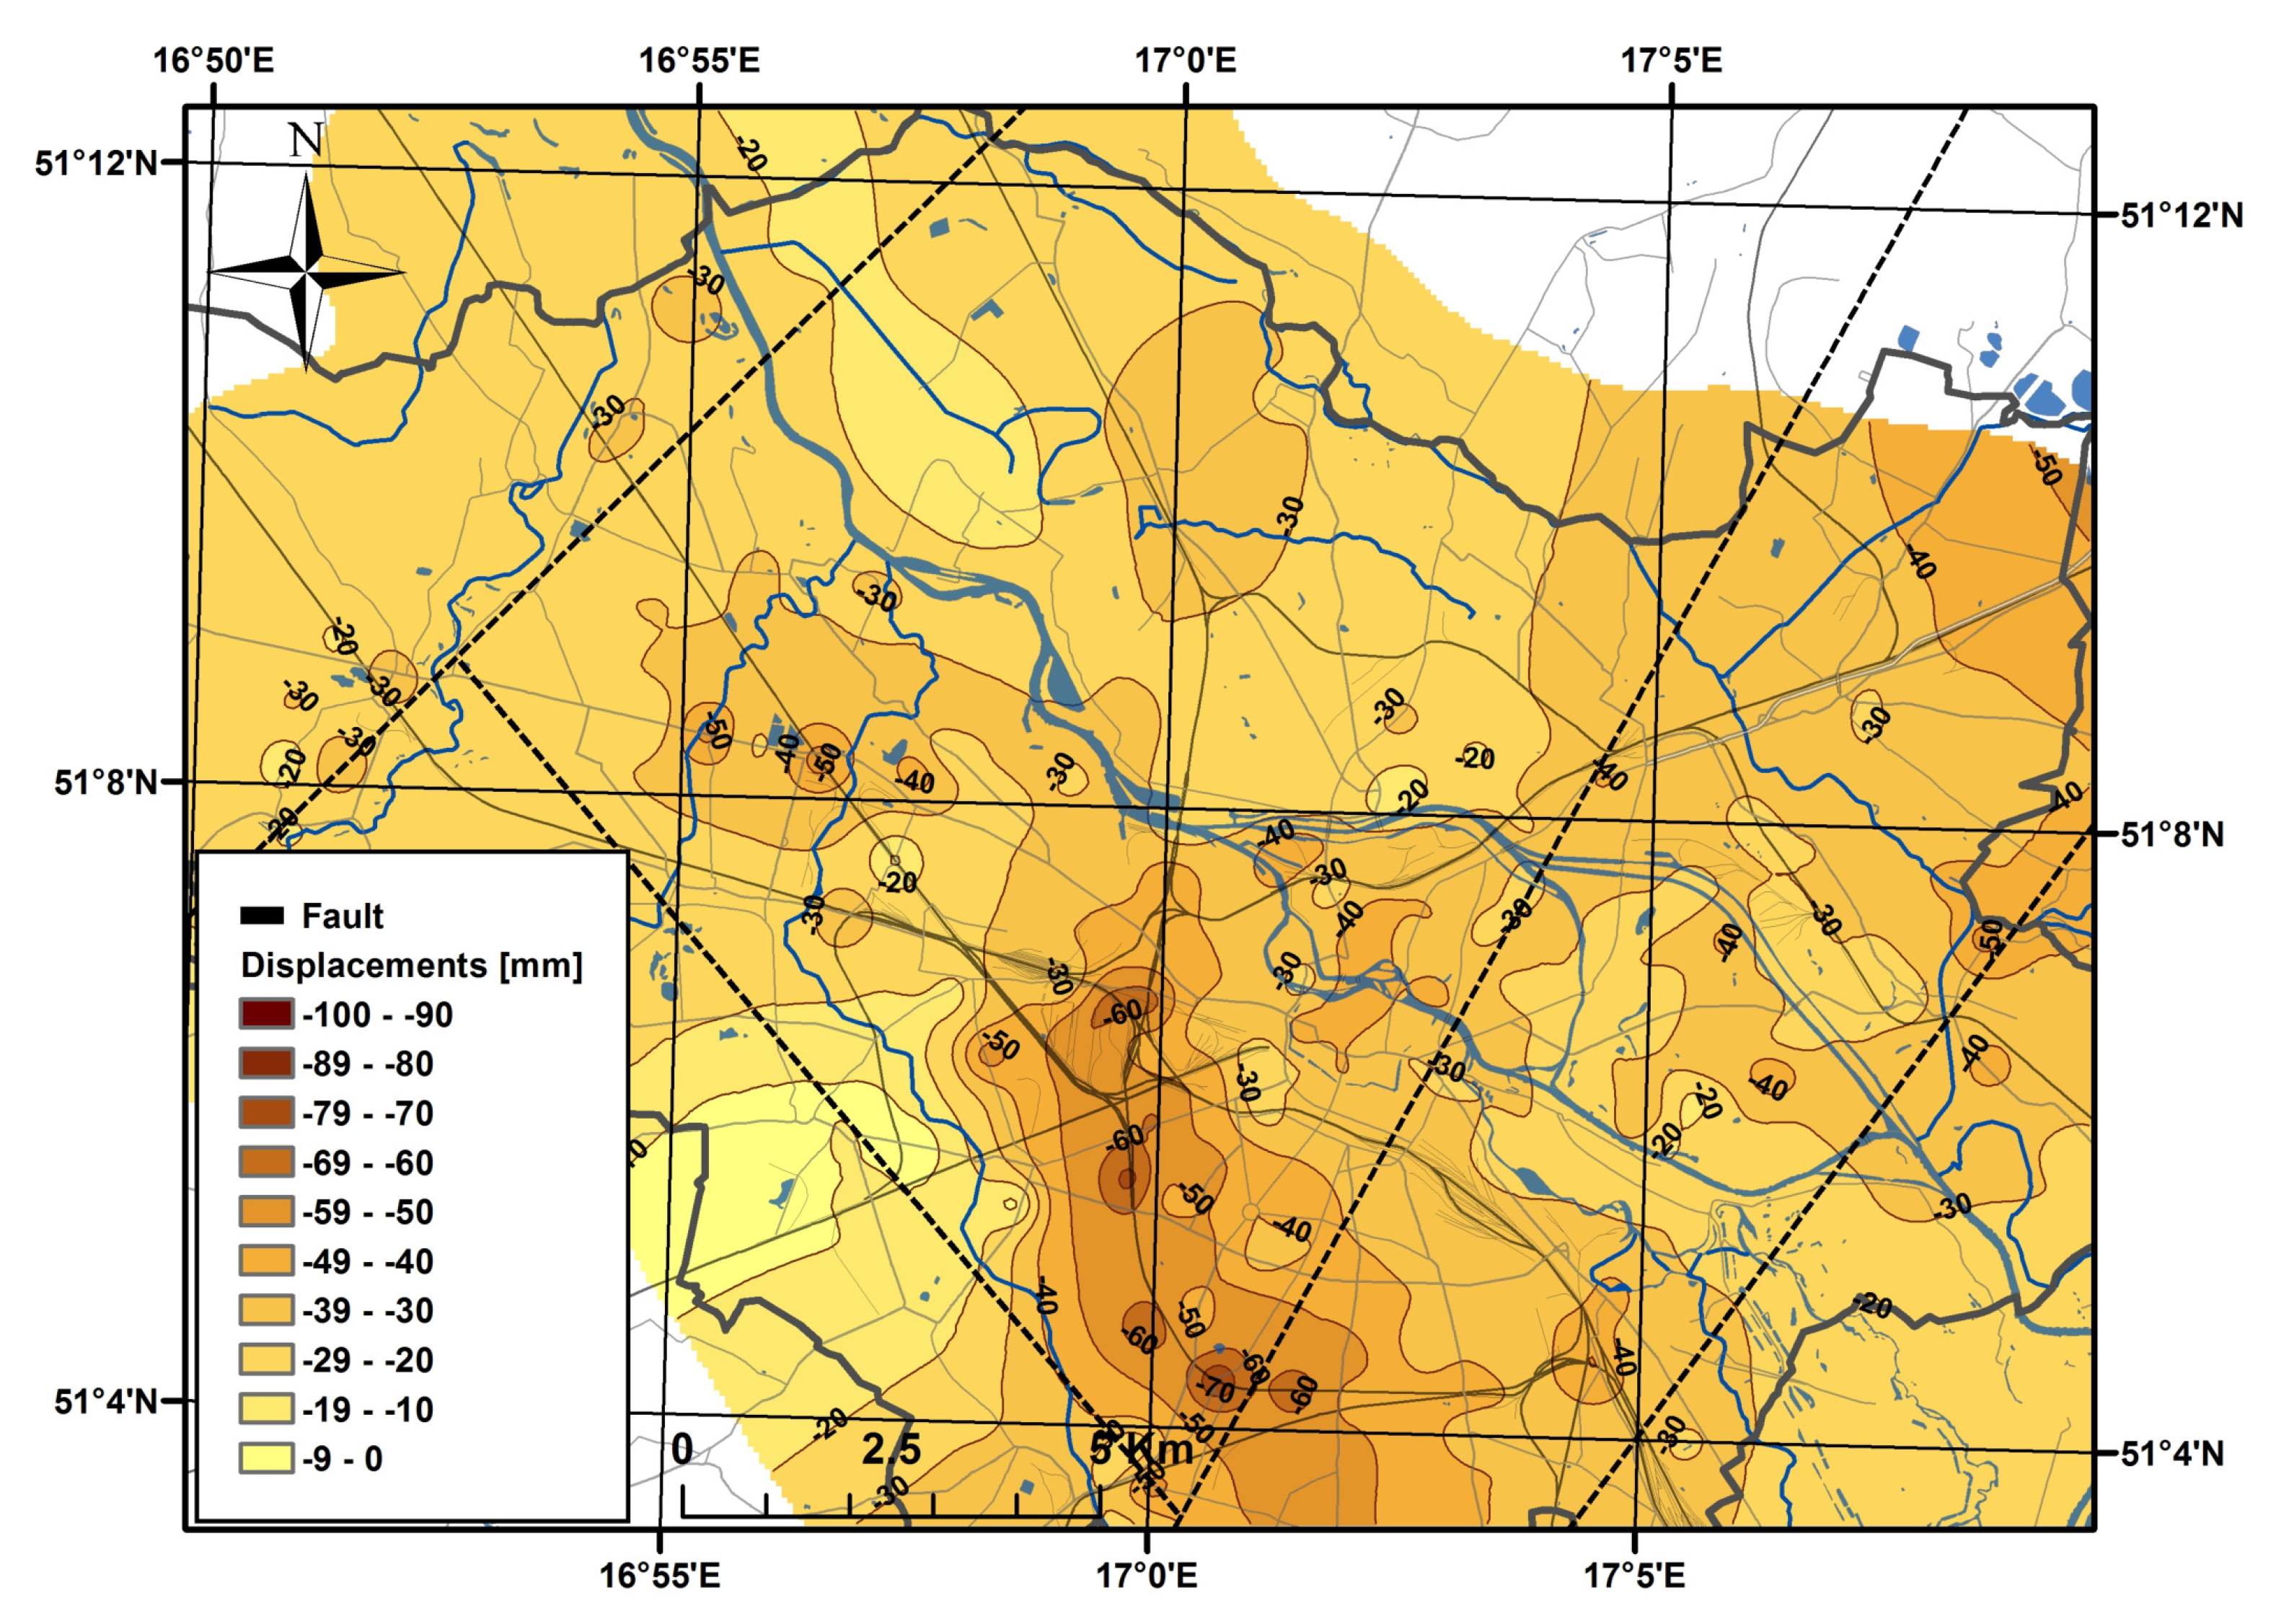
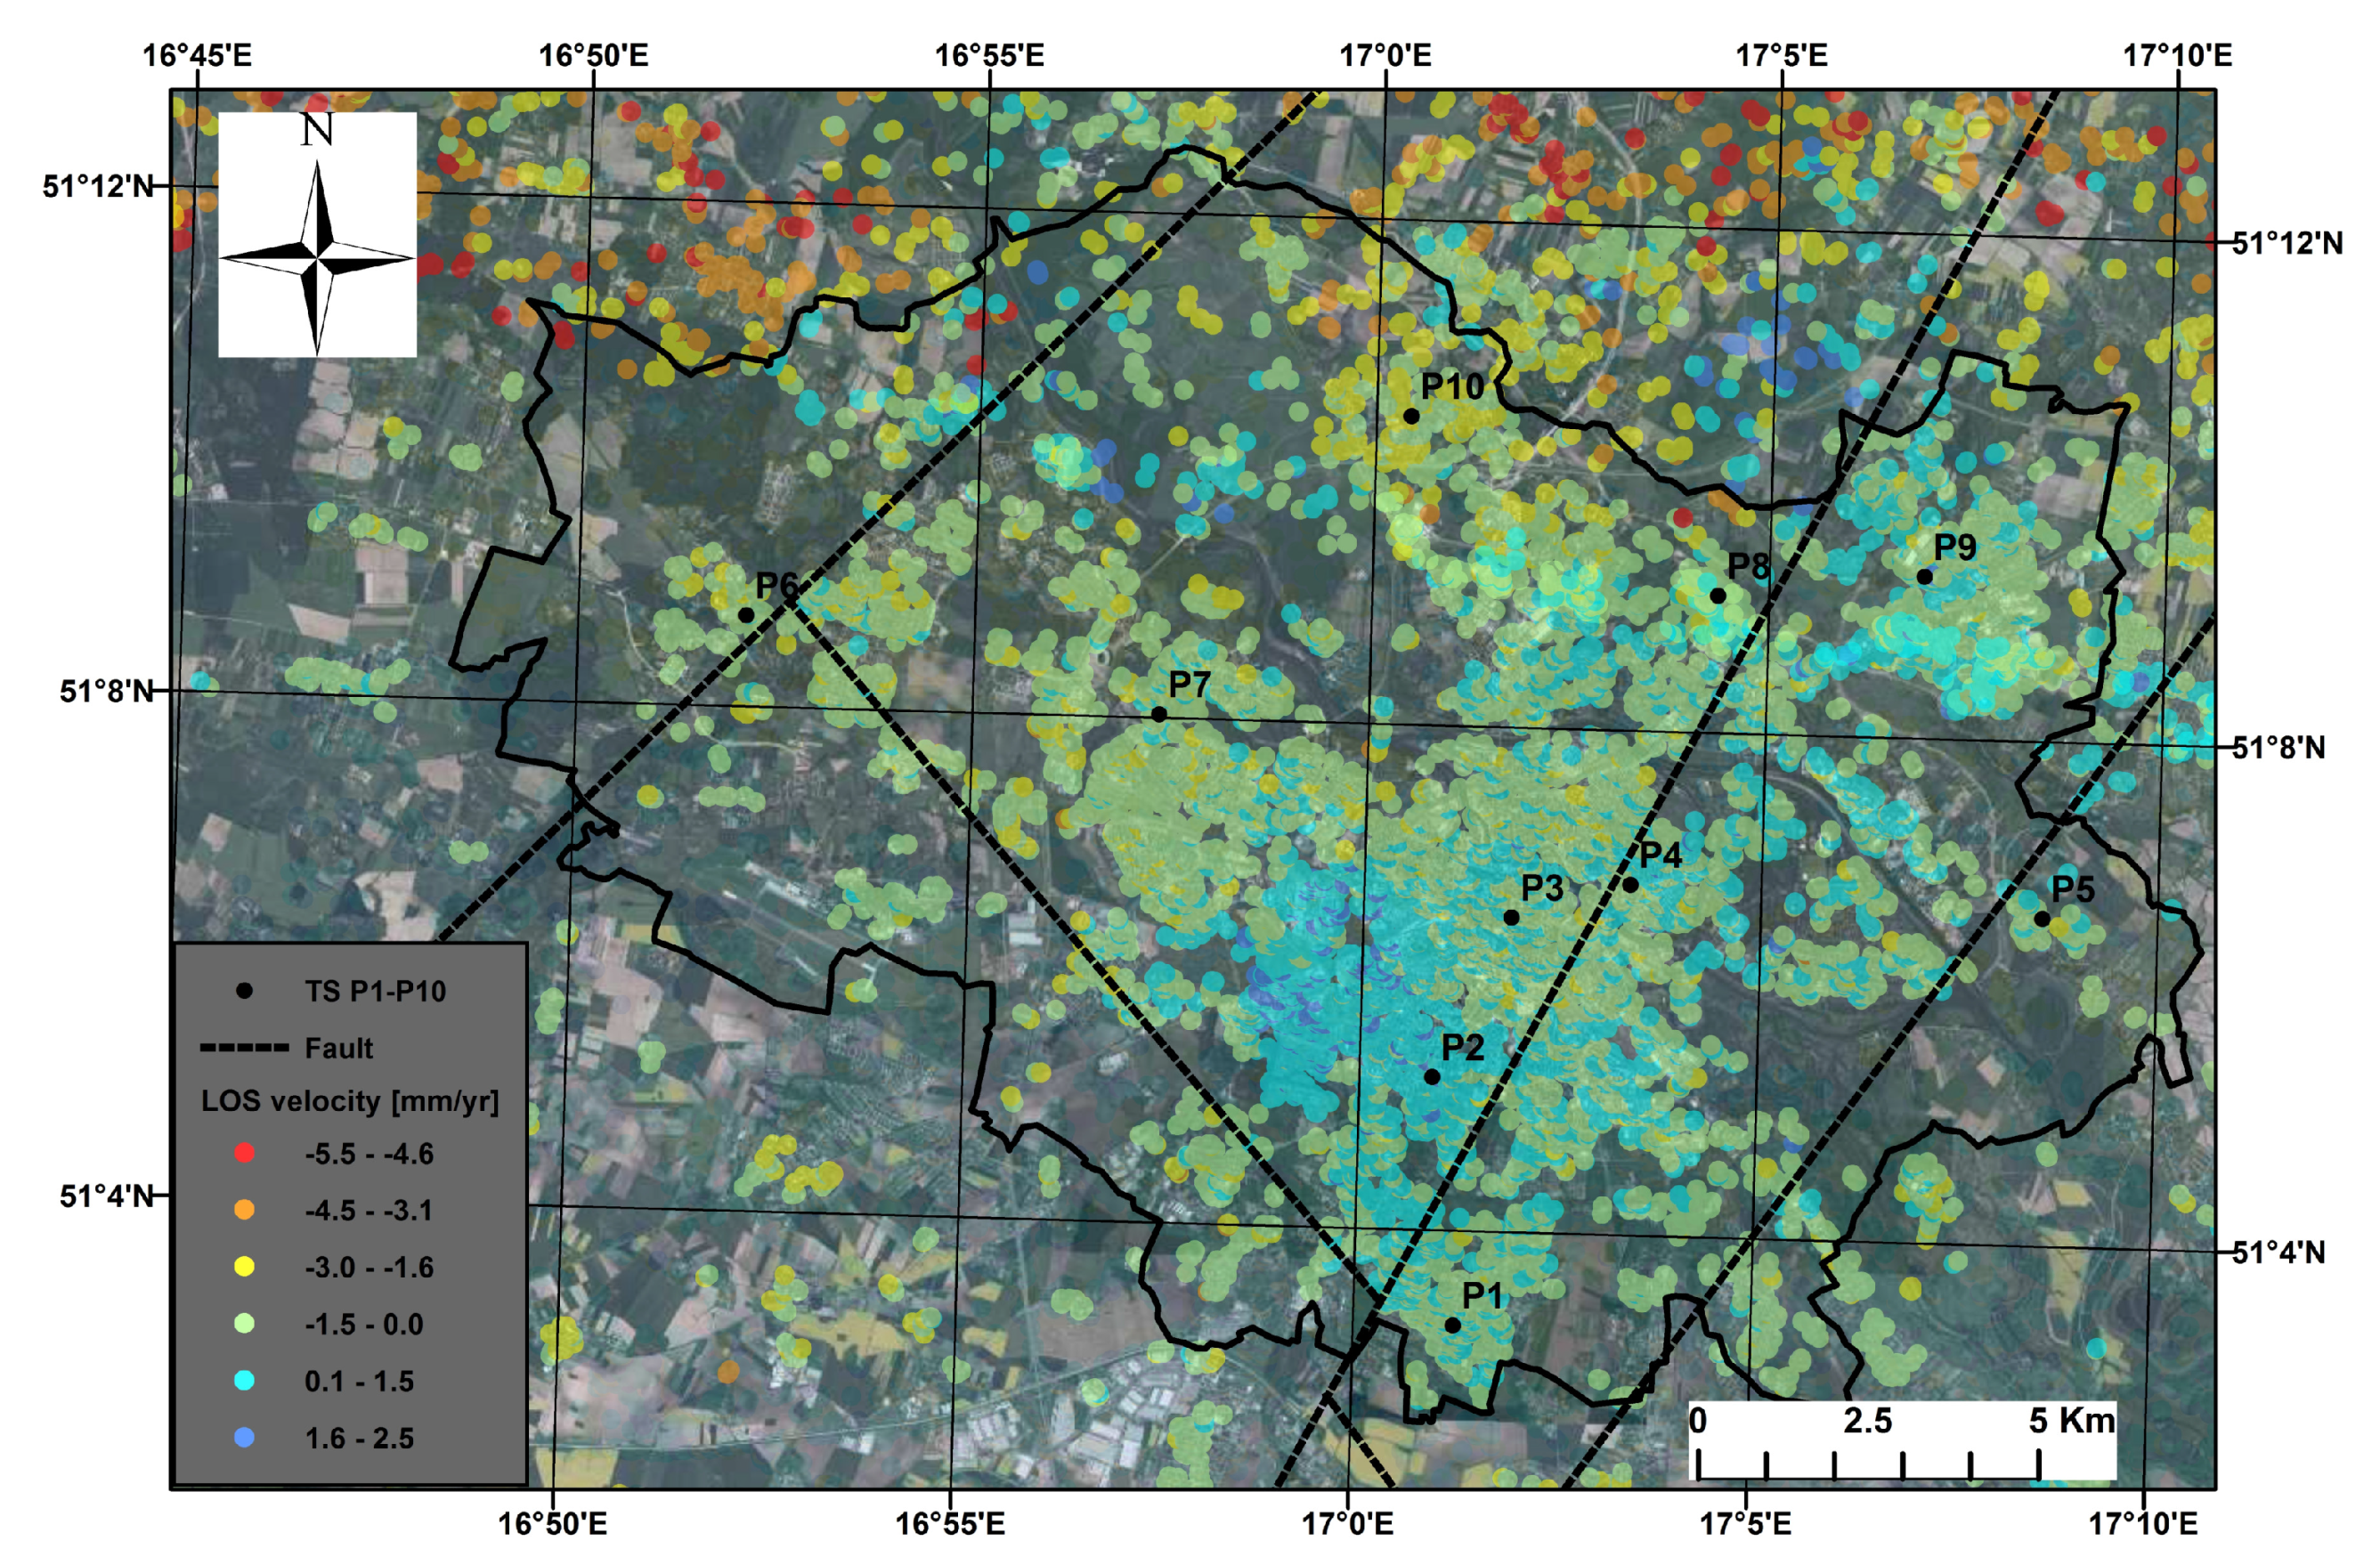
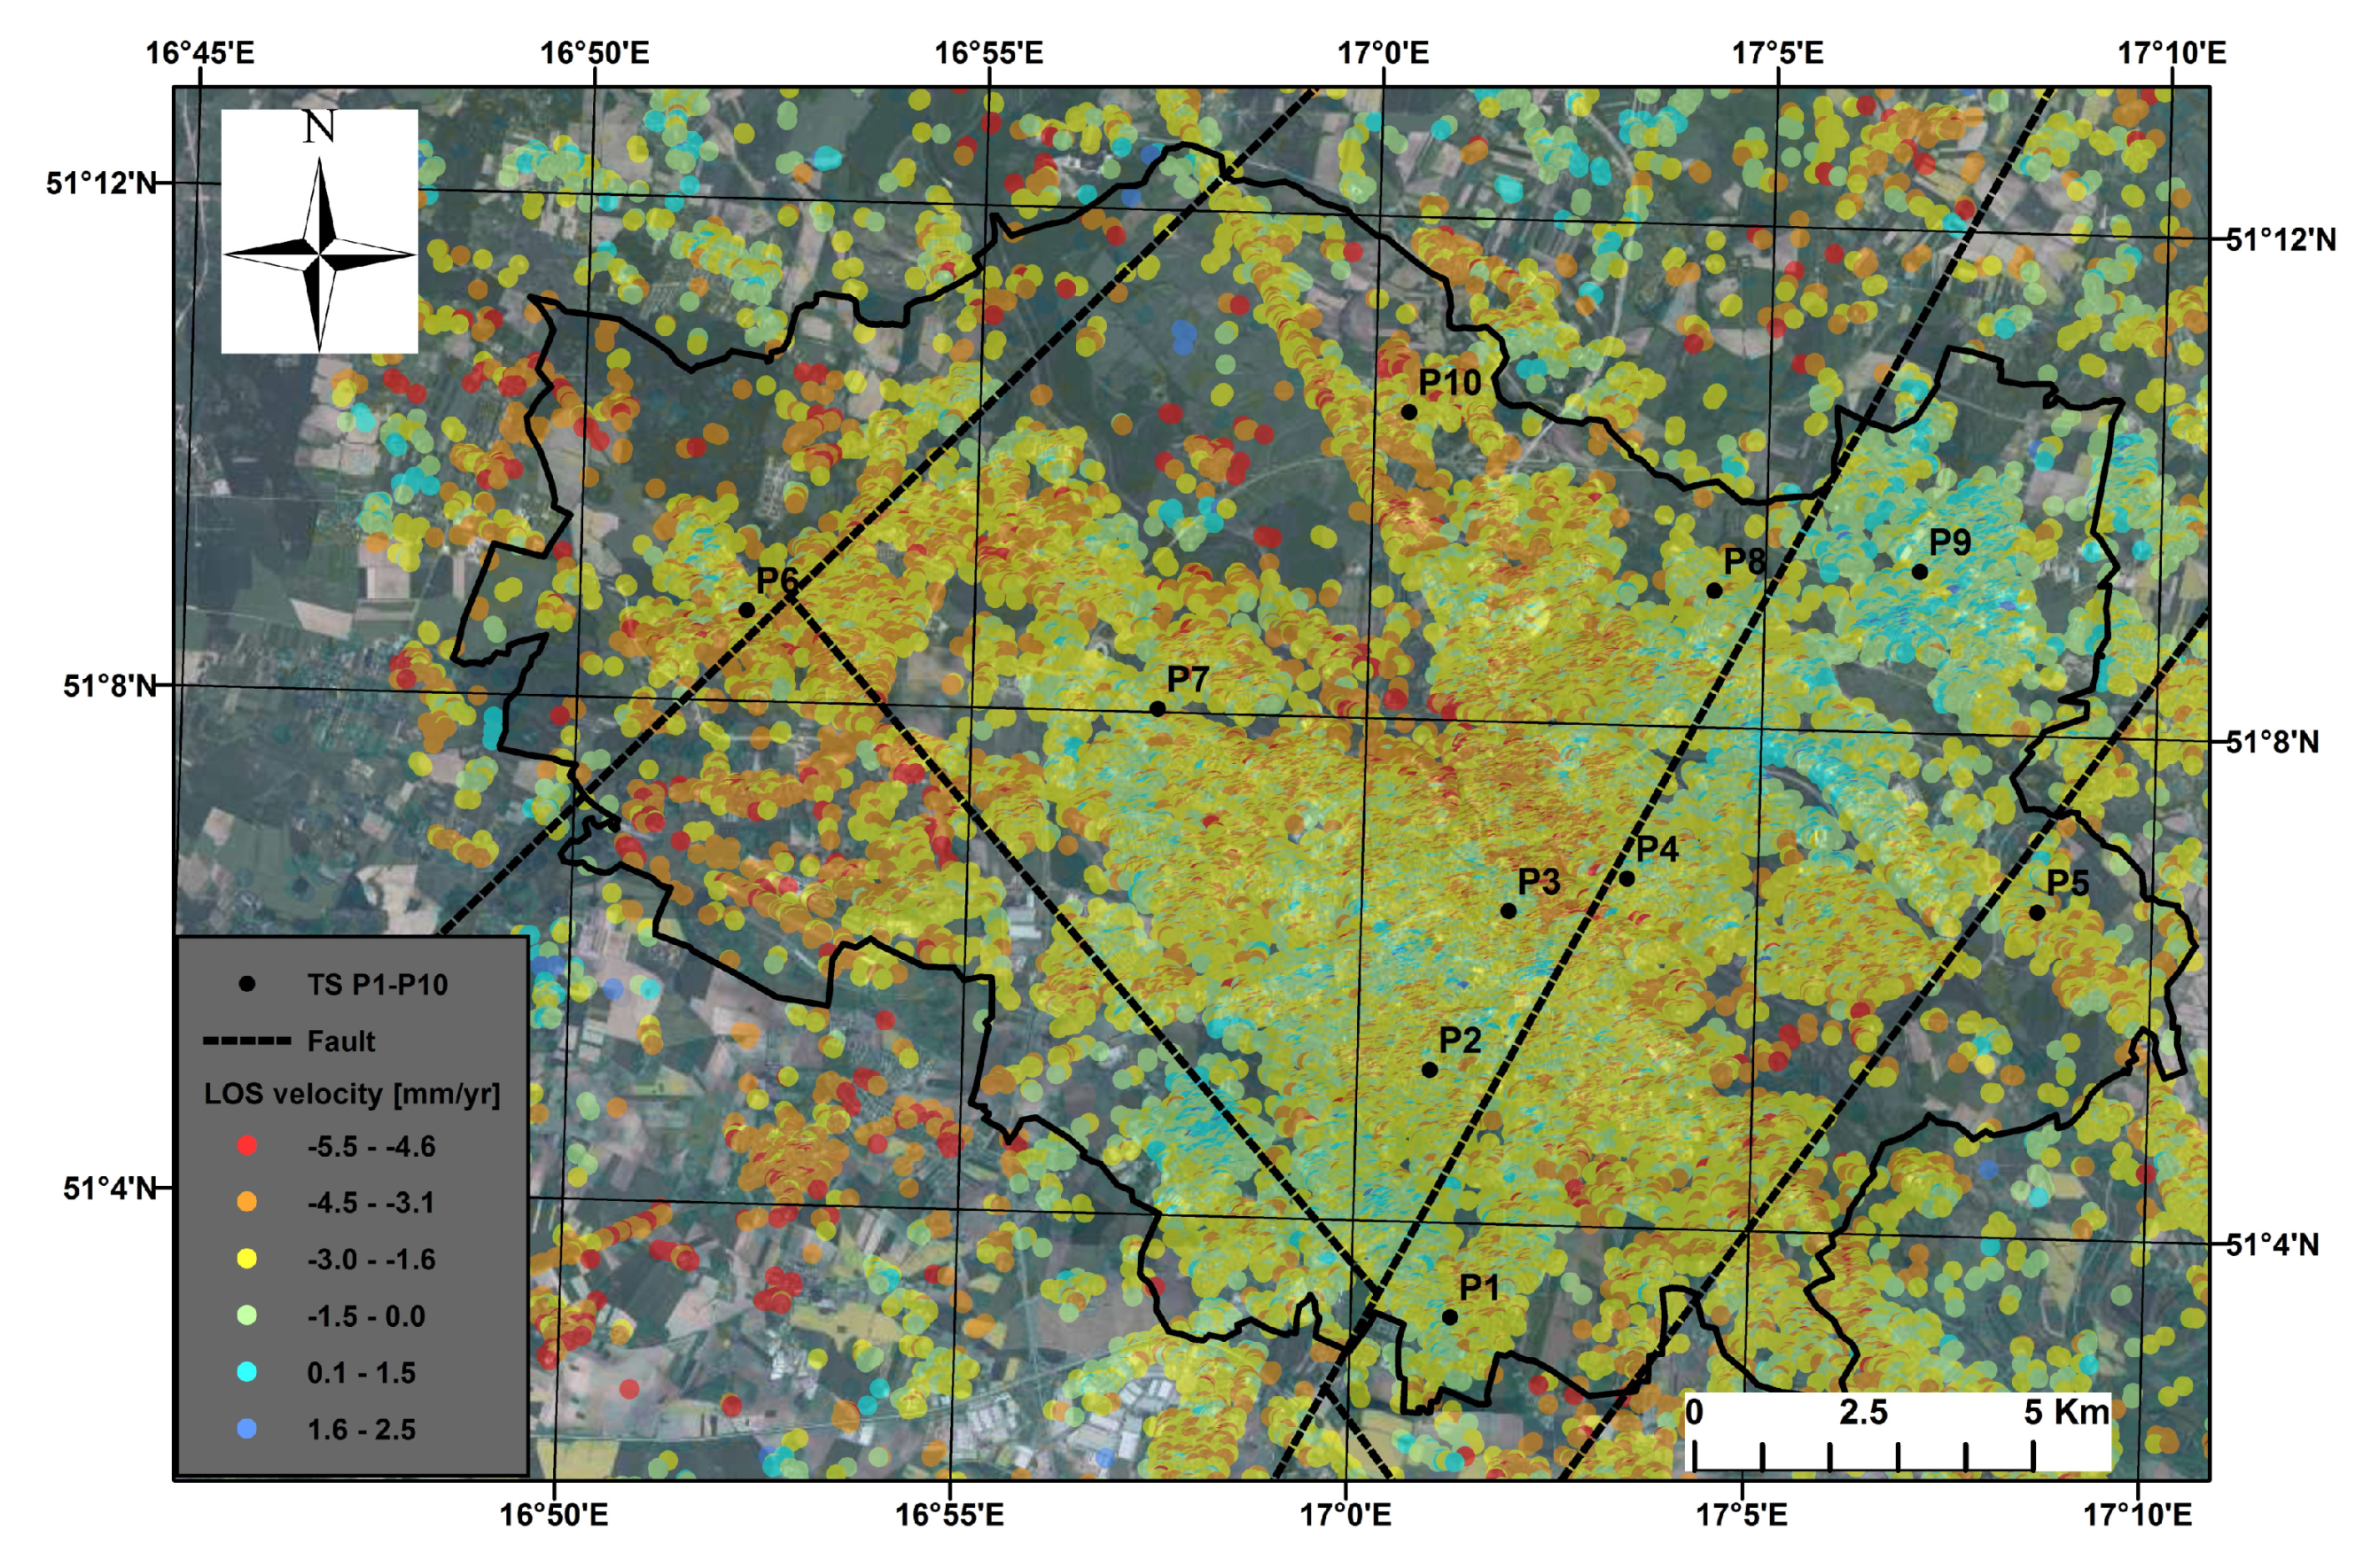
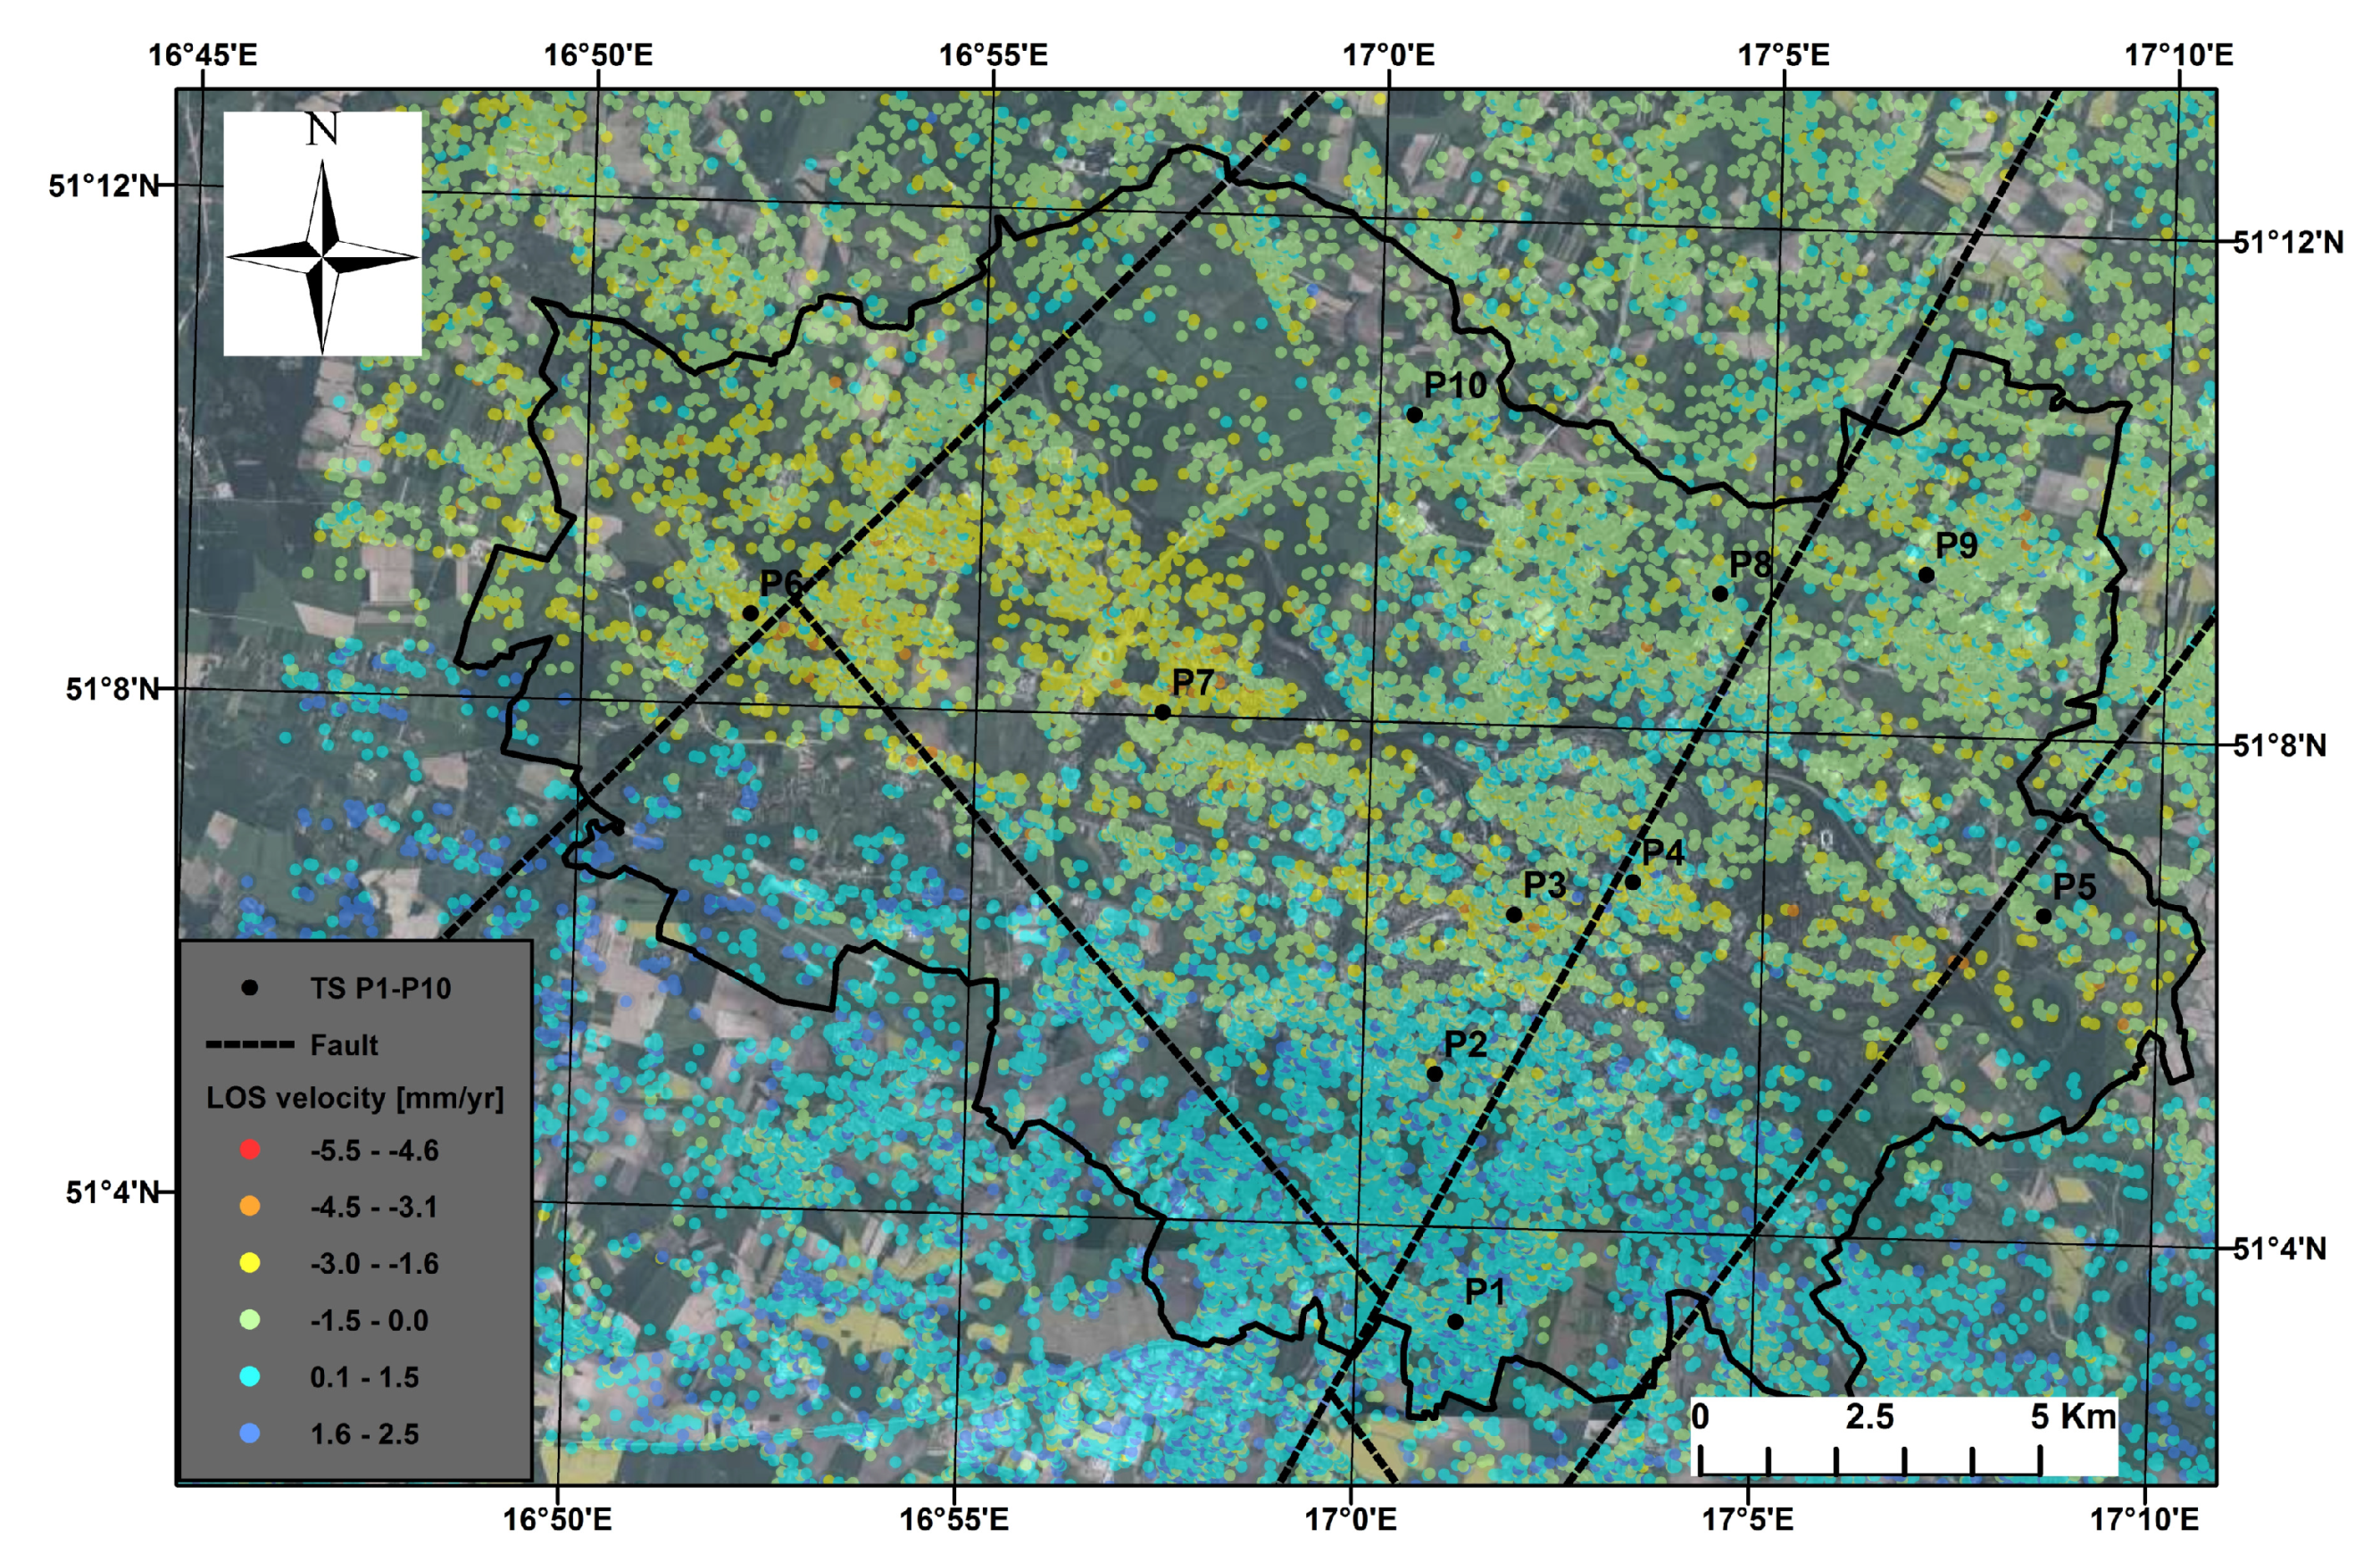
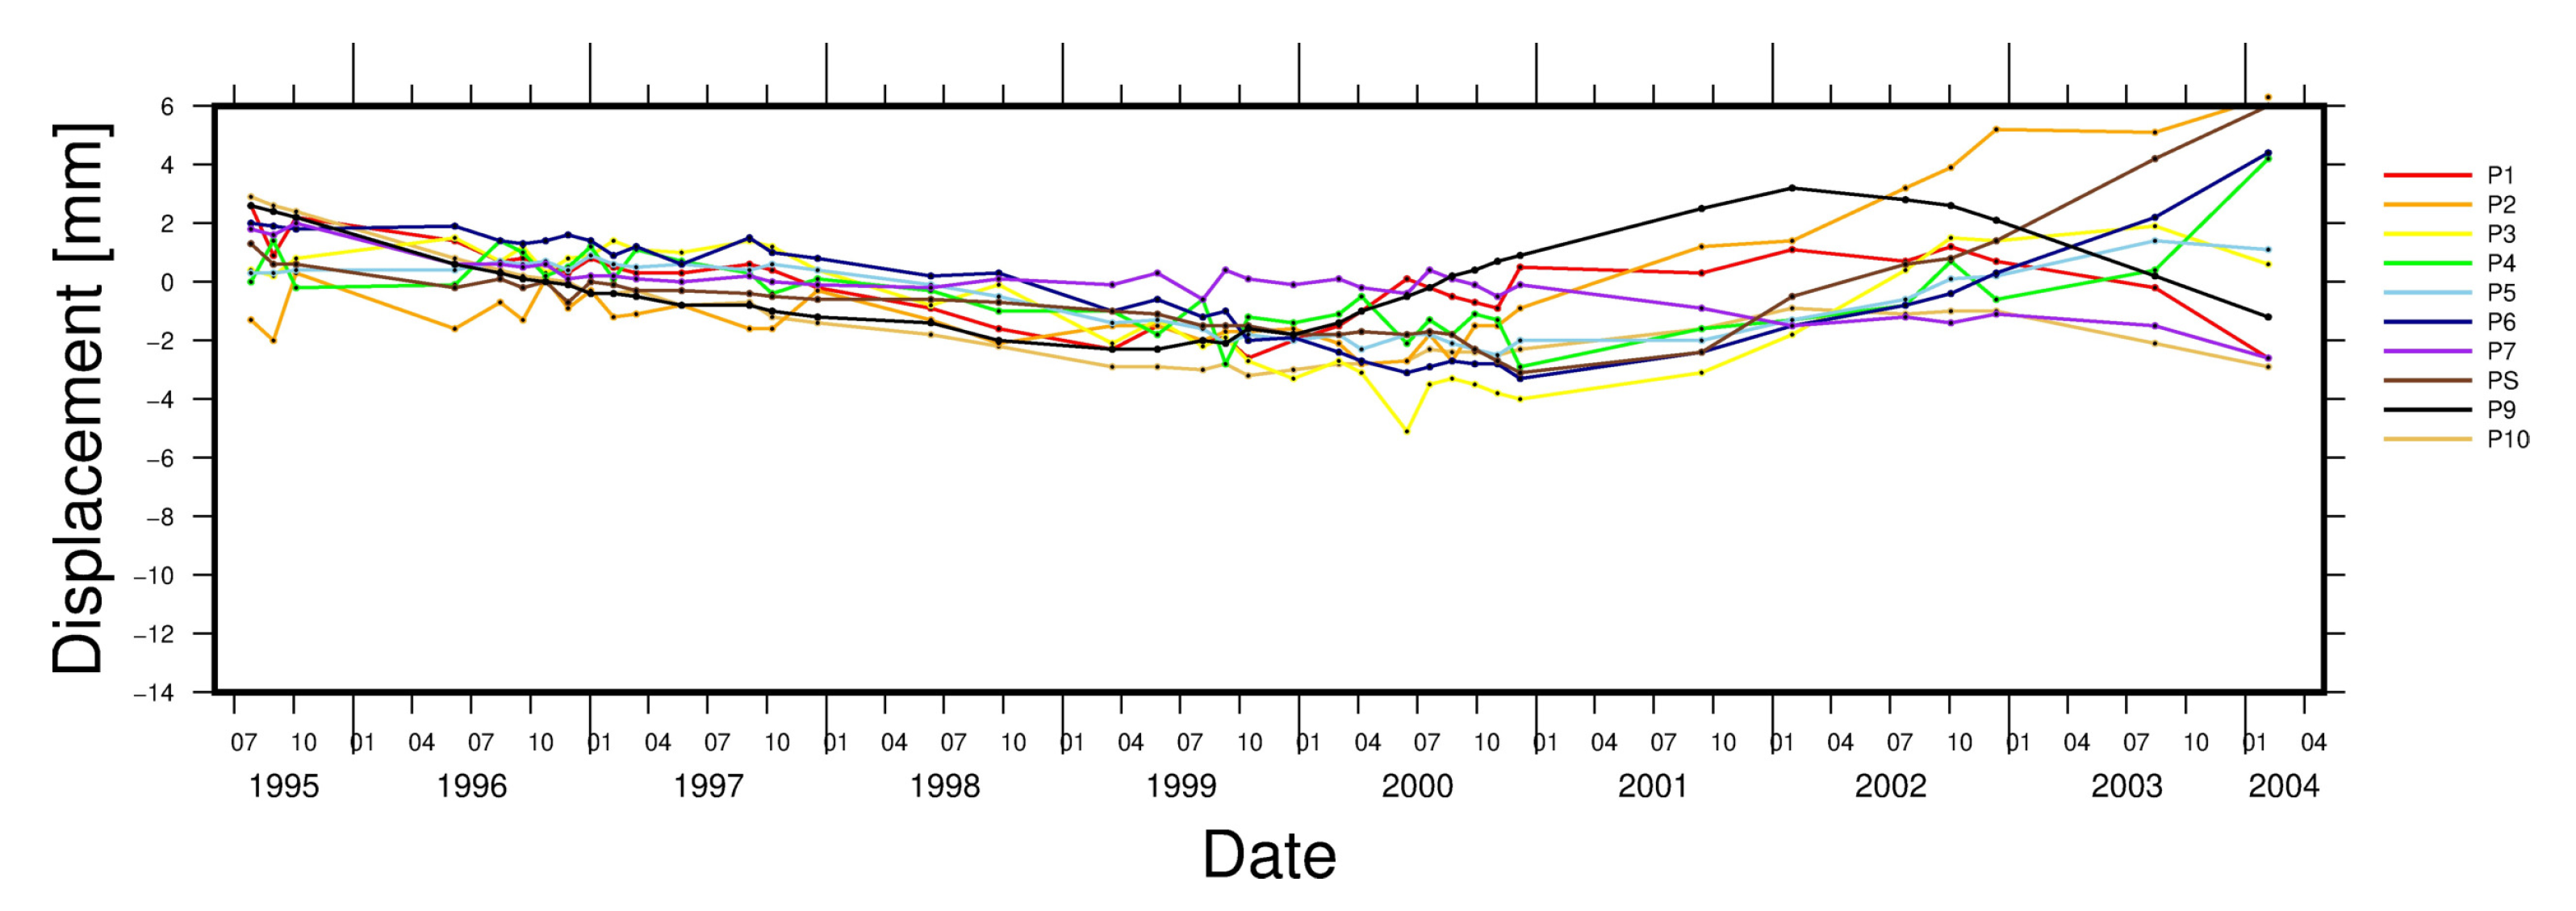
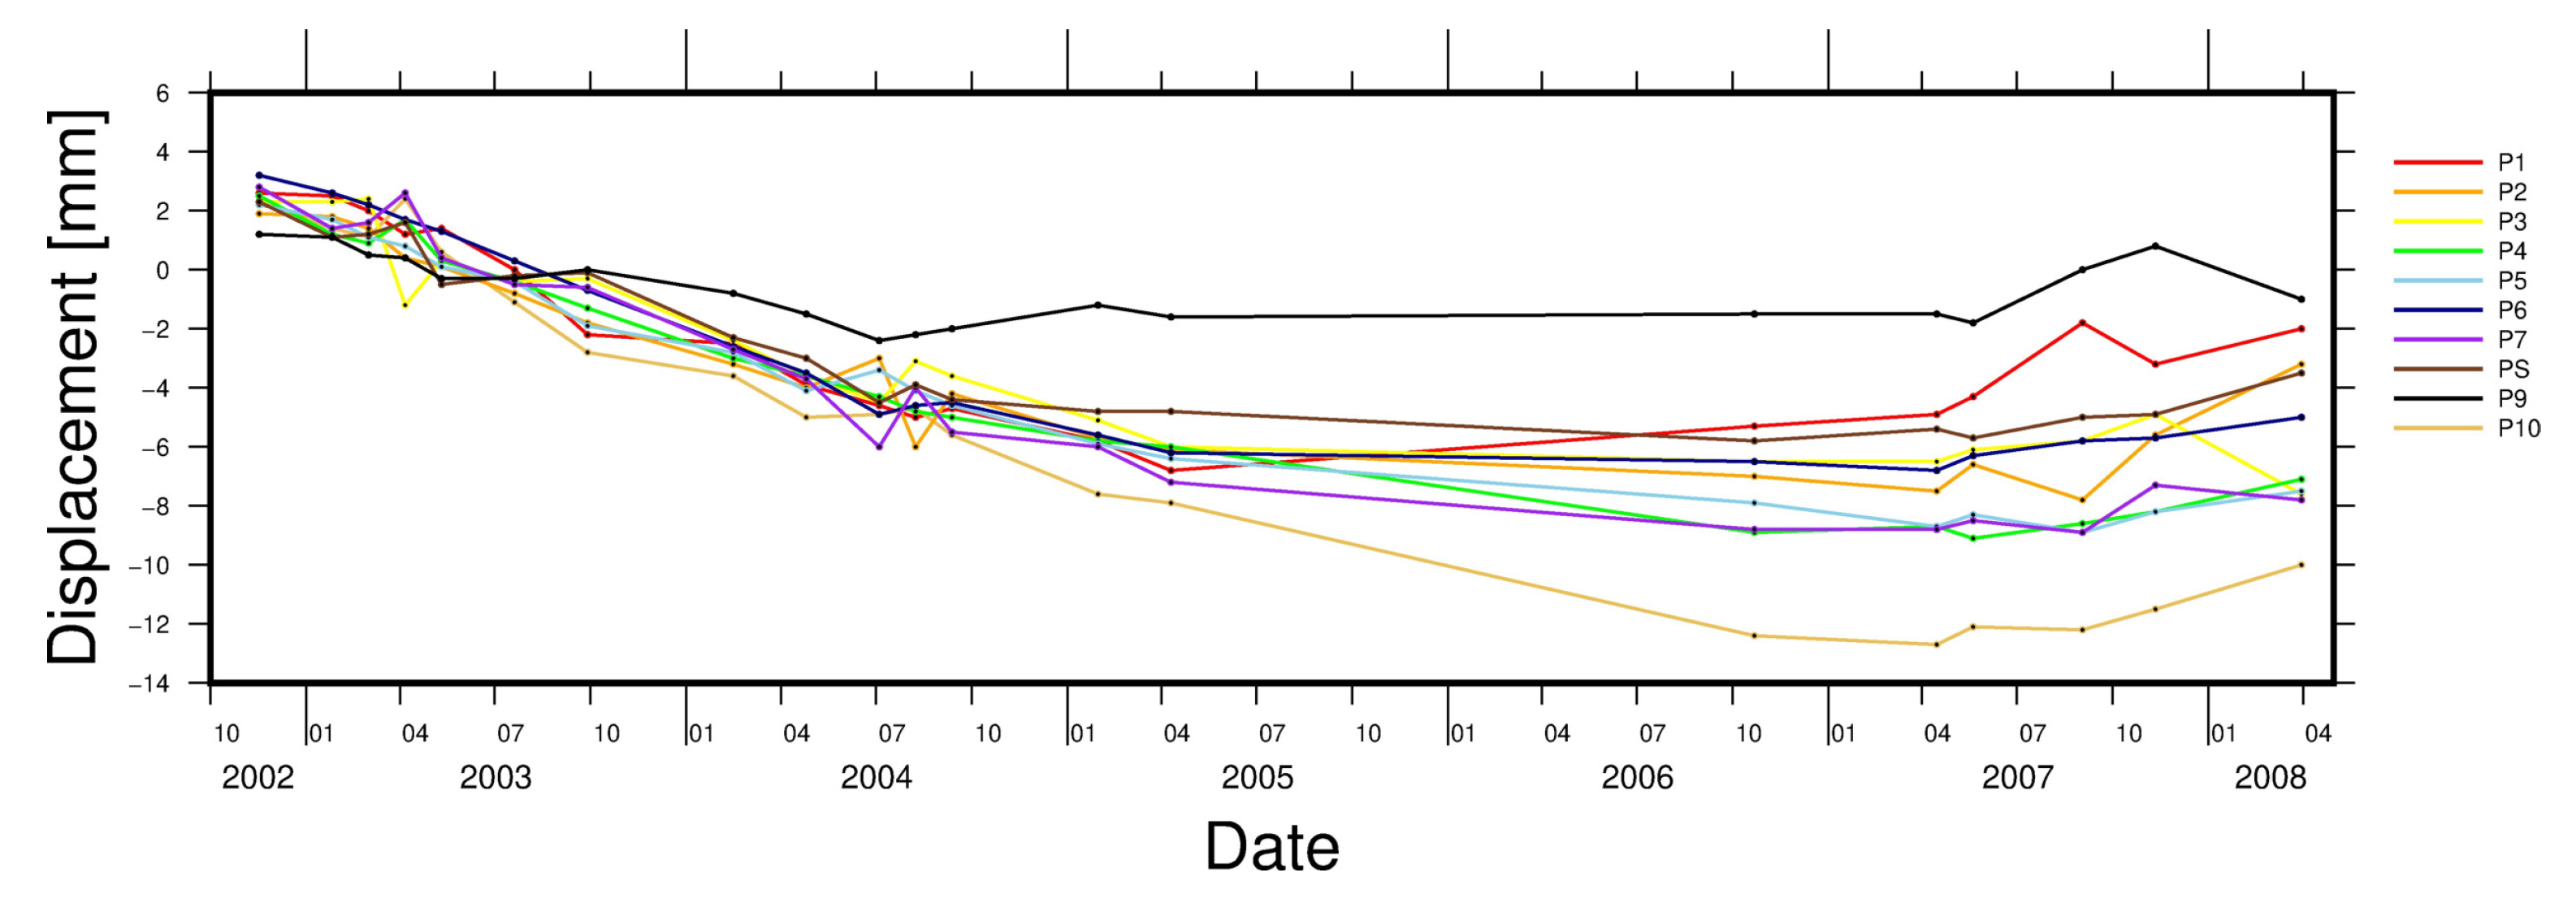
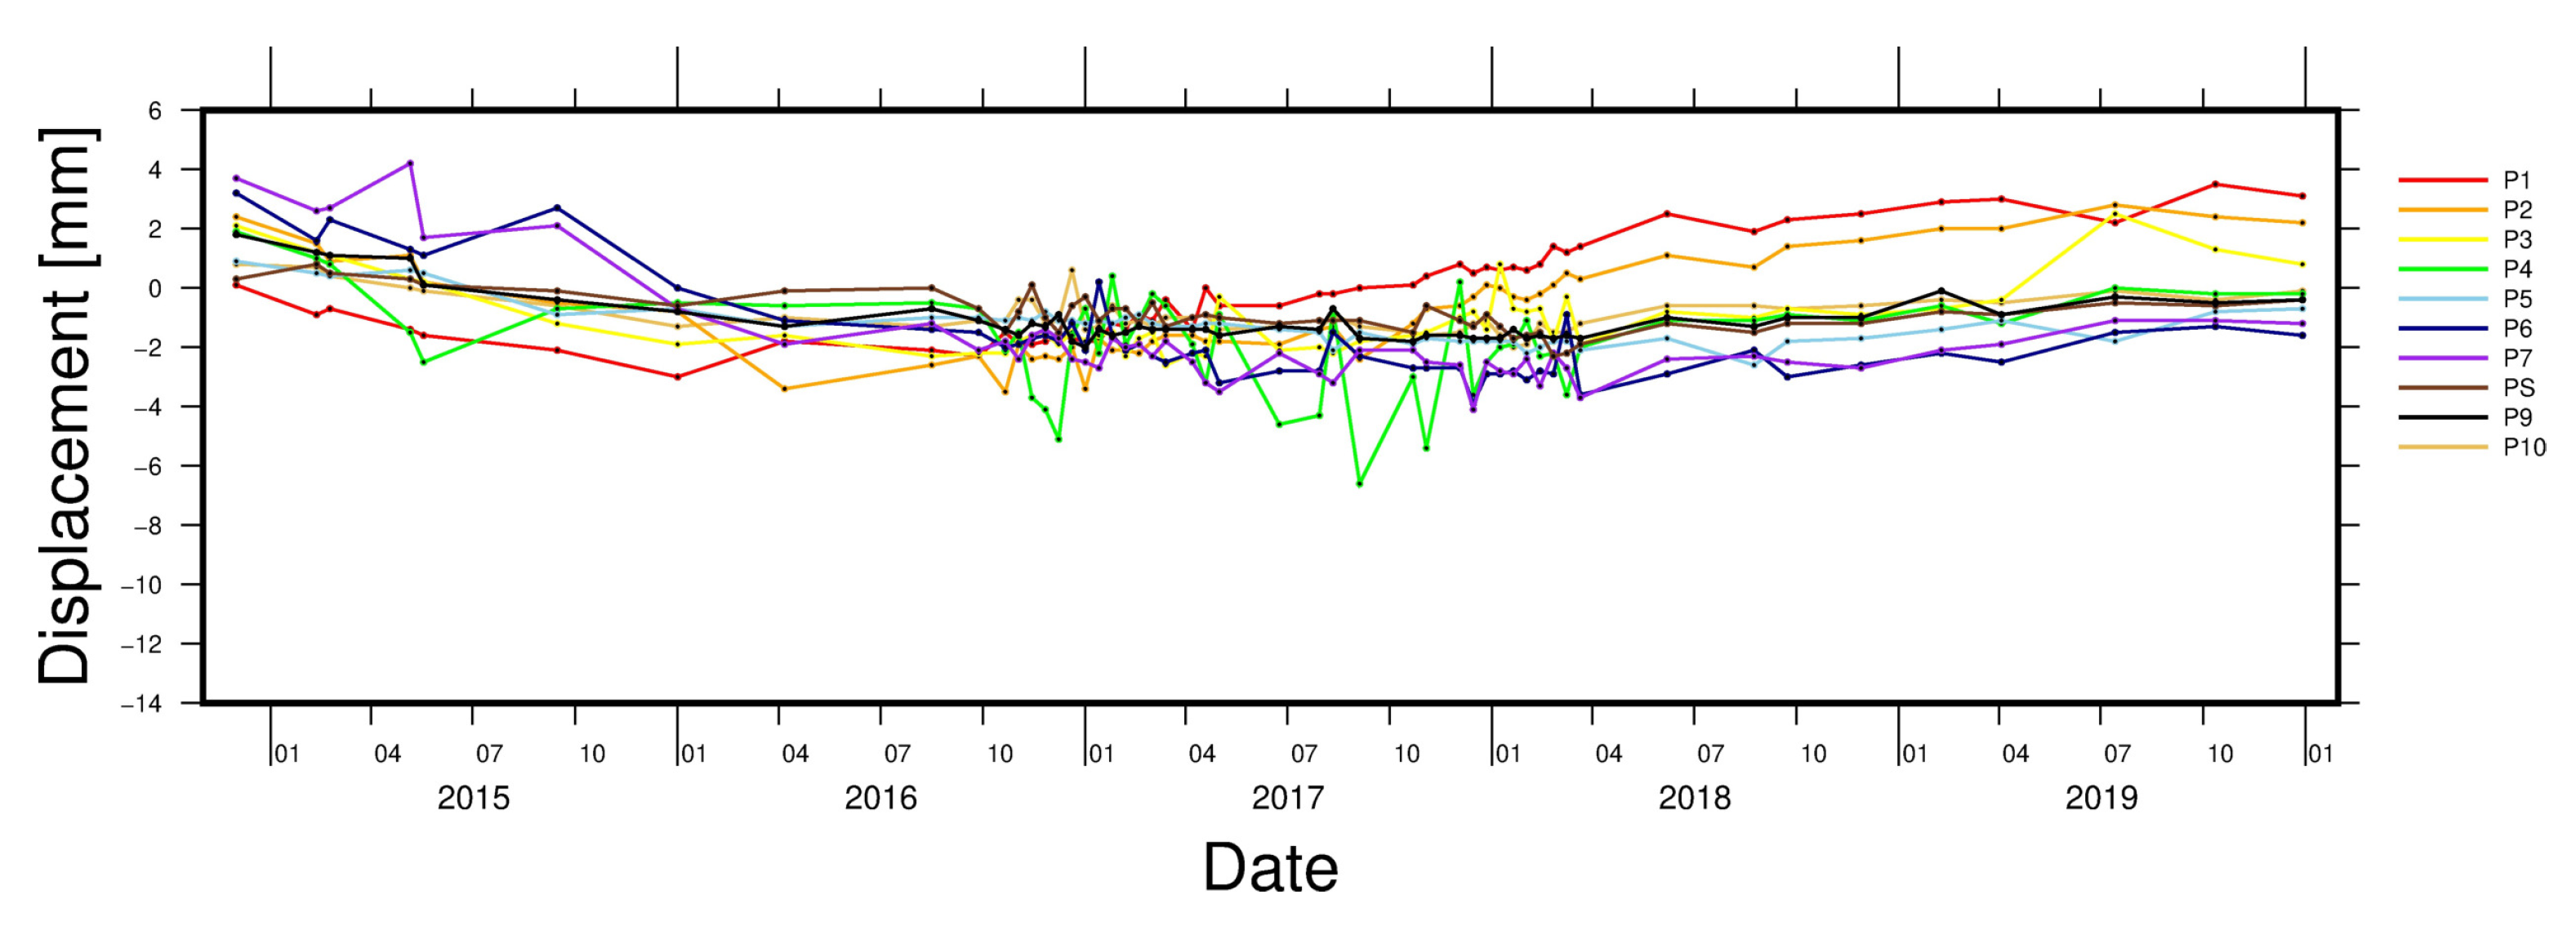
4. Results
5. Discussion
6. Conclusions
- the displacements, which continue to occur in the area of Wrocław have a cyclic character with 4–5 years long period of subsidence and 2–3 years long periods of stabilization or uplifted.
- the displacement trends indicate that the area of the city gradually subsides in relation to the reference area located on the Fore-Sudetic Block.
Author Contributions
Funding
Acknowledgments
Conflicts of Interest
References
- Ferretti, A.; Prati, C.; Rocca, F. Permanent scatterers in SAR interferometry. IEEE Trans. Geosci. Remote Sens. 2001, 39, 8–20. [Google Scholar] [CrossRef]
- Crosetto, M.; Gili, J.; Monserrat, A.; Cuevas-Gonz’alez, M.; Corominas, J.; Serral, D. Interferometric SAR monitoring of the Vallcebre landslide (Spain) using corner reflectors. Nat. Hazards Earth Syst. Sci. 2013, 13, 923–933. [Google Scholar] [CrossRef]
- Mohammed, O.I.; Saeidi, V.; Pradhan, B.; Yusuf, Y.A. Advanced differential interferometry synthetic aperture radar techniques for deformation monitoring: A review on sensors and recent research development. Geocarto Int. 2014, 29, 536–553. [Google Scholar] [CrossRef]
- Even, M.; Schulz, K. InSAR Deformation Analysis with Distributed Scatterers: A Review Complemented by New Advances. Remote Sens. 2018, 10, 744. [Google Scholar] [CrossRef] [Green Version]
- Ferretti, A.; Savio, G.; Barzaghi, R.; Borghi, A.; Musazzi, S.; Novali, F.; Prati, C.; Rocca, F. Submillimeter accuracy of InSAR time series: Experimental validation. IEEE Trans. Geosci. Remote Sens. 2007, 45, 1142–1153. [Google Scholar] [CrossRef]
- Crosetto, M.; Monserrat, O.; Cuevas-Gonz’alez, M.; Devanth’ery, N.; Crippa, B. Persistent Scatterer Interferometry: A review. ISPRS J. Photogramm. Remote Sens. 2016, 115, 78–89. [Google Scholar] [CrossRef] [Green Version]
- Ferretti, A.; Prati, C.; Rocca, F. Nonlinear subsidence rate estimation using permanent scatterers in differential SAR interferometry. IEEE Trans. Geosci. Remote Sens. 2000, 38, 2202–2212. [Google Scholar] [CrossRef] [Green Version]
- Kampes, B. Radar Interferometry: Persistent Scatterer Technique; Springer: Dordrecht, The Netherlands, 2006. [Google Scholar]
- Hooper, A.; Zebker, H.; Segall, P.; Kampes, B. A new method for measuring deformation on volcanoes and other natural terrains using InSAR persistent scatterers. Geophys. Res. Lett. 2004, 31. [Google Scholar] [CrossRef]
- Berardino, P.; Fornaro, G.; Lanari, R.; Sansosti, E. A new algorithm for surface deformation monitoring based on small baseline differential SAR interferograms. IEEE Trans. Geosci. Remote Sens. 2002, 40, 2375–2383. [Google Scholar] [CrossRef] [Green Version]
- Colesanti, C.; Ferretti, A.; Prati, C.; Rocca, F. Monitoring landslides and tectonic motions with the Permanent Scatterers Technique. Eng. Geol. 2002, 68, 3–14. [Google Scholar] [CrossRef]
- Kutoglu, H.; Kemaldere, H.; Deguchi, T.; Berber, M. Discovering a pull-apart basin using InSAR in Bursa, Turkey. Nat. Hazards 2014, 71, 871–880. [Google Scholar] [CrossRef]
- Reale, D.; Fornaro, G.; Member, S.; Pauciullo, A.; Zhu, X.; Member, S.; Bamler, R. Tomographic Imaging and Monitoring of Buildings With Very High Resolution SAR Data. IEEE Geosci. Remote Sens. Lett. 2011, 8, 661–665. [Google Scholar] [CrossRef] [Green Version]
- De Zeeuw-van Dalfsen, E.; Pedersen, R.; Hooper, A.; Sigmundsson, F. Subsidence of Askja caldera 2000–2009: Modelling of deformation processes at an extensional plate boundary, constrained by time series InSAR analysis. J. Volcanol. Geotherm. Res. 2012, 213–214, 72–82. [Google Scholar] [CrossRef]
- Hooper, A.; Segall, P.; Zebker, H. Persistent scatterer InSAR for crustal deformation analysis, with application to Volcan Alcedo, Galapagos. J. Geophys. Res. 2007, 112, B07407. [Google Scholar] [CrossRef] [Green Version]
- Samsonov, S.; d’Oreye, N.; Smets, B. Ground deformation associated with post-mining activity at the French-German border revealed by novel InSAR time series method. J. Appl. Earth Obs. Geoinf. 2013, 23, 142–154. [Google Scholar] [CrossRef]
- Gee, D.; Sowter, A.; Novellino, A.; Marsh, S.; Gluyas, J. Monitoring land motion due to natural gas extraction: Validation of the Intermittent SBAS (ISBAS) DInSAR algorithm over gas fields of North Holland, The Netherlands. Mar. Pet. Geol. 2016, 77, 1338–1354. [Google Scholar] [CrossRef]
- Peduto, D.; Ferlisi, S.; Nicodemo, G.; Reale, D.; Pisciotta, G.; Gullà, G. Empirical fragility and vulnerability curves for buildings exposed to slow-moving landslides at medium and large scales. Landslides 2017, 14, 1993–2007. [Google Scholar] [CrossRef]
- Wasowski, J.; Bovenga, F. Investigating landslides and unstable slopes with satellite Multi Temporal Interferometry: Current issues and future perspectives. Eng. Geol. 2014, 174, 103–138. [Google Scholar] [CrossRef]
- Cigna, F.; Osmano, B.; Cabral-cano, E.; Dixon, T.H.; Ávila-olivera, J.A.; Garduño-monroy, V.H.; Demets, C.; Wdowinski, S. Remote Sensing of Environment Monitoring land subsidence and its induced geological hazard with Synthetic Aperture Radar Interferometry: A case study in Morelia, Mexico. Remote Sens. Environ. 2012, 117, 146–161. [Google Scholar] [CrossRef]
- Bawden, G.W.; Thatcher, W.; Stein, R.S.; Hudnut, K.W.; Peltzer, G. Tectonic contraction across Los Angeles after removal of groundwater pumping effects. Nature 2001, 412, 812–815. [Google Scholar] [CrossRef]
- Hanssen, R.; Van Leijen, F.; Van Zwieten, G.; Dortland, S.; Bremmer, C.; Kleuskens, M. Validation of PSI Results of Alkmaar and Amsterdam within the TERRAFIRMA Validation Project. In Proceedings of the FRINGE 2007 Workshop, Frascati, Italy, 26–30 November 2007. [Google Scholar]
- Armas, I.; Gheorghe, M.; Lendvai, M.; Dumitru, P.; Badescu, O.; Calin, A. InSAR validation based on GNSS measurements in Bucharest. Int. J. Remote Sens. 2016, 37, 5565–5580. [Google Scholar] [CrossRef]
- Casu, F.; Manzo, M.; Lanari, R. A quantitative assessment of the SBAS algorithm performance for surface deformation retrieval from DInSAR data. Remote Sens. Environ. 2006, 102, 195–210. [Google Scholar] [CrossRef]
- Nicodemo, G.; Peduto, D.; Ferlisi, S. Investigating building settlements via very high resolution SAR sensors. In Life-Cycle of Engineering Systems: Emphasis on Sustainable Civil Infrastructure; Taylor & Francis Group: London, UK, 2017. [Google Scholar]
- Bakon, M.; Papco, J.; Perissin, D.; Sousa, J.; Lazecky, M. Multi-sensor InSAR Deformation Monitoring over Urban Area of Bratislava (Slovakia). Procedia Comput. Sci. 2016, 100, 1127–1134. [Google Scholar] [CrossRef] [Green Version]
- Karila, K.; Karjalainen, M.; Hyyppa, J.; Koskinen, J.; Saaranen, V.; Rouhiainen, P. A comparison of precise leveling and persistent scatterer SAR interferometry for building subsidence rate measurement. ISPRS Int. J. Geo-Inf. 2013, 2, 797–816. [Google Scholar] [CrossRef] [Green Version]
- Peduto, D.; Nicodemo, G.; Maccabiani, J.; Ferlisi, S. Multi-scale analysis of settlement-induced building damage using damage surveys and DInSAR data: A case study in The Netherlands. Eng. Geol. 2017, 218, 117–133. [Google Scholar] [CrossRef]
- Cymerman, Z. Tectonic Map of the Sudetes and the Fore-Sudetic Block 1:200 000, 2nd ed.; Polish Geological Institute: Warsaw, Poland, 2010. (In Polish) [Google Scholar]
- Badura, J.; Przybylski, B.; Zuchiewicz, W. Cainozoic evolution of Lower Silesia, SW Poland: A new interpretation in the light of sub-Cainozoic and sub-Quaternary topography. Acta Geodyn. Geomater. 2004, 1, 7–29. [Google Scholar]
- Aizberg, R.; Garetzky, R.; Karabanow, A.; Kockel, F.; Levkov, E.; Ludwig, A.; Lykke-Anderson, H.; Ostaficzuk, S.; Palijenko, V.; Schwab, G.; et al. Neotectonic structural subdivision (beginning of Oligocene until the Recent). Supplement to Brandenburgische Geowissenschaftliche Beitrage, 8, 1, respectively to Abh. Naturwiss 2001, 35, 8. (In German) [Google Scholar]
- Rózycki, M. Geological Structure of the Vicinity of Wrocław; Bulletin of The Polish Geological Institute no. 214; Bulletin of The Polish Geological Institute: Wrocław, Poland, 1968; pp. 181–230, (In Polish with English Summ). [Google Scholar]
- Badura, J.; Przybylski, B. Application of digital elevation models to geological and geomorphological studies-some examples. Pol. Geol. Rev. 2005, 53, 977–983. (In Polish) [Google Scholar]
- Grzempowski, P.; Cacoń, S. Analysis and interpretation of vertical ground movements in Wrocław. Acta Mont. IRSM AS CR 2003, 24, 1–9. [Google Scholar]
- Grzempowski, P.; Cacoń, S. The cause analysis of benchmark movements in the city of Wroclaw. Rep. Geod. 2005, 3, 271–281. [Google Scholar]
- Woźniak, J. Geodetic Methods for Investigations of Present-Day Vertical Movements Earth Crust Taking into Consideration Multiple Levelling Network in SW Poland. Ph.D. Thesis, Wroclaw University of Technology, Wroclaw, Poland, 1976. [Google Scholar]
- Wyrzykowski, T. Map of Gradients of Velocity of the Recent Vertical Movements of Earth Crust Surface on the Territory of Poland; Institute of Geodesy and Cartography: Wroclaw, Poland, 1985. [Google Scholar]
- Kowalczyk, K. Modelling the vertical movements of the earth’s crust with the help of the collocation method. Rep. Geod. 2006, 2, 171–178. [Google Scholar]
- Kontny, B.; Bogusz, J. Models of vertical movements of the Earth crust surface in the area of Poland derived from leveling and GNSS data. Acta Geodyn. Geomater. 2012, 9, 331–337. [Google Scholar]
- Ferenc, J. The Studies of Ground Surface Vertical Movements in the City of Wrocław. Ph.D. Thesis, Wroclaw University of Technology, Wroclaw, Poland, 1979. (In Polish). [Google Scholar]
- Grzempowski, P.; Badura, J.; Cacoń, S.; Przybylski, B. Recent vertical movements in the Wroclaw section of the Middle Odra Fault Zone. Acta Geodyn. Geomater. 2009, 6, 339–349. [Google Scholar]
- Grzempowski, P.; Mąkolski, K. The problem of validity of benchmark elevations for general engineering tasks in urbanised areas on the example of vertical benchmark network in the city of Wroclaw. Rep. Geod. 2007, 1, 91–102. [Google Scholar]
- Grzempowski, P.; Badura, J.; Cacoń, S.; Kaplon, J.; Rohm, W.; Przybylski, B. Geodynamics of south-eastern part of the Central European Subsidence Zone. Acta Geodyn. Geomater. 2012, 9, 359–369. [Google Scholar]
- Bogusz, J.; Figurski, M.; Kontny, B.; Grzempowski, P. Horizontal velocity field derived from EPN and ASG-EUPOS satellite data on the example of south-western part of Poland. Acta Geodyn. Geomater. 2012, 9, 349–357. [Google Scholar]
- Kapłon, J.; Kontny, B.; Grzempowski, P.; Schenk, V.; Schenkova, Z.; Balek, J.; Holesovsky, J. Geosud/Sudeten Network GPS Data Reprocessing and Site Velocity Estimations. Acta Geodyn. Geomater. 2015, 11, 65–75. [Google Scholar]
- Perski, Z.; Mróz, M. Application of SAR interferometric (InSAR) methods for the study of natural Earth surface displacements in Poland. GEO-IN-SAR project. Arch. Photogramm. Cartogr. Remote Sens. 2007, 17, 613–624. (In Polish) [Google Scholar]
- Kampes, B.; Usai, S. Doris: The Delft object-oriented Radar Interferometric Software. In Proceedings of the ITC 2nd ORS Symposium, Enschede, The Netherlands, 16–20 August 1999. [Google Scholar]
- Kampes, B.; Hanssen, R.; Perski, Z. Radar Interferometry with Public Domain Tools. In Proceedings of the FRINGE 2003, Frascati, Italy, 1–5 December 2003. [Google Scholar]
- Chen, C.W.; Zebker, H.A. Network approaches to two-dimensional phase unwrapping: Intractability and two new algorithms. J. Opt. Soc. Am. 2000, 17, 401–414. [Google Scholar] [CrossRef]
- Farr, T.G.; Rosen, P.A.; Caro, E.; Crippen, R.; Duren, R.; Hensley, S.; Kobrick, M.; Paller, M.; Rodriguez, E.; Roth, L.; et al. The Shuttle Radar Topography Mission. Rev. Geophys. 2007, 45, RG2004. [Google Scholar] [CrossRef] [Green Version]
- Sandwell, D.; Mellors, R.; Tong, X.; Wei, M.; Wessel, P. GMTSAR: An InSAR Processing System Based on Generic Mapping Tools; Scripps Institution of Oceanography: San Diego, CA, USA, 2011. [Google Scholar]
- Gehlot, S.; Perski, Z.A.; Hanssen, R.F. Web-based framework for PS-INSAR data interpretation assisted by geo-spatial information fusion. In Proceedings of the ISPRS Mid-term Symposium Enschede, Enschede, The Netherlands, 8–11 May 2006. [Google Scholar]
- Perski, Z.; Ketelaar, G.; Mróz, M. SAR Persistent Scatterers: Targets Characterization in Urbanized Areas with Envisat Alternating Polarisation Data. Arch. Photogramm. Cartogr. Remote Sens. 2006, 16, 467–482. (In Polish) [Google Scholar]
- Büttner, G. CORINE Land Cover and Land Cover Change Products. In Land Use and Land Cover Mapping in Europe: Practices & Trends; Manakos, I., Braun, M., Eds.; Springer Netherlands: Dordrecht, The Netherlands, 2014; pp. 55–74. [Google Scholar] [CrossRef]


| Satelite | Track | Pass | Years | Master Image | Number of Scenes | Spatial Baseline (m) | Time Baseline (Days) |
|---|---|---|---|---|---|---|---|
| ERS-2 | 36 | Ascending | 1995–2004 | 22.04.1999 | 55 | <800 | <365 |
| Envisat | 186 | Descending | 2002–2008 | 11.01.2004 | 21 | <700 | <365 |
| Sentinel-1A | 73 | Descending | 2014–2019 | 09.10.2016 | 52 | <150 | <180 |
| Level 1 | Level 2 | Level 3 |
|---|---|---|
| 1 Artificial surfaces | 11 Urban fabric | 111 Continuous urban fabric |
| 112 Discontinuous urban fabric | ||
| 12 Industrial, commercial and | 121 Industrial or commercial units | |
| transport units | 122 Road and rail networks and | |
| associated land | ||
| 123 Port areas | ||
| 124 Airports | ||
| 13 Mine, dump and construction sites | 131 Mineral extraction sites | |
| 132 Dump sites | ||
| 133 Construction sites | ||
| 14 Artificial, non-agricultural | 141 Green urban areas | |
| vegetated areas | 142 Sport and leisure facilities |
© 2020 by the authors. Licensee MDPI, Basel, Switzerland. This article is an open access article distributed under the terms and conditions of the Creative Commons Attribution (CC BY) license (http://creativecommons.org/licenses/by/4.0/).
Share and Cite
Grzempowski, P.; Badura, J.; Milczarek, W.; Blachowski, J.; Głowacki, T.; Zając, M. Determination of the Long-Term Ground Surface Displacements Using a PSI Technique—Case Study on Wrocław (Poland). Appl. Sci. 2020, 10, 3343. https://doi.org/10.3390/app10103343
Grzempowski P, Badura J, Milczarek W, Blachowski J, Głowacki T, Zając M. Determination of the Long-Term Ground Surface Displacements Using a PSI Technique—Case Study on Wrocław (Poland). Applied Sciences. 2020; 10(10):3343. https://doi.org/10.3390/app10103343
Chicago/Turabian StyleGrzempowski, Piotr, Janusz Badura, Wojciech Milczarek, Jan Blachowski, Tadeusz Głowacki, and Marcin Zając. 2020. "Determination of the Long-Term Ground Surface Displacements Using a PSI Technique—Case Study on Wrocław (Poland)" Applied Sciences 10, no. 10: 3343. https://doi.org/10.3390/app10103343