1. Introduction
Cars are inherently noisy machines. This noise may come from its
internal components, such as the engine, exhaust, and, to a lesser extent, fan and structural vibration, and from
external sources, namely tire–road contact and air turbulence. The former are the primary source of noise at lower speeds, which are usually observed in urban contexts. The latter become relevant at higher speeds, more often seen on rural roads or highways. Despite several technical developments on noise attenuation technology both within the vehicle and outside it, motorized vehicles are currently one of the most important sources of noise pollution [
1]. Noise disturbs sleep, interferes in complex task performance such as school performance, modifies social behavior, and causes emotional annoyance [
2,
3,
4,
5]. This problem is well acknowledged by public authorities, vehicle manufacturers, and road industries that have continuously tried to find ways to eliminate or at least attenuate the noise emissions [
1,
2,
3,
4,
5].
While vehicle noise is often regarded as an undesirable sub-product of transportation, it also has an important role in the interaction between vehicles and other road users, most notably, pedestrians and cyclists. Particularly in urban areas, vehicular noise often acts as a cue for vulnerable road users, improving their perception of speed and distance and calling their attention to approaching traffic. This dual nature of vehicular noise in relation to other agents raises some concerns regarding the increasing introduction of hybrid/electric vehicles that are considerably quieter than their combustion counterparts are. On the one hand, hybrid and electrical vehicles emit less or no engine noise. At speeds below 30 km/h, they can produce a noise almost 4 dB(A) lower than a combustion engine-powered vehicle [
6,
7]. Thus, generalized adoption can significantly reduce the levels of environmental noise and related subjective annoyance. However, there is the risk of an increase in the number of accidents involving vulnerable road users—which already make up for a large part of the number of road deaths and injuries [
8,
9,
10]—due to misperception of approaching vehicles.
Understanding how low noise emission affects the vehicles’ detection and localization by pedestrians [
11,
12], particularly those who are blind or visually impaired [
13,
14,
15,
16], has been a challenge. When crossing a road, pedestrians must detect traffic, combine data coming from various directions, determine whether the time remaining before a vehicle reaches them is long enough for crossing, and adapt their action to the continuous perception of oncoming vehicles. The way they can determine the available time to cross and relate it to the time needed to cross is a behavioral indicator. Theoretically, the crossing is possible if the available time is higher than the crossing time, but pedestrians usually allow for a safety margin [
17].
Oxley et al. [
18] stated that crossing decision-making is mainly based on the visual information received by pedestrians, firstly, concerning the distance between the vehicles and the crosswalk or a front car, agreeing with the conclusions obtained by Simpson et al. [
19] and Cavallo et al. [
20], and then about the vehicles speed, in order to estimate its time of arrival. Despite the importance of the visual information on pedestrians’ crossing decision-making, the auditory cues are also relevant for the detection and location of approaching vehicles [
6,
11,
12,
13,
14,
16]. Thus, sometimes, the approach of quieter vehicles can be noticed later than needed to ensure a safe crossing, especially at lower speeds. The level of noise also influences the pedestrians’ ability to estimate the trajectory of the approaching vehicle. The greater is the noise emitted, the easier it is to detect and estimate its arrival time.
In this study, the influence of vehicular noise on pedestrian crossing decision-making was explored, comparing the effects of noise emitted by an electric vehicle, a gasoline vehicle, and a control condition where vehicle sound was absent. Contrary to previous works, different approaching speeds, trajectories, and the corresponding sound effects on the pedestrians’ risk behavior were also explored. The possibility that electric vehicles lead to worse estimations of the vehicle’s trajectory and to a riskier behavior was here hypothesized.
Therefore, an experimental study using a CAVE-like virtual reality environment in which participants were safely placed “within” the audiovisual crossing scenario was conducted. Participants could both see and listen to the oncoming car and decide whether to cross or not. Simulated environments allow for more controllability of the experimental variables than video-based naturalistic approaches. They also enable researchers to put participants in potentially dangerous crossing situations without compromising their safety [
19,
20,
21,
22,
23]. In the experiment reported here, car trajectories and audio signals were developed based on recordings of speed and audio of real vehicles, and virtual scenarios were modeled based on actual streets to serve as context. This approach aimed to produce as realistic as possible visual and auditory cues to increase the ecological validity of the experiment.
2. Materials and Methods
2.1. Participants
Ten adults aged 24–43 years old (m = 30.70; sd = 6.15; 50% male) were recruited from the University of Minho community, in Portugal. Before the experiment, all participants answered a questionnaire regarding their hearing, visual, and mobility conditions. None of them reported any impairing condition. All participants gave their written informed consent. The experiments were conducted in accordance with the principles stated in the 1964 Declaration of Helsinki.
2.2. Virtual Environment
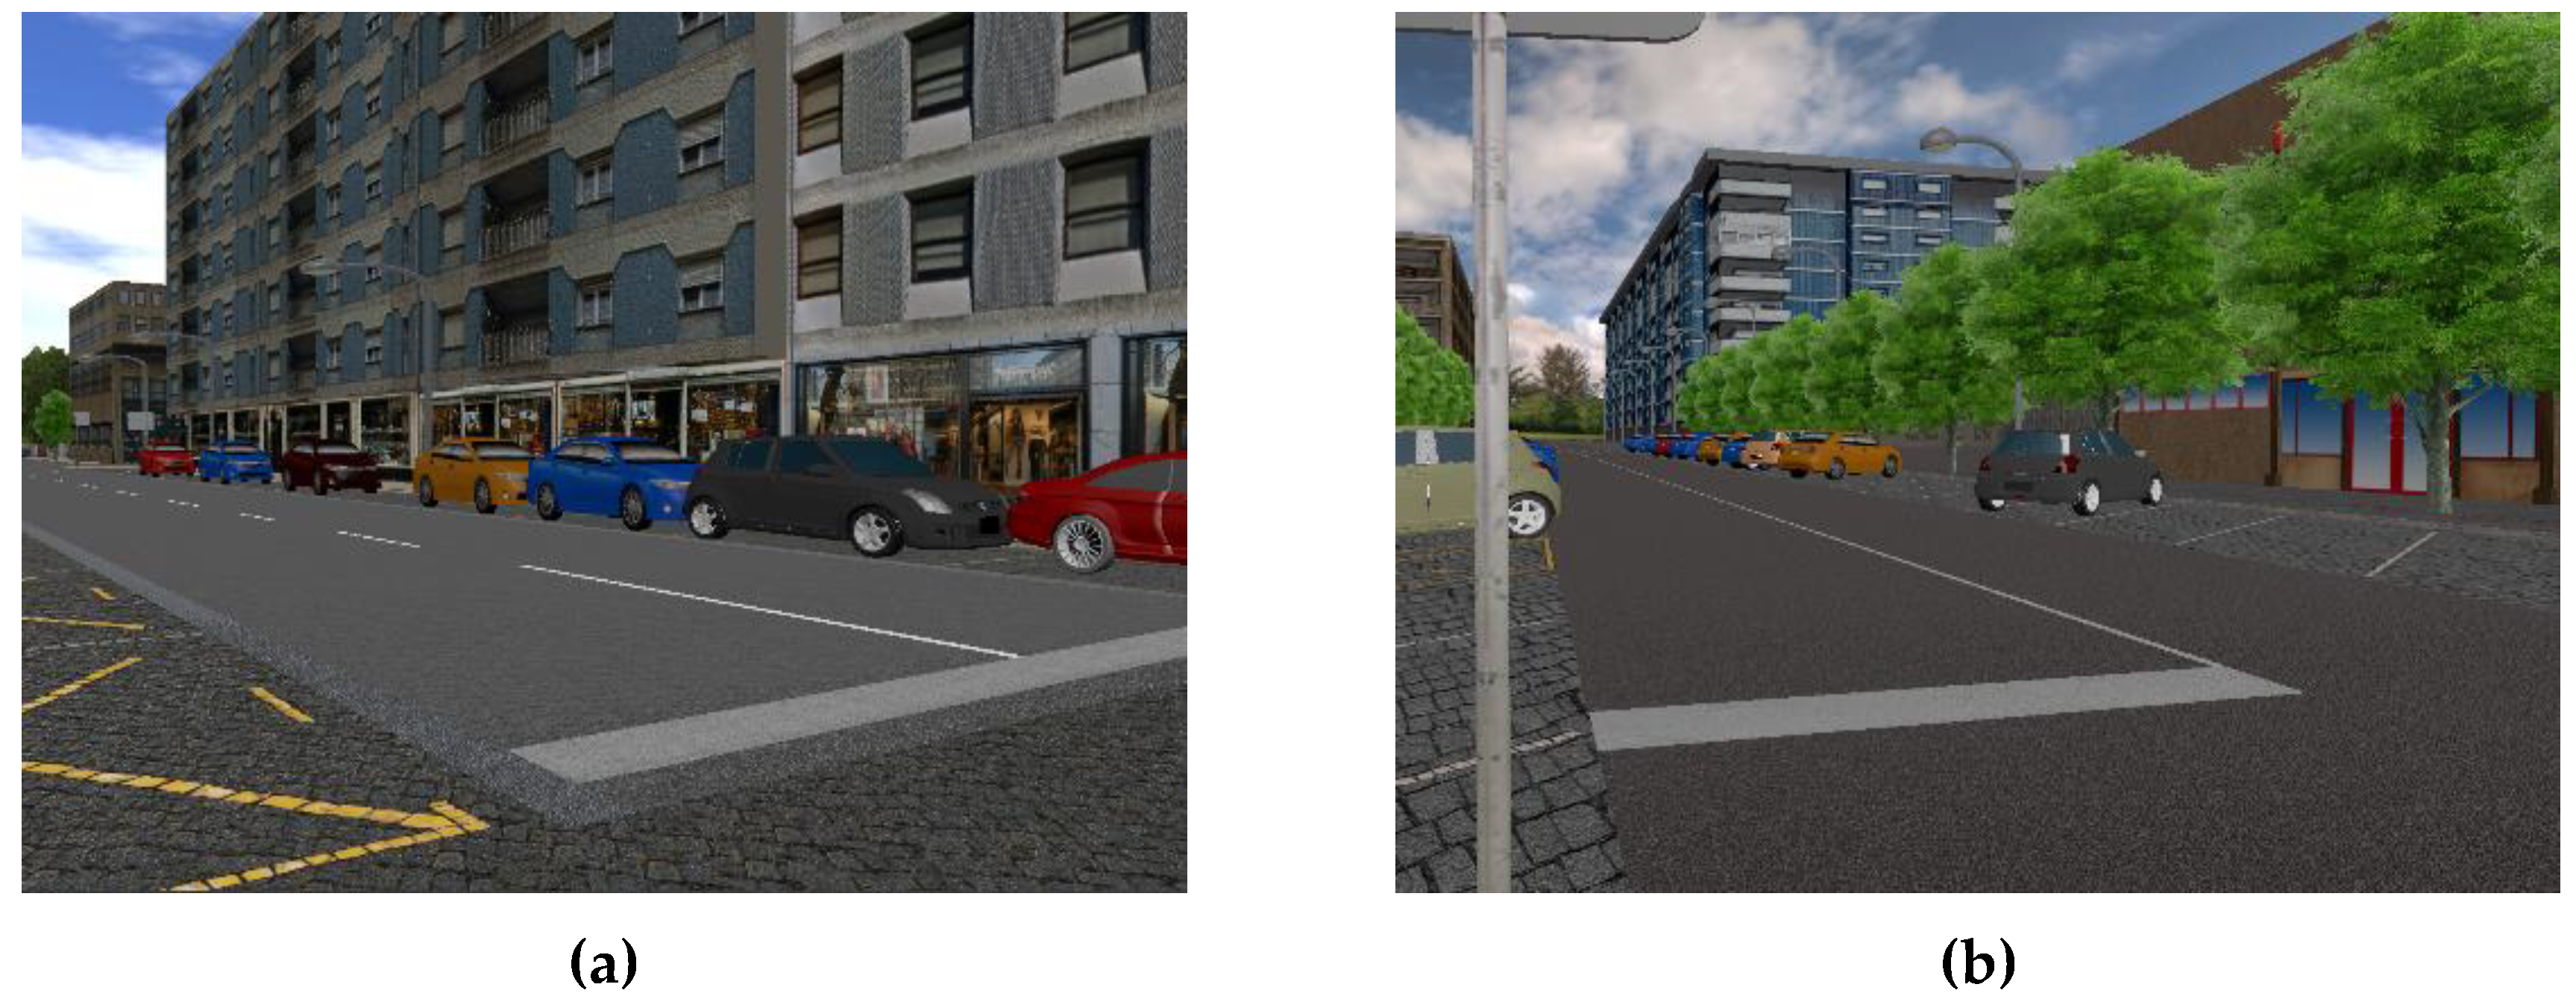
Two existing real-world streets were modeled in two different virtual scenarios: Rua 25 de Abril, in Braga, and Rua Teixeira de Pascoais, in Guimarães. Each one followed a similar development process. First, dimension and distance measurements were taken from the streets, including the length and width of the crosswalks and its markings, the road width, the width of the sidewalks, the length and width of the parking sites, and the sizes of the road. Afterward, the two scenarios were modeled in Blender 2.79a, an open-source 3D computer graphics software that uses Python as a scripting language. Several architectural details such as buildings, vertical signalization, and vegetation were modeled, and textures from pavements and buildings were added to provide participants with a more realistic depiction of the roads (
Figure 1a,b).
The next step was to model the movement of a vehicle, which approached the participants throughout the experiment. To do so, the traffic on the two streets was firstly analyzed, recording vehicle speeds and trajectories when approaching the crosswalk in situations in which pedestrians were crossing the road. Then, noise recordings of real vehicles were carried out in a closed urban road to obtain a realistic depiction of the vehicles’ noise resulting from similar trajectories.
To collect the speeds and trajectories of the vehicles, a 2-h video was recorded in each street and then analyzed using the Traffic Intelligence software [
24,
25]. The several trajectories collected were clustered into three distinct categories: (1) the vehicle maintained its speed without any or with very subtle changes (Constant Speed); (2) the vehicle slowed down before reaching the crosswalk, but continued its trajectory without stopping (Slow Down); and (3) the vehicle slowed down and completely stopped before reaching the crosswalk (Stop). For each speed pattern, the mean (m), maximum (max), minimum (min), and standard deviation (sd) of the distances between vehicle and pedestrians at the beginning (V
i and D
i) and the end (V
f and D
f) of the braking, in the cases where it occurred, were calculated. These values (
Table 1) were used as a reference to define the vehicles’ trajectories to be used in the simulator. Contrary to other studies that usually assume constant speed (e.g., [
19,
20,
22,
26,
27,
28,
29]), the three types of speed profiles recorded in the observational study were implemented in the simulator.
Speeds above 30 km/h were not considered since the study intended to evaluate the pedestrians’ crossing decision-making, considering the approach of a vehicle at short distances from the crosswalk. In addition, above that speed, the noise emitted by a vehicle is predominantly produced by the tire–road interaction, and engine noise differences (electric and gasoline combustion) are of little relevance to the crossing decision [
6].
From the values in
Table 1, three different conditions for the simulator experiment were defined (
Table 2). The distance at which the vehicle was shown on the screen and started its approaching movement (D
i, mov) was kept the same in all conditions.
The vehicle approaching sounds were recorded using as test vehicles: (1) a Kia Ceed SW, with a gasoline combustion engine, equipped with ContiEcoContact3 195/65-R15 tires; and (2) a Renault Zoe ZE, with electric engine, equipped with Michelin Primacy 3 205/45-R17 tires. Controlled Pass-By (CPB) measurements were performed with a Brüel & Kjaer Pulse Analyzer type 3560-C and a Brüel & Kjaer Head and Torso Simulator (HATS) Type 4128-C equipped with Ear Simulators Type 4158-C and 4159-C. The HATS was placed at 1.55 m from the road center, at the height of 1.66 m (corresponding to the Portuguese population average height) with its head turned 35° counterclockwise from the road perpendicular.
To minimize the environmental noise interference all recording sessions were performed with dry pavements, wind speed below 5 m/s, atmospheric temperature between 5 °C and 30 °C, and pavement temperature between 5 °C and 50 °C as recommended in ISO Standard 11819-1:1997 [
4], between 20:00 and 24:00.
To generate the sound for each sample, the two vehicles completed the trajectories defined by the parameters in
Table 2. To gather real speed, time, and distance data from the vehicles, their position was registered at each 0.125 s at the same time the sound recordings were performed. The sound and vehicles’ positions files were later synchronized, calibrated, and implemented in the virtual environment.
2.3. Stimuli
Three different auditory conditions were used: (i) the vehicle emitted the noise of a car with a gasoline combustion engine; (ii) the vehicle emitted the noise of a car with an electric engine; and (iii) the vehicle emitted no sound. The third type of stimulus was considered as a control condition to assess the role auditory cues play in crossing decision-making.
Table 3 presents the main characteristics of the stimuli audio component. The measurement time corresponds to the interval between the beginning of the stimulus presentation and the instant when the vehicle stopped or passed by the participant.
As expected, the noise emitted by gasoline combustion vehicle was in general louder than that emitted by electric vehicle. The difference between the noise indicators for electric and gasoline combustion vehicles is bigger for the stimuli regarding the slow down pattern and lower for the constant speed pattern.
Each of the three conditions presented in
Table 2 and
Table 3 was repeated five times for every auditory condition (electric engine (electric), gasoline combustion engine (gasoline), and no auditory cue (no sound)). Thus, in total, throughout the experiment, 90 stimuli were presented to each participant in a random order (3 speed patterns × 3 auditory conditions × 2 scenarios × 5 repetitions).
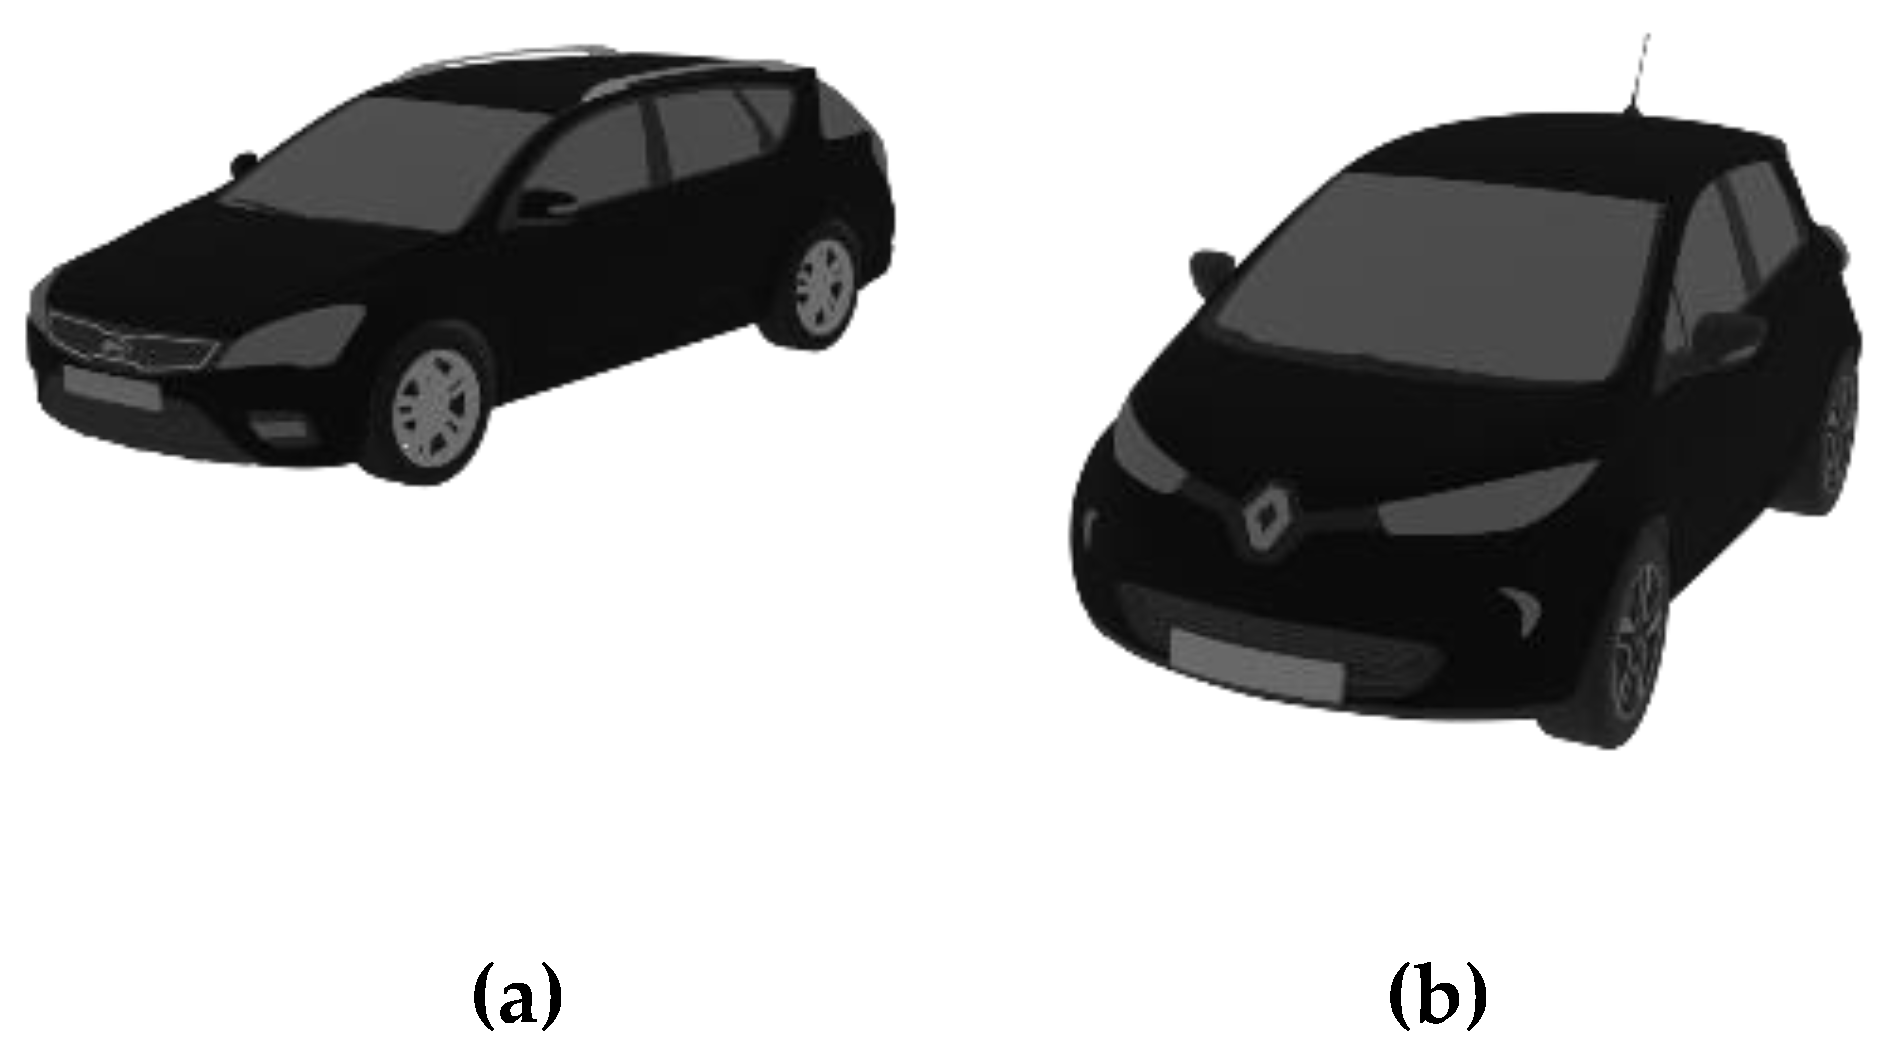
The virtual models of the approaching vehicle used in the experiment were a Kia Ceed SW (Seul, South Korea, Kia Motors, 2011) for gasoline condition (
Figure 2a) and a Renault Zoe ZE (Boulogne, France, Renault S.A., 2018) for electric condition (
Figure 2b). For the no sound, the visual aspect of the vehicle varied between both models.
2.4. Instruments
The experiment was conducted in a room where the CAVE type system is located. Three DLP Christie Mirage S+4K projectors with a resolution of 1400 × 1050 pixels are placed side by side generate an 8-m-wide scene on a 9-m projection screen. They are capable of 3D stereoscopic projection, which was used with a frame rate of 60 fps. Participants, wearing 3D glasses were placed on the opposite side of the screen. The computational effort was distributed through 4 Dell Precision R7610 rack workstations, equipped with Nvidia Quadro K5000 graphics card and Intel Xeon E5-2600 processors. Three of them were used to render the projection itself, while the fourth was used for monitoring. BlenderVR software [
30] was used to control the simulation, paired with a VICON motion capture system. VICON reflective tracking points were placed on a set of headphones worn by participants. By knowing the position of the participants, it was possible to adjust the visual scene to their perspective, increasing the feeling of presence. The room was kept dark throughout the experiments, with the exception of the projection and the VICON’s infrared lights. Participants were placed at 2 m from the screen, rotated so that their sagittal plane formed a 35° angle with the screen. The projection viewpoint was such that the participant was placed on the sidewalk of the virtual scenario, facing the road. CPB sounds were played synchronously with the corresponding visual stimuli on the headphones, using VLC media player. The sound was amplified through a Sony TA-AV570 Audio Video Amplifier. Acoustic levels were calibrated to ensure they were equal to the ones registered during the recording sessions.
2.5. Experimental Procedure
While listening to the instructions, participants were placed in the predefined location, where they remained throughout the experiment. They were equipped with the headtracker and the 3D glasses and asked to hold a computer mouse. They were tasked with indicating, in each trial, the moment when they decided to cross the street if they felt safe to do that, clicking on any button of the mouse. They were also instructed to avoid moving or rotating their heads as much as possible during the experiment to minimize the difference between the virtual and the perceived position of the sound source (vehicle). The experimental scene was set so that the participants could see the vehicle from the start of the stimulus presentation.
Participants completed an experimental session formed by two main blocks, one using the Rua 25 de Abril scenario and others using the Rua Teixeira de Pascoais scenario. The experiment was preceded by a training block composed of 4 stimuli. Depending on the participants, there was a gap of 5 min between the two main blocks. The stimulus presentation continued after every click. However, participants were instructed to make their decision before the car stopped or passed by them, and the crossings were considered valid only for those cases.
2.6. Analysis
The influence of the several variables addressed in this study on the participants’ crossing decision-making was analyzed in terms of percentage of crossings, to infer about the impact of the considered variables (speed pattern and auditory condition) on the effective decision of the participants; response time, to evaluate the time that the participants needed to make their decision when they decided to cross; and time-to-passage (TTP), which, although indirectly related to the response time, can ultimately serve as a risk-taking indicator. Here, lower TTPs at the crossing moment were assumed to be indicative of a riskier behavior, as the participant would have less time to cross the road in a real situation.
The percentage of crossings was calculated, for each participant, considering the number of answers, i.e., the trials for which they have clicked the computer mouse before the vehicle has stopped or passed in front of them, and the total number of trials per condition. For those trials in which the participant did not click, it was assumed that the participants would only cross after the vehicle passed, and no conflict was considered. The response time, which was the time from the start of the stimulus presentation to the moment the participant clicked the mouse, was also registered. The TTP (s), also called time-to-arrival (e.g., [
17,
20]), was calculated based on the moment in which the participant clicked the mouse. This variable is generally defined as the time it would take for an object (vehicle) to reach the frontal plane of an observer (participant) [
31], given by:
where D
vehicle-conflict point is the distance, in meters, from the center of the vehicle’s license plate, assumed as the possible point of impact, and participant’s frontal plane at the moment when he or she started to cross, and V
vehicle is the vehicle speed, in meters per second, at the moment the participant started to cross.
As mentioned in the Introduction, an impact of the noise level on the participants’ decision-making was expected. With stimuli with higher noise levels, such as those related to the approach of the gasoline vehicle (see
Table 3), the participants would be able to better estimate the vehicle’s trajectory and would risk less, which would be translated into higher TTP values and a lower percentage of crossings. A faster decision-making for the gasoline vehicle due to the facilitated trajectory estimation was also expected. In turn and following the same increased saliency of the approaching cues, faster decisions and less risky behavior for electric vehicles when compared with those in which no sound was presented were also expected to be found.
The influence of the variables such as the auditory condition and the vehicle speed pattern on the percentage of crossings was assessed using a three-way repeated-measures ANOVA and Bonferroni-corrected post-hoc tests. Due to the presence of missing values in the database regarding the trials that participants did not feel safe to cross, Linear Mixed Models were used to assess the influence of the auditory condition and the vehicle speed pattern on response time and on TTP, accounting for repeated measures.
3. Results
3.1. Percentage of Crossings
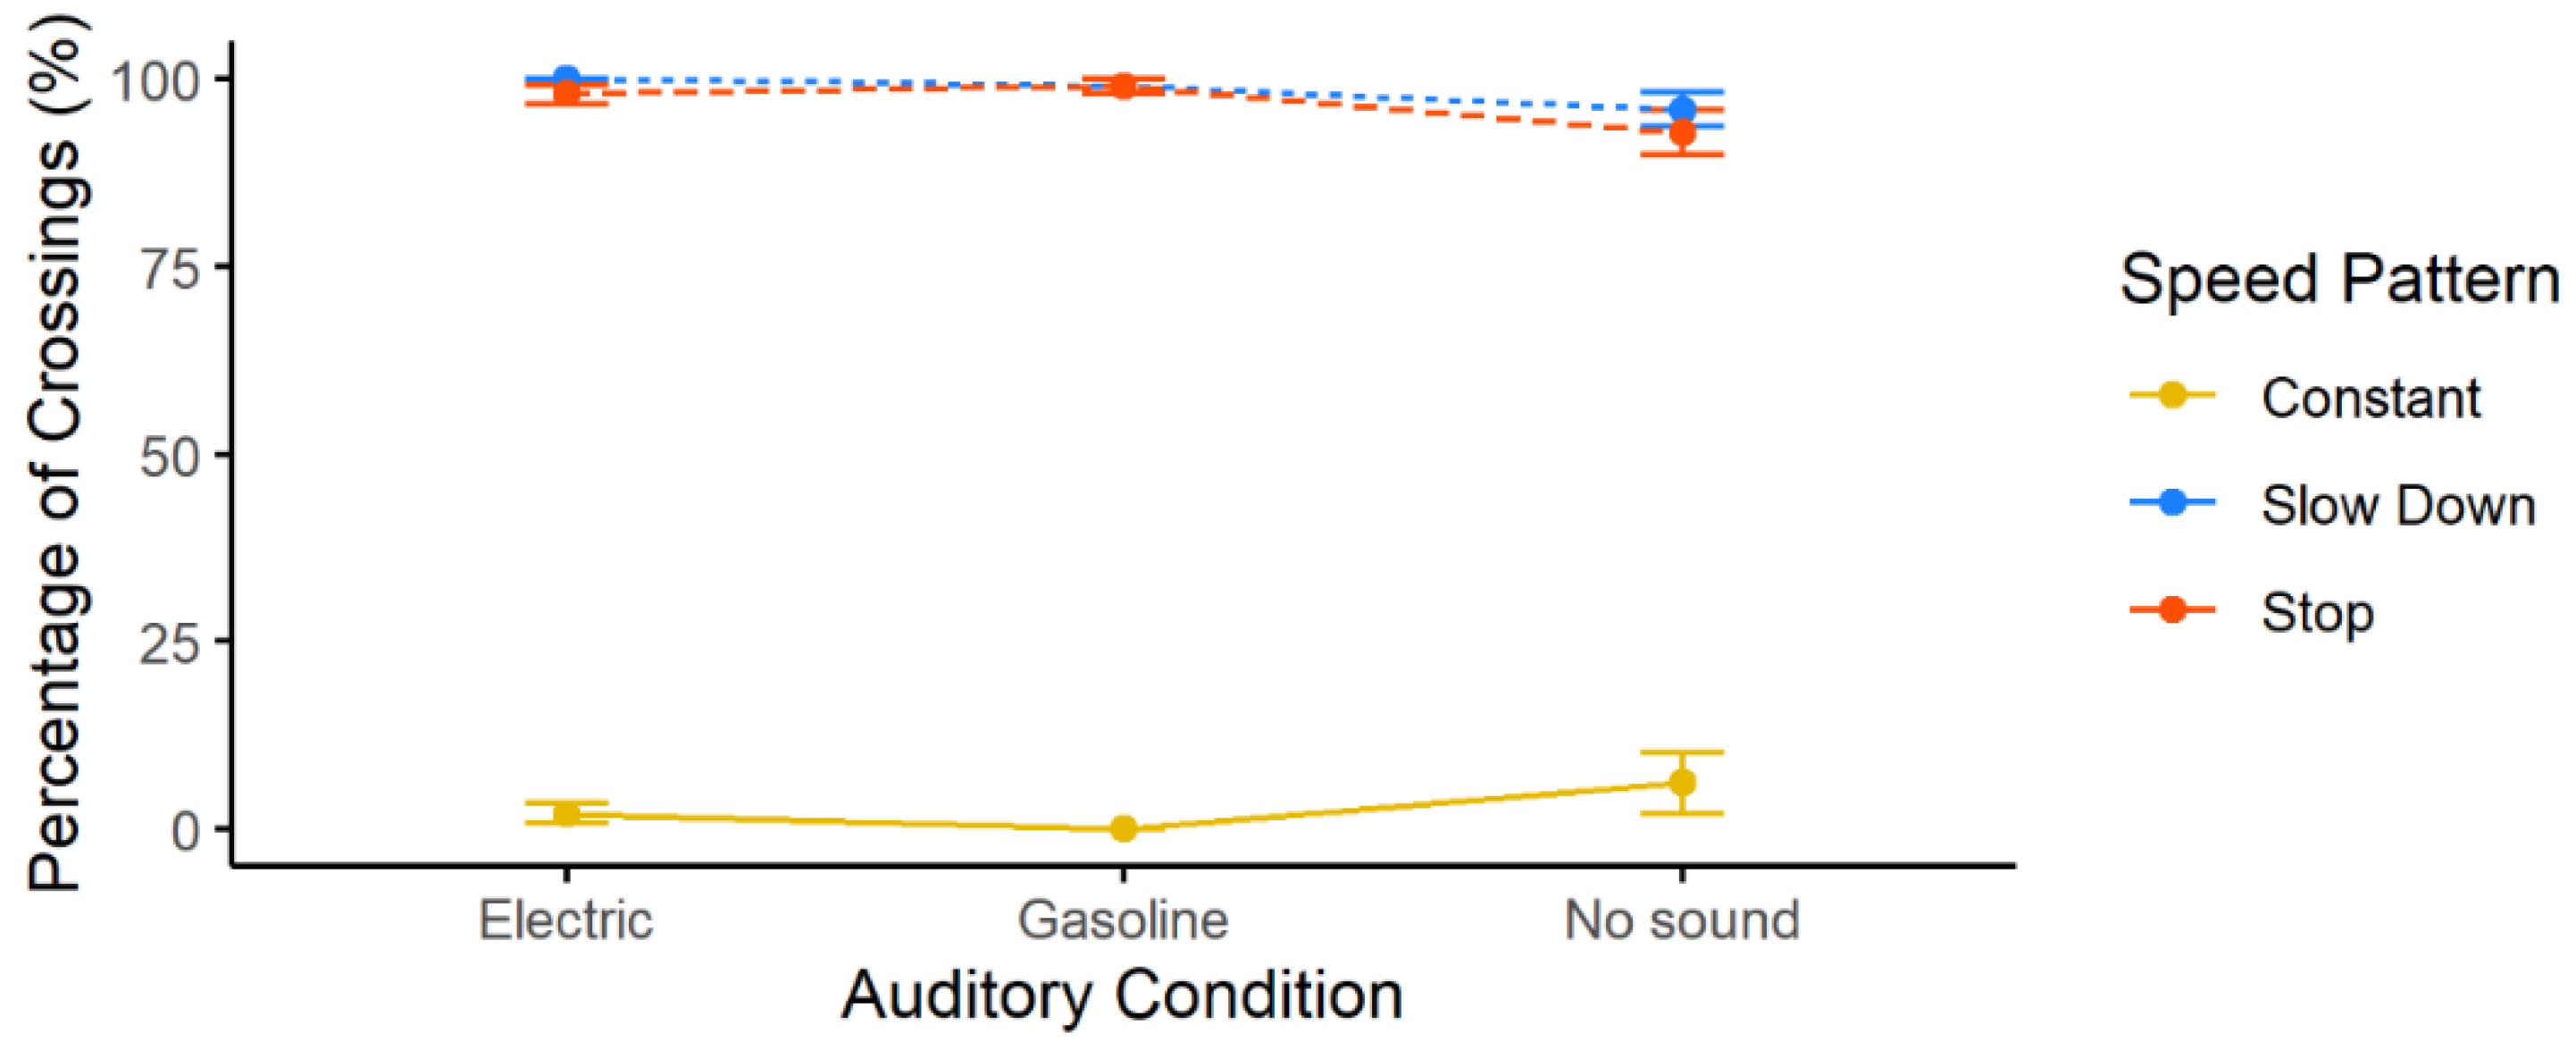
Figure 3 shows the percentage of crossings for all experimental conditions. In general, participants based their decision on the movement of the vehicle, in terms of speed and distance, crossing mainly during trials where the vehicle speed decreased. Although slight differences in the percentage of crossings could be observed, namely between no sound and the other two auditory conditions, it is not possible to state that the type of sound emitted by the vehicle, or its absence, has influenced the percentage of crossings. The very low percentage of crossings in the constant speed stimuli should also be highlighted. The participants did not feel, overall, that it was safe to cross when a vehicle signals no intent of slowing down, and in the particular case of the gasoline condition, none of the participants decided to cross during in these conditions.
These observations were confirmed by a two-way repeated-measures ANOVA, which analyzed the role of auditory condition and the vehicle speed pattern as factors affecting the crossing decision. The auditory condition did not significantly influence the participants’ percentage of crossings, F(2, 18) = 0.90, p = 0.43, while main effects were found for speed pattern, F(2, 18) = 1580.54, p < 0.01, η2 = 0.99. Bonferroni post-hoc test indicated that the percentage of crossings did not significantly differ between the stop (m = 96.67%; sd = 6.61%) and slow down (m = 98.33%; sd = 4.61%) patterns, but they were significantly higher than that regarding constant speed pattern (m = 2.67%; sd = 7.85%).
A significant auditory condition × speed pattern interaction on participants’ percentage of crossings was also found, F(4, 36) = 2.89,
p = 0.04,
η2 = 0.24. However, considering the results shown in
Figure 3, the effect of this interaction was mainly due to the great relevance of the speed pattern effect on the percentage of crossings and not exactly to that regarding the interaction between the two variables, as shown by the small effect size value (
η2). Bonferroni post-hoc test indicated the percentage of crossings is only significantly different when the auditory conditions at constant speed (electric: m = 2.00%; sd = 4.22%; gasoline: m = 0%; sd = 0%; no sound: m = 6.00%; sd = 12.65%), slow down (electric: m = 100.00%; sd = 0%; gasoline: m = 99.00%; sd = 3.16%; no sound: m = 96.00%; sd = 6.99%), and stop (electric: m = 98.00%; sd = 4.22%; gasoline: m = 99.00%; sd = 3.16%; no sound: m = 93.00%; sd = 9.49%) patterns were compared. No significant differences existed between the percentage of crossings referring to the different auditory conditions verified for the stop and the slow down patterns.
3.2. Response Time
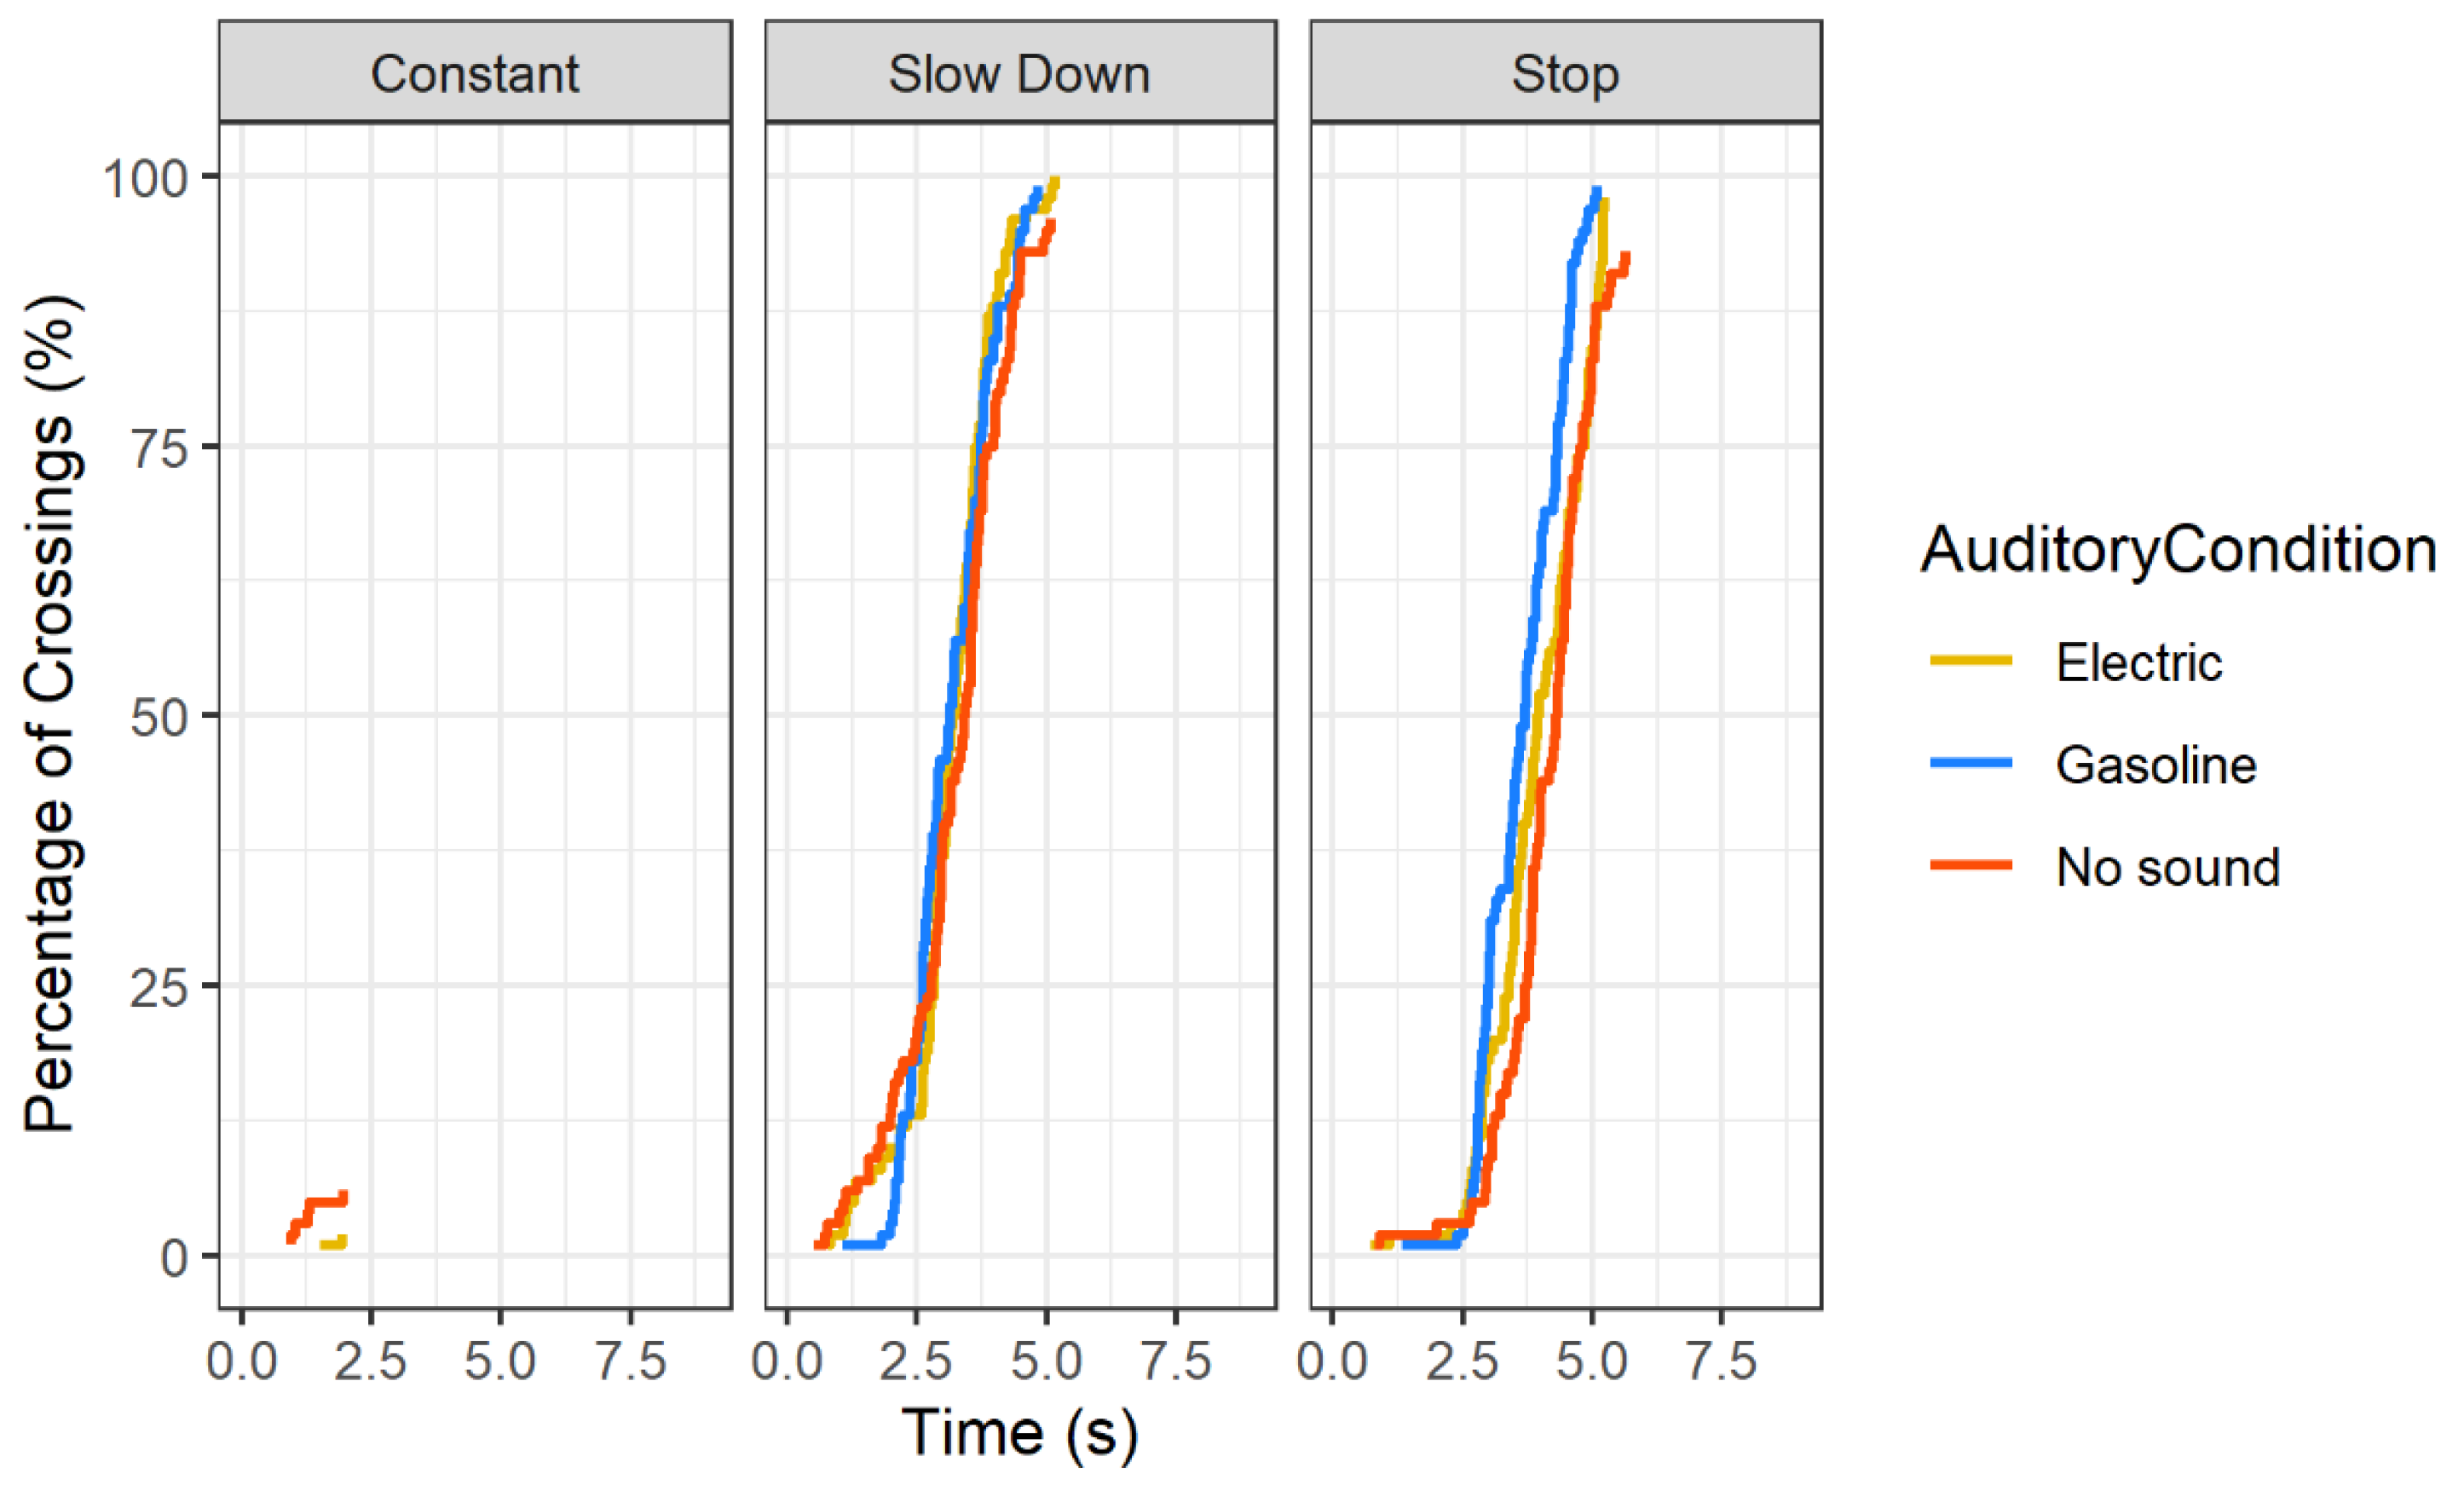
Figure 4 shows the aggregated cumulative percentage of crossings as a function of time. It is noticeable that the few crossings with constant speed stimuli all occurred in the initial 2 s after the beginning of the stimuli presentation. For the other speed patterns, there were considerably more crossings. Nevertheless, in both the “slow down” and “stop” conditions, most responses were given after the vehicle speed began decreasing.
The response time was examined with a Linear Mixed Model considering the vehicle speed pattern and the auditory condition variables. The time participants have taken to respond was significantly longer when the vehicle stopped (m = 3.88 s; sd = 0.86 s; p < 0.01) and when it just slowed down (m = 3.15 s; sd = 0.87 s; p < 0.01) than when it passed at constant speed (m = 1.36 s; sd = 0.41 s).
The response time was significantly longer for the approaching gasoline vehicle (m = 3.40 s; sd = 0.79 s; p = 0.05) than for the electric (m = 3.52 s; sd = 0.99 s). The no sound condition (m = 3.53 s; sd = 1.10 s; p = 0.44) did not significantly differ from the electric one.
It is important to mention that existing differences between response times obtained for the gasoline vehicle and the other conditions may be partially explained by a small difference in the speeds used by the model defining movement of the cars, recorded along the passage of the vehicle when the noise was acquired. During the acquisitions, the two cars were driven by the same person to minimize the human error induced in the speed control. However, due to the different sensitivity of the vehicles’ systems and human factors of the professional driver, some differences in the order of 1.70 km/h, on average, were found in the vehicle speed.
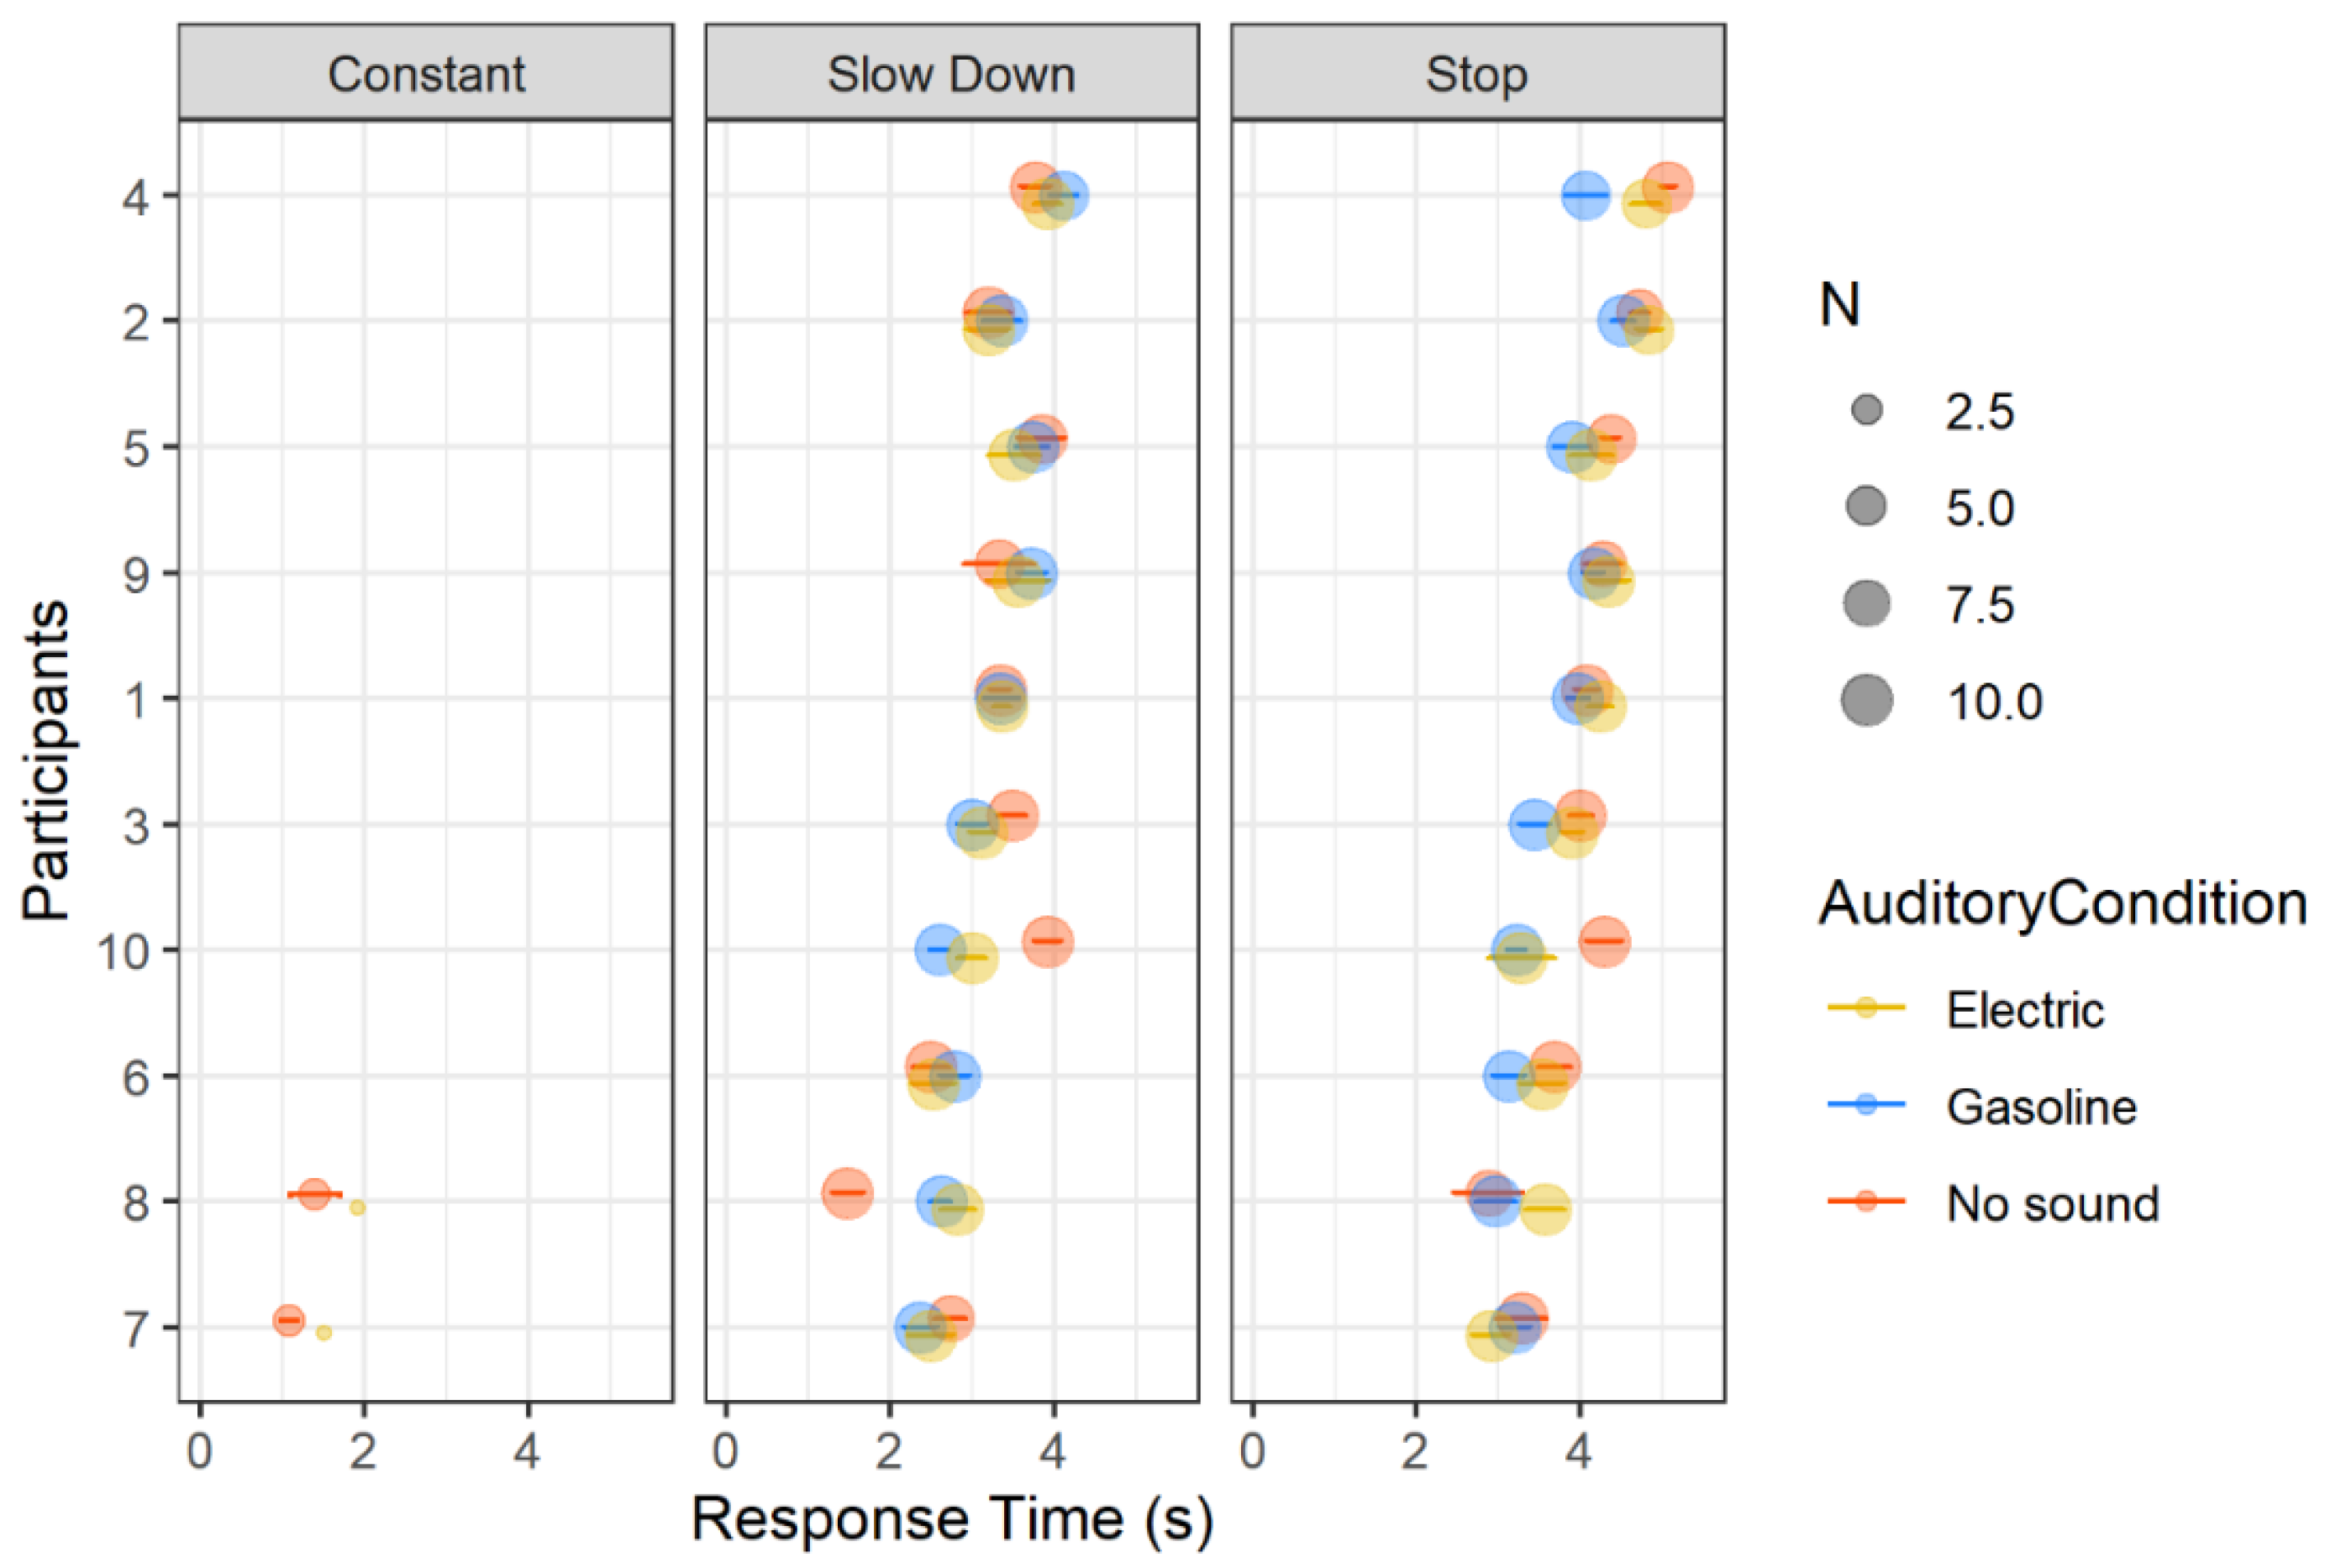
Figure 5 shows the number of crossings and corresponding response time per participant in each condition. Only 2 out of 10 participants felt able to cross the road when the vehicle was approaching them at 30 km/h. Besides also being the only ones to cross during the constant speed condition, these two were also the ones who made crossing decisions more quickly in the other conditions. The results are remarkably consistent, and
Figure 5 exhibits the low variability in the responses of all participants.
In summary, considering all the results of the analysis of the percentage of crossings and the response time, it is noticeable that the participants felt more opportunities to cross the road safely when the vehicle speed varied, namely in stimuli where the car had the pattern of stopping and slowing down. In the responses given by the participants to the stimuli related to the stop speed pattern, it was possible to verify some differences between the different auditory conditions. In these cases, and for the gasoline combustion vehicle, participants made their decision more quickly than in the other two types of stimulus.
3.3. Time-To-Passage
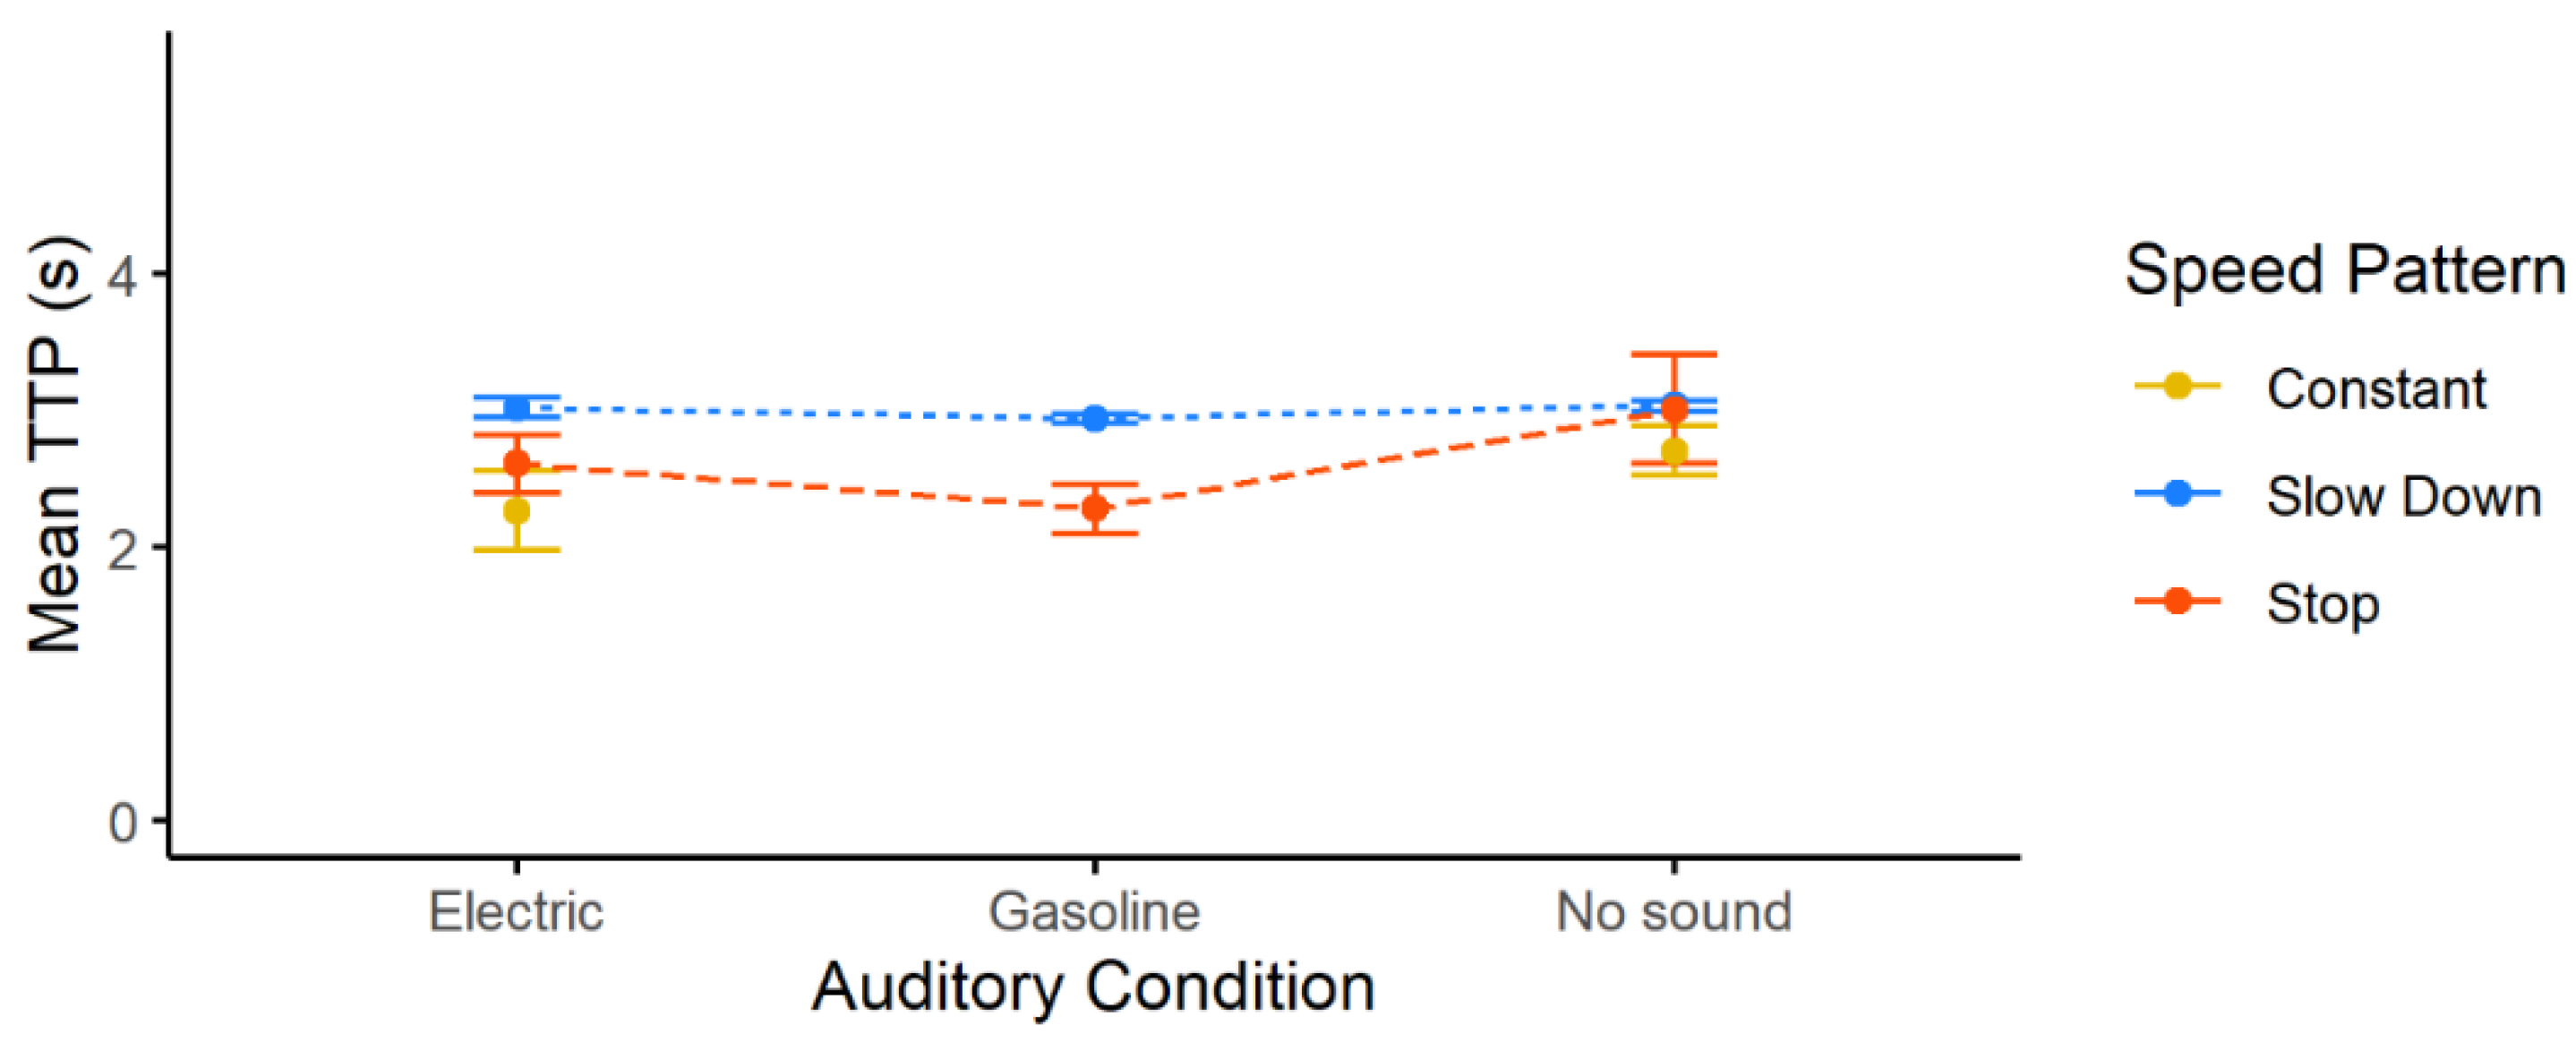
The values of TTP were very similar across conditions. Nevertheless, a slightly lower value of TTP for the stop and constant speed conditions was noticeable when compared with the slow down condition. Regarding the type of auditory condition, lower values of TTP were found when the gasoline vehicle approached than in the others. The highest values of TTP were found in no sound condition (
Figure 6).
The results of the Linear Mixed Model confirmed what is shown in
Figure 6. The auditory condition had a significant influence on the TTP. The obtained values of TTP regarding the no sound stimuli (m = 3.01 s; sd = 1.34 s;
p = 0.02) were significantly higher than those obtained with the approaching of the electric vehicle (m = 2.80 s; sd = 0.83 s). When the gasoline combustion vehicle (m = 2.61 s; sd = 0.81 s;
p = 0.04) approached the participants, the TTP was significantly lower than observed for the remaining auditory conditions. Regarding the speed pattern, the results of the model showed the TTP for the slow down (m = 3.00 s; sd = 0.30 s;
p = 0.40) and stop (m = 2.62 s; sd = 1.42 s;
p = 0.81) patterns was not significantly different from that verified for the constant speed pattern (m = 2.59 s; sd = 0.44 s).
Because TTP is the result of dividing the vehicle distance by the approaching velocity, the role of these two components was analyzed in more detail.
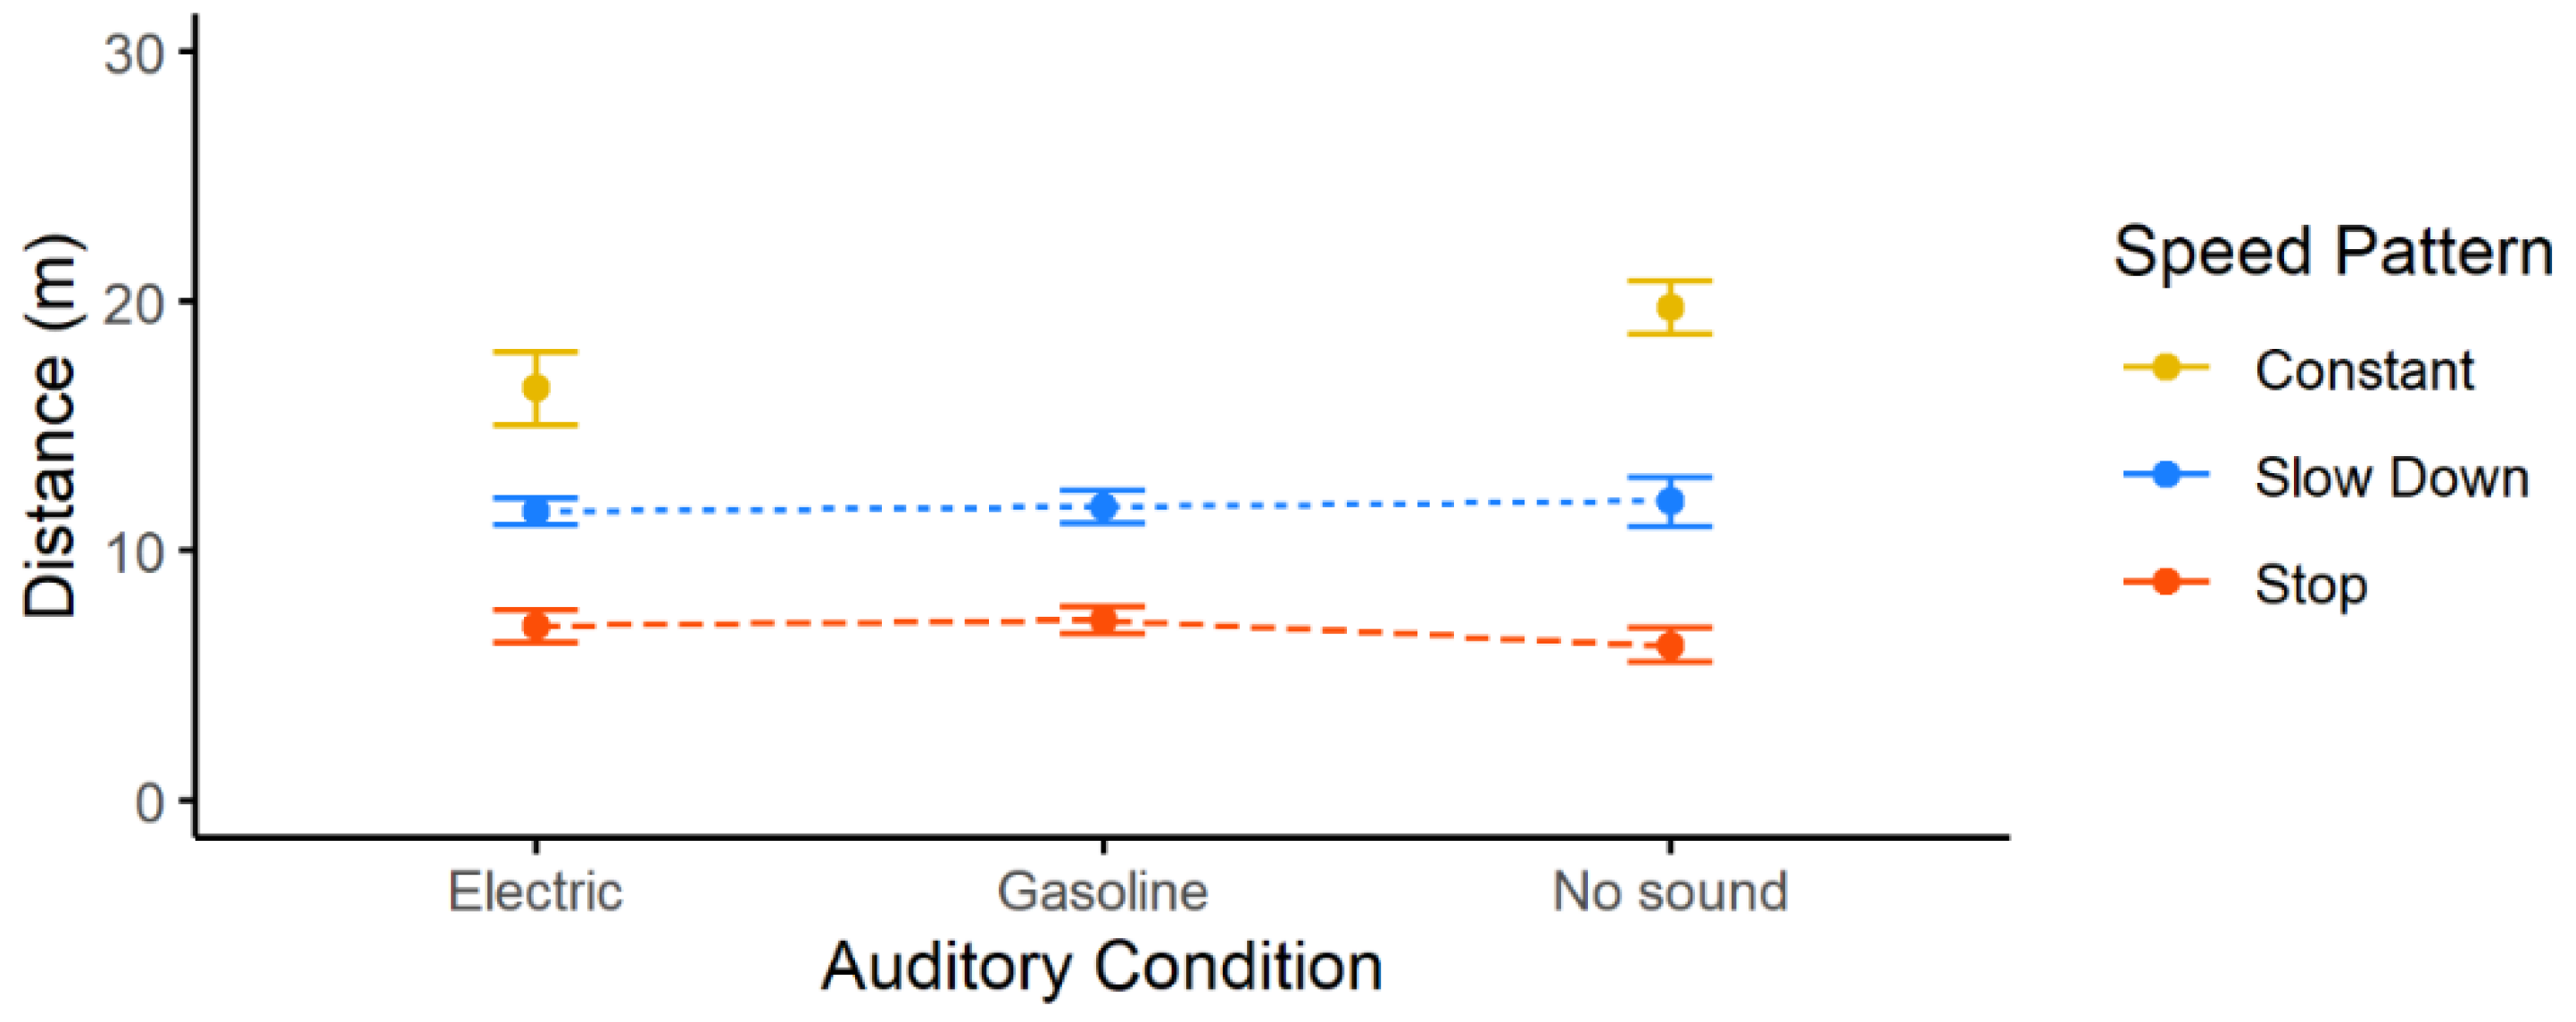
Two Linear Mixed Models were developed to assess the influence of the auditory condition on the distance at which the vehicle was and the speed it was going at the moment the participants decided to cross. The analysis in
Figure 7 shows that these distances were very similar in all auditory conditions, considering each speed pattern separately. The results of the model show that the recorded distances at the moment of response did not differ in the no sound condition (m = 9.45 m; sd = 4.98 m;
p = 0.70) or in the gasoline condition (m = 9.50 m; sd = 3.54 m;
p = 0.39) when compared with those registered when approaching the electric vehicle (m = 9.37 m; sd = 4.12 m).
Nevertheless, this variable appeared to be affected by the vehicle speed pattern. In the stop pattern (m = 6.82 m; sd = 3.03 m; p < 0.01) the registered distances were shorter than those of the slow down pattern (m = 11.76 m; sd = 3.53 m; p < 0.01), which, in turn, were shorter than the constant pattern (m = 18.94 m; sd = 2.78 m).
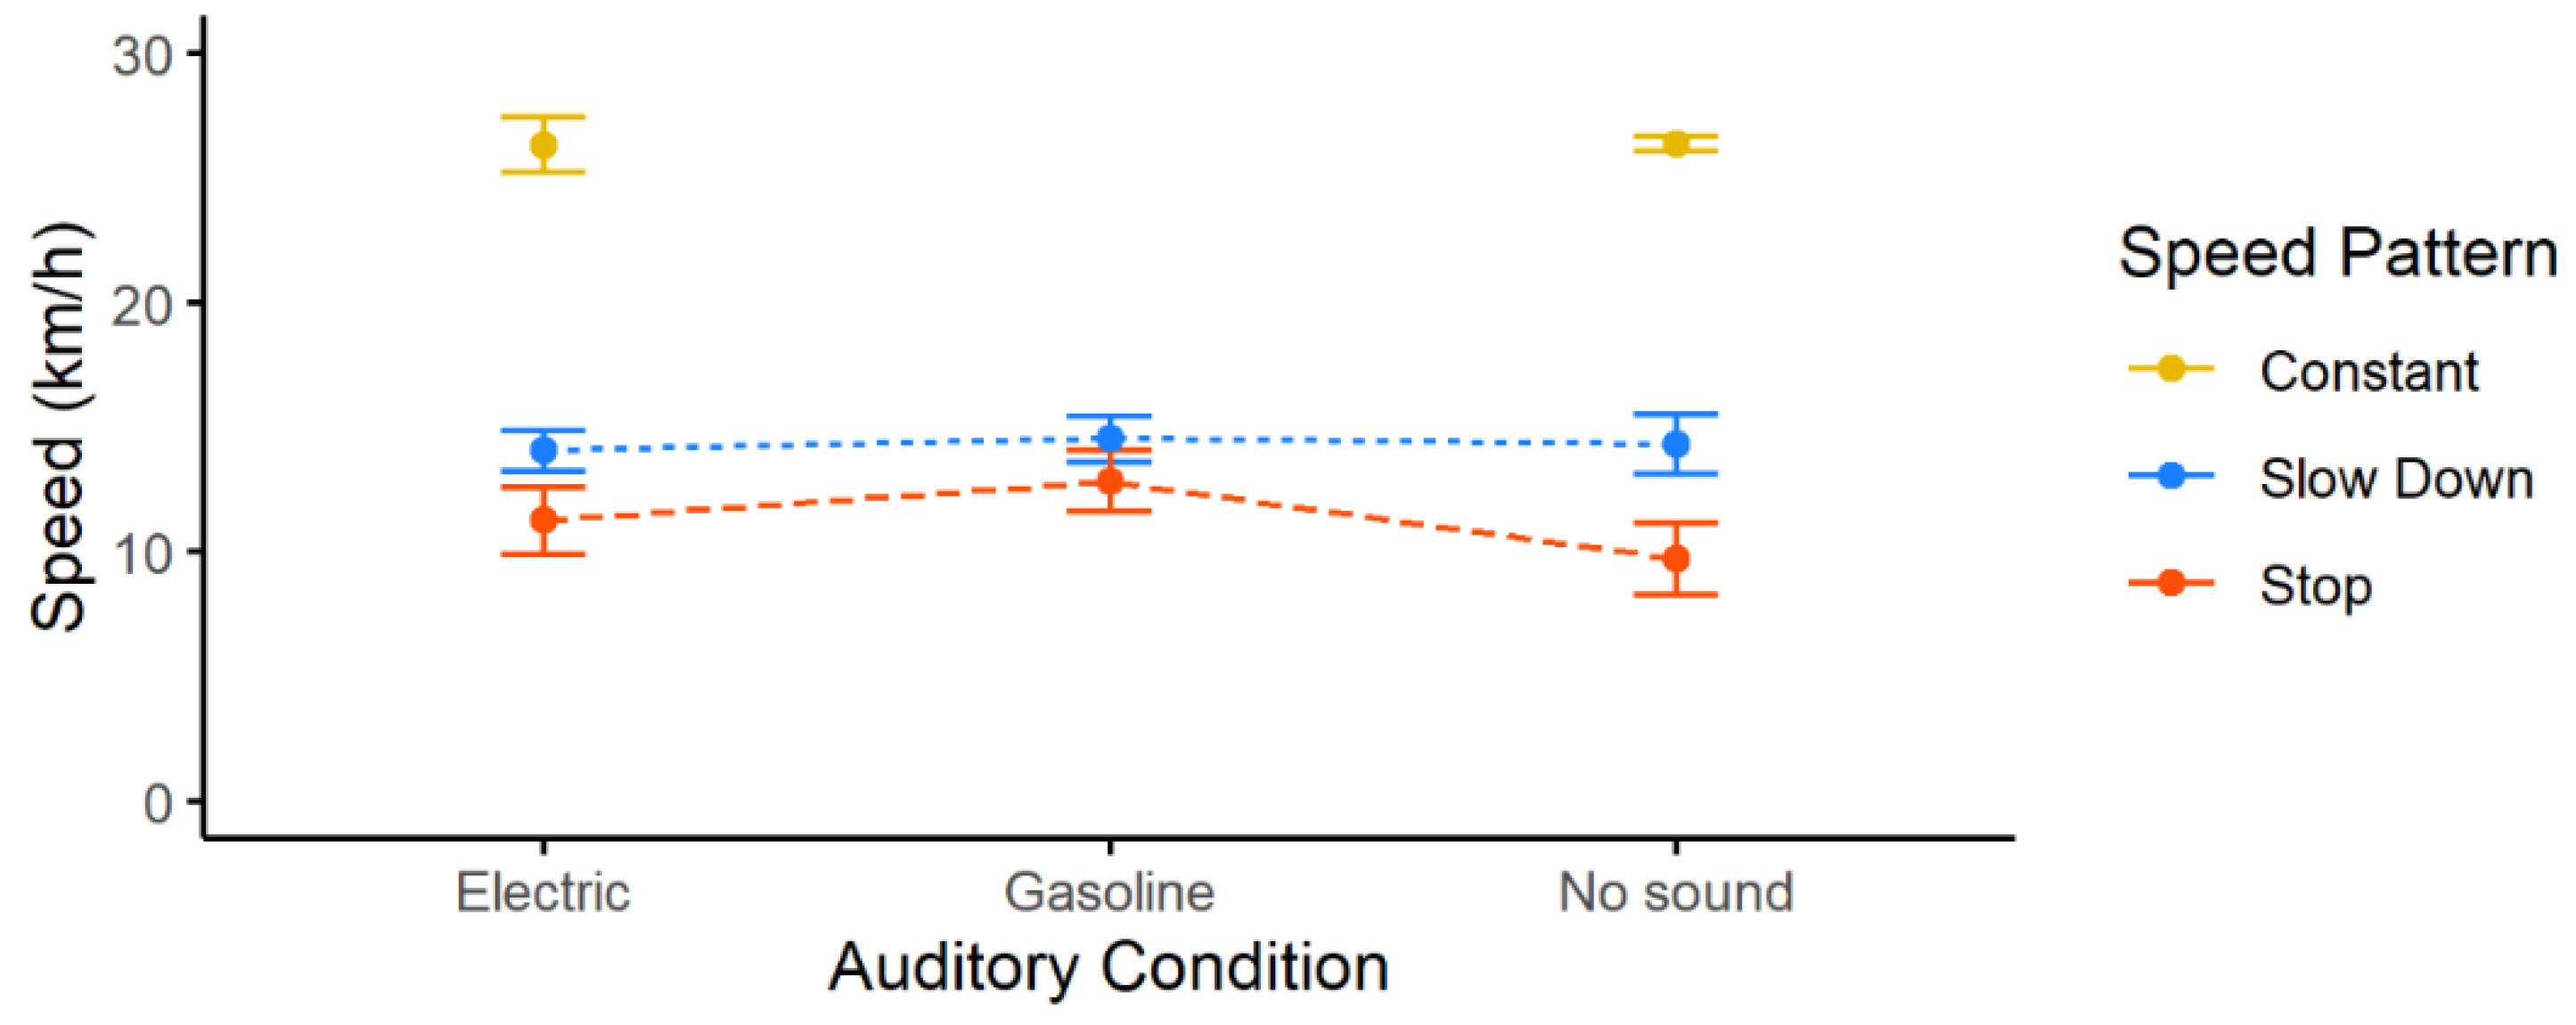
Regarding the vehicle speed at the moment of the participants’ response,
Figure 8 shows a great similarity between the three auditory conditions. However, in the results of the stop pattern stimuli, the participants crossed with higher vehicle approaching speeds when they were presented with the sound of a gasoline combustion vehicle. The model results show that in fact the vehicle speed at the moment of response was significantly higher for gasoline stimuli (m = 13.72 km/h; sd = 4.92 km/h;
p = 0.02) than for electric stimuli (m = 12.85 km/h; sd = 5.51 km/h). Non-significant differences were found between the speeds of the no sound (m = 12.47 km/h; sd = 6.34 km/h;
p = 0.13) and electric condition.
As in the case of distance, the vehicle approaching speed at the time of the participants’ cross significantly depended on the vehicle speed pattern. In the stop pattern (m = 11.34 km/h; sd = 5.96 km/h; p < 0.01), the registered speeds were lower than those of the slow down pattern (m = 14.31 km/h; sd = 4.43 km/h; p < 0.01), which, in turn, were lower than those of the constant pattern (m = 26.37 km/h; sd = 0.93 km/h). Nevertheless, one should regard the differences between the constant pattern and the other conditions with care, due to the lower number of observations (i.e., lower number of crossing decisions) in this particular condition.
4. Discussion
On the one hand, pedestrian crossing decision-making appears to be based mainly on the readily assessable visual information of an approaching vehicle, specifically its speed and distance [
18]; on the other hand, auditory cues can play an important role in both detecting and improving locating of approaching vehicles [
11,
12].
The increasing presence of hybrid and electric vehicles raises important questions about the impact of auditory cues on pedestrian safety, especially in situations of conflict between pedestrians and vehicles, such as in cases of crossing the road when a vehicle is approaching [
7,
13,
14,
16]. The purpose of this study was to contribute to this ongoing discussion by assessing the influence of the type of sound emitted by a vehicle and the auditory cues on pedestrian crossing decision-making, without neglecting the role of the vehicle speed and distance, as well as its movement pattern.
Three types of stimuli were presented to the participants, corresponding to the approach of a vehicle with different movement characteristics: a vehicle emitting the sound of an electric car, a vehicle emitting the sound of a gasoline combustion car, and a vehicle with no audio component.
The results show that, contrary to the hypothesis of this study, the type of emitted sound had a negligible influence on the number of times the participants decided to cross the road. On the other hand, the movement pattern of the approaching vehicle seemed to play a more relevant role.
In general, participants only chose to cross when the vehicle displayed signs of slowing down. For a vehicle starting distance of 30 m and a constant speed of 30 km/h, most participants assumed that it was not safe to cross the road. The analysis of the number of crossings as a function of response times confirmed this conclusion. At constant speed stimuli, the very few crossings occurred at an early stage of the stimulus presentation, while, in stimuli where the vehicle speed decreased, the participants waited for the approaching vehicle to reach lower speeds in order to communicate their decision to cross.
The gasoline combustion vehicle seemed to lead to faster crossing decisions, particularly in the stop condition. However, this also meant that participants crossed when the speed was still relatively high, which, counter-intuitively, ended up resulting in lower TTP values at the time of crossing decision. The shorter response times for gasoline could, at first view, indicate a better trajectory estimation for louder vehicles. However, a difference was not found between the electric and no sound conditions. In addition, when analyzing vehicle distances and speeds at the time which the responses were given, it is apparent that the participants’ decision was based primarily on the vehicle distance, which was specific for each vehicle speed pattern. For each of the three different auditory conditions, participants clicked on the computer mouse when the vehicle was always at the same distance. That distance selected by the participants was greater for higher approaching speed conditions. Expectably, the similarity in distances should have been accompanied by similarities in vehicle speed, if the vehicle speed and its evolution over time were exactly the same in the three types of auditory condition. In such cases, no difference would have been observed in the TTP values and response times when the three auditory conditions were compared. However, differences in speed of about 1.7 km/h existed between conditions, resulting from the manual driving variability during the CPB and movement trajectories acquisition sessions. This difference contributes to explain the slightly lower TTP values for gasoline vehicle in the stop condition.
Another possible influencing factor is that visual model of the car presented during these two auditory conditions was different (Kia Ceed for gasoline combustion vehicle trials and Renault Zoe ZE for the electric vehicle trials), and the physical characteristics (such as dimension) of the vehicle can be important for the visual looming perception [
32].
The results of this work support the view that pedestrians make crossing decisions based mainly on the movement characteristics of the approaching vehicle, using visual information to estimate the safeness of crossing the road [
18,
19,
20]. However, they also indicate that the speed of the approaching vehicle may have an important role in the decision process, supporting the most common view that the distance of the oncoming vehicle is the most important parameter in crossing decision-making [
19,
20]. Considering the testing conditions implemented in this work, it is possible to state that for situations in which only one vehicle approaches the crosswalk from a short distance and with no occlusion to the pedestrian’s visibility, the sound does not seem to be the most meaningful cue for the pedestrians’ crossing decision-making.
Overall, the conclusions of Verheijen and Jabben [
6], who pointed electric vehicles as more dangerous for pedestrians, at least for situations in which detection has already occurred, could not be verified. The number of times that participants crossed when faced with an approaching electric vehicle was very similar to the number of times that participants crossed when faced with a gasoline vehicle. Moreover, the approaching speed at the moment of crossing decision was lower for trials with electric vehicles, thus allowing participants to cross more safely.
It is worth noting the distinction between the trajectory and speed estimation, which is the object of this study, and vehicle detection. Even considering that the trajectory of the electric car can be estimated with the same precision as the gasoline combustion one, the first can still be more dangerous because it can be much more difficult to detect in situations that pedestrians are not looking at it or have an obstacle occluding the approaching vehicle due to the lower levels of noise emitted by this type of vehicles.
Finally, the differences in crossing percentages as a function of speed pattern are regard to be as a quite relevant conclusion. Contrary to other studies that usually assume constant speed (e.g., [
19,
20,
22,
26,
27,
28,
29]), this study showed that the speed pattern is a relevant factor of crossing decision-making and should be a variable of interest in pedestrian simulator studies. Future work should complement this approach with other vehicle approaching patterns. Implementing different speeds and variations of the initial distance, as well as simulating different visibility conditions to the approaching vehicle, would be an interesting improvement aiming to clarify a possible impact of the sound emitted by the vehicle on the participants’ crossing decision-making.
5. Conclusions
The aim of this study was to analyze the importance of auditory cues and, more specifically, how the type of noise emitted by vehicles can affect pedestrian crossing decision-making. In a virtual scenario, three types of stimuli corresponding to the approach of a vehicle were presented to the participants: a vehicle emitting the sound of an electric car, a vehicle emitting the sound of a gasoline combustion engine car, and a vehicle that did not produce any sound. Three types of speed patterns were considered based on observational data: constant speed, slow down, and stop patterns. The sound emitted by the simulated vehicles consisted of samples collected through controlled pass-by measurements in a semi-controlled environment.
The results show that the movement characteristics of the approaching vehicle, the speed, and especially the distance, were determining factors on the participants’ crossing decision. On the other hand, the sound emitted by the approaching vehicle or its absence does not seem to be a meaningful factor as expected for explaining participants’ crossing decision-making, at least in scenarios where participants are crossing a road having perfect visibility conditions of the approaching vehicle.
Moreover, this enhanced simulator proved to be a useful tool in the study of pedestrian crossing decision-making.


 and
and 


