Analysis of Salt Mixture Contamination on Insulators via Laser-Induced Breakdown Spectroscopy


1
Shanxi Electric Power Research Institute, Taiyuan 030000, China
2
Engineering Laboratory of Power Equipment Reliability in Complicated Coastal Environments, Tsinghua Shenzhen International Graduate School, Shenzhen 518055, China
*
Author to whom correspondence should be addressed.
Appl. Sci. 2020, 10(7), 2617; https://doi.org/10.3390/app10072617
Submission received: 4 March 2020
/
Revised: 3 April 2020
/
Accepted: 5 April 2020
/
Published: 10 April 2020
(This article belongs to the Special Issue Advances and Technologies in High Voltage Power Systems Operation, Control, Protection and Security)
Abstract
:The composition of contamination deposited on transmission line insulators can affect their surface flashover voltage. Currently, there is no rapid on-line method to detect this contamination composition in power grids. In this paper, we applied laser-induced breakdown spectroscopy (LIBS) to analyze contamination on insulator surfaces. Usually, Na and Ca salts are found in contamination along with various sulfate, carbonate, and chloride compounds. As an element’s detection method, LIBS can only measure a certain element content, for example, Ca. The mixture of various compounds with the same cations can influence the LIBS signal. The influence of mixing ratios on the calibration curves and relative spectral intensity was studied via LIBS. Na2CO3, NaHCO3, CaSO4, and CaCO3 samples containing different proportions of Na and Ca were prepared. The linear correlation coefficients (R2) for the Na and Ca calibration curves generated using various mixing ratios were analyzed. The results showed that the mixture ratio did not dramatically affect the linear calibration curves for mixtures containing the same cations. This finding may significantly reduce the difficulty of applying LIBS analysis for complex contamination on insulators. The laser energy density had effects on the spectral characteristics of the measured elements. The partial least-square regression (PLSR) model can improve the accuracy of Na and Ca prediction.
1. Introduction
Insulators are key components on transmission lines because they provide sufficient insulation space between the conductor line and the ground. Usually, insulators are made of glass, ceramics, and polymers [1]. During prolonged outdoor service, contamination or pollution is inevitably deposited on insulator surfaces and consists of dust, particles, and other airborne substances. This contamination cannot be avoided because transmission lines are the main energy transport channel for every grid. Under dry conditions, this contamination is relatively safe. Still, in heavy fog or rainy weather, the soluble components in the contamination can dissolve in the water and form conductive paths on the insulator surfaces, thus reducing the flashover voltage and causing discharge and even accidental flashover. In China, there were several power outage incidents in the 1990s due to transmission flashover caused by contamination deposited on insulators in heavy fog weather [2]. This phenomenon was deemed surface flashover in high-voltage engineering and has become a topic of interest in this field. Thus, the detection of contamination composition has become an important task in the regular operation of the State Grid.
The main factors affecting the surface discharge activity and flashover process of pollution insulators are the equivalent salt deposit density (ESDD) level and relativity air humidity (RH). Higher ESDD or higher RH will lead to more intense discharges and lower flashover voltage [3,4]. Contaminant composition, especially soluble salts (including common salts such as NaCl, NaNO3, Na2SO4, MgC12, Mg(NO3)2, MgSO4, CaCl2, Ca(NO3)2, and CaSO4.), and material properties can affect the flashover process, which may result in an excess or lack of insulation during insulation design. A previous study showed that the tendency for an insulator to flashover is dependent on the type of contaminant, as well as on the equivalent salt density [5]. At present, the only way to analyze these salt compositions is by collecting the contamination during a power outage and taking the sample back to the lab for analysis with chemistry equipment. It needs a new method that can be used for on-site and on-line detection of contamination in insulators.
In recent years, laser-induced breakdown spectroscopy (LIBS) has developed rapidly in power engineering because of its advantages, such as no sample preparation, harmless sampling, and fast detection speed. LIBS has been widely applied as a tool for mineral analysis, archaeology, biomedical analysis, aerospace exploration, etc. [6,7,8]. The basic experimental process involves exciting plasma with a high-energy laser and collecting its characteristic spectral information to obtain the elemental composition and surface condition of the target material.
In recent years, LIBS has also played an important role in the online detection of power equipment status in high-voltage engineering. Huan et al. [9] applied LIBS technology to detect the vacuum degree of vacuum breakers. Based on the fact that the intensity of characteristic spectral lines of different elements, including Cu, O, N, and H, will change with the vacuum degree of the vacuum breaker, the vacuum degree can be predicted. In their study, principal component analysis (PCA) and the artificial neural network (ANN) model were used to optimize the spectral line selection, and the accuracy of the final model reached 96.67% [10,11]. Our previous work proved that the number of laser pulses has a linear relationship with the depth of ablation. Thus, the distribution of elements along with depth on one test point of silicon rubber was obtained, and the thickness of the aging layer could be calculated accordingly [12,13,14].
A remote laser-induced breakdown spectroscopy technique combined with a photometric device was proposed and demonstrated at the laboratory scale. It was used for the remote sensing and quantification of surface pollutants such as salt deposits on wind turbine blades from different standoff distances [15]. Nearly every element was studied with LIBS to obtain calibration curves for quantitative analysis of soils, rocks, compounds, and other materials [16,17,18]. However, on the surface of transmission line insulators, the contamination consists of various compounds that may have the same cations. It is necessary to determine the influence of various compound ratios and system parameters on the calibration results to improve the detection accuracy of LIBS for the online monitoring of insulator surface pollution. Calibration curves are crucial in determining the sample contents with LIBS. There have been many studies on the composition analysis of contamination, and we used artificial pollution and compressed it into pellets. In this work, compounds containing various ratios of Na and Ca were designed and analyzed to determine the effects of these mixture ratios on the LIBS calibration results.
2. Experiments
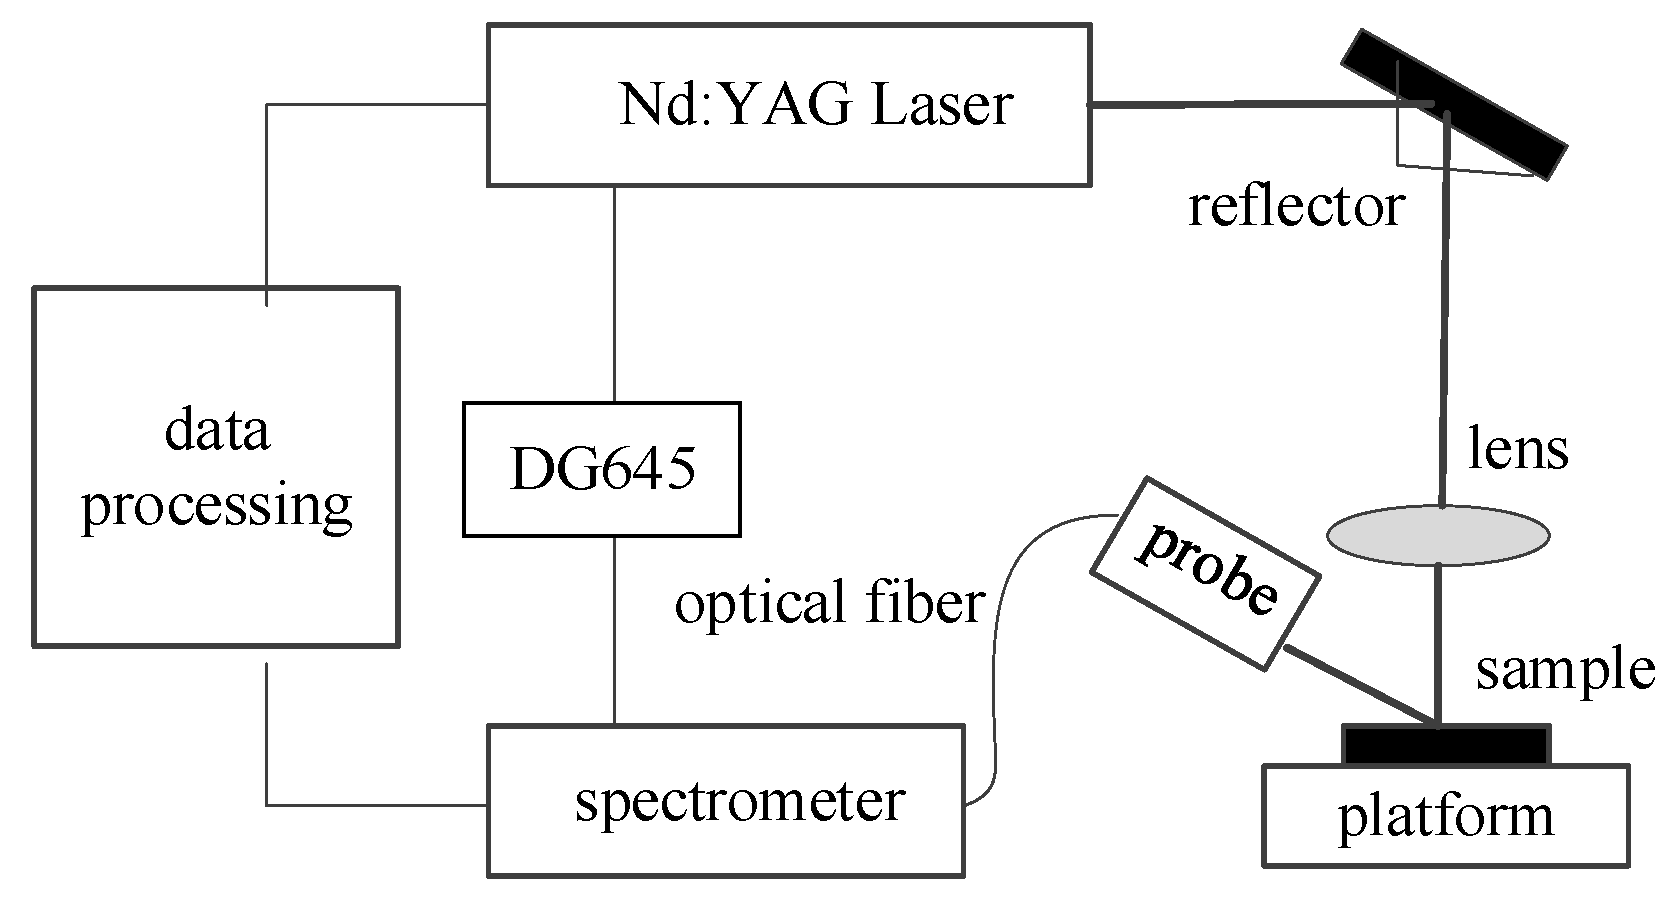
The experimental setup is depicted in Figure 1. The LIBS system consisted of a Q-switched laser (Beamtech Nimma-900), where the laser pulse duration was 10ns, shot-to-shot energy variation (RMS) ≤1%. We used an Avantes optical fiber spectrometer (190 nm to 650 nm) with 6 channels, the spectral resolution was 0.05nm, and a Stanford Research System Delay Generator SRS DG645. The laser was focused on the surface of the sample by a lens with a focal length of 100 mm. It was ablated operating at a wavelength of 1024 nm. The laser energy of the Nimma-900 could be adjusted from 1 J to 900 J. Laser fluence was determined at 1.9 J/cm2 for 38 mJ, 3.8 J/cm2 for 76 mJ, and 6.4 J/cm2 for 128 mJ.
All chemicals used in the experiments were acquired from Aladdin and were of analytical reagent grade. Mixed samples of Na2CO3 and NaHCO3 were prepared with a series of Na concentration gradients. The total mass of each sample remained constant, and the mass of Na2CO3 and NaHCO3 to be mixed was calculated separately according to the total concentration of Na set by the concentration gradient and the various mixing ratios of Na in Na2CO3 and NaHCO3. The total concentration of Na for each sample varied from 27.4% to 43.4% because the mass percentage of Na in Na2CO3 was 43.4%, and that in NaHCO3 was 27.4%. Similarly, the quantity of CaSO4 and CaCO3 to be mixed in each sample was obtained using the above method, and the Ca mass fraction of the mixtures ranged from 29.4% to 40%, corresponding to the mass percentages of Ca in CaSO4 and CaCO3, respectively. Varying ratios of Na2CO3, NaHCO3 and CaSO4, CaCO3 were prepared and mixed, as shown in Table 1. The ratios of the Na and Ca mass fractions of Na2CO3:NaHCO3 and CaSO4:CaCO3 are also shown in Table 1 and Table 2. Pellets were formed from each sample by using a circle pellet forming press with a diameter of 8 mm under 5 tons of force, which improved the LIBS ablation of the sample.
For the LIBS analysis, the pellets were placed on an optical platform. The vertical distance between the optical platform and convex lens was adjusted, so the laser spot was focused on the sample surface. The delay time of the LIBS system was 3 μs, and the diameter of the laser spot was 0.8 mm. The dark spectrum captured by the spectrometer was acquired 50 times without laser ablation. Then, 5 points were selected randomly for each sample, and the spectral data for each point were obtained after 10 rounds of 10 Hz continuous ablation. The averaged background spectrum was subtracted from the processed spectral data, and the resulting spectra were averaged. The NIST database was used to determine spectral intensities for Ca, C, Na, etc. [19]. The above analyses were repeated for the two groups of samples, #1-1 through #1-6 and #2-1 through #2-6, at a laser fluence of 3.8 J/cm2 and 6.4 J/cm2, respectively. Due to the influence of Na matrix effects, LIBS analysis at 1.9 J/cm2 was added for the analysis of samples #1-1 through #1-6. The elements were measured, as shown in Table 2.
3. Results and Discussion
3.1. Spectral Characteristics for Na2CO3 and NaHCO3
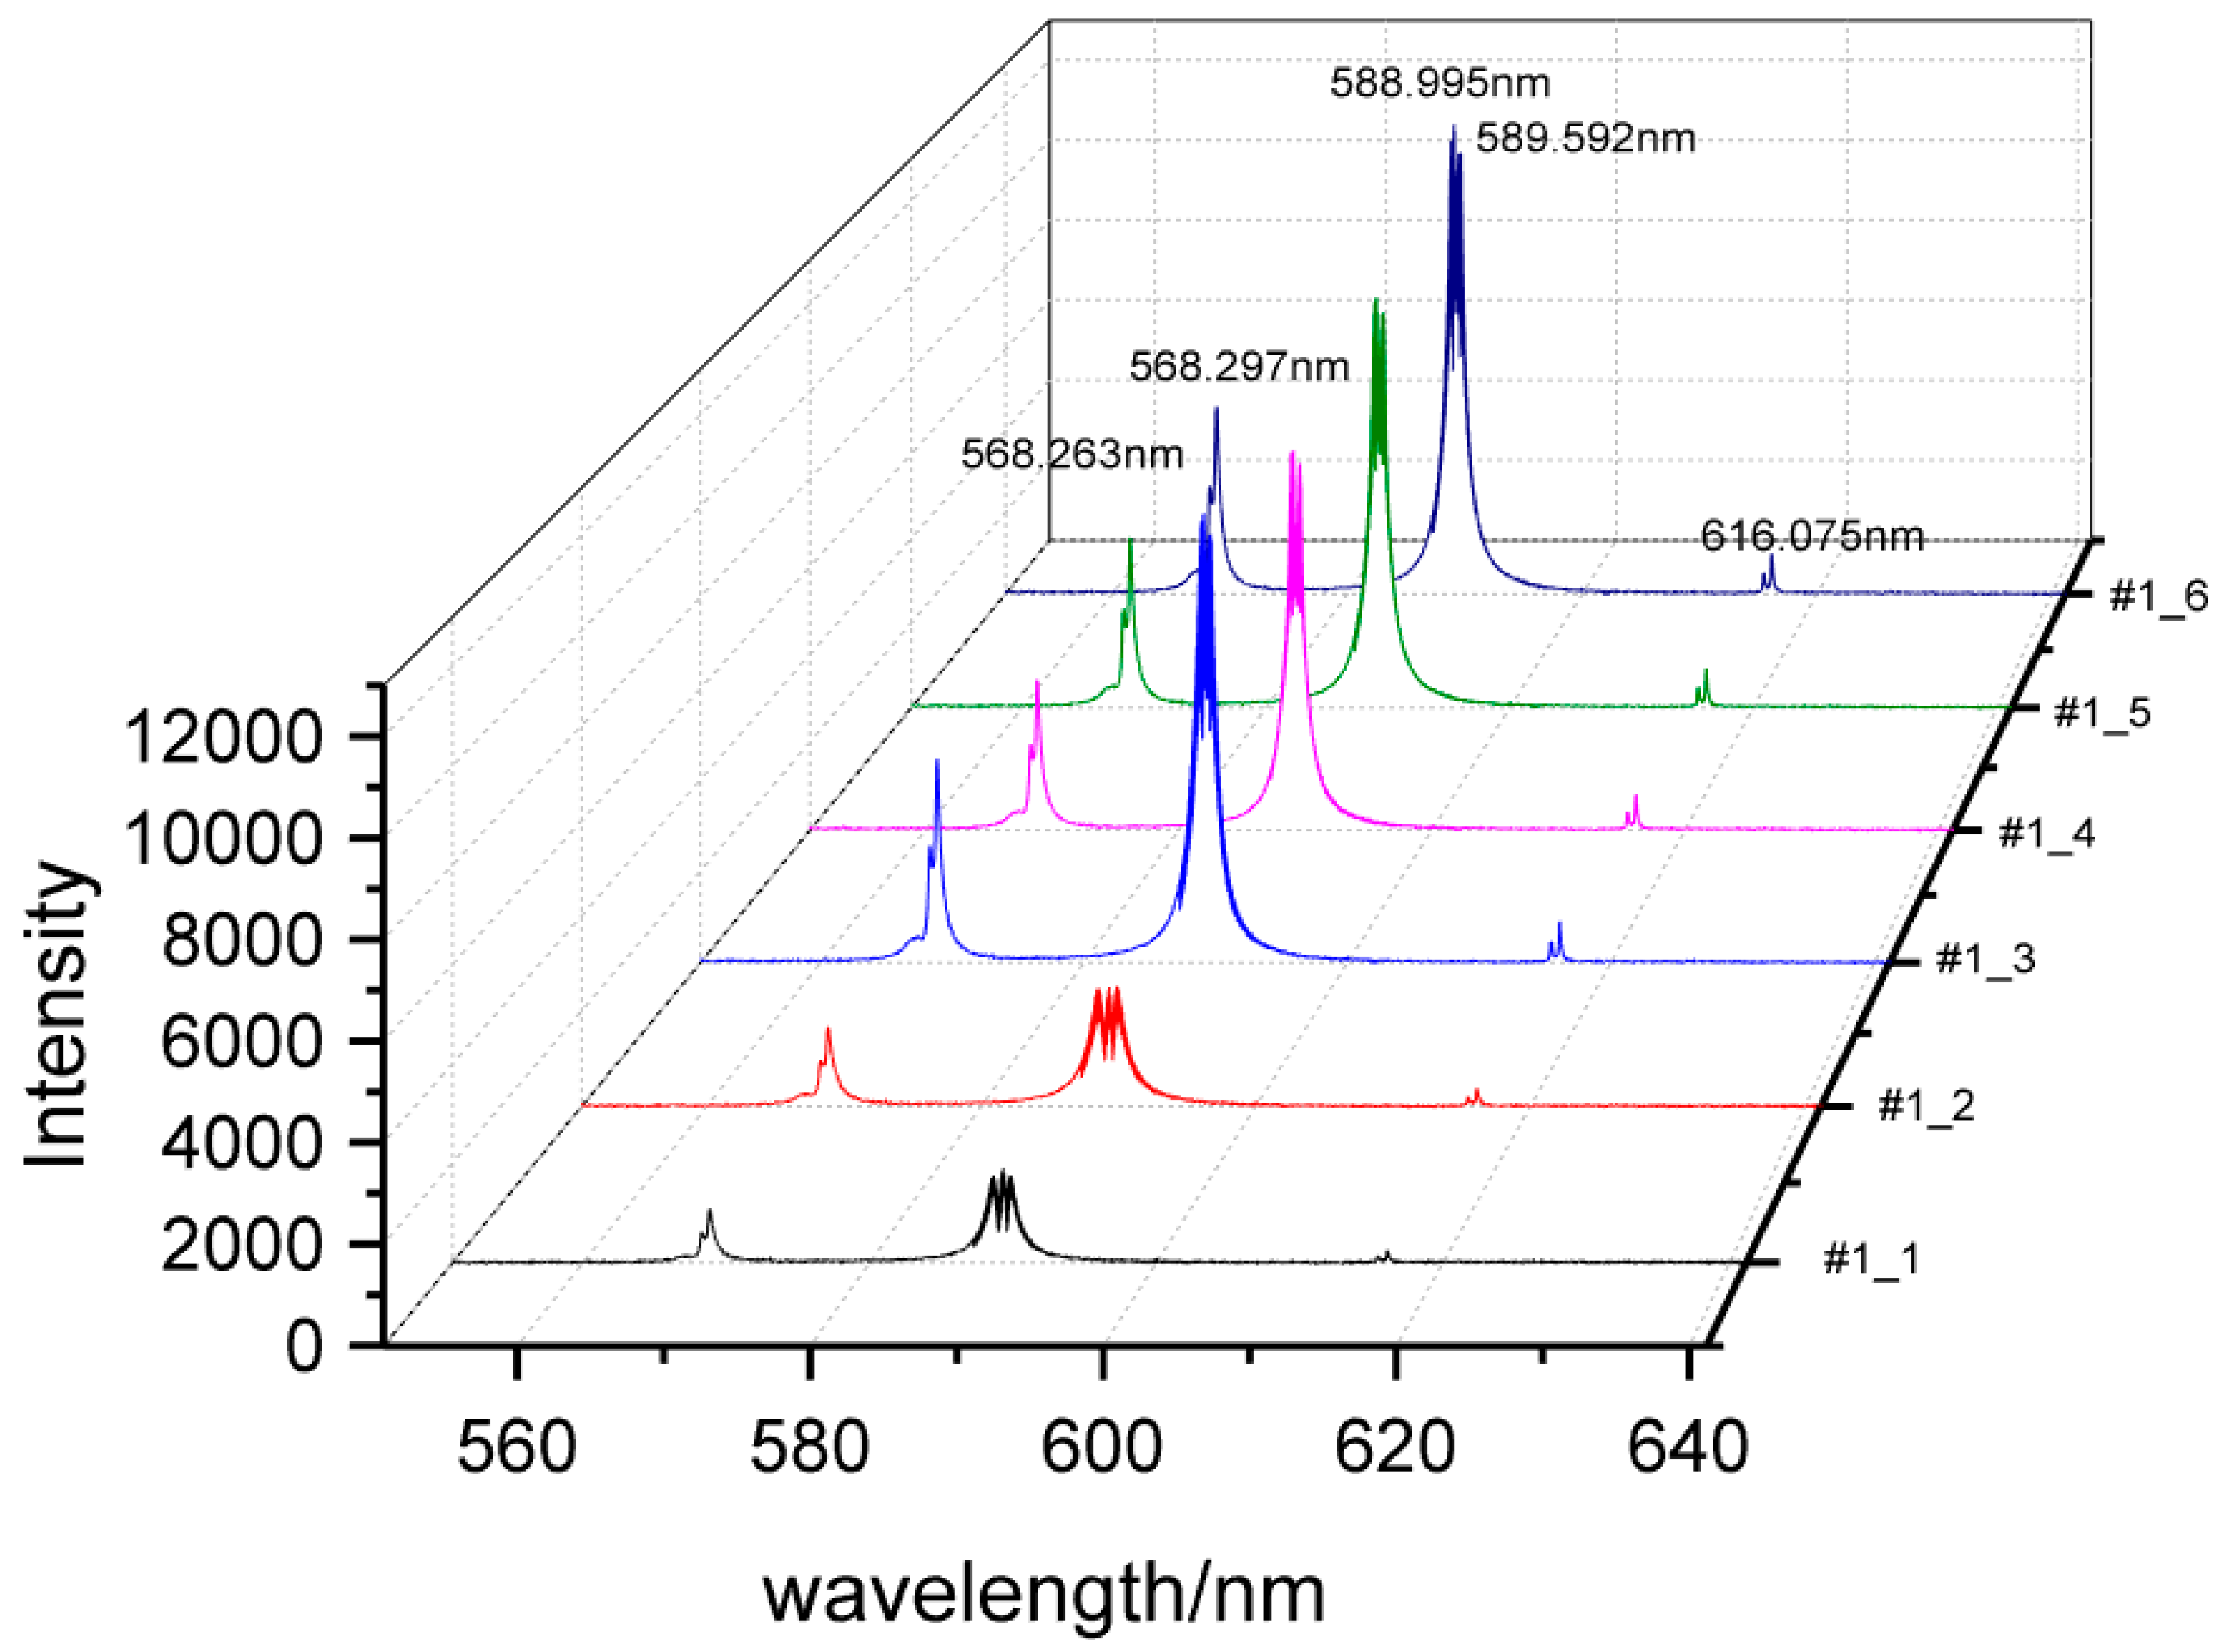
Figure 2 shows the whole spectra for samples #1-1 to #1-6 at an energy intensity of 3.8 J/cm2. The intensity of the spectra increased with increasing concentrations of Na. The Na content in Na2CO3 was higher than that in NaHCO3 when the sample had the same amount of substance. Therefore, the spectral intensity of Na2CO3 was higher than that of NaHCO3, which was demonstrated in the range of 588 nm to 589 nm. As Na2CO3 and NaHCO3 were similar in element composition, except for H, the characteristic spectral wavelengths were very similar in these samples, i.e., either they were pure compounds (#1-1 and #1-6) or a mixture of two compounds (#1-2 through #1-5).
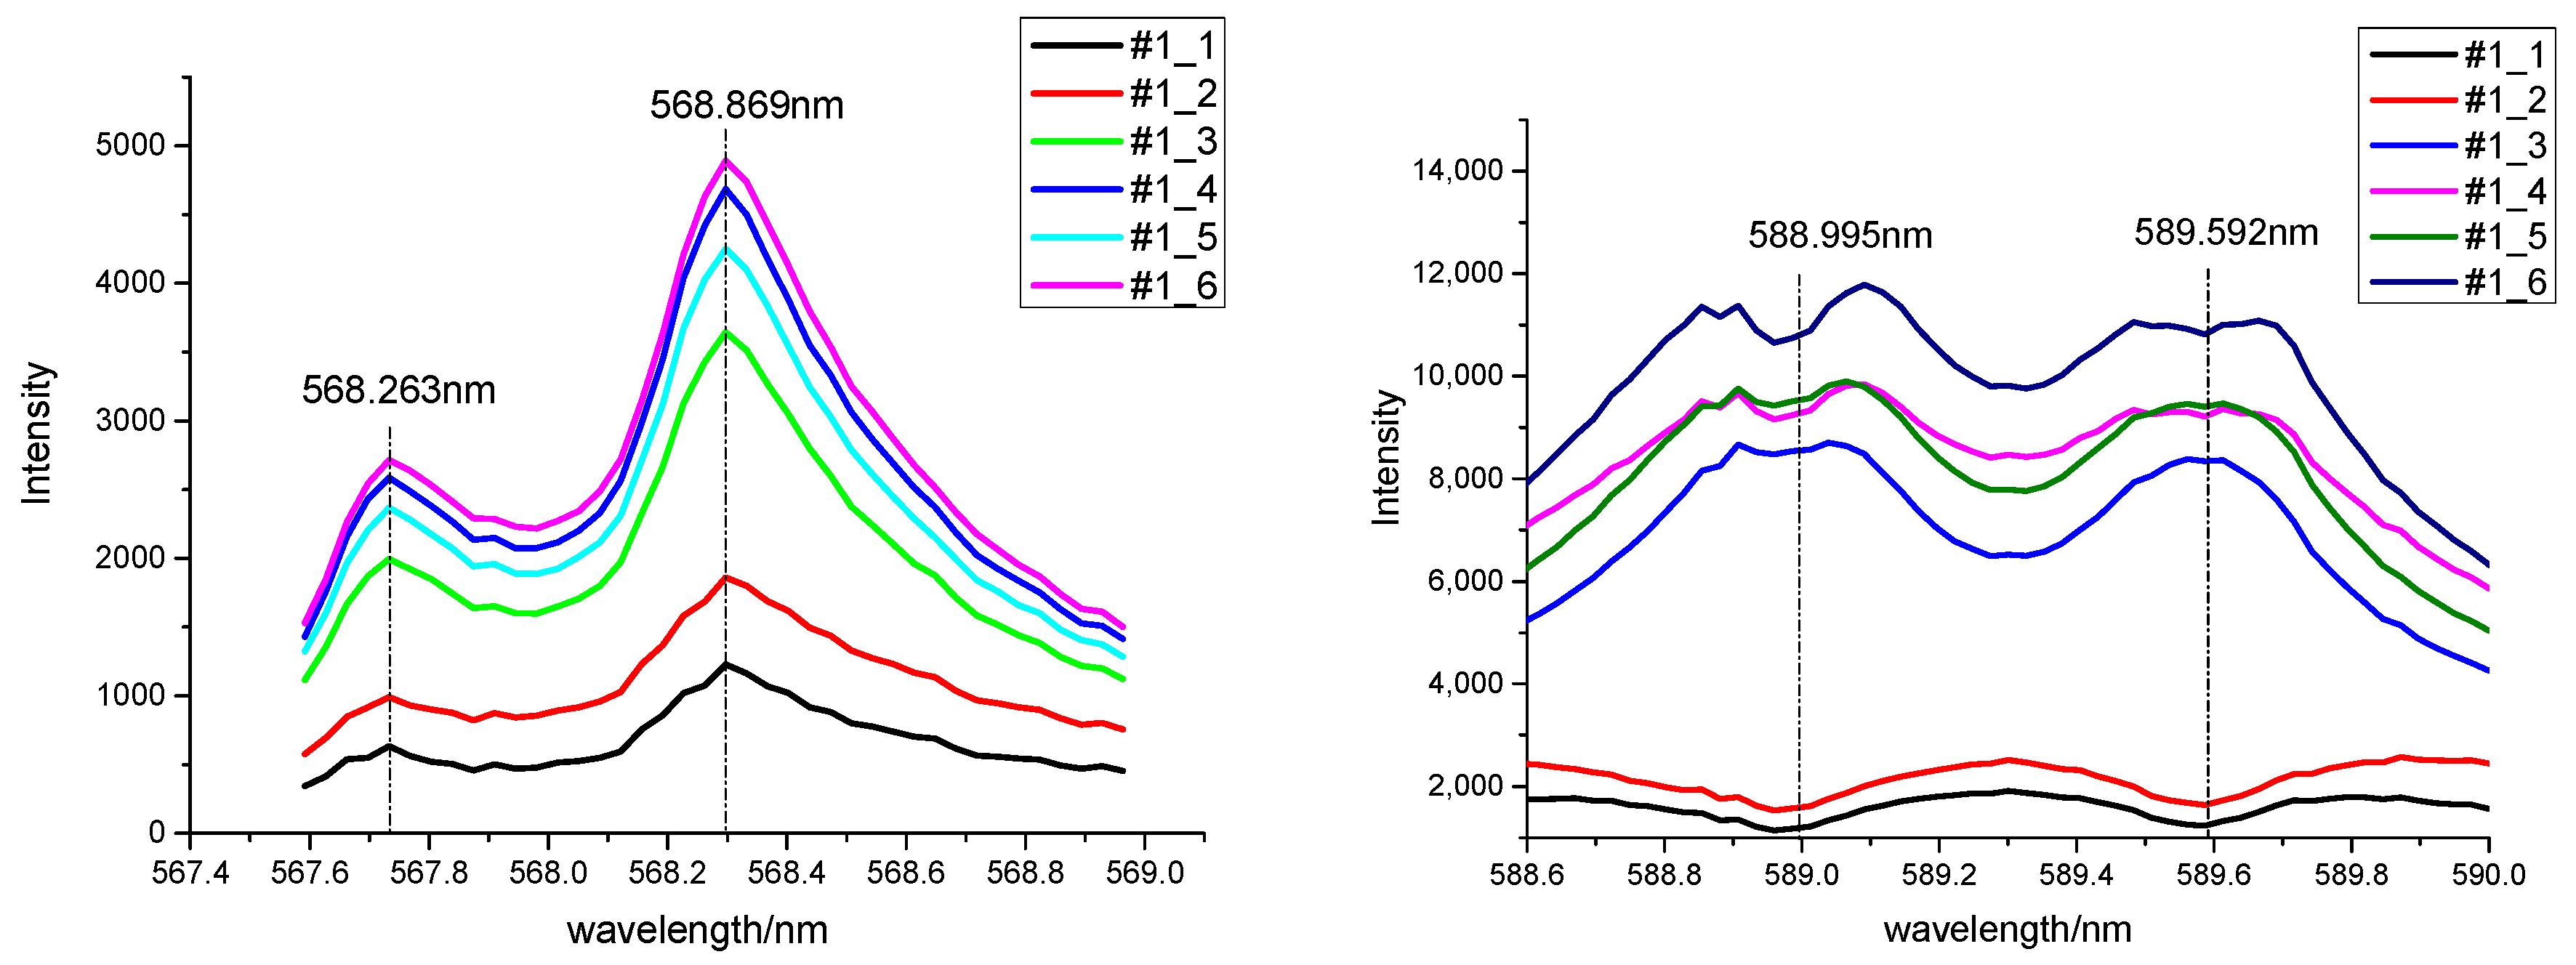
In Figure 3, the spectral resonance lines (588.995 nm, 589.592 nm) and nonresonant lines (568.297 nm, 568.859 nm) for Na were selected from Figure 2. Self-absorption was found in the resonance lines (588.995 nm, 589.592 nm) at a laser fluence of 3.8 J/cm2, as shown by a significant decrease in signal intensity. The variation in the Na concentration in different samples contributed to the self-absorption phenomenon, i.e., the higher the concentration, the more notable the self-absorption. This susceptibility existed because the laser ablated the target surface, and plasma was generated by the trailing edge of the laser pulse and disappeared during condensation. Moreover, the temperature of the entire illuminant was not uniform. After Na atoms are excited by the emission wavelength, the generated photons were absorbed by other Na atoms when passing through the low-temperature region of the plasma, resulting in changes in the intensity and profile of the Na spectrum. The influence of Na concentration on the self-absorption effect could be determined by comparing the contours of the Na resonance lines.
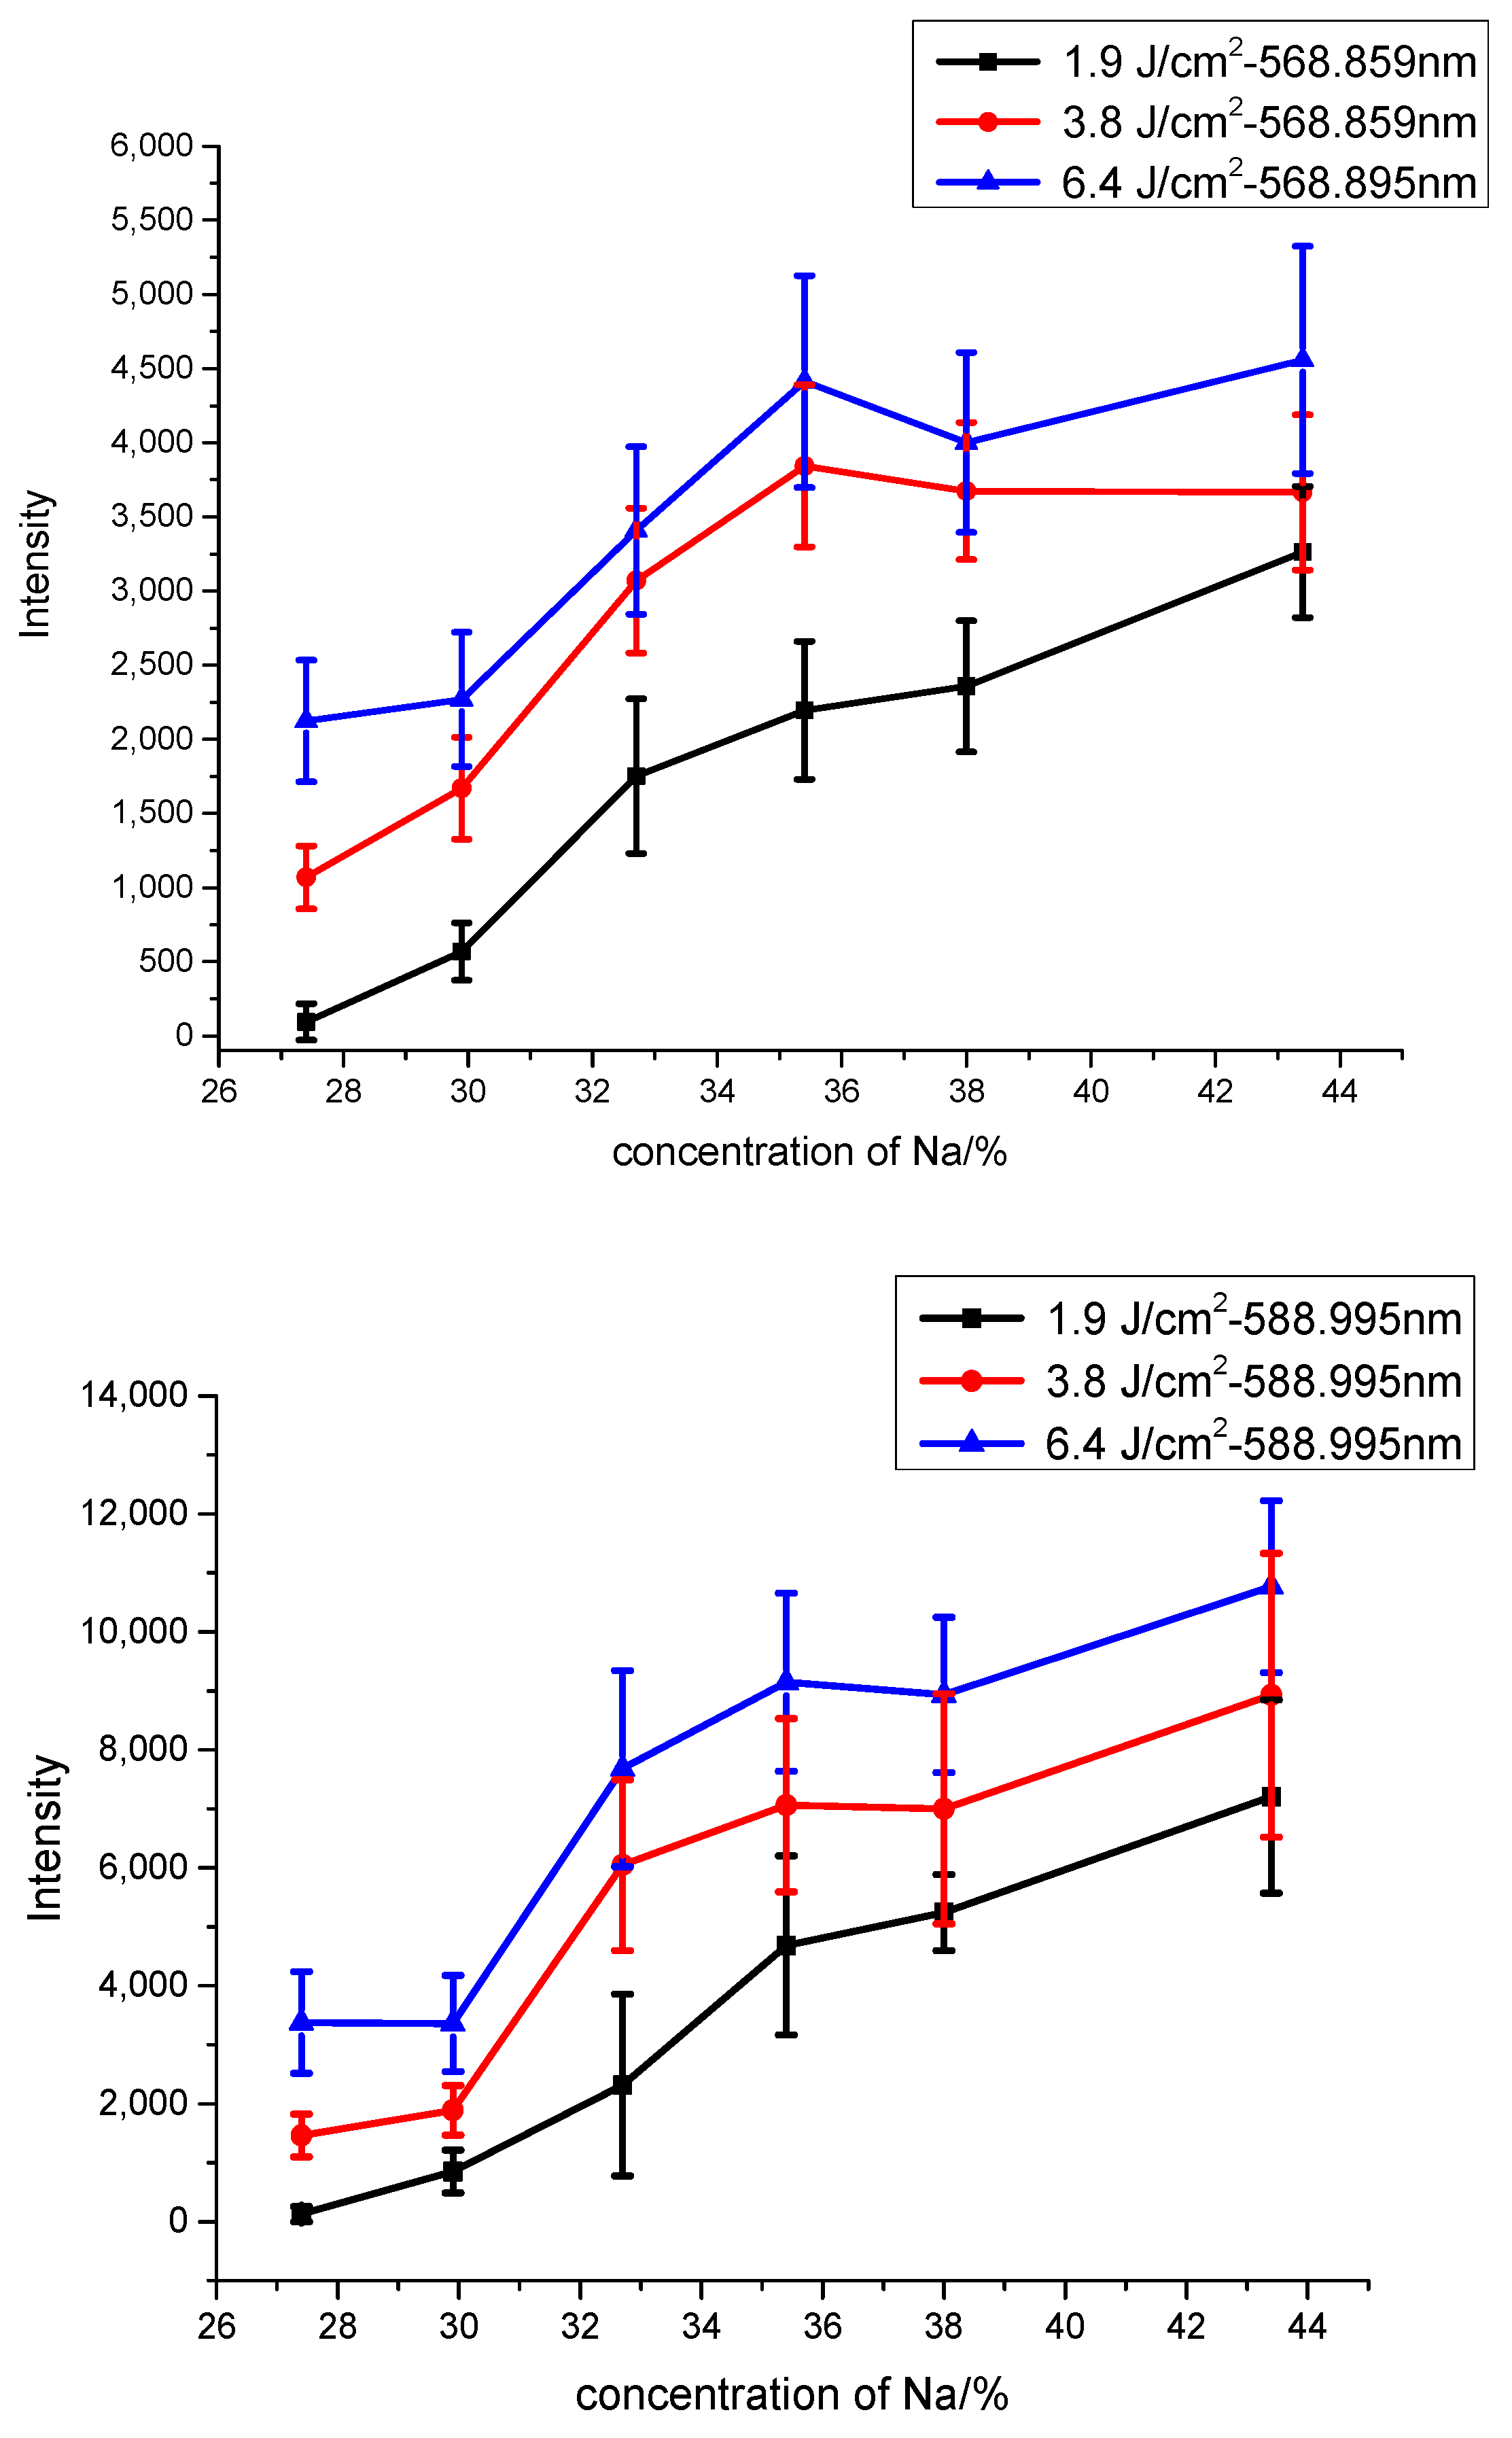
The relationship between the Na content, according to the atomic lines (Na I 588.995 nm, Na I 568.859 nm), and the average relative spectral intensity as a function of laser energy intensity is shown in Figure 4. As the laser energy density increased, the spectral intensity corresponding to each spectral line was enhanced significantly. At a laser fluence of 6.4 J/cm2, as the concentration increased, the intensity first increased and then decreased, which was due to the strong self-absorption effect. This result demonstrated that the range of Na content was limited when using calibration curves to analyze the linear relationship between Na concentration and laser fluence.
However, reducing the laser energy density per pulse and selecting the ion line reduced the atomic emission intensity because of the weak self-absorption effect. It prolonged the dynamic range of the concentration measurements, which allowed the Na atomic lines (Na I 588.995 nm, Na I 568.859 nm) to maintain a good linear relationship at a laser energy of 1.9 J/cm2. Therefore, when the concentration was held constant, reducing the laser energy, and selecting the proper Na ion line would extend the linear analysis range and improve the accuracy of Na determination using linear calibration curves. For the elements tested, a good linear relationship was the basis of the artificial data methods used to process the LIBS spectral data. This method could also be used as a preprocessing method when employing the artificial intelligence algorithm to determine the relationship between the concentration of other elements and spectral intensity.
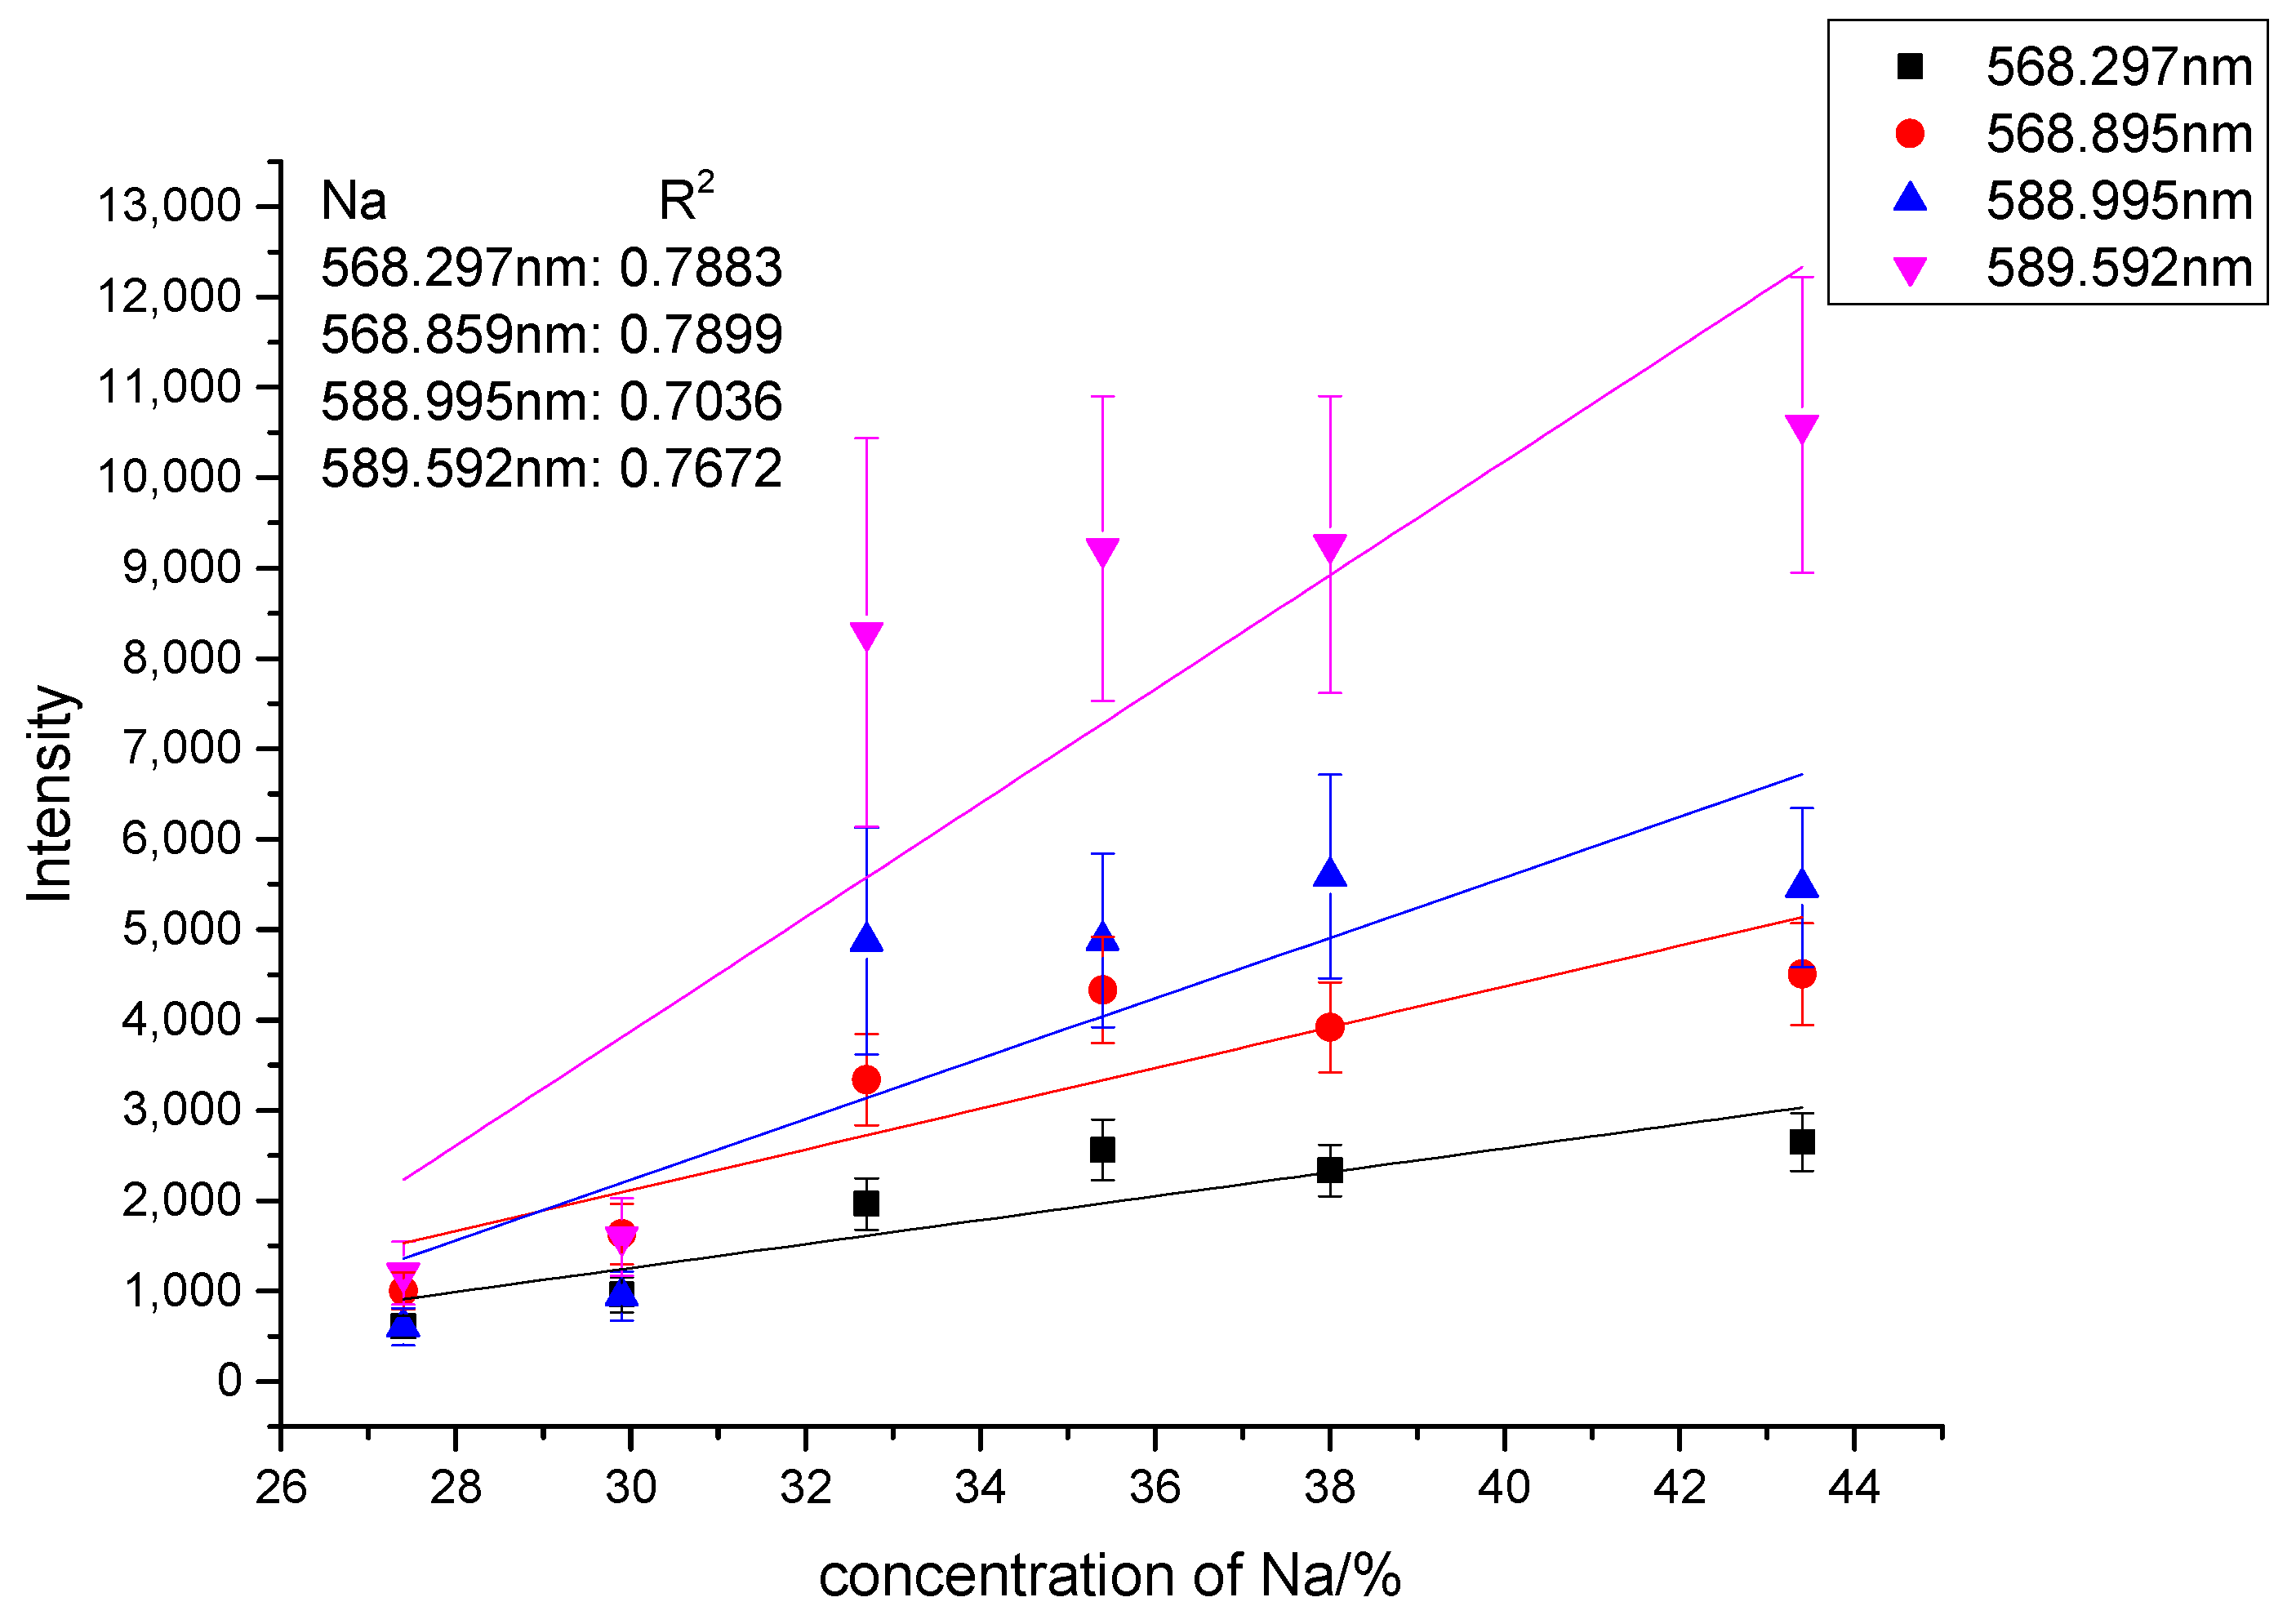
The intensity and variation trends of spectral lines were considered to analyze the influence of the Na salt mixture on the calibration results. The linear calibration coefficient (R2) for Na was obtained with a laser fluence of 3.8 J/cm2. The R2 value was greater than 0.7, as shown in Figure 5. Although the middle data point was higher in the spectrum corresponding to 588.995 nm and 589.592 nm, the spectral intensity and concentration corresponding to these data points also had linear relationships. The spectral data presented here represented the original data after subtracting the dark spectrum. The ratio of Na in samples #1-1 through #1-6 varied, but the calibration curves were similar to that of the pure compound. The mixing of various proportions of Na had minimal effects on the linear calibration model, which also indicated that the results of other complex artificial intelligence methods would not be affected. These results provided a convenient LIBS method for the on-line detection of elemental composition from multi-compound mixing.
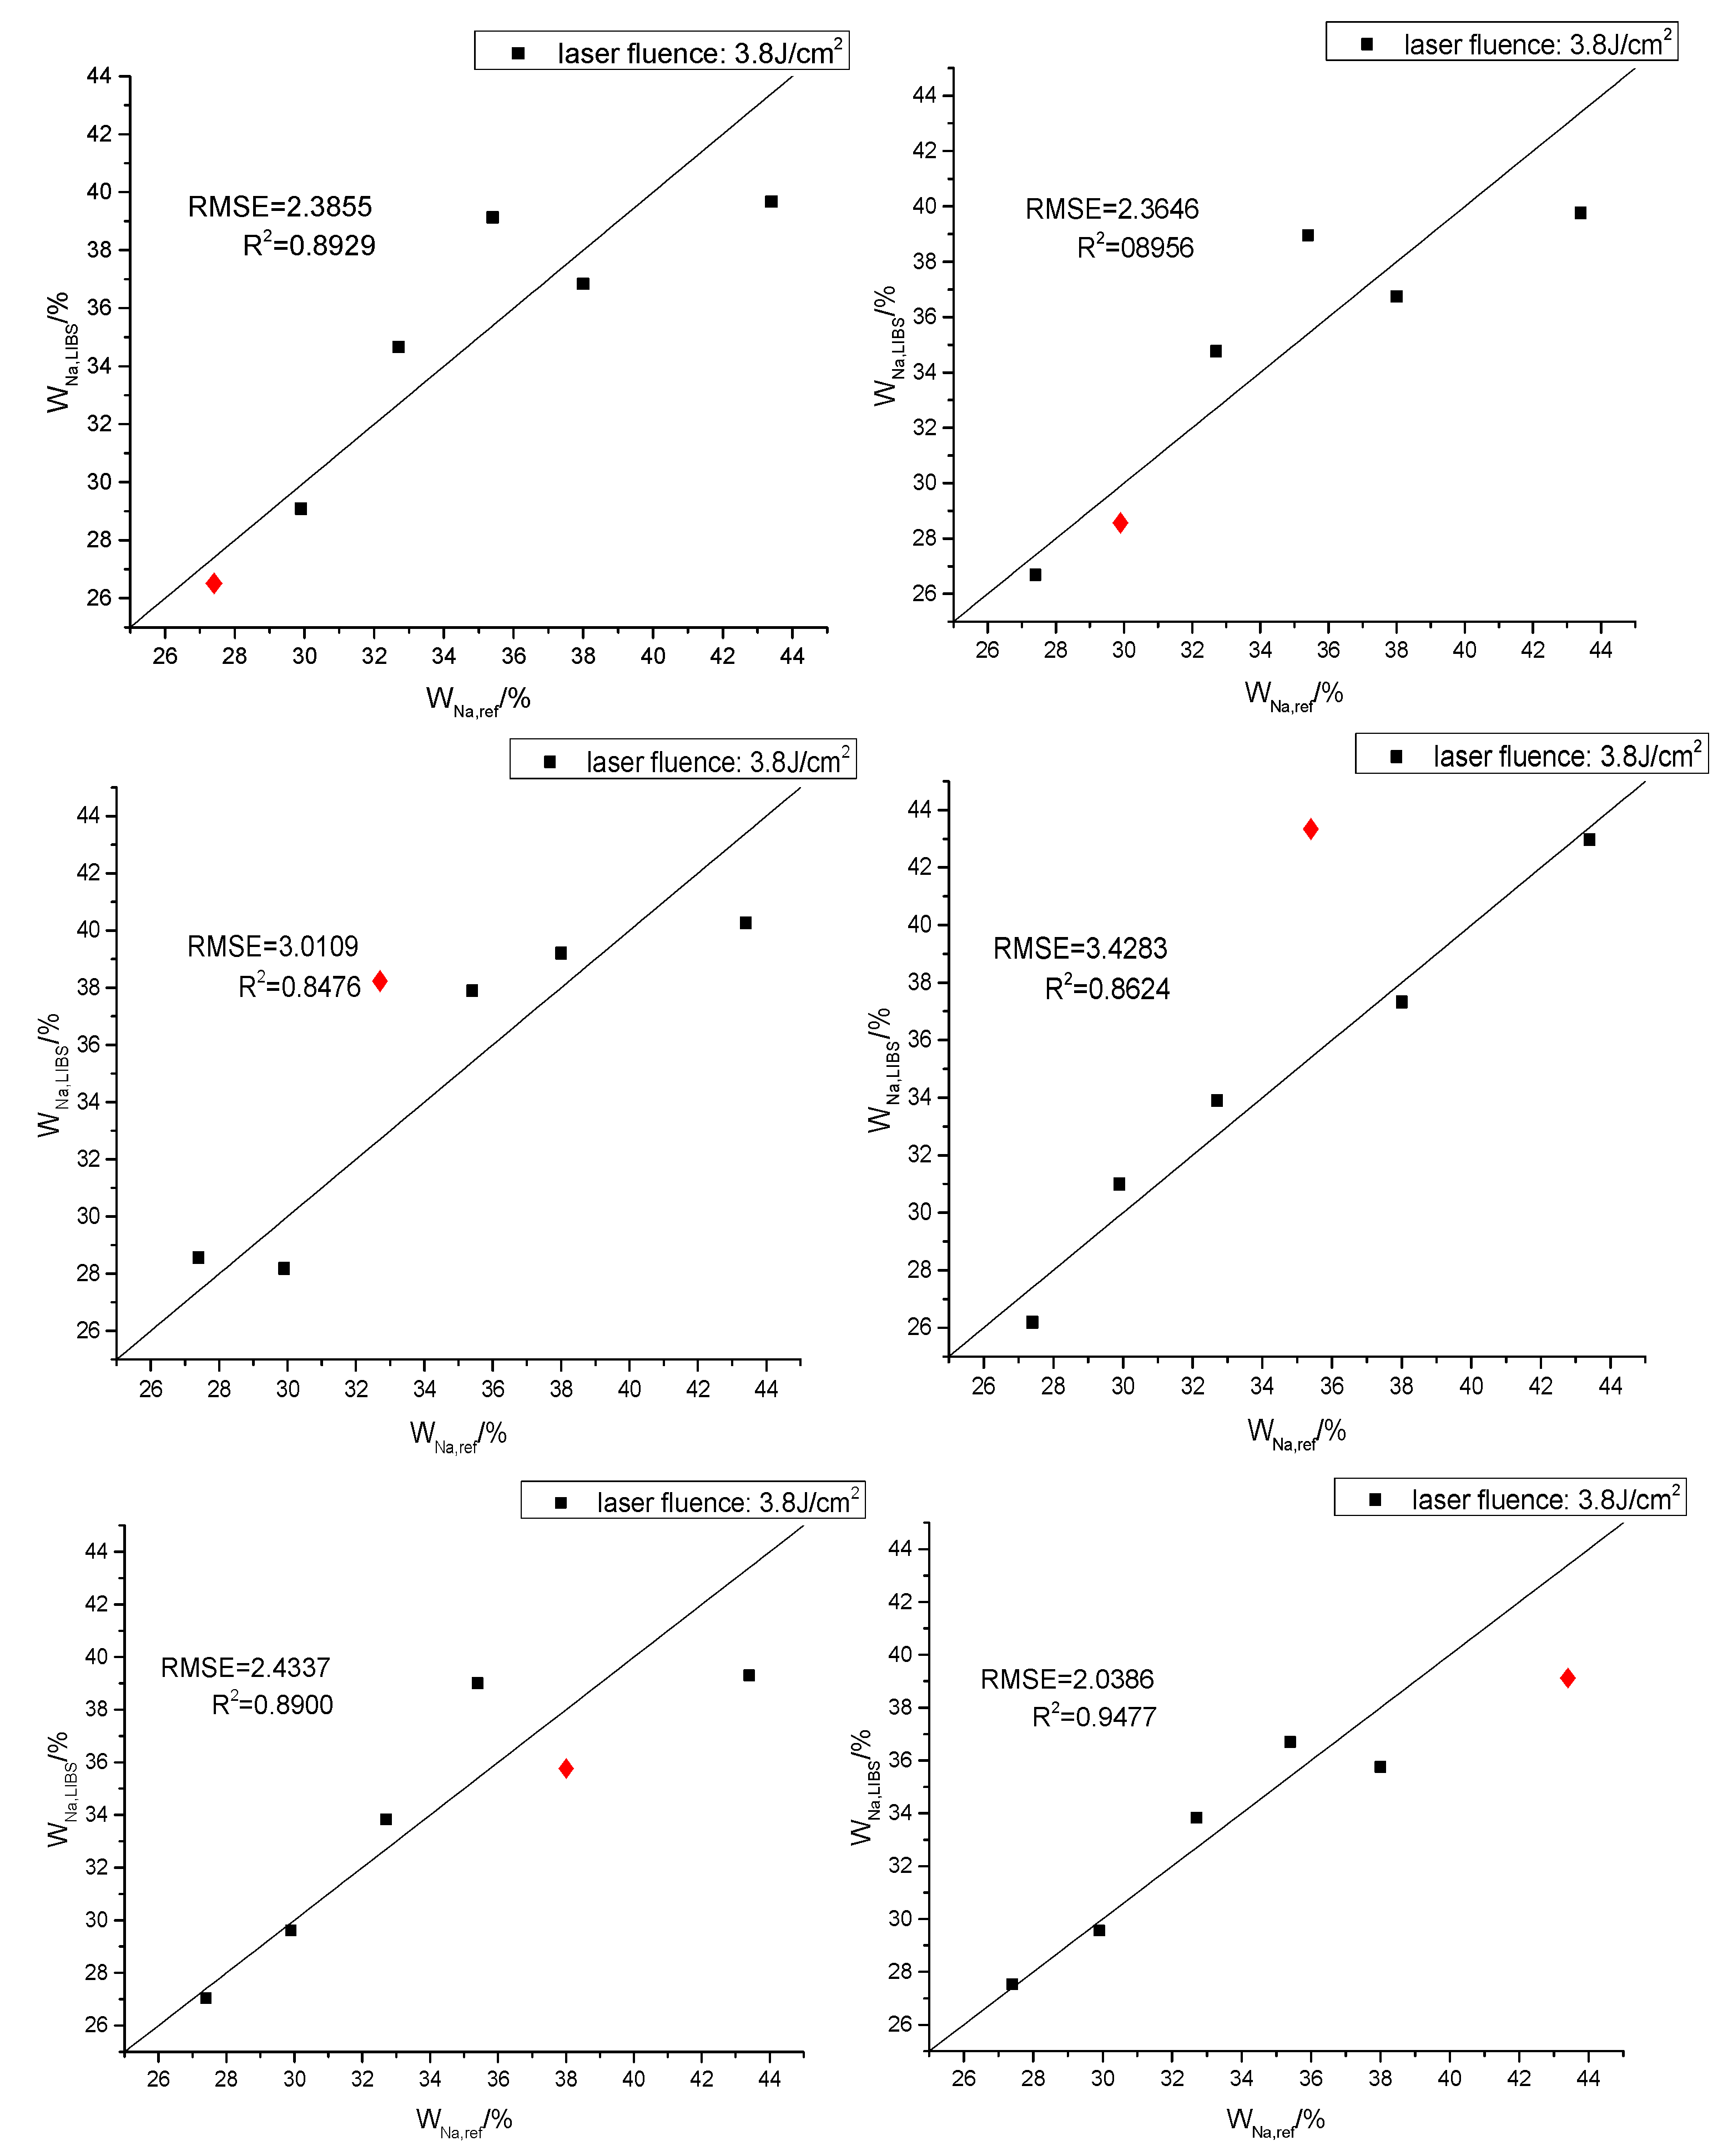
PLSR (partial least squares regression) was applied in the LIBS spectroscopy analysis to obtain the calibration model through MATLAB. There were five standard samples in the experiment, four of which were used as the calibration sample set, and their spectral data were used to train the prediction model. Meanwhile, the remaining one is used to predict and verify the model.
To compare the prediction results of the model, we used the Pearson correlation coefficient(R) to measure the calibration effect of the model. The root mean square error (RMSE) was used to describe the prediction accuracy of the model. The closer the R was to 1, the better fitting effect of the calibration curve: the smaller the RMSE, the more accurate the quantitative effect of the model.
As shown in Figure 6, The red diamond data point indicates the predicted value. The degree of fit of the regression line to the observed values was higher than that of the univariate regression model.
3.2. Characteristic Spectra of CaCO3 and CaSO4
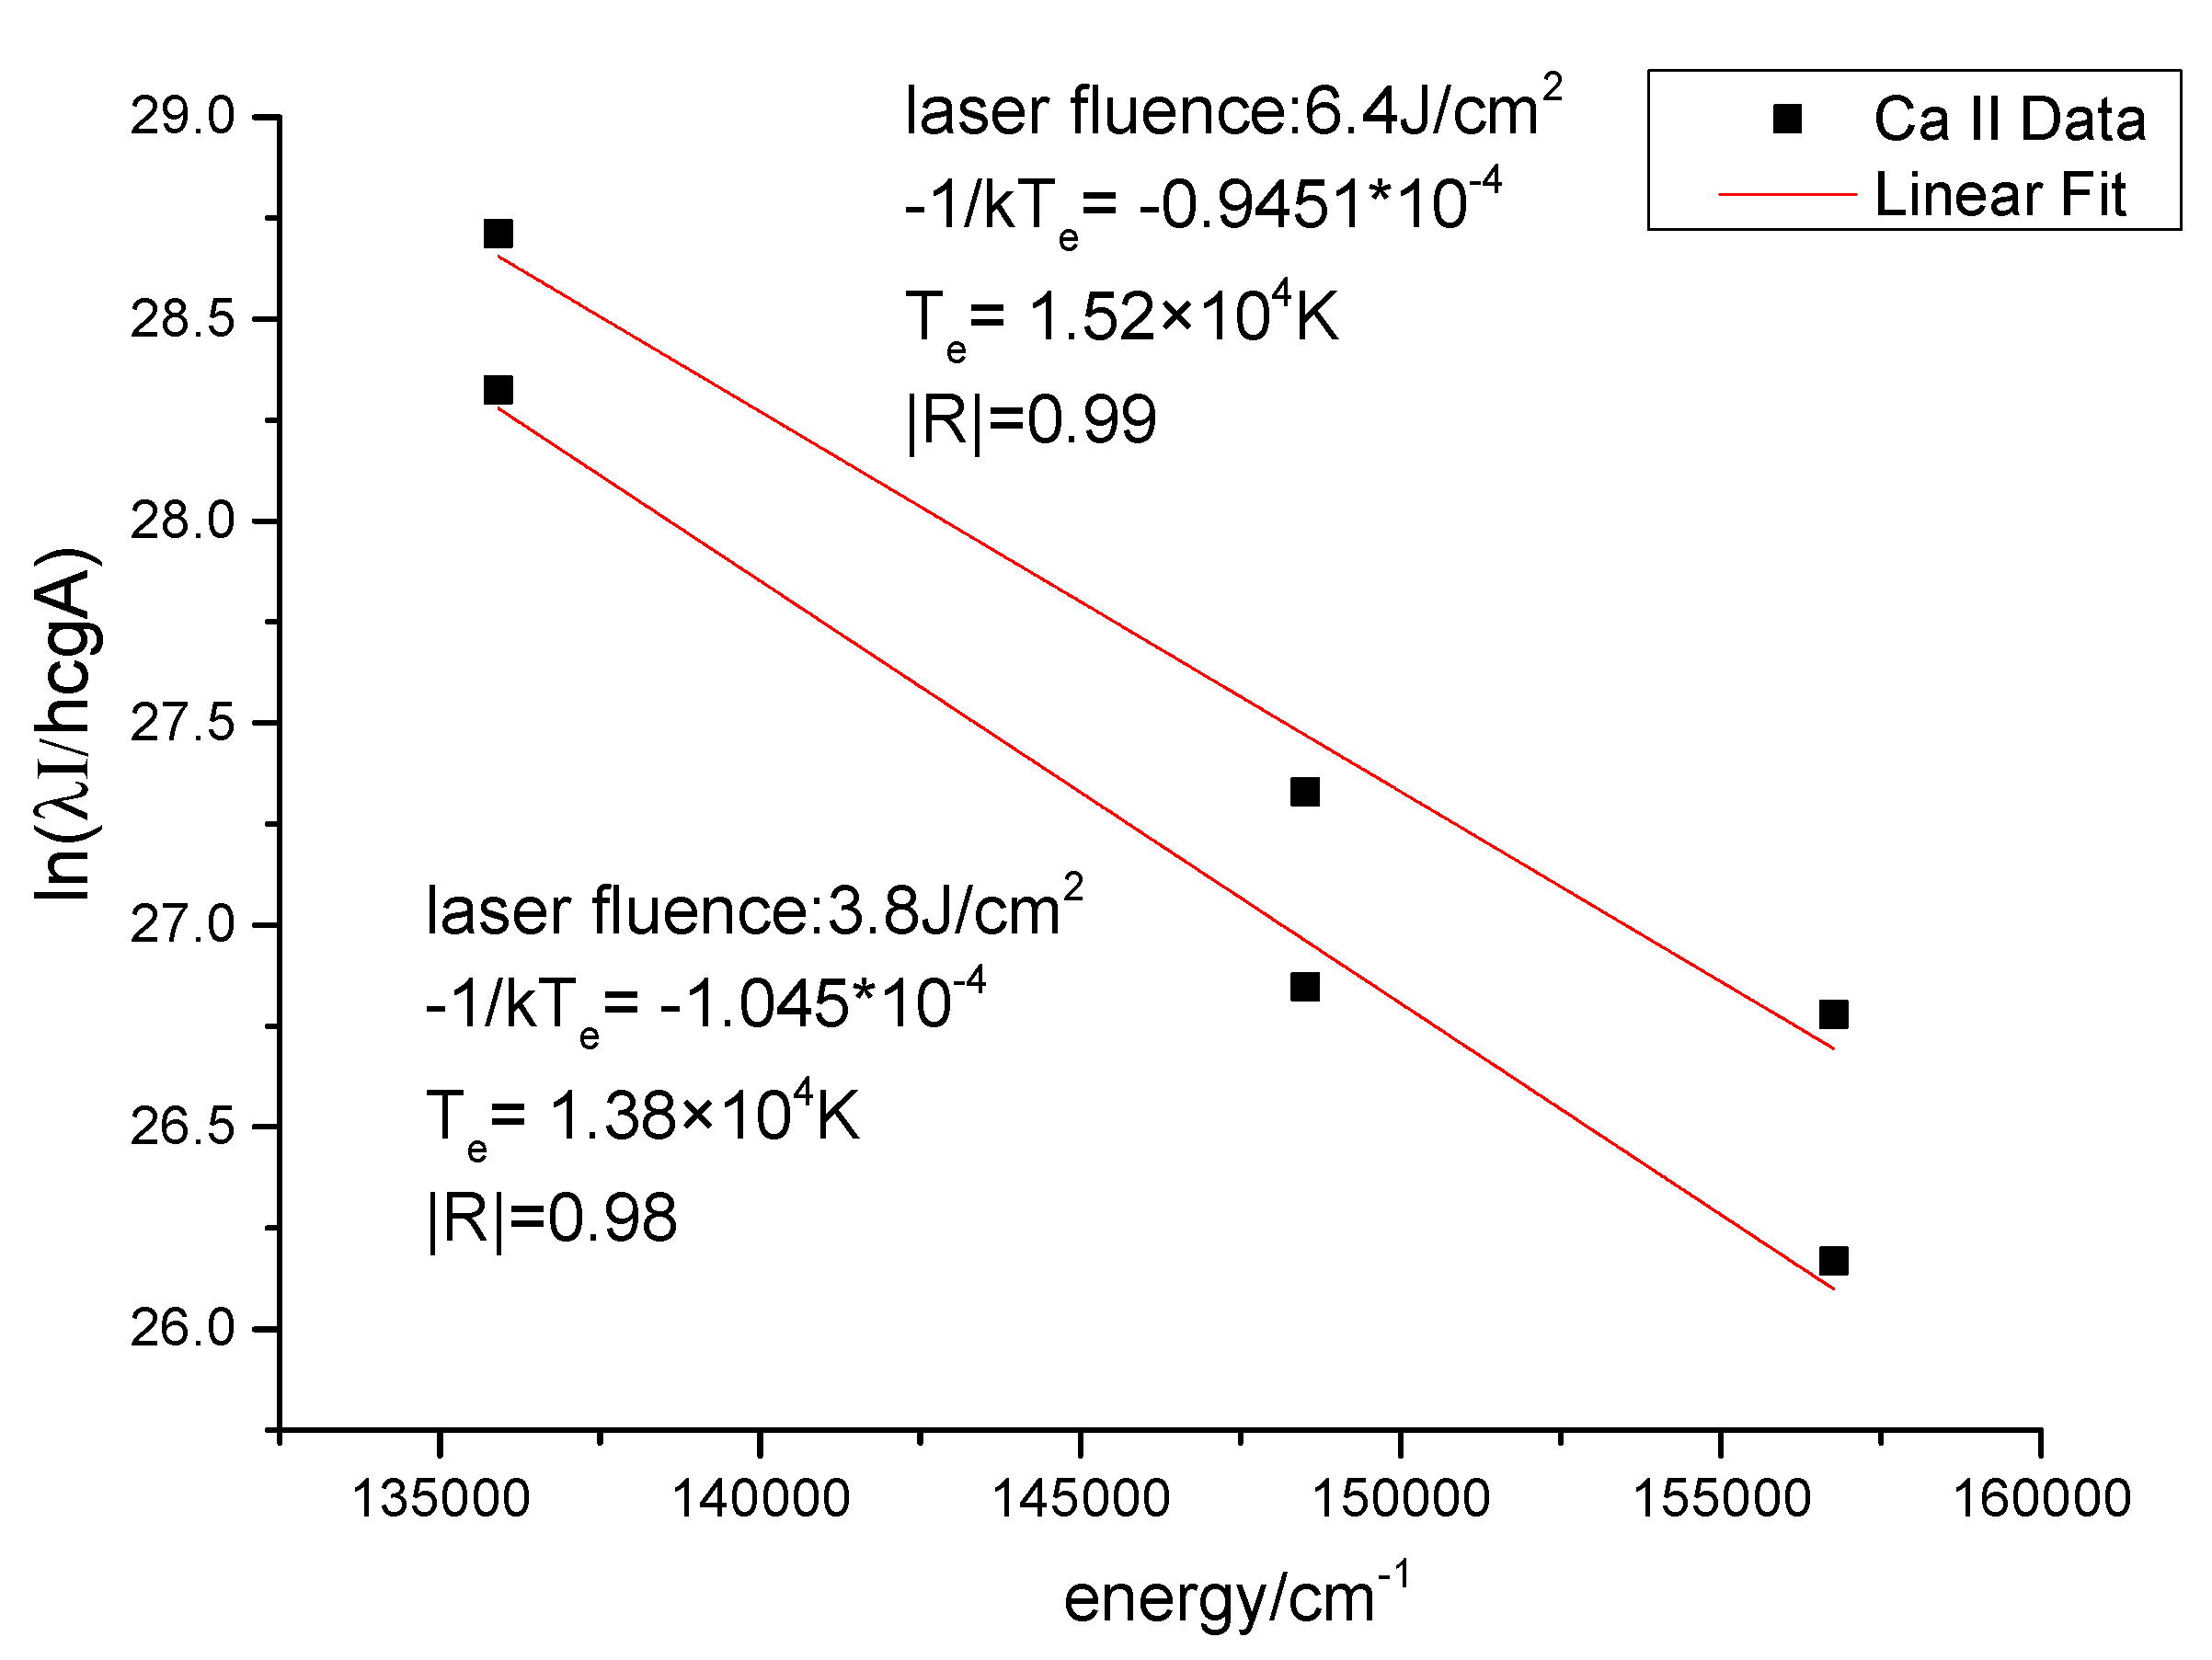
Under local thermal equilibrium conditions, the common method to calculate the plasma electron temperature is the Boltzmann method. The layout number on the atomic bound energy level satisfies the Boltzmann distribution, as shown in the following equation:
where m and n are the upper and lower energy levels of the spectral line transition, λ is transition wavelengths, A is spontaneous transition probability, I is the relative strength of the measured spectral line, Em and gm are the excitation energy and statistical weight of the m level, respectively. h, c, and kB are the Planck constant, the speed of light, and the constant number of Boltzmann, respectively. The electron temperature of the plasma can be derived from the slope of linear fitting [20,21].
In this experiment, three calcium atomic lines were selected. The relevant parameters of these lines are listed in Table 3. Figure 7 shows that as the laser energy fluence increases, the electron temperature increases. The electron temperature of the plasma was 1.38 × 10⁴ K at a laser fluence of 3.8 J/cm2 and 1.52 × 10⁴ K at a laser fluence of 6.4 J/cm2.
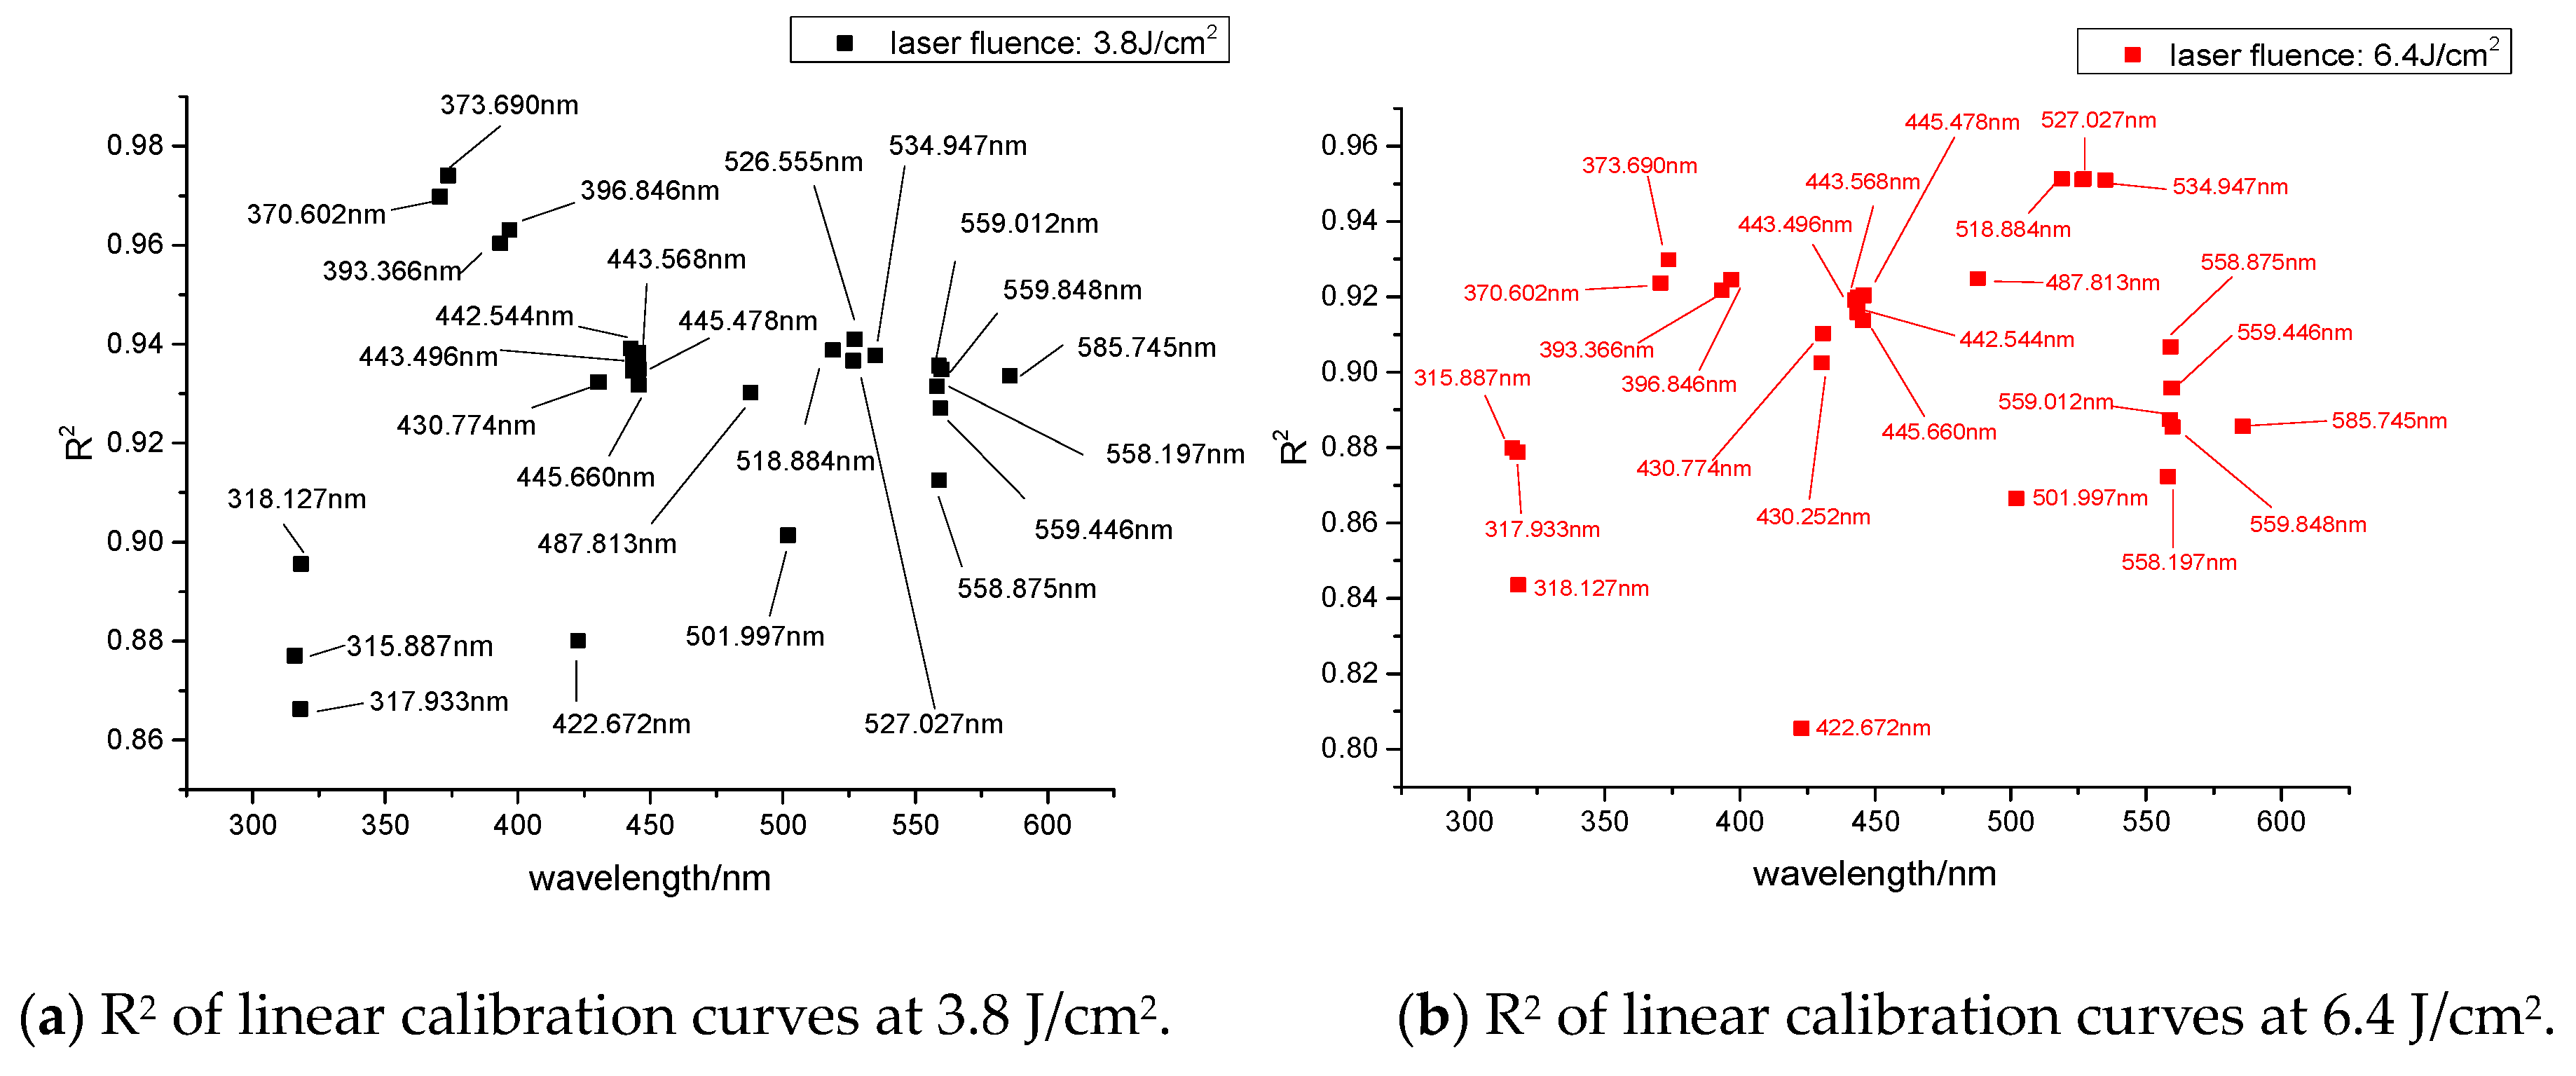
The characteristic spectral wavelengths of Ca in samples #2-1 through #2-6 were searched in the NIST database. According to the average relative spectral intensity of Ca at different wavelengths, linear calibration curves for spectral intensity and concentration were generated, and R2 values were determined.
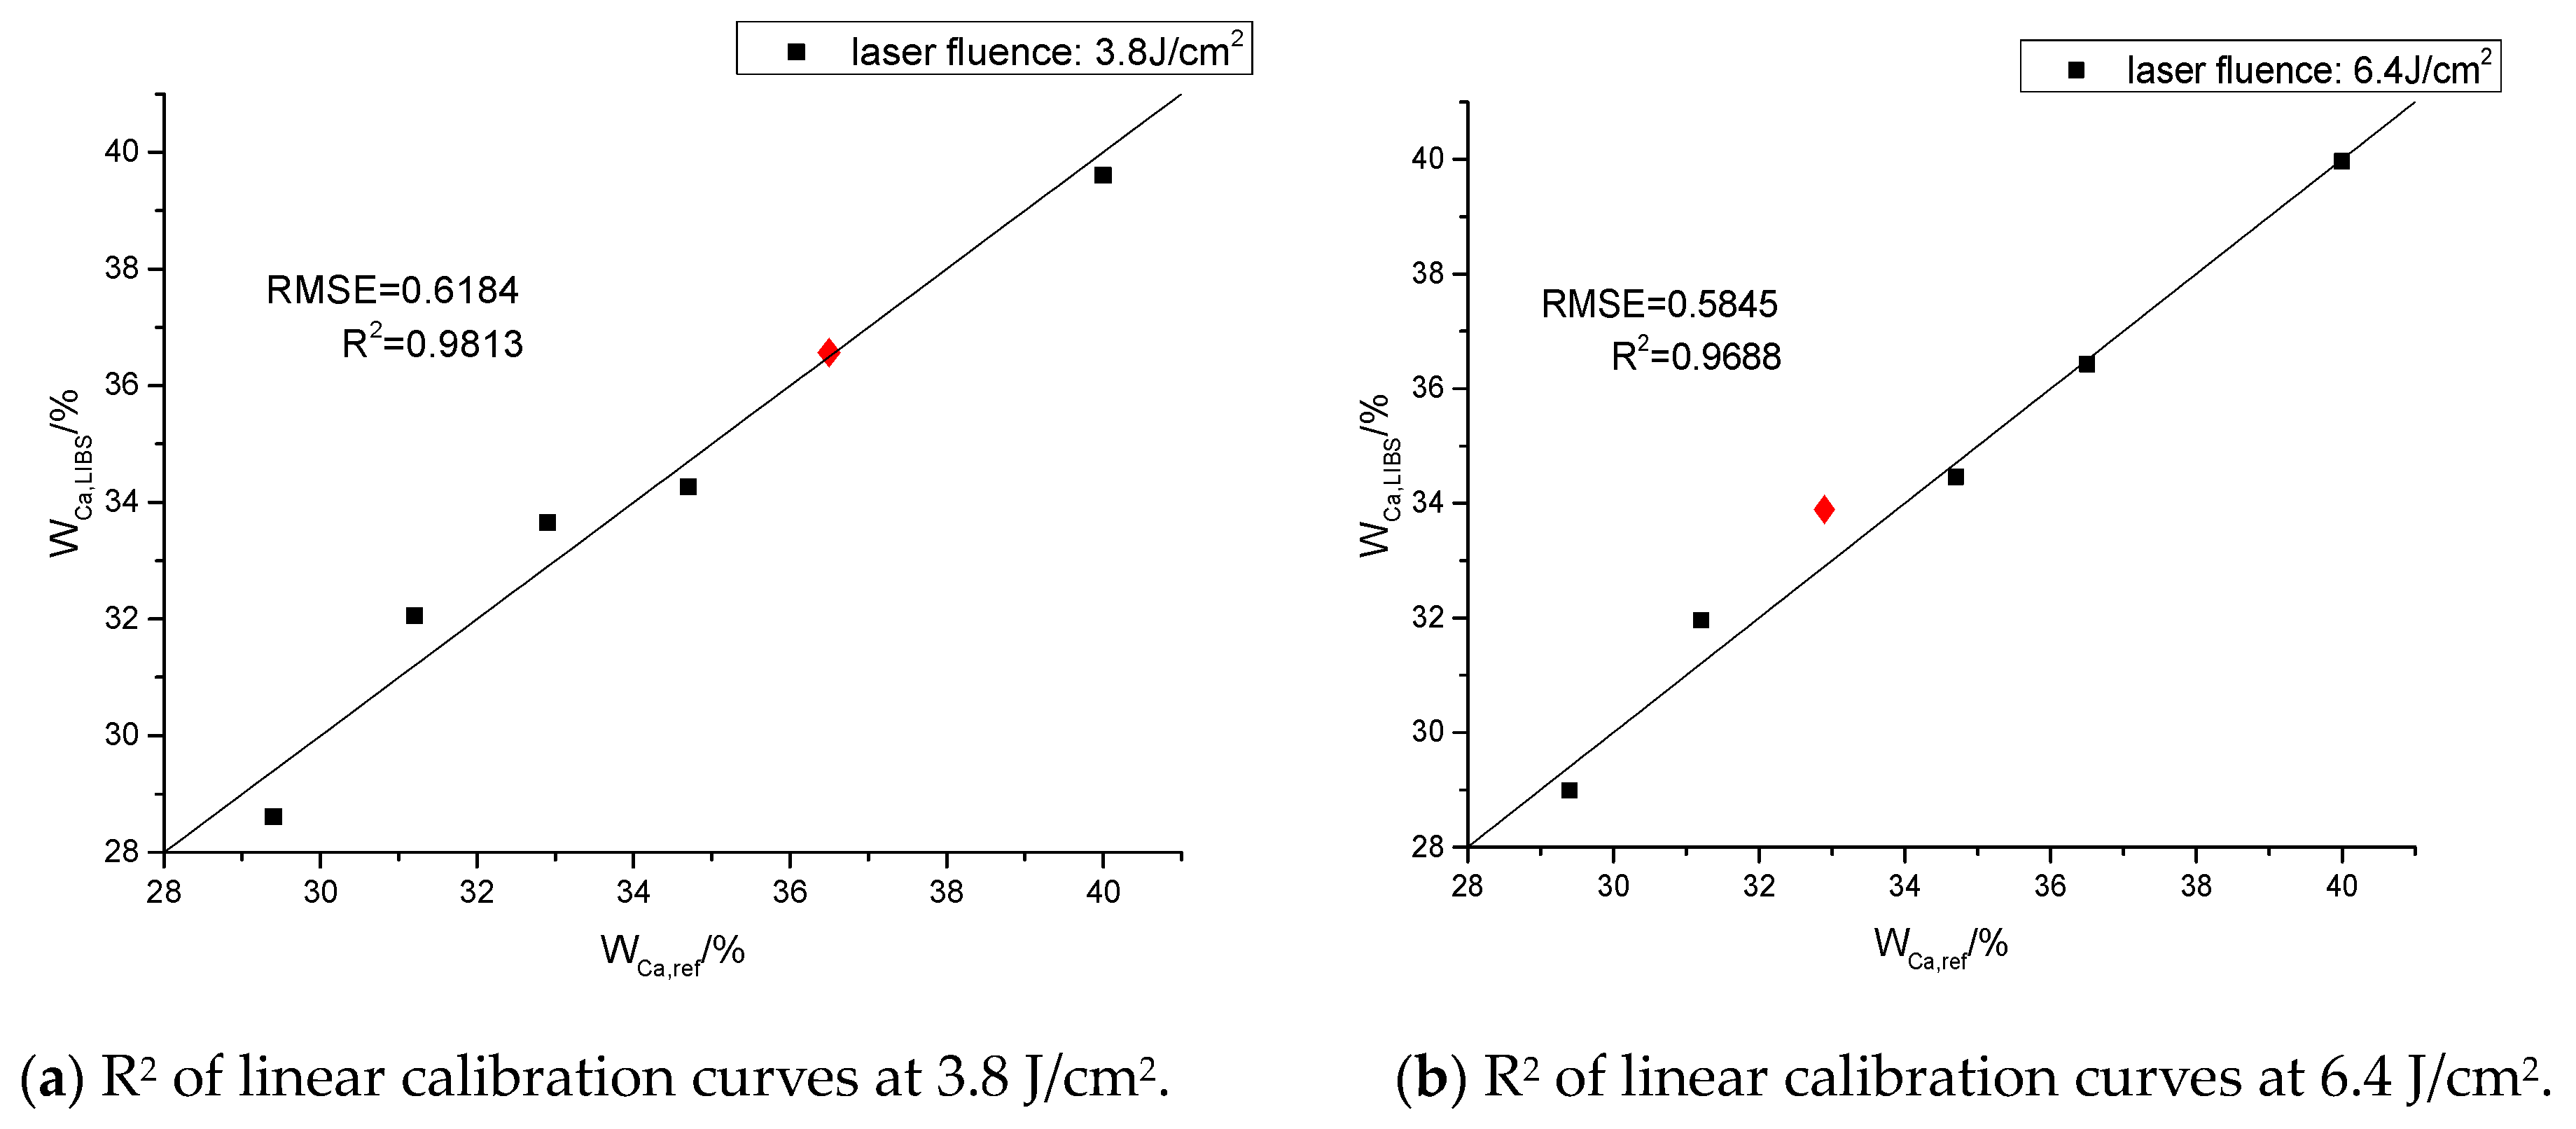
The results showed that in the Ca linear calibration curves, at a laser energy fluence of 3.8 J/cm2, four spectral lines had R2 values greater than 0.8, and 24 lines had R2 values greater than 0.9. The maximum R2 value was 0.972. Furthermore, there were ten calibration curves at the laser fluence of 6.4 J/cm2 that led to an R2 value greater than 0.9. The maximum R2 value was 0.951. In general, the linearity of the laser energy intensity of 3.8 J/cm2 had better linearity and a better different degree of increase in R2 at 6.4 J/cm2. The lines with R2 values greater than 0.9 at 3.8 J/cm2 and 6.4 J/cm2 correspond to the linear calibration curves shown in Figure 8. The distribution of R2 values greater than 0.9 as they relate to the wavelength at a laser fluence of 3.8 J/cm2 and 6.4 J/cm2, respectively, are also shown in Figure 8. The result of the PLSR model is shown in Figure 9. The R2 values were 0.9813 and 0.9688, which were close to the maximum R2 value in the Ca linear calibration curves.
By comparing the linear relationship between the laser energy of 3.8 J/cm2 and 6.4 J/cm2, increasing the output energy was not determined to result in a higher number of spectral lines with good linearity. The appropriate laser energy should be selected according to the experimental results.
As shown in Table 1, the mixing ratio of the two Ca ion compounds in samples #2-1 through #2-6 was different, but the linear relationship between the concentration and the intensity was not affected. Increasing the number of compounds containing the same cation did not influence the concentration relationship in the LIBS analysis of Ca.
In the laser-induced plasma generation process, the target material and the ions and atoms excited by the gas molecules in the air together constituted a component in the laser-plasma. The pulsed laser ablated the surface of the sample, and the energy was sufficient to cause the surface temperature to rise, melt, and evaporate to cause ion bond rupture and the further formation of laser-plasma. Both the Ca ions in CaCO3 and CaSO4 were ionized after reaching laser energy sufficient to form an ionic state of Ca. When the ionized Ca acquired enough energy, it transitioned from the ground state to various excited states and then rapidly transitioned back to form atomic emission lines and ion lines. If the concentration of the ionic state was the same, then the atomic emission spectrum was not affected. This disregarded the compound type or mixture of the original state, which was similar to results from Na analysis.
4. Conclusions
In this paper, artificial contamination was used to study the effect of the salt mixture in LIBS signals, especially the calibration curves and relative spectral intensity of different Na and Ca samples. The results showed that the R2 of the calibration curve between the element content and characteristic wavelength line intensity was affected minimally by the mixing ratio of different compounds with the same cations. Thus, it is beneficial in the LIBS test on-site, that we can get the content of cations regardless of their compounds while the cations would contribute most in the soluble contamination. The laser energy per pulse in the LIBS test would affect the spectral significantly both in line intensity and shape. By reducing the laser energy intensity and selecting the proper emission wavelength of the analytes, the effect of the self-absorption can be weakened, and the detection accuracy can be improved. The PLSR model was used in the data process, which could improve the accuracy of Na and Ca linear analysis.
Author Contributions
Conceptualization and formal analysis, S.L. and X.W.; investigation, X.Q.; resources, S.L.; data curation, S.L. and T.W.; writing—original draft preparation, X.Q.; writing—review and editing, X.W.; supervision, T.W. and Z.J. All authors have read and agreed to the published version of the manuscript.
Funding
This research was funded by the National Natural Science Foundation of China (51607101), Science and technology projects of Shanxi Electric Power Research Institute (SGSXDK00SPJS1900162).
Conflicts of Interest
The authors declare no conflict of interest.
References
- Liu, Y.; Wu, Y.; Du, B. Dynamic formation mechanism of water droplet and induced surface discharges on silicone rubber composites. High Volt. 2019, 4, 59–64. [Google Scholar] [CrossRef]
- Liang, X.; Wang, S.; Fan, J.; Guan, Z. Development of composite insulators in China. IEEE Trans. Dielectr. Electr. Insul. 1999, 6, 586–594. [Google Scholar] [CrossRef]
- Mcelroy, A.J.; Lyon, W.J.; Phelps, J.D.; Woodson, H.H. Insulators with contaminated surfaces, part I: Field conditions and their laboratory simulation. IEEE Trans. Power Appar. Syst. 1970, 8, 1848–1858. [Google Scholar] [CrossRef]
- Woodson, H.H.; Mcelroy, A.J. Insulators with contaminated surfaces, part II: Modeling of discharge mechanisms. IEEE Trans. Power Appar. Syst. 1970, 8, 1858–1867. [Google Scholar] [CrossRef]
- Williams, L.; Kim, J.; Kim, Y.; Arai, N.; Shimoda, O.; Holte, K. Contaminated insulators-chemical dependence of flashover voltages and salt migration. IEEE Trans. Power Appar. Syst. 1974, 5, 1572–1580. [Google Scholar] [CrossRef]
- Courreges-Lacoste, G.B.; Ahlers, B.; Perez, F.R. Combined Raman spectrometer/laser-induced breakdown spectrometer for the next ESA mission to Mars. Spectrochim. Acta Part A Mol. Biomol. Spectrosc. 2007, 68, 1023–1028. [Google Scholar] [CrossRef] [PubMed]
- Cremers, D.A.; Multari, R.A.; Knight, A.K. Laser-induced Breakdown Spectroscopy, Encyclopedia of Analytical Chemistry: Applications, Theory and Instrumentation; John Wiley & Sons, Ltd.: Hoboken, NJ, USA, 2006. [Google Scholar]
- Yu, K.-Q.; Zhao, Y.-R.; Liu, F.; He, Y. Laser-induced breakdown spectroscopy coupled with multivariate chemometrics for variety discrimination of soil. Sci. Rep. 2016, 6, 1–10. [Google Scholar] [CrossRef] [PubMed]
- Yuan, H.; Song, L.; Liu, P. Experimental study of vacuum degree online detection of vacuum interrupter based on laser induced breakdown spectroscopy. High Volt. Appar. 2017, 3, 235–239. [Google Scholar]
- Yuan, H.; Gojani, A.B.; Gornushkin, I.B.; Wang, X. Investigation of laser-induced plasma at varying pressure and laser focusing. Spectrochim. Acta Part B At. Spectrosc. 2018, 150, 33–37. [Google Scholar] [CrossRef]
- Wang, X.; Yuan, H.; Liu, D.; Yang, A.; Liu, P.; Gao, L.; Ding, H.; Wang, W.; Rong, M. A pilot study on the vacuum degree online detection of vacuum interrupter using laser-induced breakdown spectroscopy. J. Phys. D Appl. Phys. 2016, 49, 44LT01. [Google Scholar] [CrossRef]
- Wang, N.; Wang, X.; Chen, P.; Jia, Z.; Wang, L.; Huang, R.; Lv, Q. Metal Contamination Distribution Detection in High-Voltage Transmission Line Insulators by Laser-induced Breakdown Spectroscopy (LIBS). Sensors 2018, 18, 2623. [Google Scholar] [CrossRef] [PubMed] [Green Version]
- Wang, X.; Wang, H.; Chen, C.; Jia, Z. Ablation properties and elemental analysis of silicone rubber using laser-induced breakdown spectroscopy. IEEE Trans. Plasma Sci. 2016, 44, 2766–2771. [Google Scholar] [CrossRef]
- Wang, X.; Hong, X.; Chen, P.; Zhao, C.; Jia, Z.; Wang, L.; Lv, Q.; Huang, R.; Liu, S. In-situ and quantitative analysis of aged silicone rubber materials with laser-induced breakdown spectroscopy. High Volt. 2018, 3, 140–146. [Google Scholar]
- Kumar, V.S.; Vasa, N.J.; Sarathi, R. Remote surface pollutant measurement by adopting a variable stand-off distance based laser induced spectroscopy technique. J. Phys. D Appl. Phys. 2015, 48, 435504. [Google Scholar] [CrossRef]
- Hahn, D.W.; Omenetto, N. Laser-induced breakdown spectroscopy (LIBS), part II: Review of instrumental and methodological approaches to material analysis and applications to different fields. Appl. Spectrosc. 2012, 66, 347–419. [Google Scholar] [CrossRef] [PubMed]
- Tognoni, E.; Palleschi, V.; Corsi, M.; Cristoforetti, G. Quantitative micro-analysis by laser-induced breakdown spectroscopy: A review of the experimental approaches. Spectrochim. Acta Part B At. Spectrosc. 2002, 57, 1115–1130. [Google Scholar] [CrossRef]
- Wang, Z.; Yuan, T.-B.; Hou, Z.-Y.; Zhou, W.-D.; Lu, J.-D.; Ding, H.-B.; Zeng, X.-Y. Laser-induced breakdown spectroscopy in China. Front. Phys. 2014, 9, 419–438. [Google Scholar] [CrossRef]
- NIST. National Institute of Standards and Technology, U.S. Department of Technology Database. Available online: http://www.physics.nist.gov (accessed on 8 February 2020).
- Cremers, D.A.; Radziemski, L.J. Handbook of Laser-Induced Breakdown Spectroscopy; John Wilkey & Sons Ltd.: Chichester, UK, 2006. [Google Scholar]
- Singh, J.P.; Thakur, S.N. Laser-Induced Breakdown Spectroscopy; Elsevier: Amsterdam, The Netherlands, 2007. [Google Scholar]
Figure 1.
Laser-induced breakdown spectroscopy (LIBS) experimental setup.

Figure 2.
Spectra intensity of samples #1-1 to #1-6 at an energy intensity of 3.8 J/cm2 shown in black, red, navy blue, green, light blue, and purple, respectively.
Figure 2.
Spectra intensity of samples #1-1 to #1-6 at an energy intensity of 3.8 J/cm2 shown in black, red, navy blue, green, light blue, and purple, respectively.

Figure 3.
Emission intensity of Na in samples #1-1 through #1-6 measured at different wavelengths at an energy intensity of 3.8 J/cm2. Spectra show the resonance lines (588.995 nm, 589.592 nm) and nonresonant lines (568.263 nm, 568.859 nm).
Figure 3.
Emission intensity of Na in samples #1-1 through #1-6 measured at different wavelengths at an energy intensity of 3.8 J/cm2. Spectra show the resonance lines (588.995 nm, 589.592 nm) and nonresonant lines (568.263 nm, 568.859 nm).

Figure 4.
Emission intensity under varying concentrations of Na as a function of laser energy. Signals obtained from the Na I 588.995 nm, Na I 568.859 nm are shown.
Figure 4.
Emission intensity under varying concentrations of Na as a function of laser energy. Signals obtained from the Na I 588.995 nm, Na I 568.859 nm are shown.

Figure 5.
LIBS signal intensity of Na vs. Na concentration at a laser fluence of 3.8 J/cm2.

Figure 6.
Results of Na data for Partial least squares regression (PLSR) (2 components).

Figure 7.
Boltzmann diagram of plasma electron temperature (obtained by 3 calcium atomic lines).

Figure 8.
R2 values greater than 0.9 at various Ca spectral lines as a function of laser energy intensity. The two laser fluences are drawn in black (3.8 J/cm2) and red (6.4 J/cm2).
Figure 8.
R2 values greater than 0.9 at various Ca spectral lines as a function of laser energy intensity. The two laser fluences are drawn in black (3.8 J/cm2) and red (6.4 J/cm2).

Figure 9.
Results of 5-fold cross-validation of Ca data for PLSR (2 components).


Table 1.
Different ratios of Na2CO3 and NaHCO3, CaSO4, and CaCO3.
| Sample Number | Na/% | Na2CO3/g | NaHCO3/g | Weight/g | Ratio of Na (Na2CO3:NaHCO3) |
| #1-1 | 27.4 | 0 | 1.500 | 1.5 | 0:1 |
| #1-2 | 29.9 | 0.250 | 1.250 | 1.5 | 0.317:1 |
| #1-3 | 32.7 | 0.500 | 1.000 | 1.5 | 0.792:1 |
| #1-4 | 35.4 | 0.750 | 0.750 | 1.5 | 1.584:1 |
| #1-5 | 38.0 | 1.000 | 0.500 | 1.5 | 3.168:1 |
| #1-6 | 43.4 | 1.5 | 0 | 1.5 | 1:0 |
| Sample Number | Ca/% | CaSO4/g | CaCO3/g | Weight/g | Ratio of Ca (CaSO4:CaCO3) |
| #2-1 | 29.4 | 1.5 | 0 | 1.5 | 1:0 |
| #2-2 | 31.2 | 1.250 | 0.250 | 1.5 | 3.675:1 |
| #2-3 | 32.9 | 1.000 | 0.500 | 1.5 | 1.470:1 |
| #2-4 | 34.7 | 0.750 | 0.750 | 1.5 | 0.735:1 |
| #2-5 | 36.5 | 0.500 | 1.000 | 1.5 | 0.368:1 |
| #2-6 | 40.0 | 0 | 1.500 | 1.5 | 0:1 |
Table 2.
Wavelength of typical spectral lines for sample by LIBS.
| Element | Na I | Na I | Na I | Na I | Na I |
| Wavelength/nm | 568.263 | 568.859 | 589.592 | 588.995 | 616.075 |
| Element | Ca II | Ca II | Ca II | Ca II | Ca I |
| Wavelength/nm | 315.886 | 317.933 | 393.366 | 396.846 | 422.672 |
Table 3.
Parameters of calcium atomic emission line.
| Species | Wavelength/nm | Em/cm−1 | Amn/107s−1 | gm |
|---|---|---|---|---|
| Ca II | 392.065 | 148515 | 3.3 | 9 |
| 504.133 | 135910 | 1.6 | 5 | |
| 534.516 | 156767 | 1.1 | 13 |
© 2020 by the authors. Licensee MDPI, Basel, Switzerland. This article is an open access article distributed under the terms and conditions of the Creative Commons Attribution (CC BY) license (http://creativecommons.org/licenses/by/4.0/).
Share and Cite
MDPI and ACS Style
Lu, S.; Wang, X.; Wang, T.; Qin, X.; Wang, X.; Jia, Z. Analysis of Salt Mixture Contamination on Insulators via Laser-Induced Breakdown Spectroscopy. Appl. Sci. 2020, 10, 2617. https://doi.org/10.3390/app10072617
AMA Style
Lu S, Wang X, Wang T, Qin X, Wang X, Jia Z. Analysis of Salt Mixture Contamination on Insulators via Laser-Induced Breakdown Spectroscopy. Applied Sciences. 2020; 10(7):2617. https://doi.org/10.3390/app10072617
Chicago/Turabian StyleLu, Shan, Xinwei Wang, Tianzheng Wang, Xinran Qin, Xilin Wang, and Zhidong Jia. 2020. "Analysis of Salt Mixture Contamination on Insulators via Laser-Induced Breakdown Spectroscopy" Applied Sciences 10, no. 7: 2617. https://doi.org/10.3390/app10072617
Note that from the first issue of 2016, this journal uses article numbers instead of page numbers. See further details here.