A Seamless Image-Stitching Method Based on Human Visual Discrimination and Attention


1
School of Microelectronics, Tianjin University, Tianjin 300072, China
2
School of Mathematical Sciences, Tianjin Normal University, Tianjin 300387, China
3
Tianjin Key Laboratory of Imaging and Sensing Microelectronic Technology, Tianjin 300072, China
*
Author to whom correspondence should be addressed.
Appl. Sci. 2020, 10(4), 1462; https://doi.org/10.3390/app10041462
Submission received: 17 January 2020
/
Revised: 16 February 2020
/
Accepted: 19 February 2020
/
Published: 21 February 2020
(This article belongs to the Section Electrical, Electronics and Communications Engineering)
Abstract
:Stitching gaps and misalignments in mosaic images can severely degrade the human visual perception of mosaic effects. Image stitching plays a key role in eliminating these unpleasant defects. In this paper, an image-stitching method for mosaic images with invisible seams is proposed, according to the research on the human visual system (HVS). By quantifying the human visual attention of images and visual discrimination about luminance difference and fine dislocations, each pixel in the stitching region is given a priority value for tracing a stitching line. Coupled with the processing of an optimal stitching line locating method and the multi-band blending algorithm, the pixels of discontinuous items in mosaic images decrease significantly and the stitching line is almost invisible. This study provides a new insight into the image-stitching field, and the experiments show that the results of the proposed method are more consistent with the human visual system in creating high-quality image mosaics.
1. Introduction
Due to the limited display range of a single image taken by a single lens, an excellent method for stitching and merging two or more adjacent images is required in the fields of remote sensing and computer vision. A large number of scholars are working on the research of image stitching and have achieved certain results [1,2,3,4]. Common image mosaicking algorithms comprise feature points detection [5], image registration, rectification, image stitching and blending. If the images are all identically exposed and perfectly registered, the stitching process will be a simple problem. However, due to non-ideal factors such as the accuracy limitations of the registration algorithm and differences in image exposure, there will exist discontinuous edges and unnatural seams in overlap regions [6]. Besides, target movements may also cause blur or ghosting.
Therefore, further processing is essential to eliminate these discontinuities and obtain a natural transition between images. Alpha blending which is known as feathering or linear blending has good performance in processing seamlines caused by luminance difference. But this approach will cause blurring of high-frequency detail if there are some small registration errors [3]. The multi-band blending algorithm has better effects by using different weights at different frequencies for fusion, but it cannot correct mismatches either. Compared with the blending-related methods mentioned above, the more effective method is to find the optimal seamlines in the overlapping area to bypass obvious dislocations and discontinuous areas, improving the quality of stitching.
In the past three decades, a number of researchers have sought to find the optimal seamlines. The seamline detection algorithm proposed by Milgram may be the beginning of this field, and he defined the seamlines as the pixels that minimize the sum of the gray level differences in the overlapping area [7]. Kerschner proposed a seamline selection method using twin snakes based on high color similarity and high texture similarity of images [8]. Dijkstra’s algorithm is a widely used algorithm to find the shortest path [9], which is also popular in the optimal seamlines detection field. Chon et al. first determined the required maximum difference level and then applied Dijkstra’s algorithm to find the best seamline [10]. Gao et al. proposed a novel method for searching for an optimal seamline, which was driven by seams to obtain high-quality stitching results [11]. Zhang et al. first introduced the optical flow to the energy function in order to find an optimal seamline for unmanned aerial vehicle images [12]. Li et al. presented an optimal seamline detection technique via convolutional neural network and graph cuts [13]. The method is effective in the field of reducing the mismatched objects of urban remote-sensing images.
We found that these methods currently have used many different criteria to find the optimal seamline and achieved good results. However, most of these methods seem to ignore one objective fact, that the subject of evaluating mosaic image quality is the human visual system (HVS) itself [14]. HVS has been proven to evaluate the quality of mosaic images [15]. As far as we know, only Yu et al. used visual saliency to describe visual attention in optimal seamline selection [1]. Li et al. proposed a new energy function with visual non-linearity and non-uniformity to find the optimal seam-cutting which is more consistent with the human perception [16]. However, the above methods only considered a few characteristics in HVS. HVS is a complex optical imaging and processing system that includes not only visual attention but also visual discrimination.
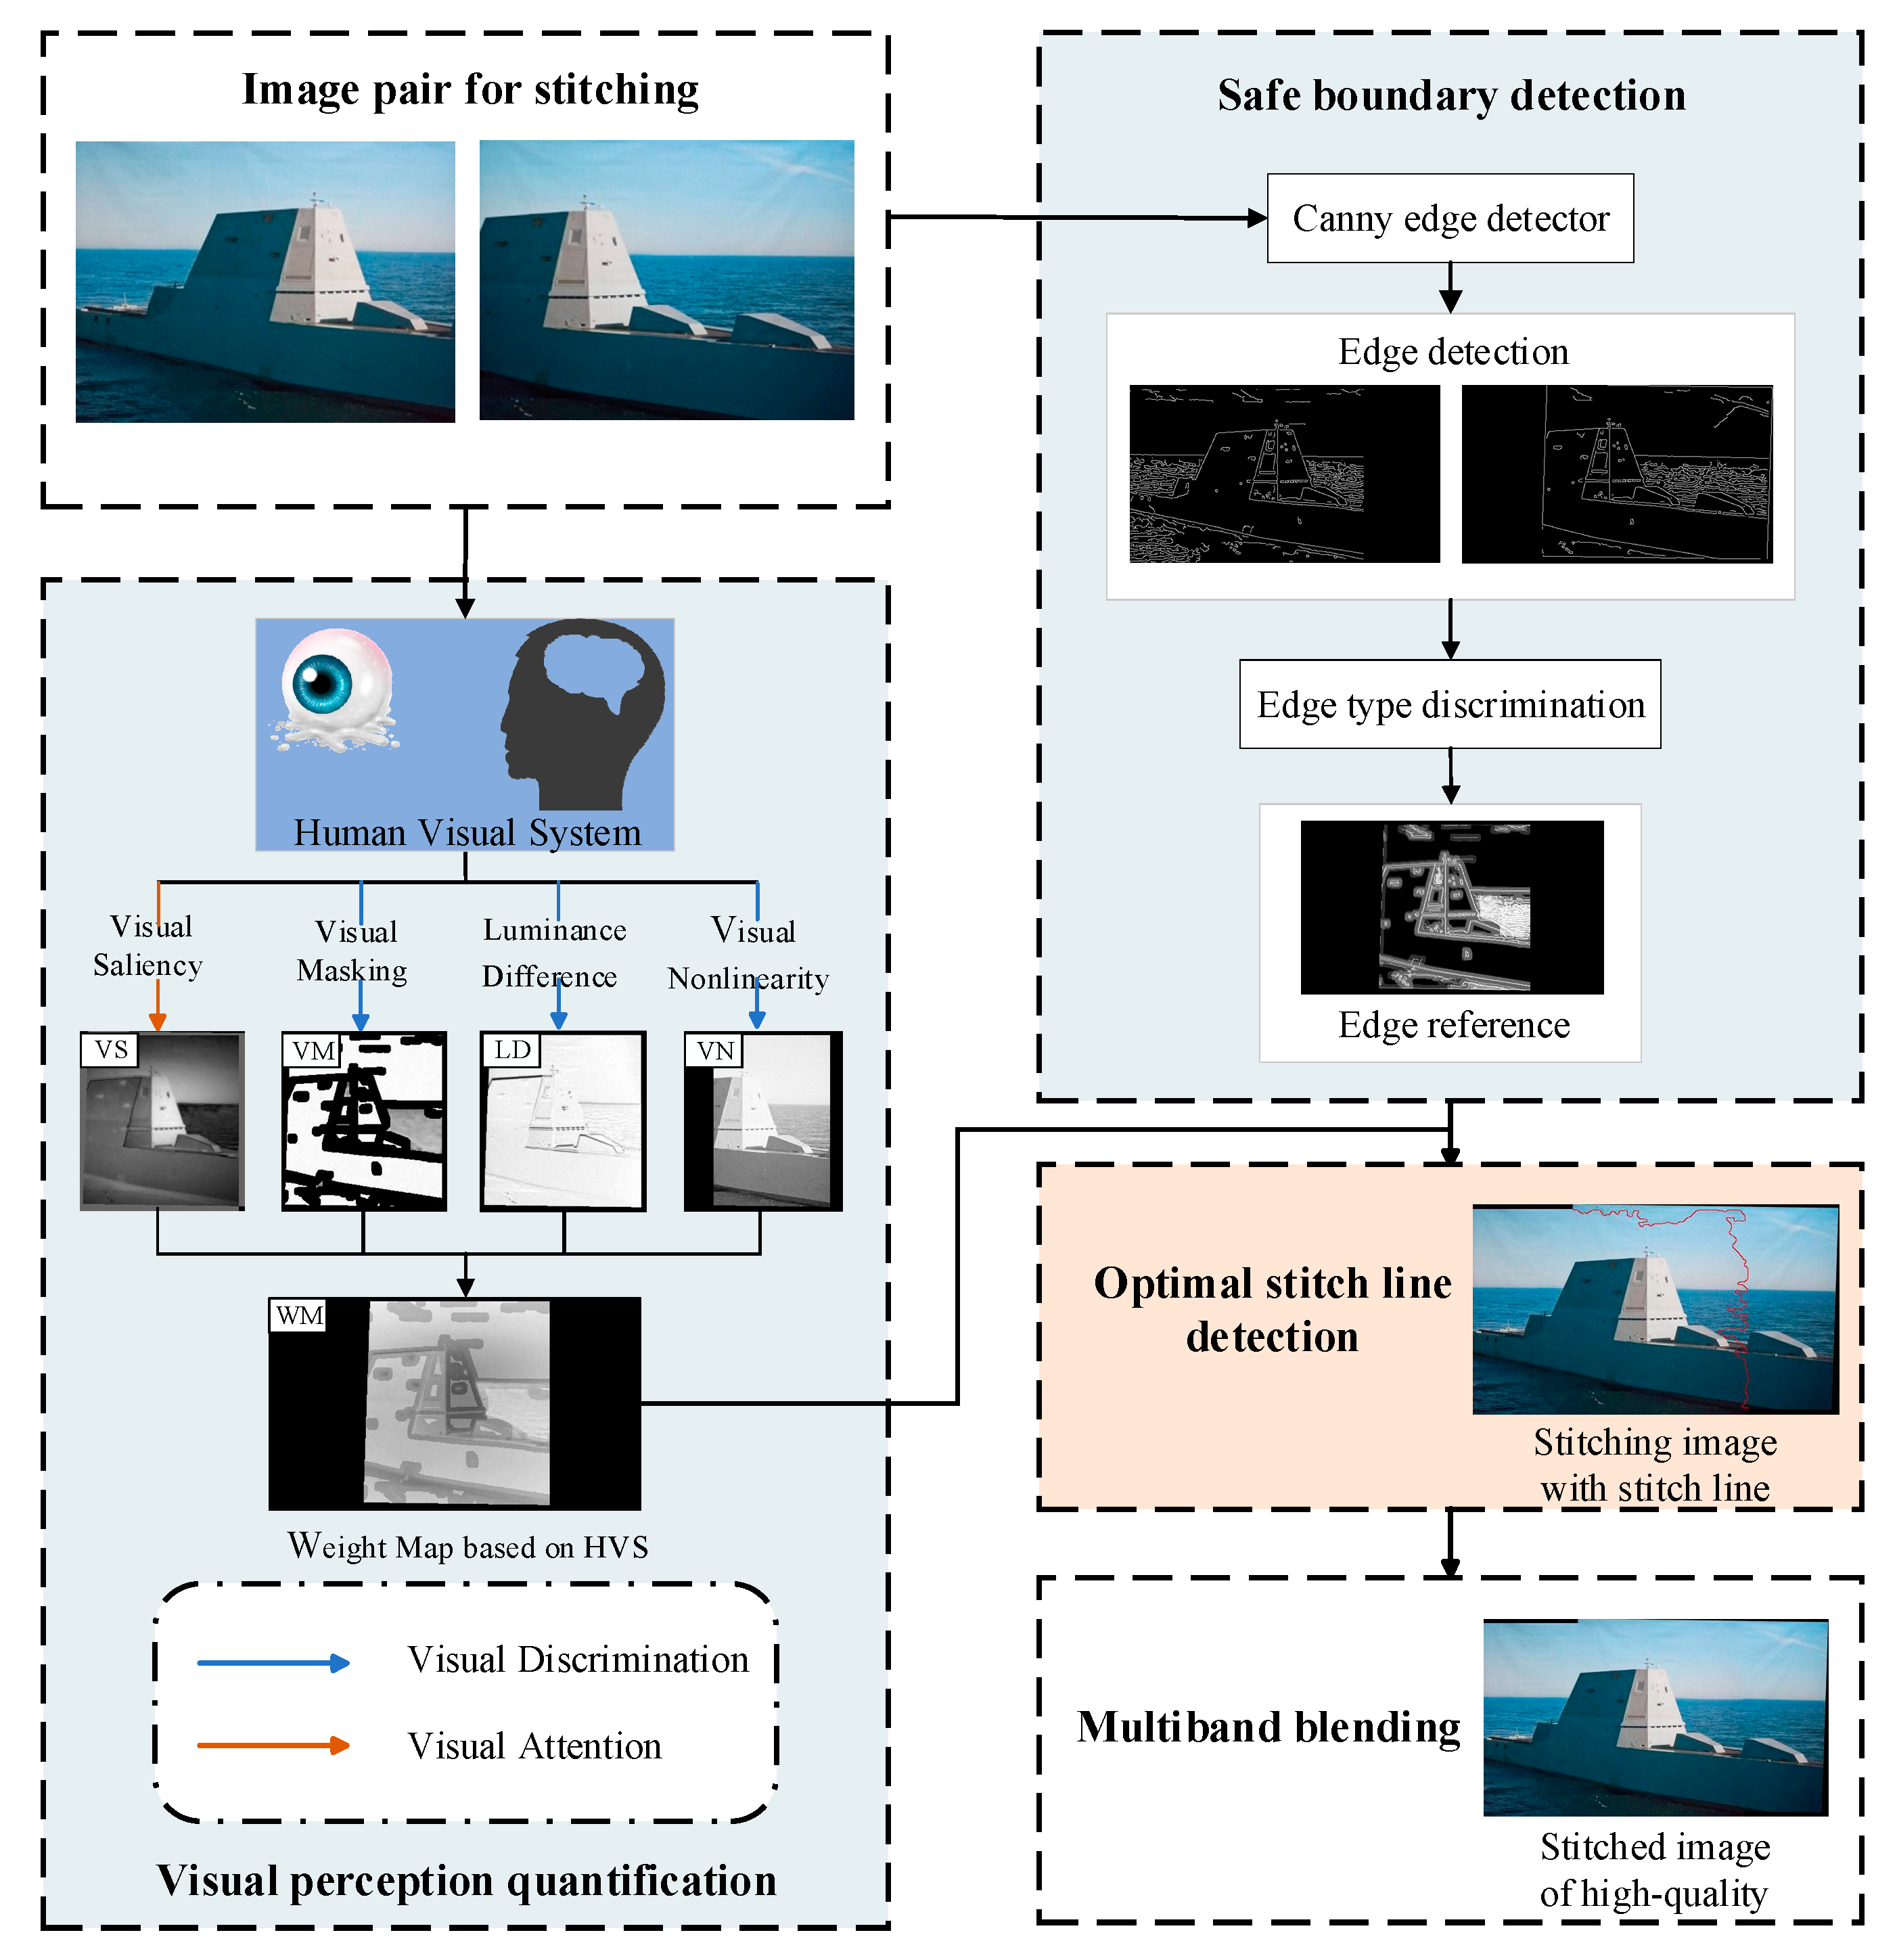
In this paper, an image-stitching method based on visual attention and discrimination is proposed to seek out an optimal seamline that brings less discontinuous edges, many of which are masked or located in where the human eyes pay little attention or can hardly identify. First, the visual perception of the image’s overlapped region is quantified using HVS-related metrics (based on human visual discrimination and attention). Then, an edge detection algorithm is used to distinguish safe edges and misaligned edges to obtain the edge reference information for selecting seamline. Next, according to the previous two steps, an optimal path algorithm is used to obtain a stitching line that conforms to the characteristics of HVS. Finally, a multi-band blending algorithm is used to blend the images to obtain high-quality mosaic image.
Experiments demonstrate that the result of our approach are more consistent with human visual perception. The key contributions of our work are summarized as:
- Human visual attention and discrimination were adopted to quantify the mosaic regions to trace optimal stitching lines.
- This method can be integrated into other image-stitching pipelines easily.
The remaining part of this paper has been organized in the following way. Section 2 analyzes the basis of our method and Section 3 explains the proposed method in detail. Two sets of experiments are then presented in Section 4. Section 5 concludes our works. The source code for this paper is available at https://github.com/pumengwang/ImageStitching_HVS.
2. Preliminary Work
2.1. Non-Ideal Factors in the Mosaicking Process
Obtaining perfect stitching results is usually not easy because of the limitations of existing mosaicking algorithms, such as false corner detection, poor matching accuracy and low efficiency rectification. More specifically, some corner detection algorithms are sensitive to the noise in the image, while some other corner detection algorithms based on contours cannot accurately locate the feature points because of the contour deformation resulting from a filter before processing [17,18,19]. Meanwhile, many false matches exist in feature matching process. A number of advanced corner detectors and descriptors are created to solve this problem, but error matches still cannot be eliminated completely [20,21]. Moreover, the rectification techniques such as least median-squares (LMedS) proposed by Rousseeuw and random sample consensus (RANSAC) proposed by Fischler have poorer performance with the mismatches increasing [22,23]. In these cases, the transformation matrix for mosaicking is not accurate and images cannot be stitched perfectly, which leads to some discontinuities especially at the edges of the graphs [1].
In addition, external interference always exists when taking pictures, for example lens distortion [24], photorefractive effect, different exposure and illuminations. None of the images can be mosaicked to be ideal in the presence of lens distortion [25]. Similarly, the edges of objects may deform when the pictures are taken under water or in an inhomogeneous atmosphere [26,27]. All the distortions may cause losses of pixel level alignment, these discontinuities can severely degrade the human visual perception and decrease the quality of the mosaic image. Thus, how to reduce the negative effect of discontinuities on visual perception is the key to improving image-stitching qualities.
2.2. Human Visual System (HVS)
Image quality evaluation based on HVS is one of the most reasonable methods when assessing pictures, because the results obtained are consistent with the subjective results [15,28]. Therefore, it is of great significance to study how the human visual system works. Human awareness of images is affected by the physiological structure of the eyeballs and the psychological function of the brain shows different visual discrimination and attention in different conditions. For example, visual masking refers to the visibility reduction when one stimulus is in a similar background [29]. The limited human visual ability will ignore some details hidden in the background in time [30]. Besides, the perceived intensity is proportional to physical stimuli on a logarithmic scale according the Weber–Fechner law [31]. The law indicates that human eyes are insensitive to the change of gray value when the brightness of objects in the pictures is at a high level [32]. In addition, psychophysical studies show that the perception of HVS for an image is selective. Different regions or objects have diverse levels of visual saliency [33,34]. The HVS will detect the stimulus with high saliency by the distinctive size, intensity, color, or orientation contrasting with the surroundings [33]. In other words, these stimuli attract almost all the attention of the human eyes.
The above theories of HVS indicate that if the discontinuous edges located at the high saliency regions, the quality of mosaic images will be reduced, while the discontinuous edges will result in little detectable effect when they are in low-saliency regions or masking backgrounds. Therefore, using HVS to determine the location of the seamline can effectively reduce the discontinuities, thereby improving the quality of stitching.
3. Methods
The seamless stitching method focuses on eliminating discontinuities in mosaic images. The flow is shown in Figure 1. First, the feature extraction algorithm is used to register the two input images to obtain the homographic wrap for aligning them. Then the visual perception of these images’ overlapped region is quantified to indicate the influence on the stitching result. Human visual discrimination and attention are involved in the process mentioned above. In general, the image processing is divided into 4 parts, including visual non-linearity (VN), luminance difference (LD), visual masking property (VM), and visual saliency (VS) respectively, and they are then combined to a weight map (WM) for selecting stitching line pixels. Edge detection is also implemented to distinguish safe edges and misaligned edges in order to provide a reference for seamline-pixel selection. An optimal stitching line is then detected based on WM and the reference edge. Lastly, images are stitched at the stitching line by multi-band blending to be a seamless mosaic image.
As is stated and analyzed above, the key to this method is tracing a stitching line which can avoid discontinuous edges that will attract the attention of the human eyes strongly. Therefore, the WM of visual perception and the optimal stitching line detection method are crucial in our approach.
3.1. Visual Perception Quantification
In the first stage, we process the images for stitching according to several visual properties and combine the results as a stitching line weight map to represent the priority of choosing the pixels as the stitching line components. The higher the weight value, the smaller the influence on the quality of the mosaic image. Finally, WM is obtained based on HVS, which includes the visual discrimination consisting of VN, LD, and VM and visual attention referred to as VS.
3.1.1. Visual Non-Linearity
VN is a study on the relationship between the objective luminance and the human subjective brightness perception. According to the universally acknowledged Weber–Fechner law, brightness perception of pictures is proportional to physical stimulus on a logarithmic scale [32]. In other words, the human eyes’ ability to recognize the difference of brightness declines with the increase of the objective luminance. Dehaene demonstrated the neural basis of the Weber–Fechner law by researching monkeys’ brains [31]. The Weber–Fechner law is given by Equation (1):
In Equation (1), S describes human visual subjective perception of brightness, and L is luminance of images. K and K0 are both constants associated with the average brightness of the pictures. Very bright or dark images correspond to small K values, and the value of K is taken as 1 for normal luminance range. In this paper, S is normalized to the range of (0–255) to compute the VN map.
The pictures for mosaicking are always taken by several image sensors from different orientations, which may lead to inequality in data processing and illumination circumstance; therefore, there are luminance differences in input images, resulting in discontinuities at luminance of objects in stitched image. Human eyes’ luminance discrimination threshold is at a low level in very bright areas, so it will improve the quality of mosaic if locating the stitching line in bright areas.
3.1.2. Luminance Difference
Differentiate Equation (1), and we obtain the solution as follows:
where dS and dL are the differentiation of subjective brightness perception and objective luminance. According to Equation (2), the difference of the perception brightness varies linearly with the change of actual luminance. High LD between the input image pair will cause luminance discontinuities in the mosaic image. Thus, we choose low LD regions as mosaic regions in this experiment. LD map is defined in Equation (3):
where L1 and L2 denote the luminance of pixels with the same coordinate in the overlap area of image pair to be stitched. Then mean_filter denotes the mean luminance of the pixels adjacent to the pixel under computing. abs denotes the absolute value function.
3.1.3. Visual Masking
VM refers to the phenomenon that a visual stimulus in an image will be masked by its surroundings, which is difficult to be detected by HVS, especially when the characteristics of the stimulus are similar to those of the environment [29]. In the final stitched image, discontinuous edges due to misalignment usually seriously damage the image quality, but when it appears in areas with very complicated edge information, it has limited impact. At the same time, in the smoothing regions without edges, even if a slight mismatch of the image occurs in the area, it will not significantly affect the quality of the stitched image.
Based on this principle, the visual masking characteristics are quantified. The image is divided into texture regions, smoothing regions and other regions. The texture regions are mainly used to mask discontinuous edges in the mosaic image. Therefore, the more chaotic the edge information of texture regions is, the more helpful it is to improve the quality of stitched images. The degree of chaos in these regions is measured using local entropy, and the formula is shown in Equation (4):
where H is the local entropy. m, n are the length and width of the window around the pixel under calculating. Besides pij is defined as:
which is the probability that a gray level pixel (i, j) appears in the m·n neighboring window.
For pixels in smoothing regions, the selection of seamlines also has priority. The smaller the difference, the smoother the regions, and thus the better for the final result. Therefore, if we seam the images in very similar regions, the stitching line will be invisible. The degree of similarity is represented by a local range defined as:
where R is the local range. xmax and xmin are the maximum and minimum of gray value in the neighborhood window, respectively. The value of R is zero when a pixel is same with its adjacent pixels.
In summary, we can work the VM map out via Equations (4)–(7):
where VM denotes visual masking value of each pixel. k1 and k2 are constants and set to 0.8 and 1 based on experimental experience.
3.1.4. Visual Saliency
In addition to the visual discrimination restricted by HVS physiological properties analyzed above, there is also a vital psychological feature called visual attention mechanism, which has an impact to the selection of visual information. According to the feature integration theory proposed by [35], independent early features are extracted but not perceived at first time, and then the whole scene is gradually perceived with the selection and transfer of focus of attention (FOA). VS is used to represent the tendency of FOA selection. There is an increasing number of researchers studying VS detection to achieve the consistent effect with the human eyes in recent years. Some researchers are focusing on image quality assessment based on VS for reasonable evaluation results [14,36].
Each pixel has a unique saliency value, and those pixels with higher saliency have greater impact on image quality. If the discontinuous stitching line is also with a high visual saliency, it will have a negative effect on the mosaic result. Therefore, it is of great significance to avoid high VS regions when searching the stitching line. In this paper, we choose the VS model SDSP to calculate the VS value of each pixel. The value is defined as Equation (8):
where X refers to different pixels in input image pairs. The final saliency map VS combines three saliency maps, which include saliency map VSF(X) modeled by band-pass filtering, location saliency VSD(X), and color saliency VSC(X) based on whether it is warm or cold respectively.
3.1.5. Weight Map
The quality of mosaic images is influenced by VN, LD, VM and VS. We integrate all of them according to Equation (9):
where WM refers to the weight map based on HVS. μ1, μ2, μ3, and μ4 are constants, the sum of which is 1. In Equation (9), VS is a comprehensive visual feature that directly affects the first impression of the mosaic image, so μ4 is set as the maximum value in these constants. Discontinuous edges degrade mosaic image considerably, so μ3 comes in second. Because an extra light compensation is necessary for images with obvious luminance difference and it is not the emphasis of our approach, the images used in this paper have similar brightness. In this situation, μ1 and μ2 are set to about 0.15 so that HVS could experience luminance difference across the stitching line.
3.2. Optimal Stitching Line Detection and Smoothing
In Section 3.1.3, the overlap area is segmented into smoothing areas, texture areas and other areas. We have clarified that selecting seamlines in smoothing and texture areas can minimize the impact on image quality. In fact, some overlapping strong edge areas in other areas, also called safe strong edge areas, can also be used as candidate areas. Considering the phenomenon mentioned above, a reference edge map based on edge detection algorithm Canny is used for judging whether an edge pixel is a stitching line candidate or not.
An optimal stitching line is almost invisible when it produces few discontinuous strong edges and the discontinuous weak edges are masked or located in low-saliency areas. The first step of locating the optimal stitching line is to set the two intersections of input image pair’s boundaries after transforming to starting pixel and terminal pixel, respectively. Then all pixels in overlap region are divided into candidates and invalid pixels. The candidates comprise the pixels in smoothing regions or texture regions and safe strong edge pixels. Then, the dynamic programming goes into operation at the starting pixel. A parameter Dref related to the distance to terminal point for each pixel is added to make sure the stitching line ends at the terminal point. Dref is defined as the inverse of the Euclidean distance between the pixel under computing and the terminal one. During this procedure, we choose the adjacent candidate with the maximum WMref as the next stitching line pixel. The chosen pixels are then added into the invalid point set for searching. The program will keep searching the ending point until it makes it. WMref can be calculated by Equation (10):
and then the obtained stitching line is simplified after the former process to then trace the final stitching line.
Considering the diversity of the photographic circumstances and image sensors, the luminance difference cannot be ignored even though the stitching line has already reduced its impact; thus, the post processes such as white balance and illumination compensation are beneficial to obtain a visually comfortable mosaic image. In the fusion phase, the overlap area is divided into two parts by the stitching line based on HVS. The left part of mosaic image is filled by the left input image, while the other is filled by the right one. The transition is smoothed by a multi-band blending algorithm.
The multi-band blending algorithm gives a significant result by retaining useful image information at different scales. In the first step this algorithm decomposes the image pairs into a set of band-pass filtered component images called Gaussian pyramid and Laplacian pyramid. Next, the component images in each spatial frequency band are assembled into a corresponding band-pass mosaic. Finally, these band-pass images are integrated to obtain the mosaic image. The macro features of the image are in the low-frequency component images, while the local characteristics are retained in the high-frequency ones. Therefore, a stitching line in the resultant mosaic image is almost invisible.
4. Experimental Results and Analysis
We have conducted experiments to evaluate the performance of this method, and the results of the experiments show that the method improves the quality of the fused image. The two image pairs are tested in two sets of experiments. In the first set, mosaic images seamed directly at the input images’ boundaries and obtained from the proposed technique were compared. In the other set, we changed the parameters of the weight map to assess the impact of them in our method.
4.1. Experiment Set1
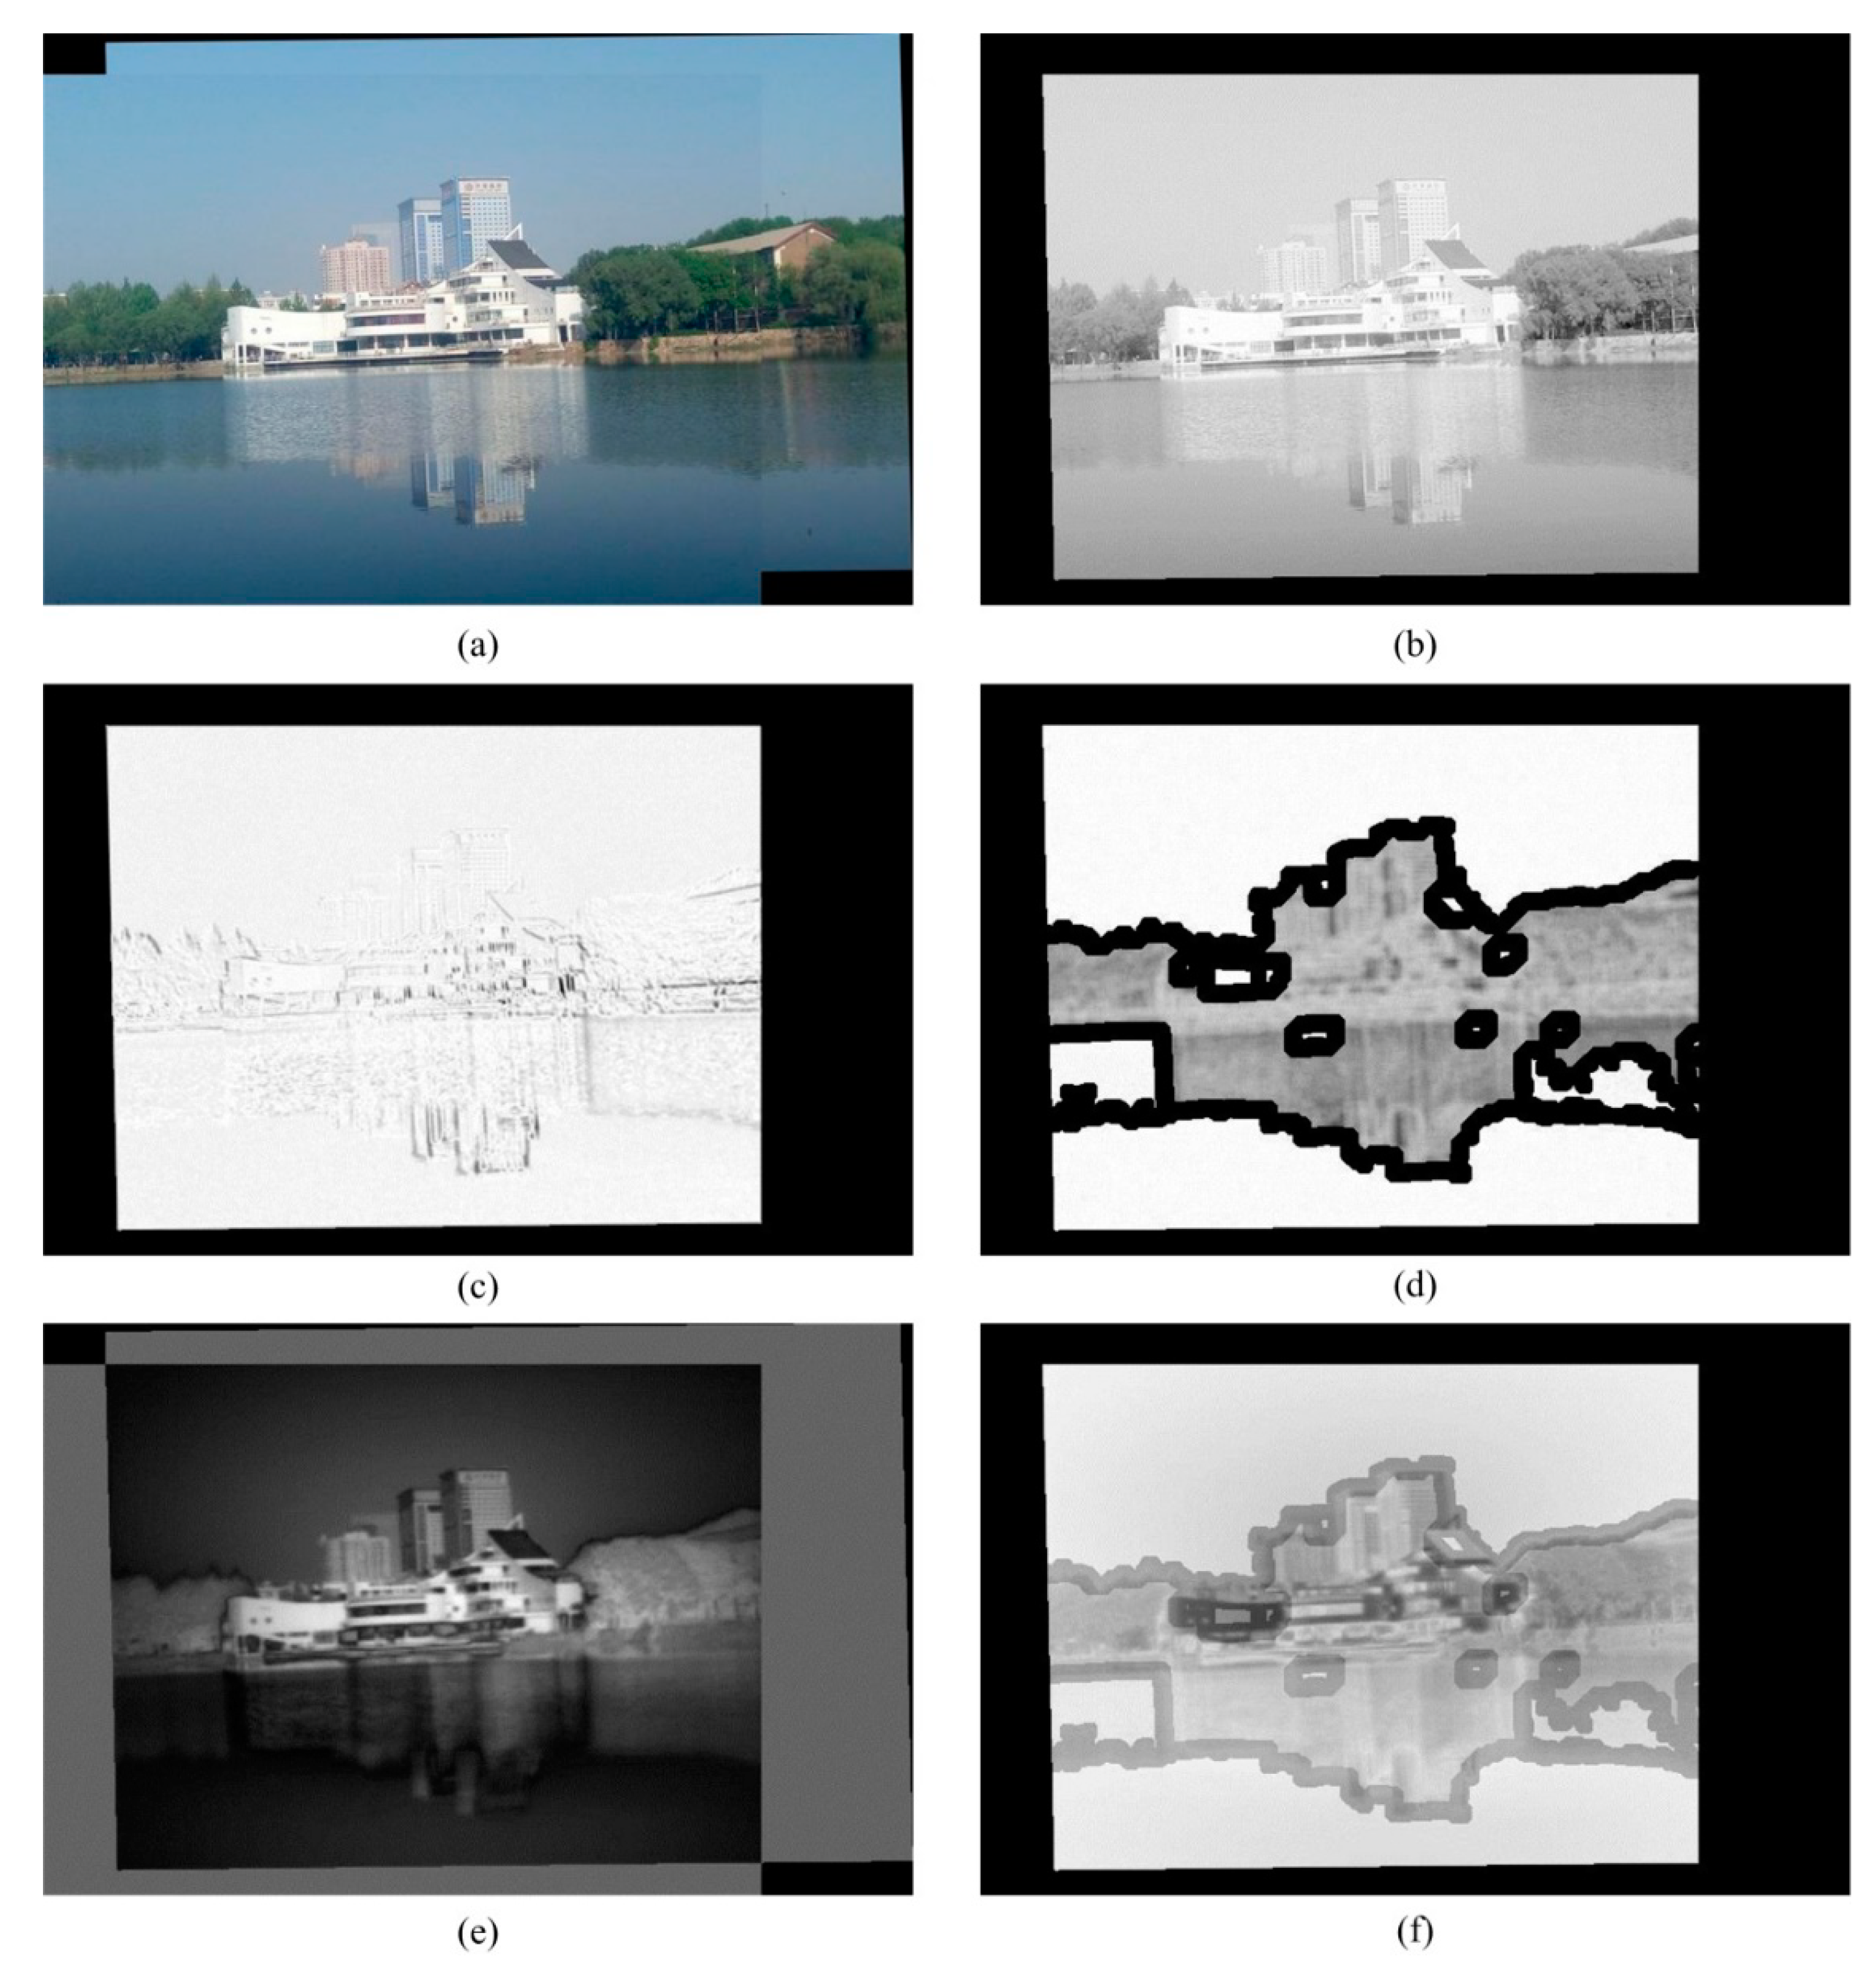
Figure 2 shows the image pair and the quantitative results of the overlap region with 4 different HVS properties, which are VN, LD, VM, and VS, respectively.
As is shown in Figure 2a, the two pictures are stitched at the boundary directly, where there is a dividing line visible to the naked eye. In the experiment, Figure 2b,c illustrate the visual discrimination of luminance through the VN and LD map of the same image in which Figure 2c shows the discrimination of edge information. In the VN map shown in Figure 2b, brightness discrimination of human eyes decreases as the VN value increases, and in the LD map shown in Figure 2c, bright pixels represent small luminance difference between the two images, and small luminance gap can be smoothed by our technique. In the VM map, white areas represent smooth areas without edges and gray areas are texture areas, while the black areas in overlap zone contain strong edges, which are dangerous to mosaic image quality. The result of visual attention is pictured in Figure 2e. HVS will capture the white objects in this picture the first time. The last image of Figure 2 is the weight map combined by Figure 2b–e for tracing the stitching line.
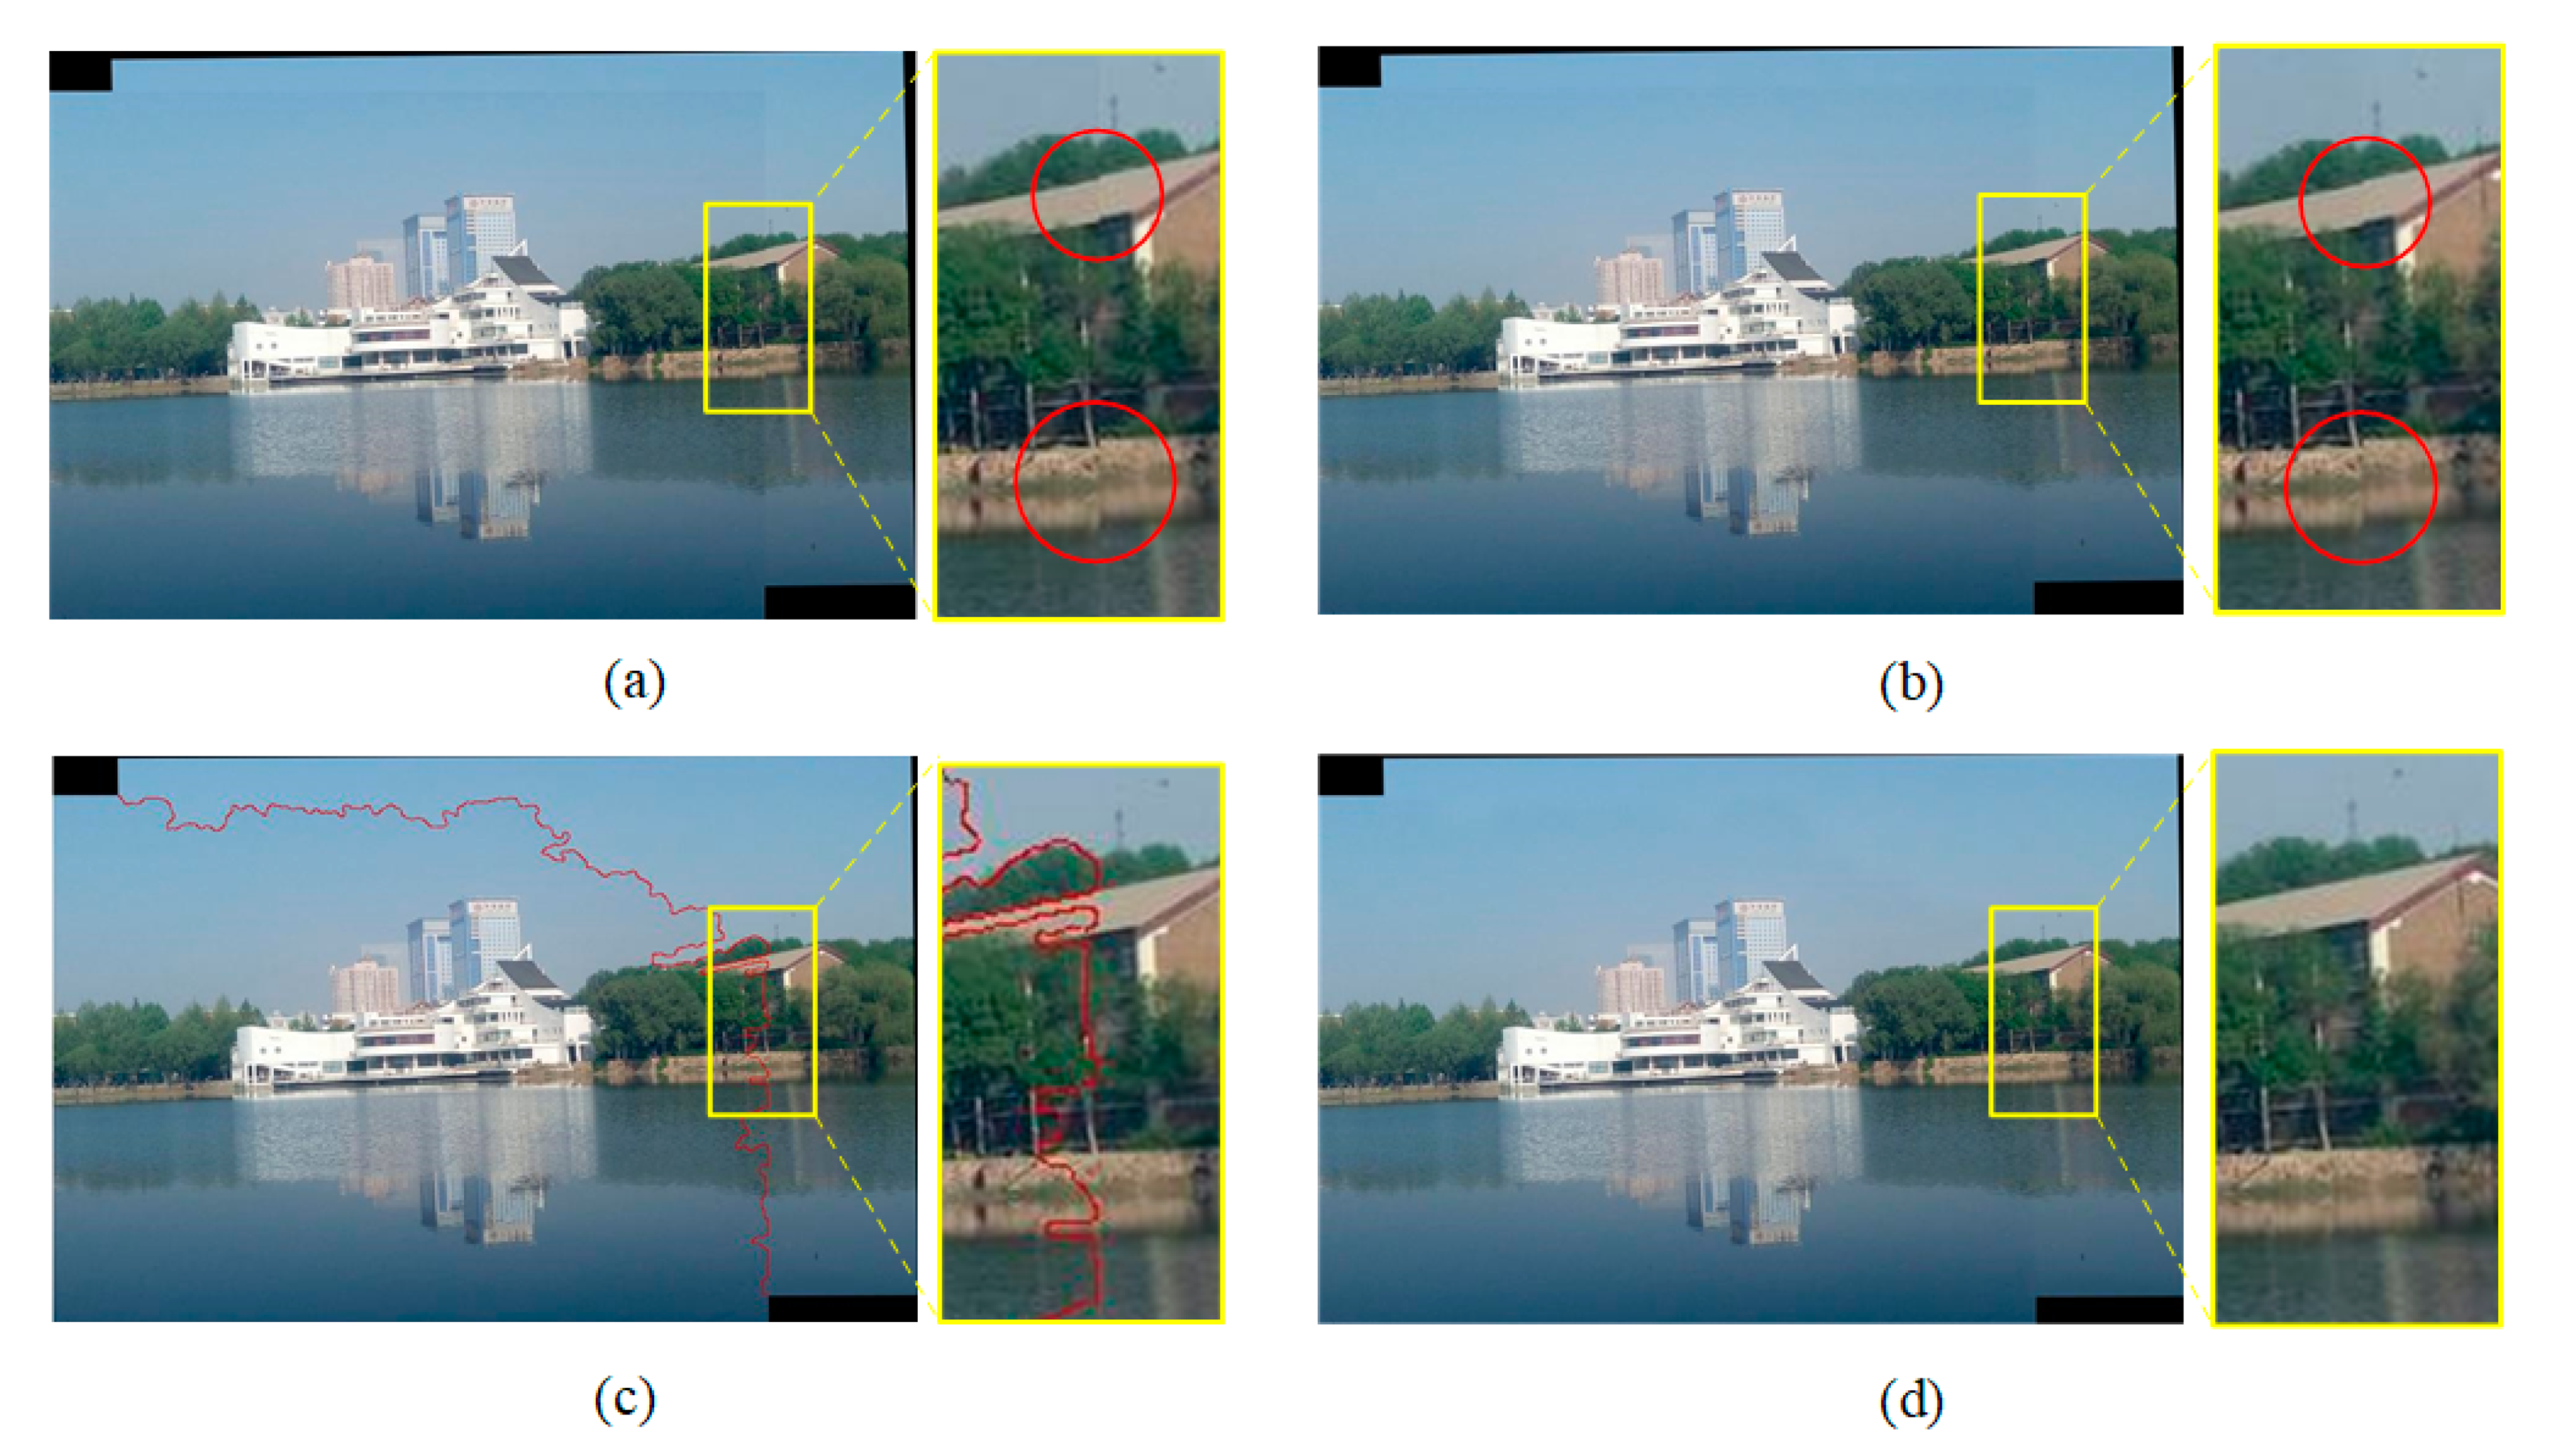
We compare stitching results of 4 different methods in Figure 3. The edges in yellow circle are broken by the left image boundaries, and the boundaries are visible. The multi-band blending is useless to eliminate discontinuous edges; it is to say that Figure 3b is a mosaic picture with low quality even whose boundaries are feathered. The red line in Figure 3c is the stitching line detected by the proposed method. It can be clearly seen in the enlarged yellow frame that this stitching line successfully locates a low luminance difference path and avoids the high-saliency areas. Therefore, our method produces a satisfactory result without obvious stitching lines or discontinuous edges shown in Figure 3d.
Due to the lack of universal no-reference image quality assessment based on HVS, two quantitative indicators were proposed to evaluate the stitching effects. One is N defined as the number of the pixels in the stitching line which can be detected by an edge detection algorithm (Canny), excepting those masked ones. The other indicator P is expressed as the following Equation (11):
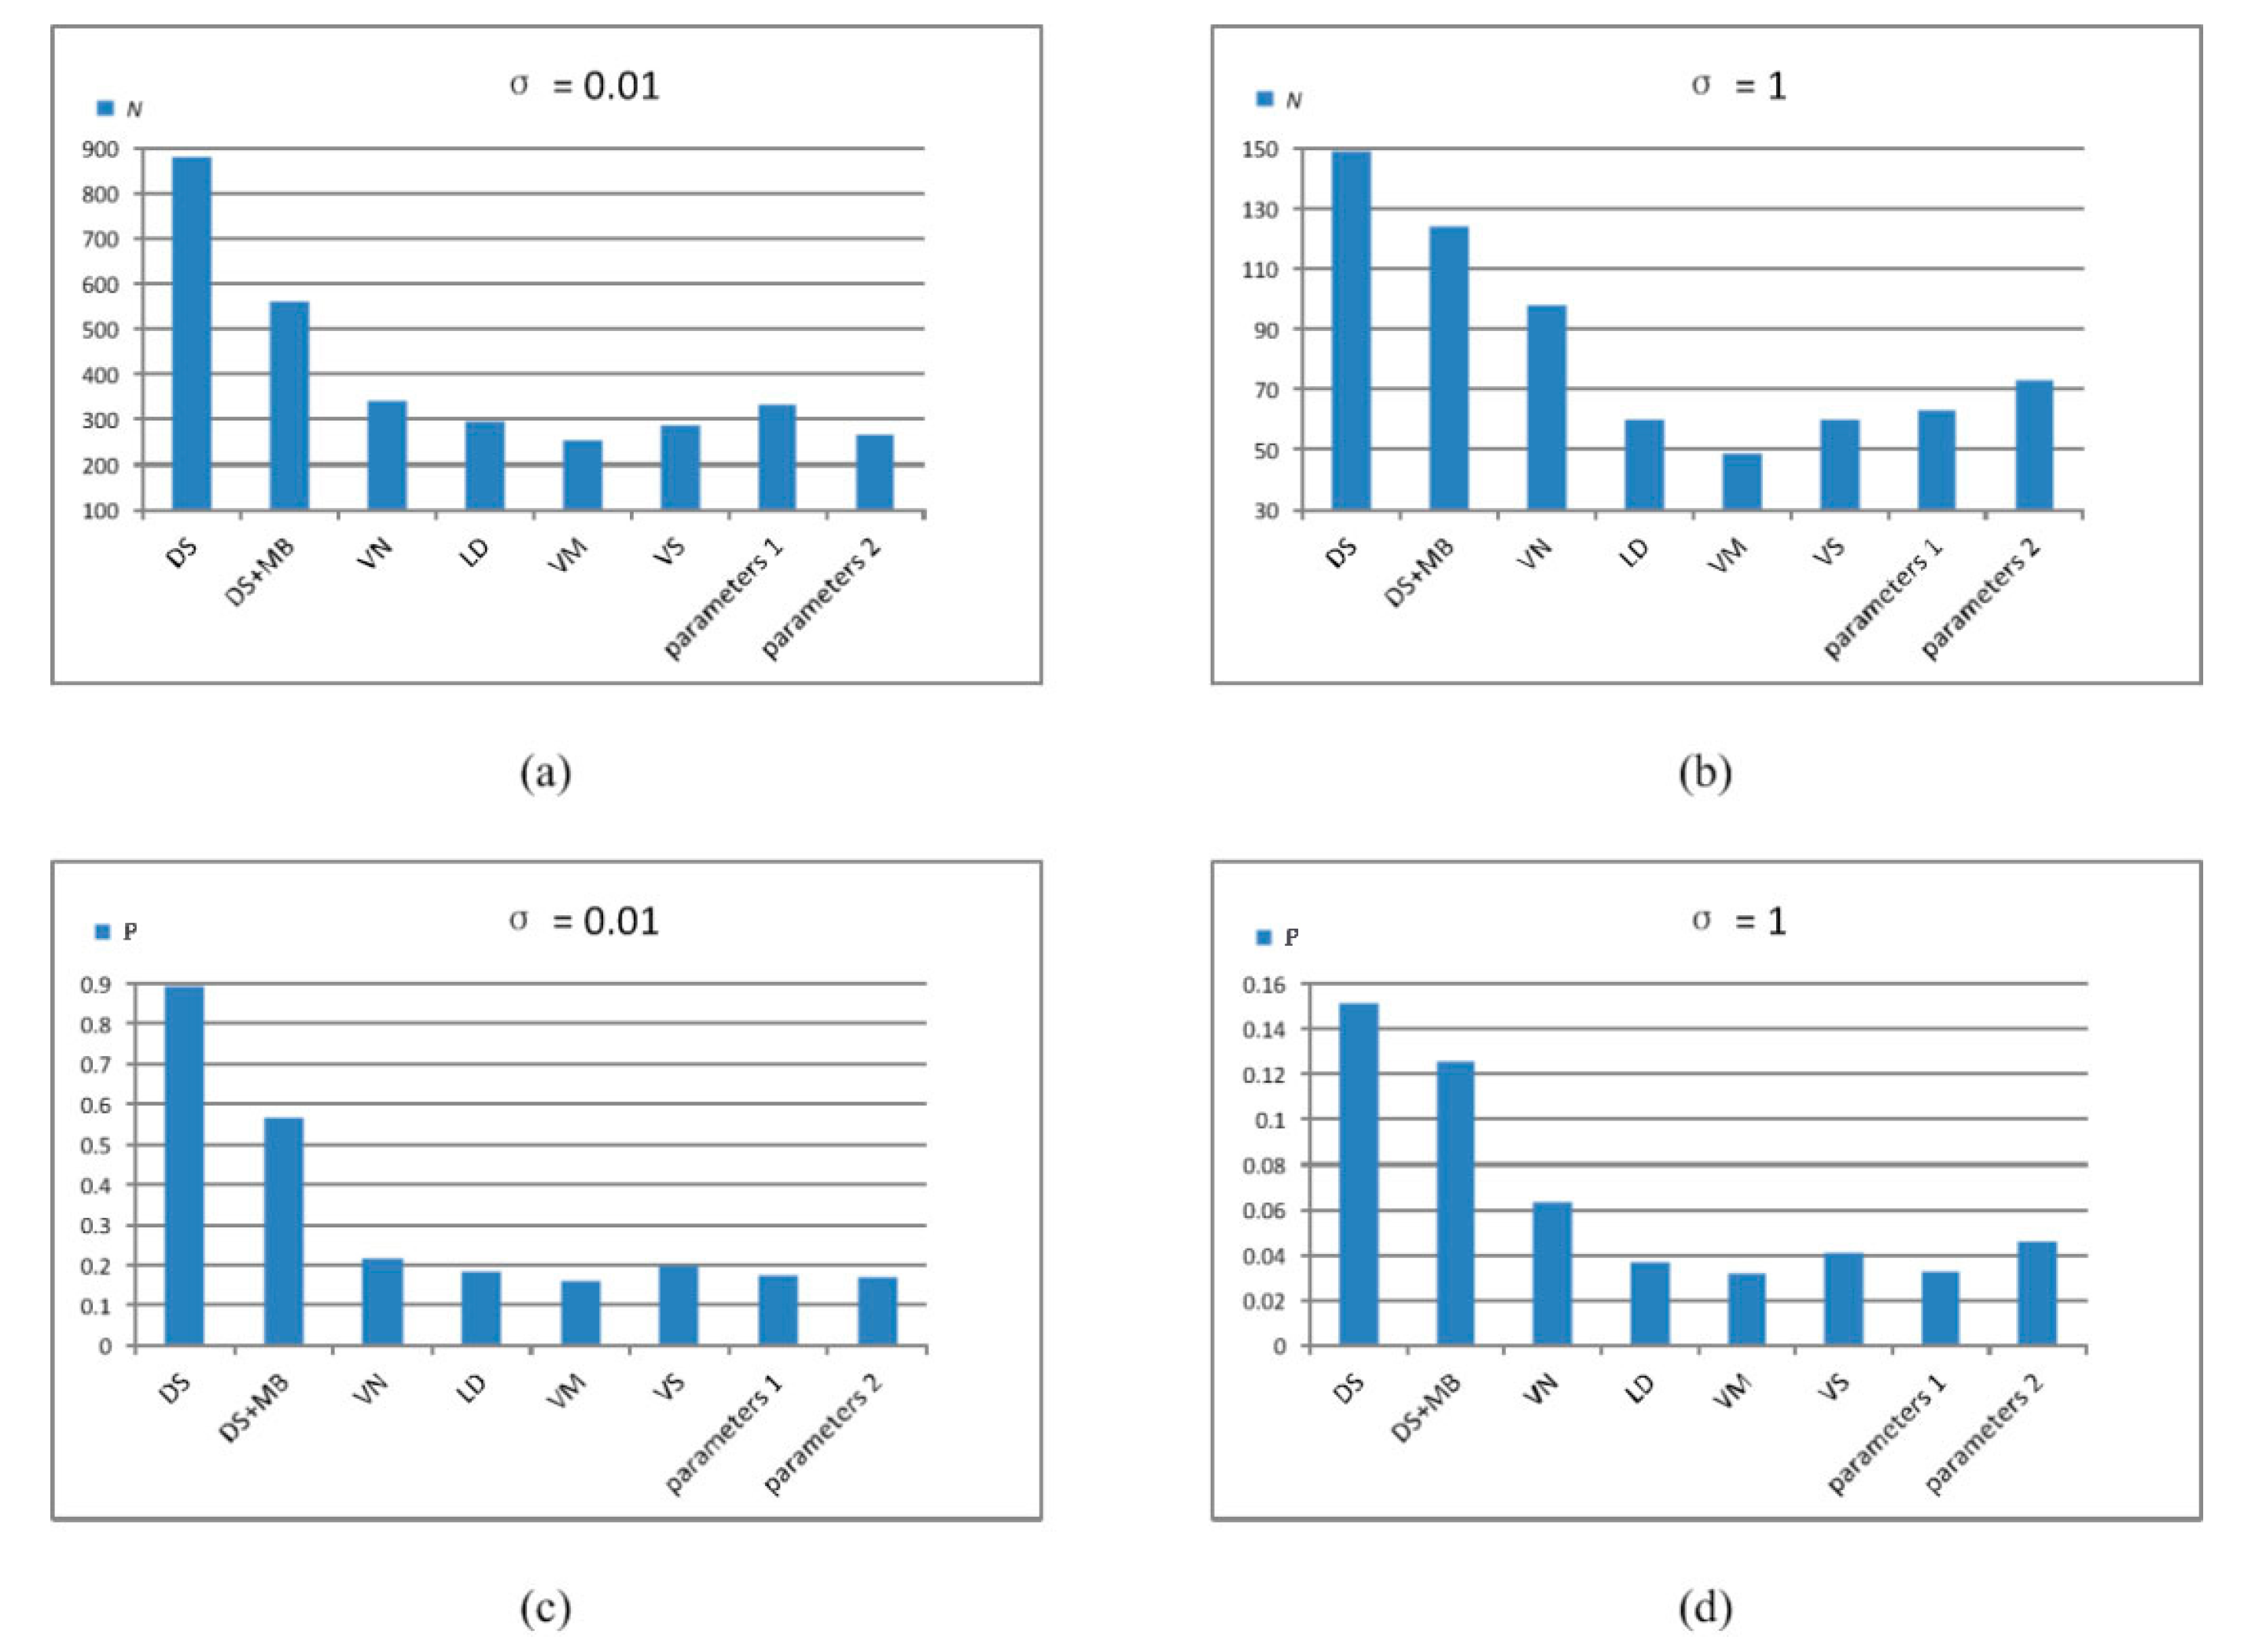
where Nstich_line indicates the number of stitching line pixels. Obviously, the values of these indicators are low for a visual friendly image. Table 1 shows the indicators of Figure 3a,b,d.
We process images by the Gaussian smoothing filter with different levels (σ) at the beginning of edge detection. According to Figure 3 and Table 1, our approach performs much better than the traditional methods in the both two situations. The significant decreases of N when enlarge the value of σ imply that all of three images have many edge pixels that are hard to notice. Nevertheless, there are still about 130 conspicuous edge pixels left in Figure 3a,b with the image size of 699 × 459 pixels, while the number in Figure 3d is 73 with a 50% decline compared with Figure 3a. These conspicuous edge pixels in the final image are only 4.58% of the stitching line pixels, compared with the 15.14% and 12.6% in (a) and (b) respectively.
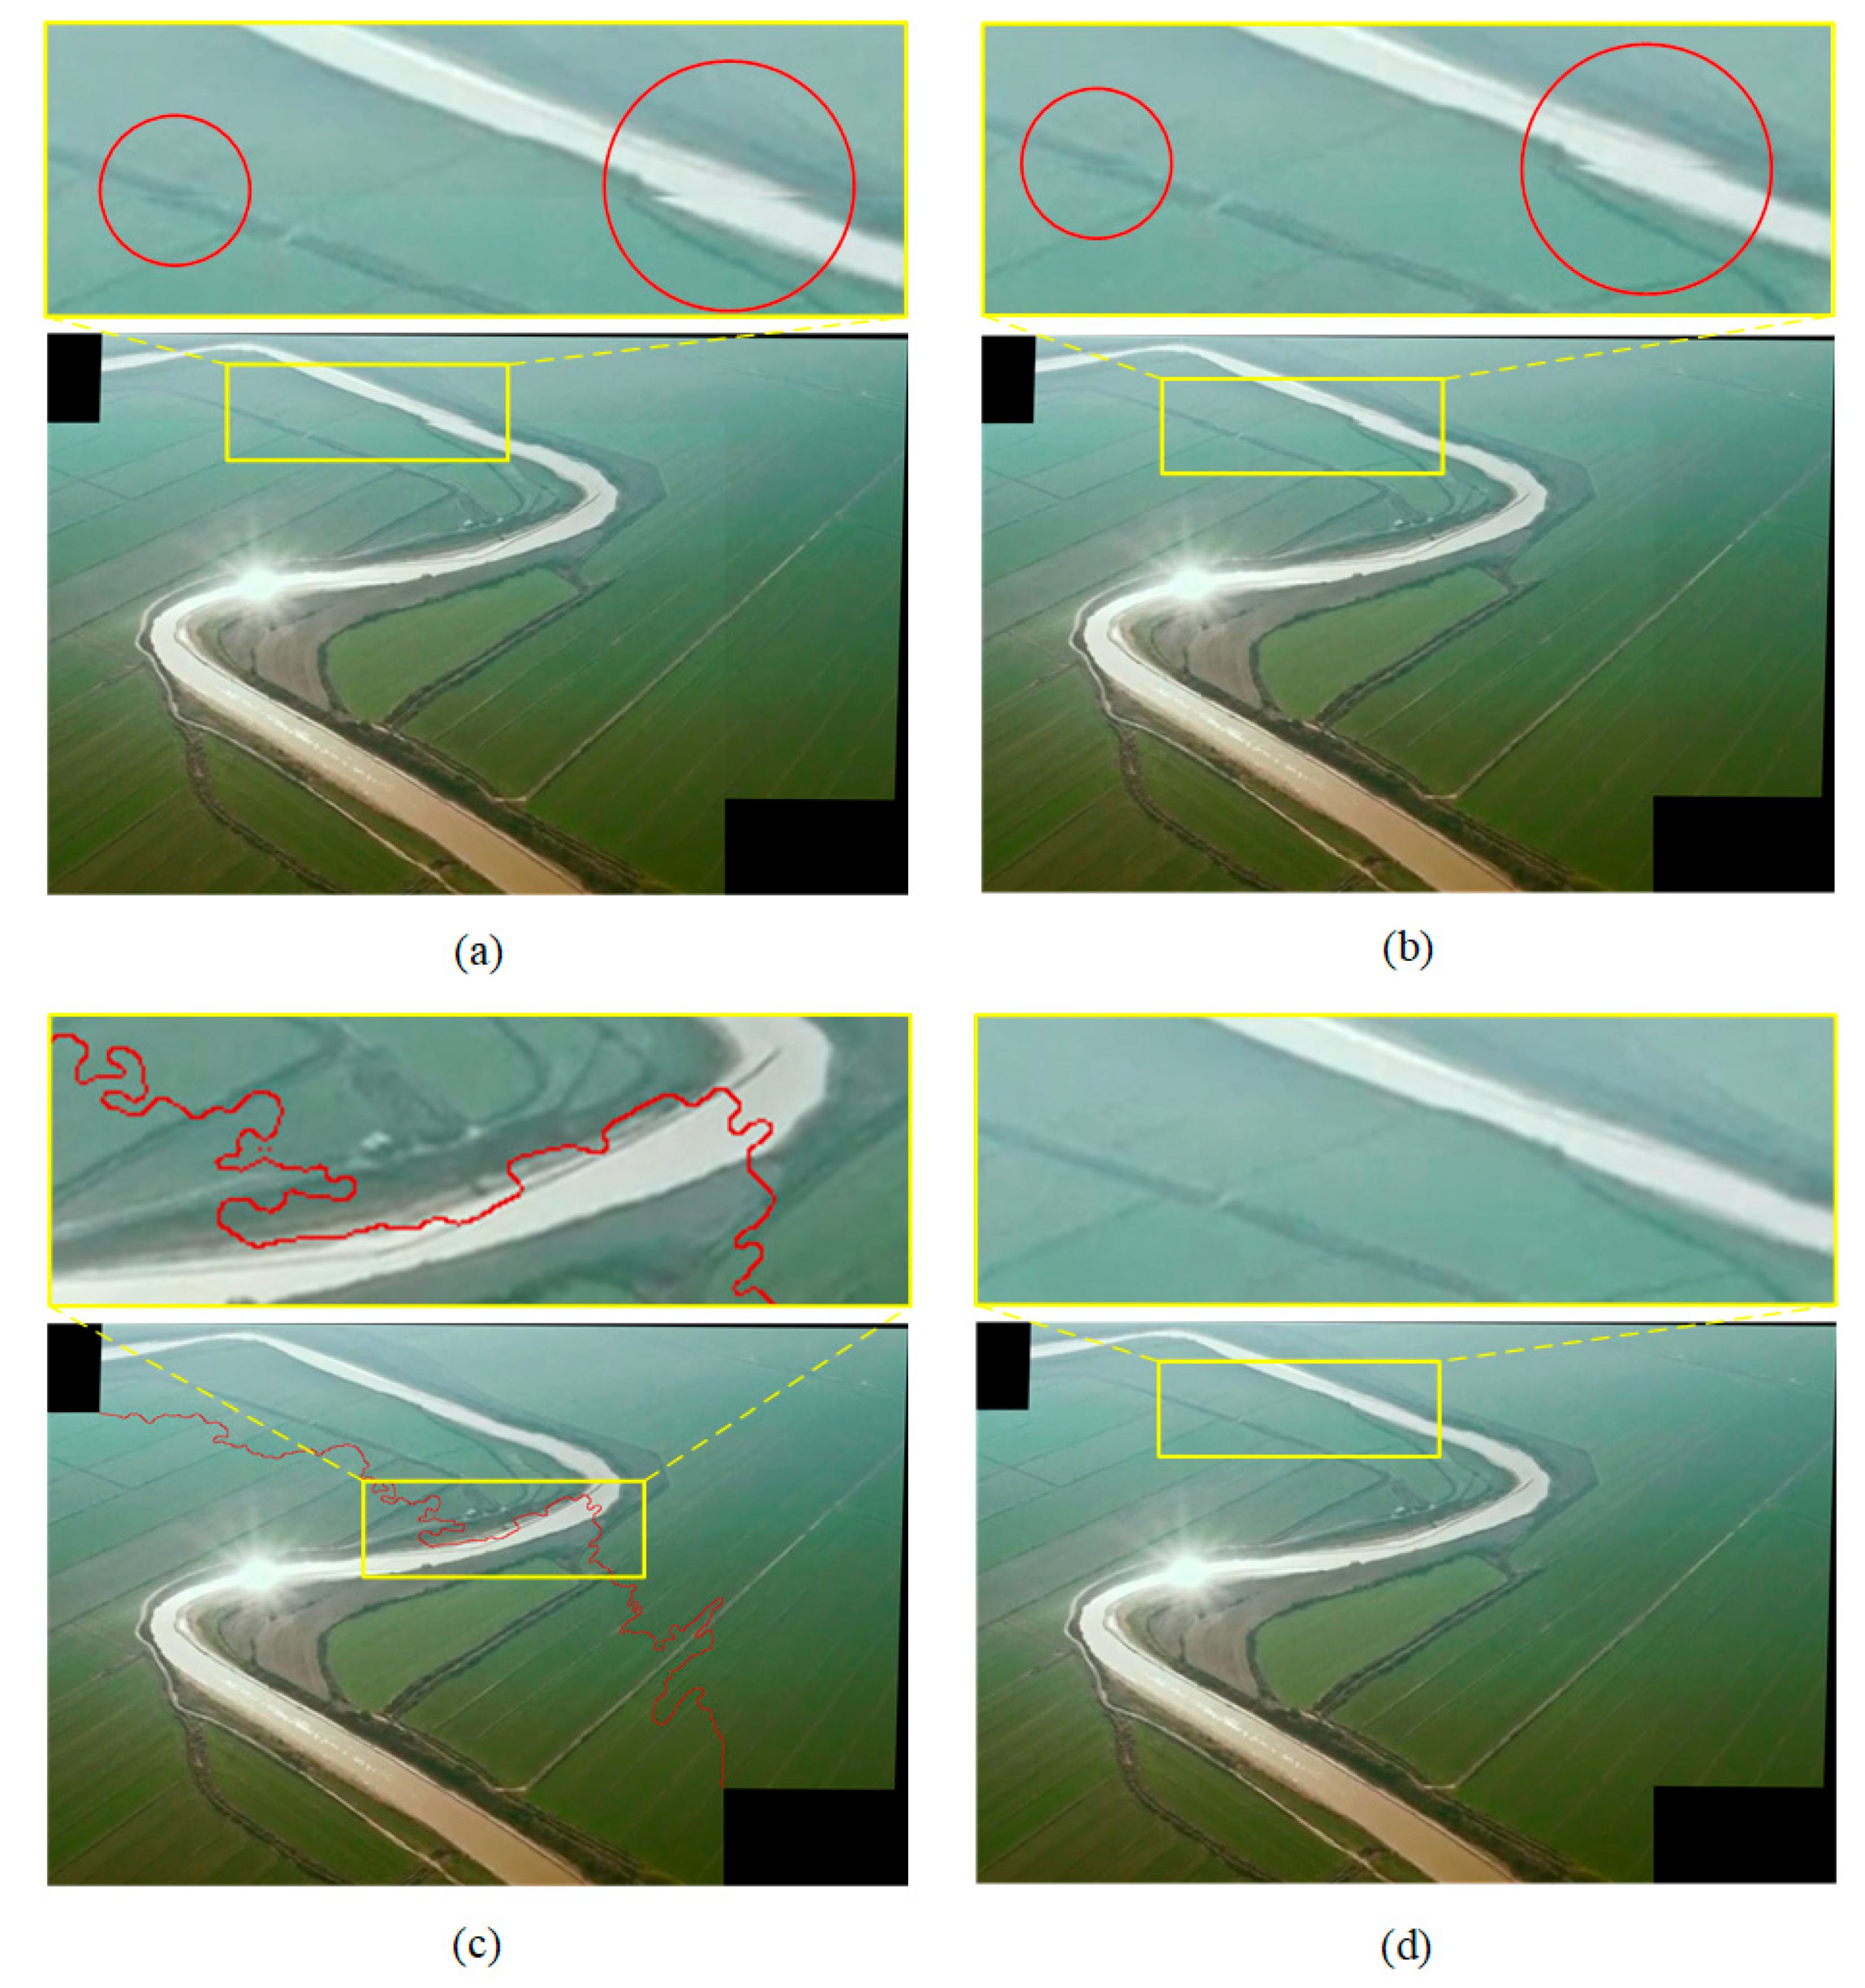
By contrast with the above image pair, the other image pair in the first experiment set is a photo couple taken by drones. The stitching results are listed in Figure 4.
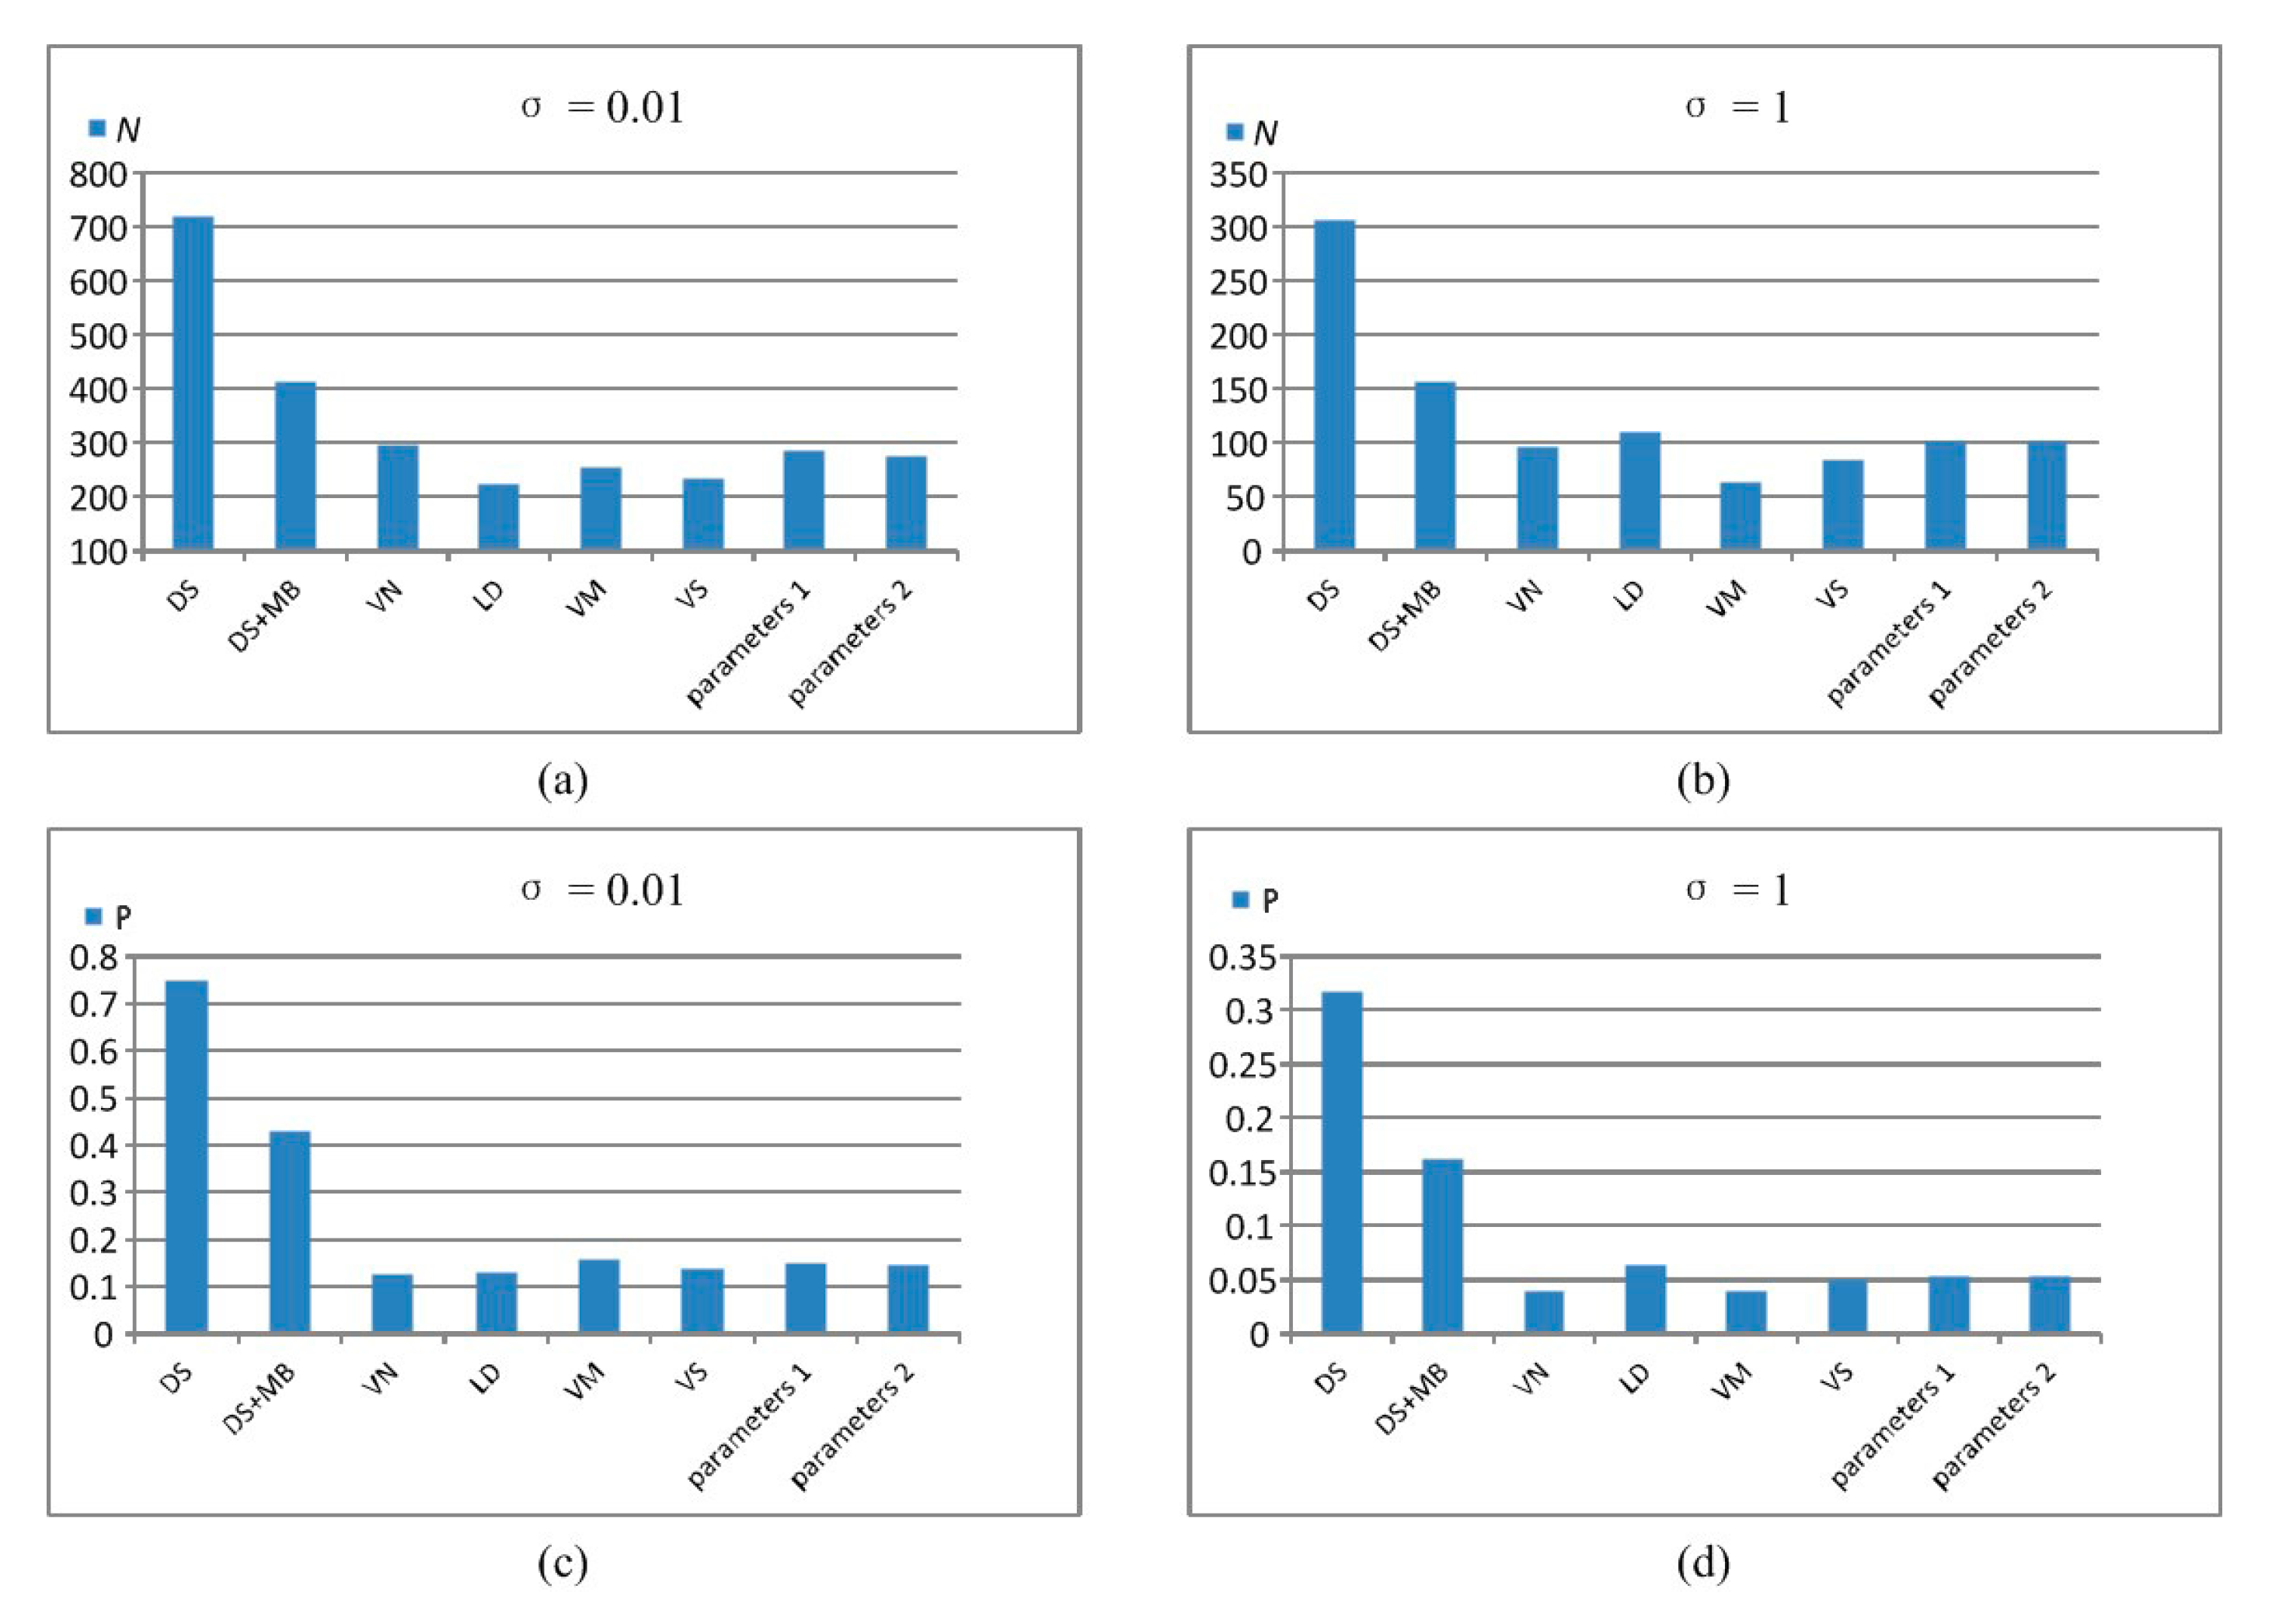
Besides the obvious stitching line in (a) and (b), the riverbank edges and farmland edges in yellow frames are cut off by image boundaries. However, these rivers are high-saliency objects in the pictures, which lead to the conspicuous unnatural dislocations. In this experiment, stitching lines must cut through the river. But the path selection of the stitching line shown in Figure 4c automatically bypasses the high-saliency regions where discontinuities occur in (a) and (b), it chooses the low-saliency regions such as the aligned river bank as its components. There is no visible discontinuous edge in (d) and the transition of the two photos is also smoothed. The evaluations are listed in Table 2.
When σ is 0.01, N of Figure 4d decreases a lot compared with (a) and (b). The value of P shrinks even more. When σ is 1, about 32% stitching line pixels can be detected in Figure 3a, compared to only 5.3% in (d). Only 101 pixels in the picture with a resolution of 830∗542 are visible. According to the two experiments, our technique improves the mosaic image quality significantly.
4.2. Experiment Set 2
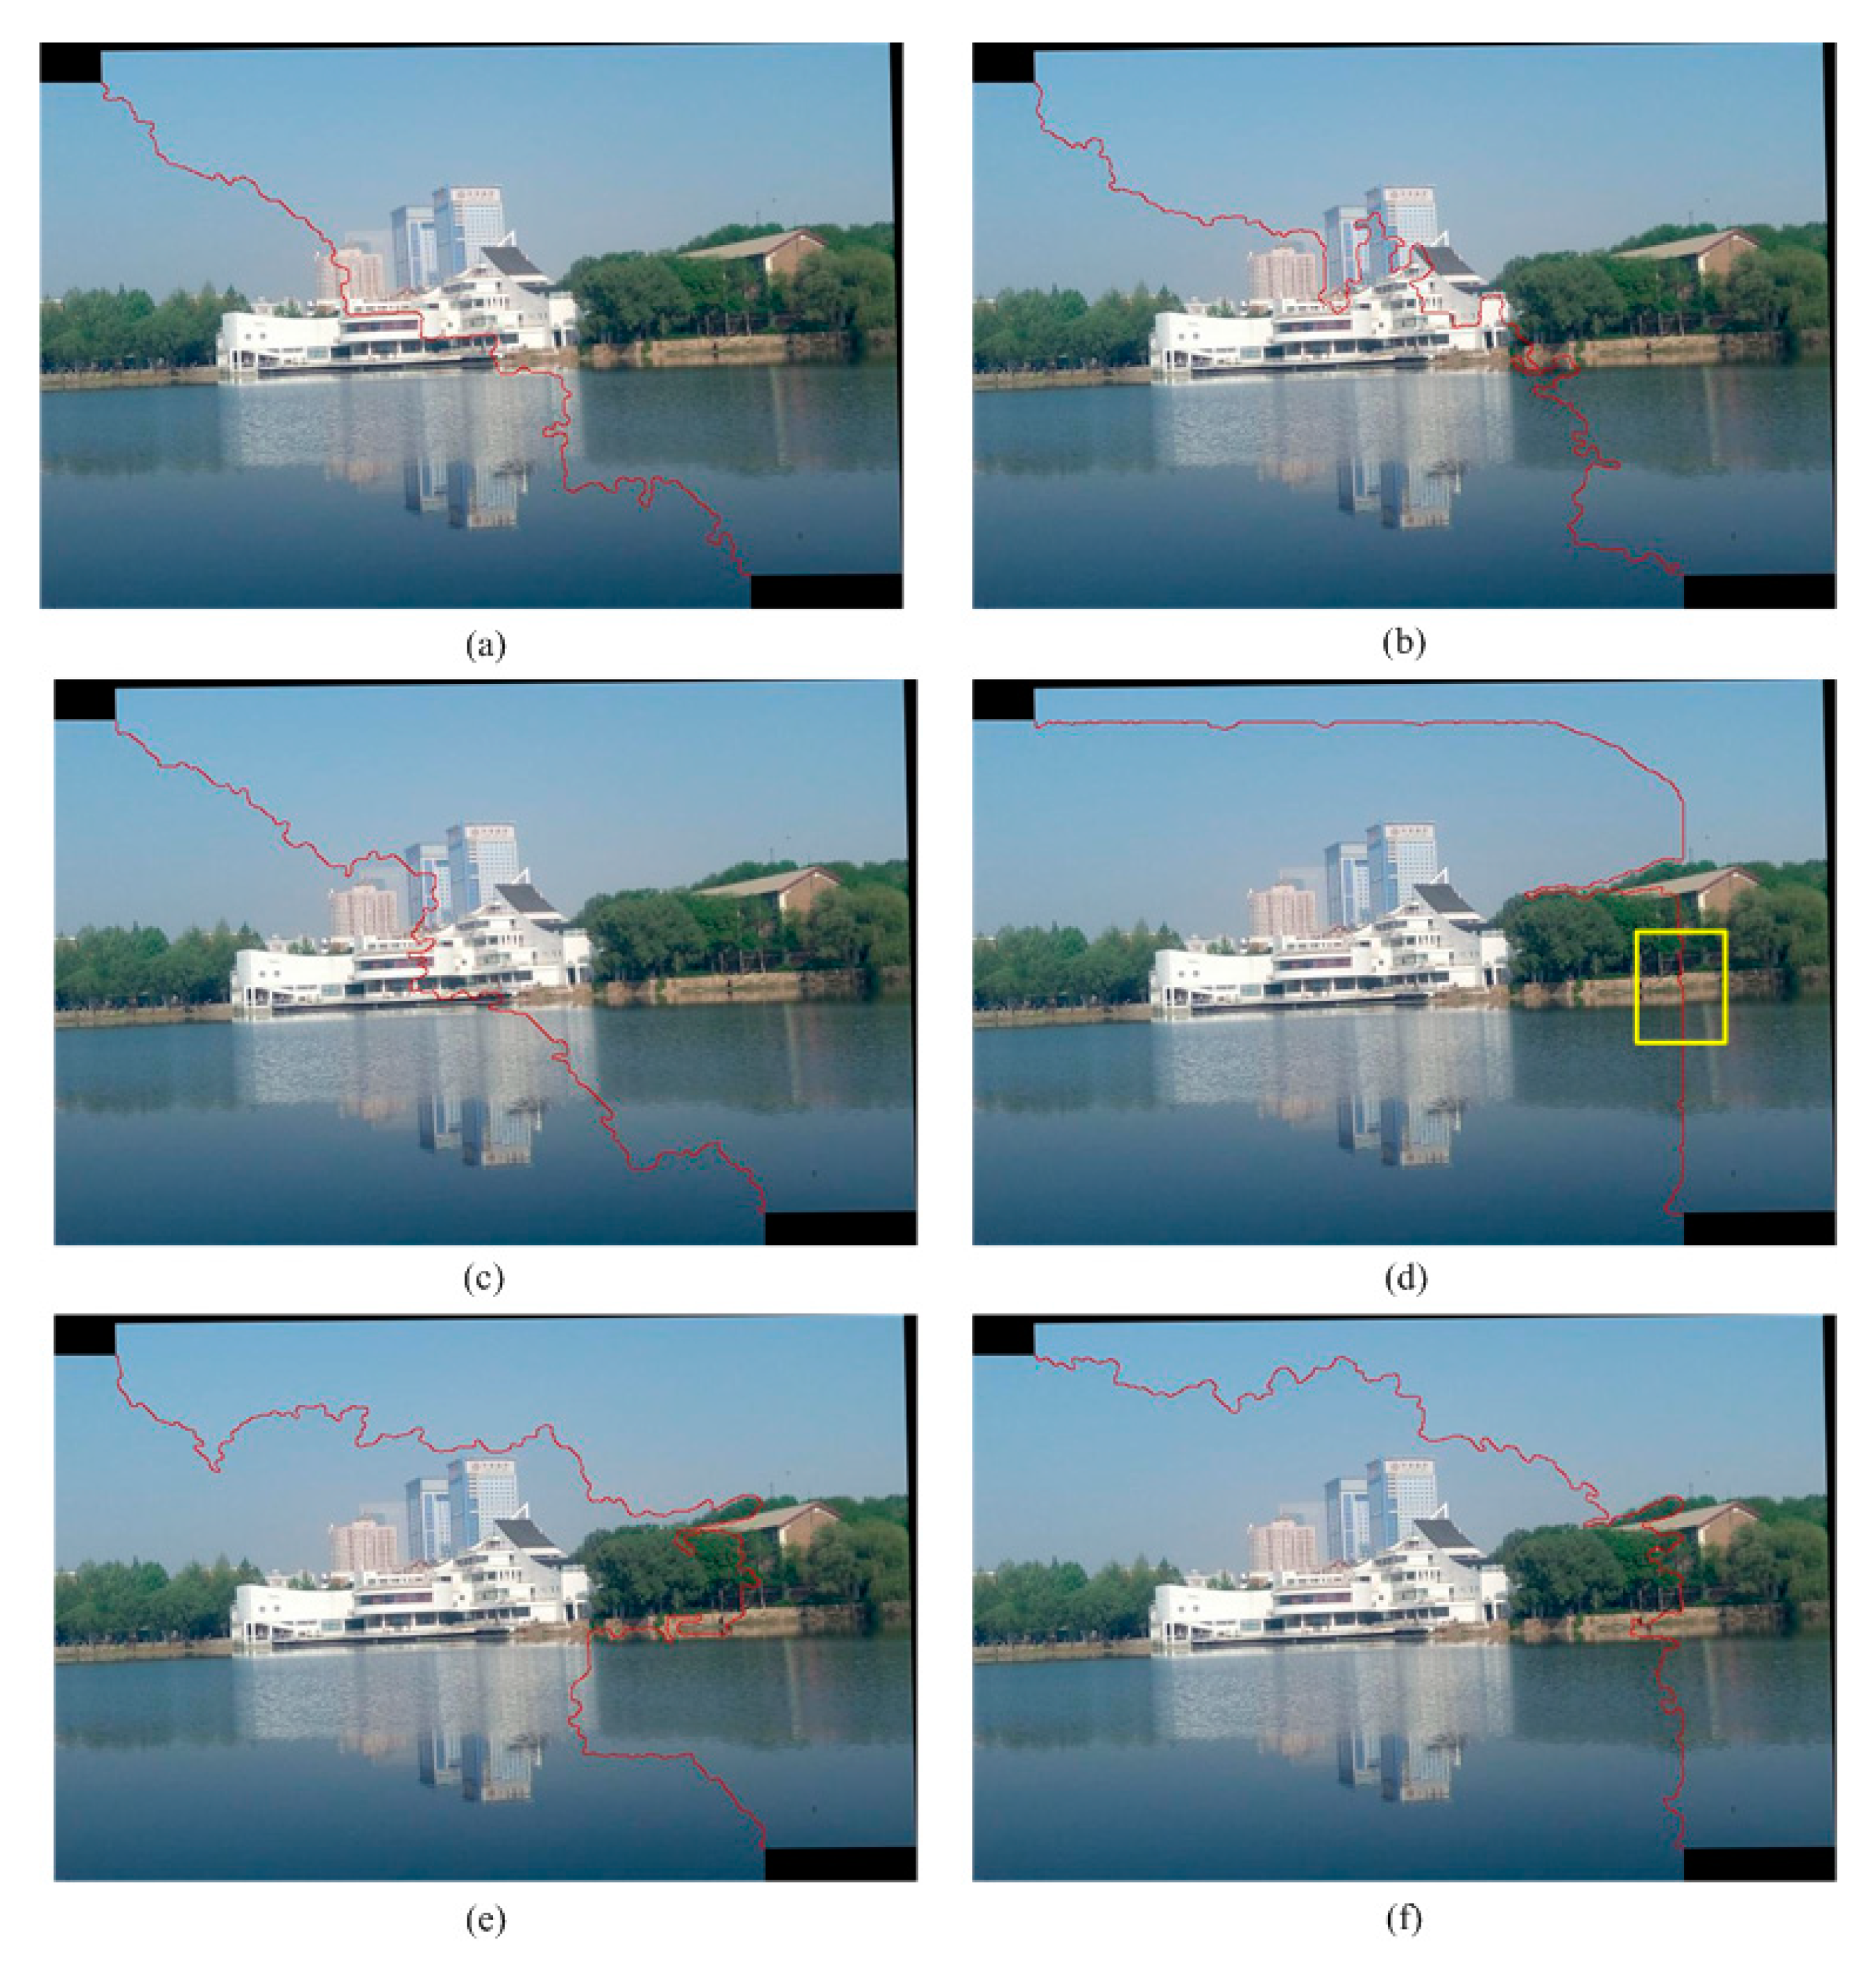
According to Figure 2e, white architecture is the most conspicuous object. All the stitching effects are fine, because the edges of white building are aligned. However, the stitch lines obtained from VN, LD and VM cut through the high-saliency object, which is dangerous to the mosaic image quality. Then we change the parameters of Equation (9) and make comparison of these stitching effects, as shown in Figure 5 and Figure 6. The broken edges in the yellow box of Figure 5d debase the image quality. The stitch lines in (e) and (f) avoid the white building and unaligned edges, and the final result is seamless. Evaluations of fusion effects are listed in Table 3.
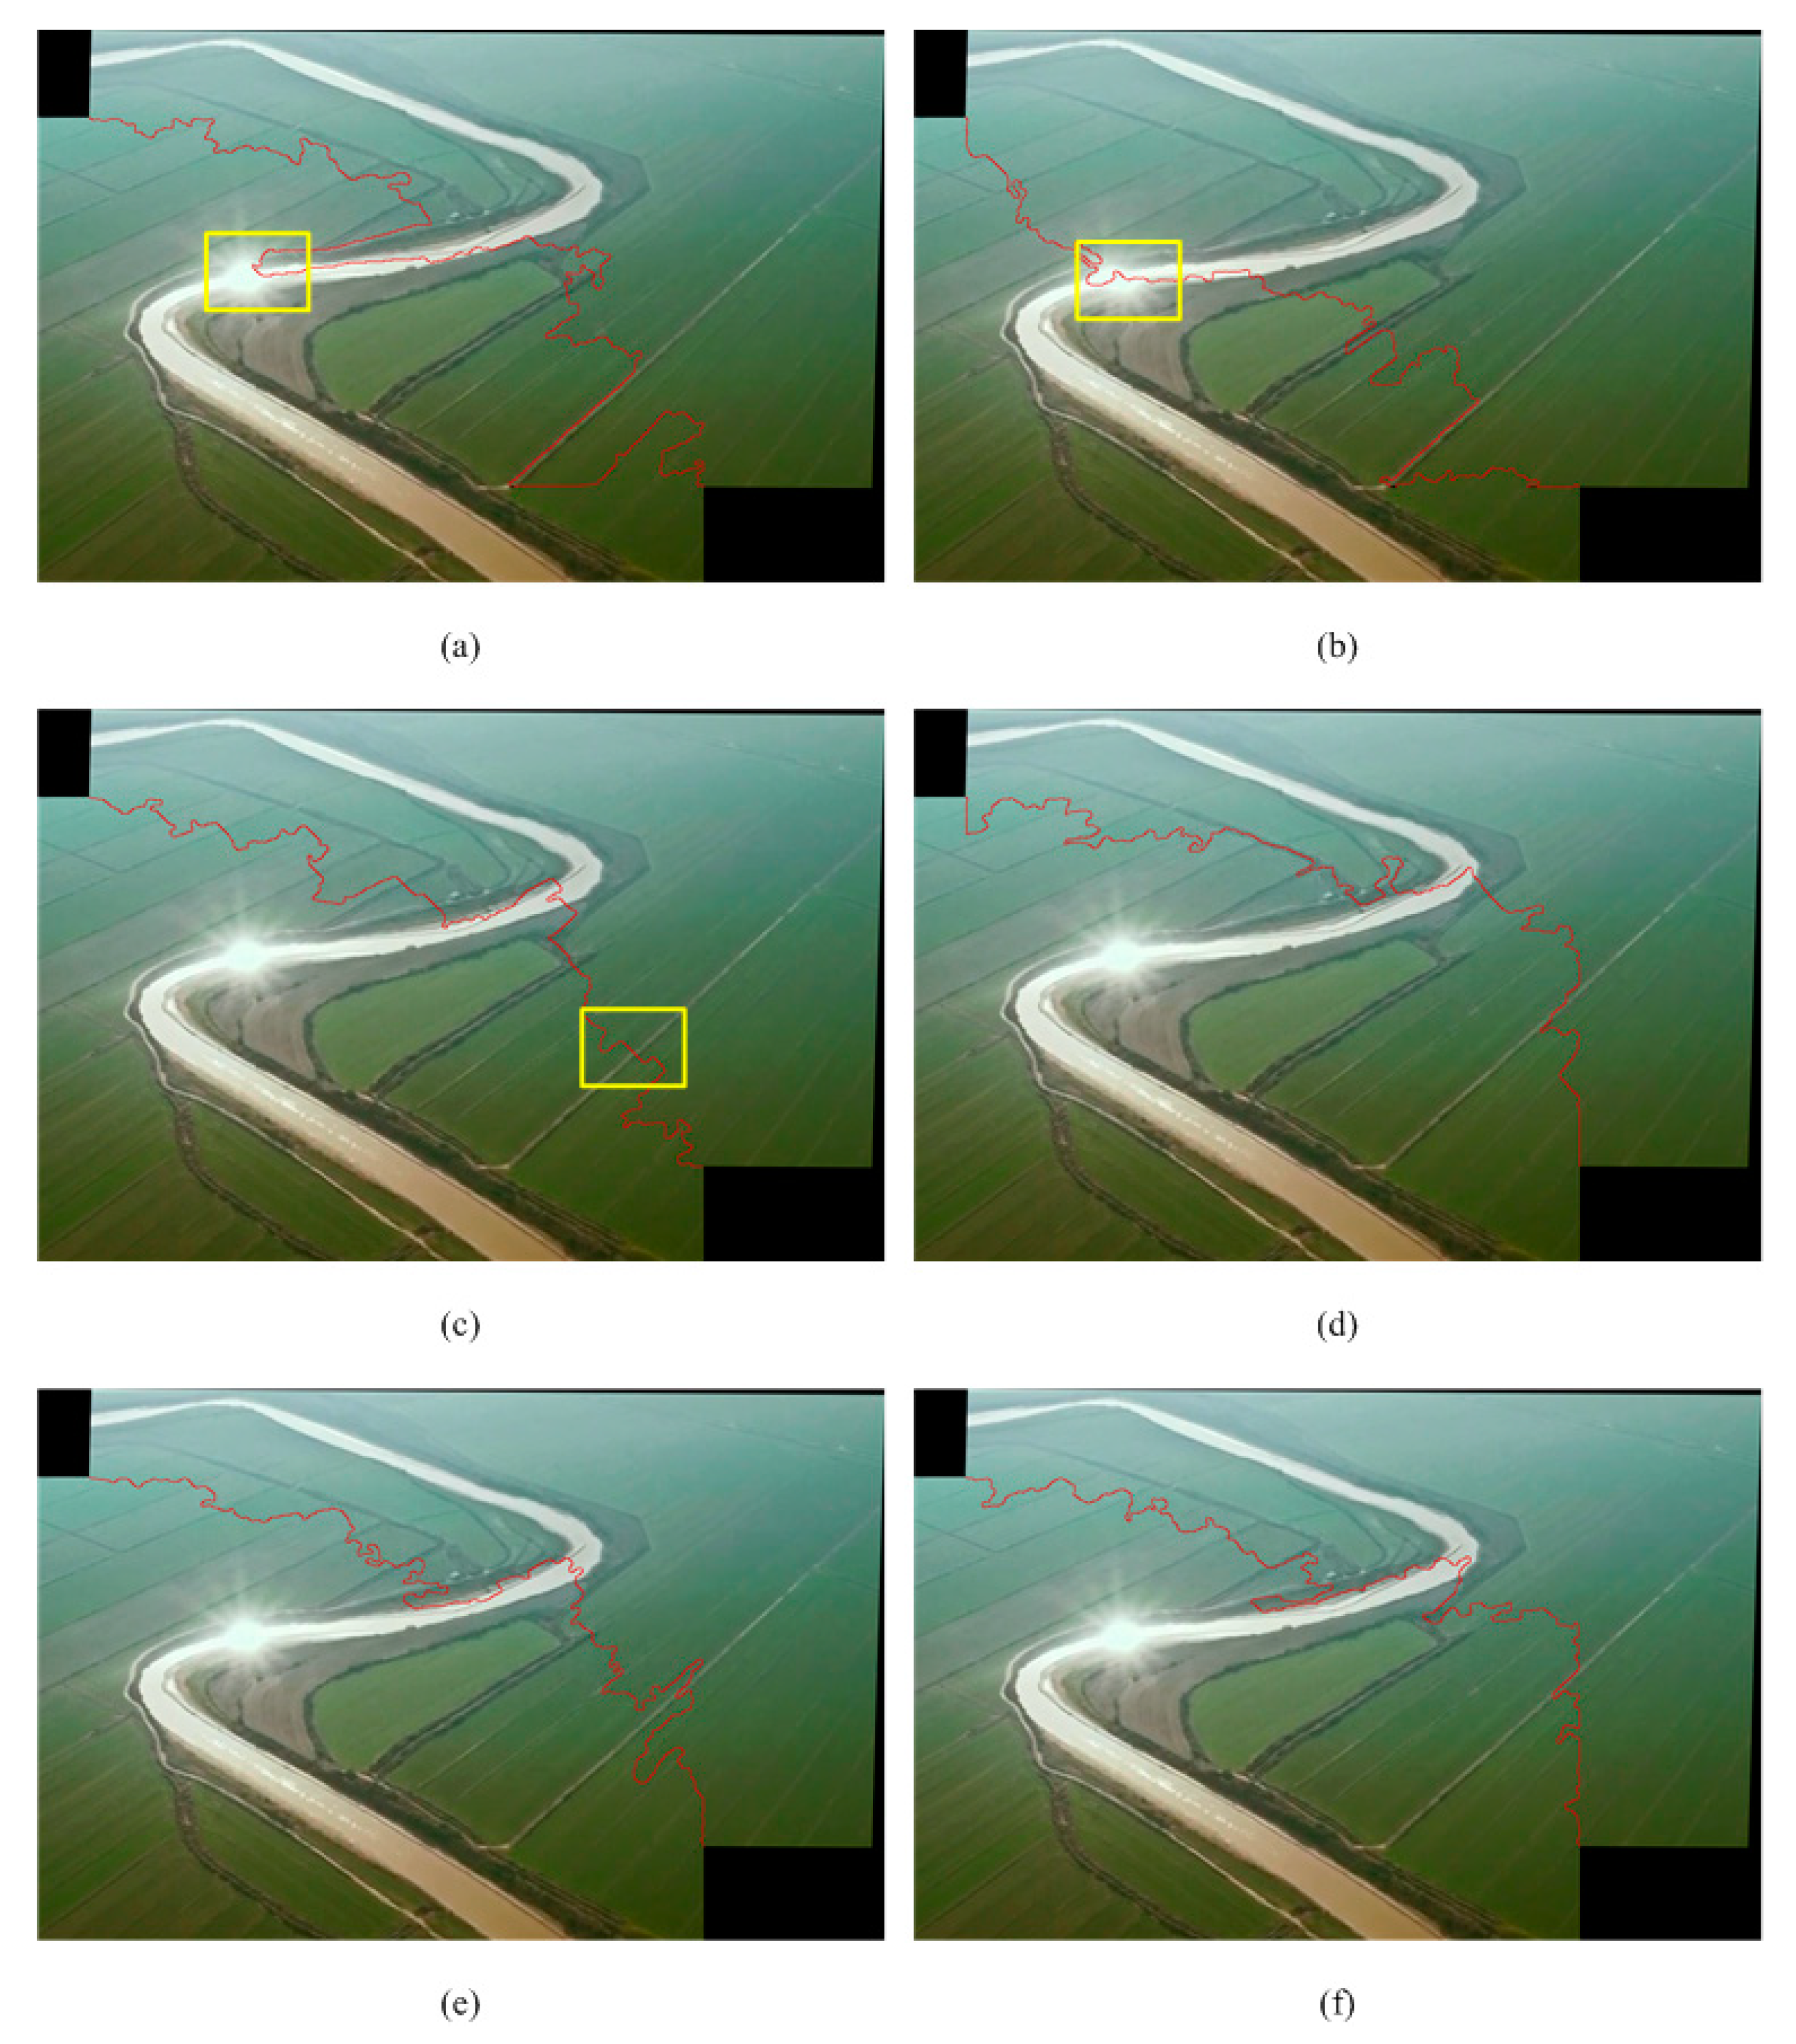
According to the table, the six mosaic images are visual pleasant even the high-saliency objects are cut through by stitch lines. That is because the objects are registered perfectly. However, in other cases, this kind of stitch lines may cause many unexpected effects (shown in Figure 6).
Figure 6 shows stitch lines using different combinations of visual properties. There are some unnatural edges caused by breaking the reflections of the sun in the rivers indicated by yellow boxes in Figure 6a,b. Due to the high saliency of the sun reflections, the stitch effects are poor. The dislocation in Figure 6c is also an unexpected item. Figure 6d–f are acceptable outcomes without generating broken strong edges. The evaluations of these images are listed in Table 4. Although indicators of (a), (b) and (c) are at a low level, they are unnatural mosaic images because some of detected edges are strong. According to the table, (d), (e) and (f) have similar performance.
4.3. Analysis
The experiment results show that our method can locate appropriate stitching lines based on HVS and blend input images commendably. The output mosaic images have less discontinuous edges and visible stitching-line pixels, with most of them located in low-saliency or masking areas where human eyes will ignore flaws. In our method, the combination of μ1, μ2, μ3, and μ4, is crucial for tracing the stitching line. Computing with a visual property alone is likely to produce obvious mosaic trace, but an appropriate combination of parameters can stitch images seamlessly by our technique. The weight map with parameter set 2 takes the impact of several HVS properties into consideration comprehensively and has a stable performance for photos taken in similar environments. If the average luminance difference of image pairs is significant, we can increase the value of μ2 so that we can make Equation (9) suit this situation.
5. Conclusions
This paper has presented a stitching method for generating mosaic images consistent with the human visual system. The value of influence on stitching effects is quantified based on models of HVS. This method can locate a stitching line by quantifying the visual perceptions in overlapping regions, avoiding pixels which can produce a strong response to the human eyes, and the multi-band blending scheme is applied for smooth transition at the stitching line. Visual non-linearity, luminance difference, visual masking property and visual saliency are used to represent human visual discrimination and attention, and the weight map obtained through the combination reflects the human eye’s perception of the image. Locating the stitching line in low-perception areas as much as possible can minimize the negative impact of discontinuities. To further prove the superiority of our proposed approach, we used images from the fields of architecture and remote sensing to compare our method with traditional methods. Experimental results show that the mosaic images processed by this method contain fewer detected stitching line and discontinuous edge pixels, which is more consistent with human visual perception. Different weight maps have a direct impact on the results. There are different situations in some applications, which may correspond to different optimal weight combinations. The quality of stitching images may be further improved if some deep-learning method is employed in the allocation of weights.
Author Contributions
Conceptualization, Z.S.; methodology, Q.C.; validation, Y.G.; writing—original draft preparation, Q.C.; formal analysis, P.W.; writing—review and editing, P.W. and Y.G.; project administration, Z.S.; funding acquisition, Z.S. All authors have read and agreed to the published version of the manuscript.
Funding
This research was supported by the National Natural Science Foundation of China under NO.61674115 and the National High Technology Research and Development Program of China under No.2012AA012705.
Conflicts of Interest
The authors declare no conflict of interest.
References
- Yu, L.; Holden, E.J.; Dentith, M.C.; Zhang, H. Towards the automatic selection of optimal seam line locations when merging optical remote-sensing images. Int. J. Remote Sens. 2012, 33, 1000–1014. [Google Scholar] [CrossRef]
- Kanazawa, Y.; Kanatani, K. Image mosaicing by stratified matching. Image Vis. Comput. 2004, 22, 93–103. [Google Scholar] [CrossRef]
- Brown, M.; Lowe, D.G. Automatic Panoramic Image Stitching using Invariant Features. Int. J. Comput. Vis. 2007, 74, 59–73. [Google Scholar] [CrossRef] [Green Version]
- Li, L.; Yao, J.; Lu, X.; Tu, J.; Shan, J. Optimal seamline detection for multiple image mosaicking via graph cuts. ISPRS J. Photogramm. Remote Sens. 2016, 113, 1–16. [Google Scholar] [CrossRef]
- Luo, T.; Shi, Z.; Wang, P. Robust and Efficient Corner Detector Using Non-Corners Exclusion. Appl. Sci. 2020, 10, 443. [Google Scholar] [CrossRef] [Green Version]
- Zhang, H.; Shi, Z.; Pang, K.; Cao, Q.; Luo, T.; Yao, S. Seam-based variable-step Bresenham blending method for real-time video mosaicking. J. Electron. Imaging 2016, 25, 12. [Google Scholar] [CrossRef]
- Milgram, D.L. Computer methods for creating photomosaics. IEEE Trans. Comput. 1975, 100, 1113–1119. [Google Scholar] [CrossRef]
- Kerschner, M. Seamline detection in colour orthoimage mosaicking by use of twin snakes. ISPRS J. Photogramm. Remote Sens. 2001, 56, 53–64. [Google Scholar] [CrossRef]
- Dijkstra, E.W. A note on two problems in connexion with graphs. Numer. Math. 1959, 1, 269–271. [Google Scholar] [CrossRef] [Green Version]
- Chon, J.; Kim, H.; Lin, C.S. Seam-line determination for image mosaicking: A technique minimizing the maximum local mismatch and the global cost. ISPRS J. Photogramm. Remote Sens. 2010, 65, 86–92. [Google Scholar] [CrossRef]
- Gao, J.; Li, Y.; Chin, T.J.; Brown, M.S. Seam-Driven Image Stitching. Eurographics 2013, 45–48. [Google Scholar]
- Zhang, W.; Guo, B.; Li, M.; Liao, X.; Li, W. Improved Seam-Line Searching Algorithm for UAV Image Mosaic with Optical Flow. Sensors 2018, 18, 1214. [Google Scholar] [CrossRef] [PubMed] [Green Version]
- Li, L.; Yao, J.; Liu, Y.; Yuan, W.; Shi, S.; Yuan, S. Optimal seamline detection for orthoimage mosaicking by combining deep convolutional neural network and graph cuts. Remote Sens. 2017, 9, 701. [Google Scholar] [CrossRef] [Green Version]
- Zhang, L.; Shen, Y.; Li, H. VSI: A visual saliency-induced index for perceptual image quality assessment. IEEE Trans. Image Process. 2014, 23, 4270–4281. [Google Scholar] [CrossRef] [Green Version]
- Shi, Z.; Chen, K.; Pang, K.; Zhang, J.; Cao, Q. A perceptual image quality index based on global and double-random window similarity. Digit. Signal Process. 2017, 60, 277–286. [Google Scholar] [CrossRef]
- Li, N.; Liao, T.; Wang, C. Perception-based seam cutting for image stitching. Signal Image Video Process. 2018, 12, 967–974. [Google Scholar] [CrossRef]
- Awrangjeb, M.; Lu, G. An Improved Curvature Scale-Space Corner Detector and a Robust Corner Matching Approach for Transformed Image Identification. IEEE Trans. Image Process. 2008, 17, 2425–2441. [Google Scholar] [CrossRef]
- Miao, Z.; Jiang, X.; Yap, K.H. Contrast Invariant Interest Point Detection by Zero-Norm LoG Filter. IEEE Trans. Image Process. 2016, 25, 331–342. [Google Scholar] [CrossRef]
- Zhang, W.; Shui, P. Contour-based corner detection via angle difference of principal directions of anisotropic Gaussian directional derivatives. Pattern Recognit. 2015, 48, 2785–2797. [Google Scholar] [CrossRef]
- Lowe, D.G. Object recognition from local scale-invariant features. IEEE Int. Conf. Comput. Vis. 1999, 2, 1150–1157. [Google Scholar]
- Lowe, D.G. Distinctive Image Features from Scale-Invariant Keypoints. Int. J. Comput. Vis. 2004, 60, 91–110. [Google Scholar] [CrossRef]
- Rousseeuw, P.J.; Leroy, A.M. Robust Regression and Outlier Detection; Wiley: New York, NY, USA, 1987. [Google Scholar]
- Fischler, M.A.; Bolles, R.C. Random Sample Consensus: A Paradigm for Model Fitting with Applications to Image Analysis and Automated Cartography. Commun. ACM 1981, 24, 381–395. [Google Scholar] [CrossRef]
- Zhou, Q. Automatic orthorectification and mosaicking of oblique images from a zoom lens aerial camera. Opt. Eng. 2015, 54, 013104. [Google Scholar] [CrossRef]
- Sawhney, H.S.; Kumar, R. True multi-image alignment and its application to mosaicing and lens distortion correction. IEEE Trans. Pattern Anal. Mach. Intell. 1999, 21, 235–243. [Google Scholar] [CrossRef]
- Elibol, A.; Kim, J.; Gracias, N.; Garcia, R. Efficient image mosaicing for multi-robot visual underwater mapping. Pattern Recognit. Lett. 2014, 46, 20–26. [Google Scholar] [CrossRef]
- Seron, F.J.; Gutierrez, D.; Gutierrez, G.; Cerezo, E. Implementation of a method of curved ray tracing for inhomogeneous atmospheres. Comput. Graph. UK 2005, 29, 95–108. [Google Scholar] [CrossRef]
- Tang, Z.; Zheng, Y.; Gu, K.; Liao, K.; Wang, W.; Yu, M. Full-Reference Image Quality Assessment by Combining Features in Spatial and Frequency Domains. IEEE Trans. Pattern Anal. Mach. Intell. 2019, 65, 138–151. [Google Scholar] [CrossRef]
- Agaoglu, S.; Agaoglu, M.N.; Breitmeyer, B.; Ogmen, H. A statistical perspective to visual masking. Vis. Res. 2015, 115, 23–39. [Google Scholar] [CrossRef]
- Goodhew, S.C.; Dux, P.E.; Lipp, O.V.; Visser, T.A. Understanding recovery from object substitution masking. Cognition 2012, 122, 405–415. [Google Scholar] [CrossRef]
- Dehaene, S. The neural basis of the Weber–Fechner law: A logarithmic mental number line. Trends Cogn. Sci. 2003, 7, 145–147. [Google Scholar] [CrossRef]
- Sun, J.Z.; Wang, G.I.; Goyal, V.K.; Varshney, L.R. A framework for Bayesian optimality of psychophysical laws. J. Math. Psychol. 2012, 56, 495–501. [Google Scholar] [CrossRef]
- Itti, L.; Koch, C.; Niebur, E. A Model of Saliency-Based Visual Attention for Rapid Scene Analysis. IEEE Trans. Pattern Anal. Mach. Intell. 1998, 20, 1254–1259. [Google Scholar] [CrossRef] [Green Version]
- Zhang, L.; Gu, Z.; Li, H. SDSP: A novel saliency detection method by combining simple priors. In Proceedings of the 20th IEEE International Conference on Image Processing, Melbourne, Australia, 15–18 September 2013. [Google Scholar]
- Treisman, A.M.; Gelade, G. A feature-integration theory of attention. Cogn. Psychol. 1980, 12, 97–136. [Google Scholar] [CrossRef]
- Liu, M.N.; Yang, X. Image quality assessment using contourlet transform. Opt. Eng. 2009, 48, 107201. [Google Scholar] [CrossRef]
Figure 1.
Flow of the proposed method.

Figure 2.
The results with different human visual system (HVS) properties. (a) Stitched image after affine transformation; (b) image just with visual non-linearity (VN); (c) image just with luminance difference (LD); (d) image just with visual masking property (VM); (e) image just with visual saliency (VS); (f) image with the integral HVS.

Figure 3.
Mosaic images obtained from different methods. (a) Directly seamed at image boundaries; (b) directly seamed with multi-band blending; (c) detected the stitching line; (d) result of the proposed method.
Figure 3.
Mosaic images obtained from different methods. (a) Directly seamed at image boundaries; (b) directly seamed with multi-band blending; (c) detected the stitching line; (d) result of the proposed method.

Figure 4.
Mosaic images obtained from different methods. (a) Directly seamed at image boundaries; (b) directly seamed with multi-band blending; (c) detected stitching line; (d) stitch result of proposed method.
Figure 4.
Mosaic images obtained from different methods. (a) Directly seamed at image boundaries; (b) directly seamed with multi-band blending; (c) detected stitching line; (d) stitch result of proposed method.

Figure 5.
The stitch line results with different weight map: (a) VN, (b) LD, (c) VM, (d) VS, (e) WM with parameter set 0.1, 0.2, 0.2, 0.5, and (f) 0.1, 0.1, 0.25, 0.55.
Figure 5.
The stitch line results with different weight map: (a) VN, (b) LD, (c) VM, (d) VS, (e) WM with parameter set 0.1, 0.2, 0.2, 0.5, and (f) 0.1, 0.1, 0.25, 0.55.

Figure 6.
The stitch line results with different weight map: (a) VN, (b) LD, (c) VM, (d) VS, (e) WM with parameters 0.1, 0.2, 0.2, 0.5, and (f) 0.1, 0.1, 0.25, 0.55.
Figure 6.
The stitch line results with different weight map: (a) VN, (b) LD, (c) VM, (d) VS, (e) WM with parameters 0.1, 0.2, 0.2, 0.5, and (f) 0.1, 0.1, 0.25, 0.55.

Figure 7.
Evaluations of fusion effects of white building pictures in two experiments (DS (directly seamed); MB (multi-band blending)). (a) N with σ = 0.01, (b) N with σ = 1, (c) P with σ = 0.01, and (d) P with σ = 1.
Figure 7.
Evaluations of fusion effects of white building pictures in two experiments (DS (directly seamed); MB (multi-band blending)). (a) N with σ = 0.01, (b) N with σ = 1, (c) P with σ = 0.01, and (d) P with σ = 1.

Figure 8.
Evaluations of fusion effects of river pictures in two experiments. (a) N with σ = 0.01, (b) N with σ = 1, (c) P with σ = 0.01, and (d) P with σ = 1.
Figure 8.
Evaluations of fusion effects of river pictures in two experiments. (a) N with σ = 0.01, (b) N with σ = 1, (c) P with σ = 0.01, and (d) P with σ = 1.


Table 1.
Evaluations of fusion effects in Figure 3.
Table 1.
Evaluations of fusion effects in Figure 3.
| No. of Images | Canny (σ = 0.01) | Canny (σ = 1) | ||
|---|---|---|---|---|
| N | P | N | P | |
| a | 880 | 0.8943 | 149 | 0.1514 |
| b | 559 | 0.5681 | 124 | 0.1260 |
| d | 268 | 0.1682 | 73 | 0.0458 |
Table 2.
Evaluations of fusion effects in Figure 4.
Table 2.
Evaluations of fusion effects in Figure 4.
| No. of Images | Canny (σ = 0.01) | Canny (σ = 1) | ||
|---|---|---|---|---|
| N | P | N | P | |
| a | 722 | 0.7490 | 306 | 0.3174 |
| b | 415 | 0.4305 | 157 | 0.1629 |
| d | 285 | 0.1495 | 101 | 0.0530 |
Table 3.
Evaluations of fusion effects in Figure 5.
Table 3.
Evaluations of fusion effects in Figure 5.
| No. of Images | Weight Map | Canny (σ = 0.01) | Canny (σ = 1) | ||
|---|---|---|---|---|---|
| N | P | N | P | ||
| a | VN | 339 | 0.2180 | 98 | 0.0630 |
| b | LD | 297 | 0.1820 | 60 | 0.0368 |
| c | VM | 252 | 0.1622 | 49 | 0.0315 |
| d | VS | 286 | 0.1974 | 60 | 0.0414 |
| e | parameter set 1 | 334 | 0.1742 | 63 | 0.0329 |
| f | parameter set 2 | 268 | 0.1682 | 73 | 0.0458 |
Table 4.
Evaluations of fusion effects in Figure 6.
Table 4.
Evaluations of fusion effects in Figure 6.
| No. of Images | Weight Map | Canny (σ = 0.01) | Canny (σ = 1) | ||
|---|---|---|---|---|---|
| N | P | N | P | ||
| a | VN | 297 | 0.1250 | 96 | 0.0404 |
| b | LD | 222 | 0.1278 | 110 | 0.0633 |
| c | VM | 256 | 0.1590 | 64 | 0.0398 |
| d | VS | 233 | 0.1356 | 85 | 0.0495 |
| e | parameter set 1 | 285 | 0.1495 | 101 | 0.0530 |
| f | parameter set 2 | 274 | 0.1443 | 102 | 0.0537 |
© 2020 by the authors. Licensee MDPI, Basel, Switzerland. This article is an open access article distributed under the terms and conditions of the Creative Commons Attribution (CC BY) license (http://creativecommons.org/licenses/by/4.0/).
Share and Cite
MDPI and ACS Style
Cao, Q.; Shi, Z.; Wang, P.; Gao, Y. A Seamless Image-Stitching Method Based on Human Visual Discrimination and Attention. Appl. Sci. 2020, 10, 1462. https://doi.org/10.3390/app10041462
AMA Style
Cao Q, Shi Z, Wang P, Gao Y. A Seamless Image-Stitching Method Based on Human Visual Discrimination and Attention. Applied Sciences. 2020; 10(4):1462. https://doi.org/10.3390/app10041462
Chicago/Turabian StyleCao, Qingjie, Zaifeng Shi, Pumeng Wang, and Yang Gao. 2020. "A Seamless Image-Stitching Method Based on Human Visual Discrimination and Attention" Applied Sciences 10, no. 4: 1462. https://doi.org/10.3390/app10041462
Note that from the first issue of 2016, this journal uses article numbers instead of page numbers. See further details here.