Feasibility Study for Spatial Distribution of Diesel Oil in Contaminated Soils by Laser Induced Fluorescence


1
Institute of Advanced Manufacturing Engineering, Hefei University, Hefei 230601, China
2
University of Science and Technology of China, Hefei 230026, China
*
Author to whom correspondence should be addressed.
Appl. Sci. 2020, 10(3), 1103; https://doi.org/10.3390/app10031103
Submission received: 15 January 2020
/
Revised: 24 January 2020
/
Accepted: 3 February 2020
/
Published: 7 February 2020
(This article belongs to the Special Issue Advanced Remote Sensing Technologies for Disaster Monitoring)
Abstract
:Featured Application
Fast Sensing Technologies for Disaster Monitoring.
Abstract
Laser induced fluorescence (LIF) technique has been demonstrated as a powerful technology for analyzing the contamination of petroleum due to its excellent attributes of rapid analysis speed and slight sample preparation. This study focuses on the monitoring application of LIF in petroleum hydrocarbon-contaminated soils by establishing the three-dimensional diffusion models. In this paper, to improve the analysis accuracy, the effects of soil matrix difference for fluorescence intensities were considered. In order to validate the practicability of LIF, the longitudinal penetration laws and the lateral diffusion laws of diesel oil in different humidity soils were analyzed. These laws indicate that the longitudinal penetration depth decreases and the lateral diffusion range increases with the increase of soil moisture. Then, the three-dimensional diffusion models were established, the relative standard deviation (RSD) of the predictions for diesel oil in different soil moisture are 5.09%, 9.62%, 7.92%, and the contaminated volumes of soils by diesel oil are 233.90 cm3, 332.70 cm3, and 660.05 cm3, respectively. These results express that the soil moisture extends the extent of diesel-contaminated soils. The present work shows the feasibility of LIF technique for the field monitoring of petroleum.
1. Introduction
Due to the high-speed economic development and energy shortage, petroleum gradually occupies an important role in modern society. The total output of petroleum is about 4.45 billion tons across the world nowadays, and it has come to be used for more and more fields [1,2]. In the process of exploitation, transportation, and production of petroleum, a large amount of petroleum will be spilled into the surrounding soils. Petroleum in soils has a significant impact on health through the bioaccumulation in the food chain [3]. This problem of environmental pollution brings huge challenges to the sustainable development of our economy. Therefore the study of rapid and in-site detection technique of petroleum pollutions in soils has become crucial to environmental monitoring.
Molecules are useful platforms to detect phenomena at quantum-projection-limited precision [4]. In the molecular techniques, laser induced fluorescence (LIF) spectroscopy technique is a rapid and sensitive method for the analysis of organic materials based on their characteristics of fluorescence spectra emitted by fluorophores [5]. The macromolecular organic compounds in petroleum hydrocarbons, benzene series in polycyclic aromatic hydrocarbons and organophosphorus in pesticides can emit fluorescence under ultraviolet pulse laser irradiation [6]. The fluorescence spectra can be used to analyze the structure and characteristics of materials. This technique has been widely applied in a variety of fields in recent years, such as biological detection, environmental detection, energy exploration, petrochemical production, etc. [7,8,9].
Recently, many researchers have focused on the application of LIF in organic constituents and quantitative analysis [10,11,12]. Cazorla et al. [13] used an airborne LIF instrument for measuring the gas-phase formaldehyde, and the accuracy of quantitative analysis for reporting mixing ratios was raised to ±10%. Baburaj et al. [14] used LIF technique to detect coral bleaching by researching the variations of laser induced fluorescence spectral signatures in coral and proved that the average fluorescence intensity ratio values were different at different temperature. Honza et al. [15] utilized LIF technique as a tool for imaging the flame of sulfur dioxide and visualized the development of the early flame kernel by the combination of SO2- and OH-PLIF (Planar Laser Induced Fluorescence) setup. Bardi et al. [16] focused on the use of LIF technique to quantitative analyze the preferential evaporation of fuel at engine relevant conditions.
However, due to the complicated matrixes of soils, it is hard to use the same calibration curve to predict the concentrations of diesel oil in soils. The soils near the gas stations or on both sides of the roads are most vulnerable to be polluted by petroleum in their transportation or on traffic accidents. The physical characteristics of the above-mentioned soils are quite unified and the contents of soil moisture are relatively low, the diffusion of petroleum in soils can be assumed as symmetrical, therefore the content distribution of petroleum can be calculated by the fluorescence detection of the surface and one vertical section. To date, the LIF technique has already been used as a measuring tool for content distributions of materials [17,18]. Hayashi et al. [19] used LIF to analyze the distribution law of polynuclear aromatic hydrocarbons in radial direction from the central axis at the processes of soot formation. Wang et al. [20] applied LIF to investigate the combustion efficiency and combustion phasing of fuel in different zones of an engine.
The objective of this paper is to obtain the diffusion regularity of diesel oil in soils, we report the horizontal and vertical diffusion laws of diesel oil in different humidity soils by the application of LIF technique. The effects of soil moisture are discussed. Then, the three-dimensional diffusion models are established and discussed, highlighting the prediction accuracies from using the proposed three-dimensional diffusion models.
2. Experimental Methods
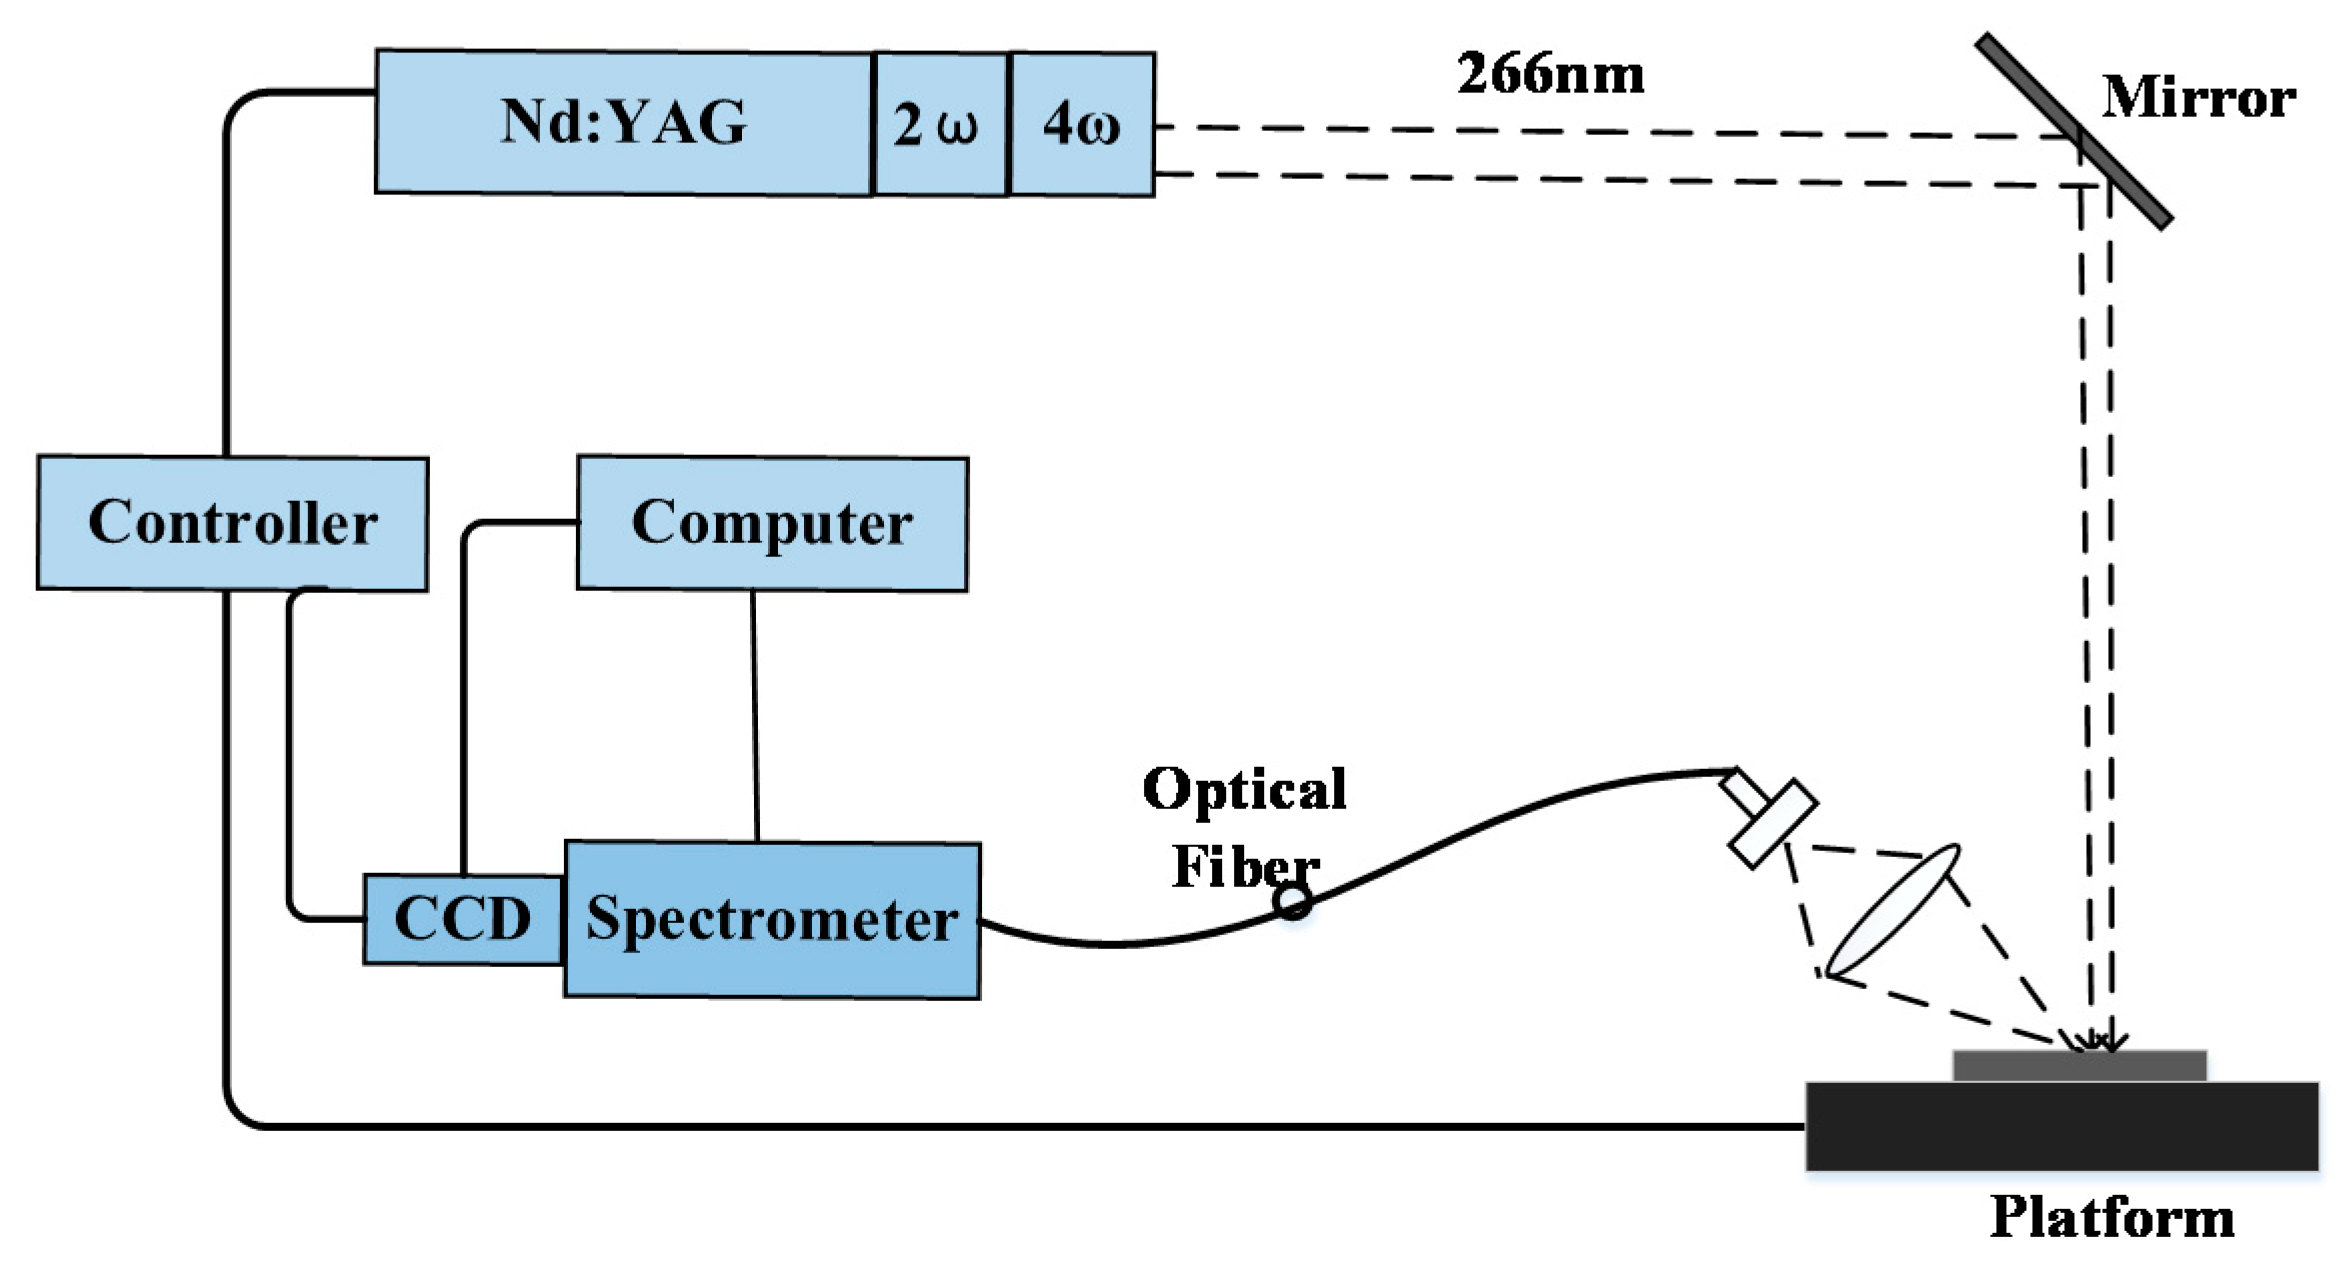
The schematic diagram of the LIF setup is presented in Figure 1. A Q-switched Nd: YAG laser (Quantel, Q-Smart 850) emitting at 266 nm with an output power of 30 mJ/pulse was used as the excitation source and the repetition rate of the laser is 1 Hz. The pulse laser beam irradiated onto the soil surface perpendicularly and a plano-convex quartz lens with a 50 mm focal length was used for focusing the fluorescence spectra. The fluorescence spectrum was collected by a 1 m long fiber optic which central fiber is 800 m diameter, each spectrum detected by a grating spectrometer (Ocean, Maya-2000pro) and recorded by a computer. The spectrometer covered an overall range 200 nm-1100 nm with a spectral resolution of 1.1 nm. The soil samples were placed on a rotary platform which was synchronized rotation with the pulse laser to avoid the inhomogeneity of spectral detection.
Soil samples were collected from the both sides of a national highway with a depth of 20–30 cm and all sampling points are yellowish red soil. All of the collected samples were dried, grinded, and sieved through 100-mesh to remove roots, then they were measured by gas chromatography to choose the one without petroleum hydrocarbons as the experimental matrix. In order to obtain the diffusion regularity of diesel oil in soils, the experiments were divided into two sets of experiments, and to imitate the actual soil conditions, we impacted the soils by a hydraulic press. Firstly, for the quantitative analysis experiments, ten dried soil samples were prepared by mixing different concentrations of diesel oil and the concentrations are 0.5%, 1%, 1.5%, 2%, 2.5%, 3%, 3.5%, 4%, 4.5%, and 5%. Secondly, for the three-dimensional diffusion analysis, several samples with different gravimetric soil moisture ranging from 0% to 25% were prepared, then 5.3 g diesel oil was quickly dropped on three soil samples with gravimetric moisture of 0%, 5%, and 10% by a pipette, and the density of the soils is about 2 g per cubic centimeter.
For improving the stability of the LIF spectra, each measured spectrum was the accumulation of 40 laser shots at different locations of the same soil sample every sample was detected 5 times under the same conditions to confirm the experimental reproducibility.
3. Results and Discussion
3.1. Quantitative Analysis
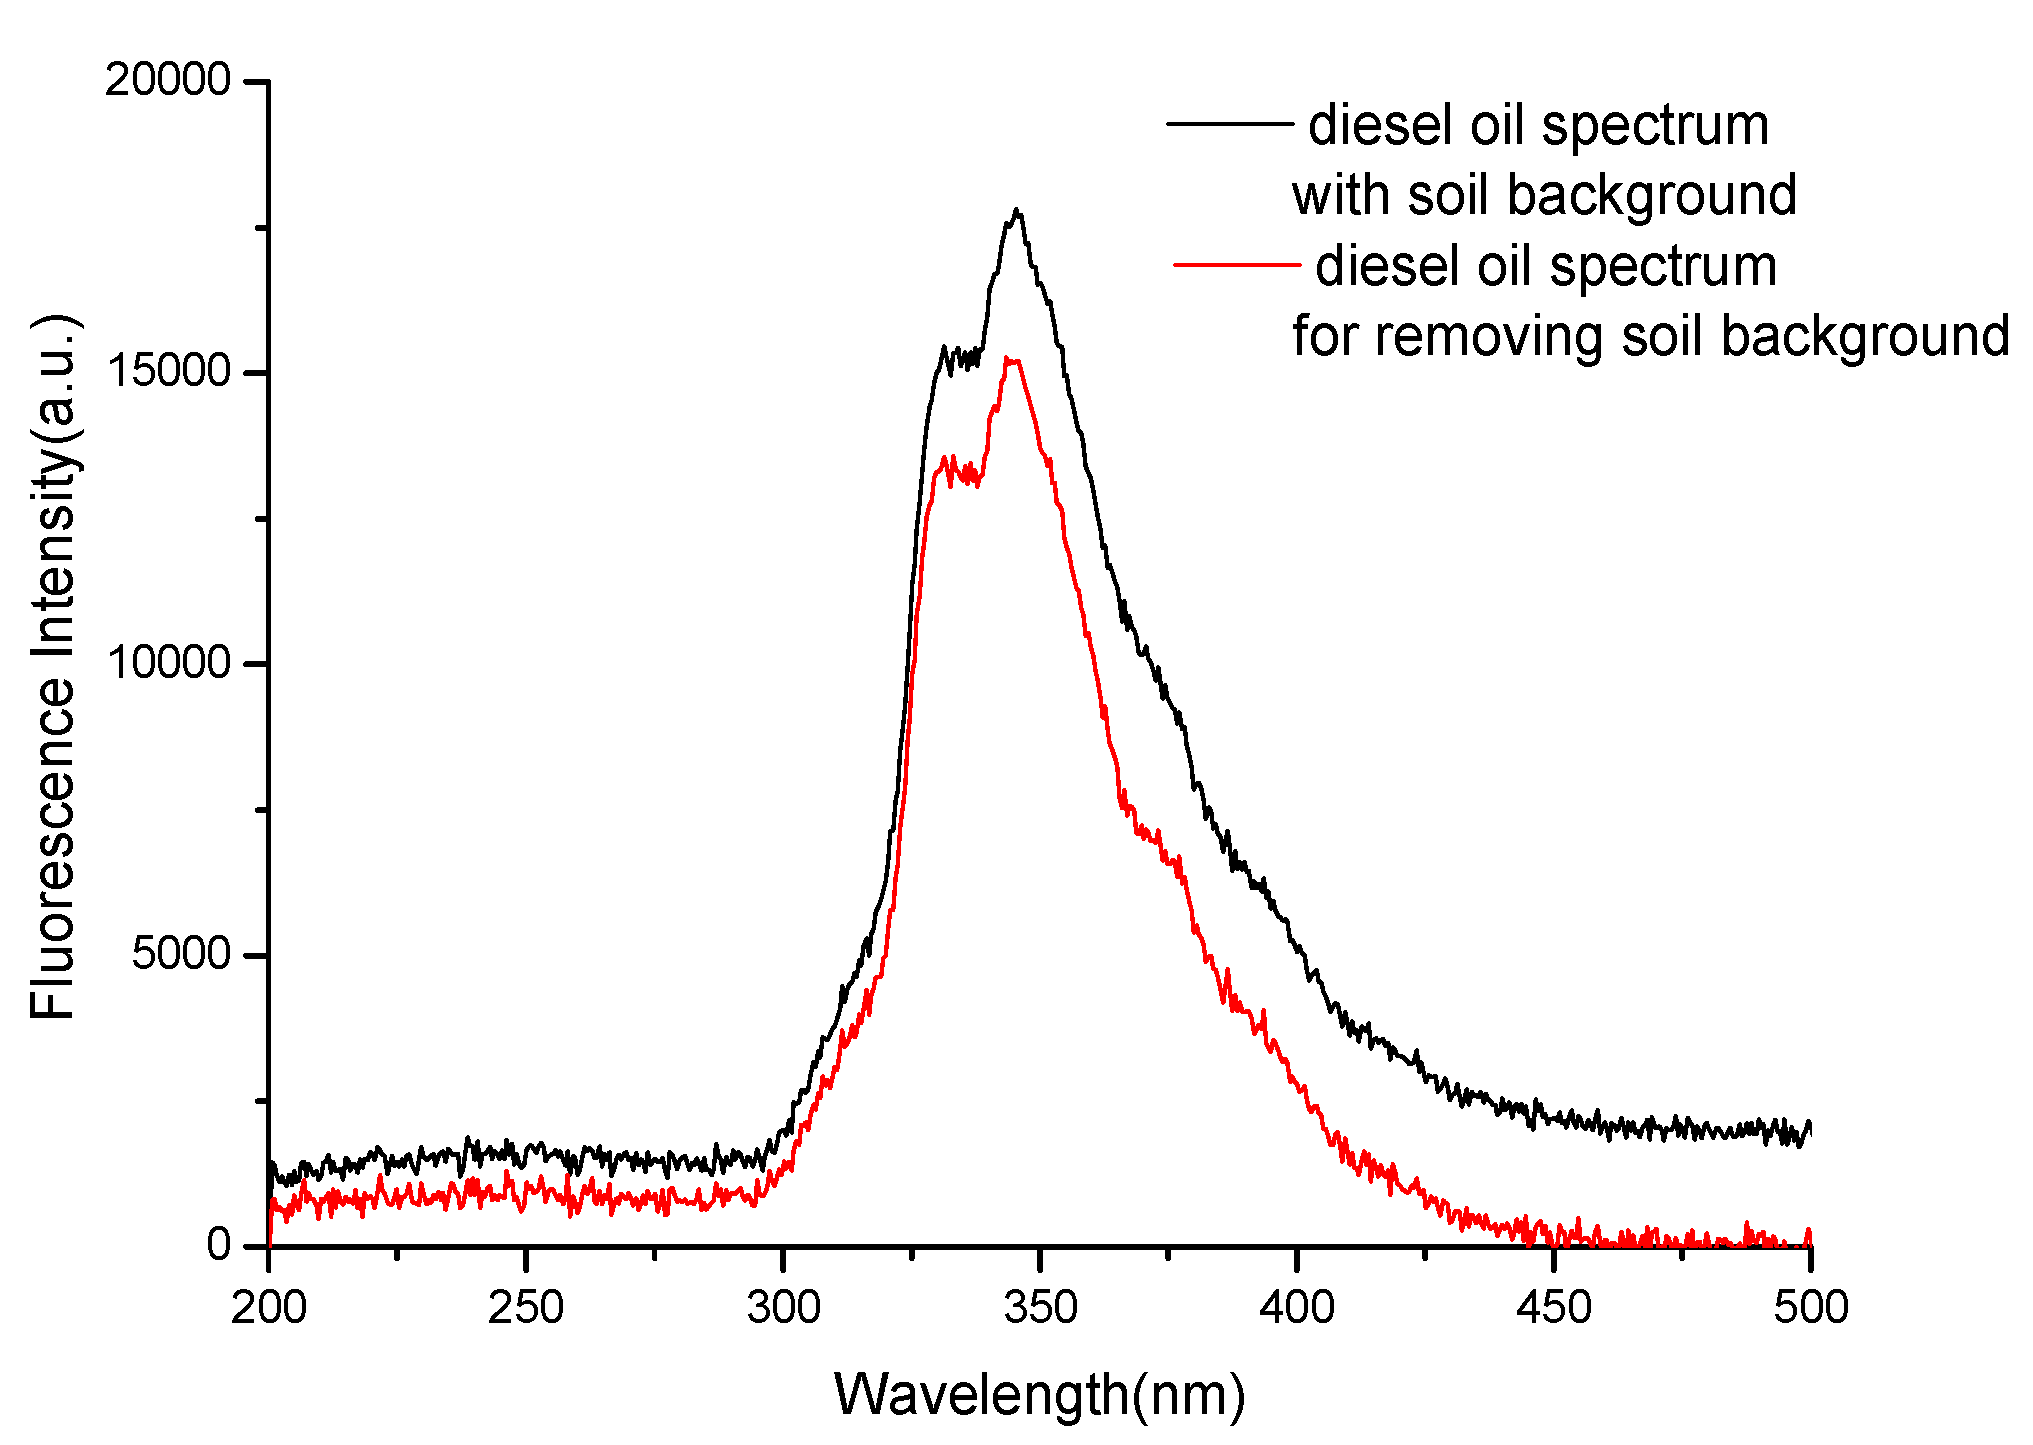
In the first set of experiments, the fluorescence spectra for a set of soil samples prepared as described in the previous section were detected. The typical fluorescence spectra of diesel oil before and after preprocessing by baseline correction are shown in Figure 2. One can observe from Figure 2 that the fluorescence peak of diesel oil is significantly influenced by the soil organic matter, polycyclic aromatic hydrocarbons, and so on. In order to eliminate the influence of fluorescence spectra by soil background, the data that follows in this paper are all the fluorescence spectra of diesel oil for removing soil background.
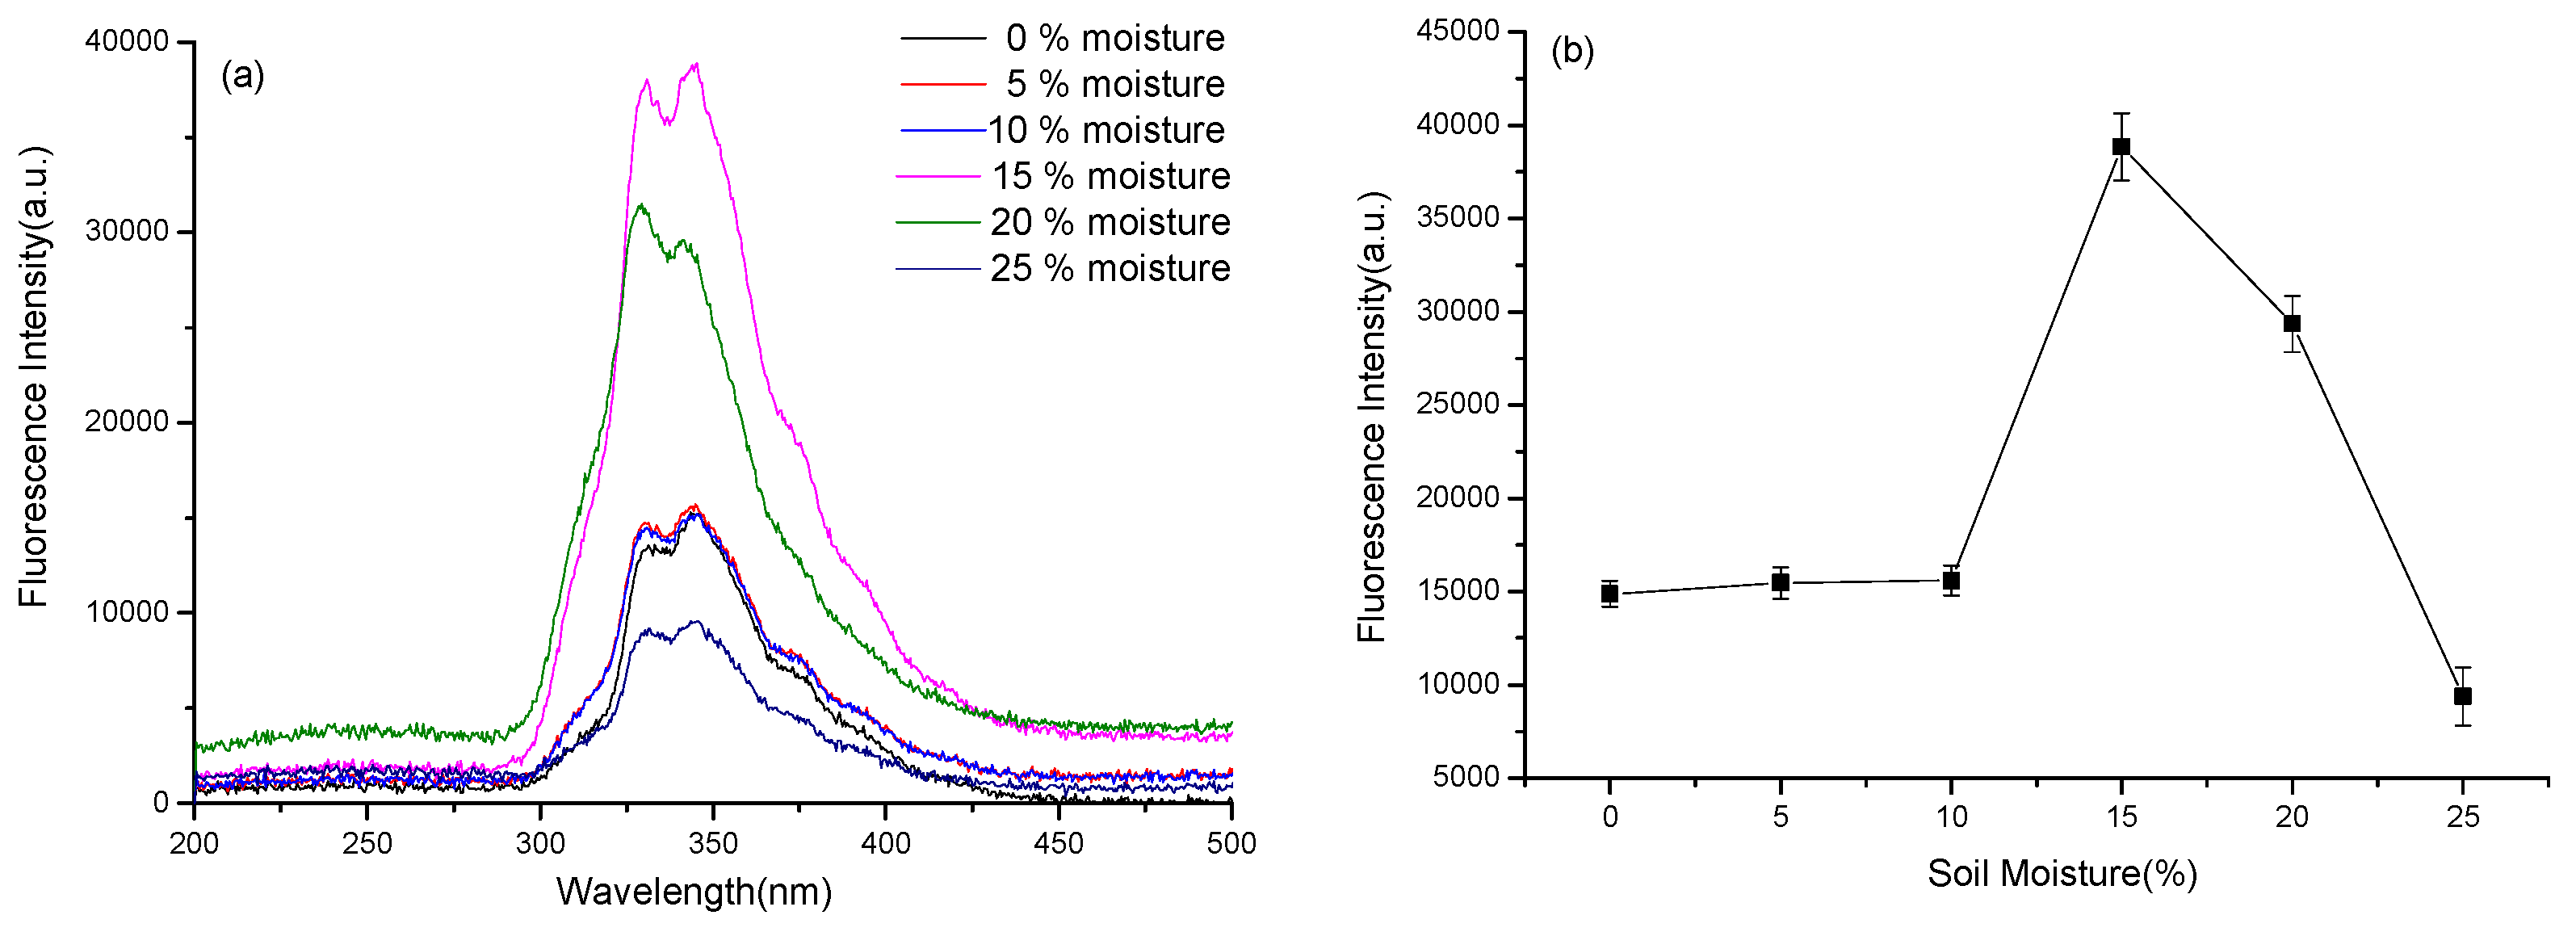
Figure 3 shows the fluorescence spectra of diesel oil and the change rule of fluorescence intensity in different soil moisture with the concentration of 0.5%. Five measured spectra for each sample were averaged into an analytical spectrum. As shown in Figure 3, the fluorescence intensity change of diesel oil is smaller when the percentage of soil moisture content is between 0% to 10%, and the fluorescence intensity of diesel oil changes greatly with the increasing of soil moisture, the deviation of multiple measurements also increases. This may be due to the changes of the fluorescence emission efficiency in different soil moisture, therefore the analysis of fluorescence spectra should consider the soil moisture content. The soils beside the roads or near gas stations are the hot spots of diesel oil spilled and the soils are usually dry, so in the following analytical process, all the soil samples were in low relative soil moisture.
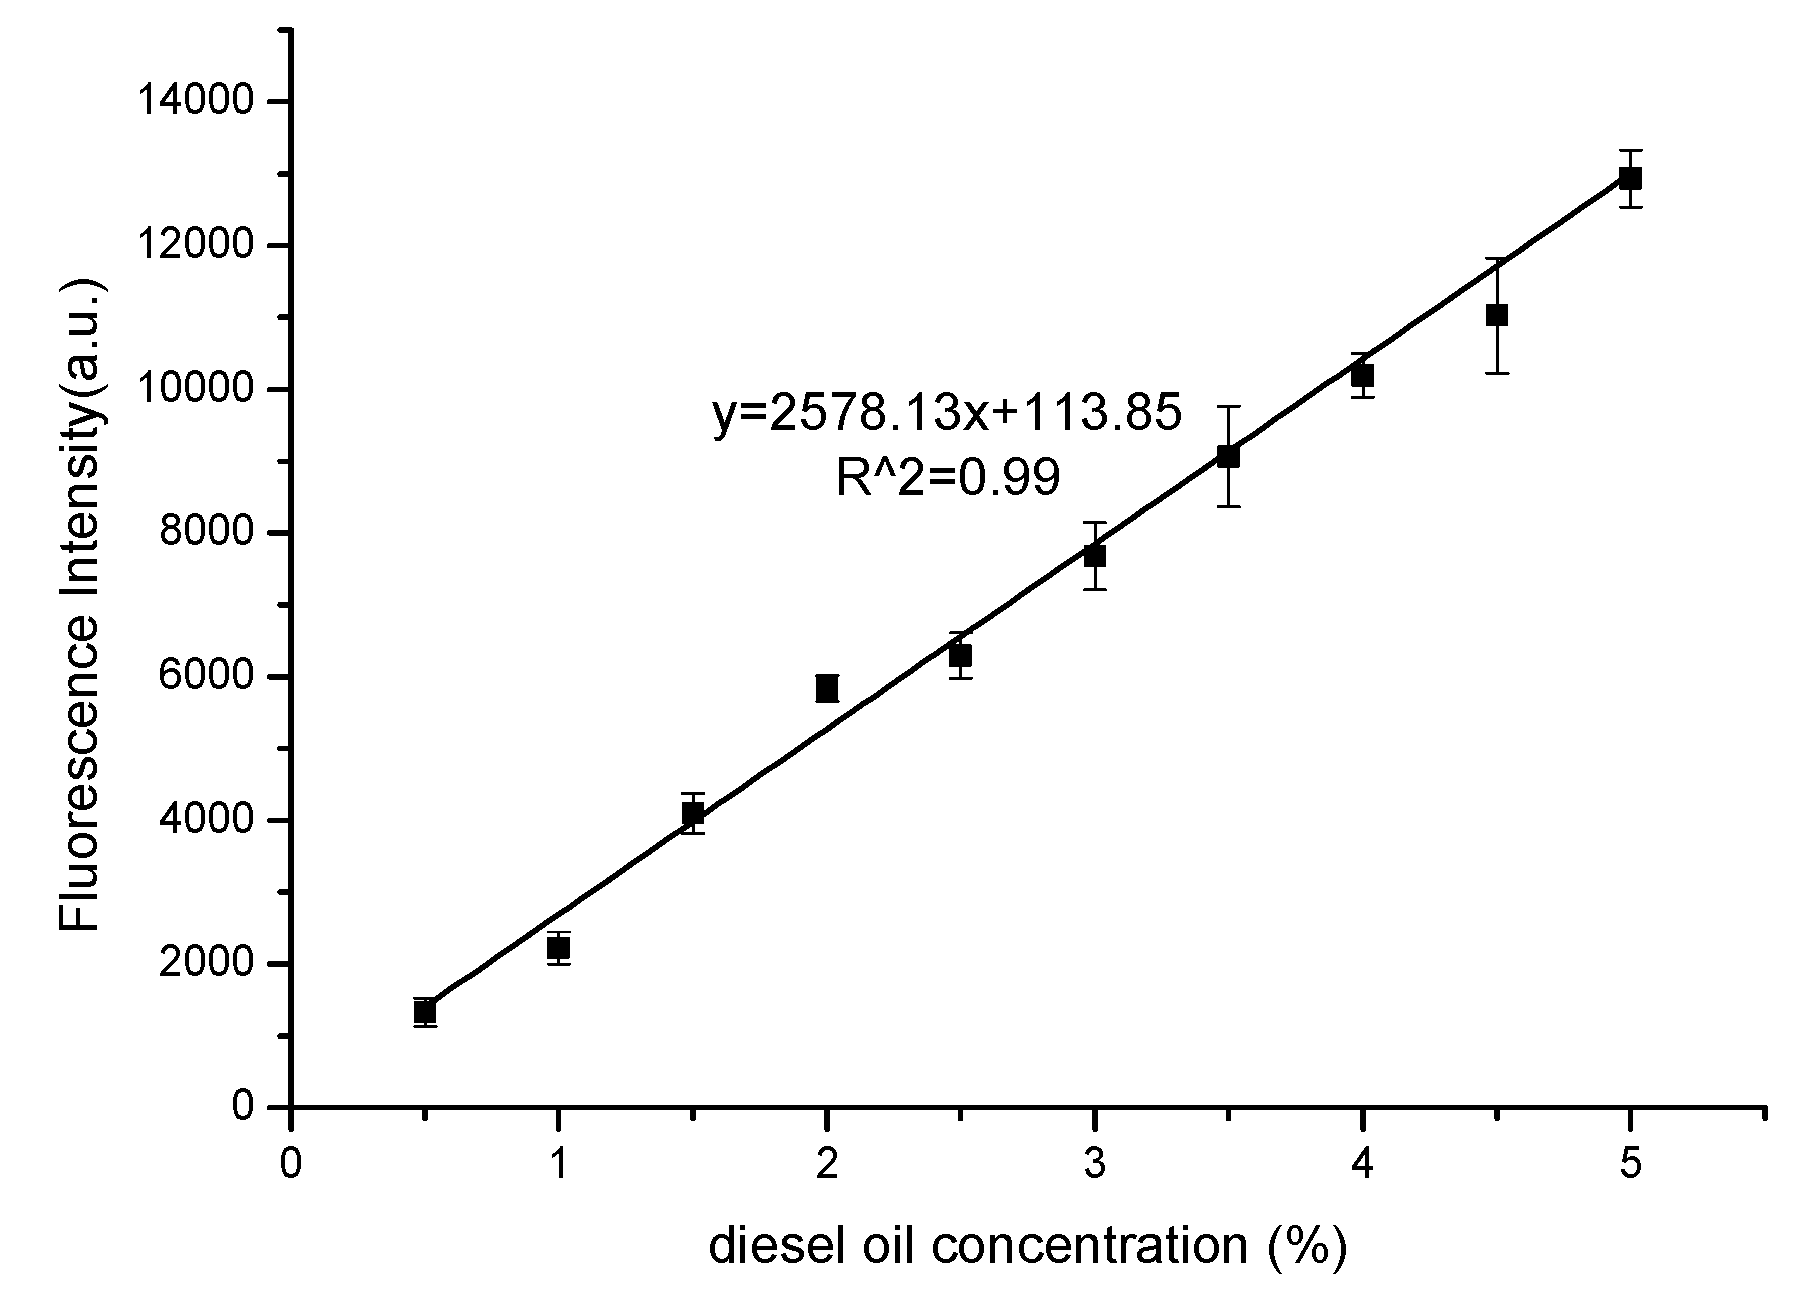
The calibration curve between the fluorescence peak intensities of diesel oil and the known concentrations of the diesel oil are shown in Figure 4. It notes that the square correlation coefficient value is 0.99, which verifies that the fluorescence peak intensity of diesel oil can be used to predict the concentration of diesel oil in soils.
3.2. Three-Dimensional Diffusion Models
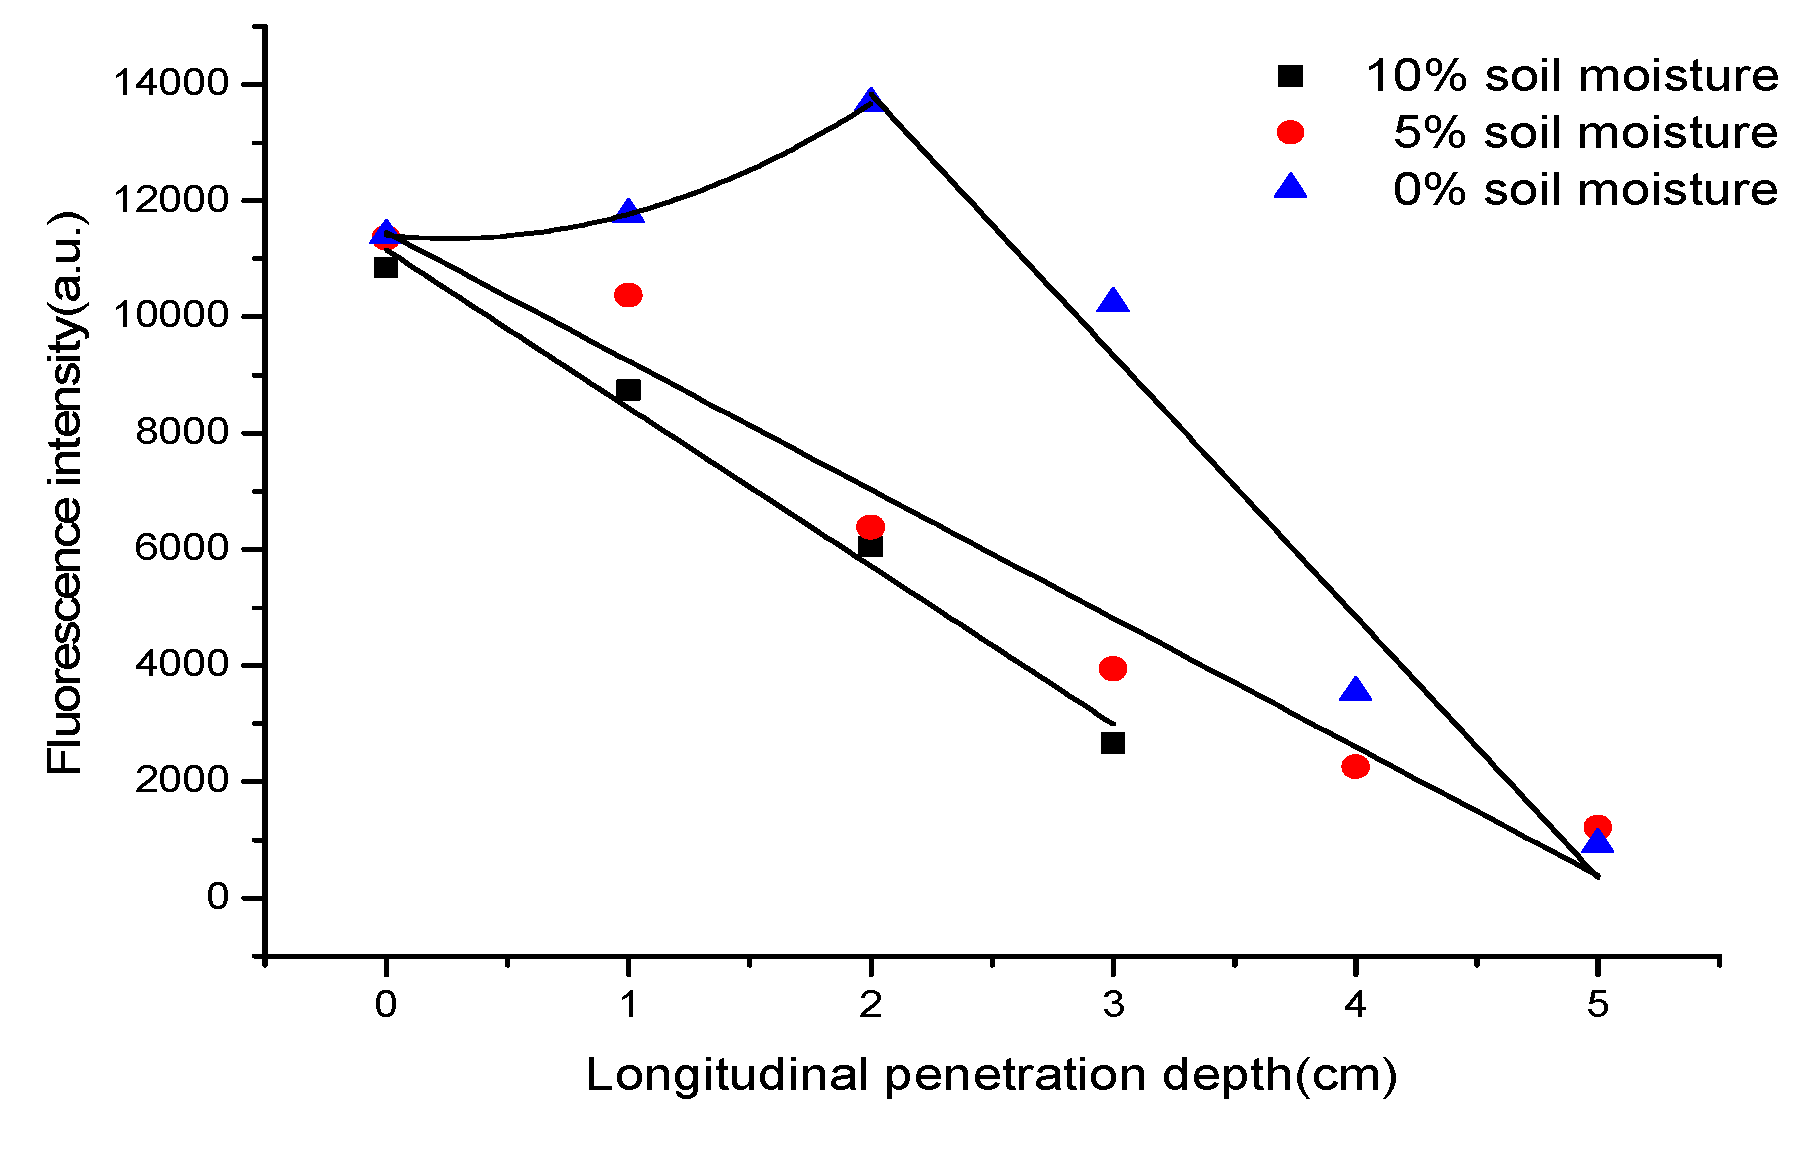
On the sides of national highways or near the gas stations, they are the main sites of pure petroleum pollution, and they are usually quite spacious and environmentally similar within the same place, then assuming that the diesel oil can permeate freely. Then, in the next set of experiment, 5.3 g diesel oil was quickly dropped on three soil samples with gravimetric moisture of 0%, 5%, and 10% by a pipette, and the density of the soils is about 2 g per cubic centimeter. Then we kept the sealed beaker in the shade for 15 days, and observed its diffusion every day. After 7 days later, the variation of the diesel diffusion could not be detected by LIF. After 15 days of standing, the LIF spectra of three-dimensional distributions of diesel oil in three different soil samples were detected. The intervals of the longitudinal penetration depth detection were 1 cm, and the fluorescence peak intensities of diesel oil versus the longitudinal penetration depths down the center point are shown in Figure 5.
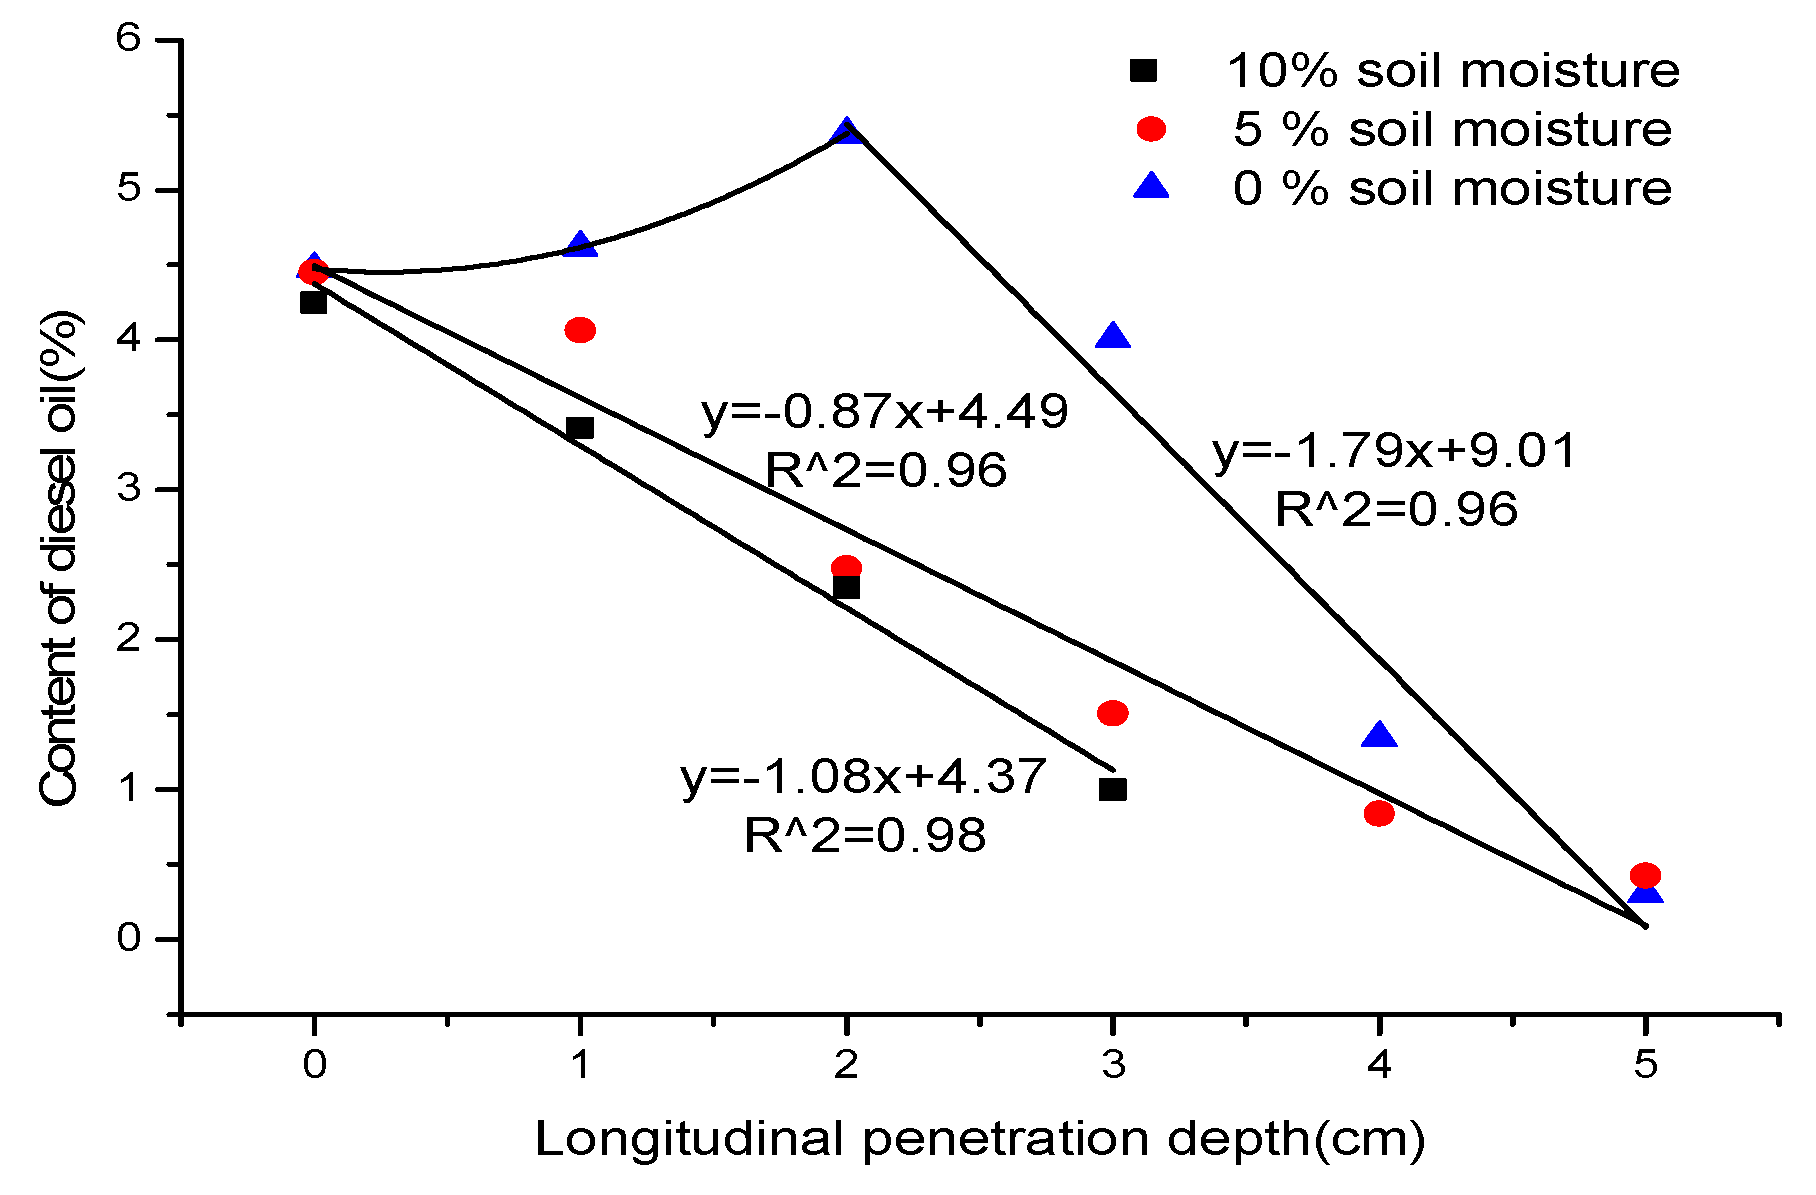
Figure 5 indicates that the diesel oil deposits in 0–6 cm below the surface of the soil. When the soil moisture is 0%, the fluorescence intensity of diesel oil increases with increasing soil depth, but after 2 cm depth later, the fluorescence intensity of diesel oil gradually decreases with depth. When the soil moisture is 5% or 10%, the fluorescence intensity of diesel oil gradually decreases with increasing soil depth. Then the fluorescence intensities were taken into the calibration curve, and the concentrations of diesel oil at different depths were calculated. As shown in Figure 6, when the soil moisture is 0%, the concentrations of diesel oil in soils versus the longitudinal penetration depths are conformed to quadratic law, but after 2 cm depth later, the concentration of diesel oil gradually decreases with depth. When the soil moisture is 5% or 10%, the concentration of diesel oil gradually decreases with the penetration depth increasing and a nearly linear relationship exists between the concentrations of diesel oil and the longitudinal penetration depths. The square correlation coefficients of the calibration curves are all above 0.95, which implies that the diesel oil accumulation in soils decreases linearly with the penetration depth increasing, and the longitudinal penetration depth decreases with the increasing of soil of humidity.
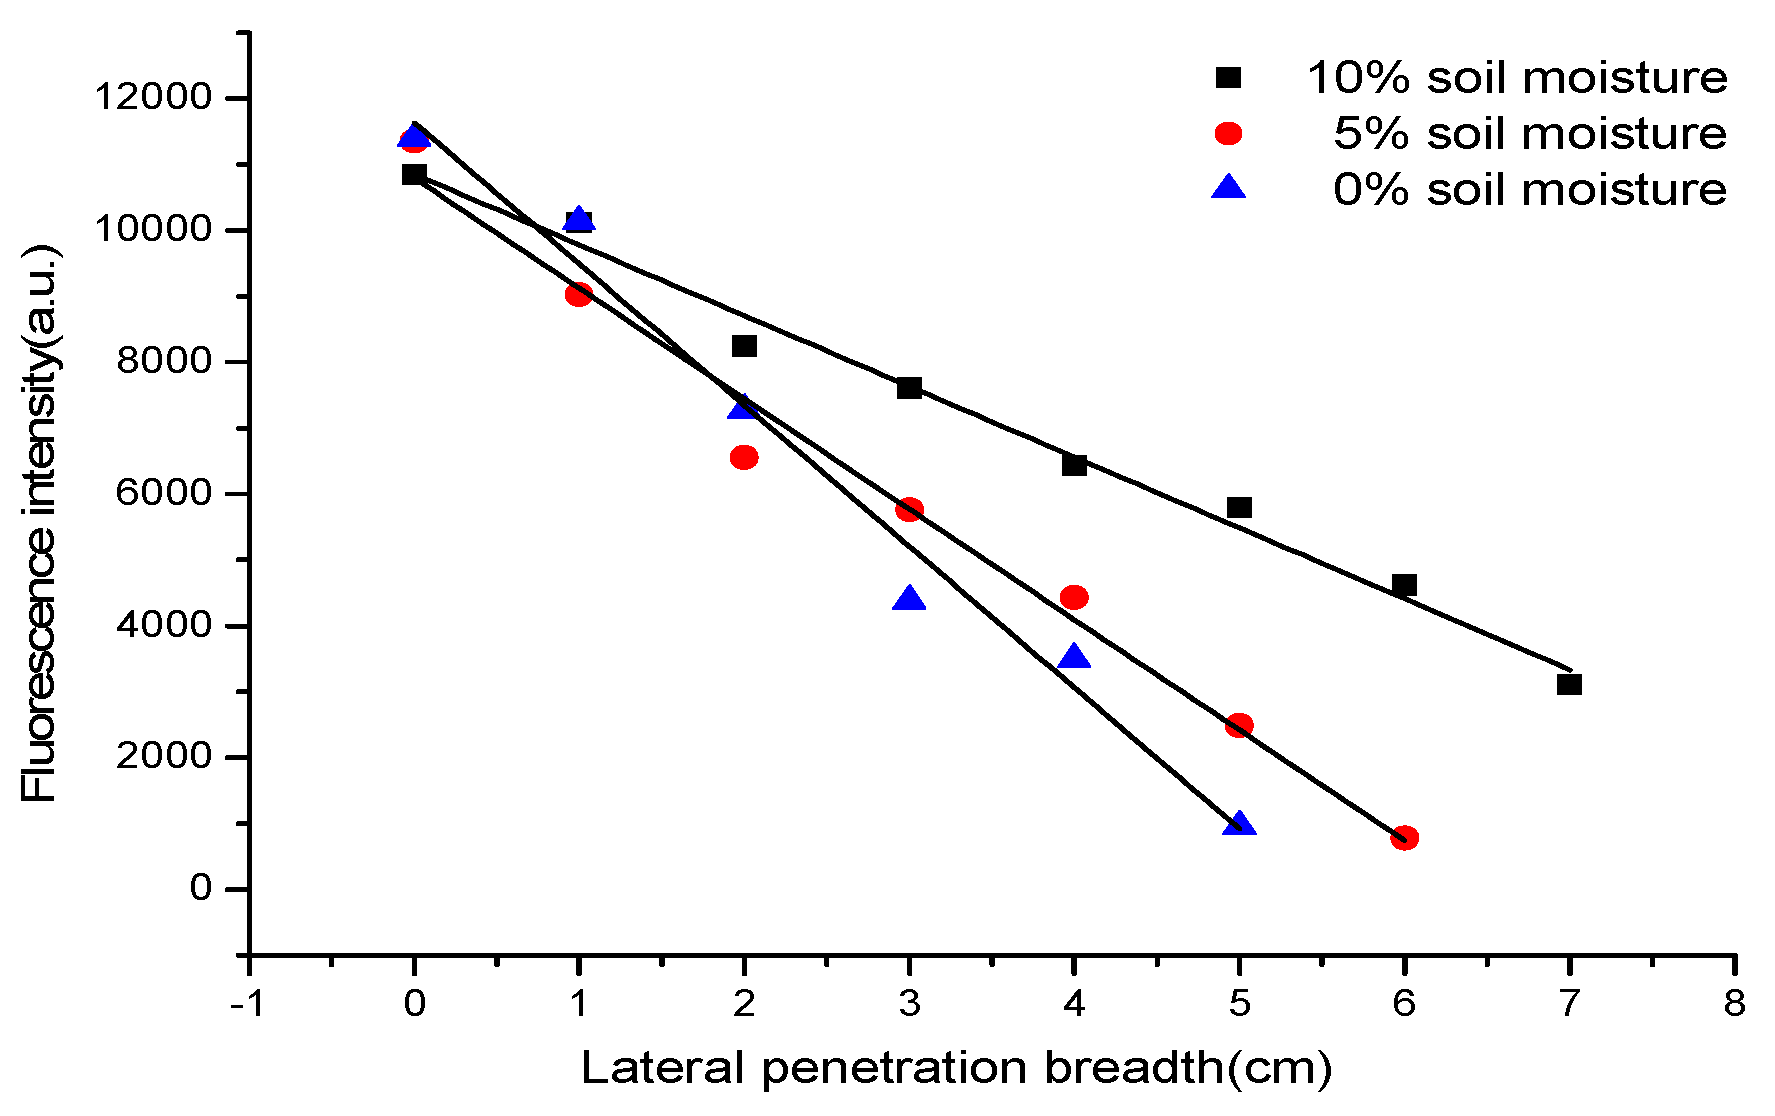
The intervals of the lateral diffusion detection were 1 cm, and the fluorescence peak intensities of diesel oil versus the lateral diffusion breadths outward from the central point in different humidity soils are shown in Figure 7.
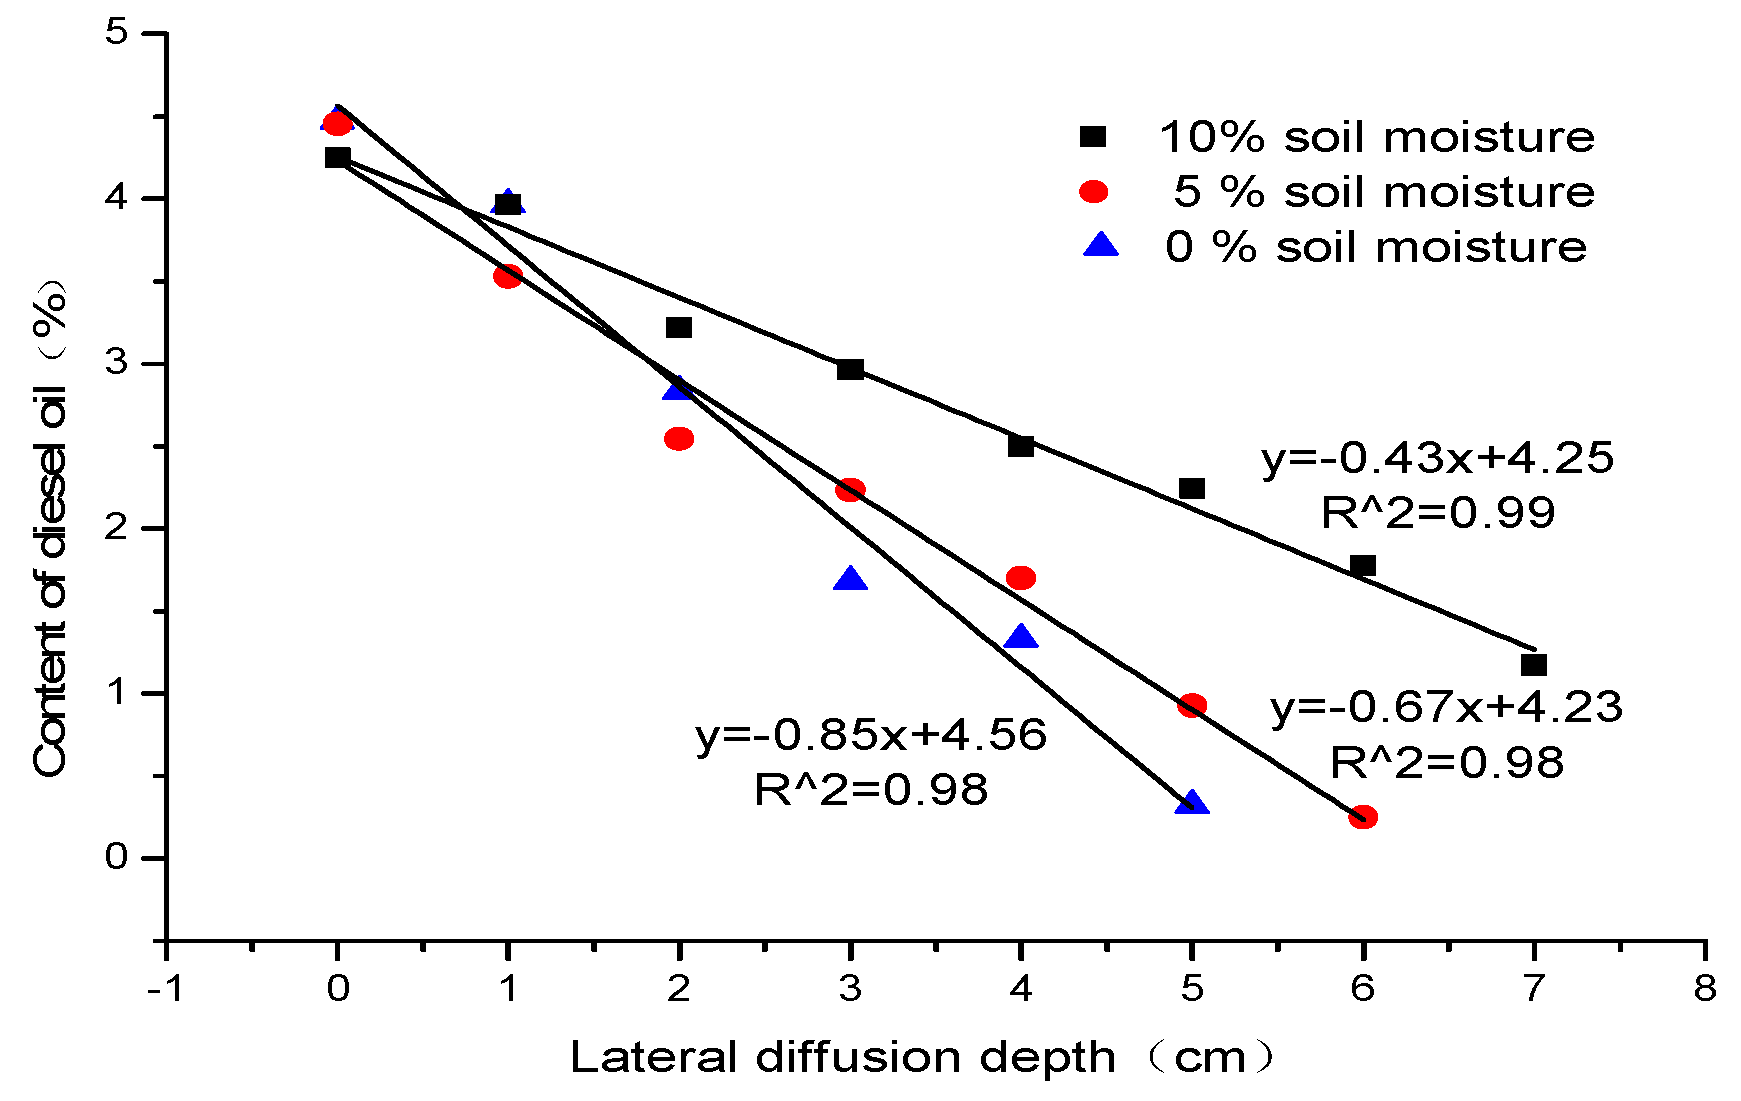
As shown in Figure 7, we can detect the fluorescence of diesel oil 5 cm away from the central point of the pollution source. Then the fluorescence intensities were taken into the calibration curve, and the concentrations of diesel oil at different breadths were calculated. Figure 8 indicates that there are good linear relationships between the concentrations of diesel oil and the lateral diffusion breadths away from the central point of the pollution source in different humidity soils. The square correlation coefficients of the calibration curves are all above 0.98, which implies that the amounts of the lateral diffusion of diesel oil in soils decreases linearly with the transverse diffusion distance increasing. As shown in Figure 8, we can observe that the lateral diffusion breadth increases with the increasing of soil humidity.
On the basis of diesel oil diffusion shown in Figure 6 and Figure 8, we can calculate that the longitudinal penetration depths of diesel oil in different soil samples with the moisture of 0%, 5%, 10% are 5.05 cm, 5.10 cm, 4.11 cm, which are shown in Table 1, and the lateral diffusion breadths of diesel oil are 5.36 cm, 6.44 cm, 10.11 cm, when 5.3 g diesel oil was quickly dropped on the surface of soil by a pipette.
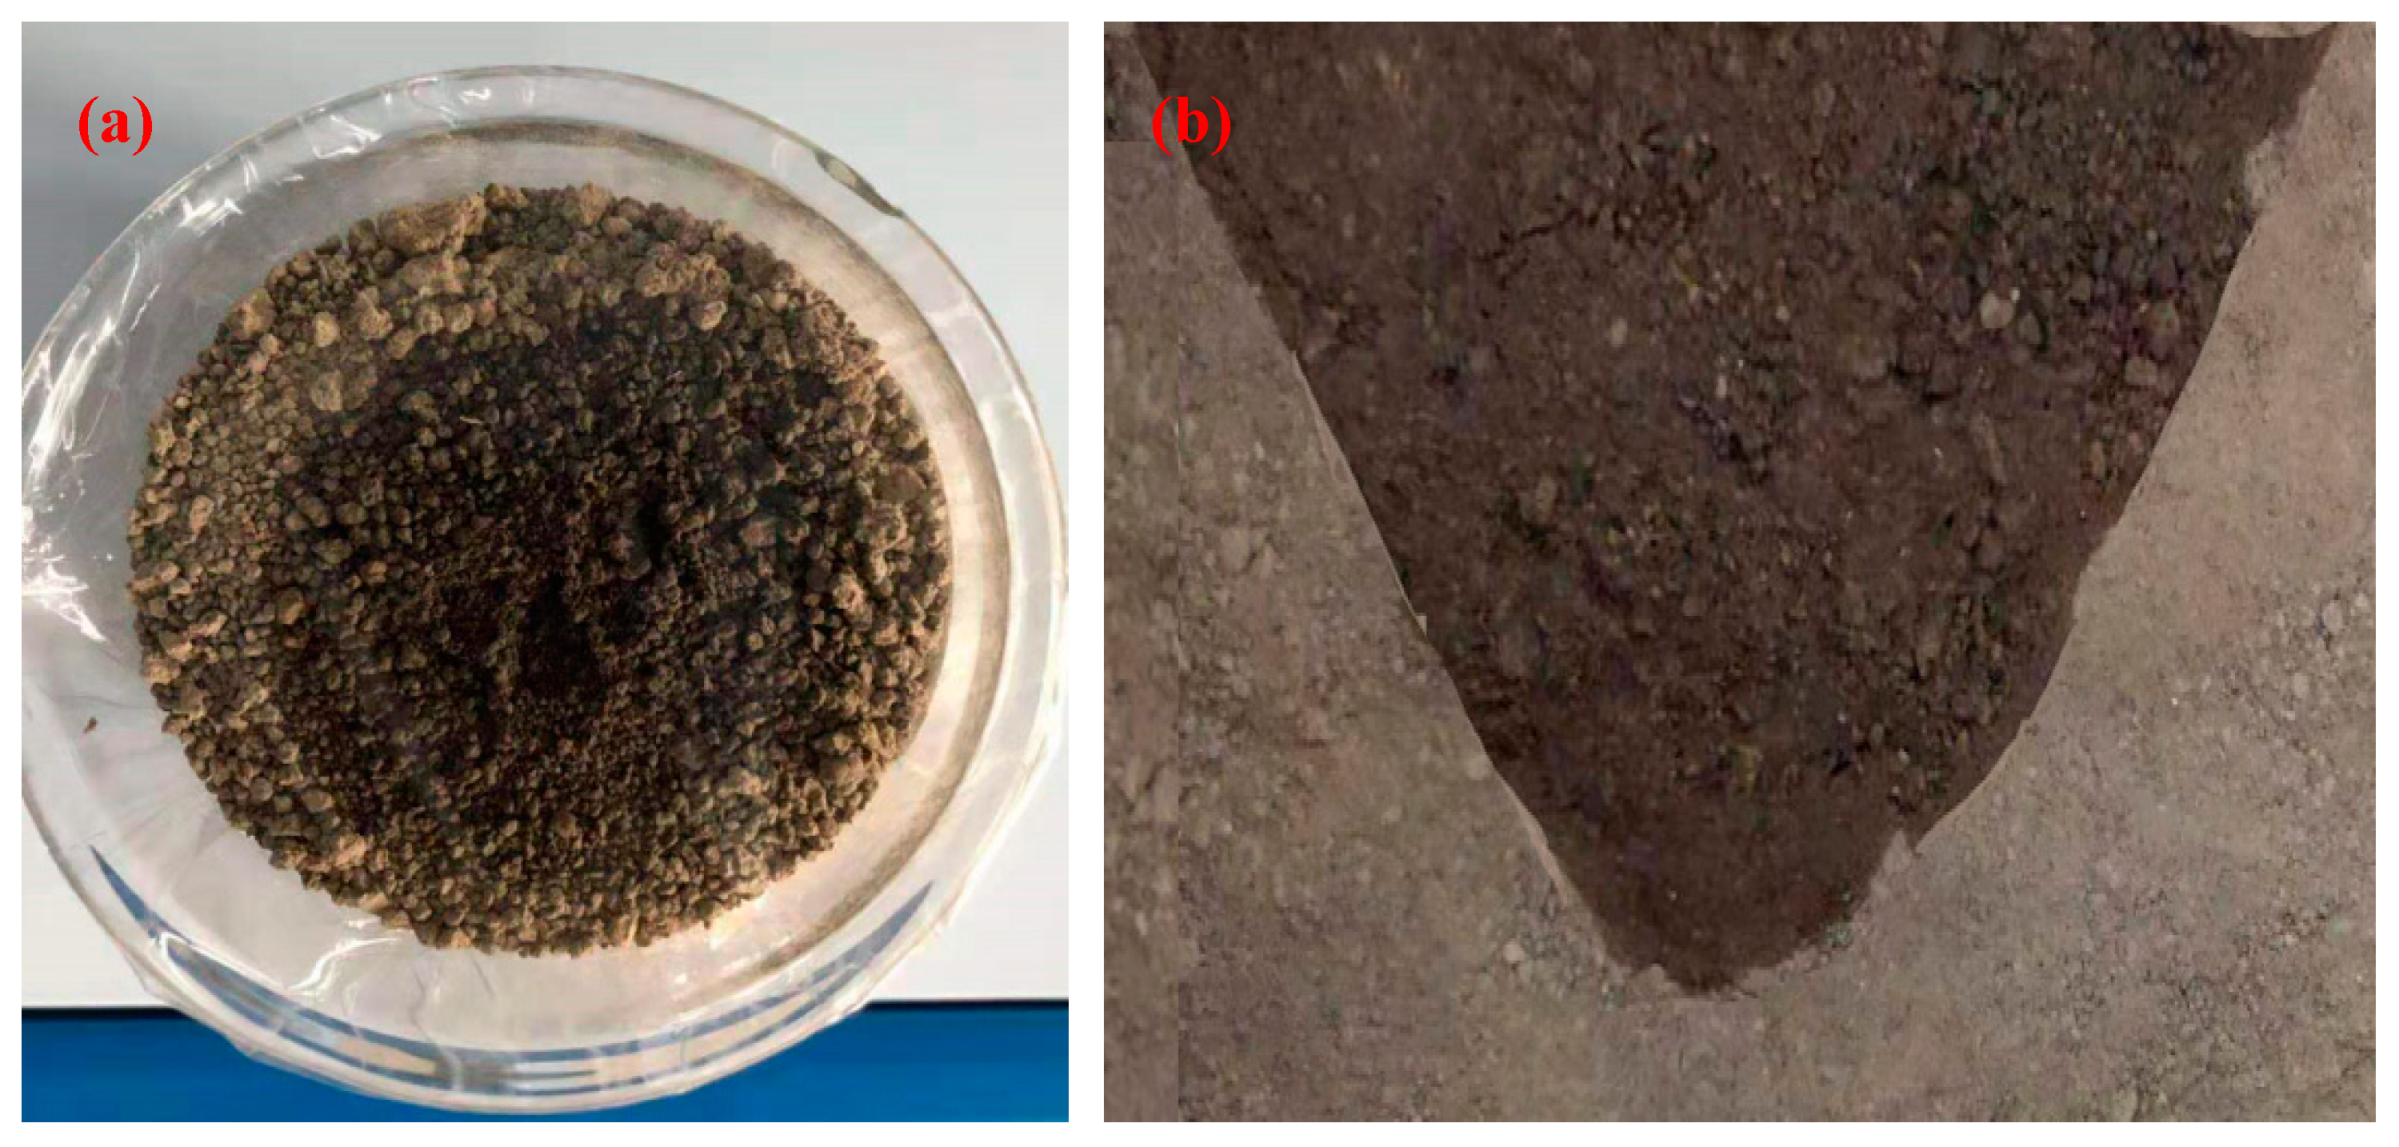
Figure 9 shows the diffusion mechanisms of diesel oil at the surface of the soil and longitudinal cut sides through the central point of the diesel oil dropped. As shown in Figure 9, the diesel oil diffuses around the central point like a circle, and the soil color becomes shallow gradually with the departing from the dropping center of diesel oil. On the longitudinal section, the diesel oil diffuses in accordance with parabolic-like line form, and the soil color becomes shallow towards periphery. This results show that the diesel oil evenly distributes in all lateral directions, combined with the longitudinal section, the permeation-diffusion model of diesel oil in soils can be viewed as a rotating body formed by rotating a parabola around an axis which was crossing the central point and vertical to the soil surface.
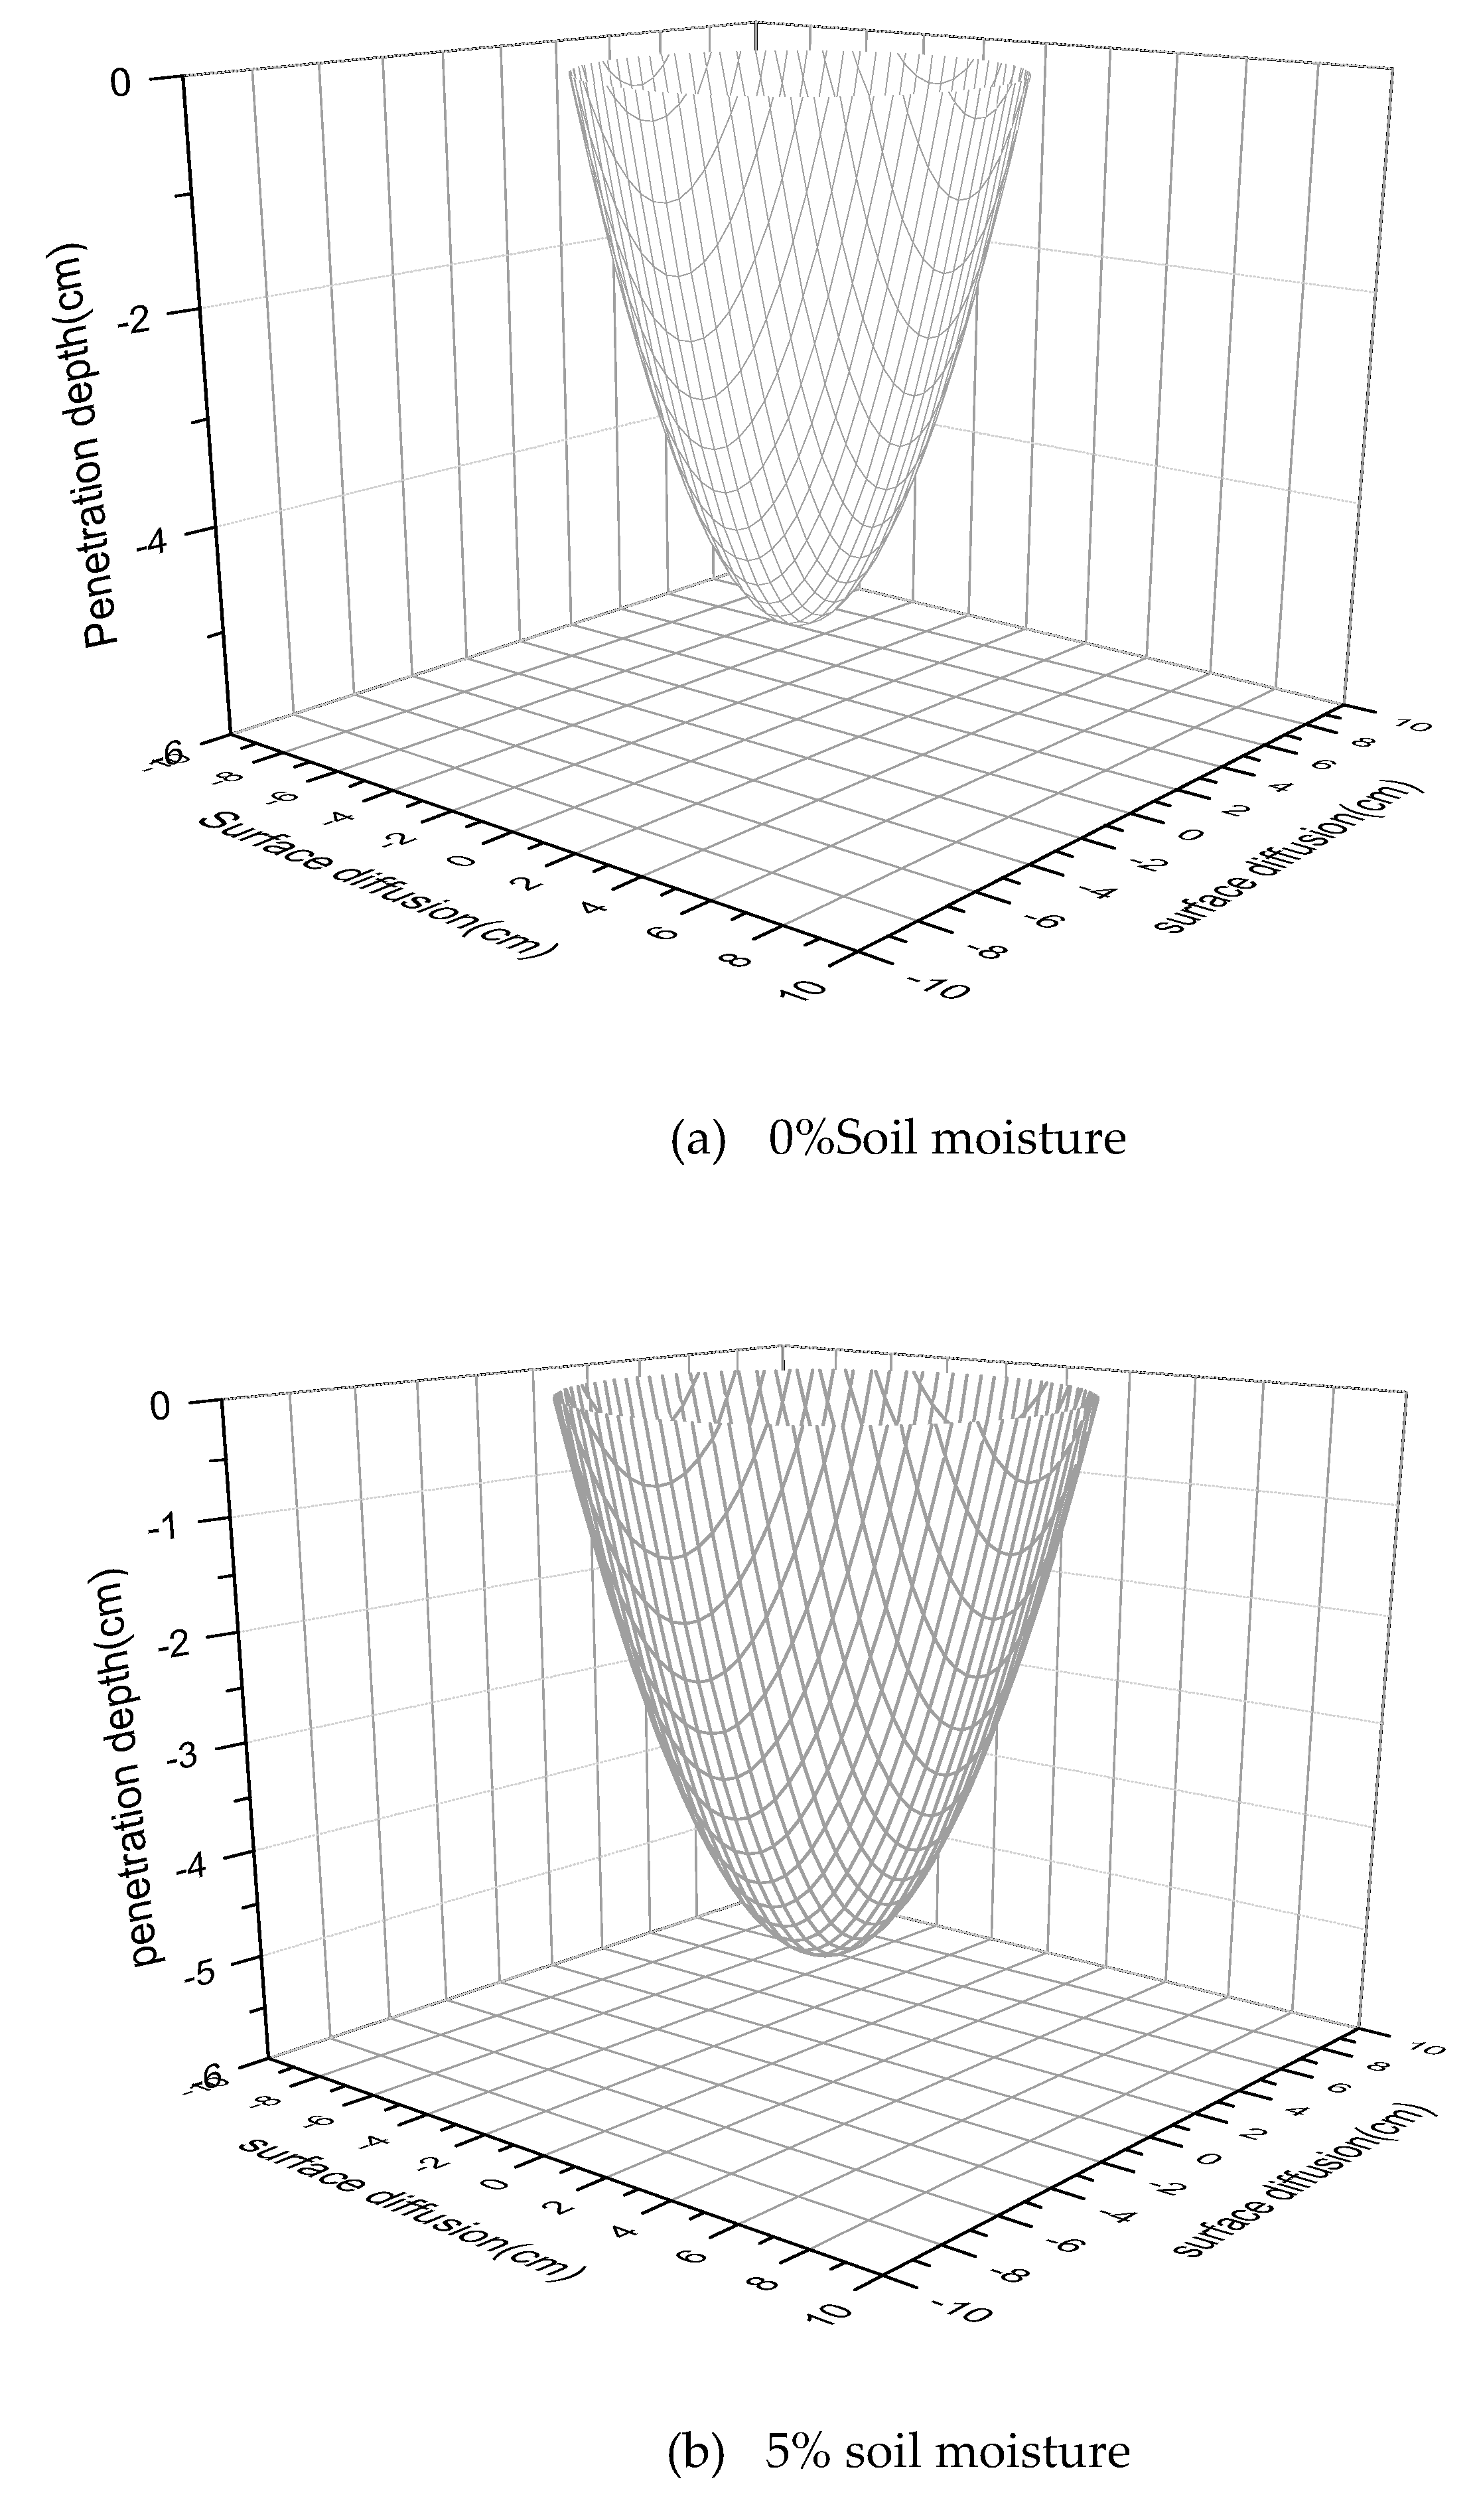
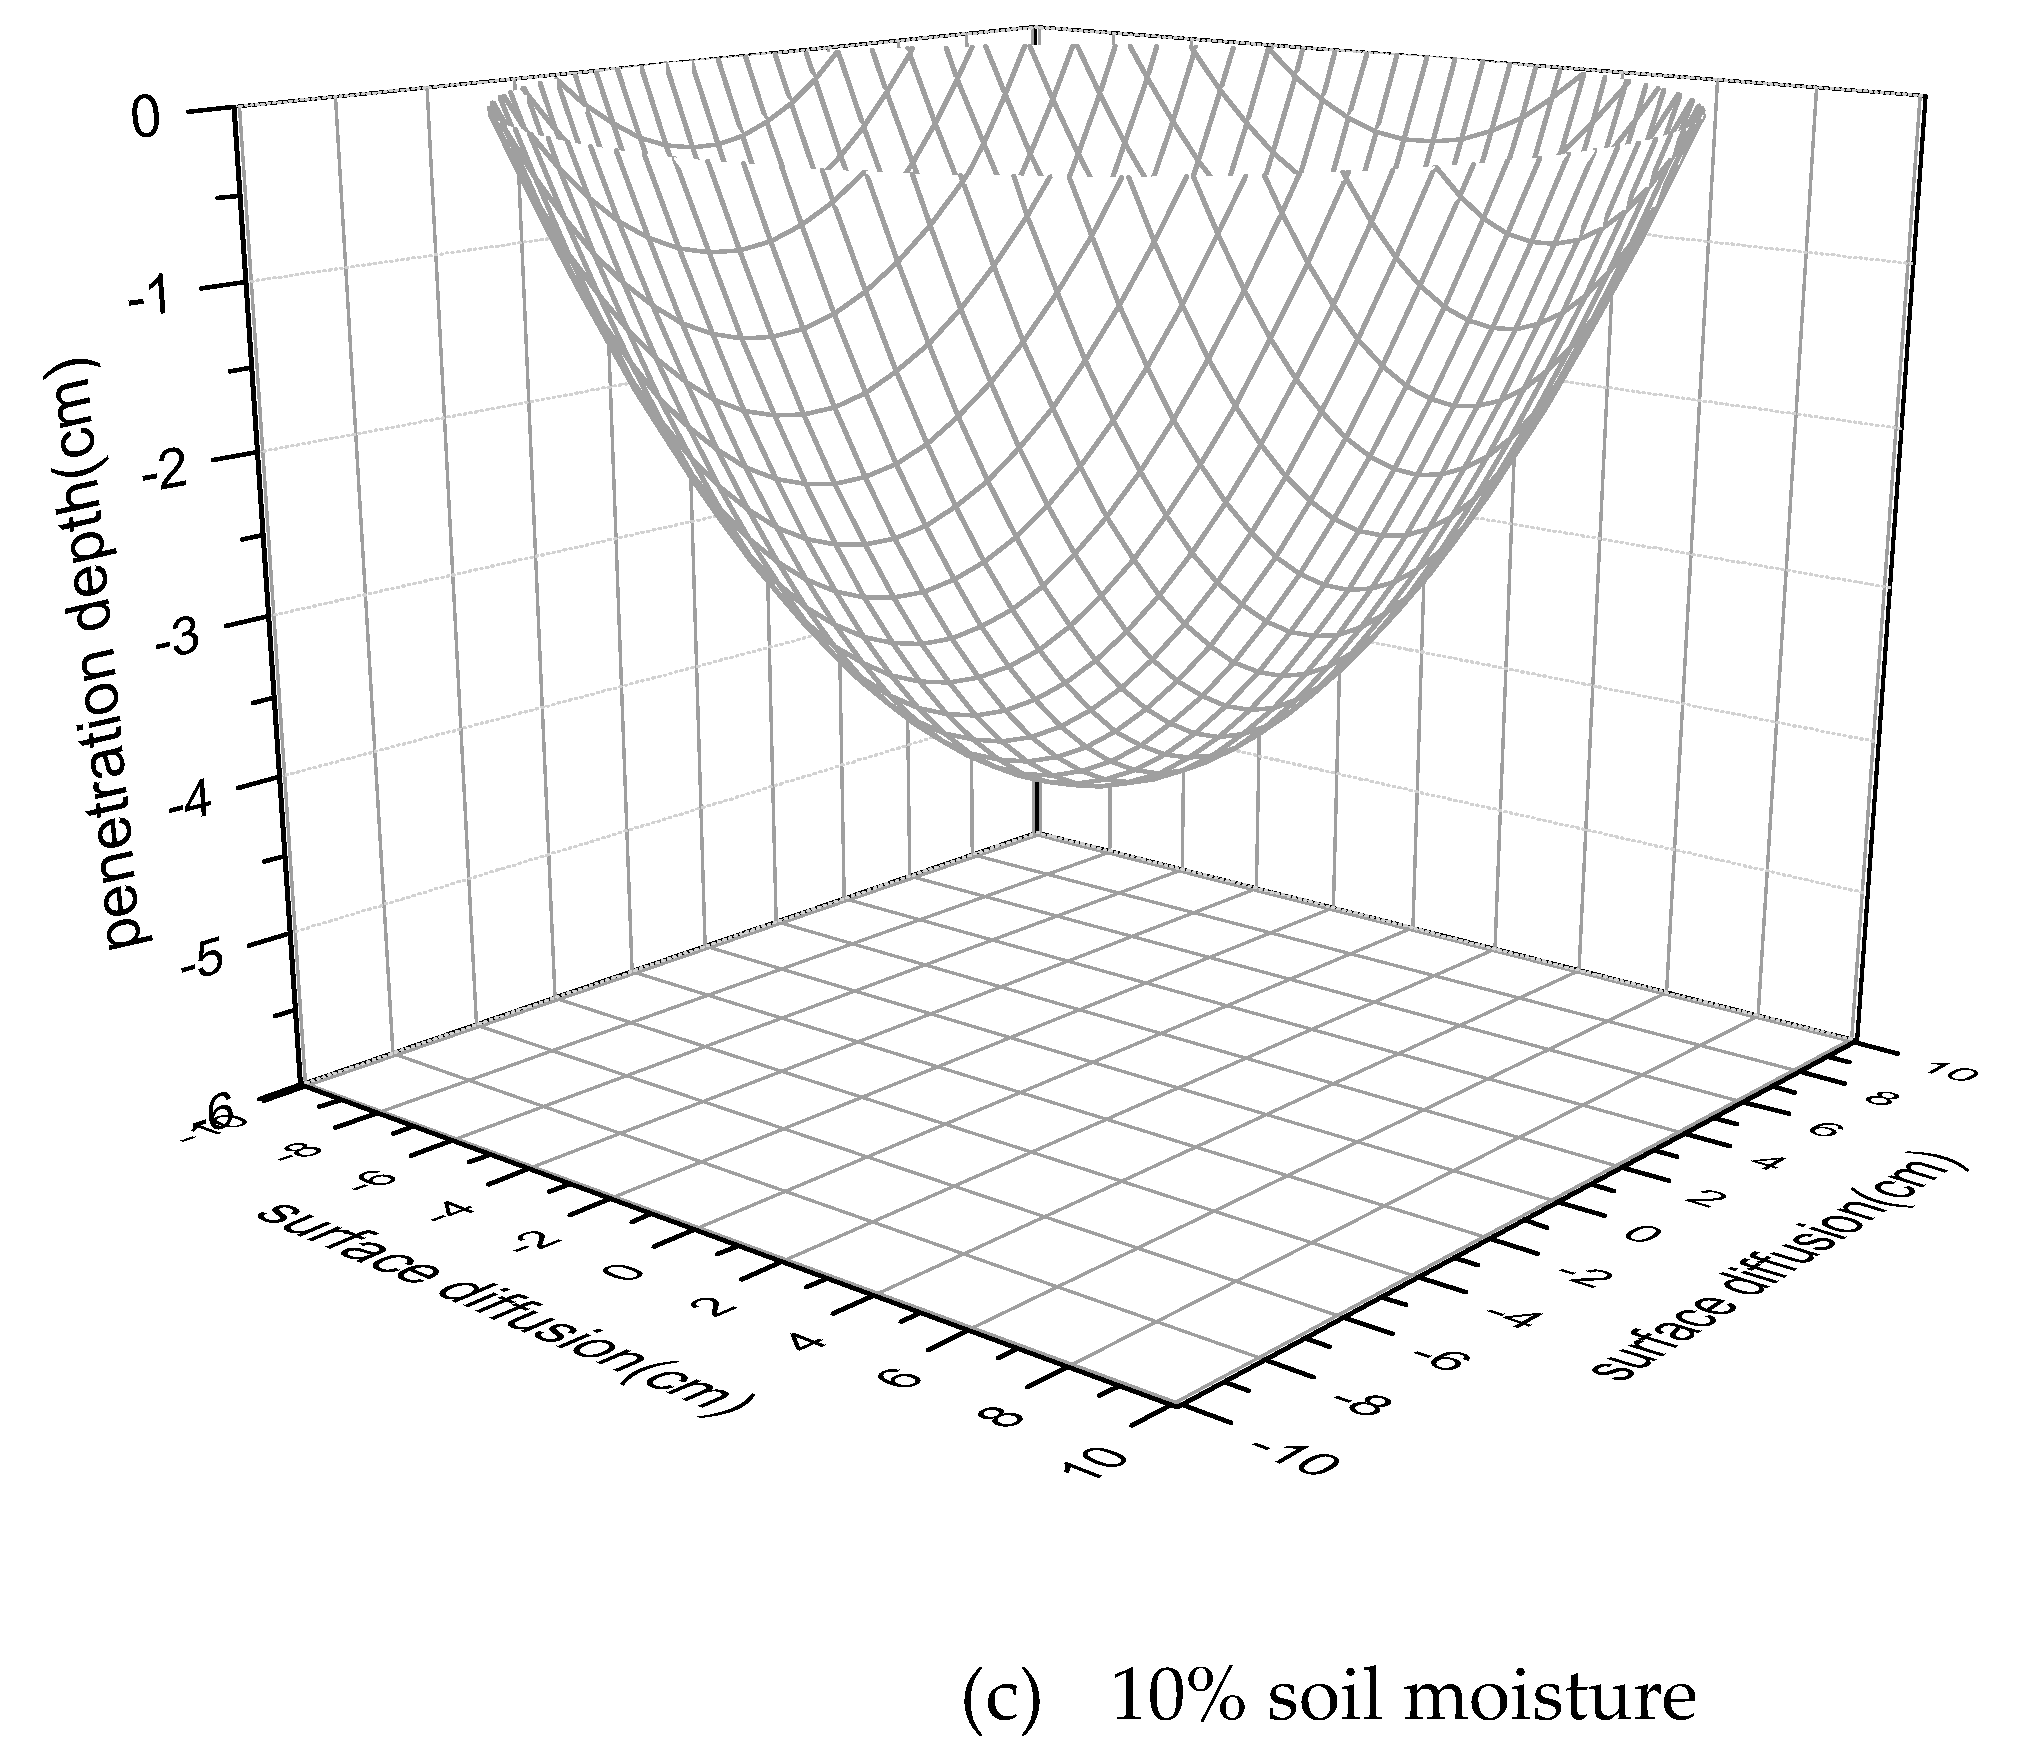
Then the three-dimensional diffusion models of diesel oil in different moisture soils are established and shown in Figure 10. For estimating the total amounts of diesel oil which were dropped in soils, the three-dimensional diffusion models and the calibration curve were used. Assuming that the diffusion laws in longitudinal direction are consistent, to validate the accuracies of the calibration curve and the three-dimensional diffusion models of diesel oil in soils, a way of calculating triple integral by the use of symmetry is utilized. The calculated weights of diesel oil in different soil samples with the humidity of 0%, 5%, 10% are 5.57 g, 5.81 g, and 5.72 g. These results gained through the three-dimensional diffusion models show that the relative standard deviations of the predictions for the total weights of diesel oil in soils are 5.09%, 9.62%, and 7.92%, therefore the accuracies of the calibration curve and the three-dimensional diffusion models are verified by the error analysis.
As shown in Table 2, we calculated the polluted volumes of diesel oil in soils with different soil moistures, and the polluted volumes of soils by diesel oil are 233.90 cm3, 332.70 cm3, and 660.05 cm3. These results express that the soil moisture can extend the diesel oil pollution to the soil. Therefore, LIF technique can be considered as a fast and useful tool for analyzing the three-dimensional content distribution of diesel oil and evaluating the soil environmental quality.
4. Conclusions
In summary, this study focuses on the monitoring application of LIF in petroleum hydrocarbon-contaminated soils by establishing the three-dimensional diffusion models. The spectra obtained from diesel oil are complex and unique, which peak intensity can represent the concentration of diesel oil, and the square correlation coefficient value of the calibration curve is 0.99. There is little difficulty in obtaining high-quality spectrum quickly, typically less than 1 min, which is a benefit to monitoring the soil quality.
The longitudinal penetration spectra and the lateral diffusion spectra of diesel oil in soils were detected and the laws of permeation and distribution were analyzed. These laws indicate that the soil moisture can extend the diesel oil pollution to the soil. The three-dimensional diffusion models in different soil samples were established and the polluted volumes of soils by diesel oil were calculated. The analytical method employed in this paper can be extended to other petroleum-polluted soils. Therefore, it is feasible to develop the LIF technique for the rapid analysis of petroleum hydrocarbon-contaminated concentrations and distributions in high precision, and it is an effective path to improve the efficiencies and reduce the costs of soil pollution treatment.
Author Contributions
Writing—original draft preparation, Y.G.; data curation, Z.Z.; resources, C.S.; investigation, X.H. All authors have read and agreed to the published version of the manuscript.
Funding
This work was supported by the Anhui Province Natural Key Science and Technology Projects (KJ2018A0547), and the Talent Research Foundation of Hefei University (18-19RC47, 18-19RC38).
Conflicts of Interest
The authors declare no conflict of interest.
References
- Sherry, A.; Andrade, L.; Velenturf, A.; Christgen, B.; Gray, N.D.; Head, I.M. How to access and exploit natural resources sustainably: Petroleum biotechnology. Microb. Biotechnol. 2017, 10, 1206–1211. [Google Scholar] [CrossRef] [PubMed]
- Aburas, H.; Demirbas, A. The Caspian Sea Basin, Middle East Petroleum Resources, and the Importance of Turkey. Petrol. Sci. Technol. 2015, 33, 397–405. [Google Scholar] [CrossRef]
- Edokpolo, B.; Yu, Q.J.; Connell, D. Health risk assessment for exposure to benzene in petroleum refinery environments. Int. J. Environ. Res. Public Health 2015, 12, 595–610. [Google Scholar] [CrossRef] [PubMed] [Green Version]
- Connor, E.G.; McHugh, M.K.; Crimaldi, J.P. Quantification of airborne odor plumes using planar laser-induced fluorescence. Exp. Fluids 2018, 59, 137. [Google Scholar] [CrossRef]
- Maes, N.; Meijer, M.; Dam, N.; Somers, B.; Toda, H.B.; Bruneaux, G.; Skeen, S.A.; Pickett, L.M.; Manin, J. Characterization of Spray A flame structure for parametric variations in ECN constant-volume vessels using chemiluminescence and laser-induced fluorescence. Combust. Flame 2016, 174, 138–151. [Google Scholar] [CrossRef] [Green Version]
- Charogiannis, A.; An, J.S.; Markides, C.N. A simultaneous planar laser-induced fluorescence, particle image velocimetry and particle tracking velocimetry technique for the investigation of thin liquid-film flows. Exp. Therm. Fluid Sci. 2015, 68, 516–536. [Google Scholar] [CrossRef] [Green Version]
- Wu, Y.; Xu, W.; Lei, Q.; Ma, L. Single-shot volumetric laser induced fluorescence (VLIF) measurements in turbulent flows seeded with iodine. Opt. Express 2015, 23, 33408–33418. [Google Scholar] [CrossRef] [PubMed] [Green Version]
- Hodáková, J.; Preisler, J.; Foret, F.; Kubáň, P. Sensitive determination of glutathione in biological samples by capillary electrophoresis with green (515 nm) laser-induced fluorescence detection. J. Chromatogr. A 2015, 1391, 102–108. [Google Scholar] [CrossRef] [PubMed]
- Gameiro, C.; Utkin, A.B.; Cartaxana, P.; Silva, J.M.; Matos, A.R. The use of laser induced chlorophyll fluorescence (LIF) as a fast and non destructive method to investigate water deficit in Arabidopsis. Agric. Water Manag. 2016, 164, 127–136. [Google Scholar] [CrossRef]
- Richardson, D.R.; Roy, S.; Gord, J.R. Femtosecond, two-photon, planar laser-induced fluorescence of carbon monoxide in flames. Opt. Lett. 2017, 42, 875–878. [Google Scholar] [CrossRef] [PubMed]
- Lačná, J.; Foret, F.; Kubáň, P. Sensitive determination of malondialdehyde in exhaled breath condensate and biological fluids by capillary electrophoresis with laser induced fluorescence detection. Talanta 2017, 169, 85–90. [Google Scholar] [CrossRef] [PubMed]
- Li, J.; Zhu, Z.; Zhou, R.; Zhao, N.; Yi, R.; Yang, X.; Li, X.; Guo, L.; Zeng, X.; Lu, Y. Determination of carbon content in steels using laser-induced breakdown spectroscopy assisted with laser-induced radical fluorescence. Anal. Chem. 2017, 89, 8134–8139. [Google Scholar] [CrossRef] [PubMed]
- Cazorla, M.; Wolfe, G.M.; Bailey, S.A.; Swanson, A.K.; Arkinson, H.L.; Hanison, T.F. A new airborne laser-induced fluorescence instrument for in situ detection of formaldehyde throughout the troposphere and lower stratosphere. Atmos. Meas. Technol. 2015, 8, 541–552. [Google Scholar] [CrossRef] [Green Version]
- Baburaj, P.V.A.; Subhash, N.; Unni, N.G.; Anil, M.K.; George, R.M. Development of Laser-Induced Multispectral Fluorescence Imaging System For Studying Coral Bleaching; Life Science Informatics Publications: Maharashtra, India, 2018. [Google Scholar]
- Honza, R.; Ding, C.-P.; Dreizler, A.; Böhm, B. Flame imaging using planar laser induced fluorescence of sulfur dioxide. Appl. Phys. B 2017, 123, 246. [Google Scholar] [CrossRef]
- Bardi, M.; Lella, A.D.; Bruneaux, G. A novel approach for quantitative measurements of preferential evaporation of fuel by means of two-tracer laser induced fluorescence. Fuel 2019, 239, 521–533. [Google Scholar] [CrossRef]
- Yang, J.; Gong, W.; Shi, S.; Du, L.; Sun, J.; Ma, Y.-Y.; Song, S.-L. Accurate identification of nitrogen fertilizer application of paddy rice using laser-induced fluorescence combined with support vector machine. Plant Soil Eniviron. 2015, 61, 501–506. [Google Scholar] [CrossRef] [Green Version]
- Töger, J.; Bidhult, S.; Revstedt, J.; Carlsson, M.; Arheden, H.; Heiberg, E. Independent validation of four-dimensional flow MR velocities and vortex ring volume using particle imaging velocimetry and planar laser-Induced fluorescence. Magn. Reson. Med. 2016, 75, 1064–1075. [Google Scholar] [CrossRef] [PubMed]
- Hayashi, J.; Hashimoto, N.; Nakatsuka, N.; Tainaka, K.; Tsuji, H.; Tanno, K.; Watanbe, H.; Makino, H.; Akamatsu, F. Simultaneous imaging of Mie scattering, PAHs laser induced fluorescence and soot laser induced incandescence to a lab-scale turbulent jet pulverized coal flame. Proc. Combust. Inst. 2019, 37, 3045–3052. [Google Scholar] [CrossRef]
- Wang, Z.; Stamatoglou, P.; Zhou, B.; Aldén, M.; Bai, X.-S.; Richter, M. Investigation of OH and CH2O distributions at ultra-high repetition rates by planar laser induced fluorescence imaging in highly turbulent jet flames. Fuel 2018, 234, 1528–1540. [Google Scholar] [CrossRef]
Figure 1.
Schematic diagram of the laser induced fluorescence (LIF) experimental setup.

Figure 2.
The typical LIF spectra of diesel oil before and after preprocessing.

Figure 3.
The fluorescence spectra of diesel oil in different soil moisture. (a) The fluorescence spectra; (b) the change regularity of the fluorescence peak intensity.
Figure 3.
The fluorescence spectra of diesel oil in different soil moisture. (a) The fluorescence spectra; (b) the change regularity of the fluorescence peak intensity.

Figure 4.
The calibration curve between LIF intensity and diesel oil concentrations.

Figure 5.
The fluorescence intensity of diesel oil in different longitudinal penetration depths.

Figure 6.
The concentrations of diesel oil in different longitudinal penetration depths.

Figure 7.
The fluorescence intensity of diesel oil in different lateral diffusion breadths.

Figure 8.
The concentrations of diesel oil in different lateral diffusion breadths.

Figure 9.
The diffusion mechanisms of diesel oil. (a) The surface; (b) the longitudinal section.

Figure 10.
The three-dimensional diffusion models of diesel oil in different humidity soils.


Table 1.
Diffusion range of diesel oil in different soil moisture.
| Soil Moisture | Lateral Diffusion Breadth(cm) | Longitudinal Penetration Depth(cm) |
|---|---|---|
| 0% | 5.43 | 5.05 |
| 5% | 6.44 | 5.01 |
| 10% | 10.11 | 4.11 |
Table 2.
The contaminated soil volumes by diesel oil in different soil moistures.
| Soil Moisture | The Contaminated Soil Volume | The Calculated Amount of Diesel Oil (g) | RSD (%) |
|---|---|---|---|
| 0% | 233.90 cm3 | 5.57 | 5.09 |
| 5% | 332.70 cm3 | 5.81 | 9.62 |
| 10% | 660.05 cm3 | 5.72 | 7.92 |
© 2020 by the authors. Licensee MDPI, Basel, Switzerland. This article is an open access article distributed under the terms and conditions of the Creative Commons Attribution (CC BY) license (http://creativecommons.org/licenses/by/4.0/).
Share and Cite
MDPI and ACS Style
Gu, Y.; Zuo, Z.; Shi, C.; Hu, X. Feasibility Study for Spatial Distribution of Diesel Oil in Contaminated Soils by Laser Induced Fluorescence. Appl. Sci. 2020, 10, 1103. https://doi.org/10.3390/app10031103
AMA Style
Gu Y, Zuo Z, Shi C, Hu X. Feasibility Study for Spatial Distribution of Diesel Oil in Contaminated Soils by Laser Induced Fluorescence. Applied Sciences. 2020; 10(3):1103. https://doi.org/10.3390/app10031103
Chicago/Turabian StyleGu, Yanhong, Zhaolu Zuo, Chaoyi Shi, and Xueyou Hu. 2020. "Feasibility Study for Spatial Distribution of Diesel Oil in Contaminated Soils by Laser Induced Fluorescence" Applied Sciences 10, no. 3: 1103. https://doi.org/10.3390/app10031103
Note that from the first issue of 2016, this journal uses article numbers instead of page numbers. See further details here.