
Large-Scale Non-Targeted Metabolomics Reveals Antioxidant, Nutraceutical and Therapeutic Potentials of Sorghum

 ,
,  ,
,  and
and
Abstract
:1. Introduction
2. Materials and Methods
2.1. Genetic Materials
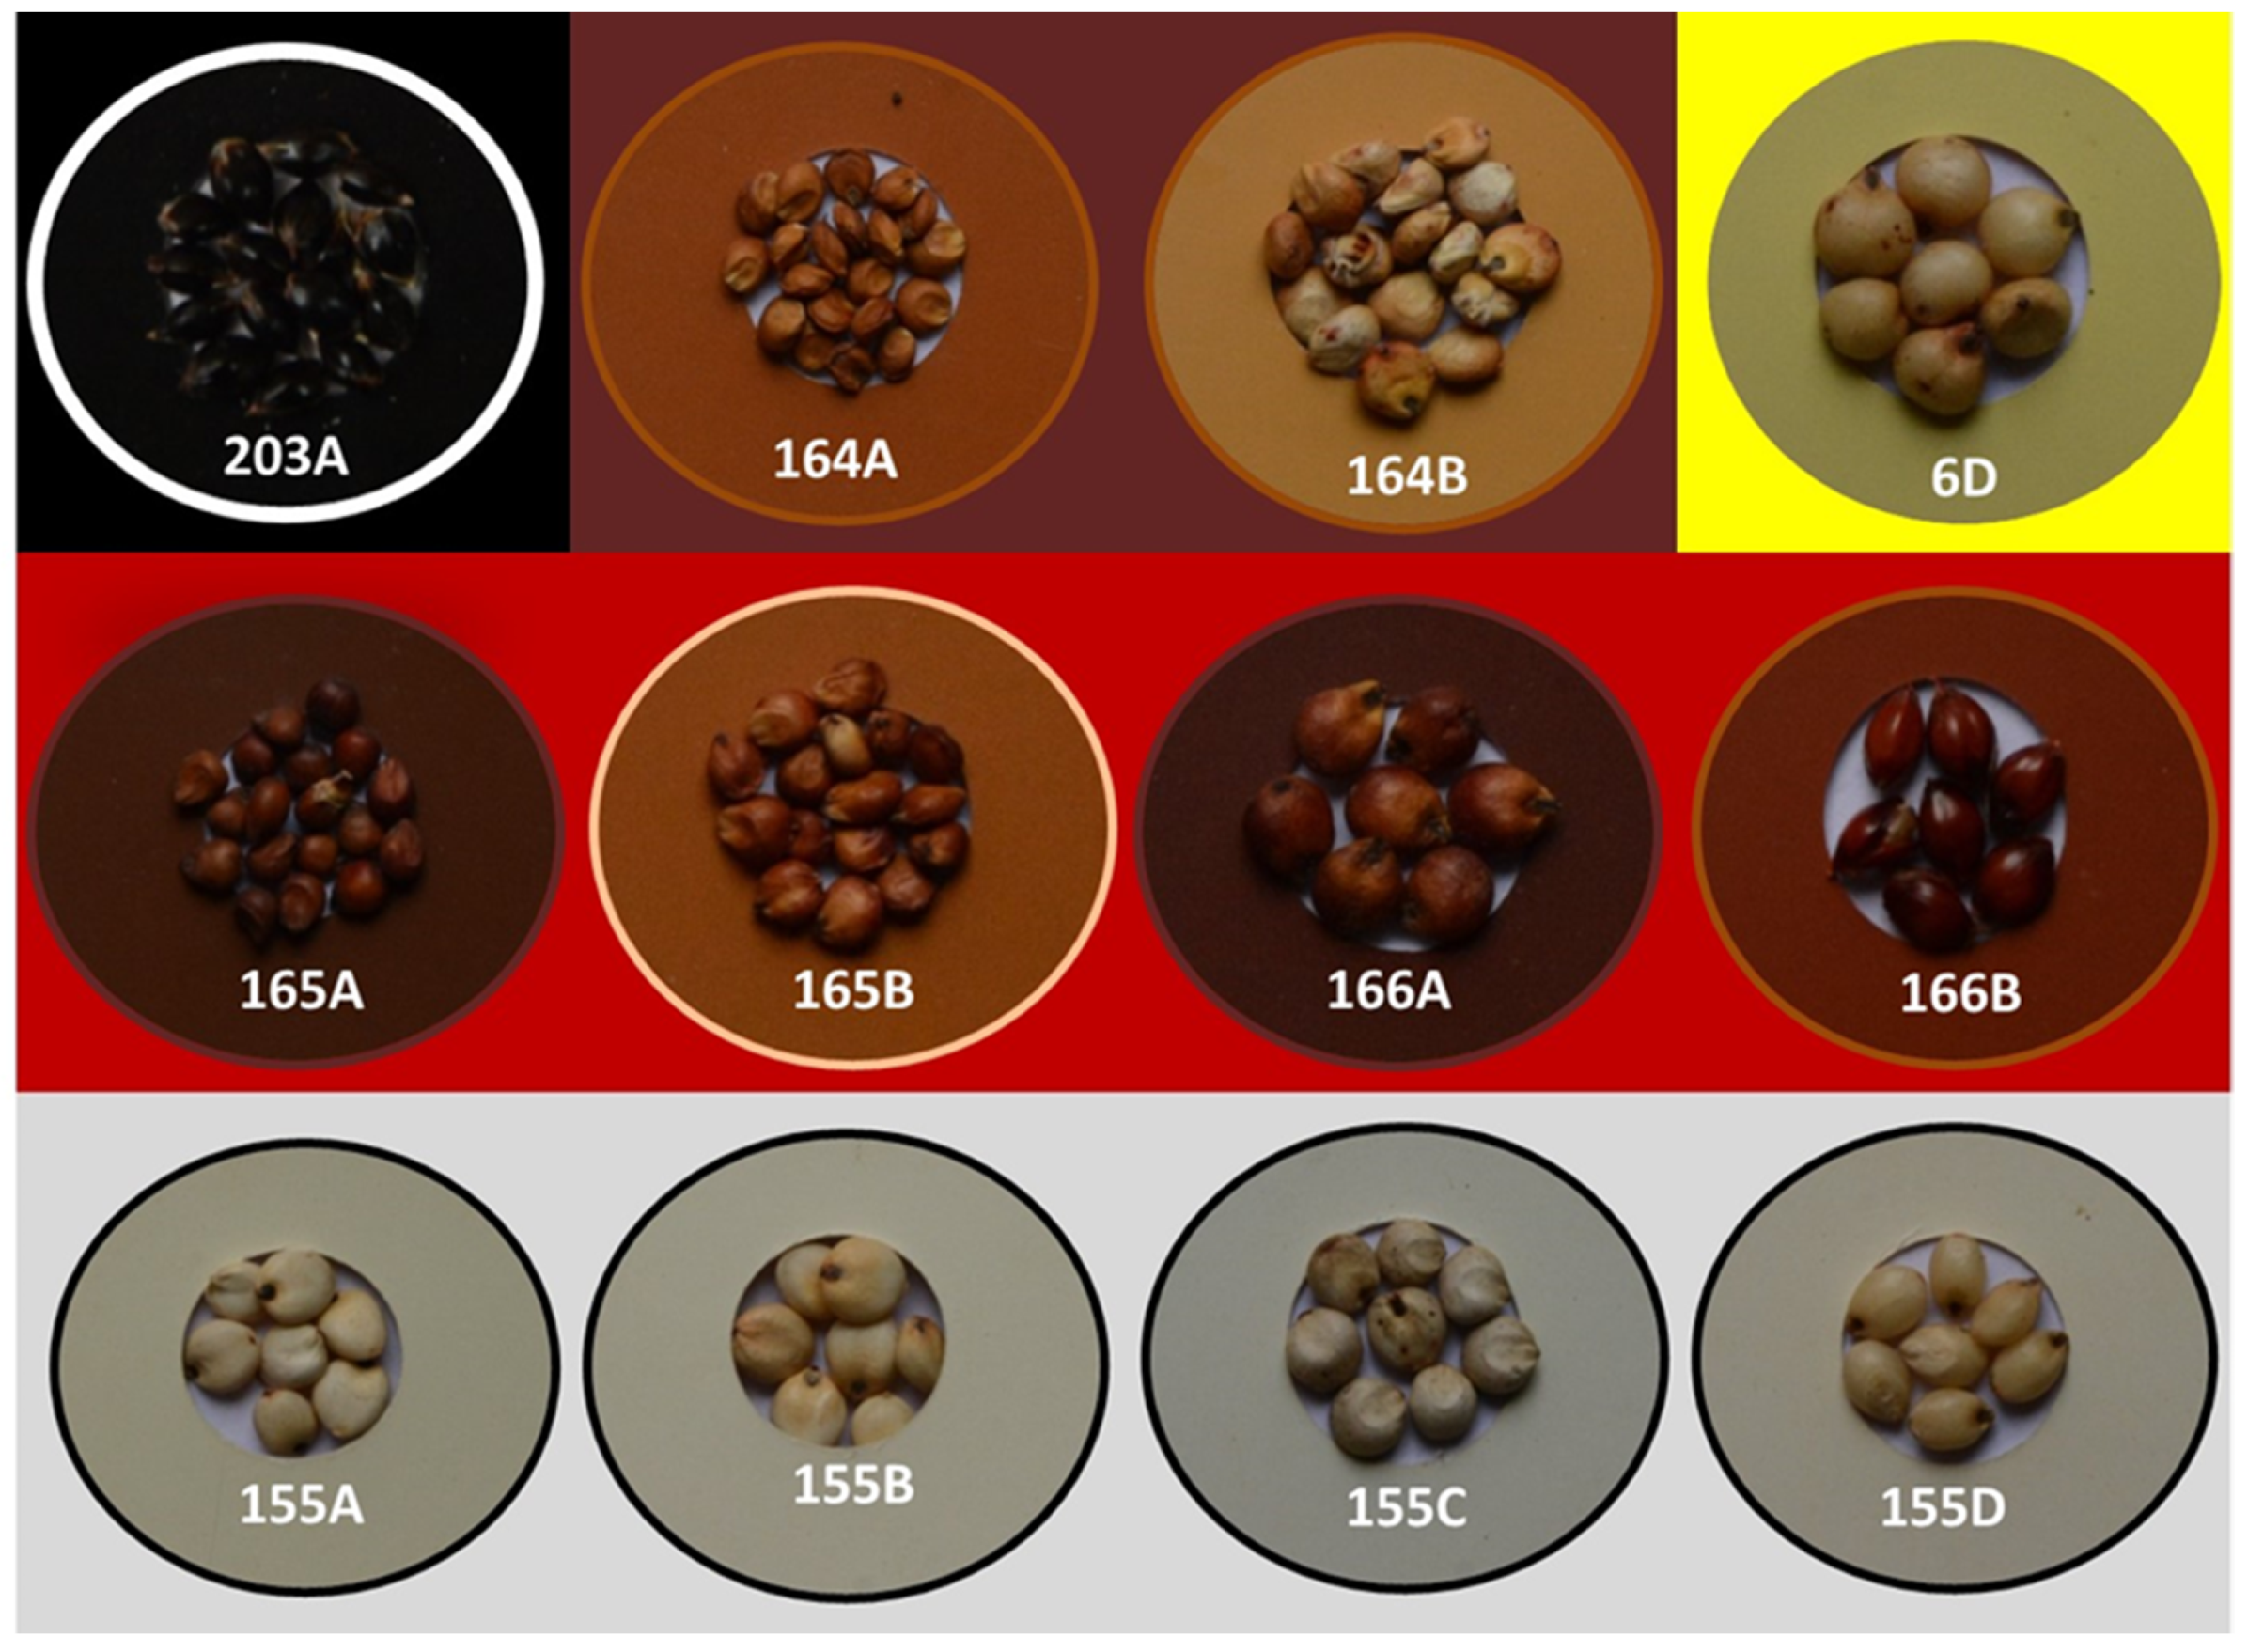
2.2. Grading of Grain Color
2.3. Extraction of Secondary Metabolites and Gas Chromatography-Mass Spectrometry Analysis
2.4. Data Processing and Peak Annotation
2.5. Statistical Analysis
2.6. Pathway Mapping
3. Results
3.1. Genetic Variation for Grain Color
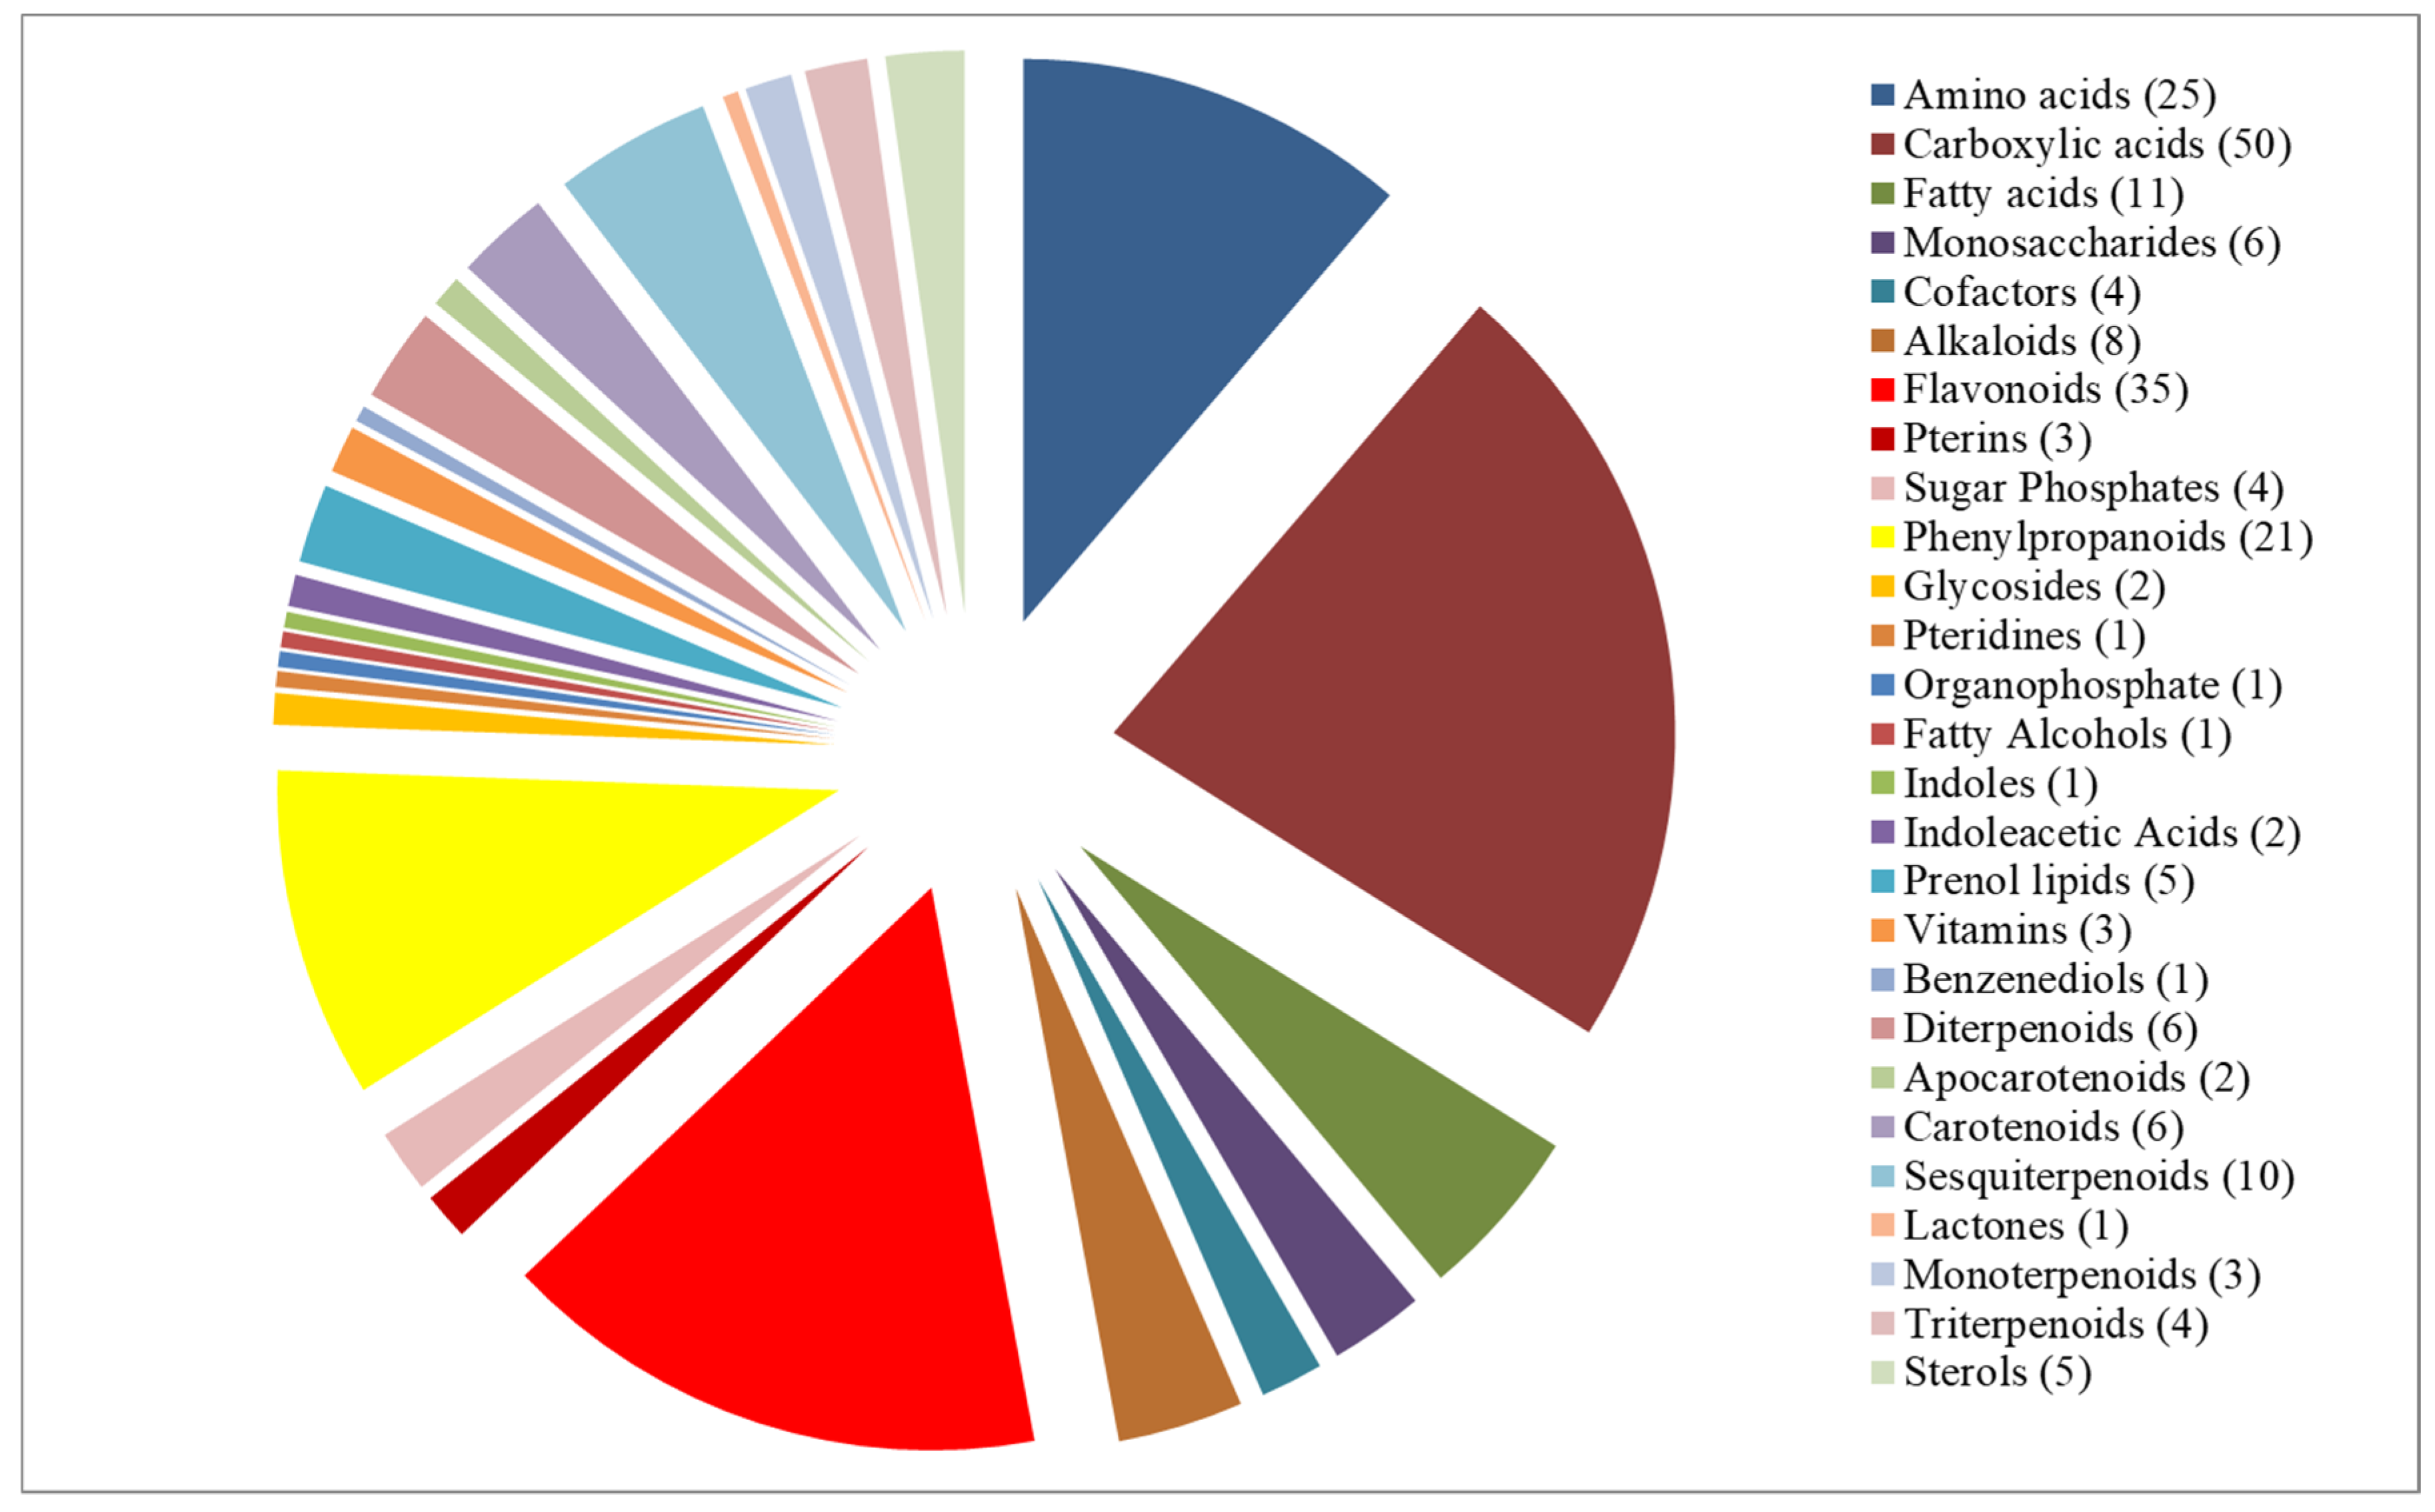
3.2. Metabolic Profile
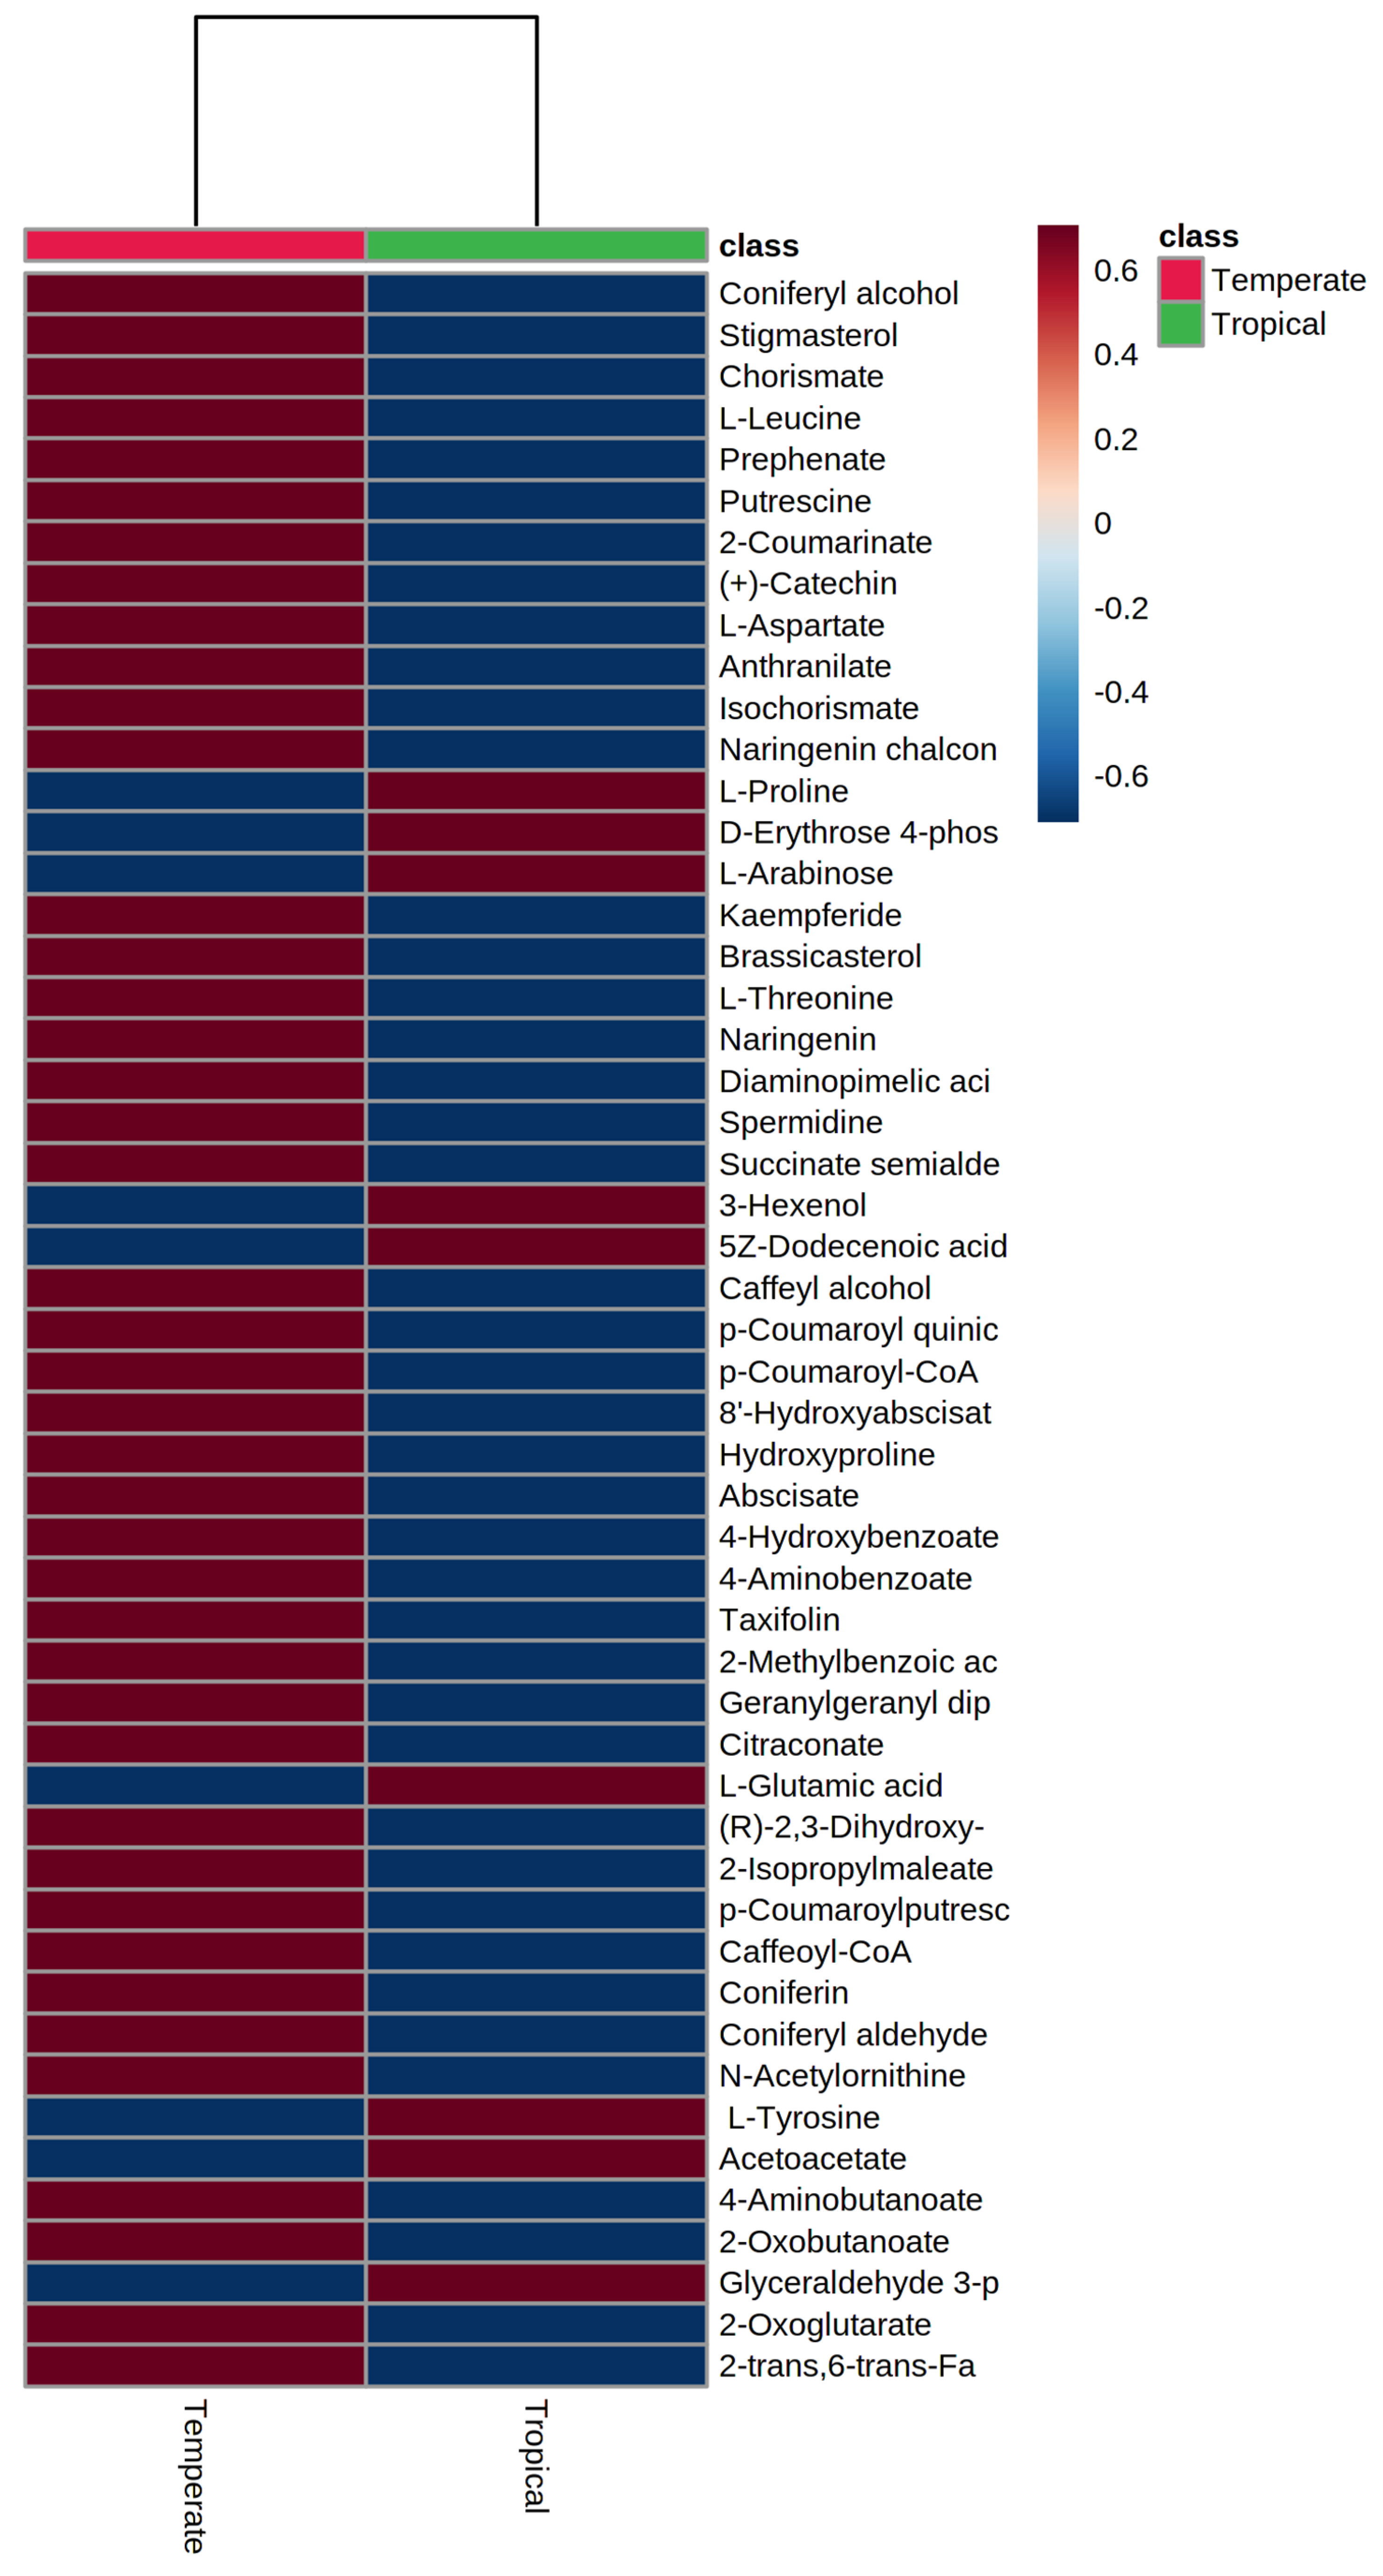
3.3. Grain Metabolome of Temperate and Tropical Sorghums
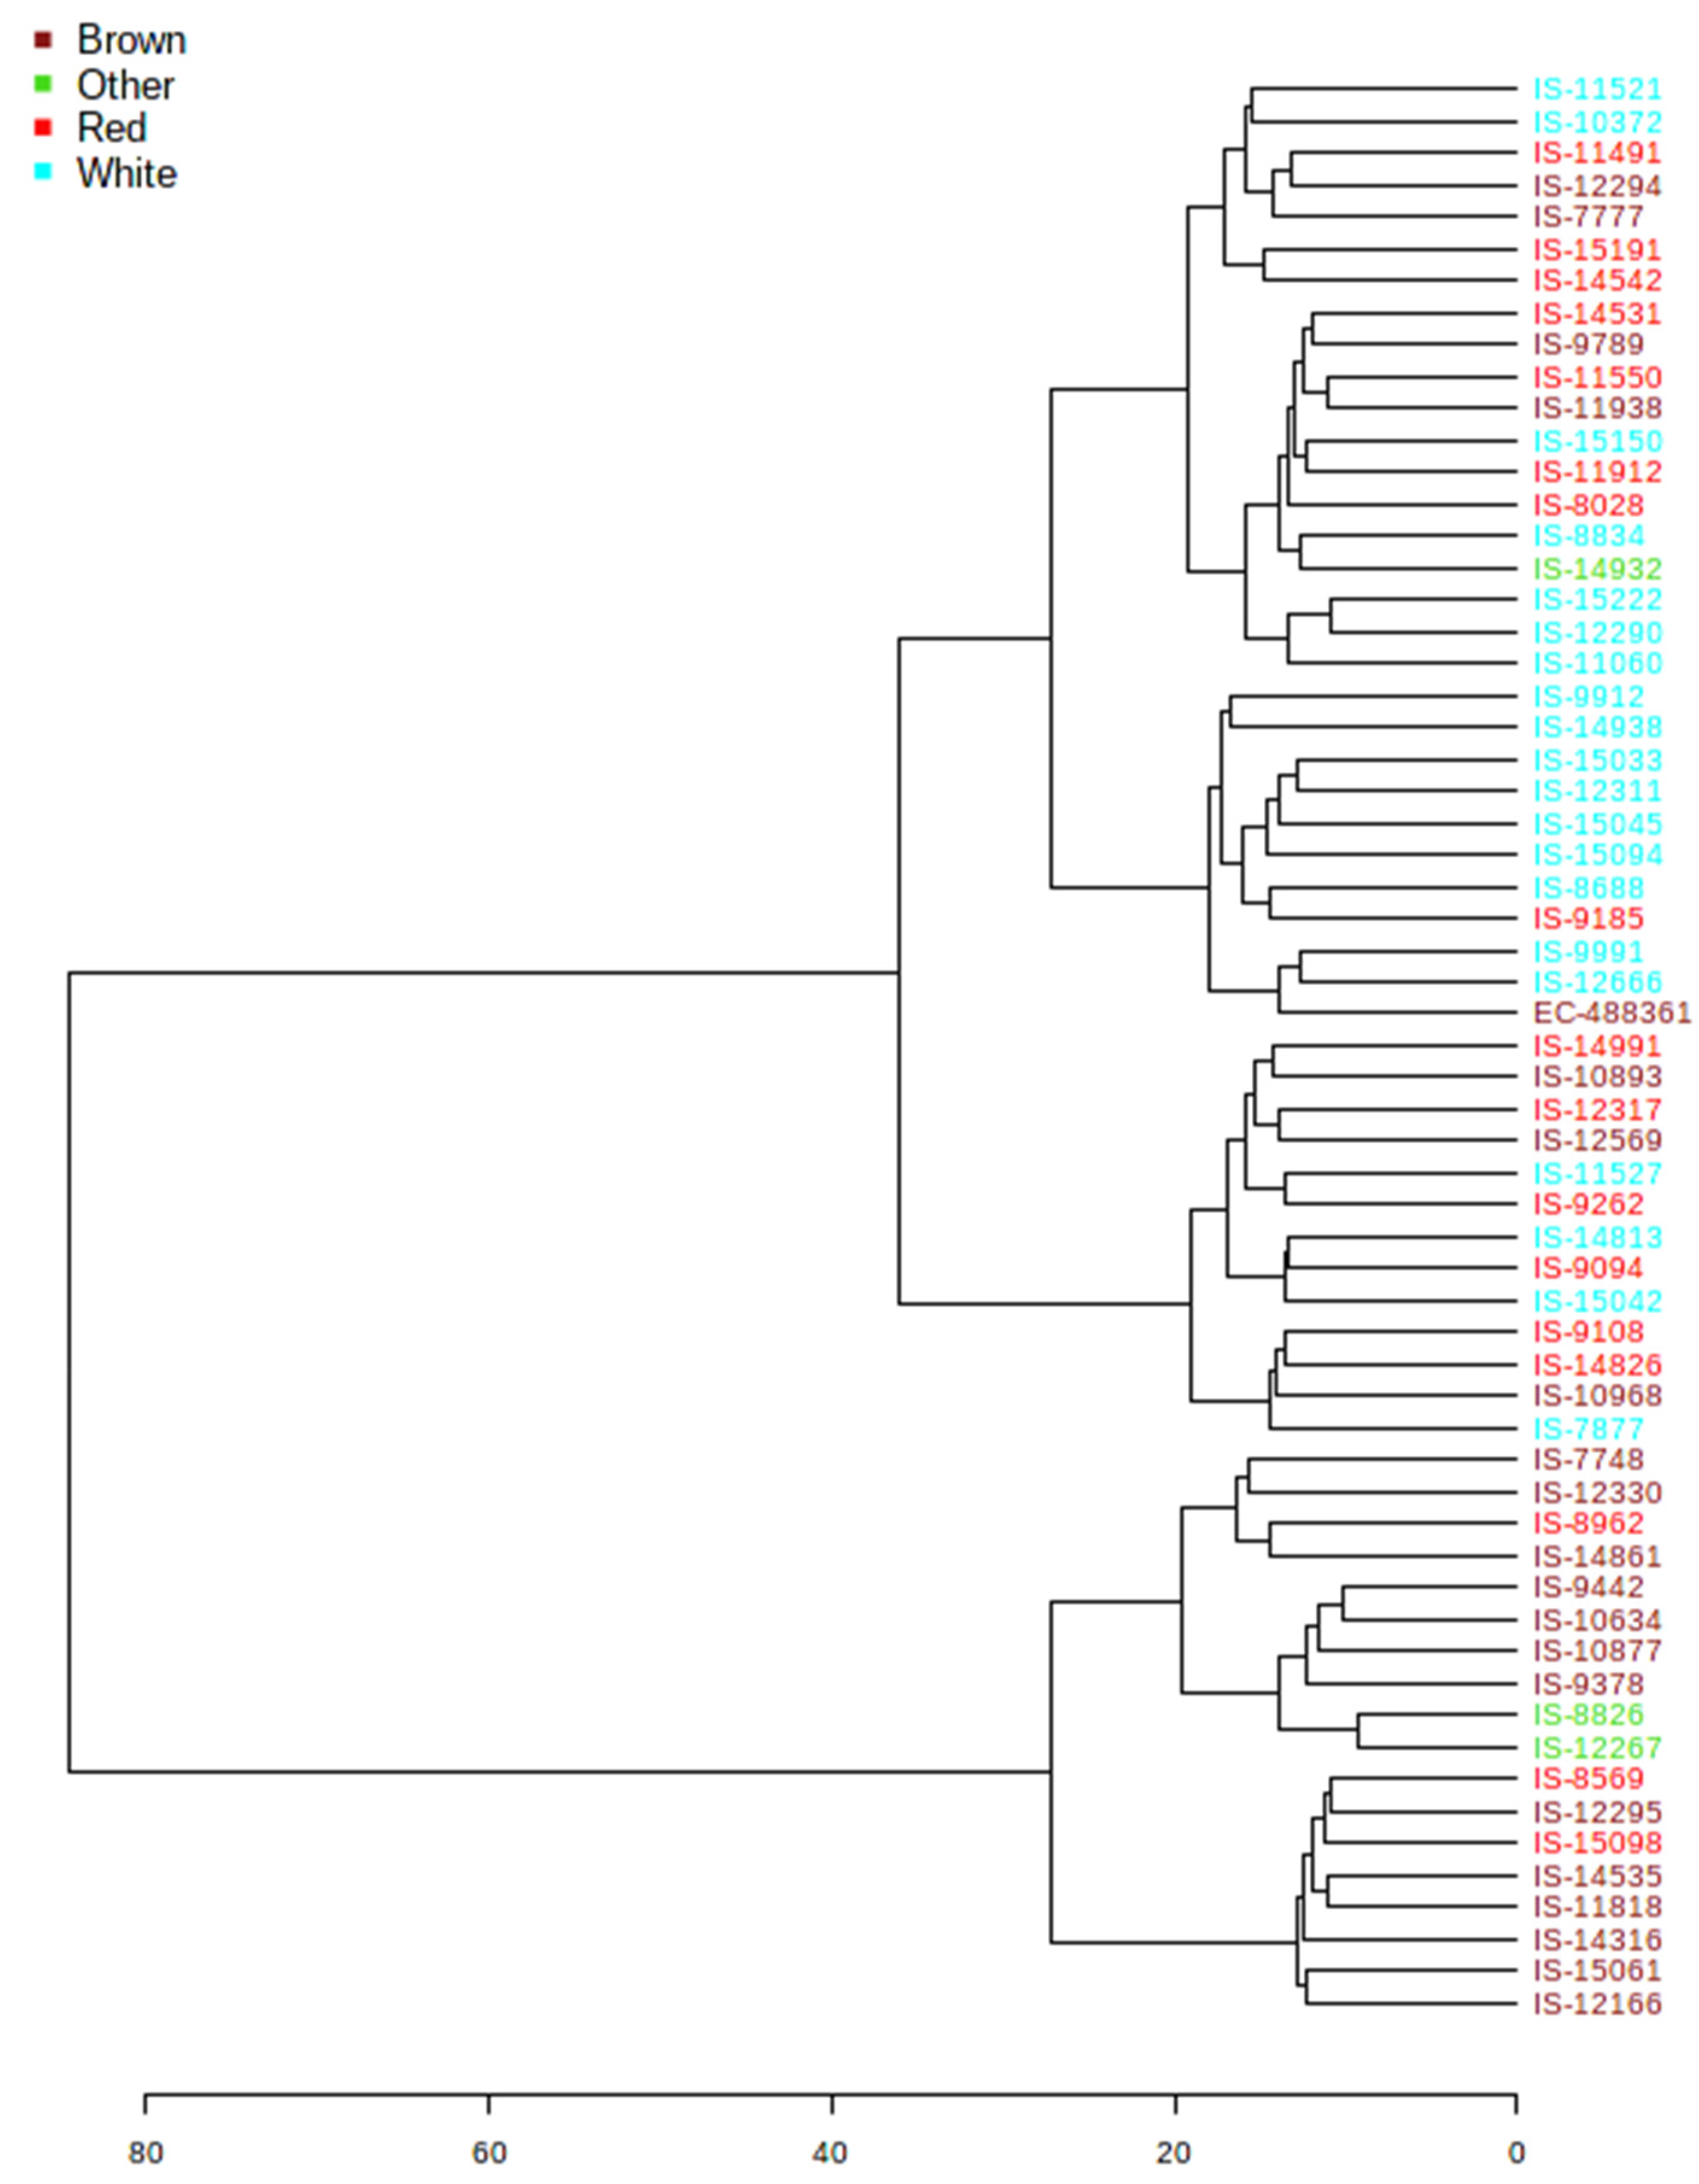
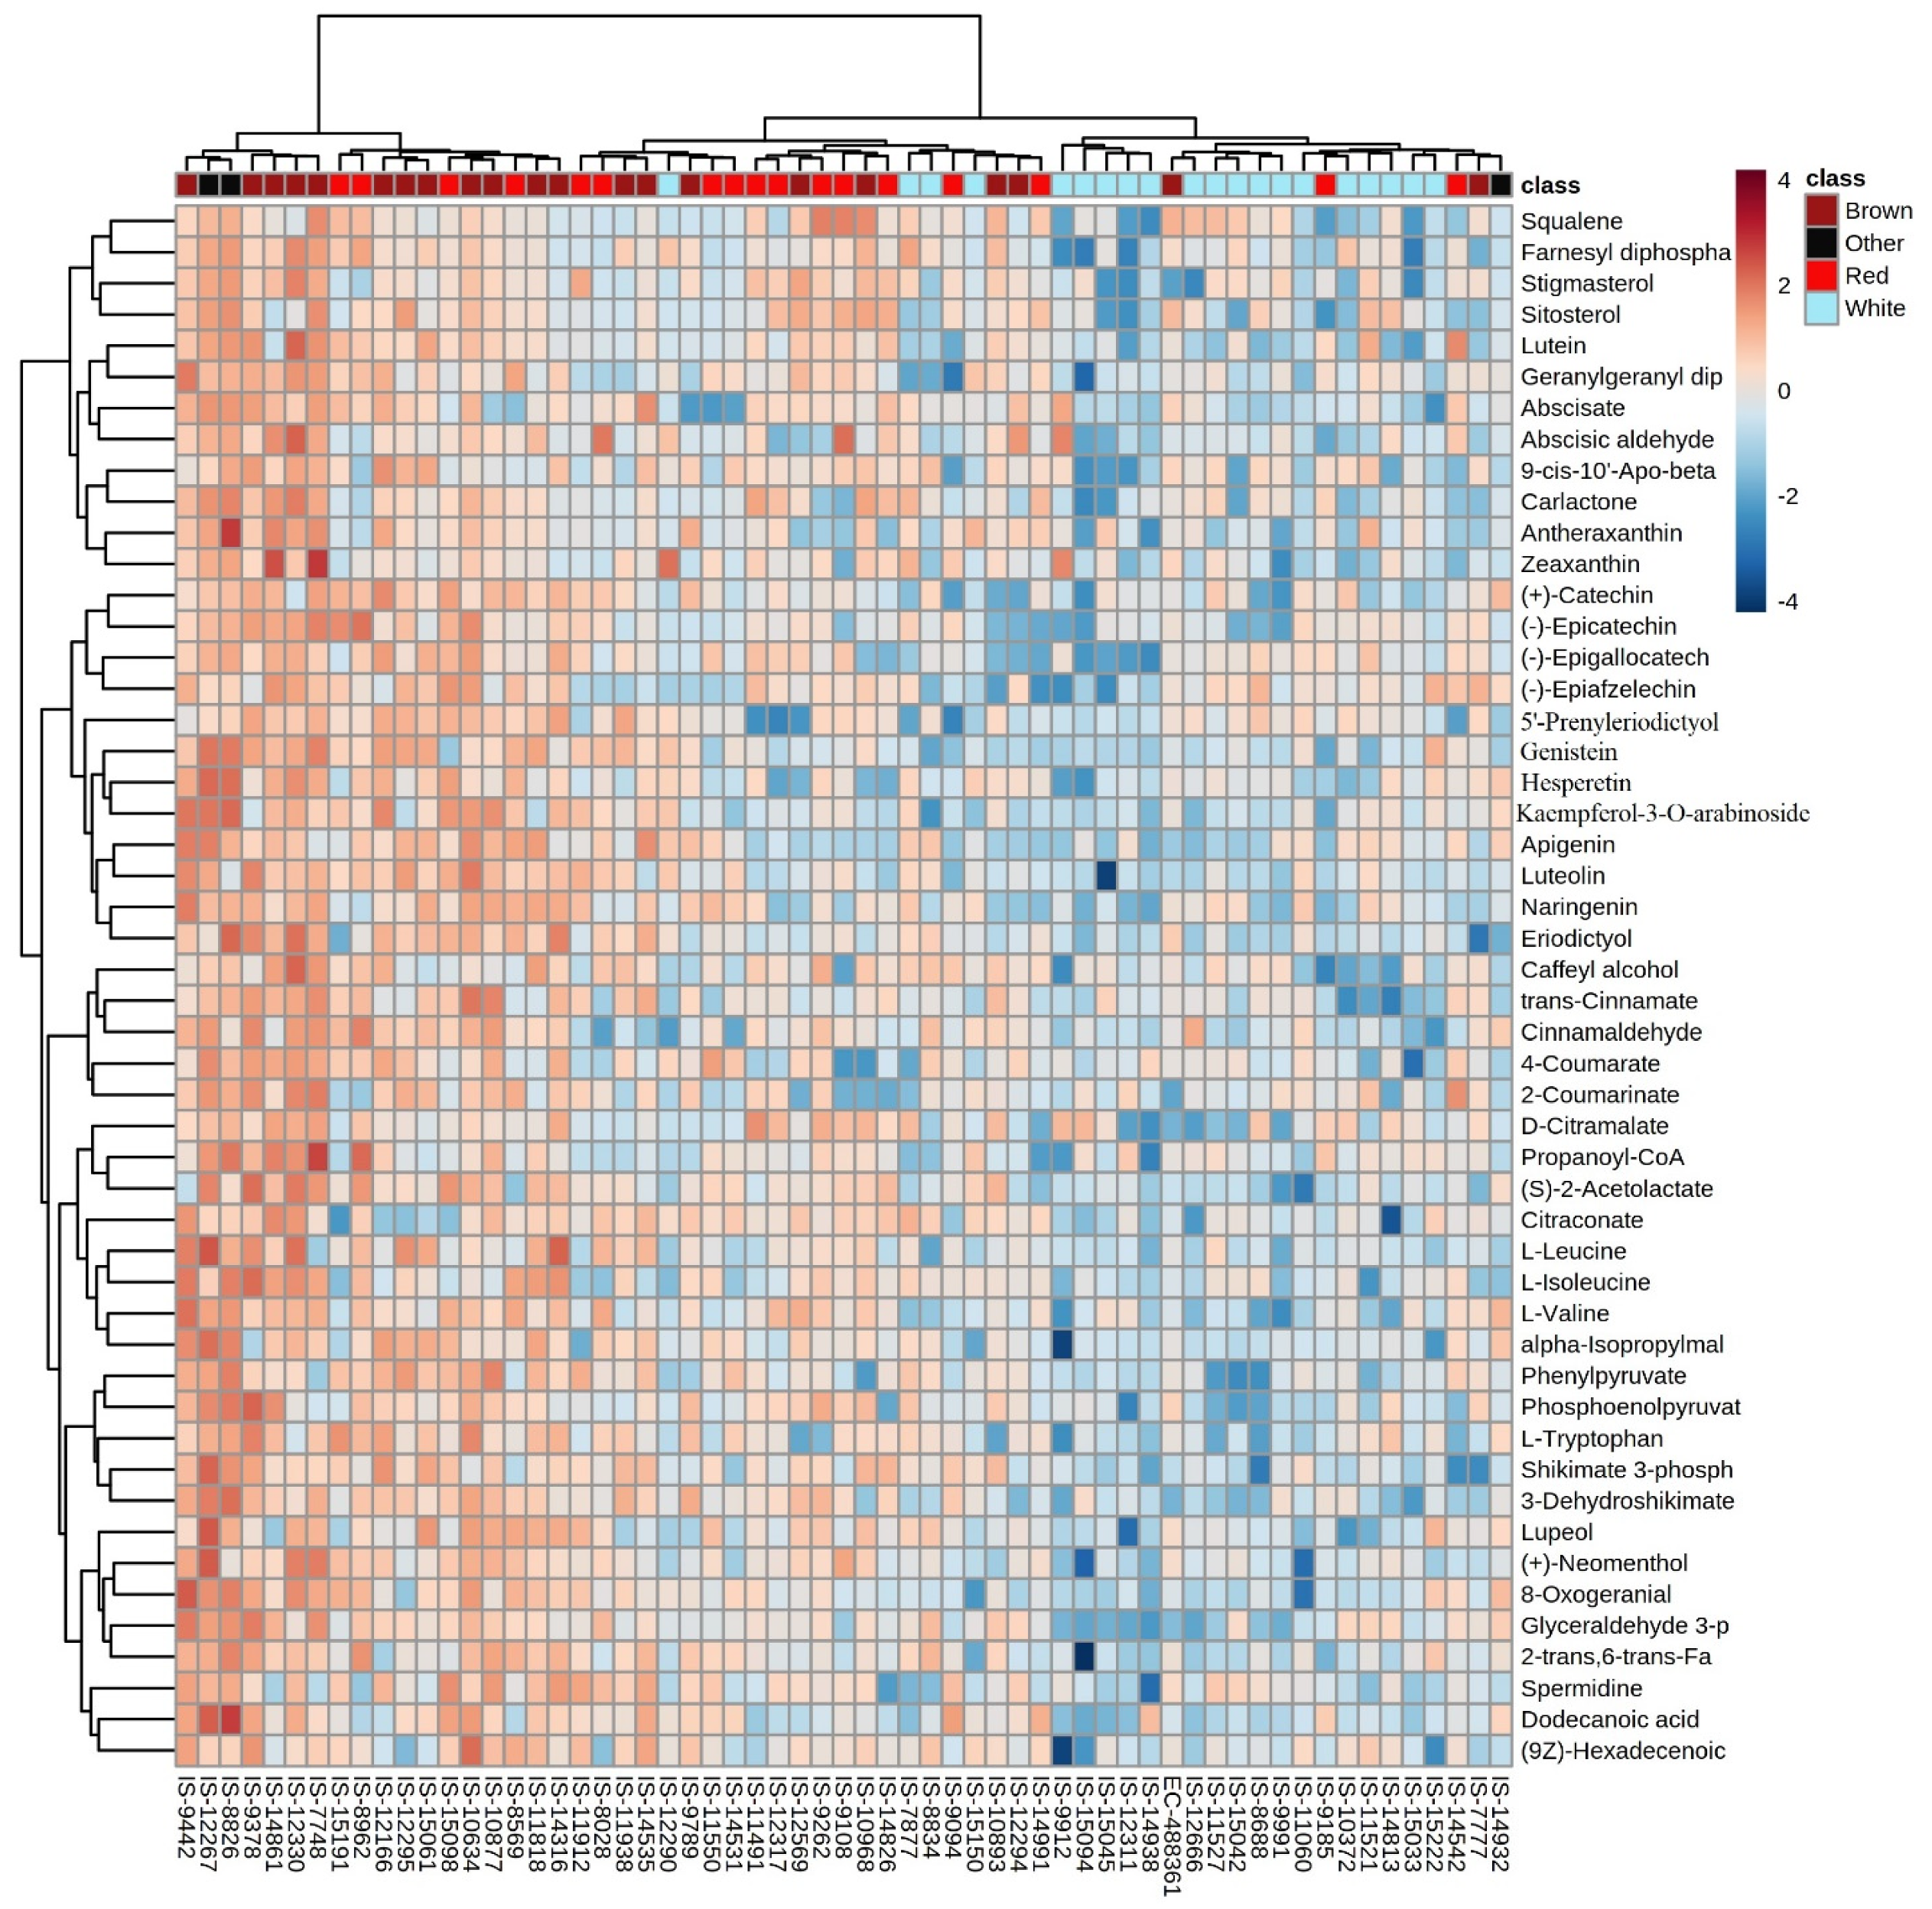
3.4. Hierarchical Clustering
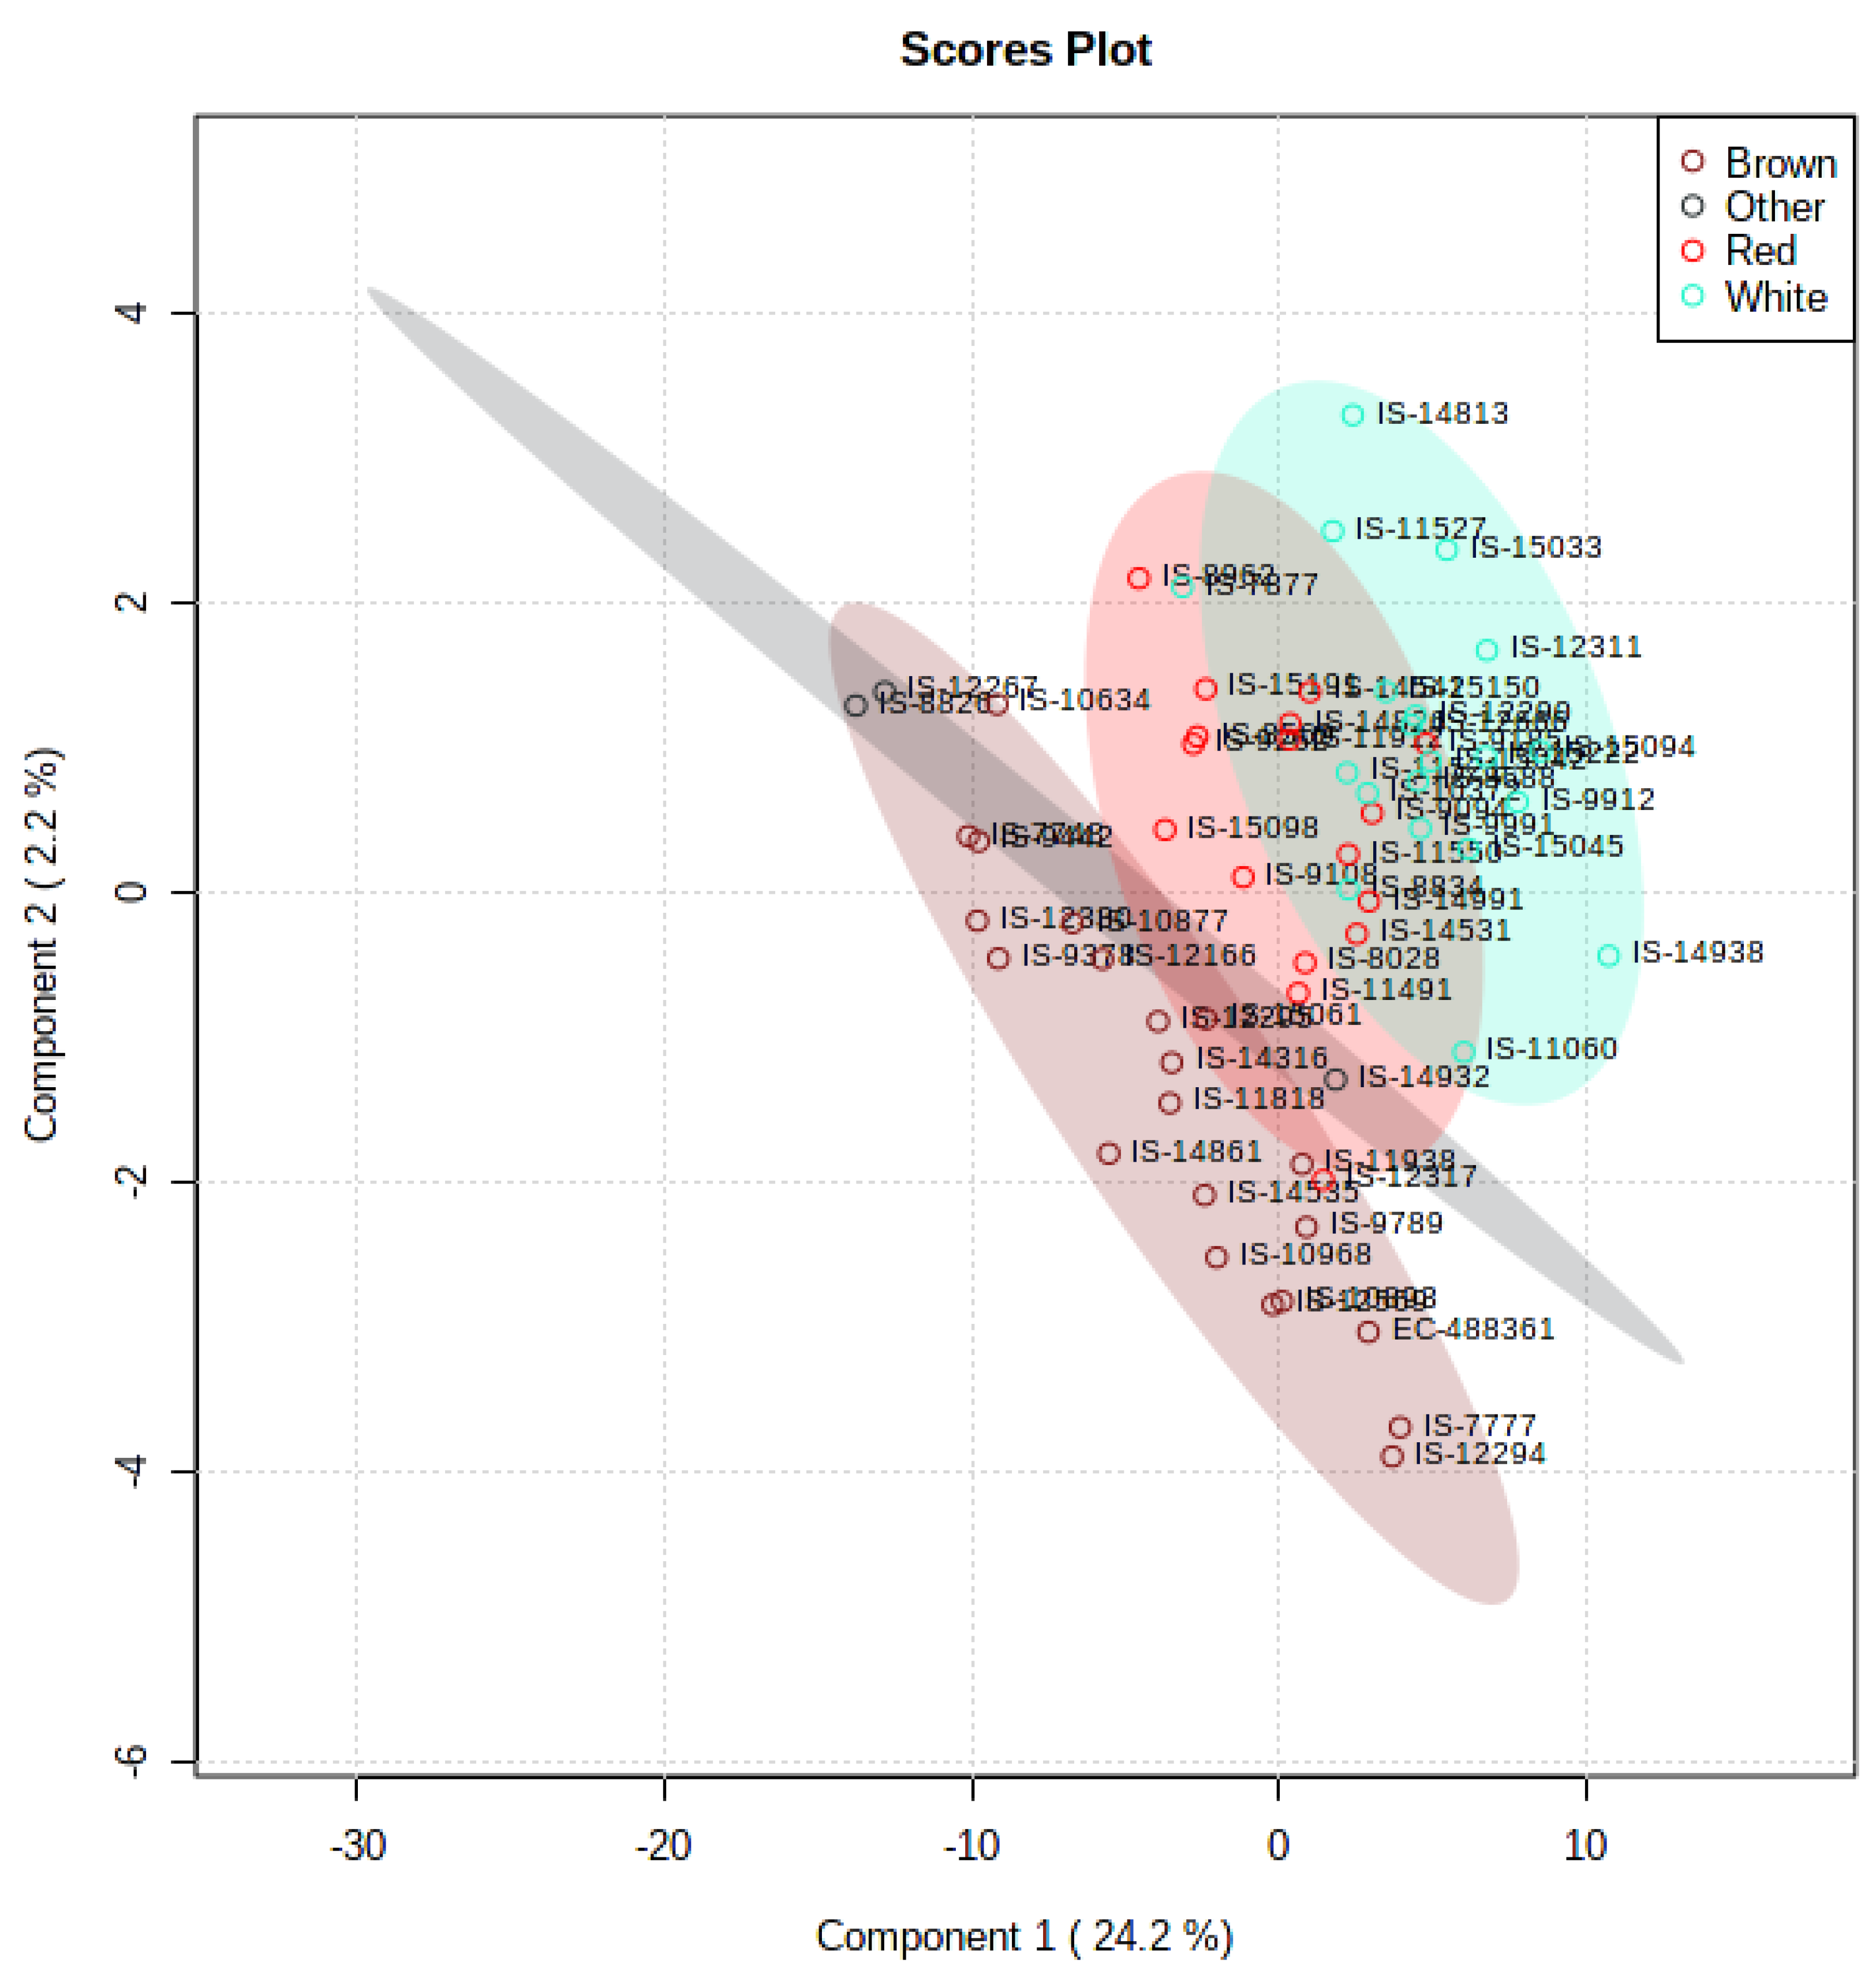
3.5. Multivariate and Univariate Analyses
3.6. Fold Change Analysis
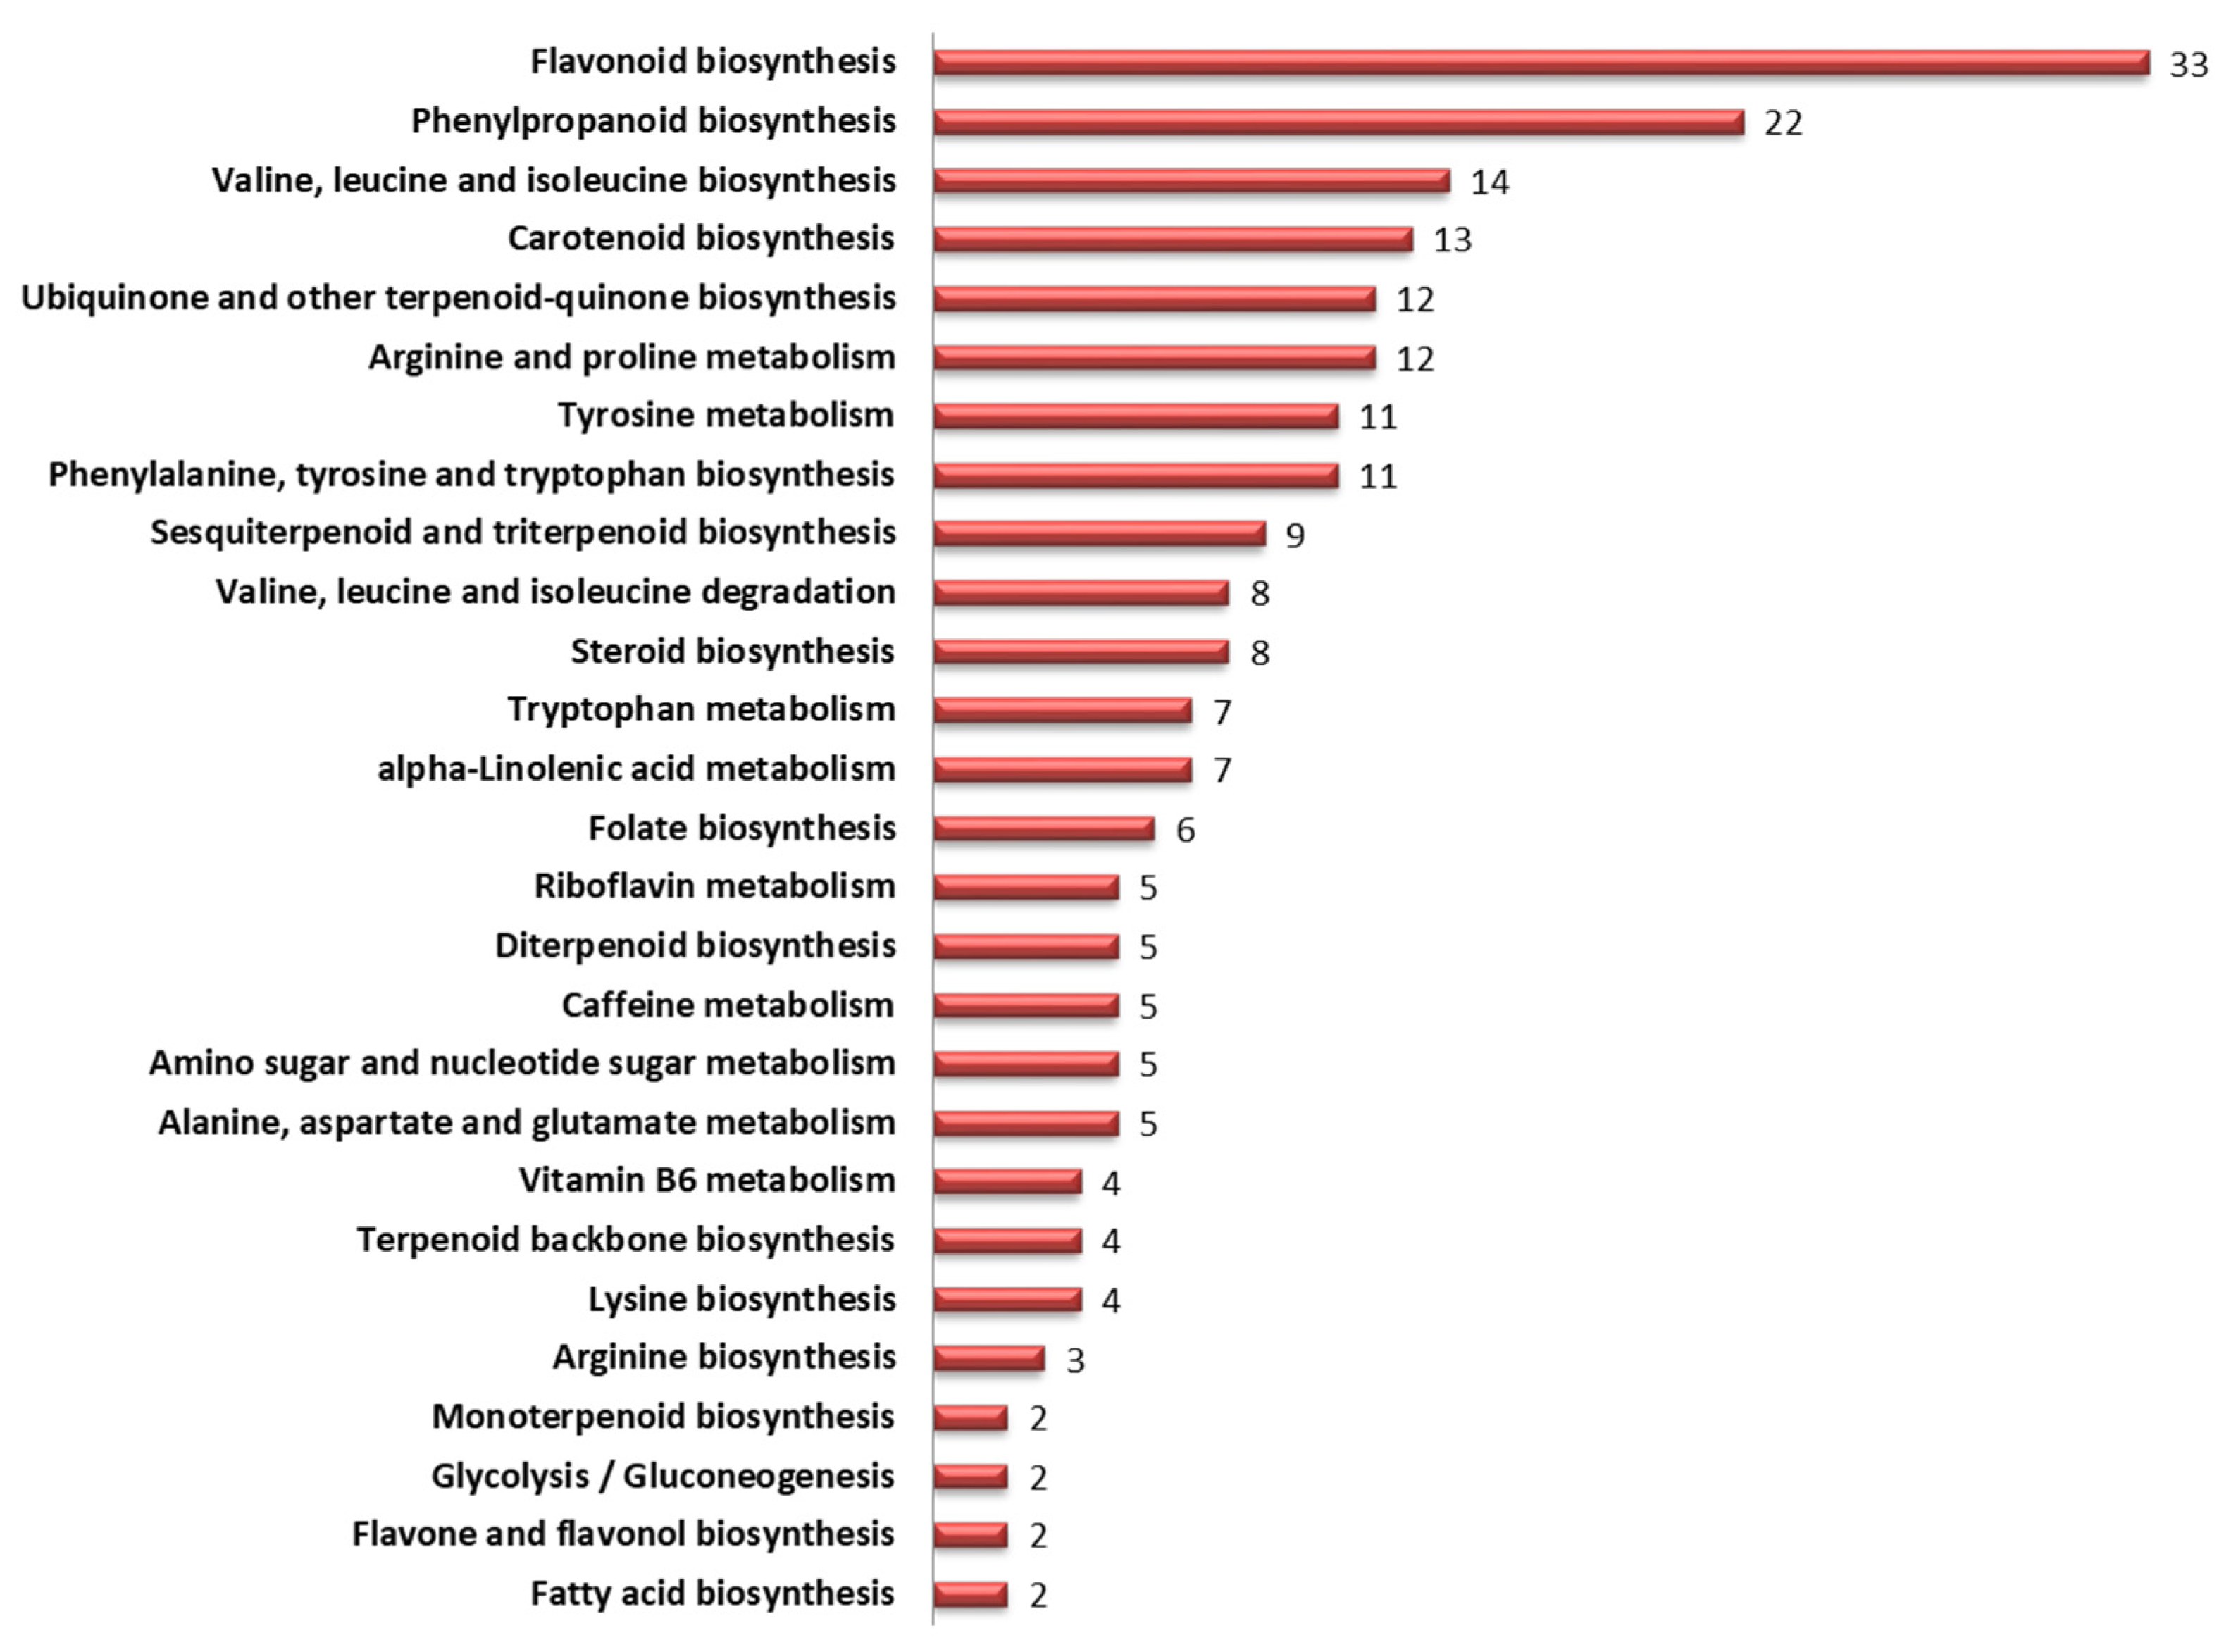
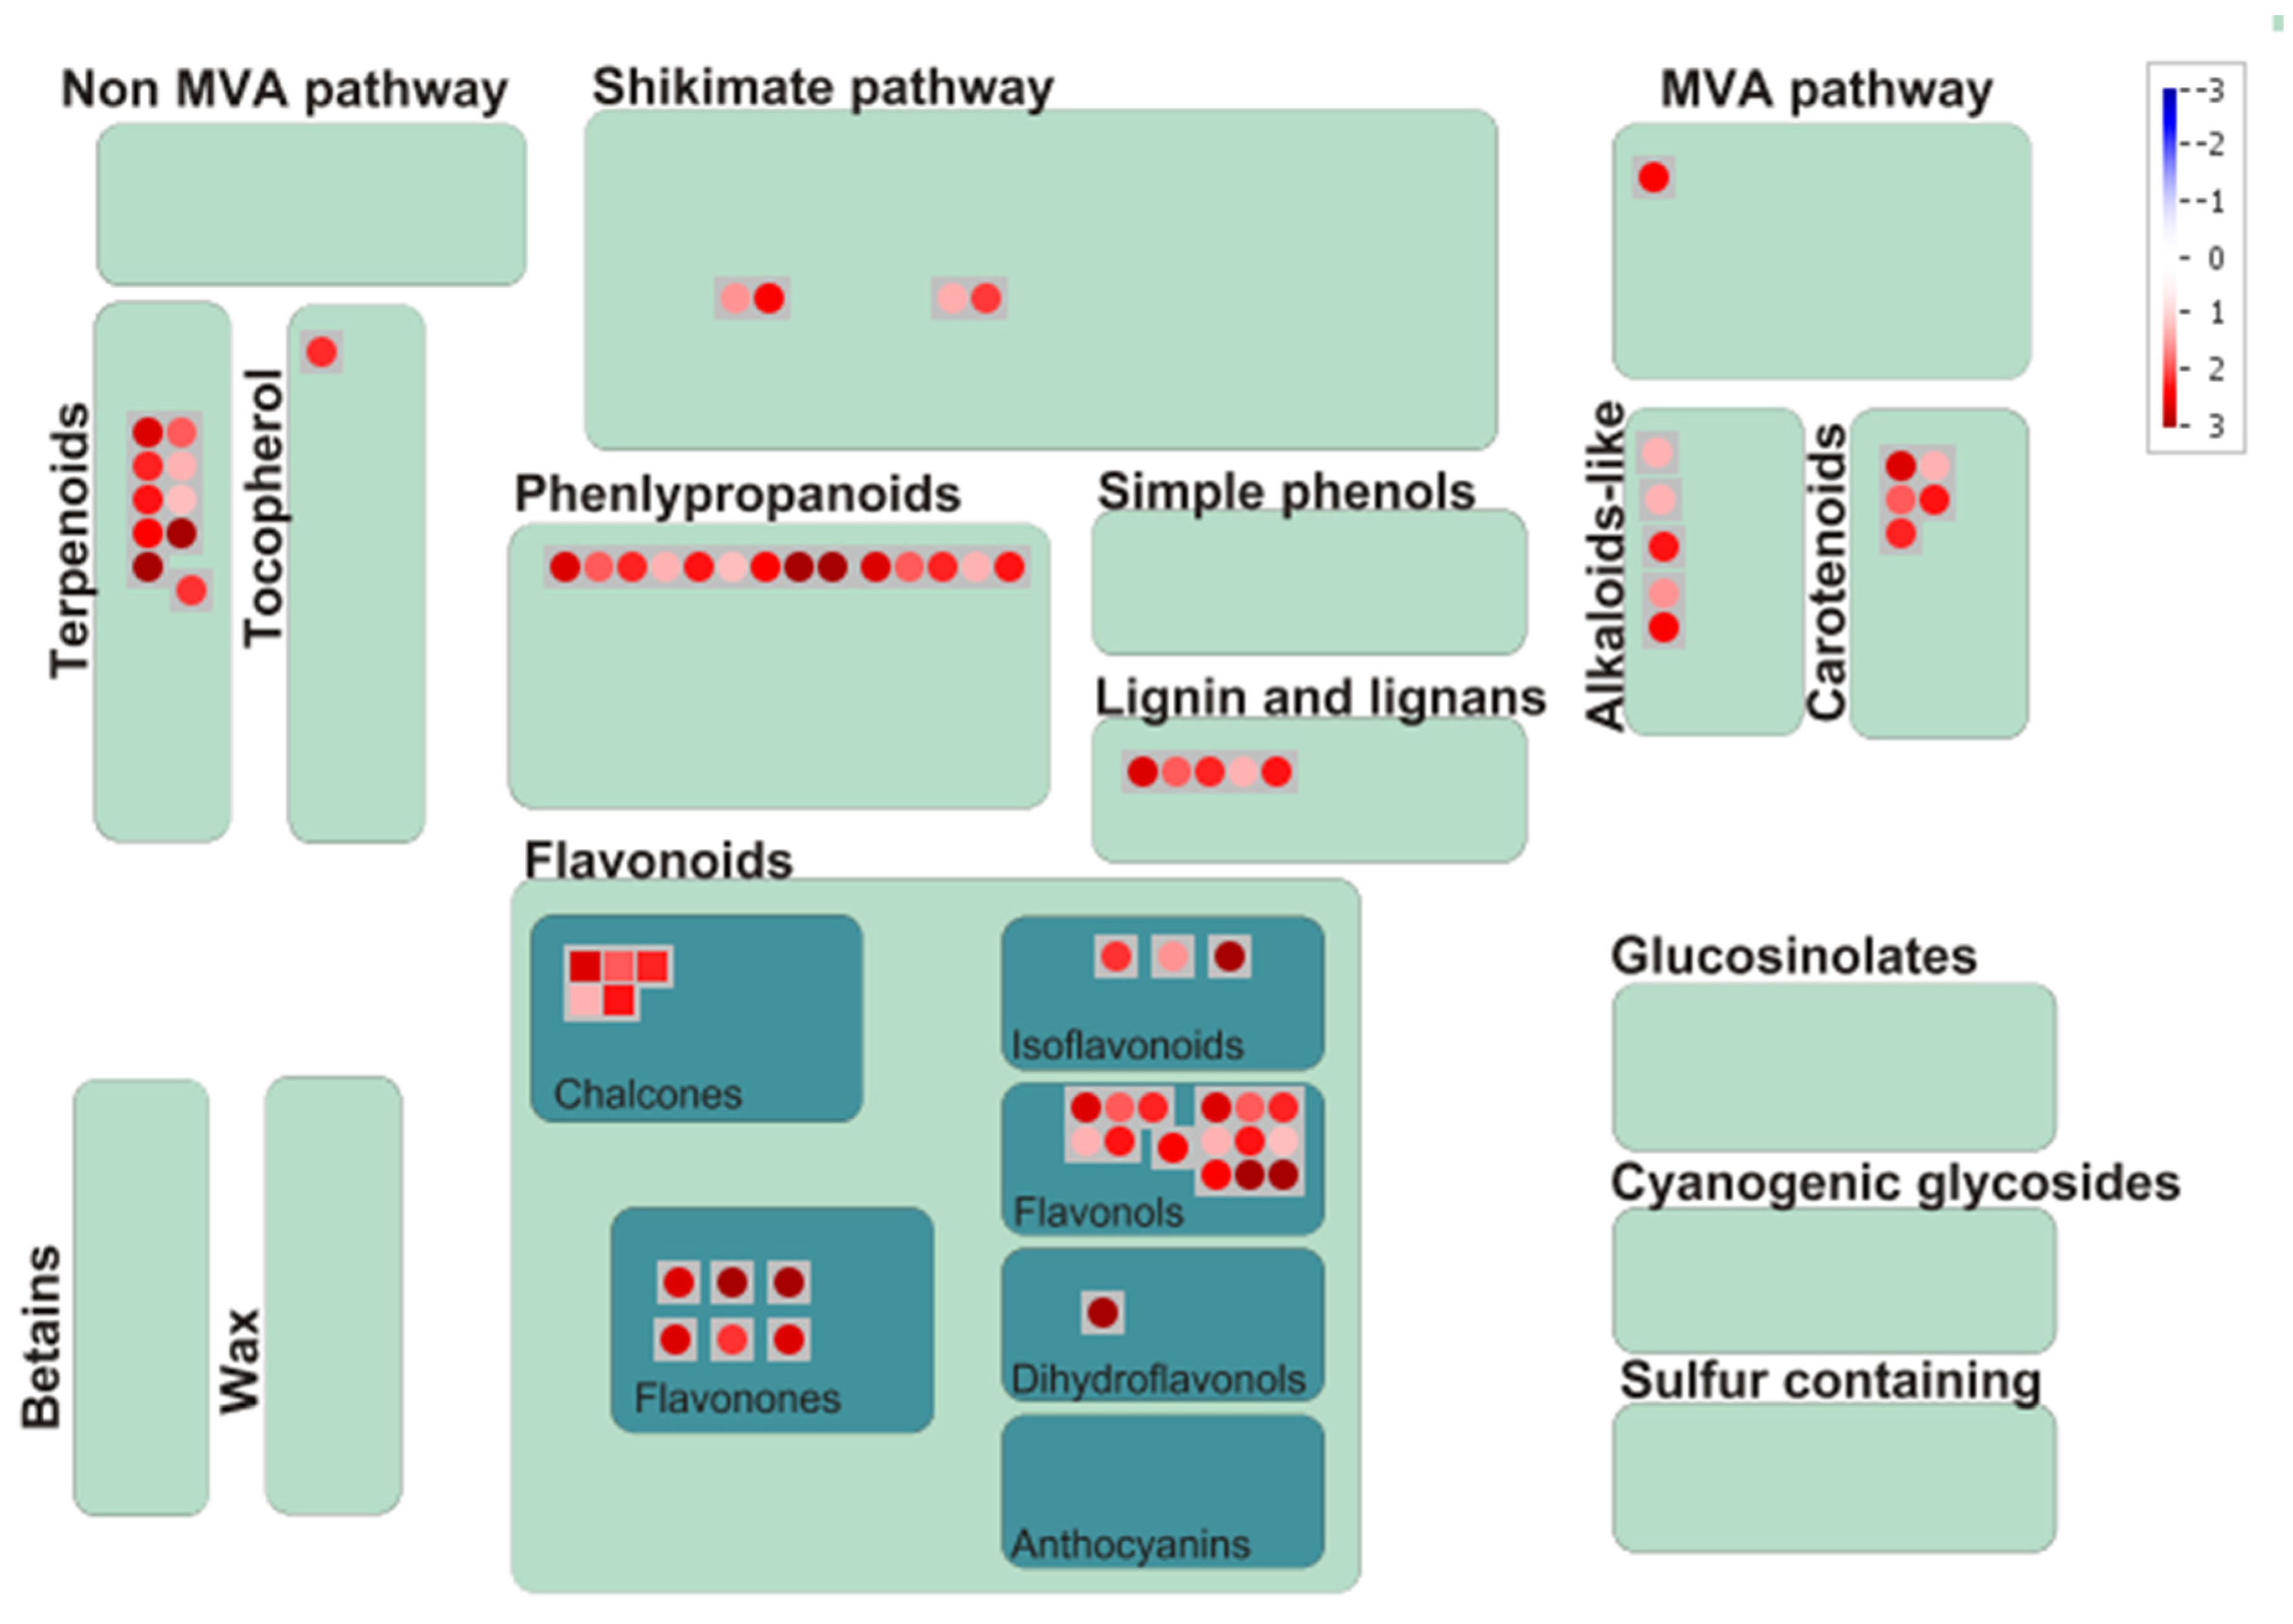
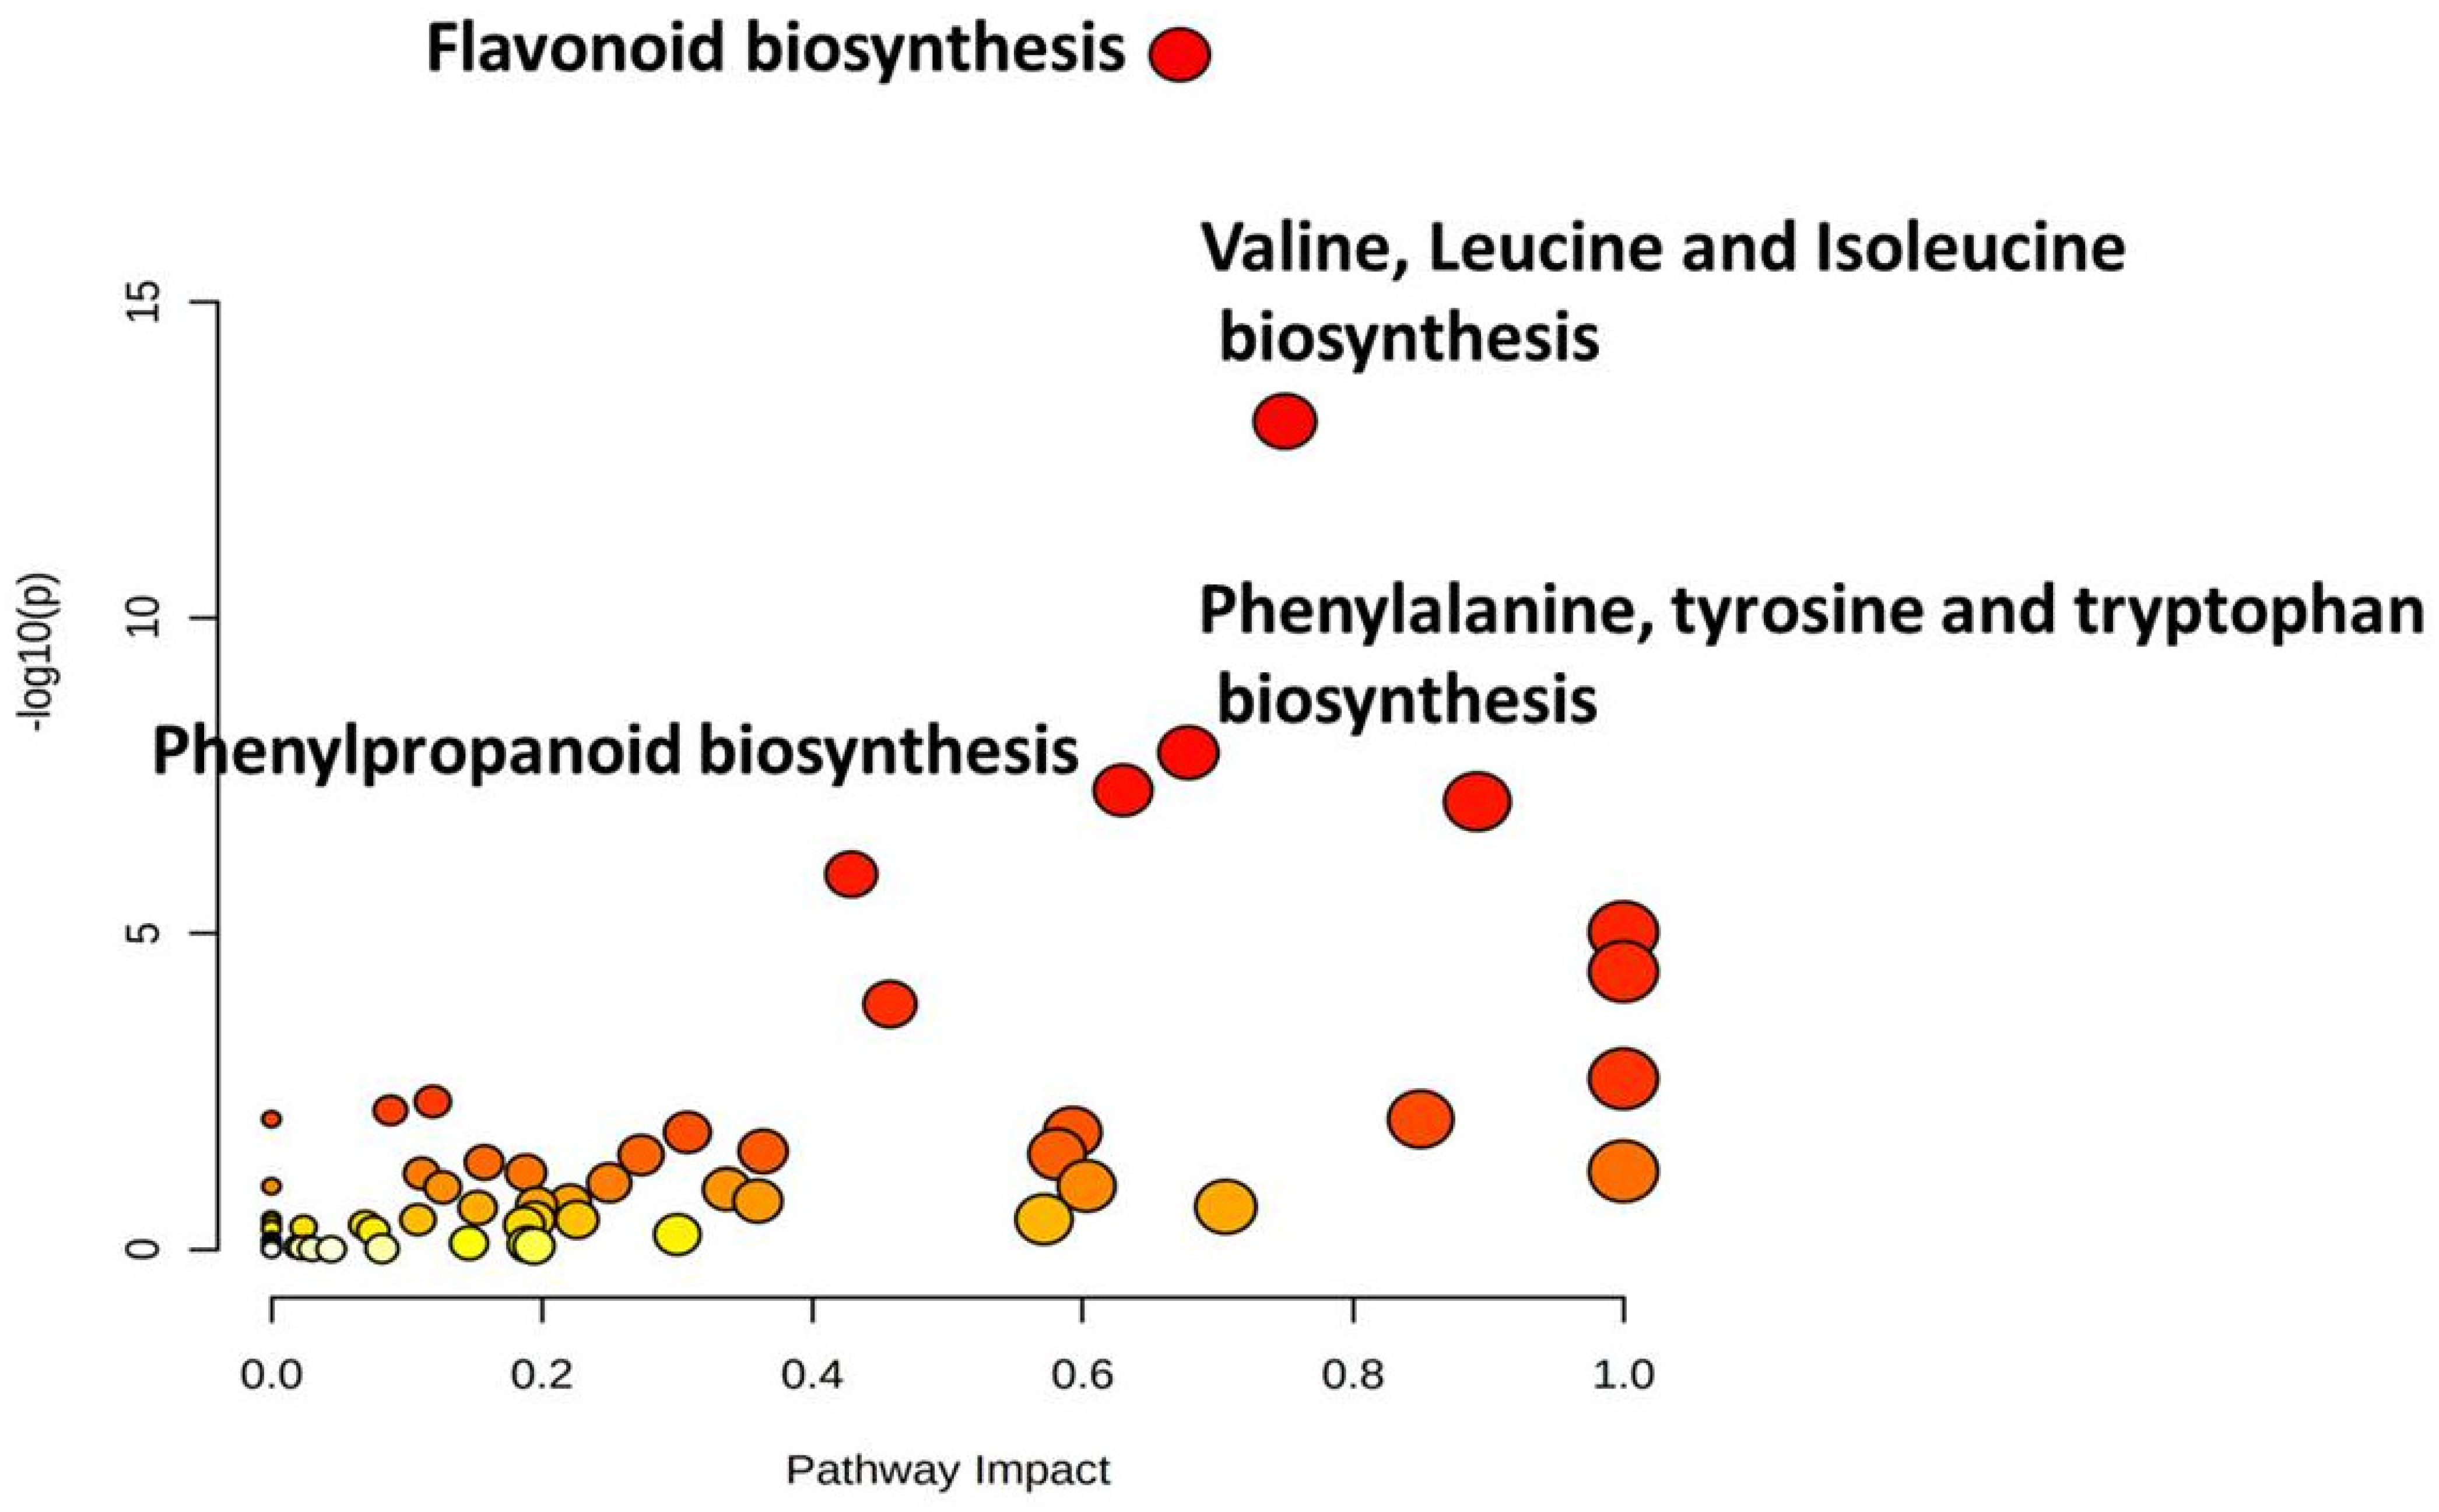
3.7. Mapping of Significant Metabolites onto Metabolic Pathways
4. Discussion
5. Conclusions
Supplementary Materials
Author Contributions
Funding
Institutional Review Board Statement
Informed Consent Statement
Data Availability Statement
Acknowledgments
Conflicts of Interest
References
- FAOSTAT. Statistical Database; Food and Agriculture Organization of the United Nations: Rome, Italy, 2019. [Google Scholar]
- Ciampitti, I.A.; Prasad, P.V.V. Sorghum: State of the Art and Future Perspective; Monograph 58; American Society of Agronomy: Madison, WI, USA, 2019. [Google Scholar]
- ICRISAT. The World Sorghum and Millet Economies: Facts, Trends and Outlook; International Crops Research Institute for the Semi-Arid Tropics: Hyderabad, India; FAO: Rome, Italy, 1996. [Google Scholar]
- Getachew, G.; Putnam, D.H.; De Ben, C.M.; De Peters, E.J. Potential of sorghum as an alternative to corn forage. Am. J. Plant Sci. 2016, 7, 1106–1121. [Google Scholar] [CrossRef] [Green Version]
- Ayseli, M.T.; Ayseli, Y.I. Flavors of the future: Health benefits of flavor precursors and volatile compounds in plant foods. Trends Food Sci. Technol. 2016, 48, 69–77. [Google Scholar] [CrossRef]
- Awika, J.M.; Rooney, W.L. Sorghum phytochemicals and their potential impact on human health. Phytochemistry 2004, 65, 1199–1221. [Google Scholar] [CrossRef]
- Dykes, L.; Rooney, L. Phenolic compounds in cereal grains and their health benefits. Cereal Foods World 2007, 52, 105–111. [Google Scholar] [CrossRef]
- Shen, S.; Huang, R.; Li, C.; Wu, W.; Chen, H.; Shi, J.; Chen, S.; Ye, X. Phenolic compositions and antioxidant activities differ significantly among sorghum grains with different applications. Molecules 2018, 23, 1203. [Google Scholar] [CrossRef] [Green Version]
- Xiong, Y.; Zhang, P.; Warner, R.D.; Fang, Z. Sorghum grain: From accession, nutrition, and phenolic profile to its health benefits and food applications. Compr. Rev. Food Sci. Food Saf. 2019, 18, 2025–2046. [Google Scholar] [CrossRef] [Green Version]
- Lee, S.H.; Lee, J.; Herald, T.; Cox, S.; Noronha, L.; Perumal, R.; Smolensky, D. Anti-cancer activity of a novel high phenolic sorghum bran in human colon cancer cells. Oxid. Med. Cell. Longev. 2020, 2020, 2890536. [Google Scholar] [CrossRef]
- Lee, S.H.; Lee, H.S.; Lee, J.; Amarakoon, D.; Lou, Z.; Leela, E.; Noronha, L.; Herald, T.; Perumal, R.; Smolensky, D. Tumor suppressive activity of polyphenol containing sorghum brans in colon cancer model. Int. J. Mol. Sci. 2021, 22, 8286. [Google Scholar] [CrossRef]
- Burdette, A.; Garner, P.L.; Mayer, E.P.; Hargrove, J.L.; Hartle, D.K.; Greenspan, P. Anti-inflammatory activity of select sorghum (Sorghum bicolor) brans. J. Med. Food 2010, 13, 879–887. [Google Scholar] [CrossRef] [Green Version]
- Ofosu, F.K.; Elahi, E.; Daliri, E.B.-M.; Chelliah, R.; Ham, H.J.; Kim, J.-H.; Han, S.-I.; Hur, J.H.; Oh, D.-H. Phenolic profile, an-tioxidant, and antidiabetic potential exerted by millet grain varieites. Antioxidants 2020, 9, 254. [Google Scholar] [CrossRef] [Green Version]
- Moraes, É.A.; da Silva Marineli, R.; Lenquiste, S.A.; Steel, C.J.; de Menezes, C.B.; Queiroz, V.A.V.; Júnior, M.R.M. Sorghum flour fractions: Correlations among polysaccharides, phenolic compounds, antioxidant activity and glycemic index. Food Chem. 2015, 180, 116–123. [Google Scholar] [CrossRef]
- Rao, S.; Santhakumar, A.B.; Chinkwo, K.A.; Wu, G.; Johnson, S.K.; Blanchard, C.L. Characterization of phenolic compounds and antioxidant activity in sorghum grains. J. Cereal Sci. 2018, 84, 103–111. [Google Scholar] [CrossRef]
- Wu, G.; Bennett, S.J.; Bornman, J.F.; Clarke, M.; Fang, Z.; Johnson, S.K. Phenolic profile and content of sorghum grains under different irrigation managements. Food Res. Int. 2017, 97, 347–355. [Google Scholar] [CrossRef] [PubMed] [Green Version]
- Dykes, L.; Rooney, L.W.; Waniska, R.D.; Rooney, W.L. Phenolic compounds and antioxidant activity of sorghum grains of varying accessions. J. Agric. Food Chem. 2005, 53, 6813–6818. [Google Scholar] [CrossRef] [PubMed]
- Chiremba, C.; Taylor, J.R.N.; Duodu, K.G. Phenolic content, antioxidant activity, and consumer acceptability of sorghum cookies. Cereal Chem. J. 2009, 86, 590–594. [Google Scholar] [CrossRef]
- Liu, L.; Herald, T.J.; Wang, D.; Wilson, J.D.; Bean, S.; Aramouni, F.M. Characterization of sorghum grain and evaluation of sorghum flour in a Chinese egg noodle system. J. Cereal Sci. 2012, 55, 31–36. [Google Scholar] [CrossRef] [Green Version]
- Wolter, A.; Hager, A.-S.; Zannini, E.; Arendt, E.K. Influence of sourdough on in vitro starch digestibility and predicted glycemic indices of gluten-free breads. Food Funct. 2014, 5, 564–572. [Google Scholar] [CrossRef]
- Cisse, F.; Erickson, D.P.; Hayes, A.M.R.; Opekun, A.R.; Nichols, B.L.; Hamaker, B.R. Traditional malian solid foods made from sorghum and millet have markedly slower gastric emptying than rice, potato, or pasta. Nutrients 2018, 10, 124. [Google Scholar] [CrossRef] [Green Version]
- Wu, L.; Huang, Z.; Qin, P.; Ren, G. Effects of processing on phytochemical profiles and biological activities for production of sorghum tea. Food Res. Int. 2013, 53, 678–685. [Google Scholar] [CrossRef]
- Queiroz, V.A.V.; da Silva Aguiar, A.; de Menezes, C.B.; de Carvalho, C.W.P.; Paiva, C.L.; Fonseca, P.C.; da Conceição, R.R.P. A low calorie and nutritive sorghum powdered drink mix: Influence of tannin on the sensorial and functional properties. J. Cereal Sci. 2018, 79, 43–49. [Google Scholar] [CrossRef]
- Garzón, A.G.; Torres, R.L.; Drago, S.R. Changes in phenolics, γ-aminobutyric acid content and antioxidant, antihypertensive and hypoglycaemic properties during ale white sorghum (Sorghum bicolor (L.) Moench) brewing process. Int. J. Food Sci. Technol. 2019, 54, 1901–1908. [Google Scholar] [CrossRef]
- Akogou, F.U.G.; den Besten, H.M.W.; Kayode, A.P.P.; Fogliano, V.; Linnemann, A.R. Antimicrobial evaluation of red, phyto-alexin-rich sorghum food biocolorant. PLoS ONE 2018, 13, e0194657. [Google Scholar]
- Luckemeyer, T.; Luckemeyer, T.; Hesteande, B.; Miller, R.; Kerth, C.; Awika, J.; Rooney, L. Sorghum bran addition in bratwurst, pre-cooked pork patties and pre-cooked turkey patties. Meat Sci. 2015, 101, 118. [Google Scholar] [CrossRef]
- García, A.C.; Hernández, V.M.; Bonet, J.; Coma, J.; Andrés, M.L. Effects of inclusion of sorghum distillers dried grains with solubles (DDGS) in diets for growing and finishing pigs. Span. J. Agric. Res. 2012, 10, 1016–1024. [Google Scholar]
- Selma, M.V.; Espín, J.C.; Tomás-Barberán, F.A. Interaction between phenolics and Gut microbiota: Role in human health. J. Agric. Food Chem. 2009, 57, 6485–6501. [Google Scholar] [CrossRef]
- Serrano, J.; Puupponen-Pimiä, R.; Dauer, A.; Aura, A.-M.; Calixto, F.D.S. Tannins: Current knowledge of food sources, intake, bioavailability and biological effects. Mol. Nutr. Food Res. 2009, 53, S310–S329. [Google Scholar] [CrossRef] [Green Version]
- Links, M.R.; Taylor, J.; Kruger, M.C.; Taylor, J.R. Sorghum condensed tannins encapsulated in kafirin microparticles as a nutraceutical for inhibition of amylases during digestion to attenuate hyperglycaemia. J. Funct. Foods 2015, 12, 55–63. [Google Scholar] [CrossRef]
- Links, M.R.; Taylor, J.; Kruger, M.C.; Naidoo, V.; Taylor, J.R. Kafirin microparticle encapsulated sorghum condensed tannins exhibit potential as an anti-hyperglycaemic agent in a small animal model. J. Funct. Foods 2016, 20, 394–399. [Google Scholar] [CrossRef] [Green Version]
- Hu, C.; Shi, J.; Quan, S.; Cui, B.; Kleessen, S.; Nikoloski, Z.; Tohge, T.; Alexander, D.; Guo, L.; Lin, H.; et al. Metabolic variation between japonica and indica rice cultivars as revealed by non-targeted metabolomics. Sci. Rep. 2014, 4, 5067. [Google Scholar] [CrossRef] [Green Version]
- Rao, J.; Cheng, F.; Hu, C.; Quan, S.; Lin, H.; Wang, J.; Chen, G.; Zhao, X.; Alexander, D.; Guo, L.; et al. Metabolic map of mature maize kernels. Metabolomics 2014, 10, 775–787. [Google Scholar] [CrossRef]
- Tugizimana, F.; Djami-Tchatchou, A.T.; Steenkamp, P.A.; Piater, L.A.; Dubery, I.A. Metabolic analysis of defense-related reprogramming in Sorghum bicolor in response to Colletotrichum sublineolum infection reveals a functional metabolic web of phnylpropanoid and flavonoid pathways. Front. Plant Sci. 2019, 9, 1840. [Google Scholar] [CrossRef] [Green Version]
- Turner, M.F.; Heuberger, A.L.; Kirkwood, J.S.; Collins, C.C.; Wolfrum, E.J.; Broeckling, C.D.; Prenni, J.E.; Jahn, C.E. Non-targeted metabolomics in diverse sorghum breeding lines indicates primary and secondary metabolite profiles are asso-ciated with plant biomass accumulation and photosynthesis. Front. Plant Sci. 2016, 7, 953. [Google Scholar] [CrossRef] [Green Version]
- Zhou, Y.; Wang, Z.; Li, Y.; Li, Z.; Liu, H.; Zhou, W. Metabolite profiling of sorghum seeds of different colors from different sweet sorghum cultivars using a widely targeted metabolomics approach. Int. J. Genom. 2020, 2020, 6247429. [Google Scholar] [CrossRef]
- Dykes, L.; Rooney, L.W. Sorghum and millet phenols and antioxidants. J. Cereal Sci. 2006, 44, 236–251. [Google Scholar] [CrossRef]
- Prasanth, A.; Premnath, A.; Muthurajan, R. Genetic divergence study for duration and biomass traits in sorghum [Sorghum bicolor (L.) Moench]. Electron. J. Plant Breed. 2021, 12, 22–27. [Google Scholar]
- Voss, D.H. Relating colorimeter measurement of plant color to the royal horticultural society color chart. HortScience 1992, 27, 1256–1260. [Google Scholar] [CrossRef]
- IBPGR. Descriptors for Sorghum [Sorghum Bicolor (L.) Moench]; International Board for Plant Genetic Resources: Rome, Italy, 1993. [Google Scholar]
- Jones, W.P.; Kinghorn, A.D. Extraction of plant secondary metabolites. In Natural Products Isolation; Springer: New York, NY, USA, 2006; pp. 323–351. [Google Scholar]
- Tsugawa, H.; Cajka, T.; Kind, T.; Ma, Y.; Higgins, B.; Ikeda, K.; Kanazawa, M.; VanderGheynst, J.; Fiehn, O.; Arita, M. MS-DIAL: Data-independent MS/MS deconvolution for comprehensive metabolome analysis. Nat. Methods 2015, 12, 523–526. [Google Scholar] [CrossRef] [PubMed]
- Horai, H.; Arita, M.; Kanaya, S.; Nihei, Y.; Ikeda, T.; Suwa, K.; Ojima, Y.; Tanaka, K.; Tanaka, S.; Aoshima, K.; et al. MassBank: A public repository for sharing mass spectral data for life sciences. J. Mass Spectrom. 2010, 45, 703–714. [Google Scholar] [CrossRef] [PubMed]
- Chong, J.; Soufan, O.; Li, C.; Caraus, I.; Li, S.; Bourque, G.; Wishart, D.S.; Xia, J. MetaboAnalyst 4.0: Towards more transparent and integrative metabolomics analysis. Nucleic Acids Res. 2018, 46, W486–W494. [Google Scholar] [CrossRef] [PubMed] [Green Version]
- Thimm, O.; Bläsing, O.; Gibon, Y.; Nagel, A.; Meyer, S.; Krüger, P.; Selbig, J.; Müller, L.A.; Rhee, S.Y.; Stitt, M. mapman: A user-driven tool to display genomics data sets onto diagrams of metabolic pathways and other biological processes. Plant J. 2004, 37, 914–939. [Google Scholar] [CrossRef] [PubMed]
- Xia, J.; Wishart, D.S. MetPA: A web-based metabolomics tool for pathway analysis and visualization. Bioinformatics 2010, 26, 2342–2344. [Google Scholar] [CrossRef] [PubMed] [Green Version]
- Li, S.; Park, Y.; Duraisingham, S.; Strobel, F.H.; Khan, N.; Soltow, Q.A.; Jones, D.P.; Pulendran, B. Predicting network activity from high throughput metabolomics. PLoS Comput. Biol. 2013, 9, e1003123. [Google Scholar] [CrossRef] [PubMed] [Green Version]
- Pontieri, P.; Mamone, G.; De Caro, S.; Tuinstra, M.R.; Roemer, E.; Okot, J.; De Vita, P.; Ficco, D.B.; Alifano, P.; Pignone, D.; et al. Sorghum, a healthy and gluten-free food for celiac patients as demonstrated by genome, biochemical, and immunochemical analyses. J. Agric. Food Chem. 2013, 61, 2565–2571. [Google Scholar] [CrossRef] [PubMed]
- Shih, C.H.; Siu, S.O.; Ng, R.; Wong, E.; Chiu, L.C.; Chu, I.K.; Lo, C. Quantitative analysis of anticancer 3-deoxyanthocyanidins in infected sorghum seedlings. J. Agric. Food Chem. 2007, 55, 254–259. [Google Scholar] [CrossRef]
- Yang, L.; Allred, K.F.; Dykes, L.; Allred, C.D.; Awika, J.M. Enhanced action of apigenin and naringenin combination on es-trogen receptor activation in non-malignant colonocytes: Implications on sorghum-derived phytoestrogens. Food Funct. 2015, 6, 749–755. [Google Scholar] [CrossRef] [PubMed]
- Zhang, Y.; Li, M.; Gao, H.; Wang, B.; Tongcheng, X.; Gao, B.; Yu, L. Triacylglycerol, fatty acid, and phytochemical profiles in a new red sorghum variety (Ji Liang No. 1) and its antioxidant and anti-inflammatory properties. Food Sci. Nutr. 2019, 7, 949–958. [Google Scholar] [CrossRef] [PubMed] [Green Version]
- Li, M.; Xu, T.; Zheng, W.; Gao, B.; Zhu, H.; Xu, R.; Deng, H.; Wang, B.; Wu, Y.; Sun, X.; et al. Triacylglycerols compositions, soluble and bound phenolics of red sorghums, and their radical scavenging and anti-inflammatory activities. Food Chem. 2021, 340, 128123. [Google Scholar] [CrossRef]
- Che, P.; Zhao, Z.-Y.; Glassman, K.; Dolde, D.; Hu, T.X.; Jones, T.J.; Gruis, D.F.; Obukosia, S.; Wambugu, F.; Albertsen, M.C. Elevated vitamin E content improves all-trans β-carotene accumulation and stability in biofortified sorghum. Proc. Natl. Acad. Sci. USA 2016, 113, 11040–11045. [Google Scholar] [CrossRef] [Green Version]
- Kumar, A.; Anuradha, K.; Ramaiah, B. Increasing grain Fe and Zn concentration in sorghum: Progress and way forward. J. SAT Agric. Res. 2013, 11, 1–5. [Google Scholar]
- Cruet-Burgos, C.; Cox, S.; Ioerger, B.P.; Perumal, R.; Hu, Z.; Herald, T.J.; Bean, S.R.; Rhodes, D.H. Advancing provitamin A biofortification in sorghum: Genome-wide association studies of grain carotenoids in global germplasm. Plant Genome 2020, 13, e20013. [Google Scholar] [CrossRef] [Green Version]
- Jiao, Y.; Bai, Z.; Xu, J.; Zhao, M.; Khan, Y.; Hu, Y.; Shi, L. Metabolomics and its physiological regulation process reveal the salt-tolerant mechanism in Glycine soja seedling roots. Plant Physiol. Biochem. 2018, 126, 187–196. [Google Scholar] [CrossRef] [PubMed]
- Tahir, A.T.; Fatmi, Q.; Nosheen, A.; Imtiaz, M.; Khan, S. Metabolomic approaches in plant research. In Essentials of Bioinformatics, Volume III; Springer: New York, NY, USA, 2019; pp. 109–140. [Google Scholar]
- González-Montilla, F.M.; Chávez-Santoscoy, R.A.; Gutiérrez-Uribe, J.A.; Serna-Saldivar, S.O. Isolation and identification of phase II enzyme inductors obtained from black Shawaya sorghum [Sorghum bicolor (L.) Moench] bran. J. Cereal Sci. 2012, 55, 126–131. [Google Scholar] [CrossRef]
- Yang, L.; Browning, J.D.; Awika, J.M. Sorghum 3-deoxyanthocyanins possess strong phase II enzyme inducer activity and cancer cell growth inhibition properties. J. Agric. Food Chem. 2009, 57, 1797–1804. [Google Scholar] [CrossRef] [PubMed]
- Yang, L.; Allred, K.F.; Geera, B.; Allred, C.D.; Awika, J.M. Sorghum phenolics demonstrate estrogenic action and induce apoptosis in nonmalignant colonocytes. Nutr. Cancer 2012, 64, 419–427. [Google Scholar] [CrossRef]
- Taylor, J.; Awika, J. Gluten-free ancient Grains. In Cereals, Pseudocereals, and Legumes: Sustainable, Nutritious, and Health-Promoting Foods for the 21st Century, 1st ed.; Woodhead Publishing: Sawston, UK, 2017. [Google Scholar]
- Bralley, E.; Greenspan, P.; Hargrove, J.L.; Hartle, D.K. Inhibition of hyaluronidase activity by select sorghum brans. J. Med. Food 2008, 11, 307–312. [Google Scholar] [CrossRef] [PubMed]
- Awika, J.M.; Piironen, V.; Bean, S. Advances in Cereal Science: Implications to Food Processing and Health Promotion; ACS Publications: Washington DC, USA, 2011. [Google Scholar]
- Leguizamón, C.; Weller, C.L.; Schlegel, V.L.; Carr, T.P. Plant sterol and policosanol characterization of hexane extracts from grain sorghum, corn and their DDGS. J. Am. Oil Chem. Soc. 2009, 86, 707–716. [Google Scholar] [CrossRef] [Green Version]
- Kamal-Eldin, A.; Moazzami, A. Plant sterols and stanols as cholesterol-lowering ingredients in functional foods. Recent Pat. Food Nutr. Agric. 2009, 1, 1–14. [Google Scholar] [CrossRef] [PubMed]
- Sundararaman, P.; Djerassi, C. A convenient synthesis of progesterone from stigmasterol. J. Org. Chem. 1977, 42, 3633–3634. [Google Scholar] [CrossRef]
- Kametani, T.; Furuyama, H. Synthesis of vitamin D3 and related compounds. Med. Res. Rev. 1987, 7, 147–171. [Google Scholar] [CrossRef]
- Kelly, G.S. Squalene and its potential clinical uses. Altern. Med. Rev. J. Clin. Ther. 1999, 4, 29–36. [Google Scholar]
- Reddy, L.H.; Couvreur, P. Squalene: A natural triterpene for use in disease management and therapy. Adv. Drug Deliv. Rev. 2009, 61, 1412–1426. [Google Scholar] [CrossRef]
- Lozano-Grande, M.A.; Gorinstein, S.; Espitia-Rangel, E.; Dávila-Ortiz, G.; Martínez-Ayala, A.L. Plant sources, extraction methods, and uses of squalene. Int. J. Agron. 2018, 2018, 1829160. [Google Scholar] [CrossRef]
- Cabral, C.E.; Klein, M.R.S.T. Phytosterols in the treatment of hypercholesterolemia and prevention of cardiovascular diseases. Arq. Bras. Cardiol. 2017, 109, 475–482. [Google Scholar] [CrossRef] [PubMed]
- Tao, C.; Shkumatov, A.A.; Alexander, S.T.; Ason, B.L.; Zhou, M. Stigmasterol accumulation causes cardiac injury and promotes mortality. Commun. Biol. 2019, 2, 20. [Google Scholar] [CrossRef] [PubMed]
- Bae, H.; Song, G.; Lim, W. Stigmasterol causes ovarian cancer cell apoptosis by inducing endoplasmic reticulum and mi-tochondrial dysfunction. Pharmaceutics 2020, 12, 488. [Google Scholar] [CrossRef]
- Saeidnia, S.; Manayi, A.; Gohari, A.R.; Abdollahi, M. The story of beta-sitosterol—A review. Eur. J. Med. Plants 2014, 4, 590–609. [Google Scholar] [CrossRef]
- Satia, J.A.; Littman, A.; Slatore, C.G.; Galanko, J.A.; White, E. Long-term use of β-carotene, retinol, lycopene, and lutein sup-plements and lung cancer risk: Results from the VITamins and Lifestyle (VITAL) study. Am. J. Epidemiol. 2009, 169, 815–828. [Google Scholar] [CrossRef] [PubMed]
- Buscemi, S.; Corleo, D.; Di Pace, F.; Petroni, M.L.; Satriano, A.; Marchesini, G. The effect of lutein on eye and extra-eye health. Nutrients 2018, 10, 1321. [Google Scholar] [CrossRef] [Green Version]
- Hu, B.-J.; Hu, Y.-N.; Lin, S.; Ma, W.-J.; Li, X.R. Application of lutein and zeaxanthin in nonproliferative diabetic retinopathy. Int. J. Ophthalmol. 2011, 4, 303–306. [Google Scholar]
- Chew, E.Y.; Clemons, T.E.; SanGiovanni, J.P.; Danis, R.; Ferris, F.L.; Elman, M.; Antoszyk, A.; Ruby, A.; Orth, D.; Bressler, S.; et al. Lutein+ zeaxanthin and omega-3 fatty acids for age-related macular degeneration: The Age-Related Eye Disease Study 2 (AREDS2) randomized clinical trial. JAMA 2013, 309, 2005–2015. [Google Scholar]
- Juturu, V.; Bowman, J.P.; Deshpande, J. Overall skin tone and skin-lightening-improving effects with oral supplementation of lutein and zeaxanthin isomers: A double-blind, placebo-controlled clinical trial. Clin. Cosmet. Investig. Dermatol. 2016, 9, 325–332. [Google Scholar] [CrossRef] [PubMed] [Green Version]
- Bae, J.; Kim, N.; Shin, Y.; Kim, S.-Y.; Kim, Y.-J. Activity of catechins and their applications. Biomed. Dermatol. 2020, 4, 8. [Google Scholar] [CrossRef] [Green Version]
- Abdulkhaleq, L.A.; Assi, M.A.; Noor, M.H.M.; Abdullah, R.; Saad, M.Z.; Taufiq-Yap, Y.H. Therapeutic uses of epicatechin in diabetes and cancer. Vet. World 2017, 10, 869–872. [Google Scholar] [CrossRef]
- Salehi, B.; Fokou, P.V.T.; Sharifi-Rad, M.; Zucca, P.; Pezzani, R.; Martins, N.; Sharifi-Rad, J. The therapeutic potential of naringenin: A review of clinical trials. Pharmaceuticals 2019, 12, 11. [Google Scholar] [CrossRef] [PubMed] [Green Version]
- Thangavel, P.; Puga-Olguín, A.; Rodríguez-Landa, J.F.; Zepeda, R.C. Genistein as potential therapeutic candidate for meno-pausal symptoms and other related diseases. Molecules 2019, 24, 3892. [Google Scholar] [CrossRef] [PubMed] [Green Version]
- Erlund, I. Review of the flavonoids quercetin, hesperetin, and naringenin. Dietary sources, bioactivities, bioavailability, and epidemiology. Nutr. Res. 2004, 24, 851–874. [Google Scholar] [CrossRef]
- Kashyap, D.; Sharma, A.; Tuli, H.S.; Sak, K.; Punia, S.; Mukherjee, T.K. Kaempferol—A dietary anticancer molecule with multiple mechanisms of action: Recent trends and advancements. J. Funct. Foods 2017, 30, 203–219. [Google Scholar] [CrossRef]
- Lin, Y.; Shi, R.; Wang, X.; Shen, H.-M. Luteolin, a flavonoid with potential for cancer prevention and therapy. Curr. Cancer Drug Targets 2008, 8, 634–646. [Google Scholar] [CrossRef] [PubMed]
- Lee, S.E.; Yang, H.; Son, G.W.; Park, H.R.; Park, C.-S.; Jin, Y.-H.; Park, Y.S. Eriodictyol protects endothelial cells against oxi-dative stress-induced cell death through modulating ERK/Nrf2/ARE-dependent heme oxygenase-1 expression. Int. J. Mol. Sci. 2015, 16, 14526–14539. [Google Scholar] [CrossRef] [Green Version]


| S. No. | Compound | Class | PLS-DA VIP Score | ANOVA p Value |
|---|---|---|---|---|
| 1 | Naringenin | Flavonoids | 2.1346 | 9.53 × 10⁻⁹ |
| 2 | (+)-Catechin | Flavonoids | 1.9378 | 9.88 × 10⁻⁷ |
| 3 | Cinnamaldehyde | Phenylpropanoids | 1.8646 | 1.39 × 10⁻⁶ |
| 4 | Stigmasterol | Steroids | 1.8592 | 3.71 × 10⁻⁶ |
| 5 | (−)Epicatechin | Flavonoids | 1.7997 | 1.25 × 10⁻⁵ |
| 6 | alpha-Isopropylmalate | Carboxylic acids | 1.7905 | 0.00013398 |
| 7 | trans-Cinnamate | Phenylpropanoids | 1.7703 | 0.00015462 |
| 8 | L-Leucine | Amino acids | 1.755 | 0.00017873 |
| 9 | Luteolin | Flavonoids | 1.7147 | 1.82 × 10⁻⁵ |
| 10 | Sitosterol | Steroids | 1.607 | 0.00022826 |
| 11 | Antheraxanthin | Carotenoids | 1.6026 | 0.00039374 |
| 12 | L-Valine | Amino acids | 1.5648 | 0.00047442 |
| 13 | Apigenin | Flavonoids | 1.5496 | 1.54 × 10⁻⁷ |
| 14 | Caffeyl alcohol | Phenylpropanoids | 1.5412 | 0.00017893 |
| 15 | 5′-Prenyleriodictyol | Flavonoids | 1.5036 | 7.06 × 10⁻⁶ |
| 16 | Kaempferol-3-O-arabinoside | Flavonoids | 1.4855 | 1.57 × 10⁻⁵ |
| 17 | Genistein | Flavonoids | 1.4852 | 0.00021481 |
| 18 | Coniferyl aldehyde | Phenylpropanoids | 1.4738 | 0.00034236 |
| 19 | Eriodictyol | Flavonoids | 1.4696 | 7.06 × 10⁻⁶ |
| 20 | Hesperetin | Flavonoids | 1.4548 | 5.14 × 10⁻⁵ |
| 21 | (−)-Epigallocatechin | Flavonoids | 1.4533 | 9.29 × 10⁻⁵ |
| 22 | Abscisate | Apocarotenoids | 1.4504 | 0.00072293 |
| 23 | 2-Coumarinate | Phenylpropanoids | 1.4217 | 0.00079068 |
| 24 | Lutein | Carotenoids | 1.4109 | 0.0012749 |
| 25 | Abscisic aldehyde | Sesquiterpenoids | 1.3993 | 0.0021929 |
| 26 | L-Isoleucine | Amino acids | 1.3974 | 0.00065042 |
| 27 | Phosphoenolpyruvate | Carboxylic acids | 1.3583 | 0.00078092 |
| 28 | Shikimate 3-phosphate | Carboxylic acids | 1.355 | 0.00098977 |
| 29 | Propanoyl-CoA | Fatty acids | 1.3536 | 0.0012642 |
| 30 | L-Tryptophan | Amino acids | 1.3512 | 0.0019882 |
| 31 | 4-Coumarate | Phenylpropanoids | 1.3482 | 0.0013115 |
| 32 | Lupeol | Triterpenoids | 1.3391 | 0.0013742 |
| 33 | Geranylgeranyl diphosphate | Diterpenoids | 1.3276 | 0.00068171 |
| 34 | Farnesyl diphosphate | Sesquiterpenoids | 1.3202 | 0.0024475 |
| 35 | Phenylpyruvate | Carboxylic acids | 1.3156 | 0.0026778 |
| 36 | Dodecanoic acid | Fatty acids | 1.3156 | 0.0031825 |
| 37 | Squalene | Triterpenoids | 1.314 | 0.0023789 |
| 38 | D-Citramalate | Carboxylic acids | 1.3084 | 0.0026724 |
| 39 | (9Z)-Hexadecenoic acid | Fatty acids | 1.3059 | 0.0030008 |
| 40 | (+)-Neomenthol | Monoterpenoids | 1.3013 | Nil |
| 41 | (S)-2-Acetolactate | Carboxylic acids | 1.2963 | 0.0021652 |
| 42 | 2-trans,6-trans-Farnesal | Sesquiterpenoids | 1.2927 | 0.0022391 |
| 43 | 8-Oxogeranial | Monoterpenoids | 1.2855 | 0.0024556 |
| 44 | Zeaxanthin | Carotenoids | 1.2822 | 0.0034374 |
| 45 | Citraconate | Carboxylic acids | 1.268 | Nil |
| 46 | Glyceraldehyde 3-phosphate | Organophosphate | 1.2647 | 0.019693 |
| 47 | Carlactone | Lactones | 1.2632 | 0.0048748 |
| 48 | Spermidine | Amino acids | 1.2617 | 0.0029642 |
| 49 | (−)-Epiafzelechin | Flavonoids | 1.254 | 0.00313 |
| 50 | 3-Dehydroshikimate | Carboxylic acids | 1.2521 | 0.0066344 |
| 51 | Naringin | Flavonoids | 1.2499 | 0.0072895 |
| 52 | Eriocitrin | Flavonoids | 1.2455 | 0.0078144 |
| 53 | Brassicasterol | Steroids | 1.2425 | 0.0095876 |
| 54 | 4-Coumaryl alcohol | Phenylpropanoids | 1.2412 | 0.010089 |
| 55 | 9-cis-10′-Apo-beta-carotenal | Apocarotenoids | 1.2407 | 0.011766 |
| 56 | Campesterol | Steroids | 1.2378 | 0.012192 |
| 57 | Dihydrokaempferol | Flavonoids | 1.2158 | 0.013448 |
| 58 | Pentahydroxyflavanone | Flavonoids | 1.2083 | 0.0040772 |
| 59 | (S)-2-Aceto-2-hydroxybutanoate | Carboxylic acids | 1.2022 | 0.0052647 |
| 60 | Kaempferol | Flavonoids | 1.2011 | 0.0067844 |
| 61 | Kaempferide | Flavonoids | 1.2 | 0.0042311 |
| 62 | Caffeic aldehyde | Phenylpropanoids | 1.1981 | 0.0075665 |
| 63 | p-Coumaraldehyde | Phenylpropanoids | 1.1949 | 0.0099842 |
| 64 | (R)-2,3-Dihydroxy-3-methylpentanoate | Carboxylic acids | 1.1919 | 0.011751 |
| 65 | 8′-Hydroxyabscisate | Carboxylic acids | 1.1914 | 0.0042353 |
| 66 | 2-Oxoisocaproate | Carboxylic acids | 1.1623 | 0.0075086 |
| 67 | beta-D-Glucopyranosyl abscisate | Carboxylic acids | 1.1606 | 0.0099713 |
| 68 | 9′-cis-Neoxanthin | Carotenoids | 1.1532 | 0.00491 |
| 69 | Presqualene diphosphate | Triterpenoids | 1.1516 | 0.0094175 |
| 70 | Ferulate | Phenylpropanoids | 1.1463 | 0.010938 |
| 71 | L-Phenylalanine | Amino acids | 1.1446 | 0.012012 |
| 72 | 1-Deoxy-D-xylulose 5-phosphate | Sugar Phosphates | 1.1438 | 0.003749 |
| 73 | beta-Tocopherol | Prenol lipids | 1.1416 | Nil |
| 74 | Luteolin 7-glucoside | Flavonoids | 1.1386 | 0.012662 |
| 75 | 2′,5-Dimethoxyflavone | Flavonoids | 1.1308 | 0.012898 |
| 76 | Eriodictyol-7-O-glucoside | Flavonoids | 1.1293 | 0.013856 |
| 77 | Homoeriodictyol | Flavonoids | 1.1217 | 0.01464 |
| 78 | Naringenin chalcone | Flavonoids | 1.1173 | 0.0147 |
| 79 | Indoleglycerol phosphate | Sugar Phosphates | 1.1098 | Nil |
| 80 | Taxifolin | Flavonoids | 1.1027 | 0.017069 |
| 81 | (S)-3-Methyl-2-oxopentanoate | Carboxylic acids | 1.0996 | 0.0040564 |
| 82 | Fustin | Flavonoids | 1.0924 | 0.015207 |
| 83 | Galangin | Flavonoids | 1.0867 | 0.015721 |
| 84 | Phloretin | Flavonoids | 1.0832 | 0.016724 |
| 85 | Garbanzol | Flavonoids | 1.0786 | 0.016737 |
| 86 | Apigenin-7-O-glucoside | Flavonoids | 1.0737 | 0.017055 |
| 87 | (S)-2,3-Epoxysqualene | Triterpenoids | 1.0709 | Nil |
| 88 | Chorismate | Carboxylic acids | 1.0667 | 0.020117 |
| 89 | 2-C-Methyl-D-erythritol 4-phosphate | Fatty Alcohols | 1.0543 | 0.019126 |
| 90 | 5-Hydroxyconiferaldehyde | Phenylpropanoids | 1.0501 | 0.017298 |
| 91 | Caffeoyl-CoA | Phenylpropanoids | 1.0492 | 0.017933 |
| 92 | p-Coumaroyl-CoA | Phenylpropanoids | 1.0328 | 0.01822 |
| 93 | L-Tyrosine | Amino acids | 1.0116 | 0.01873 |
| 94 | Demethylphylloquinol | Prenol lipids | 1.0104 | 0.01881 |
| S. No. | Pathway Name | Raw p | −log(p) | FDR |
|---|---|---|---|---|
| 1 | Flavonoid biosynthesis | 1.19 × 10⁻¹⁹ | 18.923 | 1.15 × 10⁻¹⁷ |
| 2 | Valine, leucine and isoleucine biosynthesis | 7.69 × 10⁻¹⁴ | 13.114 | 3.69 × 10⁻¹² |
| 3 | Phenylalanine, tyrosine and tryptophan biosynthesis | 1.37 × 10⁻⁸ | 7.8637 | 4.38 × 10⁻⁷ |
| 4 | Phenylpropanoid biosynthesis | 5.40 × 10⁻⁸ | 7.2676 | 1.30 × 10⁻⁶ |
| 5 | Tyrosine metabolism | 8.19 × 10⁻⁸ | 7.087 | 1.57 × 10⁻⁶ |
| 6 | Ubiquinone and other terpenoid-quinone biosynthesis | 1.16 × 10⁻⁶ | 5.9359 | 1.85 × 10⁻⁵ |
| 7 | C5-Branched dibasic acid metabolism | 9.51 × 10⁻⁶ | 5.0218 | 0.000114 |
| 8 | Isoquinoline alkaloid biosynthesis | 9.51 × 10⁻⁶ | 5.0218 | 0.000114 |
| 9 | Sesquiterpenoid and triterpenoid biosynthesis | 4.03 × 10⁻⁵ | 4.3947 | 0.00043 |
| 10 | Arginine and proline metabolism | 0.000133 | 3.8767 | 0.001275 |
| 11 | Biosynthesis of secondary metabolites - unclassified | 0.002016 | 2.6955 | 0.017596 |
| 12 | Valine, leucine and isoleucine degradation | 0.004638 | 2.3336 | 0.037106 |
| 13 | Carotenoid biosynthesis | 0.006374 | 2.1956 | 0.047071 |
| Scheme | Class | Metabolites | Enriched Sorghum Accessions | Uses | References |
|---|---|---|---|---|---|
| 1 | Squalene | Triterpenoids | IS 7748, IS 9108, IS 9262, IS 10968 | Anti-cancer, anti-bacterial and cholesterol-lowering ability | [68,69,70] |
| 2 | Stigmasterol | Steroids | IS 7748, IS 8826, IS 12330, IS 12267 | Anti-cancer and cholesterol-lowering ability, reduces risk of cardiovascular diseases | [71,72,73] |
| 3 | Sitosterol | Steroids | IS 7748, IS 8826, IS 12267 | Prevention of cervical cancer, lowers cholesterol level | [74] |
| 4 | Lutein | Carotenoids | IS 9378, IS 12330, IS 14542 | Delays/inhibits age-related macular degeneration, improves cardiovascular health, and anti-cancer | [75,76] |
| 5 | Zeaxanthin | Carotenoids | IS 14861, IS 12290, IS 7748 | Protective factor in age-related macular degeneration (AMD), reduces diabetic retinopathy and inhibits cataract growth | [77,78,79] |
| 6 | (+)-Catechin | Flavonoids | IS 12166, IS 15098, IS 7748, IS 9378, IS 14861 | Prevents/reduces skin damage; antioxidant; anti-inflammatory; anti-viral; and anti-cancer | [80] |
| 7 | (−)-Epicatechin | Flavonoids | IS 15191, IS 7748, IS 8962, IS 14861, IS 12330 | Anti-diabetic, cytotoxic to cancer cells, antioxidant and anti-angiogenic | [81] |
| 8 | Naringenin | Flavonoids | IS 9442, IS 10877, IS 10634, IS 8569, IS 10877 | Anti-cancer, cardiovascular protection, anti-viral (against hepatitis C virus) and weight control | [82] |
| 9 | Apigenin | Flavonoids | IS 12267, IS 9442, IS 10634, IS 14535, IS 15098, IS 11818 | Anti-cancer, activation of estrogen | [50] |
| 10 | Genistein | Flavonoids | IS 8826, IS 12267 | Anti-tumor | [83] |
| 11 | (−)-Epigallocatechin | Flavonoids | IS 14316, IS 15061, IS 15098, IS 10634, IS 12330 | Anti-inflammatory, anti-cancer and antioxidant | [80] |
| 12 | Hesperetin | Flavonoids | IS 8826, IS 12267 | Antioxidant, lowers blood cholesterol | [84] |
| 13 | Kaempferol-3-O-arabinoside | Flavonoids | IS 9442, IS 12267, IS 12166, 1S 8826, IS 15098, IS 10634, IS 10877 | Chemotherapeutic drug, antioxidant and anti-inflammatory | [85] |
| 14 | Luteolin | Flavonoids | IS 10634, IS 9442, IS 9378, IS 12267 | Anti-cancer, anti-hypertensive and anti-inflammatory | [86] |
| 15 | Eriodictyol | Flavonoids | IS 12330, IS 8826, IS 9378, IS 14316 | Anti-cancer, anti-inflammatory and anti- oxidant | [87] |
Publisher’s Note: MDPI stays neutral with regard to jurisdictional claims in published maps and institutional affiliations. |
© 2021 by the authors. Licensee MDPI, Basel, Switzerland. This article is an open access article distributed under the terms and conditions of the Creative Commons Attribution (CC BY) license (https://creativecommons.org/licenses/by/4.0/).
Share and Cite
Ramalingam, A.P.; Mohanavel, W.; Premnath, A.; Muthurajan, R.; Prasad, P.V.V.; Perumal, R. Large-Scale Non-Targeted Metabolomics Reveals Antioxidant, Nutraceutical and Therapeutic Potentials of Sorghum. Antioxidants 2021, 10, 1511. https://doi.org/10.3390/antiox10101511
Ramalingam AP, Mohanavel W, Premnath A, Muthurajan R, Prasad PVV, Perumal R. Large-Scale Non-Targeted Metabolomics Reveals Antioxidant, Nutraceutical and Therapeutic Potentials of Sorghum. Antioxidants. 2021; 10(10):1511. https://doi.org/10.3390/antiox10101511
Chicago/Turabian StyleRamalingam, Ajay Prasanth, Williams Mohanavel, Ameena Premnath, Raveendran Muthurajan, P. V. Vara Prasad, and Ramasamy Perumal. 2021. "Large-Scale Non-Targeted Metabolomics Reveals Antioxidant, Nutraceutical and Therapeutic Potentials of Sorghum" Antioxidants 10, no. 10: 1511. https://doi.org/10.3390/antiox10101511