
Differences between Professional and Amateur Cyclists in Endogenous Antioxidant System Profile

 , , and
Abstract
:
1. Introduction
2. Methodology
2.1. Selection of Participants
2.2. Study Protocol
2.3. Incremental Test
2.4. Blood Analysis
2.5. Oxidative Stress and Antioxidant Status Markers
2.5.1. Catalase
2.5.2. SOD
2.5.3. Glutathione
2.6. Statistical Analyses
3. Results
3.1. Subject Characteristics
3.2. Antioxidant Parameters
3.3. Physiological and Metabolic Parameters at VT1
3.4. Physiological and Metabolic Parameters at VT2
3.5. Physiological and Metabolic Parameters at VO2max
4. Discussion
Differences in Antioxidant Enzymes and Hemogram
5. Limitations
6. Conclusions
Author Contributions
Institutional Review Board Statement
Informed Consent Statement
Data Availability Statement
Acknowledgments
Conflicts of Interest
References
- Faria, E.W.; Parker, D.L.; Faria, I.E. The science of cycling: Physiology and training—Part 1. Sports Med. 2005, 35, 285–312. [Google Scholar] [CrossRef]
- Lucia, A.; Hoyos, J.; Chicharro, J.L. Physiology of professional road cycling. Sports Med. 2001, 31, 325–337. [Google Scholar] [CrossRef]
- Jeukendrup, A.E.; Craig, N.P.; Hawley, J.A. The bioenergetics of World Class Cycling. J. Sci. Med. Sport 2000, 3, 414–433. [Google Scholar] [CrossRef]
- Margaritelis, N.V.; Paschalis, V.; Theodorou, A.A.; Kyparos, A.; Nikolaidis, M.G. Redox basis of exercise physiology. Redox Biol. 2020, 35, 101499. [Google Scholar] [CrossRef] [PubMed]
- Bentley, D.J.; Ackerman, J.; Clifford, T.; Slattery, K.S. Acute and chronic effects of antioxidant supplementation on exercise performance. In Antioxidants in Sport Nutrition; CRC Press: Boca Raton, FL, USA, 2014; Volume 141. [Google Scholar]
- Bloomer, R.J.; Fisher-Wellman, K.H. Blood oxidative stress biomarkers: Influence of sex, exercise training status, and dietary intake. Gend Med. 2008, 5, 218–228. [Google Scholar] [CrossRef]
- Urso, M.L.; Clarkson, P.M. Oxidative stress, exercise, and antioxidant supplementation. Toxicology 2003, 189, 41–54. [Google Scholar] [CrossRef]
- Koppenol, W.H.; Hider, R.H. Iron and redox cycling. Do’s and don’ts. Free Radic. Biol. Med. 2019, 133, 3–10. [Google Scholar] [CrossRef] [PubMed]
- Mylonas, C.; Kouretas, D. Lipid peroxidation and tissue damage. In Vivo 1999, 13, 295–309. [Google Scholar]
- St-Pierre, J.; Buckingham, J.A.; Roebuck, S.J.; Brand, M.D. Topology of superoxide production from different sites in the mitochondrial electron transport chain. J. Biol. Chem. 2002, 277, 44784–44790. [Google Scholar] [CrossRef] [Green Version]
- Sakellariou, G.K.; Jackson, M.J.; Vasilaki, A. Redefining the major contributors to superoxide production in contracting skeletal muscle. The role of NAD(P)H oxidases. Free Radic. Res. 2014, 48, 12–29. [Google Scholar] [CrossRef]
- Marzatico, F.; Pansarasa, O.; Bertorelli, L.; Somenzini, L.; Della Valle, G. Blood free radical antioxidant enzymes and lipid peroxides following long-distance and lactacidemic performances in highly trained aerobic and sprint athletes. J. Sports Med. Phys. Fitness 1997, 37, 235–239. [Google Scholar]
- Pingitore, A.; Lima, G.P.; Mastorci, F.; Quinones, A.; Iervasi, G.; Vassalle, C. Exercise and oxidative stress: Potential effects of antioxidant dietary strategies in sports. Nutrition 2015, 31, 916–922. [Google Scholar] [CrossRef] [PubMed]
- Cordova, A.; Sureda, A.; Albina, M.L.; Linares, V.; Belles, M.; Sanchez, D.J. Oxidative stress markers after a race in professional cyclists. Int. J. Sport Nutr. Exerc. Metab. 2015, 25, 171–178. [Google Scholar] [CrossRef]
- Serrano, E.; Venegas, C.; Escames, G.; Sanchez-Munoz, C.; Zabala, M.; Puertas, A.; de Haro, T.; Gutierrez, A.; Castillo, M.; Acuna-Castroviejo, D. Antioxidant defence and inflammatory response in professional road cyclists during a 4-day competition. J. Sports Sci. 2010, 28, 1047–1056. [Google Scholar] [CrossRef] [PubMed]
- Falone, S.; Mirabilio, A.; Pennelli, A.; Cacchio, M.; Di Baldassarre, A.; Gallina, S.; Passerini, A.; Amicarelli, F. Differential impact of acute bout of exercise on redox- and oxidative damage-related profiles between untrained subjects and amateur runners. Physiol. Res. 2010, 59, 953–961. [Google Scholar] [CrossRef] [PubMed]
- Margaritelis, N.V.; Theodorou, A.A.; Paschalis, V.; Veskoukis, A.S.; Dipla, K.; Zafeiridis, A.; Panayiotou, G.; Vrabas, I.S.; Kyparos, A.; Nikolaidis, M.G. Adaptations to endurance training depend on exercise-induced oxidative stress: Exploiting redox interindividual variability. Acta Physiol. (Oxford) 2018, 222. [Google Scholar] [CrossRef]
- Kostaropoulos, I.A.; Nikolaidis, M.G.; Jamurtas, A.Z.; Ikonomou, G.V.; Makrygiannis, V.; Papadopoulos, G.; Kouretas, D. Comparison of the blood redox status between long-distance and short-distance runners. Physiol. Res. 2006, 55, 611–616. [Google Scholar] [PubMed]
- World Medical Association. WMA Declaration of Helsinki-Ethical principles for medical research involving human subjects. JAMA J. Am. Med. Assoc. 2013, 310, 2191–2194. [Google Scholar] [CrossRef] [PubMed] [Green Version]
- Martínez-Noguera, F.J.; Marín-Pagán, C.; Carlos-Vivas, J.; Rubio-Arias, J.A.; Alcaraz, P.E. Acute Effects of Hesperidin in Oxidant/Antioxidant State Markers and Performance in Amateur Cyclists. Nutrients 2019, 11, 1898. [Google Scholar] [CrossRef] [Green Version]
- Millet, G.P.; Vleck, V.E.; Bentley, D.J. Physiological Differences Between Cycling and Running. Sports Med. 2009, 39, 179–206. [Google Scholar] [CrossRef]
- Edvardsen, E.; Hem, E.; Anderssen, S.A. End criteria for reaching maximal oxygen uptake must be strict and adjusted to sex and age: A cross-sectional study. PLoS ONE 2014, 9, e85276. [Google Scholar] [CrossRef] [PubMed] [Green Version]
- Howley, E.T.; Bassett, D.R., Jr.; Welch, H.G. Criteria for maximal oxygen uptake: Review and commentary. Med. Sci. Sports Exerc. 1995, 27, 1292–1301. [Google Scholar] [CrossRef]
- Wasserman, K.; Beaver, W.L.; Whipp, B.J. Gas exchange theory and the lactic acidosis (anaerobic) threshold. Circulation 1990, 81, Ii14–Ii30. [Google Scholar]
- Weydert, C.J.; Cullen, J.J. Measurement of superoxide dismutase, catalase and glutathione peroxidase in cultured cells and tissue. Nat. Protoc. 2010, 5, 51–66. [Google Scholar] [CrossRef] [Green Version]
- Randox Laboratories Ltd. Radicales Libres; Randox Laboratories Ltd.: Crumlin, UK, 1996; pp. 1–16. [Google Scholar]
- Akerboom, T.P.; Sies, H. Assay of glutathione, glutathione disulfide, and glutathione mixed disulfides in biological samples. In Methods in Enzymology; Elsevier: Amsterdam, The Netherlands, 1981; Volume 77, pp. 373–382. [Google Scholar]
- Asensi, M.; Sastre, J.; Pallardo, F.V.; Estrela, J.M.; Viña, J. Determination of oxidized glutathione in blood: High-performance liquid chromatography. In Methods in Enzymology; Elsevier: Amsterdam, The Netherlands, 1994; Volume 234, pp. 367–371. [Google Scholar]
- Cohen, J. Statistical power. Anal. Behav. Sci. 1988, 2, 273–406. [Google Scholar]
- Evans, W.J. Vitamin E, vitamin C, and exercise. Am. J. Clin. Nutr. 2000, 72, 647S–652S. [Google Scholar] [CrossRef] [PubMed]
- Mena, P.; Maynar, M.; Gutierrez, J.M.; Maynar, J.; Timon, J.; Campillo, J.E. Erythrocyte Free Radical Scavenger Enzymes in Bicycle Professional Racers. Adaptation to Training. Int. J. Sports Med. 1991, 12, 563–566. [Google Scholar] [CrossRef]
- Tauler, P.; Aguiló, A.; Guix, P.; Jiménez, F.; Villa, G.; Tur, J.A.; Córdova, A.; Pons, A. Pre-exercise antioxidant enzyme activities determine the antioxidant enzyme erythrocyte response to exercise. J. Sports Sci. 2005, 23, 5–13. [Google Scholar] [CrossRef]
- Finaud, J.; Lac, G.; Filaire, E. Oxidative stress: Relationship with exercise and training. Sports Med. 2006, 36, 327–358. [Google Scholar] [CrossRef]
- Turner, J.E.; Hodges, N.J.; Bosch, J.A.; Aldred, S. Prolonged depletion of antioxidant capacity after ultraendurance exercise. Med. Sci. Sports Exerc. 2011, 43, 1770–1776. [Google Scholar] [CrossRef] [PubMed] [Green Version]
- Banerjee, A.K.; Mandal, A.; Chanda, D.; Chakraborti, S. Oxidant, antioxidant and physical exercise. Mol. Cell Biochem. 2003, 253, 307–312. [Google Scholar] [CrossRef] [PubMed]
- Morrison, D.; Hughes, J.; Della Gatta, P.A.; Mason, S.; Lamon, S.; Russell, A.P.; Wadley, G.D. Vitamin C and E supplementation prevents some of the cellular adaptations to endurance-training in humans. Free Radic. Biol. Med. 2015, 89, 852–862. [Google Scholar] [CrossRef]
- Lew, H.; Pyke, S.; Quintanilha, A. Changes in the glutathione status of plasma, liver and muscle following exhaustive exercise in rats. FEBS Lett. 1985, 185, 262–266. [Google Scholar] [CrossRef] [Green Version]
- Wadley, G.D.; Nicolas, M.A.; Hiam, D.S.; McConell, G.K. Xanthine oxidase inhibition attenuates skeletal muscle signaling following acute exercise but does not impair mitochondrial adaptations to endurance training. Am. J. Physiol. Endocrinol. Metab. 2013, 304, E853–E862. [Google Scholar] [CrossRef] [PubMed] [Green Version]
- Zhang, S.J.; Sandström, M.E.; Lanner, J.T.; Thorell, A.; Westerblad, H.; Katz, A. Activation of aconitase in mouse fast-twitch skeletal muscle during contraction-mediated oxidative stress. Am. J. Physiol. Cell Physiol. 2007, 293, C1154–C1159. [Google Scholar] [CrossRef] [PubMed]
- Leonardo-Mendonça, R.C.; Concepción-Huertas, M.; Guerra-Hernández, E.; Zabala, M.; Escames, G.; Acuña-Castroviejo, D. Redox status and antioxidant response in professional cyclists during training. Eur. J. Sport Sci. 2014, 14, 830–838. [Google Scholar] [CrossRef]
- Wang, J.-S.; Huang, Y.-H. Effects of exercise intensity on lymphocyte apoptosis induced by oxidative stress in men. Eur. J. Appl. Physiol. 2005, 95, 290–297. [Google Scholar] [CrossRef]
- Ferrer, M.D.; Tauler, P.; Sureda, A.; Tur, J.A.; Pons, A. Antioxidant regulatory mechanisms in neutrophils and lymphocytes after intense exercise. J. Sports Sci. 2009, 27, 49–58. [Google Scholar] [CrossRef]
- Tauler, P.; Aguiló, A.; Gimeno, I.; Guix, P.; Tur, J.A.; Pons, A. Different effects of exercise tests on the antioxidant enzyme activities in lymphocytes and neutrophils. J. Nutr. Biochem. 2004, 15, 479–484. [Google Scholar] [CrossRef] [PubMed]
- Sureda, A.; Tauler, P.; Aguiló, A.; Cases, N.; Fuentespina, E.; Córdova, A.; Tur, J.A.; Pons, A. Relation between oxidative stress markers and antioxidant endogenous defences during exhaustive exercise. Free Radic. Res. 2005, 39, 1317–1324. [Google Scholar] [CrossRef]
- Fisher-Wellman, K.; Bloomer, R.J. Acute exercise and oxidative stress: A 30 year history. Dyn. Med. 2009, 8, 1. [Google Scholar] [CrossRef] [PubMed] [Green Version]
- Steinberg, J.G.; Delliaux, S.; Jammes, Y. Reliability of different blood indices to explore the oxidative stress in response to maximal cycling and static exercises. Clin. Physiol. Funct. Imag. 2006, 26, 106–112. [Google Scholar] [CrossRef] [PubMed]
- Lee, I.M.; Hsieh, C.C.; Paffenbarger, R.S., Jr. Exercise intensity and longevity in men. The Harvard Alumni Health Study. JAMA 1995, 273, 1179–1184. [Google Scholar] [CrossRef] [PubMed]
- Wadley, A.J.; Chen, Y.W.; Bennett, S.J.; Lip, G.Y.; Turner, J.E.; Fisher, J.P.; Aldred, S. Monitoring changes in thioredoxin and over-oxidised peroxiredoxin in response to exercise in humans. Free Radic. Res. 2015, 49, 290–298. [Google Scholar] [CrossRef] [Green Version]
- Schumacher, Y.O.; Jankovits, R.; Bültermann, D.; Schmid, A.; Berg, A. Hematological indices in elite cyclists. Scand. J. Med. Sci. Sports 2002, 12, 301–308. [Google Scholar] [CrossRef]
- Aguiló, A.; Tauler, P.; Pilar Guix, M.; Villa, G.; Córdova, A.; Tur, J.A.; Pons, A. Effect of exercise intensity and training on antioxidants and cholesterol profile in cyclists. J. Nutr. Biochem. 2003, 14, 319–325. [Google Scholar] [CrossRef]
- Guglielmini, C.; Casoni, I.; Patracchini, M.; Manfredini, F.; Grazzi, G.; Ferrari, M.; Conconi, F. Reduction of Hb levels during the racing season in nonsideropenic professional cyclists. Int. J. Sports Med. 1989, 10, 352–356. [Google Scholar] [CrossRef] [PubMed]
- Saris, W.H.; Senden, J.M.; Brouns, F. What is a normal red-blood cell mass for professional cyclists? Lancet 1998, 352, 1758. [Google Scholar] [CrossRef]
- Heuberger, J.; Rotmans, J.I.; Gal, P.; Stuurman, F.E.; van’t Westende, J.; Post, T.E.; Daniels, J.M.A.; Moerland, M.; van Veldhoven, P.L.J.; de Kam, M.L.; et al. Effects of erythropoietin on cycling performance of well trained cyclists: A double-blind, randomised, placebo-controlled trial. Lancet Haematol. 2017, 4, e374–e386. [Google Scholar] [CrossRef]
- Bejder, J.; Andersen, A.B.; Goetze, J.P.; Aachmann-Andersen, N.J.; Nordsborg, N.B. Plasma volume reduction and hematological fluctuations in high-level athletes after an increased training load. Scand. J. Med. Sci. Sports 2017, 27, 1605–1615. [Google Scholar] [CrossRef]
- López-Santiago, N. La biometría hemática. Acta Pediátr. México 2016, 37, 246–249. [Google Scholar] [CrossRef] [Green Version]
- Wintrobe, M.M. Classification of the Anemias on the Basis of Differences in the Size and Hemoglobin Content of the Red Corpuscles. Proc. Soc. Exp. Biol. Med. 1930, 27, 1071–1073. [Google Scholar] [CrossRef]


| PRO | AMA | p-Value | Cohen’s d | Effect Size | |
|---|---|---|---|---|---|
| Age (years) | 28.3 (4.65) | 29.3 (6.54) | 0.671 | 0.17 | Trivial |
| Body mass (kg) | 68.5 (4.43) | 69.9 (5.50) | 0.488 | 0.28 | Small |
| Height (cm) | 178.0 (6.93) | 175.0 (6.71) | 0.274 | 0.44 | Small |
| HEMOGRAM | |||||
| RBC (106·μL−1) | 5.06 (0.281) | 5.15 (0.260) | 0.441 | 0.08 | Trivial |
| Hb (g·dl−1) | 15.6 (0.827) | 15.1 (0.676) | 0.107 | 0.49 | Small |
| HCT (%) | 44.5 (2.28) | 44.6 (1.57) | 0.866 | 0.13 | Trivial |
| MCV (fl) | 87.9 (2.19) | 86.8 (2.92) | 0.305 | 1.10 | Large |
| MCH (pg) | 30.8 (0.35) | 29.4 (1.03) | <0.001 | 1.44 | Large |
| MCHC (%) | 35.0 (0.74) | 33.8 (0.60) | <0.001 | 1.19 | Large |
| PRO | AMA | p-Value | Cohen’s d | Effect Size | |
|---|---|---|---|---|---|
| CAT (U/g Hb) | 32.5 (5.34) | 25.0 (4.51) | <0.001 | 1.55 | Large |
| SOD (U/g Hb) | 1213 (233.0) | 1447 (184.4) | 0.009 | 1.13 | Large |
| GSSG (nmol/mg protein) | 0.524 (0.103) | 0.321 (0.077) | <0.001 | 2.28 | Large |
| GSH (nmol/mg protein) | 24.4 (2.00) | 25.5 (2.17) | 0.216 | 0.50 | Moderate |
| GSSG/GSH | 2.16 (0.436) | 1.27 (0.279) | <0.001 | 2.52 | Large |
| GSSG+GSH (nmol/mg protein) | 24.9 (2.02) | 25.8 (2.19) | 0.317 | 0.41 | Small |
| PRO | AMA | p-Value | Cohen’s d | Effect Size | |
| VT1 | |||||
| VO2 (mL·min−1) | 3593 (271.0) | 2041 (401.0) | <0.001 | 4.40 | Large |
| W | 299 (32.9) | 157 (36.1) | <0.001 | 4.07 | Large |
| WR (W·kg−1) | 4.37 (0.42) | 2.27 (0.56) | <0.001 | 4.14 | Large |
| %VO2max | 76.2 (3.91) | 49.7 (5.58) | <0.001 | 5.36 | Large |
| HR (beats·min−1) | 149 (14.7) | 132 (13.2) | 0.004 | 1.25 | Large |
| RER | 0.906 (0.05) | 0.899 (0.04) | 0.707 | 0.15 | Trivial |
| VT2 | |||||
| VO2 (mL·min−1) | 4259 (234.0) | 3389 (505.0) | <0.001 | 2.10 | Large |
| W | 379 (34.0) | 286 (45.1) | <0.001 | 2.28 | Large |
| WR (W·kg−1) | 5.54 (0.41) | 4.13 (0.74) | <0.001 | 2.28 | Large |
| %VO2max | 90.3 (2.36) | 84.7 (5.67) | 0.005 | 1.24 | Large |
| HR (beats·min−1) | 168 (11.1) | 171 (9.4) | 0.467 | 0.29 | Small |
| RER | 1.01 (0.05) | 1.03 (0.03) | 0.323 | 0.40 | Small |
| VO2max | |||||
| VO2 (mL·min−1) | 4714 (241.0) | 4066 (580.7) | 0.002 | 1.38 | Large |
| VO2/R (mL·kg−1·min−1) | 69.0 (3.94) | 58.7 (9.58) | 0.003 | 1.34 | Large |
| W | 474 (31.5) | 383 (49.2) | <0.001 | 2.13 | Large |
| WR (W·kg−1) | 6.93 (0.44) | 5.51 (0.81) | <0.001 | 2.09 | Large |
| HR (beats·min−1) | 186 (7.42) | 186 (7.62) | 0.966 | 0.02 | Trivial |
| RER | 1.22 (0.04) | 1.14 (0.06) | 0.001 | 1.49 | Large |
| CAT | SOD | GSSG | GSH | %GSSG/GSH | GSSG + GSH | ||
| PRO (n = 11) | |||||||
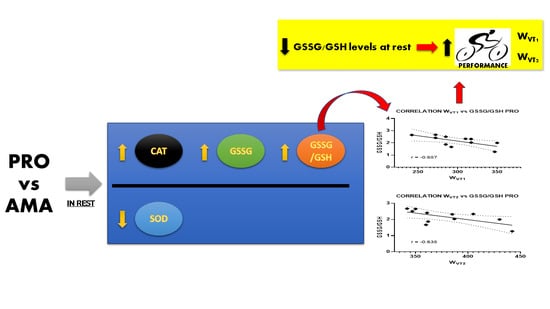
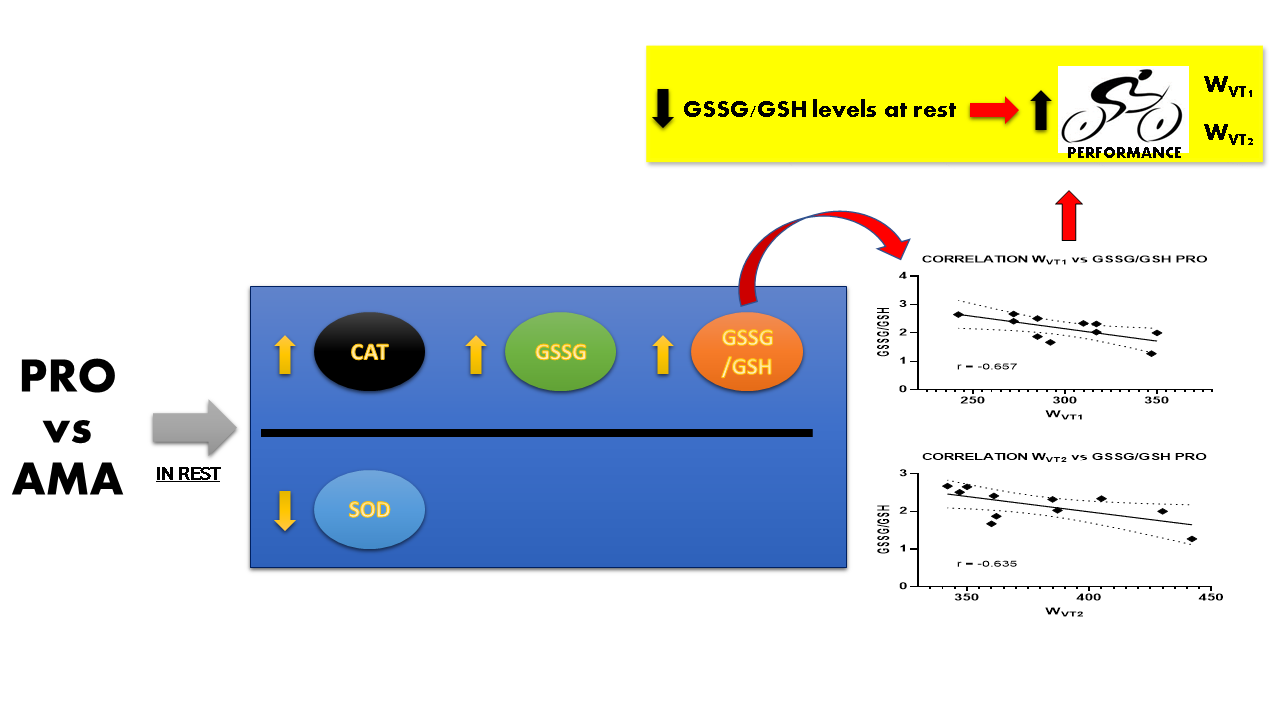
| WVT1 | r | −0.120 | 0.305 | −0.449 | 0.425 | −0.657 | 0.397 |
| p-value | 0.72 | 0.36 | 0.17 | 0.19 | 0.03 | 0.23 | |
| VO2VT1 | r | 0.001 | 0.378 | −0.442 | 0.457 | −0.651 | 0.429 |
| p-value | 0.998 | 0.252 | 0.173 | 0.157 | 0.030 | 0.188 | |
| WVT2 | r | −0.253 | 0.183 | −0.575 | 0.116 | −0.635 | 0.085 |
| p-value | 0.45 | 0.59 | 0.06 | 0.73 | 0.04 | 0.80 | |
| VO2VT2 | r | −0.319 | 0.423 | −0.518 | 0.277 | −0.622 | 0.247 |
| p-value | 0.34 | 0.20 | 0.10 | 0.41 | 0.04 | 0.46 | |
| WMAX | r | −0.045 | 0.186 | −0.342 | 0.239 | −0.443 | 0.219 |
| p-value | 0.90 | 0.58 | 0.30 | 0.48 | 0.17 | 0.52 | |
| VO2MAX | r | −0.375 | 0.422 | −0.312 | 0.304 | −0.414 | 0.284 |
| p-value | 0.26 | 0.20 | 0.35 | 0.36 | 0.21 | 0.40 | |
| AMA (n = 15) | |||||||
| WVT1 | r | 0.181 | 0.172 | 0.206 | −0.102 | 0.256 | −0.098 |
| p-value | 0.52 | 0.54 | 0.46 | 0.72 | 0.36 | 0.73 | |
| VO2VT1 | r | 0.360 | 0.159 | 0.182 | −0.108 | 0.230 | −0.105 |
| p-value | 0.19 | 0.57 | 0.52 | 0.70 | 0.41 | 0.71 | |
| WVT2 | r | 0.414 | 0.113 | −0.002 | 0.047 | −0.046 | 0.040 |
| p-value | 0.13 | 0.69 | 0.99 | 0.87 | 0.87 | 0.89 | |
| VO2VT2 | r | 0.358 | 0.234 | −0.104 | −0.068 | −0.097 | −0.077 |
| p-value | 0.19 | 0.69 | 0.71 | 0.81 | 0.73 | 0.78 | |
| WMAX | r | 0.180 | 0.173 | −0.136 | −0.379 | 0.009 | −0.386 |
| p-value | 0.52 | 0.54 | 0.63 | 0.16 | 0.97 | 0.16 | |
| VO2MAX | r | 0.289 | 0.278 | −0.118 | −0.334 | 0.001 | −0.339 |
| p-value | 0.30 | 0.32 | 0.66 | 0.22 | 0.10 | 0.22 | |
Publisher’s Note: MDPI stays neutral with regard to jurisdictional claims in published maps and institutional affiliations. |
© 2021 by the authors. Licensee MDPI, Basel, Switzerland. This article is an open access article distributed under the terms and conditions of the Creative Commons Attribution (CC BY) license (http://creativecommons.org/licenses/by/4.0/).
Share and Cite
Martínez-Noguera, F.J.; Alcaraz, P.E.; Ortolano-Ríos, R.; Dufour, S.P.; Marín-Pagán, C. Differences between Professional and Amateur Cyclists in Endogenous Antioxidant System Profile. Antioxidants 2021, 10, 282. https://doi.org/10.3390/antiox10020282
Martínez-Noguera FJ, Alcaraz PE, Ortolano-Ríos R, Dufour SP, Marín-Pagán C. Differences between Professional and Amateur Cyclists in Endogenous Antioxidant System Profile. Antioxidants. 2021; 10(2):282. https://doi.org/10.3390/antiox10020282
Chicago/Turabian StyleMartínez-Noguera, Francisco Javier, Pedro E. Alcaraz, Raquel Ortolano-Ríos, Stéphane P. Dufour, and Cristian Marín-Pagán. 2021. "Differences between Professional and Amateur Cyclists in Endogenous Antioxidant System Profile" Antioxidants 10, no. 2: 282. https://doi.org/10.3390/antiox10020282