
Alternatives to Carbon Dioxide in Two Phases for the Improvement of Broiler Chickens’ Welfare during Stunning
 , , , , , and
Abstract
:Simple Summary
Abstract
1. Introduction
2. Materials and Methods
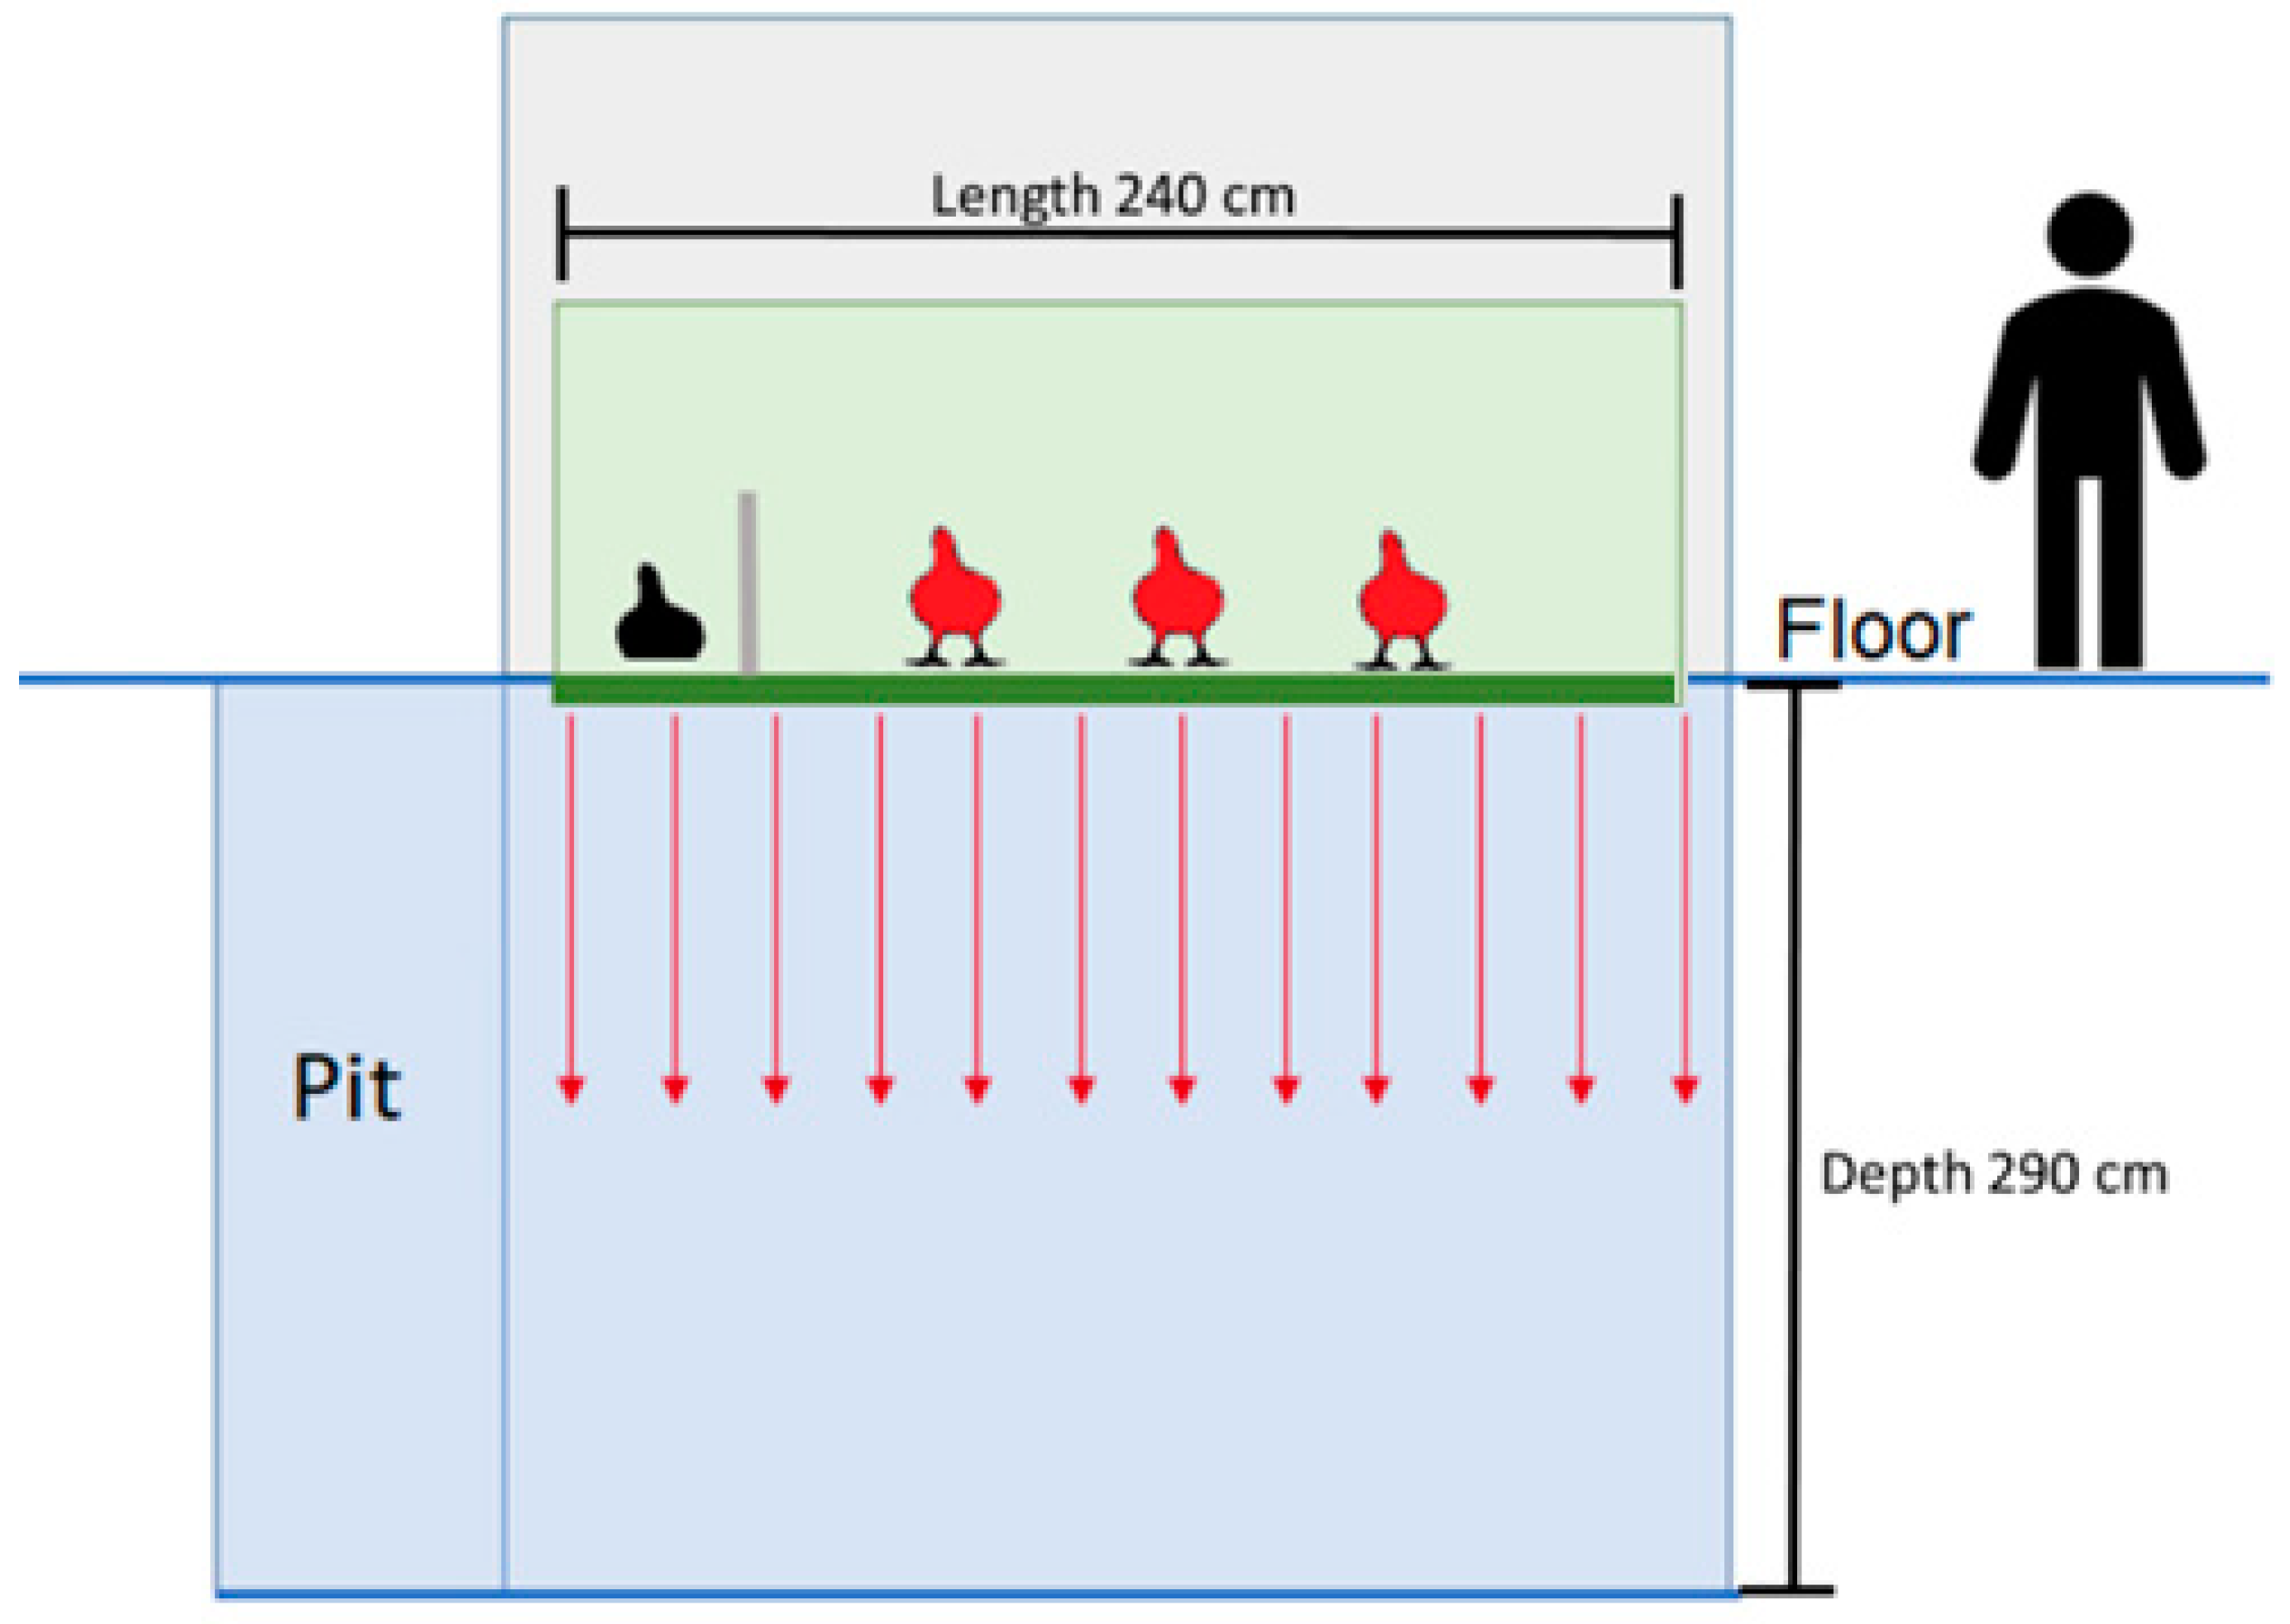
2.1. Experimental Design and Facilities
2.2. Gas Concentration Assessment
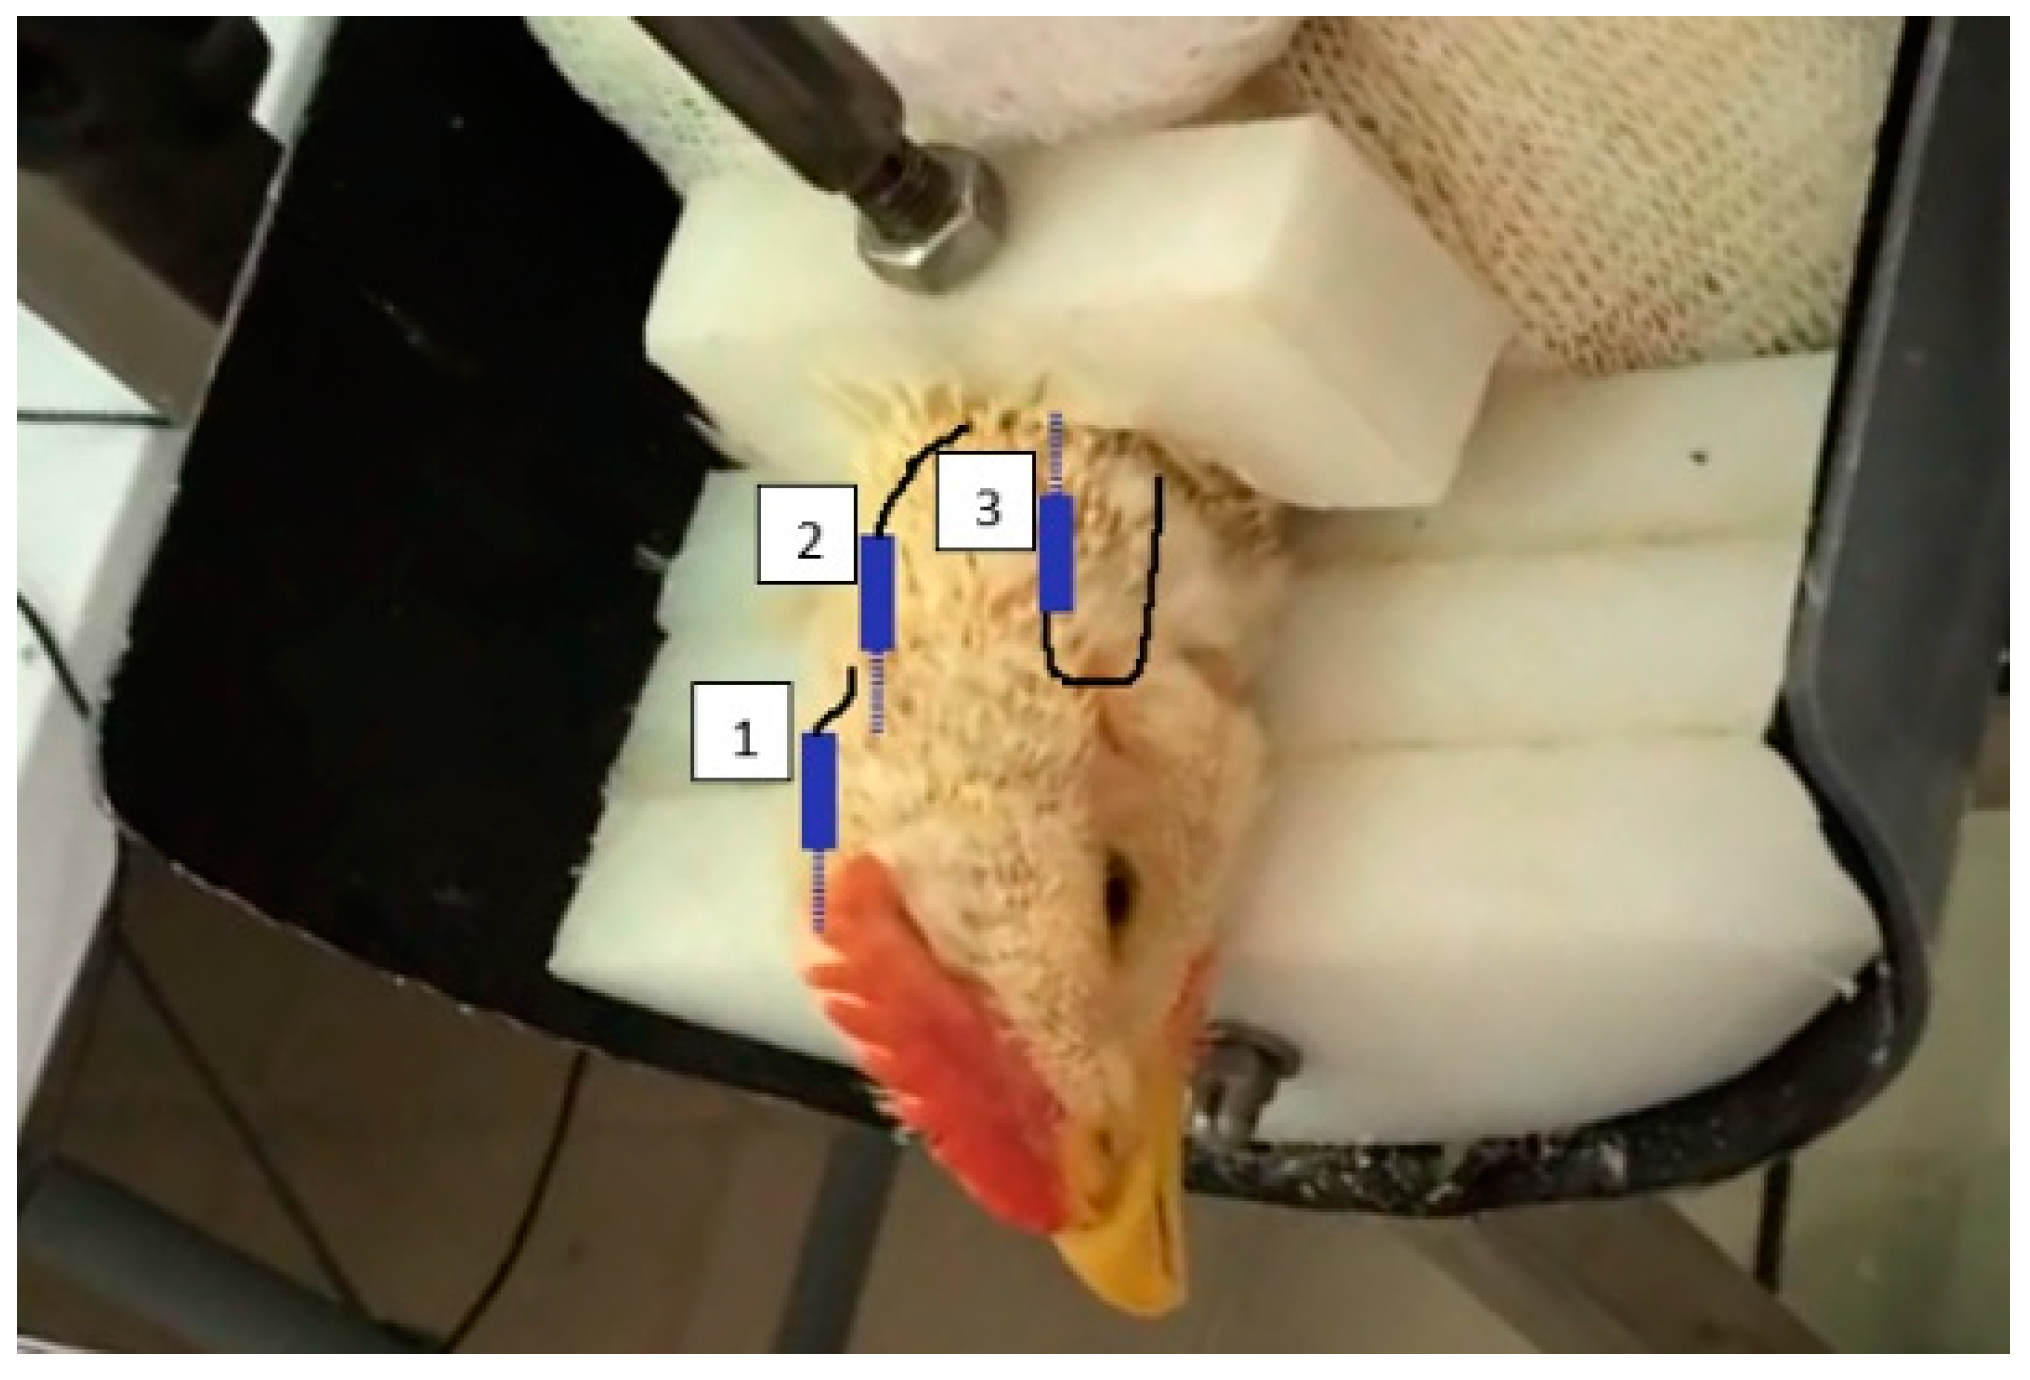
2.3. Brain Activity Assessment
2.4. Behavioural Assessment
2.5. Data Pre-Processing and Statistical Analyses
3. Results
3.1. Gas Concentration Assessment
3.2. Brain Activity Assessment
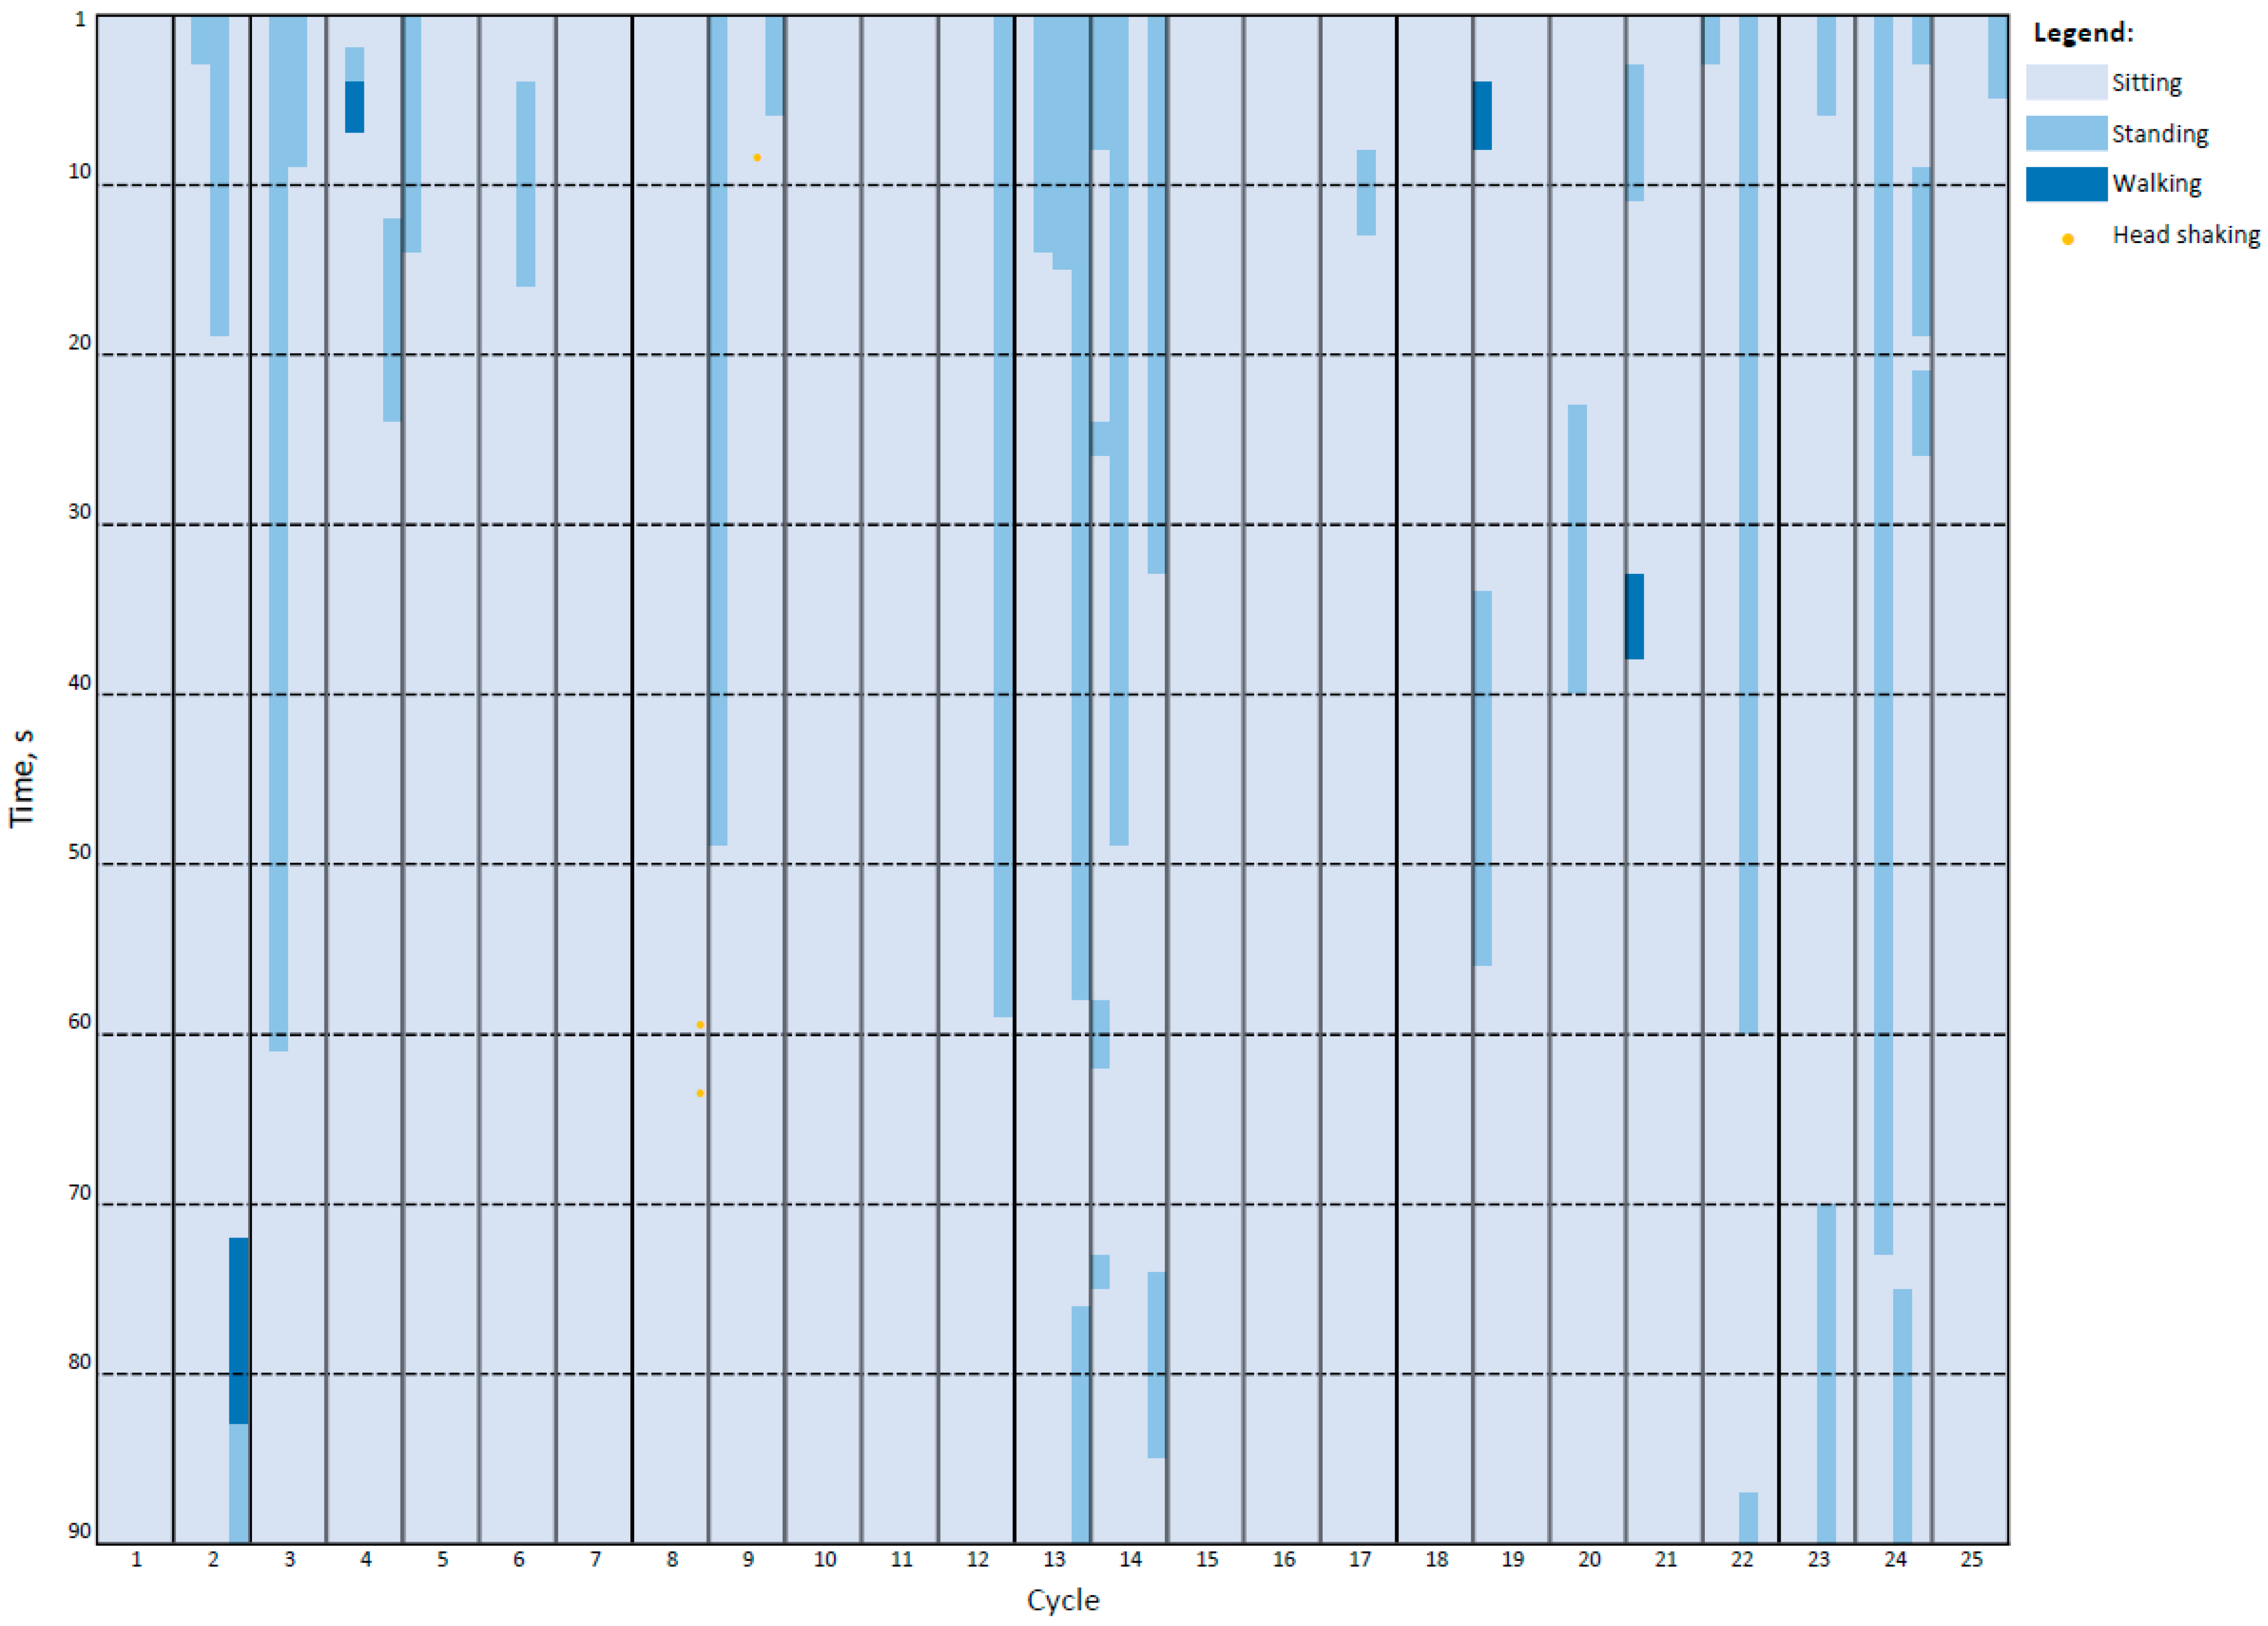
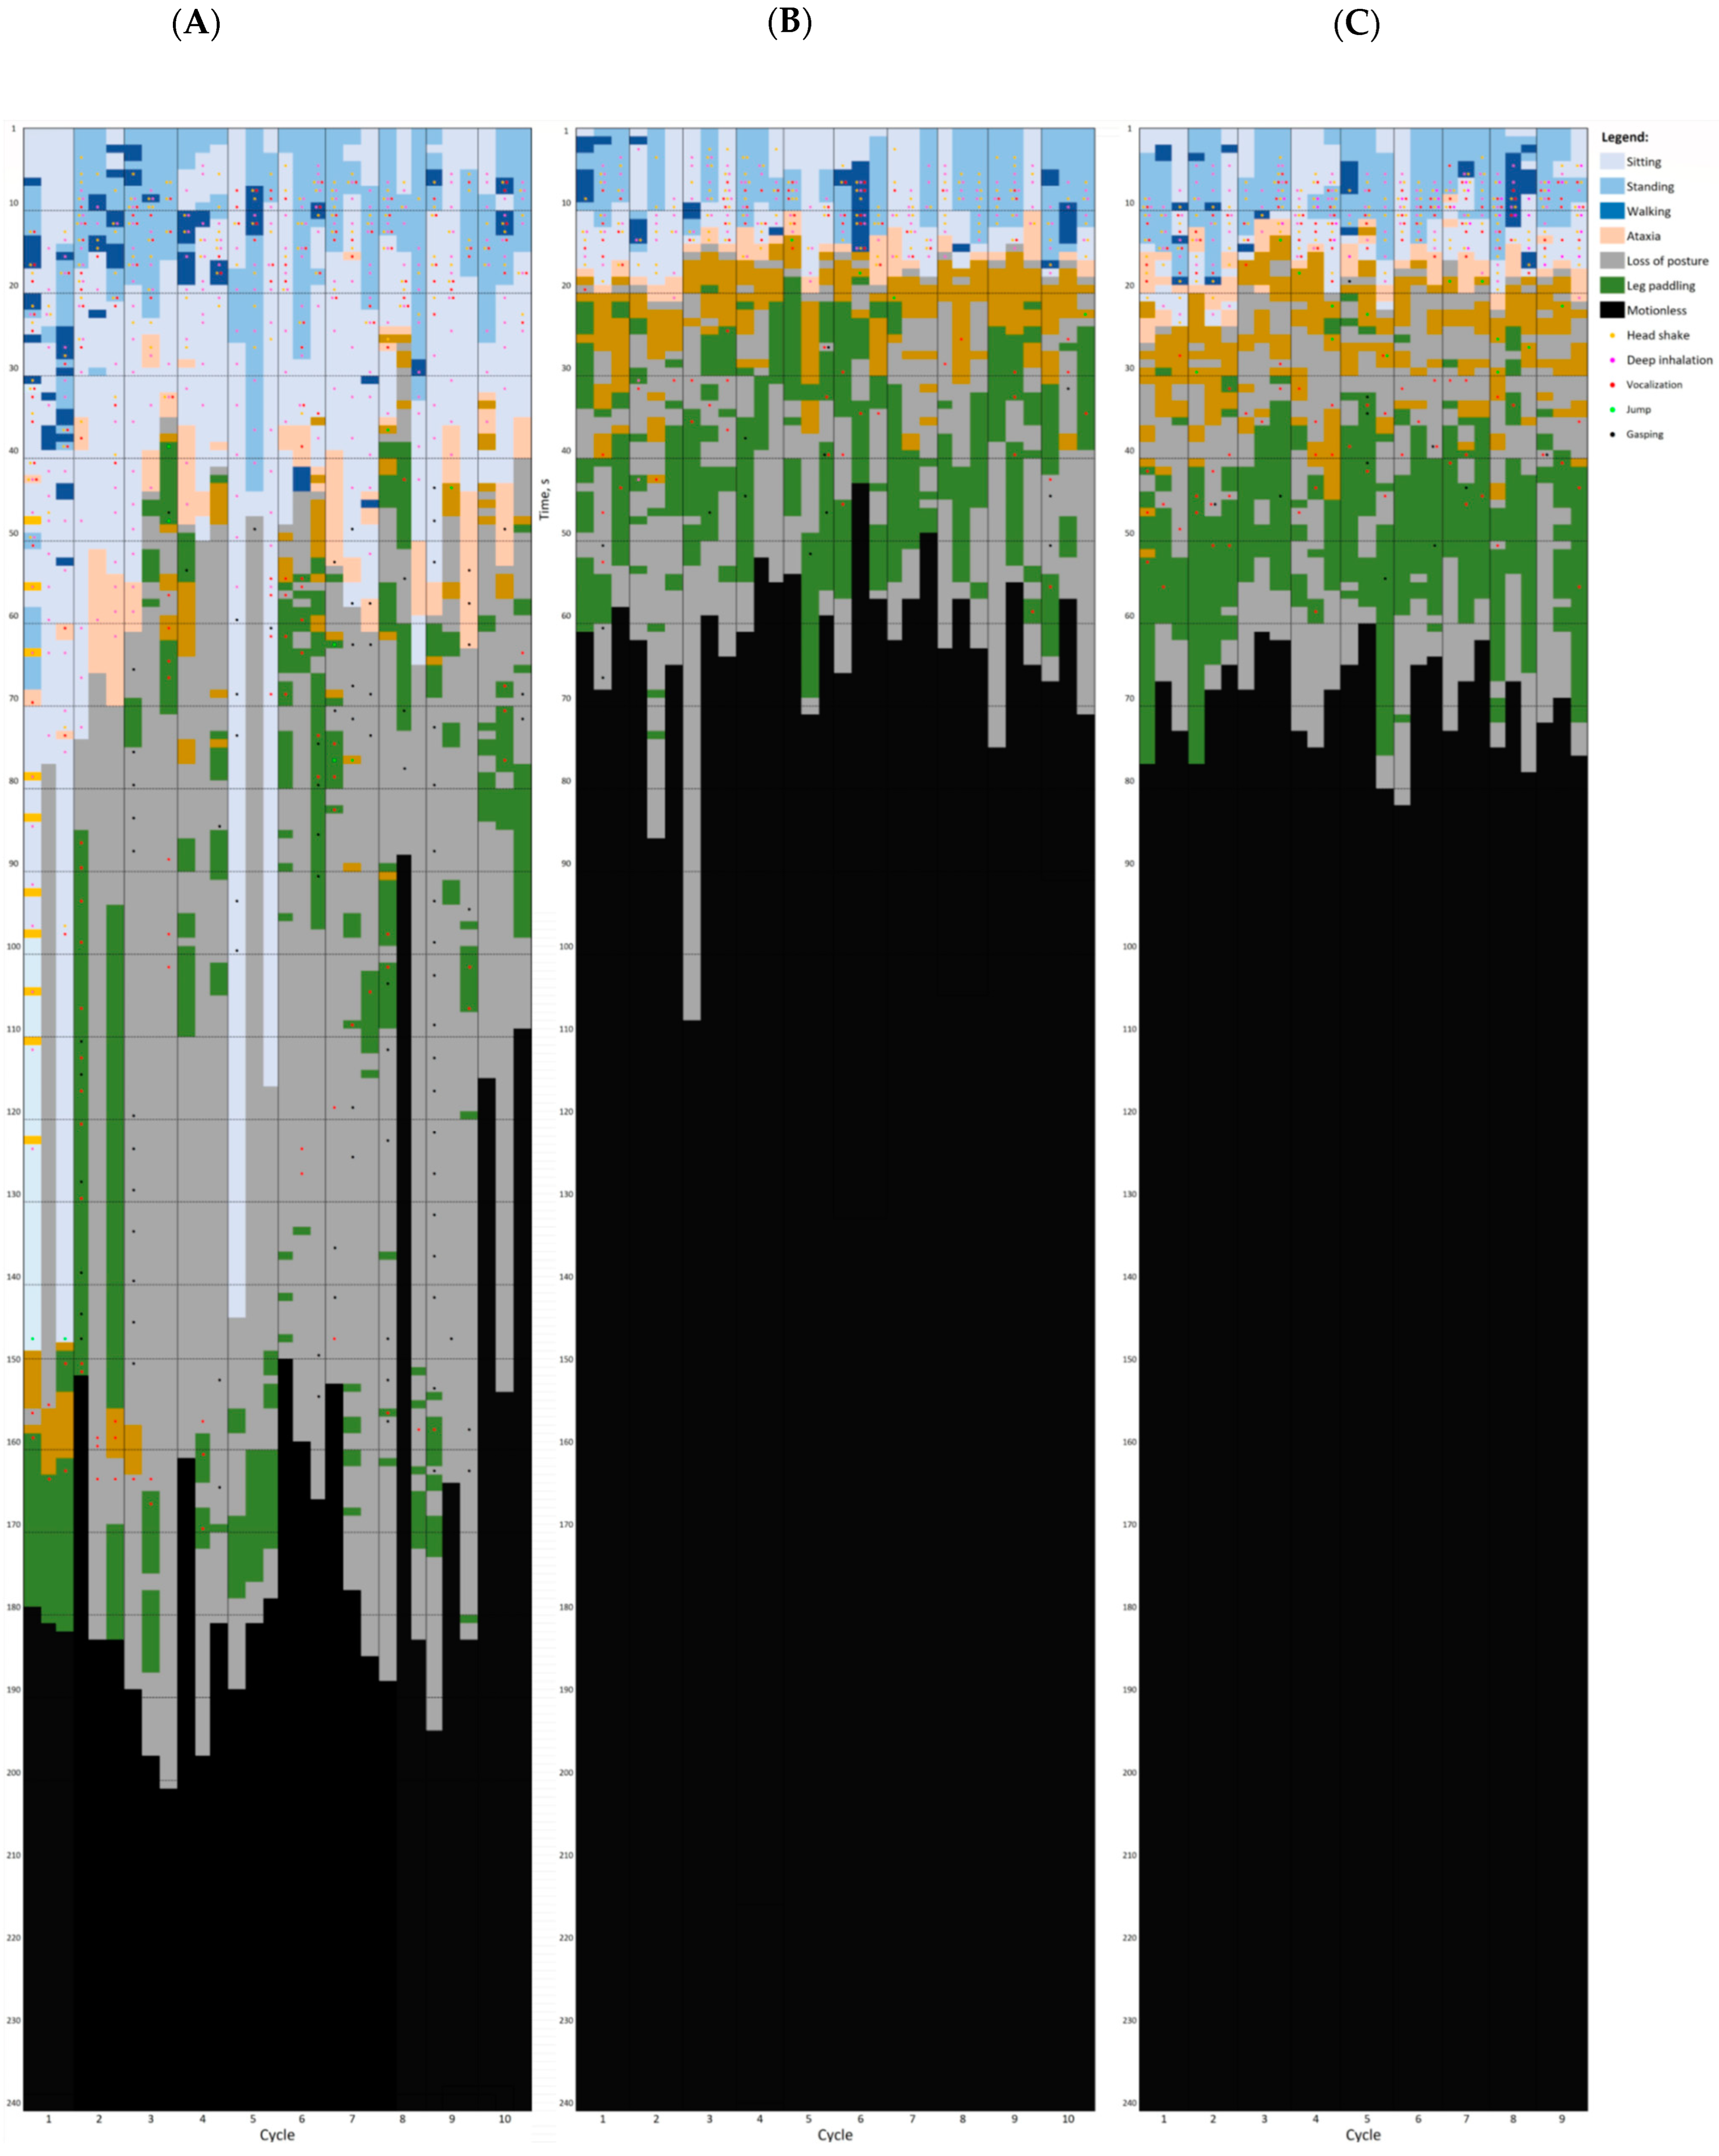
3.3. Behavioural Assessment
3.3.1. Behavioural Assessment of Loss of Posture and Motionlessness
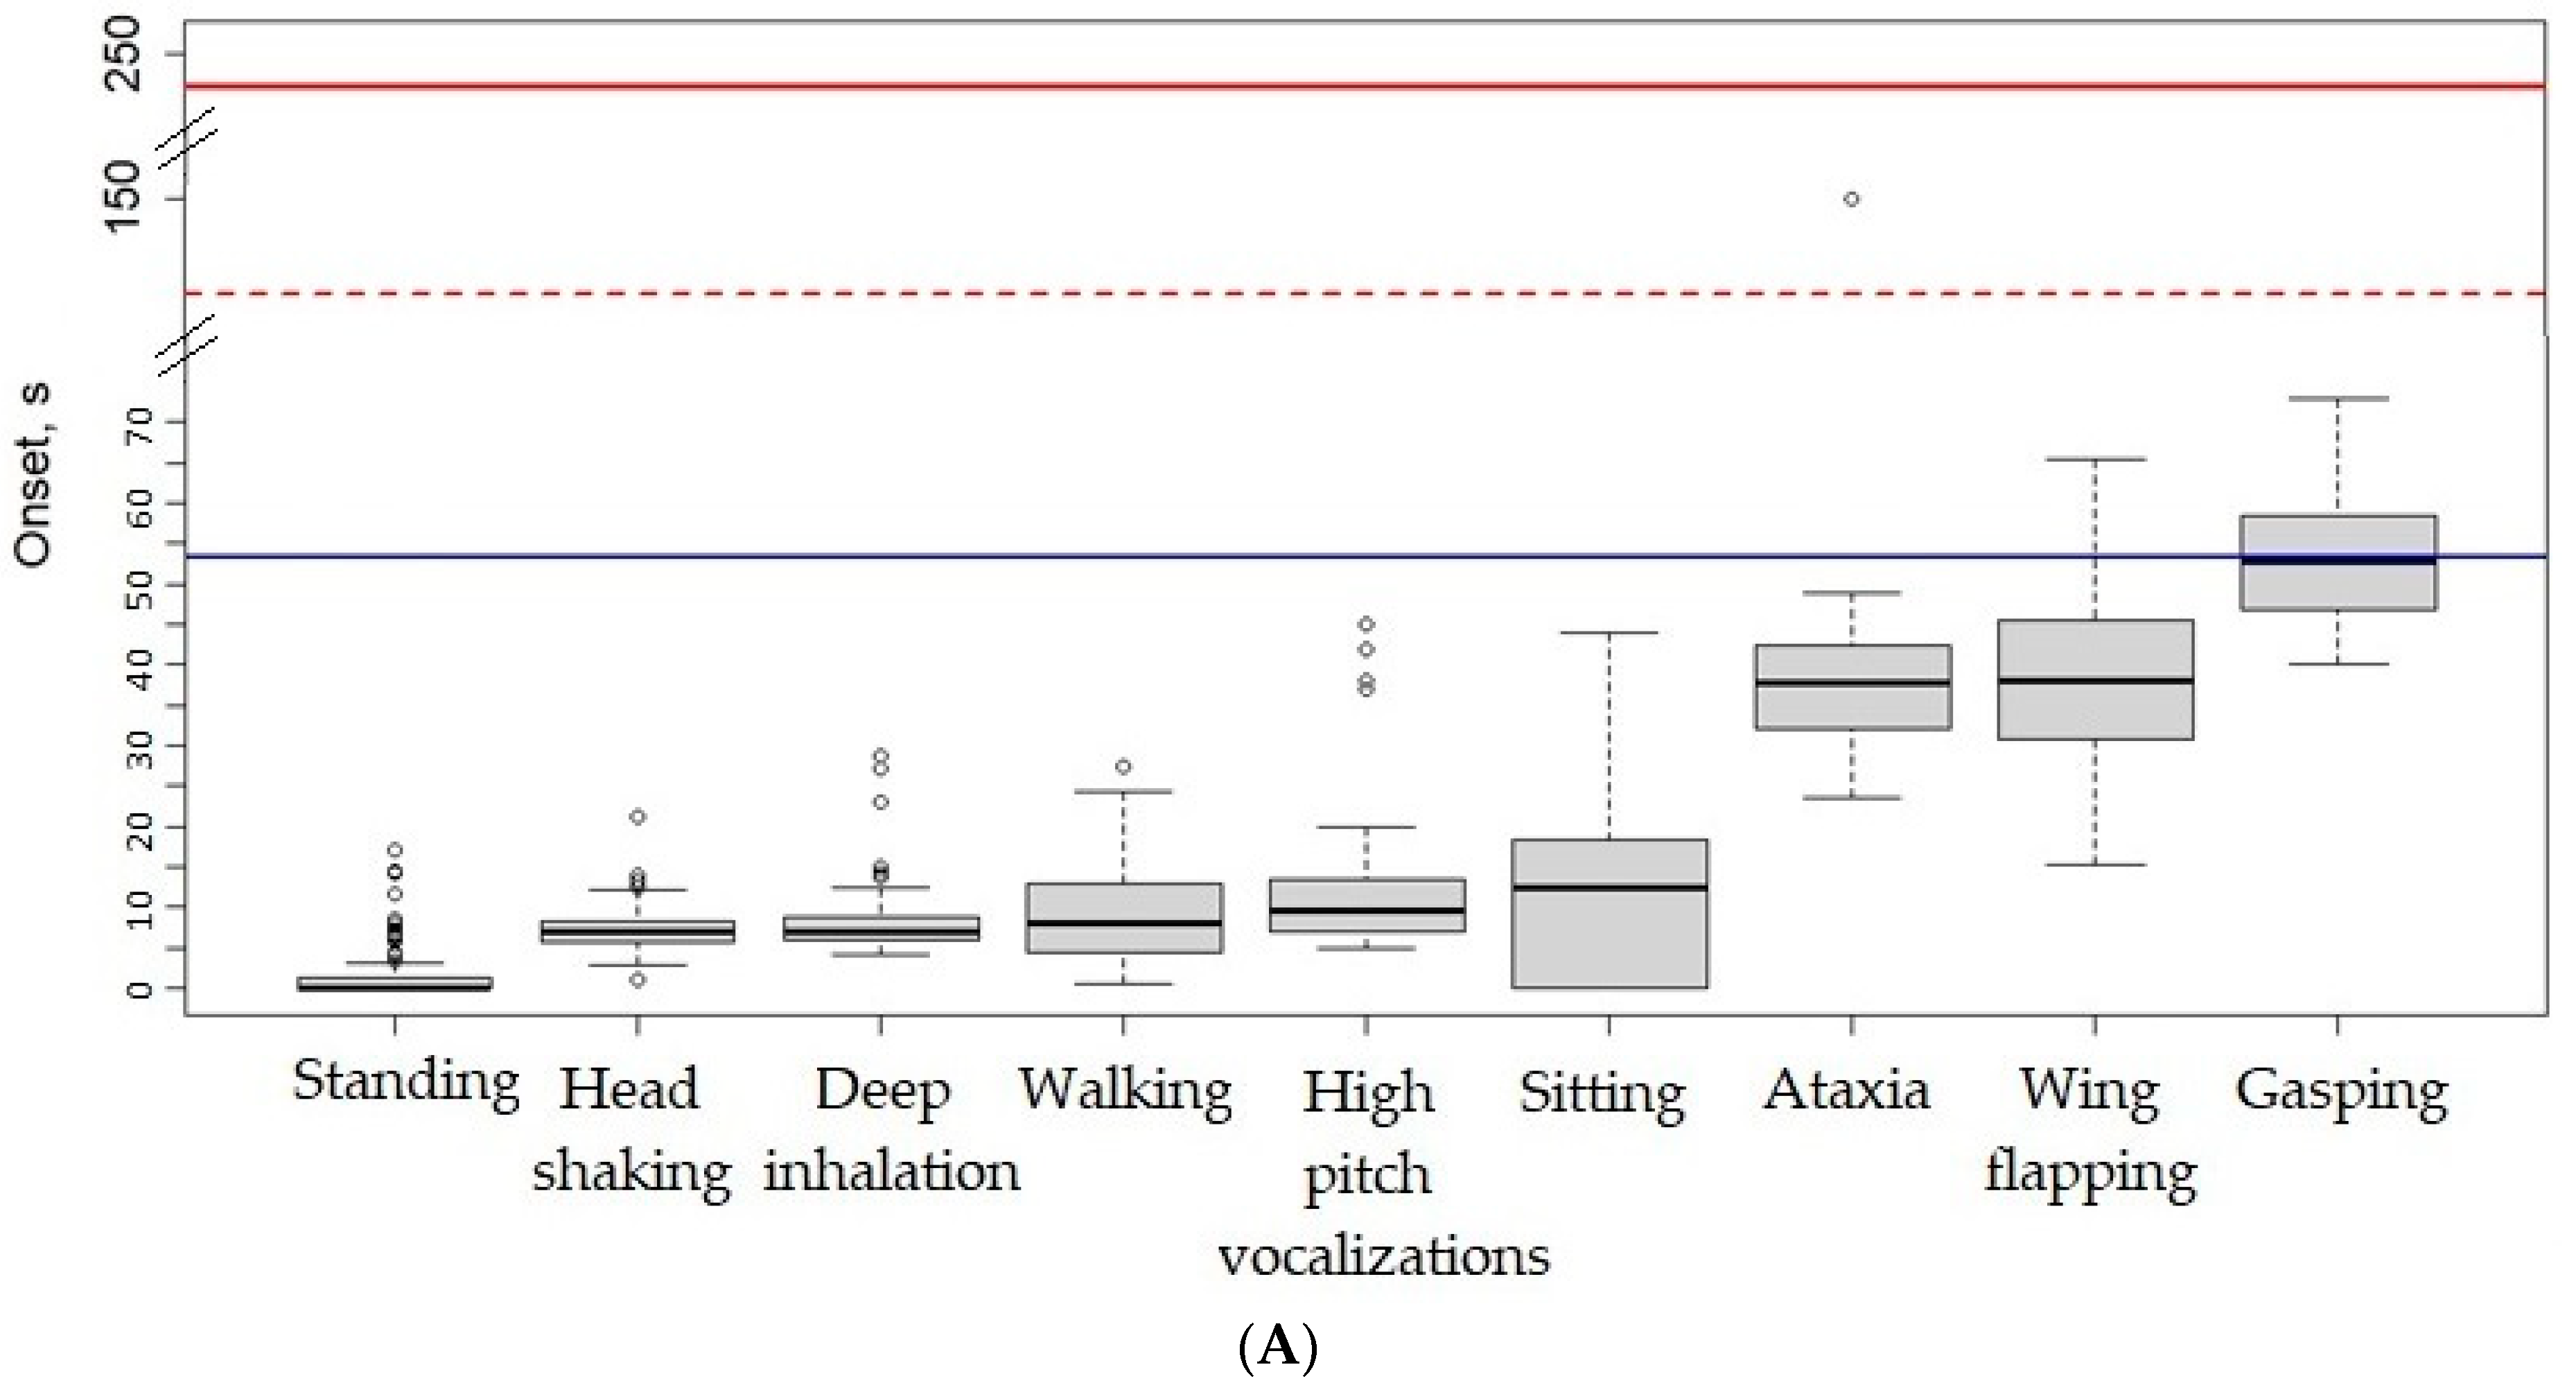
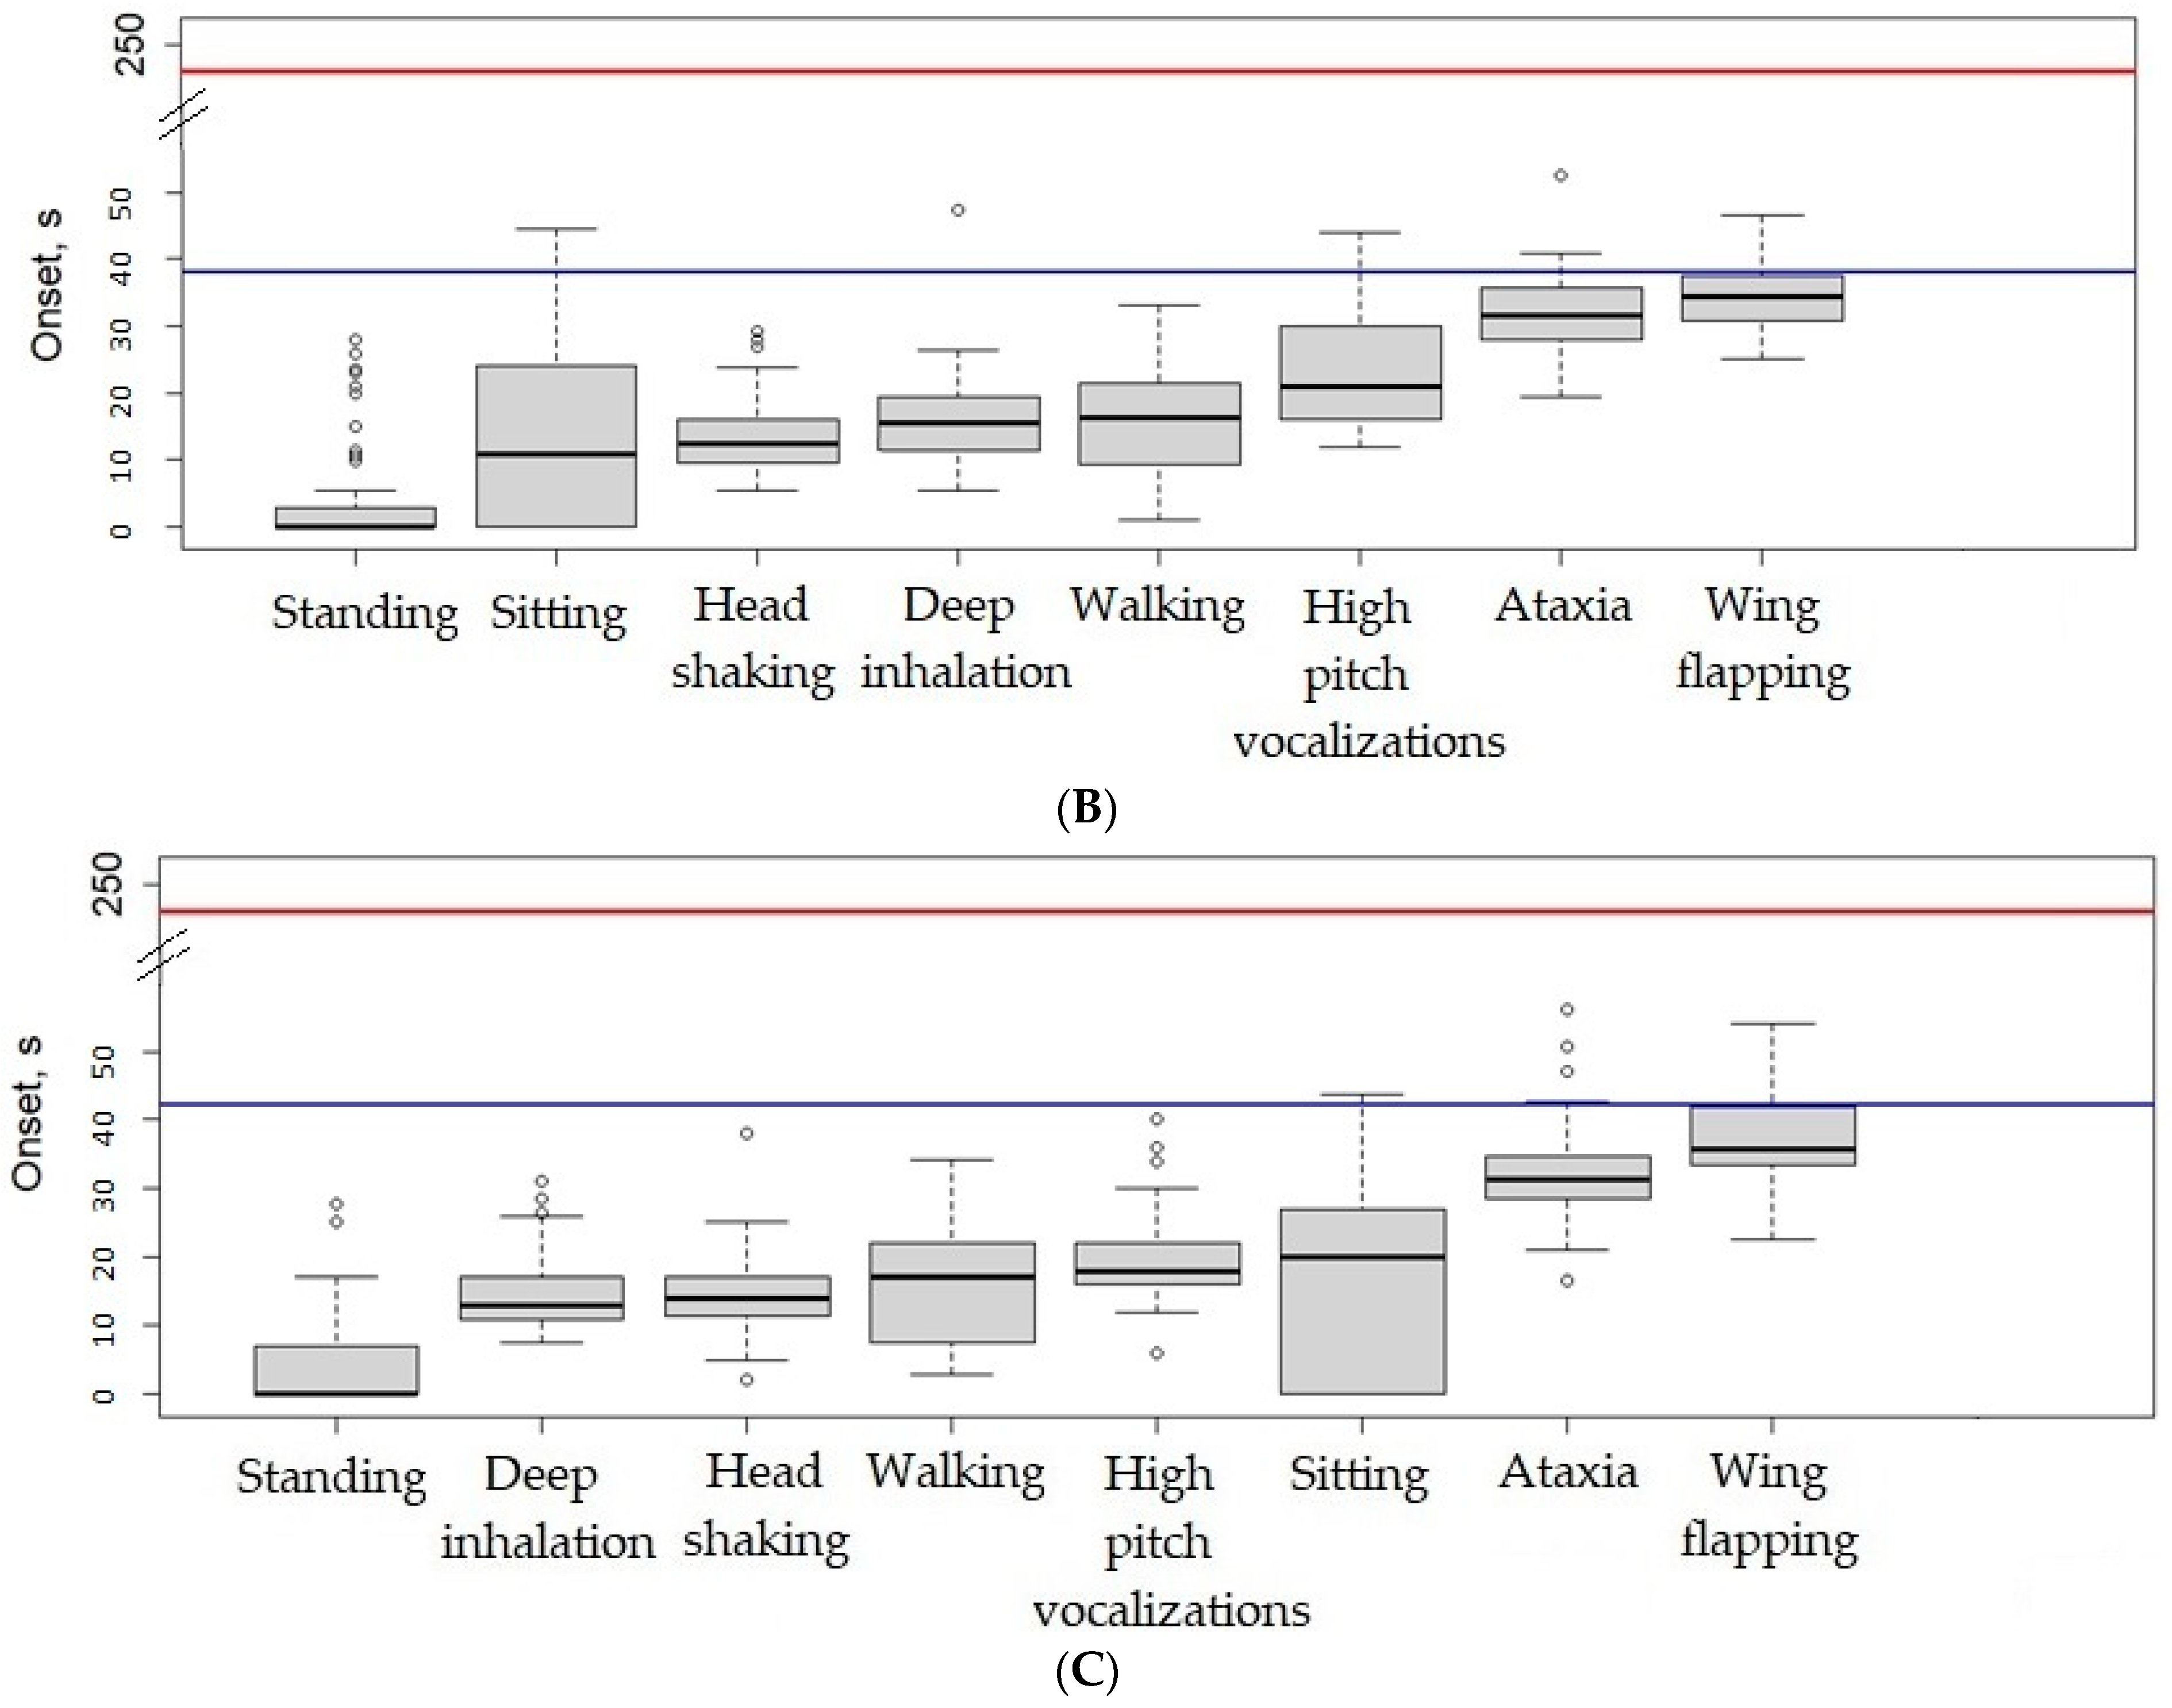
3.3.2. Behavioural Assessment before Loss of Posture
3.3.3. Behavioural Assessment after Loss of Posture
3.3.4. Relationships between EEG and Behaviour
4. Discussion
4.1. Gas Mixture Concentration and Stability Assessment
4.2. Brain Activity Assessment
4.3. Behavioural Assessment
4.3.1. Behavioural Assessment of Loss of Posture and Motionlessness
4.3.2. Behavioural Assessment before Loss of Posture
4.3.3. Behavioural Assessment after Loss of Posture
4.4. Relationship between Brain Activity and Behavioural Assessment
5. Conclusions
Author Contributions
Funding
Institutional Review Board Statement
Informed Consent Statement
Data Availability Statement
Acknowledgments
Conflicts of Interest
References
- European Union Council Regulation (EC). No 1099/2009 of 24 September 2009 on the Protection of Animals at the Time of Killing; Council of the European Union: Brussels, Belgium, 2009.
- United Kingdom the Welfare of Animals (Slaughter or Killing) Regulations. 1995. Available online: https://www.legislation.gov.uk/uksi/1995/731/made (accessed on 7 March 2023).
- EFSA (European Food Safety Authority). Opinion of the Scientific Panel on Animal Health and Welfare (AHAW) on a Request from the Commission Related to Welfare Aspects of the Main Systems of Stunning and Killing the Main Commercial Species of Animals. EFSA J. 2004, 45, 1–29. [Google Scholar] [CrossRef]
- EFSA AWAH Panel (ESFA Panel on Animal Health and Animal Welfare); Nielsen, S.S.; Alvarez, J.; Bicout, D.J.; Calistri, P.; Depner, K.; Drewe, J.A.; Garin-Bastuji, B.; Gonzales Rojas, J.L.; Gortázar Schmidt, C.; et al. Slaughter of Animals: Poultry. EFSA J. 2019, 17, e05849. [Google Scholar] [CrossRef]
- Berg, C.; Raj, M. A Review of Different Stunning Methods for Poultry—Animal Welfare Aspects (Stunning Methods for Poultry). Animals 2015, 5, 1207–1219. [Google Scholar] [CrossRef]
- Verhoeven, M.T.W.; Gerritzen, M.A.; Kluivers-Poodt, M.; Hellebrekers, L.J.; Kemp, B. Validation of Behavioural Indicators Used to Assess Unconsciousness in Sheep. Res. Vet. Sci. 2015, 101, 144–153. [Google Scholar] [CrossRef]
- European Commission. Report from the Commission to the European Parliament and the Council on the Various Stunning Methods for Poultry. Available online: https://food.ec.europa.eu/system/files/2016-10/aw_practice_slaughter_com_2013_915_report_en.pdf (accessed on 31 January 2023).
- EURCAW-Poultry-SFA Main Welfare Aspects of Stunning Chicken by Exposure to Controlled Atmosphere. Available online: https://zenodo.org/record/7382889#.Y8-a-8nMI2x (accessed on 20 February 2023).
- Martoft, L.; Lomholt, L.; Kolthoff, C.; Rodriguez, B.E.; Jensen, E.W.; Jørgensen, P.F.; Pedersen, H.D.; Forslid, A. Effects of CO2 Anaesthesia on Central Nervous System Activity in Swine. Lab. Anim. 2002, 36, 115–126. [Google Scholar] [CrossRef]
- Gent, T.C.; Gebhardt-Henrich, S.; Schild, S.-L.A.; Rahman, A.A.; Toscano, M.J. Evaluation of Poultry Stunning with Low Atmospheric Pressure, Carbon Dioxide or Nitrogen Using a Single Aversion Testing Paradigm. Animals 2020, 10, 1308. [Google Scholar] [CrossRef]
- McKeegan, D.E.F.; McIntyre, J.; Demmers, T.G.M.; Wathes, C.M.; Jones, R.B. Behavioural Responses of Broiler Chickens during Acute Exposure to Gaseous Stimulation. Appl. Anim. Behav. Sci. 2006, 99, 271–286. [Google Scholar] [CrossRef]
- Velarde, A.; Raj, M. Animal Welfare at Slaughter, 1st ed.; Velarde, A., Raj, M., Eds.; 5m Publishing: Sheffield, UK, 2016. [Google Scholar]
- Webster, A.B.; Fletcher, D.L. Assessment of the Aversion of Hens to Different Gas Atmospheres Using an Approach-Avoidance Test. Appl. Anim. Behav. Sci. 2004, 88, 275–287. [Google Scholar] [CrossRef]
- Raj, A.B.M. Aversive Reactions of Turkeys to Argon, Carbon Dioxide and a Mixture of Carbon Dioxide and Argon. Vet. Rec. 1996, 138, 592–593. [Google Scholar] [CrossRef] [PubMed]
- Wooley, S.C.; Gentle, M.J. Physiological and Behavioural Responses of the Domestic Hen to Hypoxia. Res. Vet. Sci. 1988, 45, 377–382. [Google Scholar] [CrossRef]
- McKeegan, D.; McIntyre, J.; Demmers, T.; Lowe, J.; Wathes, C.; van den Broek, P.; Coenen, A.; Gentle, M. Physiological and Behavioural Responses of Broilers to Controlled Atmosphere Stunning: Implications for Welfare. Anim. Welf. 2007, 16, 409–426. [Google Scholar] [CrossRef]
- Coenen, A.M.L.; Lankhaar, J.; Lowe, J.C.; McKeegan, D.E.F. Remote Monitoring of Electroencephalogram, Electrocardiogram, and Behavior during Controlled Atmosphere Stunning in Broilers: Implications for Welfare. Poult. Sci. 2009, 88, 10–19. [Google Scholar] [CrossRef] [PubMed]
- EFSA (European Food Safety Authority). Guidance on the Assessment Criteria for Applications for New or Modified Stunning Methods Regarding Animal Protection at the Time of Killing. EFSA J. 2018, 16, e05343. [Google Scholar] [CrossRef]
- Gibson, T.J.; Rebelo, C.B.; Gowers, T.A.; Chancellor, N.M. Electroencephalographic Assessment of Concussive Non-Penetrative Captive Bolt Stunning of Turkeys. Br. Poult. Sci. 2018, 59, 90–95. [Google Scholar] [CrossRef] [PubMed]
- Tonner, P.H.; Bein, B. Classic Electroencephalographic Parameters: Median Frequency, Spectral Edge Frequency Etc. Best. Pract. Res. Clin. Anaesthesiol. 2006, 20, 147–159. [Google Scholar] [CrossRef]
- Raj, A.B.M.; O’Callaghan, M.; Knowles, T.G. The Effects of Amount and Frequency of Alternating Current Used in Water Bath Stunning and of Slaughter Methods on Electroencephalograms in Broilers. Anim. Welf. 2006, 15, 7–18. [Google Scholar] [CrossRef]
- Sandercock, D.A.; Auckburally, A.; Flaherty, D.; Sandilands, V.; McKeegan, D.E.F. Avian Reflex and Electroencephalogram Responses in Different States of Consciousness. Physiol. Behav. 2014, 133, 252–259. [Google Scholar] [CrossRef]
- Hernandez, E.; James, F.; Torrey, S.; Widowski, T.; Schwean-Lardner, K.; Monteith, G.; Turner, P.V. Evaluation of Brain Death in Laying Hens During On-Farm Killing by Cervical Dislocation Methods or Pentobarbital Sodium Injection. Front. Vet. Sci. 2019, 6, 297. [Google Scholar] [CrossRef] [PubMed]
- Martin, J.E.; Christensen, K.; Vizzier-Thaxton, Y.; McKeegan, D.E.F. Effects of Light on Responses to Low Atmospheric Pressure Stunning in Broilers. Br. Poult. Sci. 2016, 57, 585–600. [Google Scholar] [CrossRef] [PubMed]
- Friard, O.; Gamba, M. BORIS: A Free, Versatile Open-Source Event-Logging Software for Video/Audio Coding and Live Observations. Methods Ecol. Evol. 2016, 7, 1325–1330. [Google Scholar] [CrossRef]
- Gerritzen, M.A.; Lambooij, E.; Hillebrand, S.J.W.; Lankhaar, J.A.C.; Pieterse, C. Behavioral Responses of Broilers to Different Gaseous Atmospheres. Poult. Sci. 2000, 79, 928–933. [Google Scholar] [CrossRef]
- EFSA AHAW Panel (EFSA Panel on Animal Health and Welfare); More, S.; Bicout, D.; Bøtner, A.; Butterworth, A.; Calistri, P.; Depner, K.; Edwards, S.; Garin-Bastuji, B.; Good, M.; et al. Low Atmospheric Pressure System for Stunning Broiler Chickens. EFSA J. 2017, 15, e05056. [Google Scholar] [CrossRef]
- Martin, J.E.; Christensen, K.; Vizzier-Thaxton, Y.; Mitchell, M.A.; McKeegan, D.E.F. Behavioural, Brain and Cardiac Responses to Hypobaric Hypoxia in Broiler Chickens. Physiol. Behav. 2016, 163, 25–36. [Google Scholar] [CrossRef]
- Lou, M.E.; Kleinhenz, M.D.; Schroeder, R.; Lechtenberg, K.; Montgomery, S.; Coetzee, J.F.; Viscardi, A.V. Evaluating the Utility of a CO2 Surgical Laser for Piglet Tail Docking to Reduce Behavioral and Physiological Indicators of Pain and to Improve Wound Healing: A Pilot Study. Appl. Anim. Behav. Sci. 2022, 254, 105720. [Google Scholar] [CrossRef]
- Gerritzen, M.A.; Reimert, H.G.M.; Hindle, V.A.; Verhoeven, M.T.W.; Veerkamp, W.B. Multistage Carbon Dioxide Gas Stunning of Broilers. Poult. Sci. 2013, 92, 41–50. [Google Scholar] [CrossRef]
- Benson, E.R.; Alphin, R.L.; Rankin, M.K.; Caputo, M.P.; Kinney, C.A.; Johnson, A.L. Evaluation of EEG Based Determination of Unconsciousness vs. Loss of Posture in Broilers. Res. Vet. Sci. 2012, 93, 960–964. [Google Scholar] [CrossRef] [PubMed]
- Raj, A.B.M.; Wotton, S.B.; Gregory, N.G. Changes in the Somatosensory Evoked Potentials and Spontaneous Electroencephalogram of Hens during Stunning with Carbon Dioxide and Argon Mixture. Br. Vet. J. 1992, 148, 147–156. [Google Scholar] [CrossRef] [PubMed]
- Gerritzen, M.A.; Lambooij, B.; Reimert, H.; Stegeman, A.; Spruijt, B. On-Farm Euthanasia of Broiler Chickens: Effects of Different Gas Mixtures on Behavior and Brain Activity. Poult. Sci. 2004, 83, 1294–1301. [Google Scholar] [CrossRef]
- Johnson, C.B.; Gibson, T.J.; Stafford, K.J.; Mellor, D.J. Pain Perception at Slaughter. Anim. Welf. 2012, 21, 113–122. [Google Scholar] [CrossRef]
- Martin, J.E.; Sandilands, V.; Sparrey, J.; Baker, L.; Dixon, L.M.; McKeegan, D.E.F. Welfare Assessment of Novel On-Farm Killing Methods for Poultry. PLoS ONE 2019, 14, e0212872. [Google Scholar] [CrossRef]
- Raj, A.B.M.; O’Callaghan, M. Effects of Electrical Water Bath Stunning Current Frequencies on the Spontaneous Electroencephalogram and Somatosensory Evoked Potentials in Hens. Br. Poult. Sci. 2004, 45, 230–236. [Google Scholar] [CrossRef]
- Raj, A.; O’Callaghan, M.; Hughes, S. The Effects of Amount and Frequency of Pulsed Direct Current Used in Water Bath Stunning and of Slaughter Methods on Spontaneous Electroencephalograms in Broilers. Anim. Welf. 2006, 15, 19–24. [Google Scholar] [CrossRef]
- R Core Team. R: A Language and Environment for Statistical Computing; R Foundation for Statistical Computing: Vienna, Austria; Available online: https://www.r-project.org/ (accessed on 27 December 2023).
- Pinheiro, J.; Bates, D.; DebRoy, S.; Sarkar, D. R Core Team Nlme: Linear and Nonlinear Mixed Effects Models. R Package Version 3.1-164. Available online: https://cran.r-project.org/web/packages/nlme/index.html (accessed on 2 January 2024).
- Hernandez, E.; James, F.; Torrey, S.; Widowski, T.; Schwean-Lardner, K.; Monteith, G.; Turner, P.V. Electroencephalographic, Physiologic and Behavioural Responses during Cervical Dislocation Euthanasia in Turkeys. BMC Vet. Res. 2019, 15, 132. [Google Scholar] [CrossRef] [PubMed]
- Martin-Jurado, O.; Vogt, R.; Kutter, A.P.N.; Bettschart-Wolfensberger, R.; Hatt, J.-M. Effect of Inhalation of Isoflurane at End-Tidal Concentrations Greater than, Equal to, and Less than the Minimum Anesthetic Concentration on Bispectral Index in Chickens. Am. J. Vet. Res. 2008, 69, 1254–1261. [Google Scholar] [CrossRef]
- Lambooij, E.; Kloosterboer, R.J.; Gerritzen, M.A.; van de Vis, J.W. Assessment of Electrical Stunning in Fresh Water of African Catfish (Clarias gariepinus) and Chilling in Ice Water for Loss of Consciousness and Sensibility. Aquaculture 2006, 254, 388–395. [Google Scholar] [CrossRef]
- Martín-Cancho, M.F.; Lima, J.R.; Luis, L.; Crisóstomo, V.; López, M.A.; Ezquerra, L.J.; Carrasco-Jiménez, M.S.; Usón-Gargallo, J. Bispectral Index, Spectral Edge Frequency 95% and Median Frequency Recorded at Varying Desflurane Concentrations in Pigs. Res. Vet. Sci. 2006, 81, 373–381. [Google Scholar] [CrossRef] [PubMed]
- Martín-Cancho, M.F.; Lima, J.R.; Luis, L.; Crisóstomo, V.; Ezquerra, L.J.; Carrasco, M.S.; Usós-Gargallo, J. Bispectral Index, Spectral Edge Frequency 95%, and Median Frequency Recorded for Various Concentrations of Isoflurane and Sevoflurane in Pigs. Am. J. Vet. Res. 2003, 64, 866–873. [Google Scholar] [CrossRef]
- McKeegan, D.E.F.; Reimert, H.G.M.; Hindle, V.A.; Boulcott, P.; Sparrey, J.M.; Wathes, C.M.; Demmers, T.G.M.; Gerritzen, M.A. Physiological and Behavioral Responses of Poultry Exposed to Gas-Filled High Expansion Foam. Poult. Sci. 2013, 92, 1145–1154. [Google Scholar] [CrossRef]
- Raj, A.B.M.; Wotton, S.B.; McKinstry, J.L.; Hillebrand, S.J.W.; Pieterse, C. Changes in the Somatosensory Evoked Potentials and Spontaneous Electroencephalogram of Broiler Chickens during Exposure to Gas Mixtures. Br. Poult. Sci. 1998, 39, 686–695. [Google Scholar] [CrossRef] [PubMed]
- Velarde, A.; Ruiz-de-la-Torre, J.L.; Roselló, C.; Fàbrega, E.; Diestre, A.; Manteca, X. Assessment of Return to Consciousness After Electrical Stunning in Lambs. Anim. Welf. 2002, 11, 333–341. [Google Scholar] [CrossRef]
- Webster, A.B.; Fletcher, D.L. Reactions of Laying Hens and Broilers to Different Gases Used for Stunning Poultry. Poult. Sci. 2001, 80, 1371–1377. [Google Scholar] [CrossRef]
- Lambooij, E.; Gerritzen, M.A.; Engel, B.; Hillebrand, S.J.W.; Lankhaar, J.; Pieterse, C. Behavioural Responses during Exposure of Broiler Chickens to Different Gas Mixtures. Appl. Anim. Behav. Sci. 1999, 62, 255–265. [Google Scholar] [CrossRef]
- Hughes, B.O. Headshaking in Fowls: The Effect of Environmental Stimuli. Appl. Anim. Ethol. 1983, 11, 45–53. [Google Scholar] [CrossRef]
- Gerritzen, M.; Lambooij, B.; Reimert, H.; Stegeman, A.; Spruijt, B. A Note on Behaviour of Poultry Exposed to Increasing Carbon Dioxide Concentrations. Appl. Anim. Behav. Sci. 2007, 108, 179–185. [Google Scholar] [CrossRef]


| Item | Day 1 | Day 2 | Day 3 | Day 4 | Day 5 | |||
|---|---|---|---|---|---|---|---|---|
| Session | 1500 to 1900 h | 800 to 1200 h | 1500 to 1900 h | 800 to 1200 h | 1500 to 1900 h | 800 to 1200 h | 1500 to 1900 h | 800 to 1200 h |
| Treatment | AIR | 40C90C | 40C60N | 40C60N | 20C80N | 20C80N | 40C90C | 40C90C |
| cycles, n | 25 | 10 | 10 | 11 | 9 | 9 | 8 | 8 |
| Total birds, n | 100 | 30 | 35 | 44 | 36 | 36 | 32 | 30 |
| Birds/cycle | 4 | 3 | 3–4 * | 4 | 4 | 4 | 4 | 3–4 ** |
| Brain activity assessment, n | 0 | 0 | 5 | 11 | 9 | 9 | 8 | 8 |
| Behavioural assessment, n | 100 | 30 | 30 | 33 | 27 | 27 | 24 | 22 |
| Cycles, n | 25 | 10 | 10 | 11 | 9 | 9 | 8 | 8 |
| Behaviour | Description | Adapted from |
|---|---|---|
| Loss of posture | Cessation of standing, with the head resting against either the floor or wall of the gas stunning system. | [10,26] |
| Motionlessness | Limp carcass, with the bird being completely still including the cessation of visible breathing movements. | [27] |
| Sitting | Legs underneath the body and wings relaxed against body. | [28] |
| Standing | On their feet with the body fully or partly lifted off of the ground. | [24] |
| Walking | Moving forward at a regular pace. | [29] |
| Ataxia | Uncoordinated walking with exaggerated lateral movement or fluttering when standing to maintain posture. | [10] |
| Deep inhalation | Wide open-mouth breathing with neck extension. | [10] |
| Gasping | Opening and closing mouth without neck extension and with reduced frequency compared to physiological breathing. | [10] |
| Head shaking | Rapid side-to-side movement of the head, which occurs whilst the bird is standing, walking, or sitting. | [10] |
| Jumping | Any vertical movement from a plantar stance, resulting in both feet leaving contact with the floor. | [10] |
| Leg paddling | Leg movements in the air or towards the ground depending on the body position of the bird. It can also be determined by an alternating upwards and downwards movement of the body if bird is lying sternal. | [28] |
| Wing flapping | Bouts of fast, short flapping, rapid movement of the wings. | [10,30] |
| High-pitch vocalisations | Single or repeated short and loud shrieking (screaming). | [4] |
| Treatments | |||||
|---|---|---|---|---|---|
| Analysis | Outcome | 40C90C | 40C60N | 20C80N | p-Value |
| Spectral | Loss of consciousness, s * | NA | 25.7 ± 7.0 | 20.7 ± 6.6 | 0.144 |
| Spectral | Death, s ** | NA | 65.8 ± 14.1 b | 122 ± 53.2 a | 0.048 |
| Visual | Death, s *** | NA | 69.8 ± 11.9 | 66.3 ± 8.1 | 0.456 |
| Treatment | |||||
|---|---|---|---|---|---|
| Behaviour | 40C90C | 40C60N | 20C80N | SE | p-Value |
| Loss of posture | 59.2 (26.0–156.5] a | 19.8 (14.0–30.8] b | 22.3 (15.8–37.0] b | 2.7 | <0.001 |
| Motionless | 168.8 (89.0–212.7] a | 66.1 (43.0–108.0] b | 70.4 (45.2–88.5] b | 3.5 | <0.001 |
| Treatment | ||||||
|---|---|---|---|---|---|---|
| Item | Behaviour | 40C90C | 40C60N | 20C80N | SE | p-Value |
| Proportion, (%) | Head shaking | 76/76 (100%) | 63/63 (100%) | 54/54 (100%) | - | 1.000 |
| Deep inhalation | 76/76 (100%) | 63/63 (100%) | 54/54 (100%) | - | 1.000 | |
| HPV | 42/76 (55.3%) | 43/63 (68.3%) | 53/54 (98.1%) | - | 0.101 | |
| Gasping | 20/76 (26.3%) | 0/63 (0.0%) | 0/54 (0.0%) | - | - | |
| Sitting | 75/76 (98.7%) | 58/63 (92.1%) | 50/54 (92.6%) | - | 0.951 | |
| Standing | 71/76 (93.4%) | 51/63 (81.0%) | 48/54 (88.9%) | - | 0.848 | |
| Walking | 45/76 (59.2%) | 25/63 (39.7%) | 28/54 (51.9%) | - | 0.413 | |
| Ataxia | 63/76 (82.9%) | 55/63 (87.3%) | 48/54 (88.8%) | - | 0.297 | |
| Wing flapping | 20/76 (26.3%) c | 35/63 (55.5%) b | 43/54 (79.6%) a | - | 0.001 | |
| Events/bird, n | Head shaking | 5.4 (1–12) | 4.8 (1–9) | 5.1 (1–9) | 0.3 | 0.069 |
| Deep inhalation | 9.4 (2–18) a | 3.9 (1–9) b | 4.8 (0–9) b | 0.4 | <0.001 | |
| HPV | 2.9 (0–12) a | 2.0 (0–6) b | 3.3 (0–11) a | 0.4 | 0.001 | |
| Gasping | 0.7 (0–10) | 0 (0–0) | 0 (0–0) | 0.2 | - | |
| Sitting | 2.1 (1–6) a | 1.3 (0–3) b | 1.6 (0–4) ab | 0.2 | <0.001 | |
| Standing | 2.0 (0–7) a | 1.1 (0–3) b | 1.3 (0–4) b | 0.2 | 0.004 | |
| Walking | 1.2 (0–7) a | 0.6 (0–3) b | 0.7 (0–3) b | 0.2 | <0.001 | |
| Wing flapping | 0.4 (0–4) c | 0.6 (0–2) b | 1.0 (0–3) a | 0.1 | <0.001 | |
| Total duration, s | Sitting | 35.9 (3.4–135.1) a | 7.4 (0–19.5) b | 6.9 (0–22.8) b | 2.7 | <0.001 |
| Standing | 13.4 (0.0–37.9) a | 7.5 (0.0–22.2) b | 8.5 (0–18.2) b | 1.1 | <0.001 | |
| Walking | 2.6 (0.0–11.8) a | 1.5 (0.0–10.5) b | 1.5 (0.0–9.3) b | 0.5 | 0.024 | |
| Ataxia | 4.6 (0.0–19.7) a | 2.7 (0.0–7.1) b | 3.6 (0.0–8.2) ab | 0.5 | <0.001 | |
| Wing flapping | 0.7 (0.0–6.8) c | 1.1 (0.0–6.2) b | 2.3 (0.0–6.5) a | 0.3 | 0.021 | |
| Treatment | ||||||
|---|---|---|---|---|---|---|
| Item | Behaviour | 40C90C | 40C60N | 20C80N | SE | p-Value |
| Proportion, n (%) | Gasping | 43/76 (56.6%) a | 14/63 (22.2%) b | 14/54 (25.9%) b | - | 0.009 |
| Jumping | 60/76 (7.9%) b | 7/63 (10.5%) b | 14/54 (25.0%) a | - | 0.003 | |
| Leg paddling | 75/76 (98.7%) | 63/63 (100%) | 54/54 (100%) | - | 0.998 | |
| Wing flapping | 53/76 (69.7%) | 61/63 (96.8%) | 53/54 (98.1%) | - | 0.320 | |
| HPV | 65/76 (85.5%) | 53/63 (84.1%) | 53/54 (98.1%) | - | 0.818 | |
| Events/bird, n | Gasping | 2.5 (0–16) a | 0.4 (1–3) b | 0.3 (0–3) b | 0.4 | <0.001 |
| Jumping | 0.1 (0–2) b | 0.2 (0–3) ab | 0.4 (0–3) a | 0.1 | <0.001 | |
| Leg paddling | 3.9 (0–10) b | 4.3 (2–8) ab | 4.6 (0–9) a | 0.3 | 0.041 | |
| Wing flapping | 1.5 (0–0) c | 2.4 (0–7) b | 3.1 (0–7) a | 0.3 | <0.001 | |
| HPV | 1.8 (0–10) | 1.5 (0–7) | 1.8 (0–4) | 0.3 | 0.297 | |
| Total duration, s | Leg paddling | 14.3 (1.5–36.5) b | 18.2 (4.0–39.3) a | 19.0 (2.0–36.9) a | 1.3 | <0.001 |
| Wing flapping | 0.7 (0–6.8) c | 1.1 (0–6.2) b | 2.3 (0–6.5) a | 0.3 | <0.001 | |
Disclaimer/Publisher’s Note: The statements, opinions and data contained in all publications are solely those of the individual author(s) and contributor(s) and not of MDPI and/or the editor(s). MDPI and/or the editor(s) disclaim responsibility for any injury to people or property resulting from any ideas, methods, instructions or products referred to in the content. |
© 2024 by the authors. Licensee MDPI, Basel, Switzerland. This article is an open access article distributed under the terms and conditions of the Creative Commons Attribution (CC BY) license (https://creativecommons.org/licenses/by/4.0/).
Share and Cite
Rucinque, D.S.; Velarde, A.; Xercavins, A.; Varvaró-Porter, A.; Gibson, T.J.; Michel, V.; Contreras-Jodar, A. Alternatives to Carbon Dioxide in Two Phases for the Improvement of Broiler Chickens’ Welfare during Stunning. Animals 2024, 14, 486. https://doi.org/10.3390/ani14030486
Rucinque DS, Velarde A, Xercavins A, Varvaró-Porter A, Gibson TJ, Michel V, Contreras-Jodar A. Alternatives to Carbon Dioxide in Two Phases for the Improvement of Broiler Chickens’ Welfare during Stunning. Animals. 2024; 14(3):486. https://doi.org/10.3390/ani14030486
Chicago/Turabian StyleRucinque, Daniel Santiago, Antonio Velarde, Aida Xercavins, Aranzazu Varvaró-Porter, Troy John Gibson, Virginie Michel, and Alexandra Contreras-Jodar. 2024. "Alternatives to Carbon Dioxide in Two Phases for the Improvement of Broiler Chickens’ Welfare during Stunning" Animals 14, no. 3: 486. https://doi.org/10.3390/ani14030486