Article

Identification of Signatures of Positive Selection That Have Shaped the Genomic Landscape of South African Pig Populations

by
Nompilo L. Hlongwane
1,2,*,
Edgar F. Dzomba
2,
Khanyisile Hadebe
1,
Magriet A. van der Nest
1,3,
Rian Pierneef
1,4 and
Farai C. Muchadeyi
1
1
Agricultural Research Council, Biotechnology Platform, Private Bag X5, Onderstepoort 0110, South Africa
2
Discipline of Genetics, School of Life Sciences, University of KwaZulu-Natal, Private Bag X01, Scottsville 3209, South Africa
3
Hans Merensky Chair in Avocado Research, Forestry and Agricultural Biotechnology Institute (FABI), University of Pretoria, Pretoria 0002, South Africa
4
Department of Biochemistry, Genetics and Microbiology, University of Pretoria, Pretoria 0002, South Africa
*
Author to whom correspondence should be addressed.
Animals 2024, 14(2), 236; https://doi.org/10.3390/ani14020236
Submission received: 13 November 2023 / Revised: 17 December 2023 / Accepted: 10 January 2024 / Published: 12 January 2024
(This article belongs to the Section Animal Genetics and Genomics)

Abstract

:

Simple Summary

Pigs are important in agriculture as they produce animal-based protein for human consumption. The analysis of selection signatures has implications for the maintenance and utilization of genetic diversity and can reveal genes associated with phenotypic traits, either as a result of natural or of artificial selection. Pig populations are poorly characterised in South Africa. Hence, studies aimed at evaluating genetic distinctiveness and pig breed diversity will contribute to developing a rational plan for population conservation programs among other applications.

Abstract

South Africa boasts a diverse range of pig populations, encompassing intensively raised commercial breeds, as well as indigenous and village pigs reared under low-input production systems. The aim of this study was to investigate how natural and artificial selection have shaped the genomic landscape of South African pig populations sampled from different genetic backgrounds and production systems. For this purpose, the integrated haplotype score (iHS), as well as cross population extended haplotype homozygosity (XP-EHH) and Lewontin and Krakauer’s extension of the Fst statistic based on haplotype information (HapFLK) were utilised. Our results revealed several population-specific signatures of selection associated with the different production systems. The importance of natural selection in village populations was highlighted, as the majority of genomic regions under selection were identified in these populations. Regions under natural and artificial selection causing the distinct genetic footprints of these populations also allow for the identification of genes and pathways that may influence production and adaptation. In the context of intensively raised commercial pig breeds (Large White, Kolbroek, and Windsnyer), the identified regions included quantitative loci (QTLs) associated with economically important traits. For example, meat and carcass QTLs were prevalent in all the populations, showing the potential of village and indigenous populations’ ability to be managed and improved for such traits. Results of this study therefore increase our understanding of the intricate interplay between selection pressures, genomic adaptations, and desirable traits within South African pig populations.

1. Introduction

Pigs are one of the most important livestock species worldwide. In January 2020, the world population of pigs was estimated to be 677.6 million [1]. They are key for livelihoods, food security, and economic growth, especially in developing countries where they survive under harsh environments and provide for resource-limited households [2]. Besides providing proteins for humans, pigs are also used as model animals for research on human diseases [2].
Wild hog species (also referred to as wild pigs) include the warthog (Phacochoreus Africanus), pig deer (Babyrousa Babyrussa), and the pygmy hog (Porcula Salvania), with only wild boar (Sus scrofa) having been domesticated [3,4]. Changes in the phenotypic characteristics between domestic and wild pigs are highly noticeable and were driven by natural and artificial selection [5]. Independent domestication events from local wild boar in Europe and Asia gave rise to European and East Asian pigs [6,7]. As a result of strong artificial selection, there is considerable genetic distance between European and Asian domestic pigs [3,6,7]. While commercial lines of European pigs are characterised by an extended body length and lean growth, East Asian domestic pigs have good fat deposition and high reproductive performance [8,9,10].
In the absence of a reproductive barrier between East Asian and European domestic pigs, hybridisation between East Asian and European and later American pig breeds has been successfully used to increase pig production [11,12,13]. Previous studies clearly demonstrated a hybrid origin of the European Large White breed with Asian pigs [14]. The hybridisation of domesticated pigs with wild boars on European farms has also been used to increase reproduction and genetic diversity in inbred commercial pig lines [15]. Village and smallholder pigs that are farmed predominantly under free-range production systems allow for gene flow and introgression, since hybridisation occurs with wild pigs (e.g., warthogs, wild boars and bush pigs) [16,17]. Although hybridisation between domesticated and wild pigs can increase production, these events may also have a negative impact on pig production [18]. For example, it has been suggested that the outbreak of classical swine fever (CSF) is related to wild and domestic pigs mixing in free-range production systems [19,20].
There is sparse and unreliable information with regards to the history of pig populations in South Africa and other regions of Africa [21,22,23]. Indigenous breeds most likely originated from domestic pigs that spread from sub-Saharan Africa to South Africa via the Nile Corridor [22]. Commercial pig breeds from Europe and America were also introduced in South Africa for commercial farming in the 1600s by European settlers [21,22,23]. While the commercial pig breeds are known for their high performance (e.g., litter size, high growth rate, and meat and carcass quality) [24,25,26], indigenous breeds are well adapted to harsh South African environmental conditions. For example, the indigenous Windsnyer has longer black hair and a thinner epidermis for increased heat tolerance that will shield it against extreme climatic conditions [27,28]. The positive characteristics of indigenous and local populations (e.g., heat tolerance and disease resistance) are valuable and need to be characterised and conserved as they are also important to the livelihood of subsistence and small-scale farmers.
In 2013, it was estimated that South Africa had 38,500 commercial farms and 2 million smallholder farmers [29]. While commercial pig farmers practise controlled breeding and intense artificial selection for key production traits, small-scale and village farming landscapes are characterised by poorly organised and indiscriminate crossbreeding [30]. Commercial farmers mainly use European pig breeds, while pig farmers in rural areas mainly use indigenous breeds (e.g., Kolbroek and Windsnyer). However, rural farmers are increasingly shifting away from indigenous breeds towards the use of commercial exotic breeds [18,26]. Crossbreeding between exotic and indigenous breeds have been used to improve performance and production, as well as to increase tolerance and/or resistance to disease and parasites and animals that are hardy and adapted to survive under harsh local conditions [27,31,32,33].
Adaptation and domestication processes, as well as breed development, can lead to the emergence of signatures of selection in the genomes of pig populations [34]. Signatures of selection have been identified in pig populations associated with important traits, such as adaptation to high altitudes [35], muscle growth [36], and body size [10]. Genomic sequences of domestic and wild pigs have been observed to be predominantly similar, except in regions under strong selection pressure [10]. Various authors have reported on selection in domestic pigs for disease resistance, tolerance, and productivity [37,38,39]. Information on selection signatures is valuable and can be used in management strategies to improve production and adaptability. A large-scale analysis of the genetic diversity and structure of South African pig populations relative to global populations (e.g., pigs from South America, Europe, United States, and China) [40] points towards a population that has been shaped by complex evolutionary forces including domestication and continuous interactions between domestic and wild populations. This includes natural and artificial selection under the different production systems as a result of the need to adapt and survive the prevailing climatic conditions, low-input production systems, and diseases.
Many statistical methods are available to identify selection signatures. This includes the integrated haplotype score (iHS) that allows for the detection and characterisation of genomic regions that have experienced selection within a population [41]. The iHS identifies regions where a selected allele has risen in frequency quickly due to positive selection, resulting in longer haplotypes around the selected variant. Although iHS methods apply statistical corrections to control for confounding factors such as population structure, demographic history, or genetic drift, it is still sensitive to population structure, potentially leading to false positives. The cross-population extended haplotype homozygosity (XP-EHH) method takes into account differences between two populations [42]. Both tests have been shown to have high power in detecting selection signatures even in small sample sizes [43,44]. Moreover, the XP-EHH statistic identifies population-specific genetic signatures, by identifying regions where specific alleles or haplotypes have undergone recent positive selection, leading to their rapid increase in frequency in one population but not in another [45]. This comparison helps in differentiating between regions affected by local adaptation and those influenced by hitchhiking or a demographic history shared by multiple populations. The third approach, hapFLK, involves Lewontin and Krakauer’s extension of the Fst statistic based on haplotype information [43,46]. This test measures differences in haplotype frequencies between populations, while accounting for their hierarchical structure, enabling the capturing of population-specific genetic signatures, even in scenarios with limited sample sizes [44,47]. As a result, the hapFLK method is a powerful tool for identifying signatures of selection, even in the presence of bottlenecks and migration, while limiting the effects of hitchhiking.
The aim of this research was to identify and characterise genomic regions that display signatures of natural and artificial selection in South African pig populations. For this purpose, commercial, village, indigenous, wild and Vietnamese potbelly pig populations that were previously genotyped were included [40]. To improve the statistical power for detecting the selection signatures, we used the iHS, XP-EHH, and hapFLK approaches. Specifically, the iHS was used to identify and characterise signatures of selection in each of the populations, while XP-EHH was used to identify and characterise selection signatures between different pairs of populations. The hapFLK statistical method was used to identify and characterise selection signatures between the multiple populations (i.e., including all the pig populations).

2. Materials and Methods

2.1. Animal Samples, Genotyping, and Quality Control

In total, 234 animals that were previously genotyped were used in this study [40]. This included 60 pigs from commercial farms represented by the Large White (LWT), South African Landrace (SAL) and Duroc (DUR) breeds, 40 indigenous pigs represented by Kolbroek (KOL) and Windsnyer (WIN) breeds, as well as 91 village and non-descript pig populations. The latter were obtained from villages in the Eastern Cape (Alfred Nzo, ALN and O.R. Tambo, ORT) and the Limpopo (Capricorn, CAP and Mopani, MOP) districts. In addition, 5 Vietnamese Potbelly pigs (VIT) from the Johannesburg Zoo and 38 wild pigs represented by the warthog (WAT), wild boar (WBO) and bush pig (BSP) were collected from various game reserves.
The animals were genotyped using PorcineSNP60 v2 BeadChip (Illumina, San Diego, CA, USA) containing 62,163 SNPs with an average gap of 43.4 kb [40]. Markers with a call rate lower than 85% and not physically mapped to the S. scrofa 11.2 genome assembly were discarded using Golden Helix SNP Variation Suite (SVS) version 8.8.1. Markers with a minor allele frequency (MAF) lower than 2%, and those that deviated from the Hardy–Weinberg equilibrium (p-value < 0.0001) were also excluded. BEAGLE (version 5.1) was used to phase the autosomal genome using 30 iterations of the phasing algorithm on a 5 Mb chromosomal region and sample haplotype pairs for each individual per iteration for all the data sets used.
All of the pig populations (Table 1) were included in the analyses to detect selection signatures, including the populations consisting of fewer than 10 individuals (BSP, WBO, and VIT). Based on the population diversity and structure results [40], the indigenous pig populations (WIN and KOL) were grouped together (IND, n = 40), the village populations sampled in Limpopo (MOP and CAP) were grouped together (LIM, n = 52), and those in the Eastern Cape (ORT and ALN) were grouped together (EC, n = 39) in the XP-EHH and hapFLK analysis.

2.2. Detection of Signatures Using iHS

The iHS was used to screen for non-overlapping regions within a population under positive selection. Plink 1.9 was used to exclude duplicate SNPs and to recode all genotypes using the --allele1234 script. Plink format map and ped files were converted into the fastPHASE format using the recode fastphase script. This generated a fastphase.inp file that was used in fastPHASE software 1.4.8. This software was then used to estimate missing genotypes and unobserved haplotypes from unphased data for each chromosome. This then created an input file, the fastphase_hapguess_switch.out file, which was used to calculate the iHS. Once phasing was completed, the iHS was calculated on individual sites for possible signatures using the rehh software in the R environment. The absolute unstandardised iHS (uniHS) was identified as the log ratio iHHA ancestral to the derived iHHD allele for each SNP [41]. As the standardised iHS scores are roughly distributed normally with mean = 0 and standard deviation = 1, regions with an average iHS score of 3 (three standard deviations above the mean) or above with at least five SNPs 100 kb were considered candidate regions for selection. Manhattan plots were generated in the R package qqman 2.3.

2.3. Detection of Signatures Using XP-EHH

Selective sweeps between populations were detected using XP-EHH, which makes it possible to find selected regions using the genetic distance between adjacent SNPs based on the of EHH model [42]. The cross-population EHH (XP-EHH) statistic is similar to Rsb (Robertsonian selection bias) and compares one population to the other using haplotypes [45]. Sabeti et al. [42] defined XP-EHH as standardised (unXP-EHH), identified as a mean (unXP-EHH) and standard deviation (unXP-EHH) for each given SNP. The argument was set to pop1, identified as p X P E H H r i g h t relative to pop2 as p X P E H H l e f t . to find regions associated with each population. XP-EHH used the same phased file as the iHS did and therefore the iHS was firstly calculated for each population using the rehh package [47] in R. Regions with an average XP-EHH score of 3 (three standard deviations above the mean) or above with at least five SNPs 100 kb were considered candidate regions for selection. Manhattan plots were generated in the R package qqman.

2.4. Detection of Signatures Using HapFLK

To reveal genetic differentiations in genomic regions subjected to selection from multiple populations, the HapFLK method was employed. This test accounts for the haplotype structure of the population whilst using polymorphic SNPs in ancestral populations. Reynolds distances were calculated using HapFLK 1.3.0 software (https://forge-dga.jouy.inra.fr/projects/hapflk) and then converted into a kinship matrix with the HapFLK package in RStudio. A FastPHASE cross-validation procedure was used to determine haplotype diversity [46]. In total, 20 clusters with 30 maximisation iterations on a per chromosome basis were used to calculate the HapFLK statistic. A standard normal distribution was calculated at each SNP using p-values. Selected regions were identified using a p-value ≤ 0.001 [48]. For this study, the indigenous breed Kolbroek was used as an outgroup.

2.5. Annotation and Function Analyses of Identified Genomic Regions

The candidate regions identified using the three different methods (i.e., the iHS, XP-EHH, and HapFLK) were annotated for genes, quantitative trait loci (QTLs) and functional pathways. For this purpose, BioMart on the Ensembl gene database website was used to annotate genes at particular genome coordinates for all selected regions (release 89). A candidate region search and identification was performed within 1 Mb to the left and right of statistically significant SNPs. The current pig genome S. scrofa 11.2 assembly was used to extract gene symbols. Web-based Panther was employed for functional and pathway enrichment analysis. A false discovery rate (FDR) < 0.10 was used to assess the significance of enriched pathways. The pig QTL (Release 46) database was used to align candidate genes to an available QTL.

3. Results

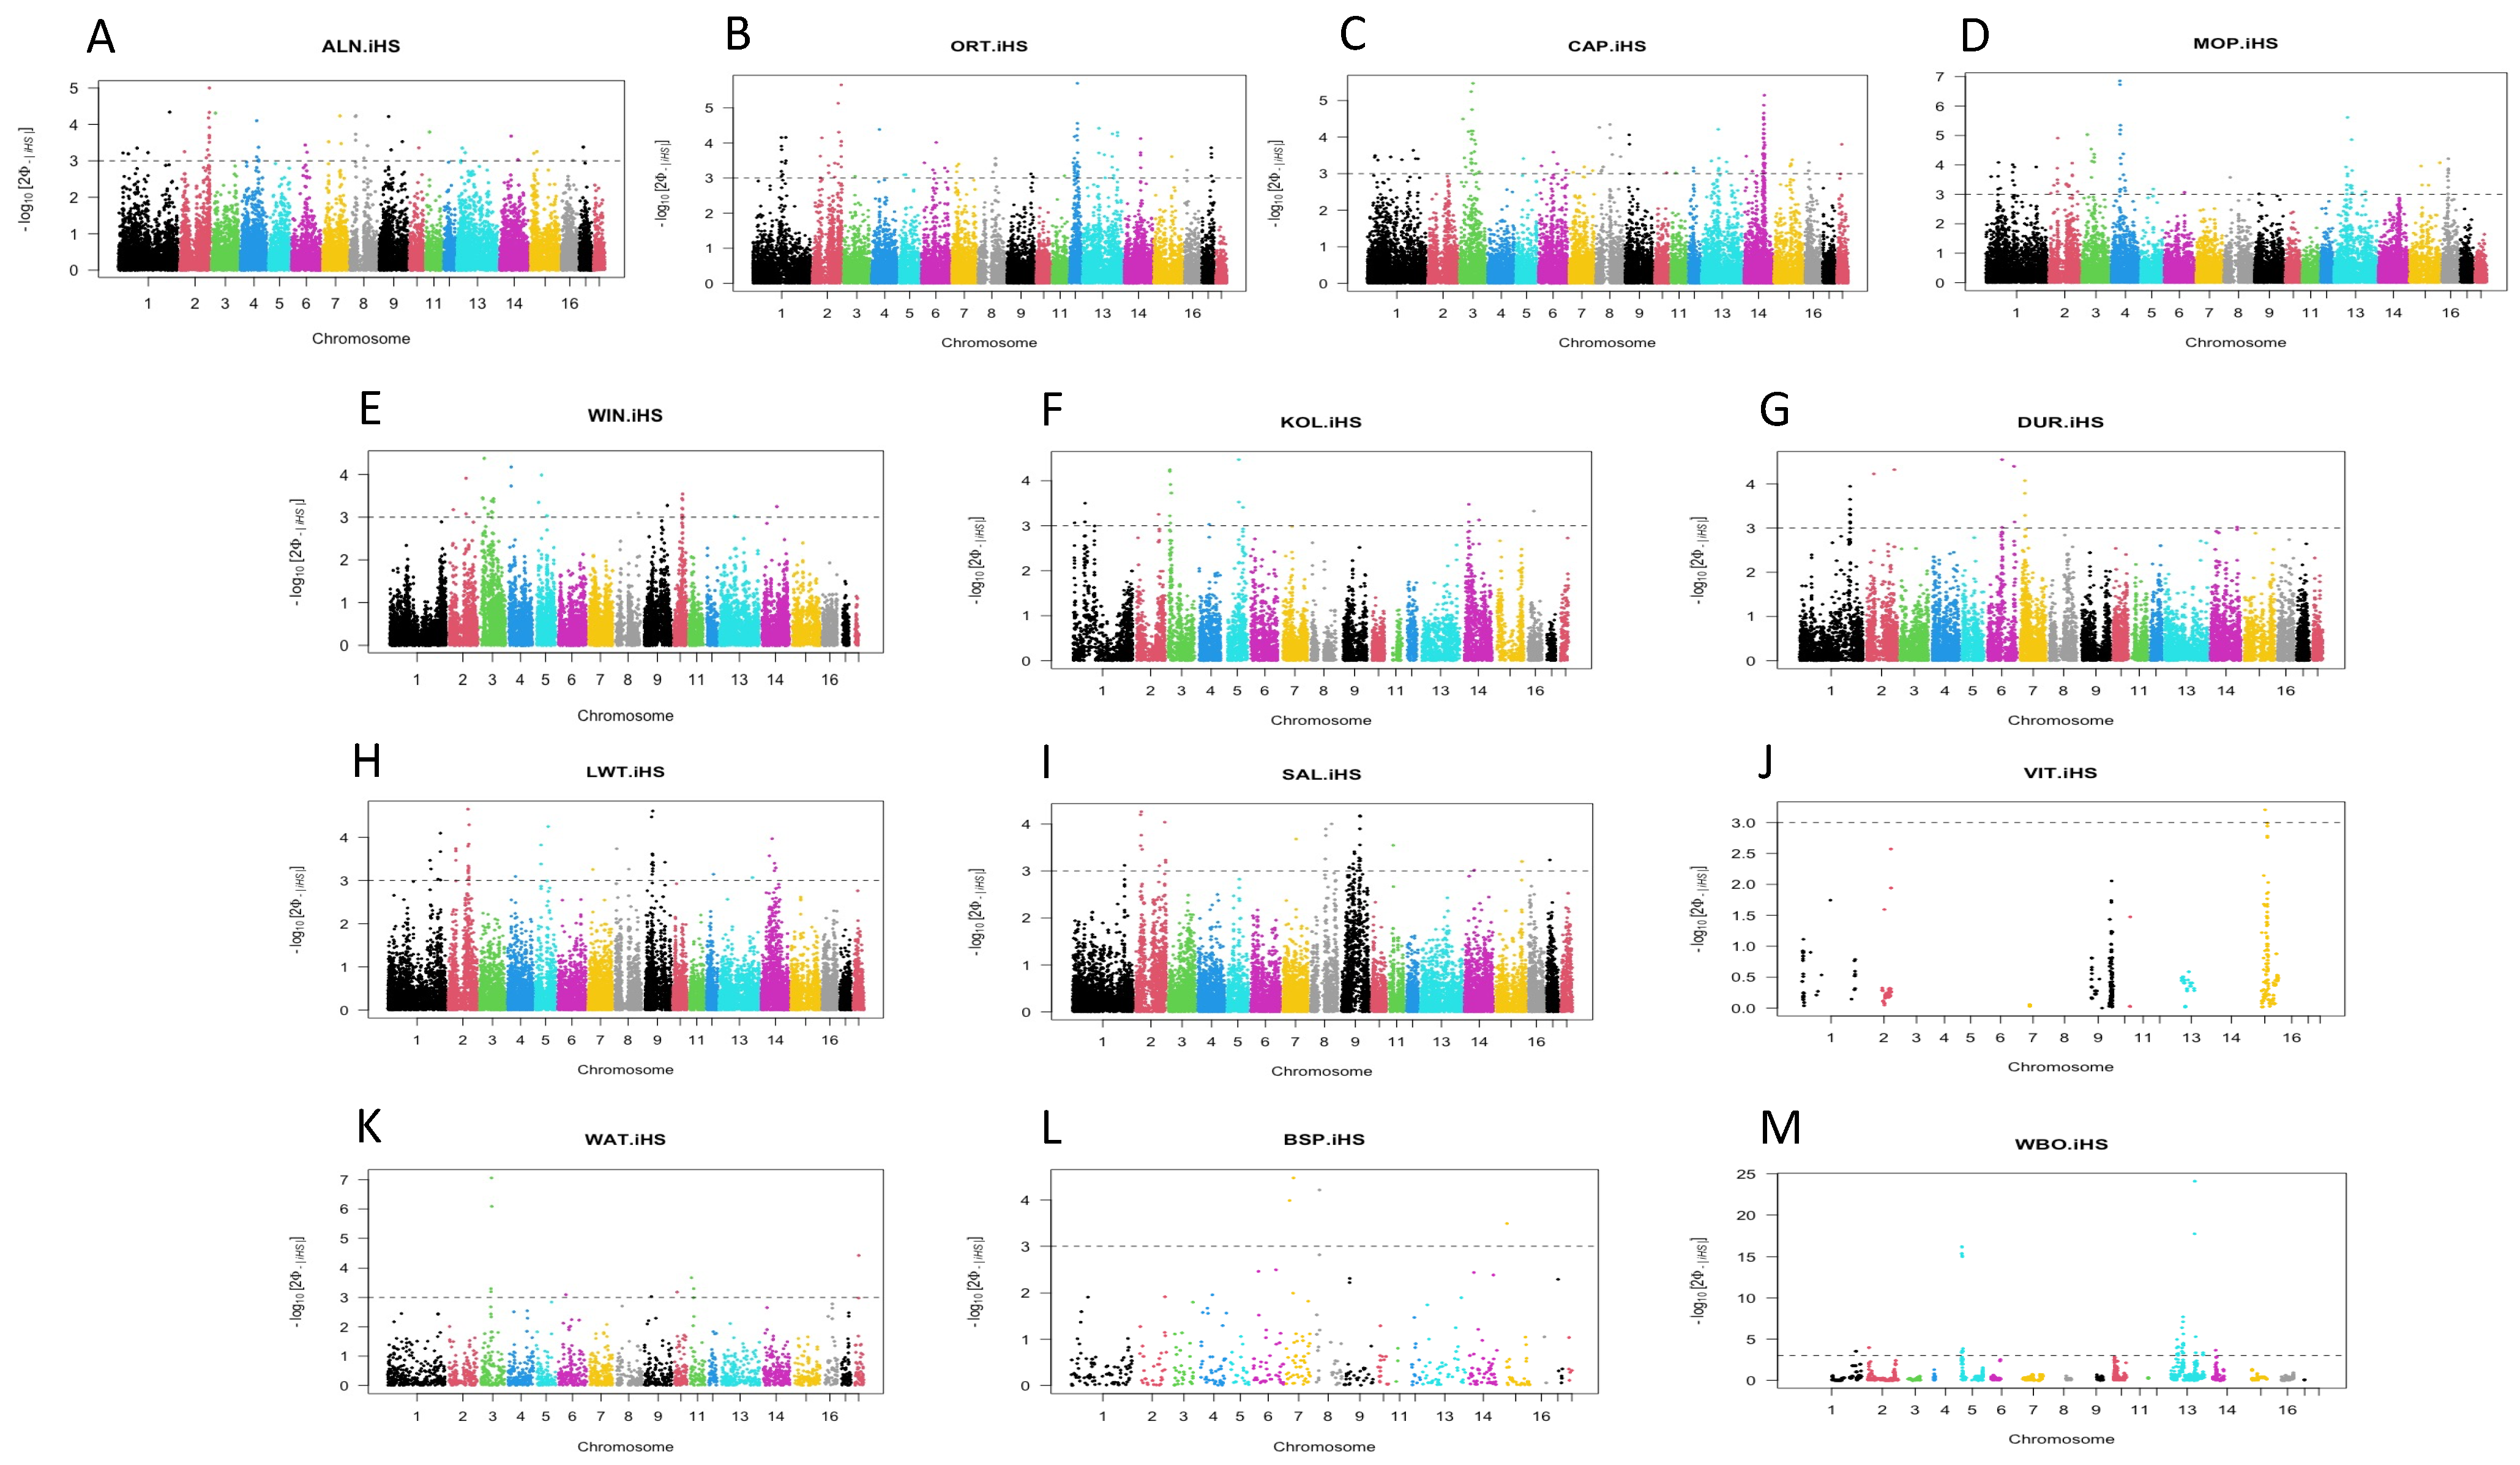
3.1. Detection of Signatures within a Population Using iHS

After quality check, 27,422 SNPs in total were retained for further analysis. The iHS method was used to detect a positive selection within a population, and identified potential genomic regions in all 13 populations included in this study (Figure 1; Table S1: Supplementary Material File S1).
The number of regions identified differed greatly between the different populations ranging from 87 for CAP (Figure 1C) to 4 for BSP (Figure 1L) (Table S2: Supplementary Material File S2). The low numbers of regions identified in the BSP and VIT populations (Figure 1J,L) likely reflect their small sample sizes. Most selection regions were identified among the village pigs, which included the CAP (87 regions), ALN (40 regions), ORT (71 regions), and MOP (68 regions) populations (Figure 1A–D). Fewer selection regions were identified within the indigenous pig population (KOL 17; WIN 22; Figure 1H,I). In contrast to the wild boar population (WBO, 32 regions) (Figure 1M), fewer regions were identified for the warthog (WAT, 10 regions) and bush pig (BSP, 4 regions) populations (Figure 1L,M). While a high number of regions were also identified for the LWT (34 regions) and SAL (31 regions) commercial pig populations, 12 regions were identified for the DUR population (Figure 1G–I).
The regions displaying significant selection were distributed on different chromosomes, harbouring genes associated with different traits (Table S2: Supplementary Material File S2). For example, the region on chromosome 13 (145.36 Mbp) displaying the strongest selection signal (iHS score of 24.09) in the WBO population overlapped with a GHRL gene related to weight gain, as well as several QTLs associated with the feed conversion ratio, age at slaughter, average backfat thickness, and average daily gain, amongst others. (Figure 1M; Table 2). Other regions identified using included QTLs associated with intramuscular fat content that included the regions on chromosome 1 (ORT and CAP), chromosome 2 (LWT), chromosome 4 (KOL), chromosome 5 (WBO), chromosome 8 (WIN), chromosome 12 (ORT), and chromosome 14 (CAP), as well as QTLs associated with the number of teats that included the regions on chromosome 7 (ALN, DUR), chromosome 8 (ORT), chromosome 16 (MOP), chromosome 14 (CAP), chromosome 2 (LWT, WBO), and chromosome 14 (LWT) (Table 2).

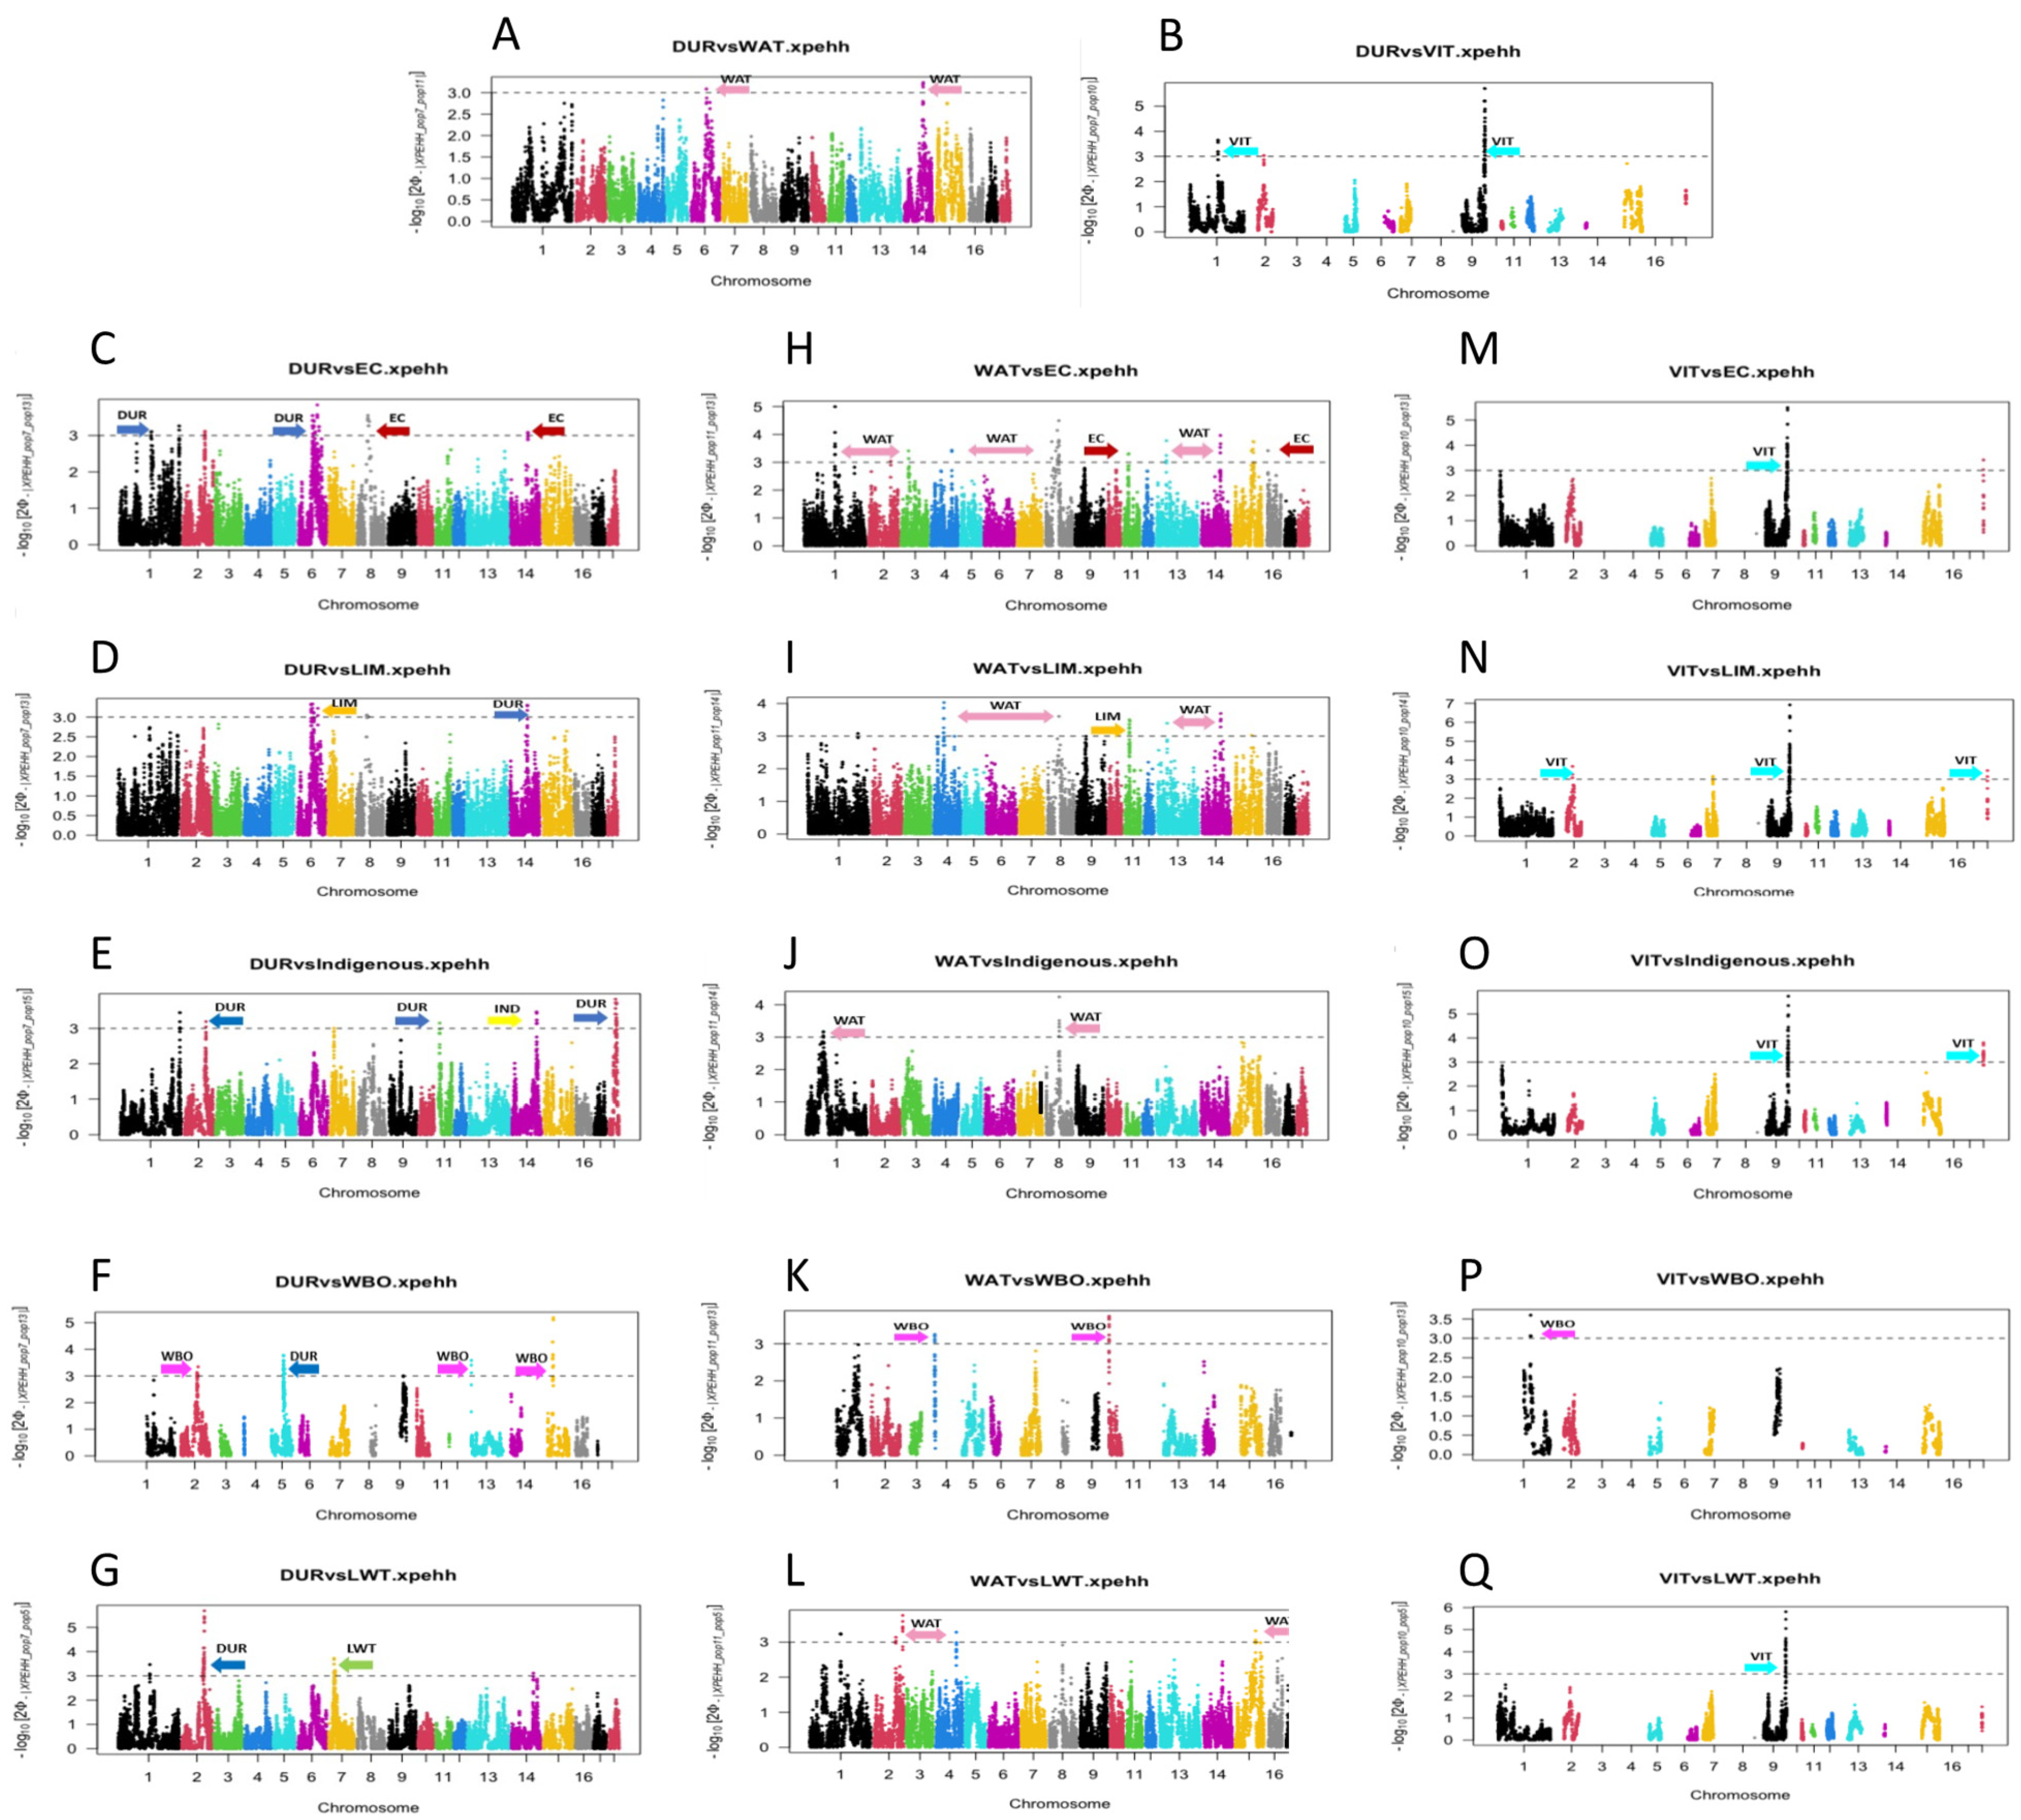
3.2. Detection of Selection of Signatures between Populations Using XP-EHH

Several regions that displayed significant evidence of selection were detected between pairs of populations using XP-EHH (Figure 2; Table S3: Supplementary Material File S3). The numbers of regions displaying significant evidence of selection differed greatly between the paired populations. A high number of regions were identified between the commercial population (DUR) paired with the village (EC, 38 regions and LIM, 19 regions), indigenous (IND, 13 regions), and commercial (LWT, 23 regions) populations. Although a high number of regions were identified between the warthog population (WAT) paired with the village (LIM, 34 regions), commercial (LWT, 14 regions), and indigenous (IND, 10 regions) populations, fewer regions were identified between the WAT paired with the wild boar (WBO, 5 regions) population. This was also true for Vietnamese potbelly pigs (VIMs), with a high number of regions identified between VIM paired with the village (LIM, 14 regions and EC, 10 regions) and indigenous (IND, 11 regions) populations, while only one region was identified between VIM and the commercial (LWT, 1 regions) populations and VIMs paired with the wild boar (WBO, 5 regions) population.
Several QTLs and genes occurred in the genomic regions identified using the XP-EHH method (Table 3, Table S4: Supplementary Material File S4). The strongest signal (XP-EHH score of 6.91) was observed for VIT_LIM on chromosome 9 (Figure 2N). Even though this region was not associated with known QTLs, several regions identified with the XP-EHH method were linked with QTLs associated with important traits. For example, the regions on chromosome 1 (166.17 Mbp) and chromosome 6 (80.64 Mbp) identified for the commercial population (DUR) paired with the village populations (EC and LIM) are linked with QTLs associated with reproduction, while the region on chromosome 2 (113.82 Mbp) identified in the commercial population (DUR) paired with the village population (EC) and commercial population (LWT) is linked with QTLs associated with meat and carcass quality traits. The region identified on chromosome 1 (193.82 Mbp) detected in the wild boar population (WBO) paired with the Vietnamese potbelly pig (VIT) and commercial population (DUR) is linked to QTLs associated with key reproduction traits such as litter size, maternal infanticide, plasma droplet rate, semen volume, sperm concentration, sperm motility, and total number born alive.

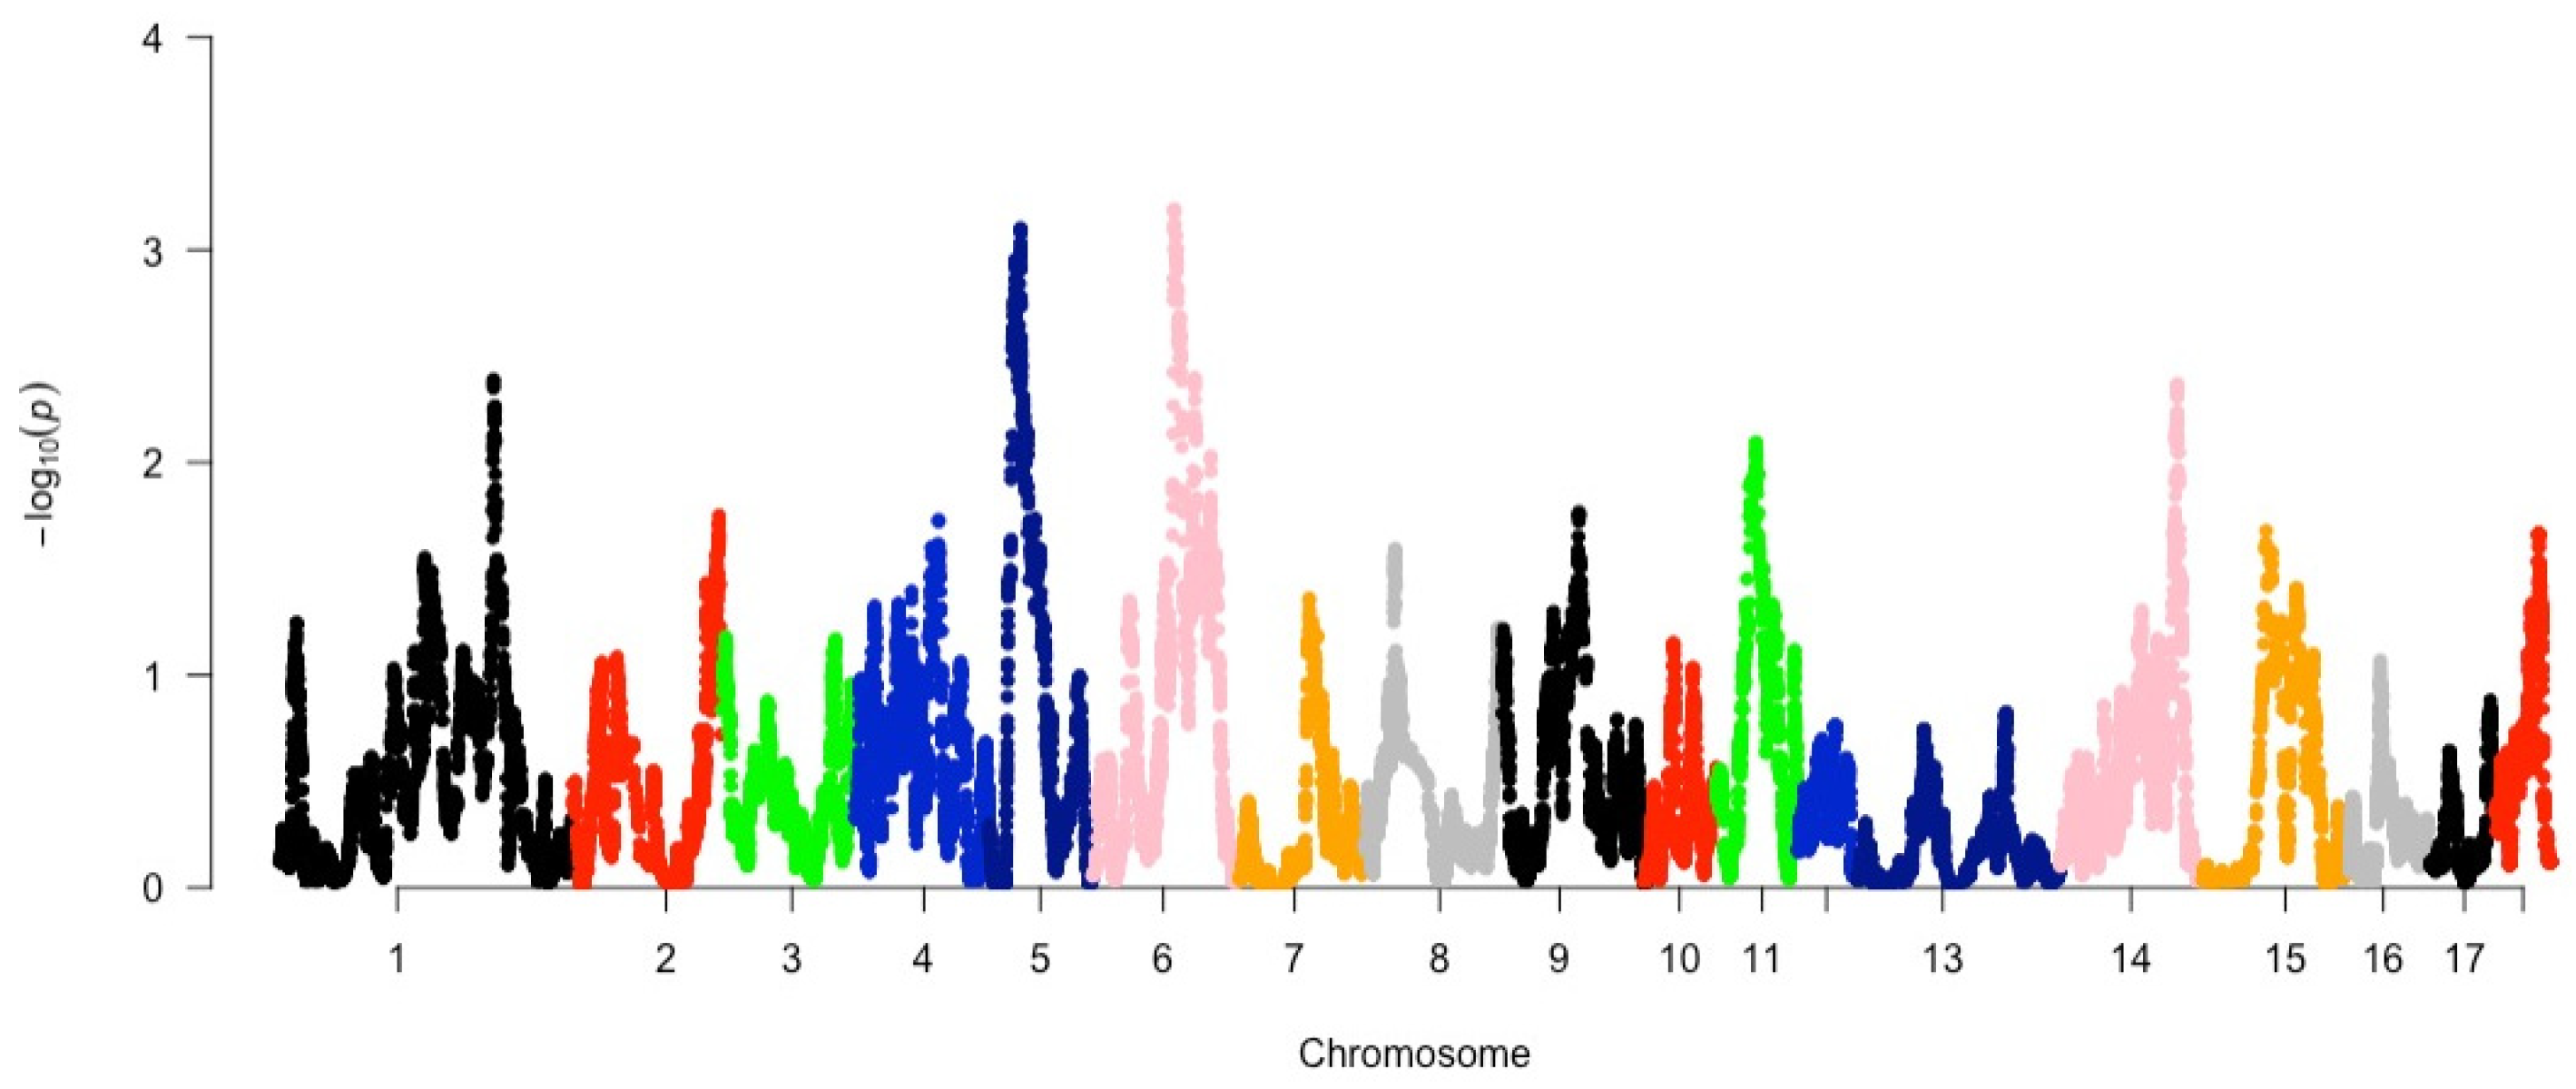
3.3. Detection of Selection of Signatures between Populations Using HapFLK

Across all populations, regions displaying significant (p-value ≤ 0.001) evidence of selection were identified on chromosomes 5 and 6 using KOL as an outgroup (Figure 3).
In total, 5924 segments displaying significant (p-value < 0.10) evidence of selection were associated with 1179 genes (Table S5: Supplementary Material File S5). The regions on chromosomes 5 and 6 were linked with QTLs associated with intramuscular fat content, litter size, number of teats, as well as age at slaughter, meat to fat ratio, and body weight (Table 4).

3.4. Genes Identified Using Different Signatures of Selection Methods

The iHS, XP-EHH, and HapFLK methods allowed the detection of the same genomic regions on chromosomes 5 and 6. The iHS method detected the region on chromosome 5 in the ORT, CAP, WIN, KOL, LWT, and MOP populations, while the region on chromosome 6 was detected in DUR, ALN, ORT, and CAP. The XP-EHH method detected the region on chromosome 5 between the DUR_WBO pairing, while the method detected the region on chromosome 6 between the DUR_EC, DUR_WAT, and DUR_LIM pairings.
The region on chromosome 5 detected in the DUR_WBO pairing encoded NECAP1 and KCNJ3 genes. The GO terms reported for DUR_WBO included the regulation of ion transmembrane transport, the clathrin vesicle coat, voltage-gated potassium channel activity, the plasma membrane, vesicle-mediated transport, ligand-gated ion channel activity, and potassium transmembrane transport (Table S6: Supplementary Material File S6). These regions also included genes linked to important signalling pathways, namely the G-protein signalling pathway, the GABA-B_receptor_II_signalling pathway, and the muscarinic acetylcholine receptor 2 and 4 signalling pathway (Table S7: Supplementary Material File S7).
The genes located in the region on chromosome 6 included EPHB2, EPB41L3, METTL4, EPHA8, LYPLA2, FUCA1, PNRC2, SRSF10, MYOM3, SLC16A12, PANK1, and PCGF5. It also included important GO terms linked to the cellular response to follicle-stimulating hormone stimuli, the fucose metabolic process, the regulation of cell growth, growth factor binding, carboxylic ester hydrolase activity, and palmitoyl-(protein) hydrolase activity (Table S6: Supplementary Material File S6). Important pathways were found to be related to the dopamine receptor-mediated signalling pathway and Coenzyme A biosynthesis (Table S7: Supplementary Material File S7).

4. Discussion

To date, this is the first study identifying signatures of selection in South African pig populations from different genetic backgrounds. We included animals from commercial farms and villages, as well as indigenous and wild roaming pigs. The adaptation footprints across these genomic landscapes were evaluated using within and cross-population selection statistics. Although these methods accounted for small population samples, their statistical power was diminished by the small sample sizes used for bush pig, wild boar and Vietnamese potbelly pig populations [49]. Nevertheless, a number of genomic regions containing significant evidence of population-specific selection signatures were detected in the case of of wild boar, which we explored further in this study.
The population genomic approach utilised in this study allowed for the identification of genomic regions under natural selection, such as the indigenous Kolbroek and Windsyner, as well as in the wild boar. Specifically, the region on chromosome 5 included a putative KCNJ3 gene, which may be associated with an udder structure in cattle that is typically important for production efficiencies as well as animal health and welfare [50]. This region also encoded genes involved in signalling pathways such as muscarinic acetylcholine receptors that are G protein-coupled receptors (GPCRs) playing a key role in regulating many fundamental functions (e.g., motor control, temperature control, control of inflammation, cell growth, and cell proliferation, as well as control of the airways, gastrointestinal and urinary tracts, cardiovascular system, the central nervous system, and eye) [51]. The region on chromosome 13 under natural selection in the wild boar population encoded a putative GHRL gene known to regulate growth and development in pigs [52,53]. The identification of these regions thus provides an opportunity to elucidate the genetic basis of the adaptive evolution of local wild and indigenous pig populations in the future including larger sample sizes.
Signatures of selection identified in the commercial pig populations included regions associated with traits such as meat and carcass quality. This is expected, as the Large White, Durocs and South African Landrace pigs are bred for meat production [5,10]. Because of this strong artificial selection and because the internal mechanism is the selection of genes, genes in these regions associated with meat and carcass quality included CORIN on chromosome 8, TMPRRSS4 on chromosome 9, SLC44A5 on chromosome 6, APBB2 on chromosome 8, TECTA on chromosome 9, LIPA and IDE on chromosome 14, and ITGA2 on chromosome 16. The DECR1 gene on chromosome 4 is associated with cholesterol levels amongst other meat quality and growth traits. Regions associated with meat and carcass quality were also identified among the indigenous breeds. For example, the indigenous Kolbroek and Windsnyer breeds included the JPH1 gene observed on chromosome 4, which has previously been linked to meat and carcass quality in pigs [54,55]. Furthermore, Hoffman et al. [56] observed that meat from Kolbroek pigs can be processed into bacon, ham, and chops. This shows that indigenous breeds can also be identified with traits despite their slow growth rate.
Among the genomic regions displaying signatures of selection, some were associated with fatness, an important economic trait in pig farming [57]. For example, ITGA11 on chromosome 1 is associated with an obesity index that determines fat deposition in pigs and other animals [40]. The genomic regions (chromosomes 5 and 6) identified with all three the statistics were linked with QTLs associated with intra-muscular fat content, meat to fat ratio, and body weight. Regions that are associated with excess fat deposition when fed improved diets [36,58] present an opportunity to genetically improve meat quality in these breeds. A study by Jung et al. [59] and Ren et al. [60] observed that consumers preferred lean pork with high intramuscular fat content. As a result, commercial breeds displayed lower fat levels compared to European and Chinese breeds [61,62]. While commercial breeds (e.g., Large White, Duroc, and Landrace) have low levels of fat tissue, European breeds (e.g., Iberian and Mangalica pigs) and Chinese breeds are predisposed to accumulate excess amounts of adipose tissue [62,63,64]. Hoffman et al. [65] reported consumers’ preference towards meat with a higher lean percentage. Wild boars have low intra-muscular fat and are categorised under game meat that has high protein and iron and that is considered healthier than ordinary pork or beef meat [66,67,68]. Since pig breeds vary when it comes to fat tissue deposition with heritability levels being around 0.5 [61,62], obesity indices and intra-muscular fat can be used as potential tools for selecting animals with desirable meat and carcass qualities. For example, SCPEP1 identified in this study regulates body fat content and correlates with intra-muscular fat deposition in pigs [69].
Genomic regions displaying signatures of selection were associated with reproduction traits such as litter size and total number born alive from a sow, semen volume, sperm concentration, sperm motility, etc. For example, PIK3R5 is one of the genes identified in the O.R. Tambo population that influences litter size at birth and the number of piglets born alive [70], which is important as pigs differ greatly in litter size. For example, the wild boar sows an average if 6.6 litters [71] per year versus an average of 14 to 15.3 litters per sow in Large White breeds [72,73], while indigenous breeds such as Kolbroek average at 810 piglets [74]. Nowadays, the pig industry in Europe has been yielding 18–20 litters per sow [75]. This high litter number has a negative implication on the physiological tolerance for both sows and litters. The good mothering ability and hardiness of sows ensure high survival rates for the litters. Commercial breeds have an advantage being raised in the intensive production system. Several genomic regions contain QTLs associated with the number of teats on chromosomes 1, 2, 5, 6, 14, 16, and 18. The number of teats is an important trait as it ensures that piglets have adequate access to milk from the sow. The number of teats can have effects on the weaning weight of a piglet and a smaller number of teats in a sow reduces piglets’ survival rate [76]. In commercial breeds such as Large White and Duroc, a sow can have as many as 19 teats [77]. Makhanya [78] reported the number of teats to be an average of 10 in indigenous Kolbroek pigs. Various studies have shown that the number of teats is an essential morphological and reproductive trait that has been under selection for many generations in the pig industry [77,79].
A high number of regions that display significant selection were detected in the South African village pig populations. This is similar to what was previously seen for cattle, where Van Hossou et al. [80] also reported a higher number of selection signatures in admixed West African cattle populations in Benin. The presence of more selection signatures in village pig populations compared to that in other populations can be attributed to several factors. One possible explanation is that genetic diversity may provide a broader pool of genetic variants for selection to act upon, resulting in a higher number of selection signatures. Several genes related to health and resistance to parasites were identified in the village populations, which is well in line with the sturdy nature of this breed. This included the APBB2 gene present in regions under selection in the Alfred Nzo, Mopani, and Capricorn populations, which was shown to regulate inflammatory responses during infection with porcine reproductive and respiratory syndrome virus, which is a major respiratory pathogen of pigs [71]. The LIPA gene under selection in the Capricorn population may be involved in the response to wounds and inflammations, as well as in the molecular genetic mechanisms affecting fecundity in sheep [72]. Village pigs are well adaptable to local harsh conditions, and this makes them important genetic resources that provide new diversity for the improvement of commercial lines.
Another explanation for the high number of regions is the admixture between village pigs and commercial pigs, which could allow for an improvement in economic traits such as reproduction, growth, and carcass traits among village pigs. Crossbreeding with commercial pigs has allowed for the introduction of genetic variants that are advantageous for these traits in not only village pigs but also indigenous pigs. For example, regions displaying selection signatures included genes for meat and carcass quality in pigs in the village (e.g., SCPEP1 and SAMD4A) and indigenous (e.g., JPH1) populations [54,55,69]. The admixed genomes that result from the interbreeding of previously isolated populations can carry genetic signatures that resemble signals of positive selection. Therefore, the possibility that some of the genomic selection signatures identified here stem from historical admixture (i.e., they represent the “ghosts” of introgression) and not recent adaptive events could not be discounted [81]. Although further research would be needed to distinguish these types of signatures in all of the populations examined, the genetic remnants of past genetic exchange in admixed genomes may represent a valuable source of variation for further selection and/or adaptation [81].

5. Conclusions

This study identified several regions displaying significant signatures of selection, which are the result of natural and artificial directional selection events that have contributed to the adaptation of breeds to different environments and production systems of these pig populations. These signatures of selection allowed for the identification of the genomic regions and evolutionary processes that have shaped the populations and affect important phenotypic traits. These included traits related to reproduction, production, health, and meat and carcass quality. Meat and carcass QTLs were prevalent in all the populations, showing the potential of village and indigenous populations’ ability to be managed and improved for such traits. Our findings also confirm that genetic resources from villages and wild pigs are important for research as they are not influenced by selection when compared to commercial breeds. Additionally, as BeadChip, used in this study, may not be dense enough to fully understand the signatures between domestic and wild pigs, further research based on larger population sizes is required.

Supplementary Materials

The following supporting information can be downloaded at https://www.mdpi.com/article/10.3390/ani14020236/s1: Table S1: Summaries of the number of potential regions detected in iHS; Table S2: List of selected regions and candidate genes detected in iHS method associated with each pig population; Table S3: Summaries of the number of potential regions for XPEHH; Table S4: Genomic regions under divergent selection identified by XP-EHH method and associated candidate genes; Table S5: Genomic regions under divergent selection identified by HapFLK method and associated candidate genes; Table S6: Enriched pathways for significant genes identified using iHS, XP-EHH and HapFLK; Table S7: Enriched pathways identified for XP-EHH.

Author Contributions

Conceptualisation, F.C.M. and E.F.D.; methodology, N.L.H.; software, N.L.H., M.A.v.d.N., K.H. and R.P.; formal analysis, N.L.H. and M.A.v.d.N.; investigation, N.L.H.; resources, F.C.M. and E.F.D.; data curation, F.C.M., R.P.; writing—original draft preparation, N.L.H.; writing—review and editing, M.A.v.d.N., R.P., K.H., F.C.M. and E.F.D.; supervision, F.C.M. and E.F.D.; project administration, F.C.M.; funding acquisition, F.C.M. and E.F.D. All authors have read and agreed to the published version of the manuscript.

Funding

Nompilo Hlongwane was financially supported by the Agricultural Research Council (ARC)—Professional Development Program and National Research Foundation. This work is funded by the ARC-Biotechnology Platform.

Institutional Review Board Statement

Ethical approval for sample collection for this study was attained from the Agricultural Research Council-Irene Animal Ethics Committee (APIEC16/028). Permission was granted by the Department of Agriculture, Forestry and Fisheries to conduct the investigation in accordance with Section 20 of the Animal Diseases ACT of 1984 (ACT No. 35 of 1985). This was needed as domestic and wild pig samples were sampled and therefore precaution was needed to prevent the spread of African swine fever and foot and mouth diseases (12/11/1/1).

Informed Consent Statement

Not applicable.

Data Availability Statement

The datasets that were analysed during the current study are available from the corresponding author upon reasonable request.

Acknowledgments

We thank many people who assisted with collection of data, especially the pig farmers, Eastern Cape and Limpopo Departments of Agriculture, and numerous people.

Conflicts of Interest

The authors declare that the research conducted has no competing interests.

References

  1. Statista. Global Number of Pigs 2012–2021, by Country. Available online: https://www.statista.com/statistics/263963/number-of-pigs-worldwide-since-1990/ (accessed on 18 August 2021).
  2. Lunney, J.K. Advances in swine biomedical model genomics. Int. J. Biol. Sci. 2007, 3, 179–184. [Google Scholar] [CrossRef]
  3. Giuffra, E.; Kijas, J.M.; Amarger, V.; Carlborg, O.; Jeon, J.T.; Andersson, L. The origin of the domestic pig: Independent domestication and subsequent introgression. Genetics 2000, 154, 1785–1791. [Google Scholar] [CrossRef]
  4. Li, Y.; Mei, S.; Zhang, X.; Peng, X.; Liu, G.; Tao, H.; Wu, H.; Jiang, S.; Xiong, Y.; Li, F. Identification of genome-wide copy number variations among diverse pig breeds by array CGH. BMC Genom. 2012, 13, 725. [Google Scholar] [CrossRef]
  5. Gurgul, A.; Jasielczuk, I.; Ropka-Molik, K.; Semik-Gurgul, E.; Pawlina-Tyszko, K.; Szmatoła, T.; Szyndler-Nędza, M.; Bugno-Poniewierska, M.; Blicharski, T.; Szulc, K.; et al. A genome-wide detection of selection signatures in conserved and commercial pig breeds maintained in Poland. BMC Genet. 2018, 19, 95. [Google Scholar] [CrossRef] [PubMed]
  6. Larson, G.; Dobney, K.; Albarella, U.; Fang, M.; Matisoo-Smith, E.; Robins, J.; Lowden, S.; Finlayson, H.; Brand, T.; Willerslev, E.; et al. Worldwide phylogeography of wild boar reveals multiple centers of pig domestication. Science 2005, 307, 1618–1621. [Google Scholar] [CrossRef] [PubMed]
  7. Wu, G.S.; Yao, Y.G.; Qu, K.X.; Ding, Z.L.; Li, H.; Palanichamy, M.G.; Duan, Z.Y.; Li, N.; Chen, Y.S.; Zhang, Y.P. Population phylogenomic analysis of mitochondrial DNA in wild boars and domestic pigs revealed multiple domestication events in East Asia. Genome Biol. 2007, 8, R245. [Google Scholar] [CrossRef] [PubMed]
  8. Zhang, J.; Rodríguez, F.; Navas, M.J.; Mar, C.H.; Almagro-Delgado, V.; López, E.; Cuadrado, R.; Bosch-Camós, L.; Accensi Alemany, F.; Pina-Pedrero, S.; et al. Fecal microbiota transplantation from warthog to pig confirms the influence of the gut microbiota on African Swine Fever susceptibility. Sci. Rep. 2020, 10, 17605. [Google Scholar] [CrossRef]
  9. van Laere, A.S.; Nguyen, M.; Braunschweig, M.; Nezer, C.; Collette, C.; Moreau, L.; Archibald, A.L.; Haley, C.S.; Buys, N.; Tally, M.; et al. A regulatory mutation in IGF2 causes a major QTL effect on muscle growth in the pig. Nature 2003, 425, 832–836. [Google Scholar] [CrossRef]
  10. Rubin, C.J.; Megens, H.J.; Barrio, A.M.; Maqbool, K.; Sayyab, S.; Schwochow, D.; Wang, C.; Carlborg, O.; Jern, P.; Jorgensen, C.B.; et al. Strong signatures of selection in the domestic pig genome. Proc. Natl. Acad. Sci. USA 2012, 109, 19529–19536. [Google Scholar] [CrossRef]
  11. Zhang, Z.G. Pig Breeds in China; Shanghai Scientific and Technical Publishers: Shanghai, China, 1986; pp. 73–277. [Google Scholar]
  12. Guo, Y.; Mao, H.; Ren, J.; Yan, X.; Duan, Y.; Yang, G.; Ren, D.; Zhang, Z.; Yang, B.; Ouyang, J.; et al. A linkage map of the porcine genome from a large-scale White Duroc X Erhualian resource population and evaluation of factors affecting recombination rates. Anim. Genet. 2009, 40, 47–52. [Google Scholar] [CrossRef]
  13. Li, K.; Ren, J.; Xing, Y.; Zhang, Z.; Ma, J.; Guo, Y.; Huang, L. Quantitative trait loci for litter size and prenatal loss in a White Duroc X Chinese Erhualian resource population. Anim. Genet. 2009, 40, 963–966. [Google Scholar] [CrossRef]
  14. Watanabe, T.; Hayashi, Y.; Kimura, J.; Yasuda, Y.; Saitou, N.; Tomita, T.; Ogasawara, N. Pig mitochondrial DNA: Polymorphism, restriction map orientation, and sequence data. Biochem. Genet. 1986, 24, 385–396. [Google Scholar] [CrossRef]
  15. Scandura, M.; Iacolina, L.; Apollonio, M. Genetic diversity in the European wild boar Sus scrofa: Phylogeography, population structure and wild domestic hybridization. Mammal Rev. 2011, 41, 125–137. [Google Scholar] [CrossRef]
  16. Nyafu, K. Warthogs as an Introduced Species in the Eastern Cape. Master’s Thesis, Nelson Mandela Metropolitan University, Port Elizabeth, South Africa, 2009. [Google Scholar]
  17. Amar, S.; De Boni, L.; de Voux, A.; Heath, L.; Geertsma, P. An outbreak of African Swine Fever in small-scale pigs, Gauteng, South Africa, July 2020. Int. J. Infect. Dis. 2021, 110, S44–S49. [Google Scholar] [CrossRef]
  18. Molotsi, A.H.; Cupido, M.; Hoffman, L.C.H. Characterization of smallholder pig production systems in the Western Cape, South Africa. Trop. Anim. Health Prod. 2021, 53, 325. [Google Scholar] [CrossRef]
  19. NAFU. NAFU Farmer Headlines; June Issue Newsletter, 18–20 November 2007, Issue 9; NAFU: Pretoria, South Africa, 2007. [Google Scholar]
  20. Penrith, M.L.; Vosloo, W.; Mather, C. Classical Swine Fever (Hog Cholera): Review of aspects relevant to control. Transbound. Emerg. Dis. 2011, 58, 187–196. [Google Scholar] [CrossRef]
  21. Krige, J.E. The Social Systems of the Zulus; Shuter and Shooter: Pietermaritzburg, South Africa, 1988. [Google Scholar]
  22. Blench, R.M.; MacDonald, K.C. The Origins and Development of African Livestock: Archaeology, Genetics, Linguistics and Ethnography; UCL Press: London, UK, 2000. [Google Scholar]
  23. Swart, H.; Kotze, A.; Olivier, P.A.S.; Grobler, J.P. Microsatellite-based characterization of Southern African domestic pigs (Sus scrofa Domestica). S. Afr. J. Anim. Sci. 2010, 40, 121–132. [Google Scholar] [CrossRef]
  24. Visser, D.P. Structuring of Breeding Objectives in the Pork Supply Chain in South Africa. Ph.D. Thesis, University of Pretoria, Pretoria, South Africa, 2004. [Google Scholar]
  25. Visser, D. Modern Pig Production. Available online: https://books.google.co.za/books?id=mpXorQEACAAJ (accessed on 14 October 2016).
  26. Munzhelele, P. Evaluation of the Production Systems and Constraints of Smallholder Pig Farming in Three Agro-Ecological Zones of Mpumalanga Province, South Africa. Master’s Thesis, University of South Africa, Pretoria, South Africa, 2015. [Google Scholar]
  27. Madzimure, J.; Chimonyo, M.; Zander, K.K.; Dzama, K. Diurnal heat-related physiological and behavioural responses in South African indigenous gilts. J. Arid Environ. 2012, 87, 29–34. [Google Scholar] [CrossRef]
  28. Moyo, D.; Gomes, M.; Erlwanger, K.H. Comparison of the histology of the skin of the Windsnyer, Kolbroek and Large White pigs. J. S. Afr. Vet. Assoc. 2018, 89, 1–10. [Google Scholar] [CrossRef]
  29. Meissner, H.H.; Scholtz, M.M.; Palmer, A.R. Sustainability of the South African livestock sector towards 2050 Part 1: Worth and impact of the sector. S. Afr. J. Anim. Sci. 2013, 43, 282–297. [Google Scholar] [CrossRef]
  30. Madzimure, J.; Chimonyo, M.; Zander, K.K.; Dzama, K. Potential for using indigenous pigs in subsistence-oriented and market-oriented small-scale farming systems of Africa. Trop. Anim. Health Prod. 2012, 45, 135–142. [Google Scholar] [CrossRef] [PubMed]
  31. Halimani, T.E.; Muchadeyi, F.C.; Chimonyo, M.; Dzama, K. Pig genetic resource conservation: The Southern African perspective. Ecol. Econ. 2010, 69, 944–951. [Google Scholar] [CrossRef]
  32. Esfandyari, H.; Sørensen, A.C.; Bijma, P. Maximizing crossbred performance through purebred genomic selection. Genet. Sel. Evol. 2015, 47, 16. [Google Scholar] [CrossRef]
  33. Mohlatlole, R.P.; Madoroba, E.; Muchadeyi, F.C.; Chimonyo, M.; Kanengoni, A.T.; Dzomba, E.F. Virulence profiles of enterotoxigenic, shiga toxin and enteroaggregative Escherichia coli in South African pigs. Trop. Anim. Health Prod. 2013, 45, 399–405. [Google Scholar] [CrossRef]
  34. Raudsepp, T.; Finno, C.J.; Bellone, R.R.; Petersen, J.L. Ten years of the Horse Reference Genome: Insights into equine biology, domestication and population dynamics in the post genome era. Anim. Genet. 2019, 50, 569–597. [Google Scholar] [CrossRef] [PubMed]
  35. Ai, H.; Huang, L.; Ren, J. Genetic diversity, linkage disequilibrium and selection signatures in Chinese and Western pigs revealed by genome-wide SNP markers. PLoS ONE 2013, 8, e56001. [Google Scholar] [CrossRef] [PubMed]
  36. Wang, Z.; Chen, Q.; Yang, Y.; Yang, H.; He, P.; Zhang, Z.; Chen, Z.; Liao, R.; Tu, Y.; Zhang, X.; et al. A genome-wide scan for selection signatures in Yorkshire and Landrace pigs based on sequencing data. Anim. Genet. 2014, 45, 808–816. [Google Scholar] [CrossRef]
  37. D’Alessandro, E.; Arfuso, F.; Floridia, V.; Tardiolo, G.; Fazio, F.; Giannetto, C.; Piccione, G.; Zumbo, A. Different genotype and a liquid whey-supplemented diet influence the resilience of pigs through immune-modulation and anti-inflammatory response. Front. Vet. Sci. 2022, 9, 1046101. [Google Scholar] [CrossRef]
  38. Sutera, A.M.; Arfuso, F.; Tardiolo, G.; Riggio, V.; Fazio, F.; Aiese Cigliano, R.; Paytuví, A.; Piccione, G.; Zumbo, A. Effect of a co-feed liquid whey-integrated diet on crossbred pigs’ fecal microbiota. Animals 2023, 13, 1750. [Google Scholar] [CrossRef]
  39. Floridia, V.; Giuffrè, L.; Giosa, D.; Arfuso, F.; Aragona, F.; Fazio, F.; Chen, C.; Song, C.; Romeo, O.; D’Alessandro, E. Comparison of the faecal microbiota composition following a dairy by-product supplemented diet in nero siciliano and large white × landrace pig breeds. Animals 2023, 13, 2323. [Google Scholar] [CrossRef]
  40. Hlongwane, N.L.; Hadebe, K.; Soma, P.; Dzomba, E.F.; Muchadeyi, F.C. Genome wide assessment of genetic variation and population distinctiveness of the pig family in South Africa. Front. Genet. 2020, 11, 344. [Google Scholar] [CrossRef] [PubMed]
  41. Voight, B.F.; Kudaravalli, S.; Wen, X.; Pritchard, J.K. A map of recent positive selection in the human genome. PLoS Biol. 2006, 4, e72. [Google Scholar]
  42. Sabeti, P.C.; Varilly, P.; Fry, B.; Lohmueller, J.; Hostetter, E.; Cotsapas, C.; Xie, X.; Byrne, E.H.; McCarroll, S.A.; Gaudet, R.; et al. Genome-wide detection and characterization of positive selection in human populations. Nature 2007, 449, 913–918. [Google Scholar] [CrossRef] [PubMed]
  43. Sabeti, P.C.; Reich, D.E.; Higgins, J.M.; Levine, H.Z.; Richter, D.J.; Schaffner, S.F.; Gabriel, S.B.; Platko, J.V.; Patterson, N.J.; McDonald, G.J.; et al. Detecting recent positive selection in the human genome from haplotype structure. Nature 2002, 419, 832–837. [Google Scholar] [CrossRef] [PubMed]
  44. Eydivandi, S.; Roudbar, M.A.; Ardestani, S.S.; Momen, M.; Sahana, G. A selection signatures study among Middle Eastern and European sheep breeds. J. Anim. Breed. Genet. 2021, 138, 574–588. [Google Scholar] [CrossRef]
  45. Chen, Z.; Zhu, M.; Wu, Q.; Lu, H.; Lei, C.; Ahmed, Z.; Sun, J. Analysis of genetic diversity and selection characteristics using the whole genome sequencing data of five buffaloes, including Xilin buffalo, in Guangxi, China. Front. Genet. 2023, 13, 1084824. [Google Scholar] [CrossRef] [PubMed]
  46. Fariello, M.I.; Boitard, S.; Naya, H.; SanCristobal, M.; Servin, B. Detecting signatures of selection through haplotype differentiation among hierarchically structured populations. Genetics 2013, 193, 929–941. [Google Scholar] [CrossRef]
  47. Zhao, F.; Deng, T.; Shi, L.; Wang, W.; Zhang, Q.; Du, L.; Wang, L. Genomic scan for selection signature reveals fat deposition in Chinese indigenous sheep with extreme tail types. Animals 2020, 10, 773. [Google Scholar] [CrossRef]
  48. Storey, J.D.; Tibshirani, R. Statistical Significance for Genomewide Studies. Proc. Natl. Acad. Sci. USA 2003, 100, 9440–9445. [Google Scholar] [CrossRef]
  49. Willing, E.; Dreyer, C.; Oosterhout, C. Estimates of genetic differentiation measured by fst do not necessarily require large sample sizes when using many SNP markers. PLoS ONE 2012, 7, e42649. [Google Scholar] [CrossRef]
  50. Devani, K.; Crowley, J.J.; Plastow, G.; Orsel, K.; Valente, T.S. Genetic parameter estimations and genomic insights for teat and udder structure in young and mature Canadian Angus cows. J. Anim. Sci. 2021, 99, skab087. [Google Scholar] [CrossRef] [PubMed]
  51. Abraham, G. The importance of muscarinic receptors in domestic animal diseases and therapy: Current and future perspectives. Vet. J. 2016, 208, 13–21. [Google Scholar] [CrossRef] [PubMed]
  52. Tyra, M.; Ropka-Molik, K.; Piórkowska, K.; Oczkowicz, M.; Szyndler-Nędza, M.; Małopolska, M. Association of ghrelin gene polymorphisms with fattening traits and feed intake in pig: A preliminary study. Animals 2019, 9, 410. [Google Scholar] [CrossRef] [PubMed]
  53. El-Magd, M.A.; Saleh, A.A.; Abdel-Hamid, T.M.; Saleh, R.M.; Afifi, M.A. Is really endogenous ghrelin a hunger signal in chickens? Association of GHSR SNPs with increase appetite, growth traits, expression and serum level of GHRL, and GH. Gen. Comp. Endocrinol. 2016, 237, 131–139. [Google Scholar] [CrossRef] [PubMed]
  54. Duarte, D.A.S.; Fortes, M.R.S.; de Souza Duarte, M.; Guimarães, S.E.; Verardo, L.L.; Veroneze, R.; Ribeiro, A.M.F.; Lopes, P.S.; de Resende, M.D.V.; e Silva, F.F. Genome-wide association studies, meta-analyses and derived gene network for meat quality and carcass traits in pigs. Anim. Prod. Sci. 2017, 58, 1100–1108. [Google Scholar] [CrossRef]
  55. Qin, M.; Li, C.; Li, Z.; Chen, W.; Zeng, Y. Genetic diversities and differentially selected regions between Shandong indigenous pig breeds and Western pig breeds. Front. Genet. 2020, 10, 1351. [Google Scholar] [CrossRef] [PubMed]
  56. Hoffman, L.C.; Styger, E.; Muller, M.; Brand, T.S. Sensory, Physical and chemical quality characteristics of bacon derived from South African indigenous and commercial pig breeds. S. Afr. Soc. Anim. Sci. 2005, 6, 38–48. [Google Scholar]
  57. Kogelman, L.J.; Kadarmideen, H.N.; Mark, T.; Karlskov-Mortensen, P.; Bruun, C.S.; Cirera, S.; Jacobsen, M.J.; Jørgensen, C.B.; Fredholm, M. An F2 pig resource population as a model for genetic studies of obesity and obesity-related diseases in humans: Design and genetic parameters. Front. Genet. 2013, 4, 29. [Google Scholar] [CrossRef]
  58. Reardon, W.; Mullen, A.M.; Sweeney, T.; Hamill, R.M. Association of polymorphisms in candidate genes with colour, water-holding capacity, and composition traits in bovine M. longissimus and M. semimembranosus. Meat Sci. 2010, 86, 270–275. [Google Scholar] [CrossRef]
  59. Jung, J.H.; Shim, K.S.; Na, C.S.; Choe, H.S. Studies on intramuscular fat percentage in live swine using real-time ultrasound to determine pork quality. Asian Australas. J. Anim. Sci. 2015, 28, 318–322. [Google Scholar] [CrossRef]
  60. Ren, Z.; Wang, Y.; Ren, Y.; Zhang, Z.; Gu, W.; Wu, Z.; Chen, L.; Mou, L.; Li, R.; Yang, H.; et al. Enhancement of porcine intramuscular fat content by overexpression of the cytosolic form of phosphoenolpyruvate carboxykinase in skeletal muscle. Sci. Rep. 2017, 7, 43746. [Google Scholar] [CrossRef] [PubMed]
  61. Switonski, M.; Stachowiak, M.; Cieslak, J.; Bartz, M.; Grzes, M. Genetics of fat tissue accumulation in pigs: A comparative approach. J. Appl. Genet. 2010, 51, 153–168. [Google Scholar] [CrossRef]
  62. Stachowiak, M.; Szczerbal, I.; Switonski, M. Genetics of adiposity in large animal models for human obesity-studies on pigs and dogs. Prog. Mol. Biol. Transl. Sci. 2016, 140, 233–270. [Google Scholar]
  63. Lopes-Bote, C.J. Sustained utilization of the Iberian pig breed. Meat Sci. 1998, 49, S17–S27. [Google Scholar] [CrossRef]
  64. Egerszegi, I.; Rátky, J.; Solti, L.; Brüssow, K.P. Mangalica—An indigenous swine breed from Hungary. Arch. Anim. Breed. 2003, 46, 245–256. [Google Scholar] [CrossRef]
  65. Hoffman, L.C.; Styger, W.F.; Brand, T.S.; Muller, M. The growth, carcass yield, physical and chemical characteristic of two South African indigenous pig breeds. S. Afr. J. Anim. Sci. 2005, 6, 25–35. [Google Scholar]
  66. Ludwiczak, A.; Składanowska-Baryza, J.; Stanisz, M. Effect of age and sex on the quality of offal and meat of the wild boar (Sus scrofa). Animals 2020, 10, 660. [Google Scholar] [CrossRef] [PubMed]
  67. Niewiadomska, K.; Kosicka-Gębska, M.; Gębski, J.; Gutkowska, K.; Jeżewska-Zychowicz, M.; Sułek, M. Game meat consumption—Conscious choice or just a game? Foods 2020, 9, 1357. [Google Scholar] [CrossRef]
  68. Ciobanu, M.M.; Postolache, A.N.; Lipşa, F.D.; Munteanu, M.; Rațu, R.N.; Murariu, O.C.; Boișteanu, P.C. Meat fatty acid composition of wild boars hunted in Romania in relationship to gender and age-class. Animals 2022, 12, 810. [Google Scholar] [CrossRef]
  69. Li, D.; Huang, M.; Zhuang, Z.; Ding, R.; Gu, T.; Hong, L.; Zheng, E.; Li, Z.; Cai, G.; Wu, Z.; et al. Genomic analyses revealed the genetic difference and potential selection genes of growth traits in two Duroc lines. Front. Vet. Sci. 2021, 8, 725367. [Google Scholar] [CrossRef]
  70. Chen, Z.; Li, Y.; Zhang, Z.; Zhao, W.; Zhang, Z.; Xiang, Y.; Wang, Q.; Pan, Y.; Guo, X.; Wang, Z. Genome-wide epistatic interactions of litter size at birth in Chinese indigenous pigs. Anim. Genet. 2021, 52, 739–743. [Google Scholar] [CrossRef]
  71. Miller, L.C.; Fleming, D.S.; Lager, K.M. Comparison of the transcriptome response within the swine tracheobronchial lymphnode following infection with PRRSV, PCV-2 or IAV-S. Pathogens 2020, 9, 99. [Google Scholar] [CrossRef]
  72. Mészárosová, M.; Mészáros, G.; Moravčíková, N.; Pavlík, I.; Margetín, M.; Kasarda, R. Within-and between-breed selection signatures in the original and improved Valachian sheep. Animals 2022, 12, 1346. [Google Scholar] [CrossRef]
  73. Krupa, E.; Wolfová, M.; Krupová, Z.; Žáková, E. Estimation of economic weights for number of teats and sperm quality traits in pigs. J. Anim. Breed Genet. 2020, 137, 189–199. [Google Scholar] [CrossRef]
  74. Halimani, T.E.; Muchadeyi, F.C.; Chimonyo, M.; Dzama, K. Some Insights into the phenotypic and genetic diversity of indigenous pigs in Southern Africa. S. Afr. J. Anim. Sci. 2012, 42, 507–510. [Google Scholar] [CrossRef]
  75. Oliviero, C.; Junnikkala, S.; Peltoniemi, O. The challenge of large litters on the immune system of the sow and the piglets. Reprod. Domest. Anim. 2019, 54, 12–21. [Google Scholar] [CrossRef]
  76. Lopes, M.S.; Bastiaansen, J.W.; Harlizius, B.; Knol, E.F.; Bovenhuis, H. A Genome-wide association study reveals dominance effects on number of teats in pigs. PLoS ONE 2014, 9, e105867. [Google Scholar] [CrossRef]
  77. Duijvesteijn, N.; Veltmaat, J.M.; Knol, E.F.; and Harlizius, B. High-resolution association mapping of number of teats in pigs reveals regions controlling vertebral development. BMC Genom. 2014, 15, 542. [Google Scholar] [CrossRef]
  78. Makhanya, L.G. Phenotypic and Reproductive Characterisation of Kolbroek Pigs. Master’s Thesis, Central University of Technology, Bloemfontein, South Africa, 2018. [Google Scholar]
  79. Verardo, L.L.; Silva, F.F.; Varona, L.; Resende, M.D.V.; Bastiaansen, J.W.M.; Lopes, P.S.; Guimarães, S.E.F. Bayesian GWAS and network analysis revealed new candidate genes for number of teats in pigs. J. Appl. Genet. 2015, 56, 123–132. [Google Scholar] [CrossRef]
  80. Van Hossou, S.F.U.; Yin, T.; Scheper, C.; Fries, R.; Dossa, L.H.; König, S. Unravelling admixture, inbreeding, and recent selection signatures in West African indigenous cattle populations in Benin. Front. Genet. 2021, 12, 657282. [Google Scholar] [CrossRef]
  81. VonHoldt, B.M.; Hinton, J.W.; Shutt, A.C.; Murphy, S.M.; Karlin, M.L.; Adams, J.R.; Waits, L.P.; Brzeski, K.E. Reviving ghost alleles: Genetically admixed coyotes along the American Gulf Coast are critical for saving the endangered red wolf. Sci. Adv. 2022, 8, eabn7731. [Google Scholar] [CrossRef] [PubMed]
Figure 1. Manhattan plot of the genome-wide distribution of the selection of signatures detected via the iHS across the 18 chromosomes (indicated in different colours) for the village (AD), indigenous (E,F), commercial (GI), Vietnamese potbelly (J), and wild pig (KM) populations.
Animals 14 00236 g001
Figure 2. Manhattan plot of the genome-wide distribution of the selection of signatures between populations detected via XP-EHH across the 18 chromosomes (indicated in different colours) for DUR (AG), WAT (HL), and VIT (MQ) populations.
Animals 14 00236 g002
Figure 3. Manhattan plot for signature of selection of South African pig populations detected via HapFLK across 18 chromosomes (indicated in different colours).
Animals 14 00236 g003
Table 1. Summary of the sampled pig populations.
CategoryPopulationCodeN
VillageMopaniMOP27
VillageCapricornCAP25
VillageOliver Reginald TamboORT22
VillageAlfred NzoALN17
CommercialLarge WhiteLWT20
CommercialSA LandraceSAL20
CommercialDurocDUR20
IndigenousKolbroekKOL20
IndigenousWindsnyer TypeWIN20
AsianVietnamese PotbellyVIT5
WildWild boarWBO4
WildWild boarWAT31
WildWild boarBSP3
Table 2. Within-population list of genomic regions under selection and candidate genes detected using the iHS method.
PopulationsChrStartEndGeneQTLs
ALN22524750525378565TRIM44Spinal Curvature
79598273996254303DPF3Teat number
83192158732301975APBB2Stearic acid content
132975330829775371PTH1RFront leg conformation, Hind leg conformation, Hip structure
ORT1162364055162737492NEDD4LIntramuscular fat content
28767881187866856DMGDHLitter weight piglets born alive
88029071580669404NR3C2Loin muscle, Teat number
125397921554055377PIK3R5Intramuscular fat content
122795773228617585CA10Hemaglobin
124461749944660271VTNBody depth, Drip loss, Hind leg conformation, Hip structure, pH 24 h post-mortem (loin), ph 45 min post-mortem
MOP47104533371318030NKAIN3Body weight (birth)
83192158732301975APBB2Stearic acid content
162753788527631130SELENOPMeat colour a
163214203432148335PELOObesity index, Teat number
163233629232437103ITGA2Body weight (5 weeks)
CAP1183915339184140122SAMD4AIntramuscular fat content
122741633727436160NME1Conductivity 24 h post-mortem (loin), Cooking loss, Loin muscle depth, Loin weight
122795773228617585CA10Hemoglobin
14101123381101254725LIPAAverage daily gain, Front leg weight, HDL/LDL ratio, Litter size, Loin muscle area, Monounsaturated fatty acid content, Oleic acid content, Skin thickness, Sperm concentration, Teat number
14103992037104106576IDEe.g., Abdominal fat percentage, Age at puberty, Age at slaughter, Average backfat thickness, Average daily gain, Backfat at first rib, Backfat at last rib, Backfat between 3rd and 4th last ribs, Body depth, Body height
14105036770105044765RBP4Litter size, Total number born alive
141243751512563544EXTL3Fat androstenone level
87648202276699351FBXW7Body mass index
83192158732301975APBB2Stearic acid content
LWT2108255930108536881PAMIntramuscular fat content, Loin percentage, Maternal infanticide, Teat number
72686014026990017LRRC1Meat colour L
94812080248286278TECTABackfat between 3rd and 4th last ribs
13177365717179013542ROBO2Feed efficiency, Linolenic acid content
146920021570938204CTNNA3Teat number
DUR6137595524138010444SLC44A5Diameter of muscle fibers
72738987427895570KHDRBS2Loin muscle area, Loin muscle depth, Teat number
KOL46162829961716546JPH1Intramuscular fat content
147935239680106258KCNMA1Meat colour b
WIN51871815818723843TARBP2Backfat between 3rd and 4th last ribs
8127731903128953331CCSER1Backfat between 3rd and 4th last ribs, Intramuscular fat content
VIT27976634980141293COL23A1Front foot size, Hip structure
47968735979847281PRKDCFeed conversion ratio
67984968779958271HSPG2Days to 113 kg, Marbling
147935239680106258KCNMA1Meat colour b
WAT183102703131125465MDFICFat androstenone level
WBO21579145115819138F2e.g., Age at slaughter, Average backfat thickness, Average daily gain, Backfat at last rib, Backfat at rump, Backfat thickness between 3rd and 4th rib, Body weight (end of test), Body weight (weaning)
547698014849334SHISAL1Intramuscular fat content
569974447014422POLR3HFat androstenone level
136631643666452917GHRLAge at slaughter, Average daily gain, Daily feed intake, Days to 100 kg, Feed intake, Loin weight, Marbling
142175446322121051SPOCK3Fat androstenone level
Table 3. Selected regions and candidate genes detected between pairs of populations using the XP-EHH method.
PopulationsChrStartEndGeneQTLs
DUR_EC1166173135166310972ITGA11Obesity index, Teat number
2113774412114206930FERAbdominal circumference, Average backfat thickness, Average daily gain, Backfat at last lumbar, Biceps brachii weight, Body height, Body weight (3 weeks), Carcass weight (hot), Double-bond index
68064914380843567EPHB2Litter weight total
DUR_LIM1166173135166310972ITGA11Obesity index, Teat number
68064914380843567EPHB2Litter weight total
DUR_IND184082064441409087PDE1CBackfat at rump
184203051042046184GHRHRBackfat at last rump, Carcass length, Fat-cuts percentage
DUR_LWT2113774412114206930FERe.g., Abdominal circumference, Arachidonic acid content, Aspartate aminotransferase activity, Average backfat thickness, Average daily gain, Backfat at last lumbar, Backfat at mid-back, Backfat at rump, Backfat at tenth rib
72738987427895570KHDRBS2Loin muscle area, Loin muscle depth, Teat number
73070833230724045SNRPCLoin muscle area, Loin muscle depth
73073146130802735UHRF1BP1Femur length, Hip bone length, Humerus length, Tibia length, Ulna length
73081292030995361ANKS1AFemur length, Hip bone length, Humerus length, Tibia length, Ulna length, Galt score (front), Loin muscle area, Loin muscle depth
73158655531603617ARMC12Facial morphology
73172299031792904SLC26A8Facial morphology, Femur length, Humerus length, Tibia length, Ulna length
14111834168111914304PAX2Monounsaturated fatty acid to saturated fatty acid ratio, Oleic acid to stearic acid ratio, Palmitoleic acid to palmitic acid ratio, Stearic acid content
DUR_VIT27232671472391648VAV1Average daily gain, Backfat between 3rd and 4th last rib, Birth weight variability, Body weight (end of test), Conductivity 45 min post-mortem, Fat androstenone level, Intramuscular fat content, Time in feeder per day, pH 24 h postmortem (ham), pH 45 min postmortem
DUR_WBO1193722164193906565ESR2Front leg conformation, Gait score (overall), Hind leg conformation, Litter size, Maternal infanticide, Plasma droplet rate, Semen volume, Sperm concentration, Sperm motility, Total number born alive
WAT_EC1254683885254703225AMBPConductivity 24 h post-mortem (loin), pH 24 h postmortem (ham), pH 24 h post-mortem (loin), pH 45 min postmortem
33995726939957727NPWLean meat percentage
83753081537809761CORINPlatelet count
83779787537875540NFXL1Mean corpuscular hemoglobin content, Mean corpuscular volume
84747378747601359RXFP1Red blood cell count
87152027571554766PPEF2Platelet distribution width
87157378371603338NAAAPlatelet distribution width
87254362072679173SEPTIN11Teat number
87350266473958083FRAS1Teat number
WAT_LIM1254683885254703225AMBPConductivity 24 h post-mortem (loin), pH 24 h postmortem (ham), pH 24 h post-mortem (loin), pH 45 min postmortem
87152027571554766PPEF2Platelet distribution width
87157378371603338NAAAPlatelet distribution width
14113414264113429936PSDIntramuscular fat content, Oleic acid to stearic acid ratio
14113464174113478699MFSD13AOleic acid content, Oleic acid to stearic acid ratio, Stearic acid content
14113480197113498740ACTR1AOleic acid content, Stearic acid content
94540046445435916TMPRSS4Backfat between 3rd and 4th last ribs
WAT_LWT4105804586105845725CSDE1Intramuscular fat content
4105868897105893771AMPD1Juiciness score, Overall impression, sensory panel, Tenderness score
WAT_WBO78912082289168270MAXMeat colour b, Teat number, maximum per side
VIT_EC182989587829936233TESAverage daily gain, Backfat between 3rd and 4th last rib, Birth weight variability, Body weight (end of test), Conductivity 45 min post-mortem, Fat androstenone level, Intramuscular fat content, Time in feeder per day, pH 24 h postmortem (ham), pH 45 min postmortem, Teat number
VIT_LIM27232671472391648VAV1Average daily gain, Backfat between 3rd and 4th last rib, Birth weight variability, Body weight (end of test), Conductivity 45 min post-mortem, Fat androstenone level, Intramuscular fat content, Time in feeder per day, pH 24 h postmortem (ham), pH 45 min postmortem
182989587829936233TESAverage daily gain, Backfat between 3rd and 4th last rib, Birth weight variability, Body weight (end of test), Conductivity 45 min post-mortem, Fat androstenone level, Intramuscular fat content, Time in feeder per day, pH 24 h postmortem (ham), pH 45 min postmortem, Teat number
VIT_IND182989587829936233TESAverage daily gain, Backfat between 3rd and 4th last rib, Birth weight variability, Body weight (end of test), Conductivity 45 min post-mortem, Fat androstenone level, Intramuscular fat content, Time in feeder per day, pH 24 h postmortem (ham), pH 45 min postmortem, Teat number
183102703131125465MDFICFat androstenone level
VIT_WBO1193722164193906565ESR2Front leg conformation, Gait score (overall), Hind leg conformation, Litter size, Maternal infanticide, Plasma droplet rate, Semen volume, Sperm concentration, Sperm motility, Total number born alive
Table 4. Genomic regions under selection detected via HapFLK methods in South African pigs.
ChrStartEndGeneQTLs
54438100944558744FAR2Feed conversion ratio
55681760657005114EPS8Fat androstenone level
56451918665002098VWFLitter size
56666526366838922PRMT8Teat number
52830095028605120SRGAP1Ear area
52969583929863599MSRB3Ear area
59709288397148601SLC6A15Time in feeder per day
53385857234033939CCT2Feed conversion ratio
53406799234218513MYRFLFeed conversion ratio
53466002934794321PTPRBFeed conversion ratio
53627436436658703TRHDEFeed conversion ratio
69734247497429364GNALAge at puberty, Arachidic acid content, Average backfat thickness, Average daily gain, Backfat at last lumbar, Backfat at last rib, Backfat at rump, Backfat at tenth rib, Body weight (16 days), Carcass weight (hot), ear area, Feed conversion ratio, Lean meat percentage, Loin muscle area, Loin muscle depth, Oleic acid content, Oleic acid to stearic acid ratio, PH for longissmus dorsi, Stearic acid content, Teat number, Vertebra number, Androstenone laboratory
6108115886108227748CABLES1Average daily gain, Backfat at rump
6108548837108805693LAMA3Average daily gain
67569648475755892PADI2Fat androstenone level
6112396721112628432CDH2Average daily gain, Intramuscular fat content, Lean meat percentage, Obesity index
6117631227118334105NOL4Average backfat thickness
67984968779958271HSPG2Days to 113 kg, Marbling
6125890708126043161PIK3C3Average backfat thickness, Average daily gain, Intramuscular fat content, Loin muscle area
68064914380843567EPHB2Litter weight (total)
6137595524138010444SLC44A5Diameter of muscle fibers
64393375944069330GPIAverage backfat thickness, Body weight (5 weeks), Intramuscular fat content, Osteochondrosis score
64644285746470075ZNF570Lean meat percentage
144794639648040822LIMK2Fat androstenone level, Melanoma susceptibility
14122777130122828051ACSL5Fat androstenone level
14123343694123546417TCF7L2Carcass weight (hot), Number of visits to feeder per day
14133460167133544018CHST15Teat number
14124760398125010892ABLIM1Fat androstenone level, Intramuscular fat content
15100868469101211242ANKRD44Skin thickness
15101623818101957516PLCL1Skin thickness
15118335925118452296XRCC5Average backfat thickness, Conductivity 24 h post-mortem (loin), Cooking loss, Fat weight (total), Lean meat percentage, Loin muscle area, Loin muscle depth, Loin weight, PH for longissmusdorsi, Subcutanous fat area, pH 24 h postmortem (ham), pH 24 h post-mortem (ham), pH 24 h post-mortem (loin)
157993599480025850SP3Cooking loss, Meat colour b, Shear force, Thawing loss
163213023532304592ITGA1Obesity index, Teat number
163233629232437103ITGA2Body weight (5 weeks)
163312649433565542ARL15Loin muscle area
183400668834906268IMMP2LAge at puberty
184082064441409087PDE1CBackfat at rump
184203051042046184GHRHRBackfat at last rib, Carcass length, Fat-cuts percentage
185138783651802945HECW1Teat number
Disclaimer/Publisher’s Note: The statements, opinions and data contained in all publications are solely those of the individual author(s) and contributor(s) and not of MDPI and/or the editor(s). MDPI and/or the editor(s) disclaim responsibility for any injury to people or property resulting from any ideas, methods, instructions or products referred to in the content.

