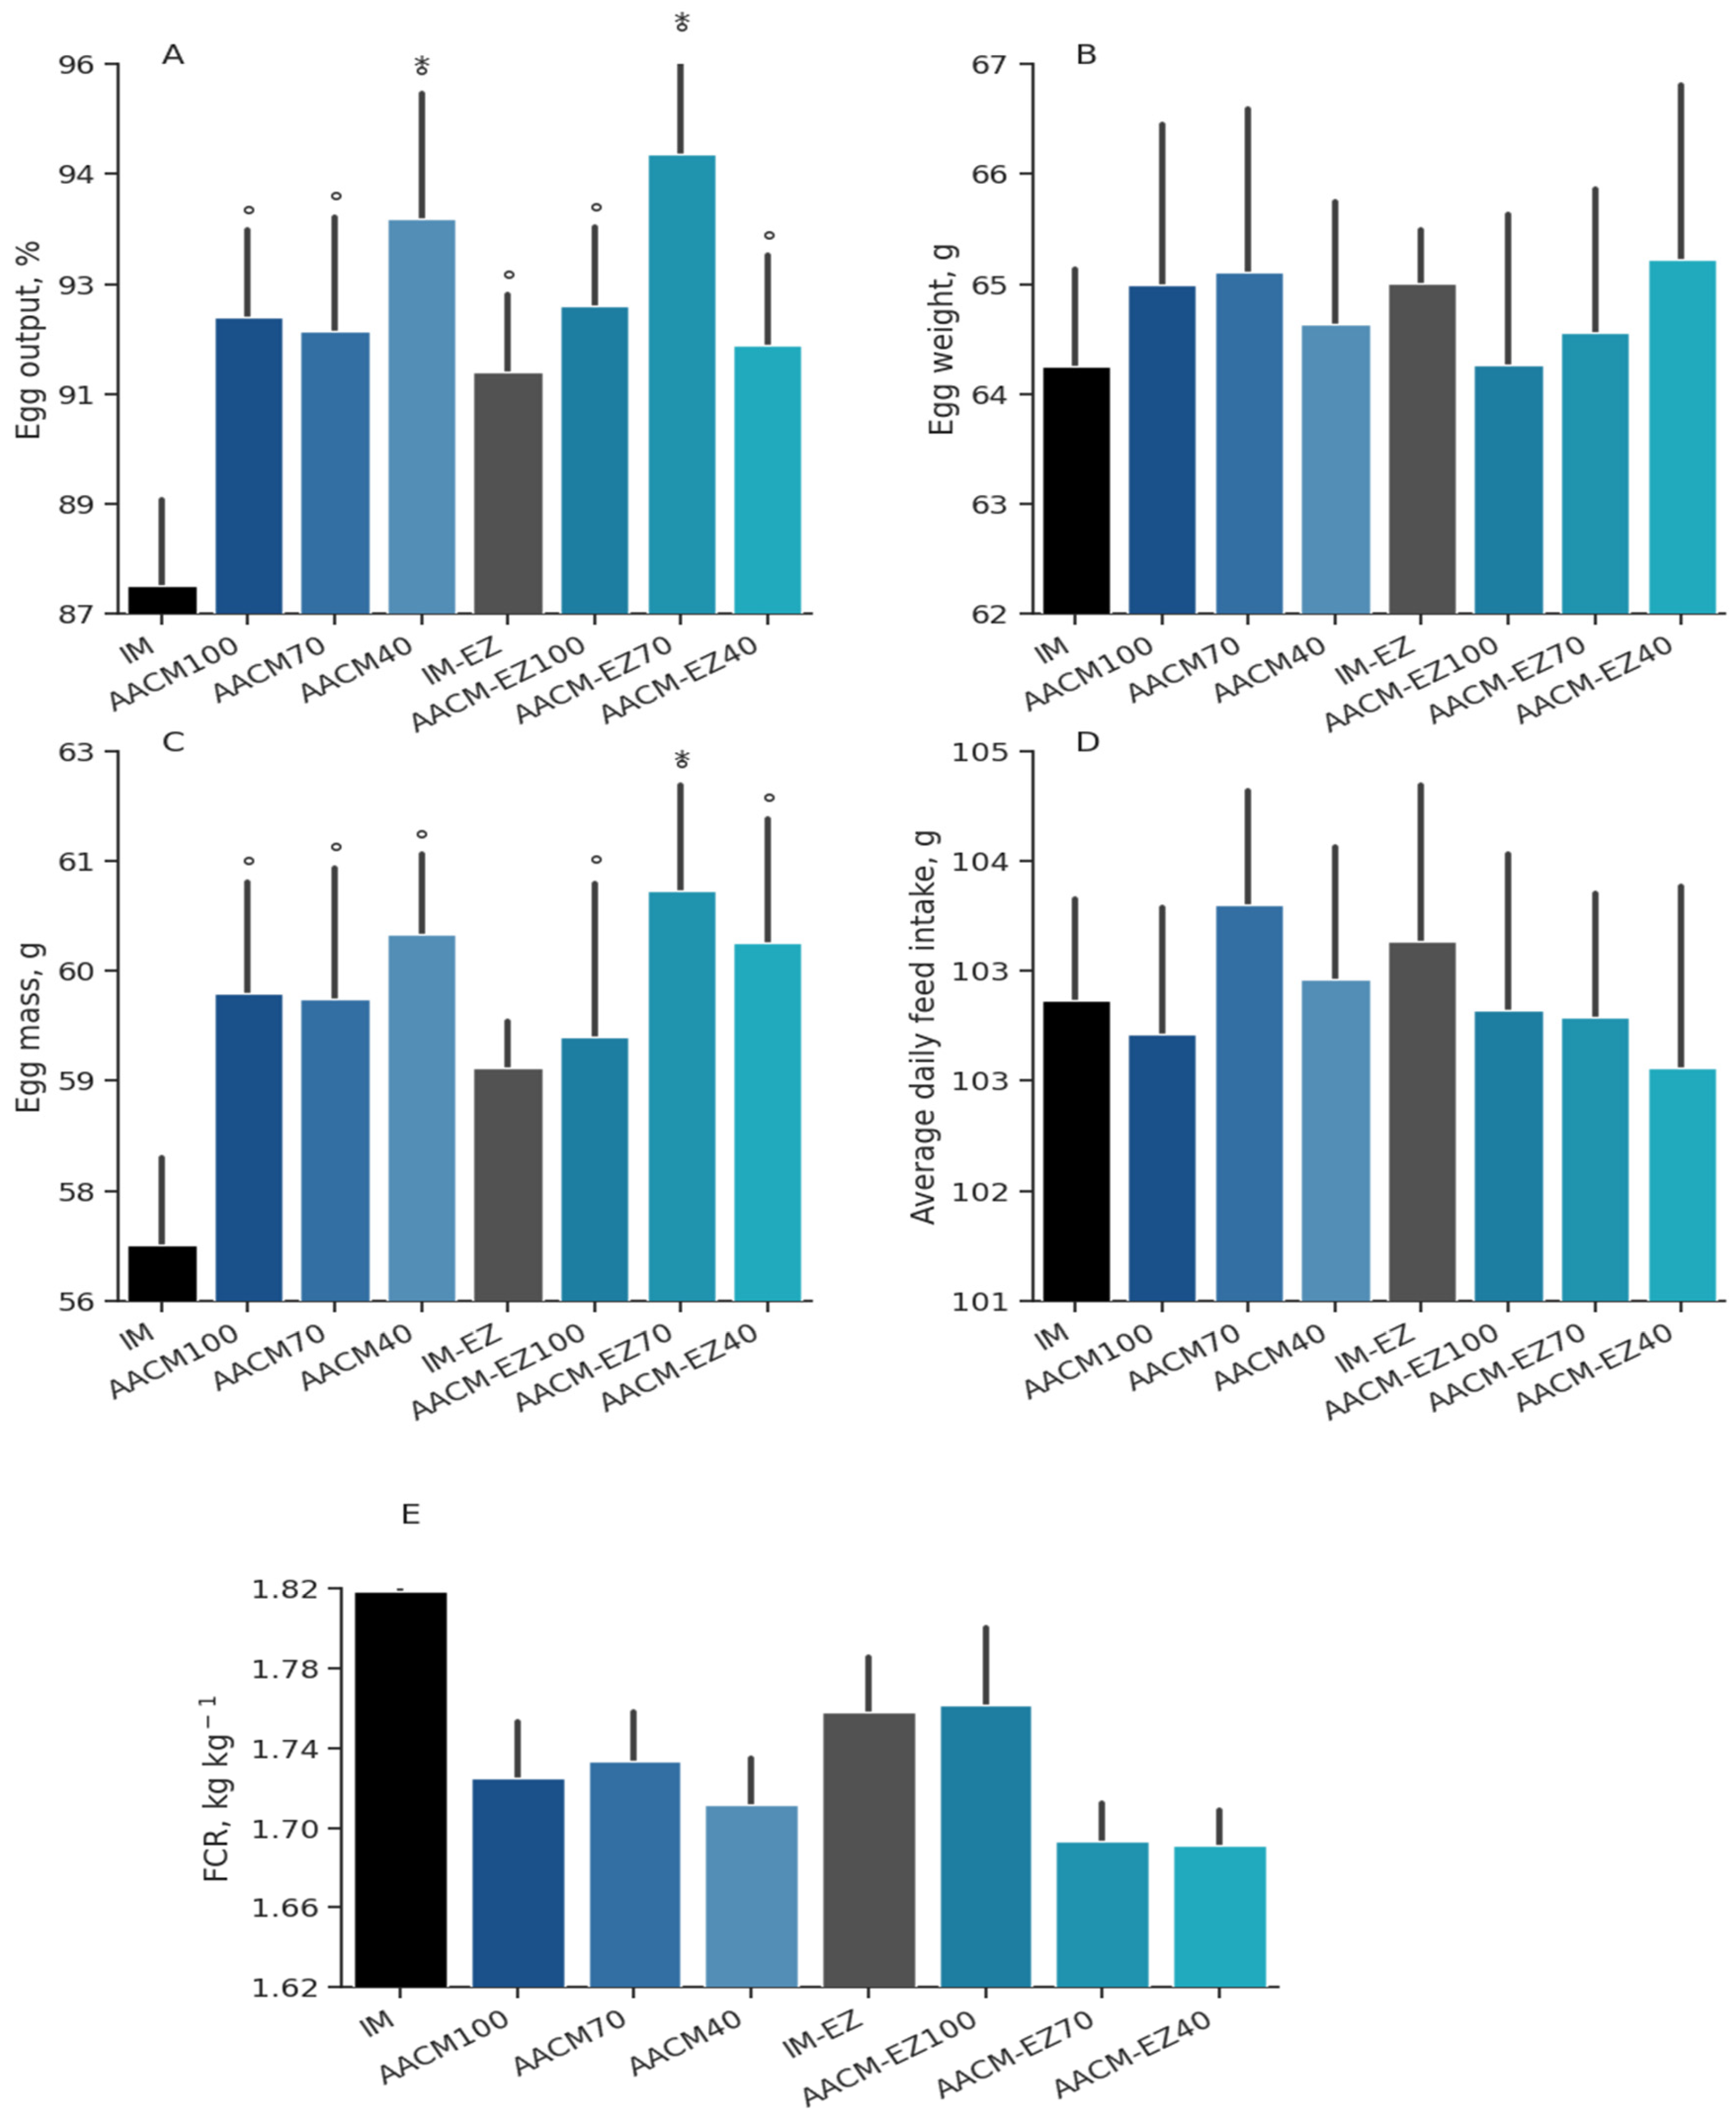
Figure 1.
Egg output (A), egg weight (B), egg mass (C), average daily feed intake (D), feed conversion ratio (E) of laying hens from 68 to 90 weeks fed inorganic minerals (IM) and amino acid complex minerals (AACM) supplemented with or without the use of phytase (EZ). IM or IM-EZ: 60, 70, 8, 40, 0.250 mg kg−1 of Zn, Mn, Cu, Fe, I, and Se, respectively; AACM100 or AACM-EZ100: 60, 70, 8, 40, 0.250 mg kg−1 of Zn, Mn, Cu, Fe, I, and Se, respectively; AACM70 or AACM-EZ70: 42, 49, 6, 28, 0.175 mg kg−1 of Zn, Mn, Cu, Fe, I, and Se, respectively; AACM40 or AACM-EZ40: 24, 28, 3, 16, 0.10 mg kg−1 of Zn, Mn, Cu, Fe, I, and Se, respectively. Data were analyzed by Dunnett’s test (p < 0.05); ° Differs from IM treatment; * Differs from IM-EZ treatment.
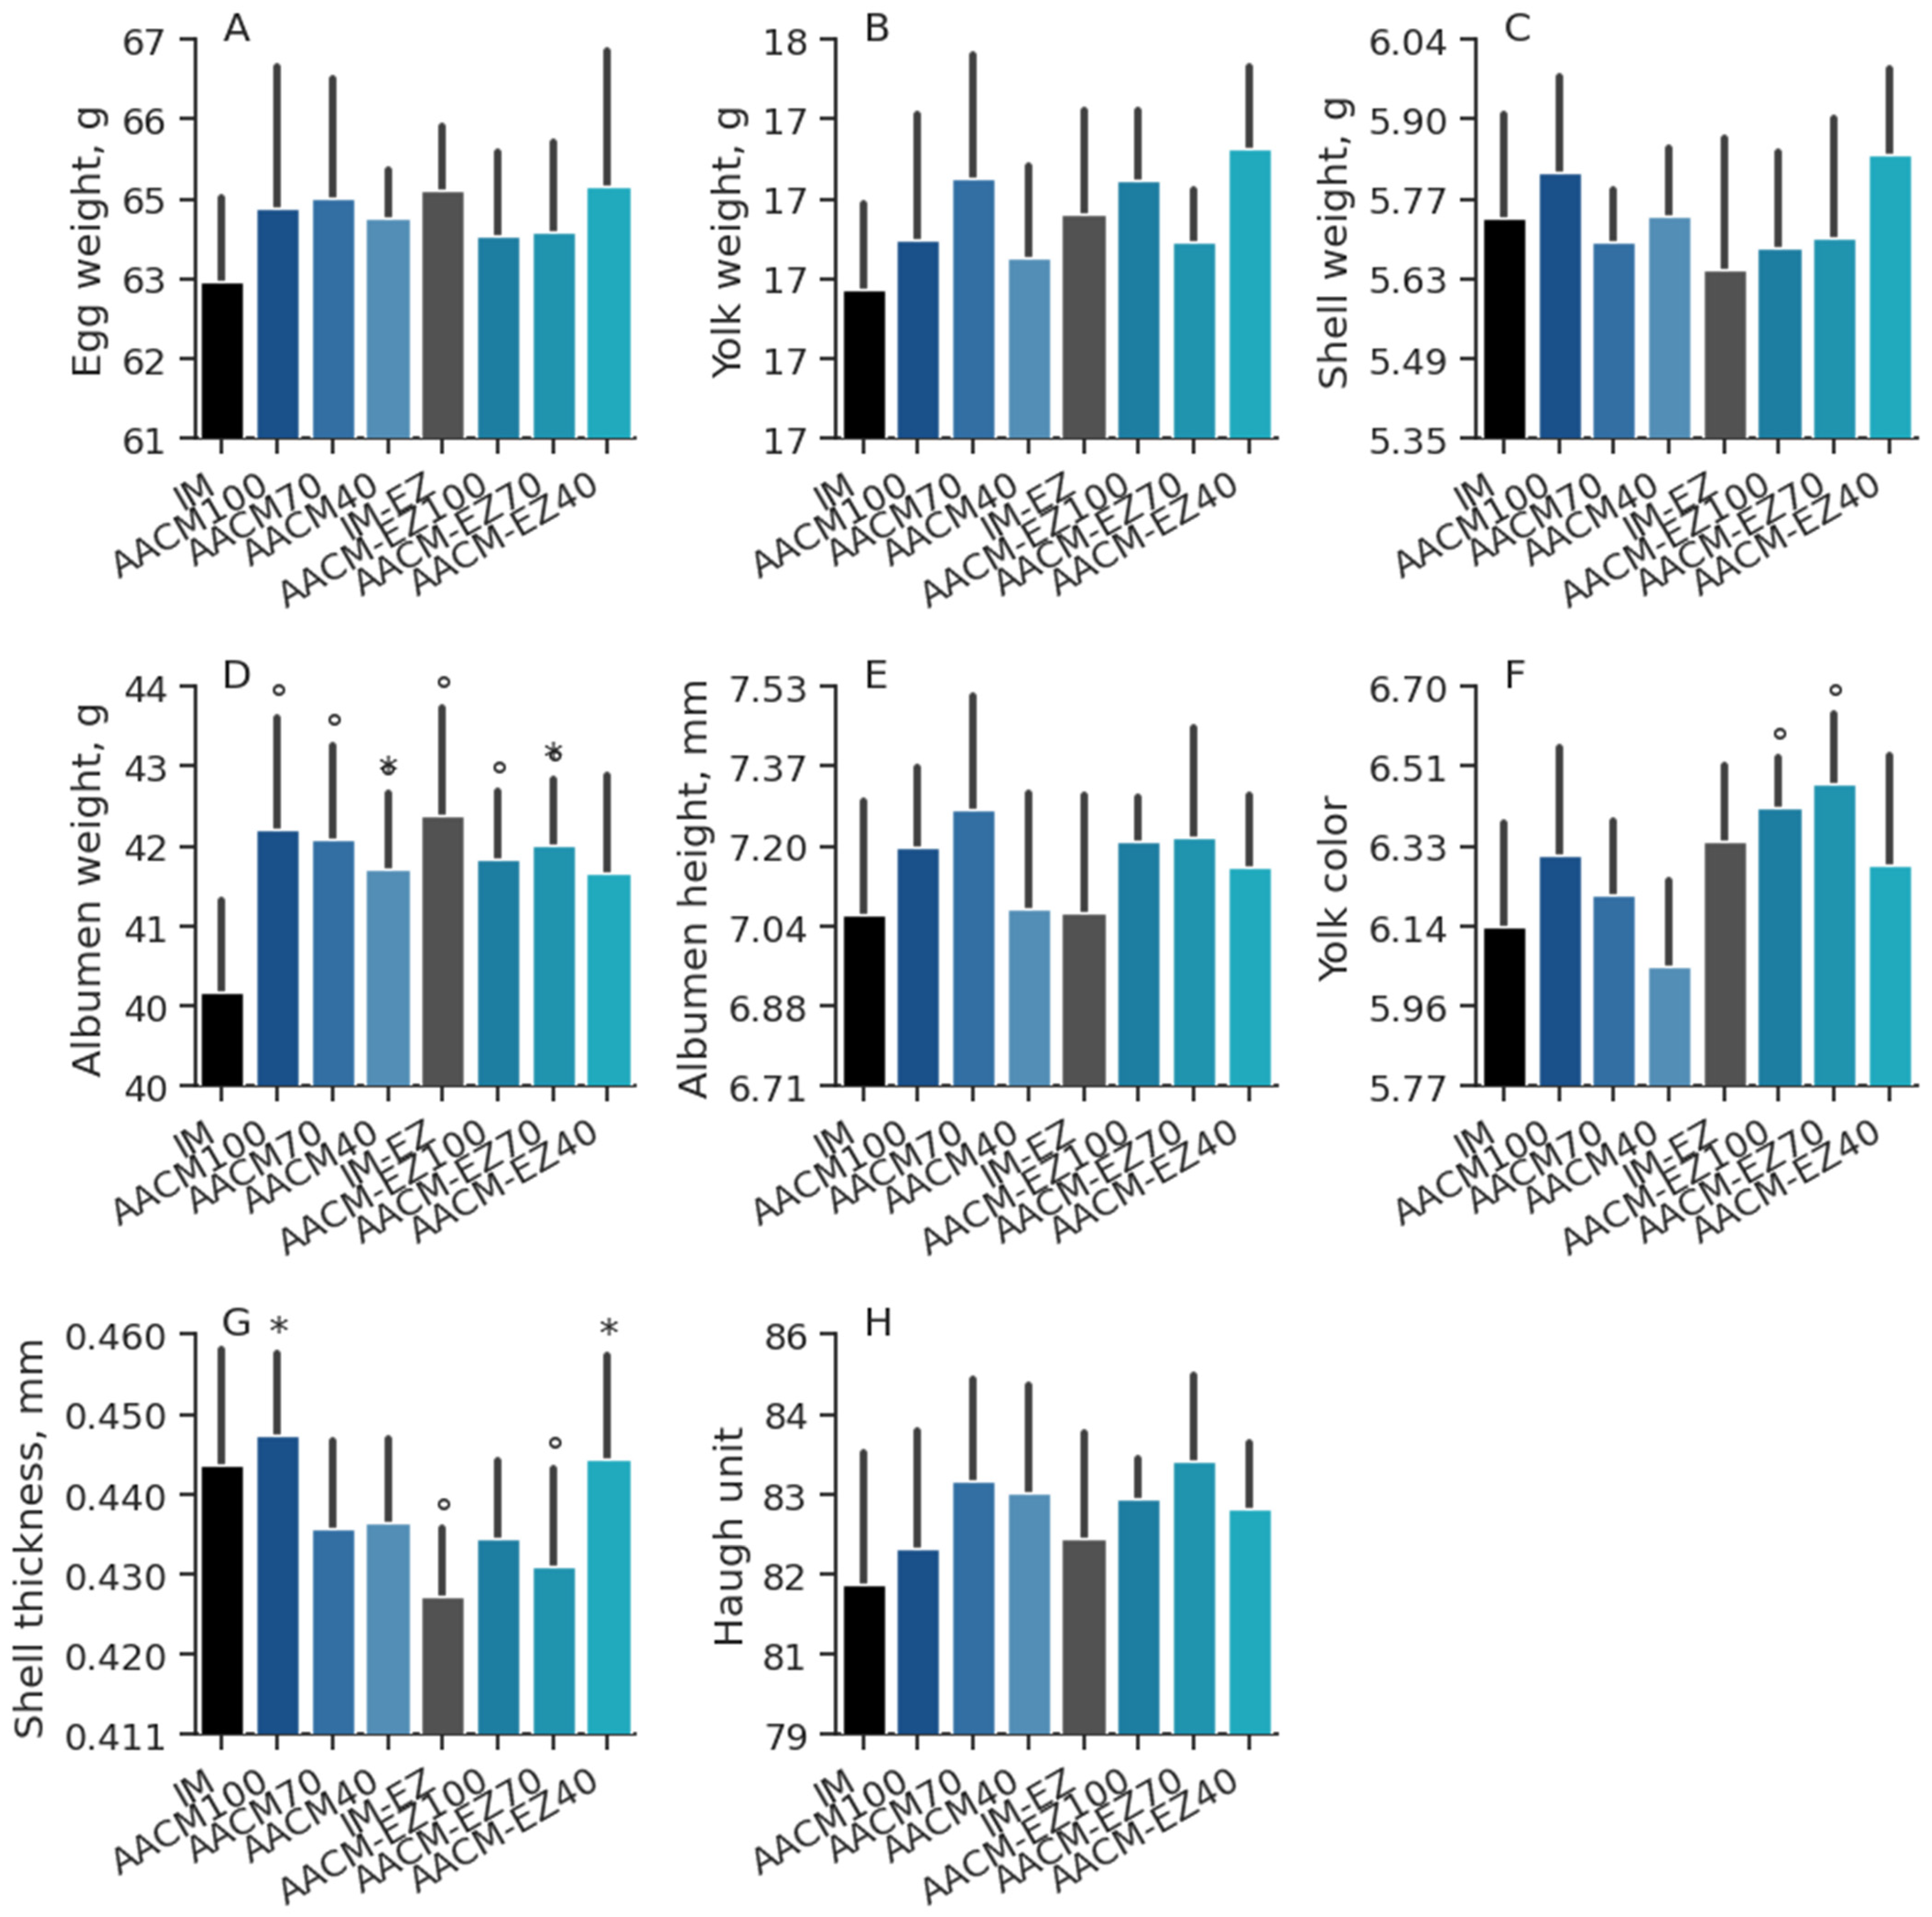
Figure 2.
Egg weight (A), yolk weight (B), shell weight (C), albumen weight (D), albumen height (E), yolk color (F), shell thickness (G), and Haugh unit (H) of laying hens from 68 to 90 weeks fed inorganic minerals (IM) and amino acid complex minerals (AACM) supplemented with or without the use of phytase (EZ). IM or IM-EZ: 60, 70, 8, 40, 0.250 mg kg−1 of Zn, Mn, Cu, Fe, I, and Se, respectively; AACM100 or AACM-EZ100: 60, 70, 8, 40, 0.250 mg kg−1 of Zn, Mn, Cu, Fe, I, and Se, respectively; AACM70 or AACM-EZ70: 42, 49, 6, 28, 0.175 mg kg−1 of Zn, Mn, Cu, Fe, I, and Se, respectively; AACM40 or AACM-EZ40: 24, 28, 3, 16, 0.100 mg kg−1 of Zn, Mn, Cu, Fe, I, and Se, respectively. Data were analyzed by Dunnett’s test (p < 0.05); ° Differs from IM treatment; * Differs from IM-EZ treatment.
Figure 3.
Liver (A), spleen (B), pancreas (C), oviduct (D), and intestine (E,F) of variables of laying hens from 68 to 90 weeks fed inorganic minerals (IM) and amino acid complex minerals (AACM) supplemented with or without the use of phytase (EZ). IM or IM-EZ: 60, 70, 8, 40, 0.250 mg kg−1 of Zn, Mn, Cu, Fe, I, and Se, respectively; AACM100 or AACM-EZ100: 60, 70, 8, 40, 0.250 mg kg−1 of Zn, Mn, Cu, Fe, I, and Se, respectively; AACM70 or AACM-EZ70: 42, 49, 6, 28, 0.175 mg kg−1 of Zn, Mn, Cu, Fe, I, and Se, respectively; AACM40 or AACM-EZ40: 24, 28, 3, 16, 0.100 mg kg−1 of Zn, Mn, Cu, Fe, I, and Se, respectively. Data were analyzed by Dunnett’s test (p < 0.05).
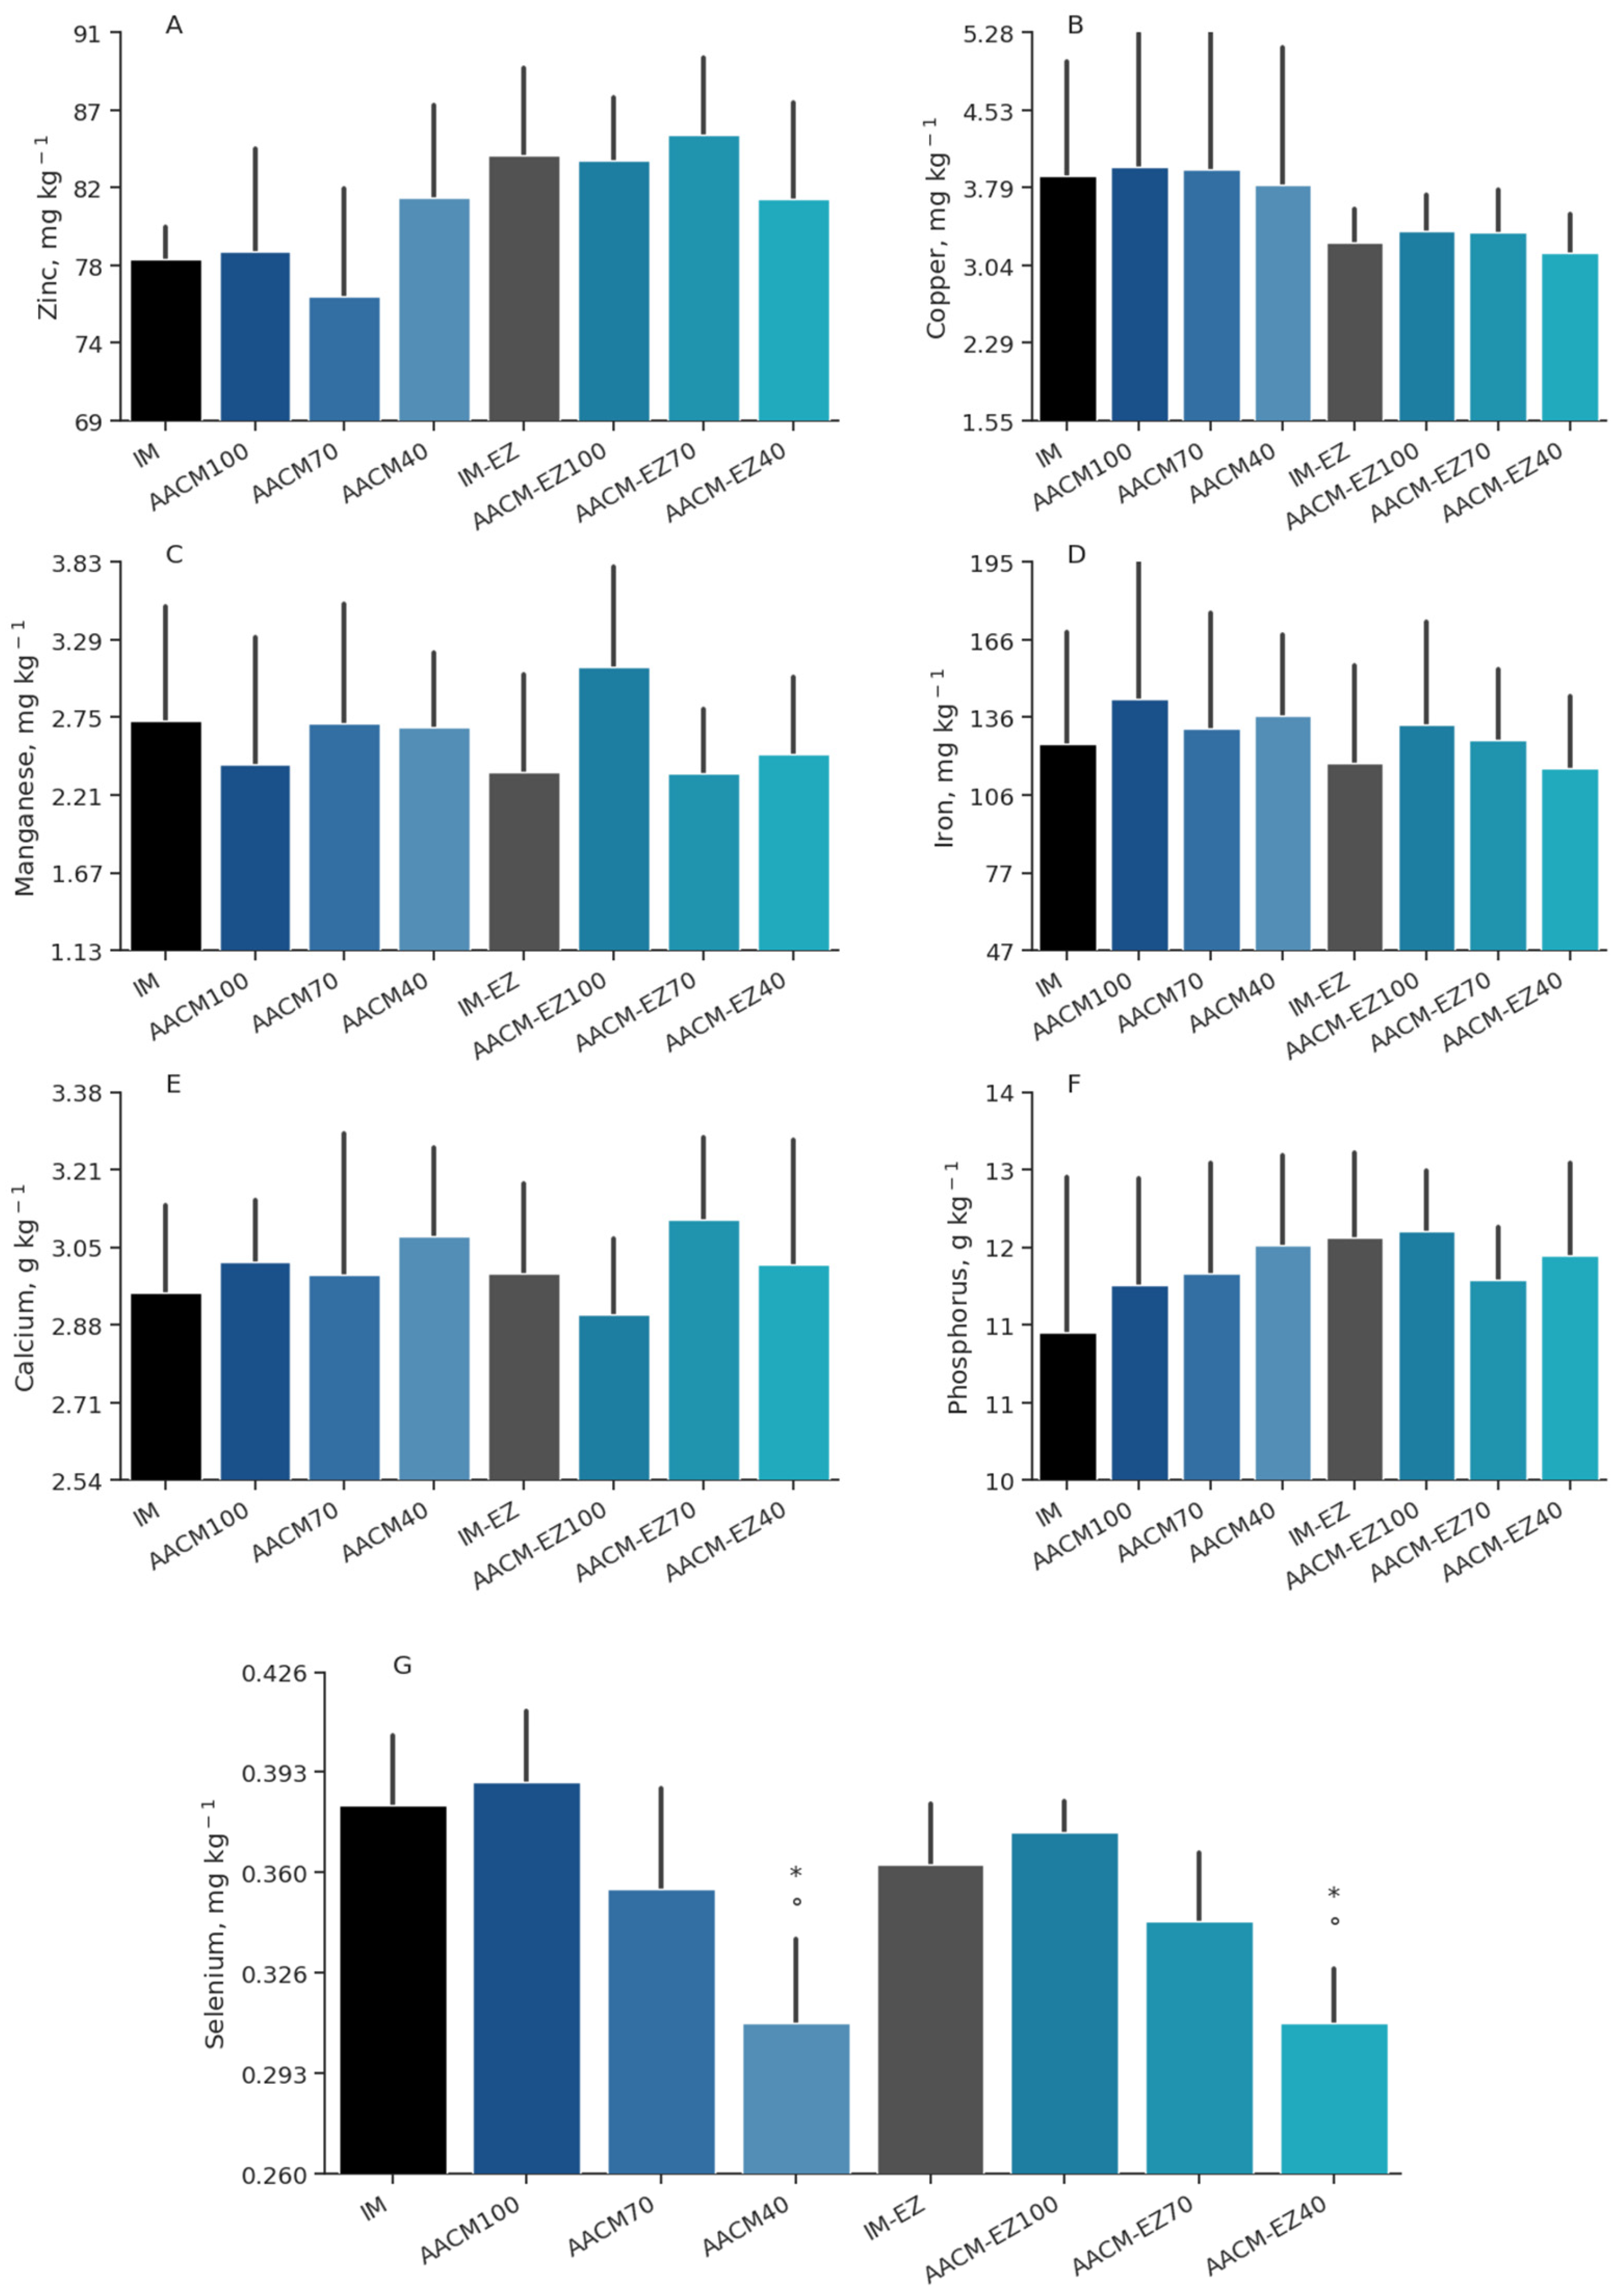
Figure 4.
Zinc (A), copper (B), manganese (C), iron (D), calcium (E), phosphorus (F), and selenium (G) deposition in egg yolk of laying hens from 68 to 90 weeks fed inorganic minerals (IM) and amino acid complex minerals (AACM) supplemented with or without the use of phytase (EZ). IM or IM-EZ: 60, 70, 8, 40, 0.250 mg kg−1 of Zn, Mn, Cu, Fe, I, and Se, respectively; AACM100 or AACM-EZ100: 60, 70, 8, 40, 0.250 mg kg−1 of Zn, Mn, Cu, Fe, I, and Se, respectively; AACM70 or AACM-EZ70: 42, 49, 6, 28, 0.175 mg kg−1 of Zn, Mn, Cu, Fe, I, and Se, respectively; AACM40 or AACM-EZ40: 24, 28, 3, 16, 0.100 mg kg−1 of Zn, Mn, Cu, Fe, I, and Se, respectively. Data were analyzed by Dunnett’s test (p < 0.05); ° Differs from IM treatment; * Differs from IM-EZ treatment.
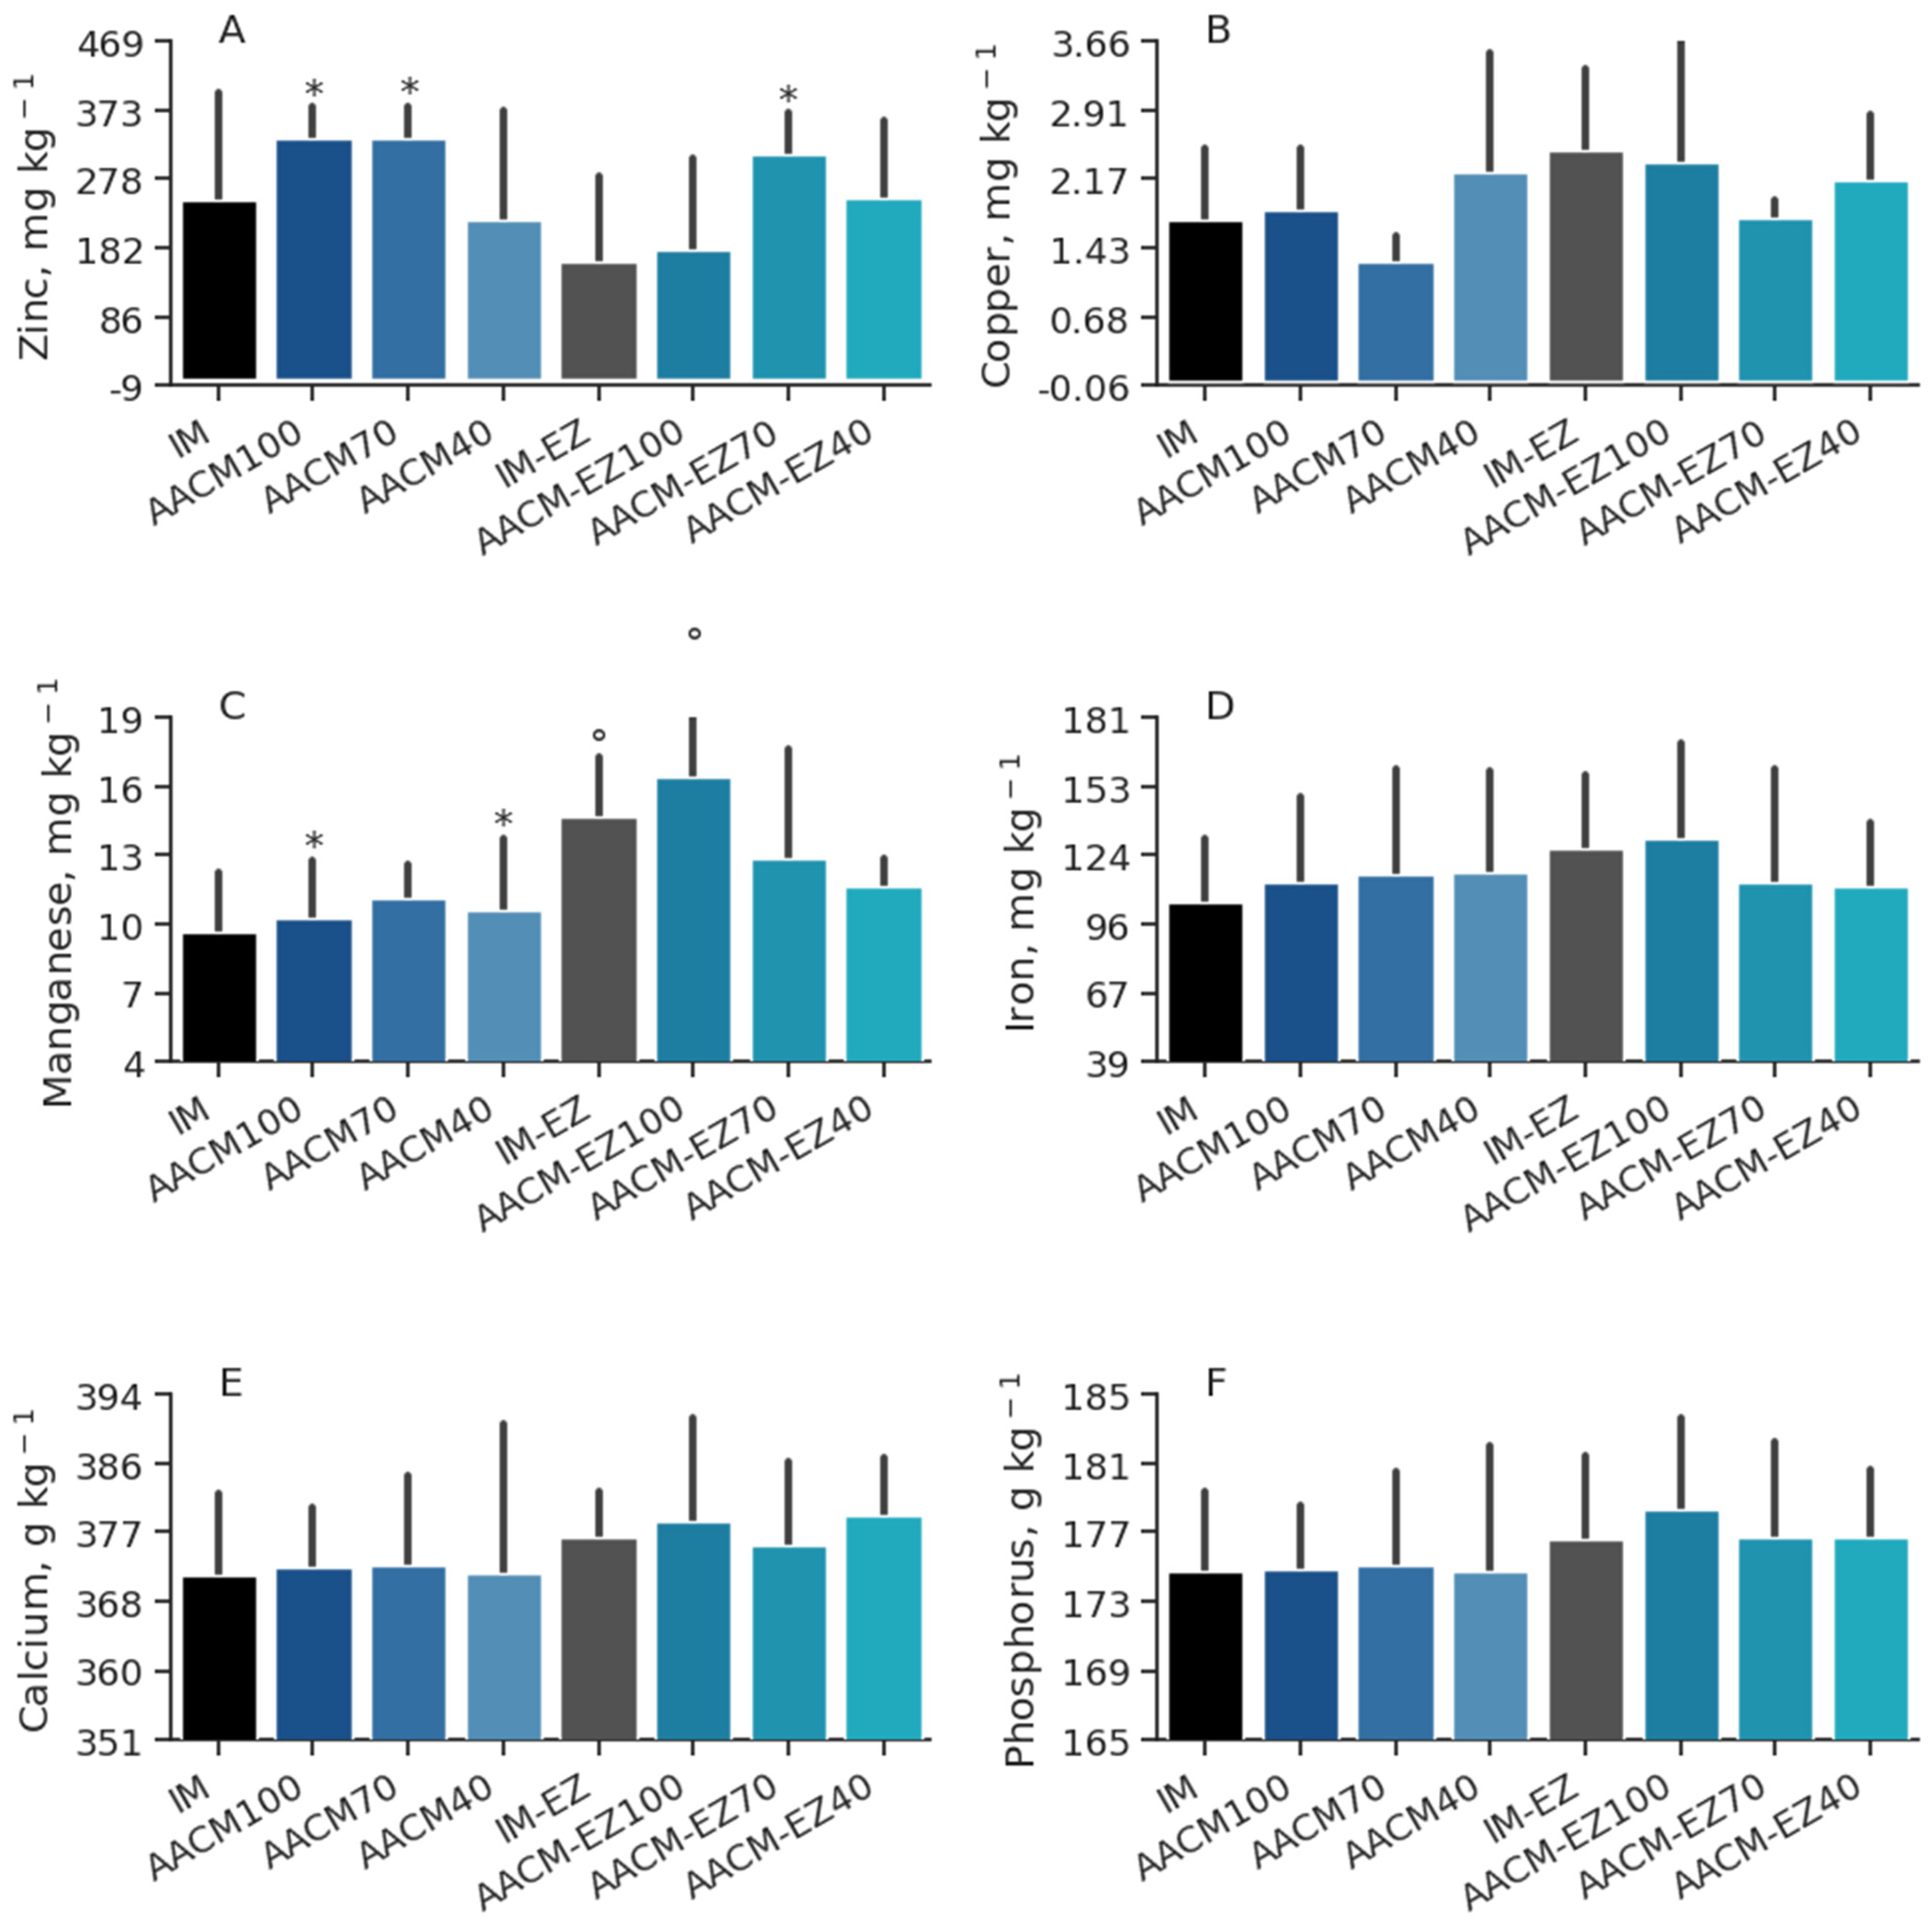
Figure 5.
Zinc (A), copper (B), manganese (C), iron (D), calcium (E), and phosphorus (F) deposition in tibia of laying hens from 68 to 90 weeks fed inorganic minerals (IM) and amino acid complex minerals (AACM) supplemented with or without the use of phytase (EZ). IM or IM-EZ: 60, 70, 8, 40, 0.250 mg kg−1 of Zn, Mn, Cu, Fe, I, and Se, respectively; AACM100 or AACM-EZ100: 60, 70, 8, 40, 0.250 mg kg−1 of Zn, Mn, Cu, Fe, I, and Se, respectively; AACM70 or AACM-EZ70: 42, 49, 6, 28, 0.175 mg kg−1 of Zn, Mn, Cu, Fe, I, and Se, respectively; AACM40 or AACM-EZ40: 24, 28, 3, 16, 0.100 mg kg−1 of Zn, Mn, Cu, Fe, I, and Se, respectively. Data were analyzed by Dunnett’s test (p < 0.05); ° Differs from IM treatment; * Differs from IM-EZ treatment.
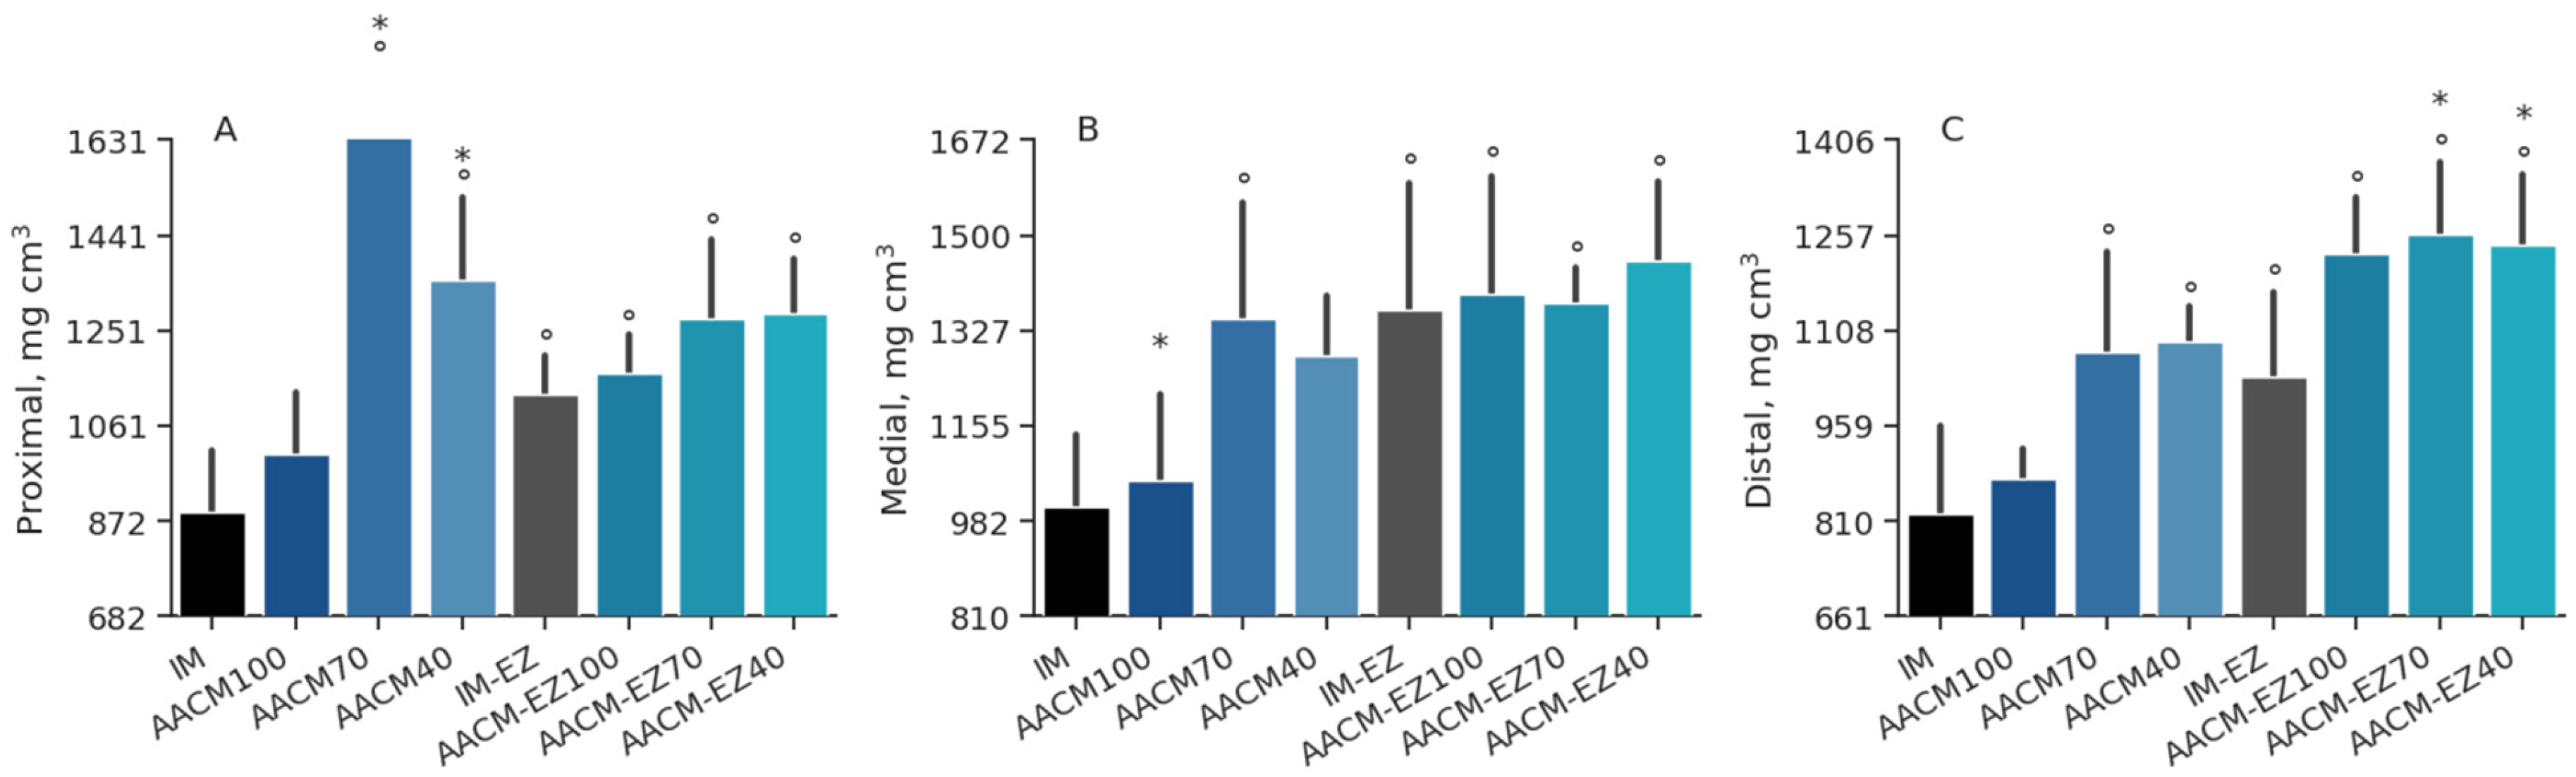
Figure 6.
Densitometry of the proximal (A), medial (B), and distal (C) segments of the tibia in laying hens aged 68 to 90 weeks, fed with inorganic minerals (IM) and amino acid complex minerals (AACM), supplemented with or without the use of phytase (EZ). IM or IM-EZ: 60, 70, 8, 40, 0.250 mg kg−1 of Zn, Mn, Cu, Fe, I, and Se, respectively; AACM100 or AACM-EZ100: 60, 70, 8, 40, 0.250 mg kg−1 of Zn, Mn, Cu, Fe, I, and Se, respectively; AACM70 or AACM-EZ70: 42, 49, 6, 28, 0.175 mg kg−1 of Zn, Mn, Cu, Fe, I, and Se, respectively; AACM40 or AACM-EZ40: 24, 28, 3, 16, 0.100 mg kg−1 of Zn, Mn, Cu, Fe, I, and Se, respectively. Data were analyzed by Dunnett’s test (p < 0.05); ° Differs from IM treatment; * Differs from IM-EZ treatment.
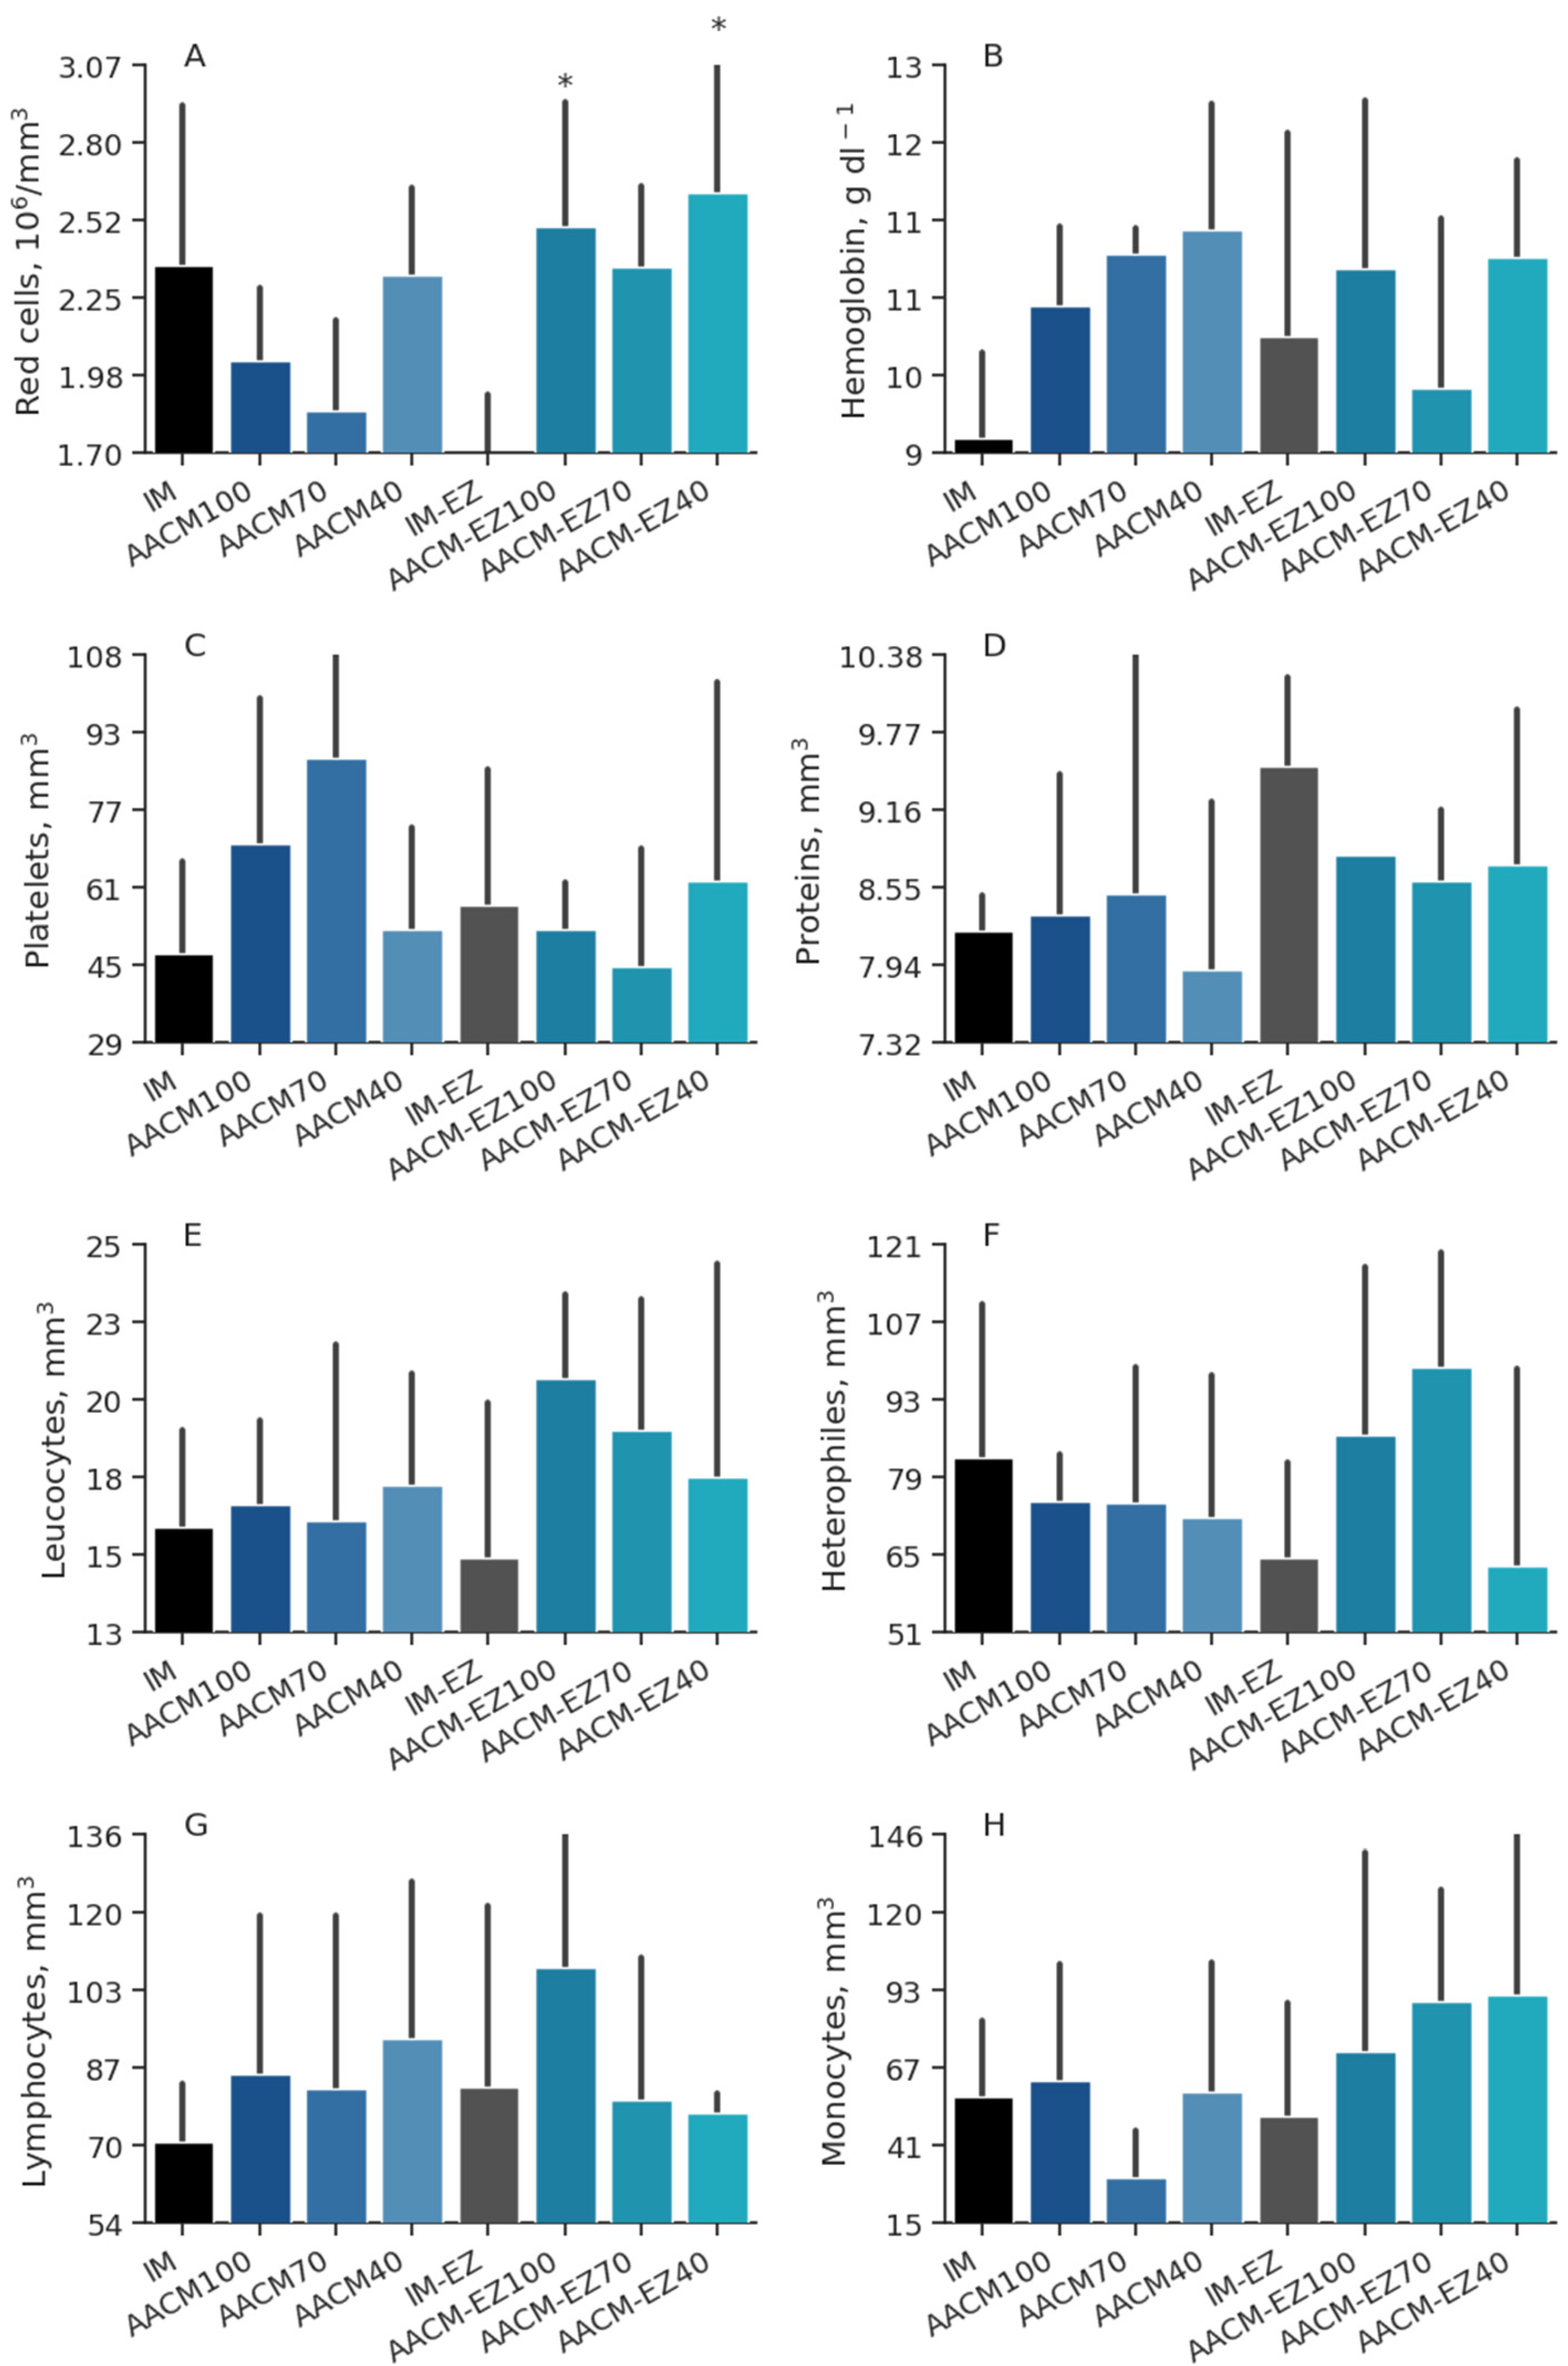
Figure 7.
Red cells (A), hemoglobin (B), platelets (C), proteins (D), leucocytes (E), heterophiles (F), lymphocytes (G), and monocytes (H) blood profiles of laying hens from 68 to 90 weeks fed inorganic minerals (IM) and amino acid complex minerals (AACM) supplemented with or without the use of phytase (EZ).IM or IM-EZ: 60, 70, 8, 40, 0.250 mg kg−1 of Zn, Mn, Cu, Fe, I, and Se, respectively; AACM100 or AACM-EZ100: 60, 70, 8, 40, 0.250 mg kg−1 of Zn, Mn, Cu, Fe, I, and Se, respectively; AACM70 or AACM-EZ70: 42, 49, 6, 28, 0.175 mg kg−1 of Zn, Mn, Cu, Fe, I, and Se, respectively; AACM40 or AACM-EZ40: 24, 28, 3, 16, 0.100 mg kg−1 of Zn, Mn, Cu, Fe, I, and Se, respectively. Data were analyzed by Dunnett’s test (p < 0.05); * Differs from IM-EZ treatment.
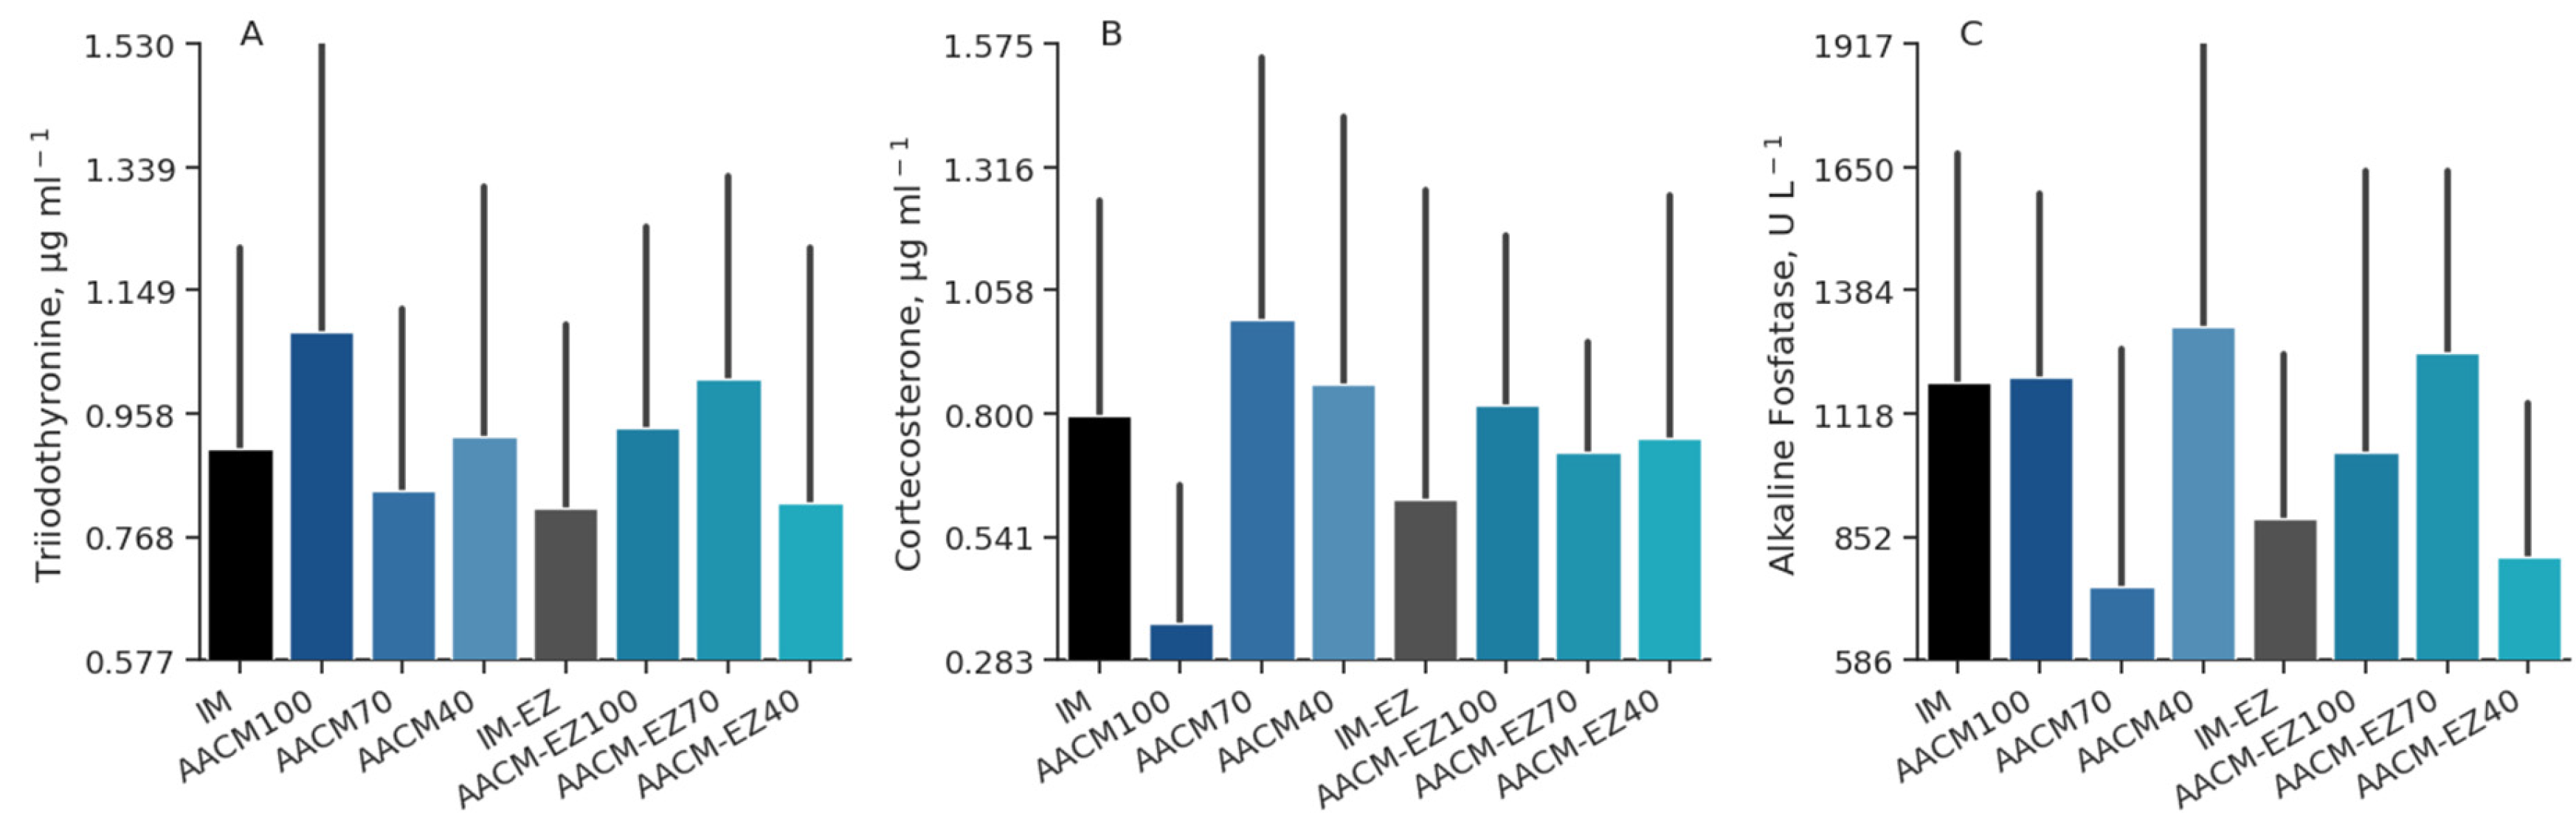
Figure 8.
Triiodothyronine (A), corticosterone (B), and alkaline fosfatase (C) profiles of laying hens from 68 to 90 weeks fed inorganic minerals (IM) and amino acid complex minerals (AACM) supplemented with or without the use of phytase (EZ). IM or IM-EZ: 60, 70, 8, 40, 0.250 mg kg−1 of Zn, Mn, Cu, Fe, I, and Se, respectively; AACM100 or AACM-EZ100: 60, 70, 8, 40, 0.250 mg kg−1 of Zn, Mn, Cu, Fe, I, and Se, respectively; AACM70 or AACM-EZ70: 42, 49, 6, 28, 0.175 mg kg−1 of Zn, Mn, Cu, Fe, I, and Se, respectively; AACM40 or AACM-EZ40: 24, 28, 3, 16, 0.100 mg kg−1 of Zn, Mn, Cu, Fe, I, and Se, respectively. Data were analyzed by Dunnett’s test (p < 0.05).
Table 1.
Composition of experimental diets.
Table 1.
Composition of experimental diets.
| Ingredients, % | Without Phytase | With Phytase |
|---|
| Corn | 58.756 | 58.756 |
| Soybean meal, 46% CP | 23.809 | 23.809 |
| Soy oil | 2.763 | 2.763 |
| Calcitic limestone | 10.538 | 10.654 |
| Dicalcium phosphate | 1.054 | 0.000 |
| Meat and bone meal, 44% | 1.580 | 1.580 |
| Sodium bicarbonate | 0.050 | 0.050 |
| Salt | 0.345 | 0.345 |
| DL-Methionine, 99% | 0.234 | 0.234 |
| L-Lysine-HCl | 0.140 | 0.140 |
| L-Threonine | 0.068 | 0.068 |
| Adsorbent 1 | 0.100 | 0.100 |
| Probiotic 2 | 0.050 | 0.050 |
| Phytase 3 | 0.000 | 0.006 |
| Vitamin Premix 4 | 0.100 | 0.100 |
| Mineral Premix 5 | 0.285 | 0.285 |
| Inert 6 | 0.121 | 1.054 |
| Total | 100.00 | 100.00 |
| Nutritional composition | | |
| Metabolizable energy, kcal kg−1 | 2820 | 2820 |
| Dry matter 7, % | 90.02 | 90.05 |
| Crude protein, % | 16.40 | 16.40 |
| Crude protein 7, % | 16.25 | 16.21 |
| Ash, % | 15.44 | 15.05 |
| Digestible Methionine, % | 0.45 | 0.45 |
| Digestible Methionine + Cystine, % | 0.68 | 0.68 |
| Digestible Lysine, % | 0.86 | 0.86 |
| Digestible Threonine, % | 0.61 | 0.61 |
| Digestible Tryptophan, % | 0.17 | 0.17 |
| Calcium, % | 4.50 | 4.50 |
| Calcium 7, % | 4.57 | 4.49 |
| Total Phophorus 7, % | 0.65 | 0.48 |
| Available Phosphorus, % | 0.37 | 0.37 |
| Sodium, % | 0.18 | 0.18 |
| Chlorine, % | 0.27 | 0.27 |
| Potassium, % | 0.60 | 0.60 |
| Crude Fat, % | 5.49 | 5.49 |
Table 2.
Concentration of zinc (Zn), manganese (Mn), iron (Fe), copper (Cu), and selenium (Se) in calculated and analyzed diets, experimental premixes, and water.
Table 2.
Concentration of zinc (Zn), manganese (Mn), iron (Fe), copper (Cu), and selenium (Se) in calculated and analyzed diets, experimental premixes, and water.
| | Calculated | |
|---|
| DIETS * | Zn | Mn | Fe | Cu | Se |
| (mg kg−1) |
| IM | 60 | 70 | 40 | 8 | 0.250 |
| AACM-100 | 60 | 70 | 40 | 8 | 0.250 |
| AACM-70 | 42 | 49 | 28 | 5.6 | 0.175 |
| AACM-40 | 24 | 28 | 16 | 3.2 | 0.100 |
| | Diets analyzed * | |
| IM | 71.6 | 73.3 | 288.9 | 11.1 | 0.320 |
| AACM-100 | 73.4 | 76.3 | 265.0 | 10.6 | 0.313 |
| AACM-70 | 58.3 | 53.3 | 249.5 | 7.95 | 0.286 |
| AACM-40 | 39.3 | 36.4 | 218.4 | 4.65 | 0.220 |
| IM-EZ | 73.0 | 71.7 | 289.5 | 9.82 | 0.318 |
| AACM-EZ-100 | 77.3 | 77.5 | 307.0 | 11.45 | 0.329 |
| AACM-EZ-70 | 52.6 | 54.2 | 267.9 | 7.15 | 0.282 |
| AACM-EZ-40 | 39.8 | 39.2 | 239.3 | 5.2 | 0.240 |
| | Premixes analyzed * | |
| IM | 61.8 | 68.0 | 46.6 | 7.4 | 0.265 |
| AACM-100 | 62.1 | 71.1 | 44.4 | 7.6 | 0.255 |
| AACM-70 | 42.3 | 48.2 | 33.6 | 5.5 | 0.180 |
| AACM-40 | 26.8 | 27.4 | 26.6 | 3.0 | 0.080 |
| WATER * | 0.18 | 1.00 | 0.00 | 0.03 | 0.085 |
Table 3.
Performance of laying hens from 68 to 90 weeks, supplemented with amino acid mineral complexes (AACM), with or without the use of phytase.
Table 3.
Performance of laying hens from 68 to 90 weeks, supplemented with amino acid mineral complexes (AACM), with or without the use of phytase.
| Enzyme | Level | EW | EO | EM | ADFI | FCR |
|---|
| | | (g) | (%) | (g bird−1) | (kg kg−1) |
| AACM | - | 64.95 | 92.53 | 60.09 | 103.21 | 1.717 |
| AACM + Phytase | - | 64.73 | 92.83 | 59.98 | 103.43 | 1.715 |
| - | 100 | 64.68 | 92.16 | 59.61 | 103.02 | 1.73 |
| - | 70 | 64.88 | 92.97 | 60.41 | 103.65 | 1.711 |
| - | 40 | 64.97 | 92.90 | 60.10 | 103.27 | 1.706 |
| p-value | | | | | | |
| Enzyme | | 0.581 | 0.583 | 0.887 | 0.367 | 0.828 |
| Level | | 0.832 | 0.416 | 0.297 | 0.107 | 0.134 |
| Enzyme × Level | | 0.363 | 0.023 | 0.101 | 0.041 | 0.030 |
| SEM | | 0.192 | 0.29 | 0.222 | 0.12 | 0.007 |
| | | Interaction |
| Variables | | Levels |
| Egg output | | 100 | 70 | 40 |
| AACM | | 92.06 Aa | 91.83 Ba | 93.68 Aa |
| AACM + Phytase | | 92.26 Aa | 94.11 Aa | 92.12 Aa |
| ADFI | | | |
| AACM | | 102.64 Bb | 103.89 Aa | 103.16 Aab |
| AACM + Phytase | | 103.52 Aa | 103.40 Aa | 103.37 Aa |
| FCR | | | |
| AACM | | 1.721 Aa | 1.730 Aa | 1.703 Aa |
| AACM + Phytase | | 1.759 Aa | 1.688 Ab | 1.710 Aab |
Table 4.
Quality of eggs of laying hens from 68 to 90 weeks, supplemented with amino acid mineral complexes (AACM), with or without the use of phytase.
Table 4.
Quality of eggs of laying hens from 68 to 90 weeks, supplemented with amino acid mineral complexes (AACM), with or without the use of phytase.
| Enzyme | Level | EW | YW | SW | AW | AH | ST | YC | HU |
|---|
| | | (g) | (mm) | (score) | |
| AACM | - | 64.27 | 17.02 B | 5.78 | 41.96 | 7.19 | 0.441 | 6.16 B | 82.98 |
| AACM + Phytase | - | 64.27 | 17.19 A | 5.74 | 41.93 | 7.20 | 0.435 | 6.37 A | 83.27 |
| - | 100 | 63.99 | 17.05 | 5.73 | 41.56 | 7.14 | 0.441 | 6.36 A | 82.72 |
| - | 70 | 64.31 | 17.13 | 5.74 | 41.99 | 7.25 | 0.435 | 6.30 AB | 83.57 |
| - | 40 | 64.48 | 17.14 | 5.79 | 41.86 | 7.12 | 0.438 | 6.16 B | 83.08 |
| p-value | | | | | | | | | |
| Enzyme | | 0.987 | 0.01 | 0.497 | 0.88 | 0.814 | 0.111 | < 0.01 | 0.504 |
| Levels | | 0.631 | 0.559 | 0.718 | 0.899 | 0.148 | 0.453 | 0.054 | 0.274 |
| Enzyme × Levels | | 0.678 | 0.001 | 0.155 | 0.679 | 0.576 | 0.136 | 0.336 | 0.601 |
| SEM | | 0.168 | 0.034 | 0.023 | 0.132 | 0.026 | 0.002 | 0.034 | 0.211 |
| | | Interaction |
| Variables | | Levels |
| Yolk weight, g | | 100 | 70 | 40 |
| AACM | | 16.908 Bb | 17.229 Aa | 16.945 Bb |
| AACM + Phytase | | 17.177 Aab | 17.051 Ab | 17.311 Aa |
Table 5.
Organ weight and intestine length of laying hens from 68 to 90 weeks, supplemented with amino acid mineral complexes (AACM), with or without the use of phytase.
Table 5.
Organ weight and intestine length of laying hens from 68 to 90 weeks, supplemented with amino acid mineral complexes (AACM), with or without the use of phytase.
| Enzyme | Level | Liver | Spleen | Pancreas | Intestine | Oviduct | Intestine |
|---|
| | | (g) | (m) |
| AACM | - | 41.05 | 1.38 | 3.52 A | 63.66 | 69.11 | 1.37 |
| AACM + Phytase | - | 41.02 | 1.37 | 3.14 B | 64.62 | 65.88 | 1.37 |
| - | 100 | 40.01 | 1.33 | 3.24 | 61.86 | 66.70 | 1.31 |
| - | 70 | 42.98 | 1.48 | 3.58 | 65.31 | 68.64 | 1.41 |
| - | 40 | 39.98 | 1.30 | 3.17 | 65.25 | 66.45 | 1.36 |
| p-value | | | | | | | |
| Enzyme | | 0.979 | 0.991 | 0.024 | 0.746 | 0.064 | 0.989 |
| Level | | 0.225 | 0.269 | 0.098 | 0.405 | 0.452 | 0.234 |
| Enzyme × Level | | 0.990 | 0.465 | 0.533 | 0.401 | 0.575 | 0.723 |
| SEM | | 0.793 | 0.047 | 0.083 | 1.184 | 0.889 | 0.015 |
Table 6.
Trace mineral deposition in the tibia and egg yolk of laying hens from 68 to 90 weeks, supplemented with amino acid mineral complexes (AACM), with or without the use of phytase.
Table 6.
Trace mineral deposition in the tibia and egg yolk of laying hens from 68 to 90 weeks, supplemented with amino acid mineral complexes (AACM), with or without the use of phytase.
| | | Yolk |
|---|
| Enzyme | Level | Zinc | Copper | Manganese | Iron | Calcium | Phosphorus | Selenium |
|---|
| | | | | (mg kg−1) | | (g kg−1) | (mg kg−1) |
| AACM | - | 78.71 B | 3.92 | 2.63 | 136.75 | 3.02 | 12.01 | 0.35 |
| AACM + Phyase | - | 84.03 A | 3.41 | 2.66 | 125.54 | 3.01 | 12.12 | 0.34 |
| - | 100 | 82.49 | 3.86 | 2.82 | 137.9 | 2.96 | 12.11 | 0.38 A |
| - | 70 | 80.34 | 3.68 | 2.55 | 129.91 | 3.04 | 11.91 | 0.35 B |
| - | 40 | 81.6 | 3.47 | 2.58 | 126.16 | 3.04 | 12.16 | 0.31 C |
| p-value | | | | | | | | |
| Enzyme | | 0.003 | 0.464 | 0.837 | 0.542 | 0.778 | 0.649 | 0.358 |
| Levels | | 0.746 | 0.571 | 0.678 | 0.903 | 0.541 | 0.705 | <0.001 |
| Enzyme × Level | | 0.074 | 0.882 | 0.135 | 0.674 | 0.362 | 0.584 | 0.789 |
| SEM | | 2.481 | 0.203 | 0.186 | 12.411 | 0.025 | 0.247 | 0.007 |
| | | Tibia |
| AACM | - | 272.5 | 1.79 | 10.89 B | 115.69 | 372.48 | 175.08 | - |
| AACM+Phyase | - | 248.44 | 2.08 | 13.79 A | 119.19 | 377.58 | 177.48 | - |
| - | 100 | 237.83 | 2.08 | 13.51 | 122.54 | 375.42 | 176.8 | - |
| - | 70 | 304.17 | 1.53 | 12.25 | 115.07 | 374.18 | 176.06 | - |
| - | 40 | 237.21 | 2.2 | 11.38 | 114.36 | 375.7 | 176.03 | - |
| p-value | | | | | | | | |
| Enzyme | | 0.377 | 0.225 | 0.011 | 0.738 | 0.139 | 0.137 | - |
| Levels | | 0.164 | 0.267 | 0.433 | 0.754 | 0.940 | 0.896 | - |
| Enzyme × Level | | 0.152 | 0.477 | 0.139 | 0.682 | 0.853 | 0.874 | - |
| SEM | | 17.26 | 0.14 | 0.55 | 5.54 | 1.66 | 0.77 | - |
Table 7.
Bone densitometry of laying hens from 68 to 90 weeks, supplemented with amino acid mineral complexes (AACM), with or without the use of phytase.
Table 7.
Bone densitometry of laying hens from 68 to 90 weeks, supplemented with amino acid mineral complexes (AACM), with or without the use of phytase.
| Treatment | Level | Proximal * | Medial * | Distal * |
|---|
| AACM | - | 1324 | 1232 | 1031 |
| AACM + Phyase | - | 1158 | 1374 | 1195 |
| - | 100 | 1183 | 1249 | 1057 |
| - | 70 | 1298 | 1269 | 1092 |
| - | 40 | 1244 | 1382 | 1174 |
| | p-value |
| Enzyme | | 0.042 | 0.015 | 0.001 |
| Level | | 0.485 | 0.178 | 0.160 |
| Enzyme × Level | | 0.019 | 0.001 | 0.038 |
| SEM | | 45.25 | 37.29 | 28.83 |
| | Interaction |
| Variables | Levels |
| Proximal | | 100 | 70 | 40 |
| AACM | | 1107 Ab | 1509 Aa | 1359 Aab |
| AACM + Phytase | | 1259 Aa | 1088 Ba | 1128 Aa |
| Medial | | | | |
| AACM | | 1062 Bb | 1359 Aa | 1300 Aa |
| AACM+Phytase | | 1482 Aa | 1196 Ab | 1464 Aa |
| Distal | | | | |
| AACM | | 913 Bb | 1080 Aab | 1099 Aa |
| AACM + Phytase | | 1236 Aa | 1107 Aa | 1250 Aa |
Table 8.
Hematological, hormone, and alkaline phosphatase activity of laying hens from 68 to 90 weeks, supplemented with amino acid mineral complexes (AACM), with or without the use of phytase.
Table 8.
Hematological, hormone, and alkaline phosphatase activity of laying hens from 68 to 90 weeks, supplemented with amino acid mineral complexes (AACM), with or without the use of phytase.
| Enzyme | Level | Red Cells | Hematocrit | Hemoglobin | TP | Platelets * | Leukocytes * | Heterophiles ** | Lymphocytes ** | Monocytes * | T3 | Corticosterone | AP |
|---|
| | | (106/mm3) | (%) | (g dL−1) | (mm3) | μg mL−1 | U L−1 |
| AACM | - | 2.06 B | 32.66 | 11.00 | 8.17 | 7.00 | 16.97 | 7.39 | 8.69 | 5.11 | 0.95 | 1.01 | 1513 |
| AACM + Phytase | - | 2.48 A | 31.58 | 10.59 | 8.70 | 5.33 | 19.31 | 8.49 | 8.83 | 8.48 | 0.92 | 0.76 | 1281 |
| - | 100 | 2.26 | 32.00 | 10.76 | 8.45 | 6.13 | 18.90 | 8.09 | 9.68 | 6.82 | 1.01 | 0.59 | 2762 |
| - | 70 | 2.06 | 31.00 | 10.42 | 8.55 | 6.63 | 17.84 | 8.69 | 8.11 | 6.01 | 0.93 | 1.20 | 3075 |
| - | 40 | 2.43 | 33.37 | 11.21 | 8.25 | 5.75 | 17.68 | 6.83 | 8.50 | 7.57 | 0.87 | 0.80 | 3046 |
| p-value | | | | | | | | | | | | | |
| Enzyme | | 0.010 | 0.485 | 0.419 | 0.550 | 0.163 | 0.210 | 0.390 | 0.684 | 0.191 | 0.836 | 0.569 | 0.575 |
| Level | | 0.162 | 0.457 | 0.456 | 0.940 | 0.824 | 0.835 | 0.342 | 0.479 | 0.947 | 0.519 | 0.120 | 0.787 |
| Enzyme × Level | | 0.845 | 0.491 | 0.389 | 0.910 | 0.202 | 0.696 | 0.447 | 0.558 | 0.446 | 0.414 | 0.084 | 0.225 |
| SEM | | 0.096 | 0.736 | 0.248 | 0.280 | 5.856 | 0.733 | 4.972 | 0.505 | 0.797 | 0.051 | 0.012 | 2.0 |

 ,
, 


