Article

Genotyping-by-Sequencing Strategy for Integrating Genomic Structure, Diversity and Performance of Various Japanese Quail (Coturnix japonica) Breeds

by
Natalia A. Volkova
1,†,
Michael N. Romanov
1,2,*,†,
Alexandra S. Abdelmanova
1,
Polina V. Larionova
1,
Nadezhda Yu. German
1,
Anastasia N. Vetokh
1,
Alexey V. Shakhin
1,
Ludmila A. Volkova
1,
Dmitry V. Anshakov
3,
Vladimir I. Fisinin
4,
Valeriy G. Narushin
5,6,
Darren K. Griffin
2,
Johann Sölkner
7,
Gottfried Brem
8,
John C. McEwan
9,
Rudiger Brauning
9 and
Natalia A. Zinovieva
1,*
1
L. K. Ernst Federal Research Center for Animal Husbandry, Dubrovitsy, Podolsk 142132, Moscow Oblast, Russia
2
School of Biosciences, University of Kent, Canterbury, Kent CT2 7NJ, UK
3
Breeding and Genetic Center Zagorsk Experimental Breeding Farm—Branch of the Federal Research Centre, All-Russian Poultry Research and Technological Institute, Russian Academy of Sciences, Sergiev Posad 141311, Moscow Oblast, Russia
4
Federal Research Center “All-Russian Poultry Research and Technological Institute” of the Russian Academy of Sciences, Sergiev Posad 141311, Moscow Oblast, Russia
5
Research Institute for Environment Treatment, 69032 Zaporizhya, Ukraine
6
Vita-Market Co., Ltd., 69032 Zaporizhya, Ukraine
7
Institute of Livestock Sciences (NUWI), University of Natural Resources and Life Sciences Vienna, 1180 Vienna, Austria
8
Institute of Animal Breeding and Genetics, University of Veterinary Medicine, 1210 Vienna, Austria
9
AgResearch, Invermay Agricultural Centre, Mosgiel 9053, New Zealand
*
Authors to whom correspondence should be addressed.
These authors contributed equally to this work.
Animals 2023, 13(22), 3439; https://doi.org/10.3390/ani13223439
Submission received: 28 September 2023 / Revised: 23 October 2023 / Accepted: 6 November 2023 / Published: 7 November 2023
(This article belongs to the Special Issue New Tools for Monitoring Genetic Diversity in Animals)

Abstract

:

Simple Summary

Artificial selection has been applied to domesticated birds for many decades. More recently, this selection has made use of so-called single-nucleotide polymorphism (SNP) markers—simple variants in a DNA sequence. These SNPs can be used for whole-genome screening to detect the unique traces of areas of the genome that are subject to selection. Doing this may help to shed light on the evolutionary and family history (phylogeny) of domestic Japanese quails of different breeds and utility types (e.g., egg, meat or dual-purpose breeds). In this study, 99 birds were used, representing eight breeds (11% of the world’s quail gene pool) and various purposes of use to gather genetic (whole-genome) data in the first-ever analysis of its kind performed on domestic quails. We thereby uncovered evolutionary relationships and points of divergence of individual quail breeds, gleaning important insights into the genetic diversity of domestic quail breeds and their future breeding potential.

Abstract

Traces of long-term artificial selection can be detected in genomes of domesticated birds via whole-genome screening using single-nucleotide polymorphism (SNP) markers. This study thus examined putative genomic regions under selection that are relevant to the development history, divergence and phylogeny among Japanese quails of various breeds and utility types. We sampled 99 birds from eight breeds (11% of the global gene pool) of egg (Japanese, English White, English Black, Tuxedo and Manchurian Golden), meat (Texas White and Pharaoh) and dual-purpose (Estonian) types. The genotyping-by-sequencing analysis was performed for the first time in domestic quails, providing 62,935 SNPs. Using principal component analysis, Neighbor-Net and Admixture algorithms, the studied breeds were characterized according to their genomic architecture, ancestry and direction of selective breeding. Japanese and Pharaoh breeds had the smallest number and length of homozygous segments indicating a lower selective pressure. Tuxedo and Texas White breeds showed the highest values of these indicators and genomic inbreeding suggesting a greater homozygosity. We revealed evidence for the integration of genomic and performance data, and our findings are applicable for elucidating the history of creation and genomic variability in quail breeds that, in turn, will be useful for future breeding improvement strategies.

1. Introduction

The study of molecular genetic principles that determine the degree of manifestation of economically significant traits is of crucial importance for increasing agricultural. In so doing, it can be applied to produce the most effective and cost-efficient agricultural products for domestic and world consumption. The poultry industry is one of the key sectors of agricultural production, and its important products are meat and eggs. Poultry meat accounts for 45% of the total global meat production [1] and virtually all egg production. In Russia, the growing market demand for poultry products led, by 2020, to an elevation from 4 to 10% in the share of food products from non-traditional poultry species [2]. An increasing proportion of the world’s egg and meat supply are provided from species of the Phasianidae (pheasant) family [3,4]. Hereby, quail breeding industry products are in special demand worldwide because of the palatability of quail eggs and meat, as well as the early onset of sexual maturity. Because of this, the establishment and growth of large quail farms mean that quail eggs and meat are becoming everyday products [3,4,5,6,7].
The progenitor of contemporary quail breeds, the Japanese quail (Coturnix japonica Temminck & Schlegel, 1848), is a migratory bird native to East Asia. Domesticated Japanese quail are a common poultry type used for meat and eggs in Europe, Asia and throughout the world. Quails have been used in genetic research since 1940 [8] and, over time, they have become an increasingly important biological model for developmental, behavioral and biomedical studies [3,4]. Belonging to the same Phasianidae family as chickens, quails have a number of advantages as a research model. They are small, fast growing, and have a short life cycle, reaching sexual maturity in 7–8 weeks after hatching [9]. In comparative biological studies of galliforms, quails show key differences from chickens and some other poultry species, e.g., immune status, migratory and seasonal behavior [3].
Worldwide, there are about 70 domestic Japanese quail breeds or strains, including commercial and laboratory quails [10]. The first Japanese quails were imported into Russia in 1964 for breeding and production purposes. The adult quail population in the former USSR grew steadily year after year, peaking at around 200,000 individual birds [11]. A large collection of quail breeds was first created at the Moscow Timiryazev Agricultural Academy (MTAA) and involved the Pharaoh (PHA), English White (ENW), British Range, Tuxedo (TUX) and Marbled breeds [12] plus a wild-type colored strain developed in the Scientific and Production Association “Complex” (SPAC; Moscow, Russia) by crossing the Marbled and PHA quails. The Marbled breed was created at the MTAA in collaboration with the N.I. Vavilov Institute of General Genetics by subjecting a group of quails to X-rays. A relatively novel dual-purpose Estonian (EST) breed was produced in 1988 by mating the Japanese (JAP), ENW and PHA breeds. According to a cytogenetic analysis, the EST quails can be distinguished from JAP quails by the presence of a centromeric band in autosome 1 that is G-positive and can be utilized as a chromosomal marker for EST (as reviewed in [11]). Another large collection of quail breeds currently exists in the Zagorsk Experimental Breeding Farm, All-Russian Poultry Research and Technological Institute (ZEBF/ARPRTI), and embraces JAP, ENW, English Black (ENB), TUX, Manchurian Golden (MAG), EST, PHA, Texas White (TEW) and a few other quail breeds and strains [13].
To create a competitive breeder stock for quails, it is necessary to use modern methodologies of genetic and genomic analysis aimed at increasing the efficiency of selection and breeding work. For instance, identified sex-linked genes for phenotypic traits, e.g., recessive genes for imperfect albinism (al) and brown (br), can be employed for autosexing (sex sorting) of newly hatched chicks [10,11,14,15].
The integration of high-throughput, next-generation sequencing-based genomic technologies into practical quail breeding should therefore be carried out, at the initial stage, by assessing the genomic architecture characteristic of a particular breed. A subsequent comparison of the genomic structure of quail breeds of different origin and direction of selective breeding is necessary. This can prove to be an effective approach to identify specific genomic regions that are either related to recent divergence and/or earlier breeding differentiation. In addition, such an investigation facilitates a genome-wide assessment and refinement of the diversity and phylogeny amongst various quail breeds. Genotyping by sequencing (GBS), one of the restriction enzyme-based enrichment approaches designed initially for plants [16], is a promising strategy for reducing the financial burden of selection strategies via high sample multiplexing, focusing the sequenced genome areas on randomly distributed read tags [17]. Being a relatively affordable and widely applicable substitute for concurrent single-nucleotide polymorphism (SNP) mining and genotyping in plants (e.g., [16,18,19]), GBS is also increasingly being used in animals (e.g., [17,19,20,21,22]). Indeed, there was a recent report that GBS has been utilized for evaluating demographic history and genetic divergence in wild African harlequin quail (Coturnix delegorguei delegorguei) populations of Kenya [22]. Ravagni et al. [23] employed GBS to explore the evolutionary history of an island endemic, the common quail (Coturnix coturnix) in the Azores archipelago. To the best of our knowledge, however, there have been no studies using this technique to characterize the genomic architecture and diversity in the divergently selected breeds of the domesticated Japanese quail.
In the current investigation, we thus aimed to examine and compare the variability and phylogeny among the genomes of eight divergently selected breeds of egg-type, meat-type and dual-purpose quails that represented a significant portion (~11%) of the global gene pool of quail breeds. In accordance with this goal, the GBS approach was applied to characterize the genetic structure of these quail populations. This information is essential for maintaining their genomic diversity and facilitating efficient breeding in the future.

2. Materials and Methods

2.1. Experimental Birds and Performance Data

Quails were hatched from fertile eggs purchased from the Genofond LLC (ZEBF/ARPRTI; [13]), grown at the L. K. Ernst Federal Research Centre for Animal Husbandry (LKEFRCAH) [24], and sampled for DNA. The following eight quail breeds were used in this experiment (Table 1): JAP, ENW, ENB, TUX, and MAG (of egg type); TEW and PHA (of meat type); and EST (of dual purpose).
For each breed, the number of females (n) was taken into account, for which the following performance indicators (as mean ± standard deviation) were collected: egg number (EN) for 180 days from the start of lay; egg weight (EW) obtained at the age of 180 to 210 days (for each female, mean was calculated over all eggs laid during a given period); and body weight (BW) of females at the ages of 6 weeks and 6 months. These data were subsequently assessed and compared with calculations of interbreed genetic variability resulting from the GBS analysis. Herewith, we proposed a hypothesis that a certain degree of “congruence” (or, in other words, integration) between phenotypic and genomic data can take place for this sample of quail breeds. For this purpose, an appropriate mathematical analysis was undertaken using a new index, Narushin’s IPI (Integral Performance Index). The latter was recently established by Vakhrameev et al. [31] to evaluate the main economically important traits (i.e., EN, EW and female BW) in various chicken breeds and was originally designated as EY/W (where EY was the product of mean EN and EW, and W was mean female BW). Here, we renamed this index after the author of that study, Valeriy G. Narushin, who proposed this indicator, and calculated it using the corresponding formula:
I P I = E N · E W B W
where EN is egg number, EW is egg weight (in g), and BW is female body weight at 6 months of age (in g), all values being calculated as breed means.
Statistical evaluation of raw performance data and means was performed using Microsoft Excel (version 16.66.1). Student’s t-test was implemented to compare the means of breeds in pairwise mode and determine the significance of the differences between them using Microsoft Excel’s T.TEST function and GraphPad online calculator [32].

2.2. Sampling and DNA Isolation

Feather samples containing pulp were obtained from 106 quails of all the breeds studied. DNA extraction was performed using the Syntol kit for DNA isolation from animal tissues (Syntol, Moscow, Russia). The DNA solution concentration was determined using a Qubit 3.0 fluorimeter (Thermo Fisher Scientific, Wilmington, DE, USA). To check the purity of the extracted DNA, the OD260/280 ratio was tested using a NanoDrop-2000 instrument (Thermo Fisher Scientific).

2.3. Sequencing, Genotyping and Quality Control of SNPs

Quail genotyping was performed using GBS analysis [16] that included the basic steps of library construction, sequencing, sequence quality control (QC), SNP detection, and construction of a genomic relationship matrix. In particular, the methods described in Elshire et al. [16], with changes as in Dodds et al. [33], were implemented to build the GBS libraries. A PstI–MspI double-digest was used to generate one GBS library that also contained negative control samples devoid of DNA. Libraries were subjected to a Pippin Prep (SAGE Science, Beverly, MA, USA) to choose fragments with a size between 220 and 340 bp (genomic sequence plus 148 bp adapters). We employed a set of 768 barcodes designed by Integrated DNA Technologies, Inc. (Coralville, IA, USA) and Illumina (Illumina, Inc., San Diego, CA, USA) that differed from each other by at least three mutational steps. The corresponding adapter sequences were as follows: PstI_Common_F, AGATCGGAAGAGCACACGTCTGAACTCCAGTCAC; PstI_Common_R, GTGACTGGAGTTCAGACGTGTGCTCTTCCGATCTTGCA; MspI(Y)_Common_F, CGAGATCGGAAGAGCGGACTTTAAGC; and MspI_Common_R, GTGACTGGAGTTCAGACGTGTGCTCTTCCGATCT. Single-end sequencing (1 × 101 bp) was performed utilizing a NovaSeq 6000 instrument (Illumina, Inc.) and the appropriate v1.5 reagents. Raw fastq files were quality checked using a custom QC pipeline, DECONVQC [19,34]. As one of the QC steps, raw fastq files were quality tested using FastQC [35].
As a reference genome, we used the Japanese quail genome assembly Coturnix japonica 2.0 [36], along with the databases Ensembl 104 and Ensembl Genomes 51 (released on 7 May 2021; [37]). Removal of adapter sequences and demultiplexing of the fastq file, i.e., its separation by samples to produce individual fastq files using a list of barcodes, were executed using the cutadapt program [38,39]. The QC of fastq files was carried out in the FastQC program [35]. To call SNPs from the GBS data, the bioinformatics workflow snpGBS [40,41] was employed. The bowtie2 package was used to align the individual fastq files to the reference genome and index them [42], while sorting of bam files was performed using samtools [43,44].
Joint genotyping of the resulting files was implemented using bcftools [44] generating one multi sample VCF file. After filtering, 80,673 SNPs were used for subsequent analysis steps. The data was generated into a file format acceptable for further analysis using the R software package [45]. The PLINK 1.9 program [46] was employed to control the quality of SNP detection. The obtained quail genotypes were filtered according to the genotyping efficiency parameter (mind 0.25), and SNPs genotyped in less than 90% samples (geno 0.1) were excluded from the analysis. The final dataset used for the genome-wide analyses was 62,935 SNPs out of original 80,673 SNPs. A total of 106 individuals were initially sequenced and genotyped. After removing two quails that did not belong to their respective breeds according to genetic data, a matrix of 104 birds was subject to subsequent analysis. After pulling out five more quails from the total number due to insufficient information about them with regard to the studied SNPs, a total of 99 individuals was investigated in the experiment.
For some types of analysis, e.g., principal component analysis (PCA), analysis of genetic diversity and divergence, construction of phylogenetic networks, analysis of population structure and analysis of gene flow (migration events), an additional linkage disequilibrium (LD) filter was applied to remove loci for which LD was identified within a 50 Kb sliding window with a step of 5. After using the LD filter, 27,171 SNPs were included in the analysis.

2.4. Genetic Diversity Assessment

To determine within-population genetic diversity, PLINK 1.9 software package was used. QC was performed at both the individual and SNP levels using PLINK 1.9. By implementing various parameters of the R package diveRsity [47], we computed values of observed heterozygosity (HO), expected heterozygosity (HE), unbiased expected heterozygosity (UHE), rarefied allelic richness (AR; [48]), coefficient inbreeding (FIS) and coefficient of inbreeding (UFIS) based on unbiased expected heterozygosity.

2.5. PCA, Neighbor-Net and Admixture Procedures

For breed clustering, PCA and calculation of identical-by-state (IBS) distances were performed in PLINK1.9. The degree of genetic differentiation of the studied breeds was estimated based on pairwise FST values. Visualization of PCA results was carried out in the R ggplot2 package [49]. Dendrograms based on IBS distances and pairwise FST distances were plotted using an agglomerative method for constructing phylogenetic networks, i.e., Neighbor-Net in SplitsTree 4 [50]. The software Admixture v1.3 [51] for model-based clustering and computation of the related cross-validation (CV) errors was implemented to analyze ancestral populations and genetic impurities, while the BITE R package [52] was used to visualize these results. The Phantasus web program was also used to perform PCA and hierarchical clustering procedures [53]. Using the online T-REX program [54], the Neighbor-Joining [55] trees showing phylogenetic relationships between breeds were built.
Gene flow (migration) events were analyzed using the TreeMix 1.12 program [56]. The analysis considered from 0 to 5 migrations with 30 iterations per migration event. The optimal number of migrations (1) was determined using the OptM R package [57]. The best maximum likelihood tree configuration was determined based on the minimum mean standard error of the residual matrix among all iterations.
The analysis of homozygous genomic segments (runs of homozygosity, ROH) was performed using the detectRUNS R package [58] with the following settings: the minimum number of SNPs was 30, and the minimum length was 0.5 Mb.

3. Results

3.1. Breed Performance

Information for the three major performance characteristics, according to which the IPI index was computed, is given in Table 2. As can be seen, the two meat-type breeds, PHA and TEW, had the lowest IPI values (roughly 5 if rounded up to integers), the dual-purpose breed, EST, had a slightly higher value (~7), and the five egg-type breeds had greater values (~8 to 12).
A matrix of interbreed Euclidean distances computed for breed IPI values is presented in Supplementary Table S1. Using it, breed clustering was reconstructed in the form of PCA plots and Neighbor-Joining trees (Figure 1). Notably, a largely similar configuration of breeds was obtained using both clustering techniques, reflecting the breed subdivision into three main types of utility and selection, as well as in accordance with the ranking of IPI values as shown in Table 2.

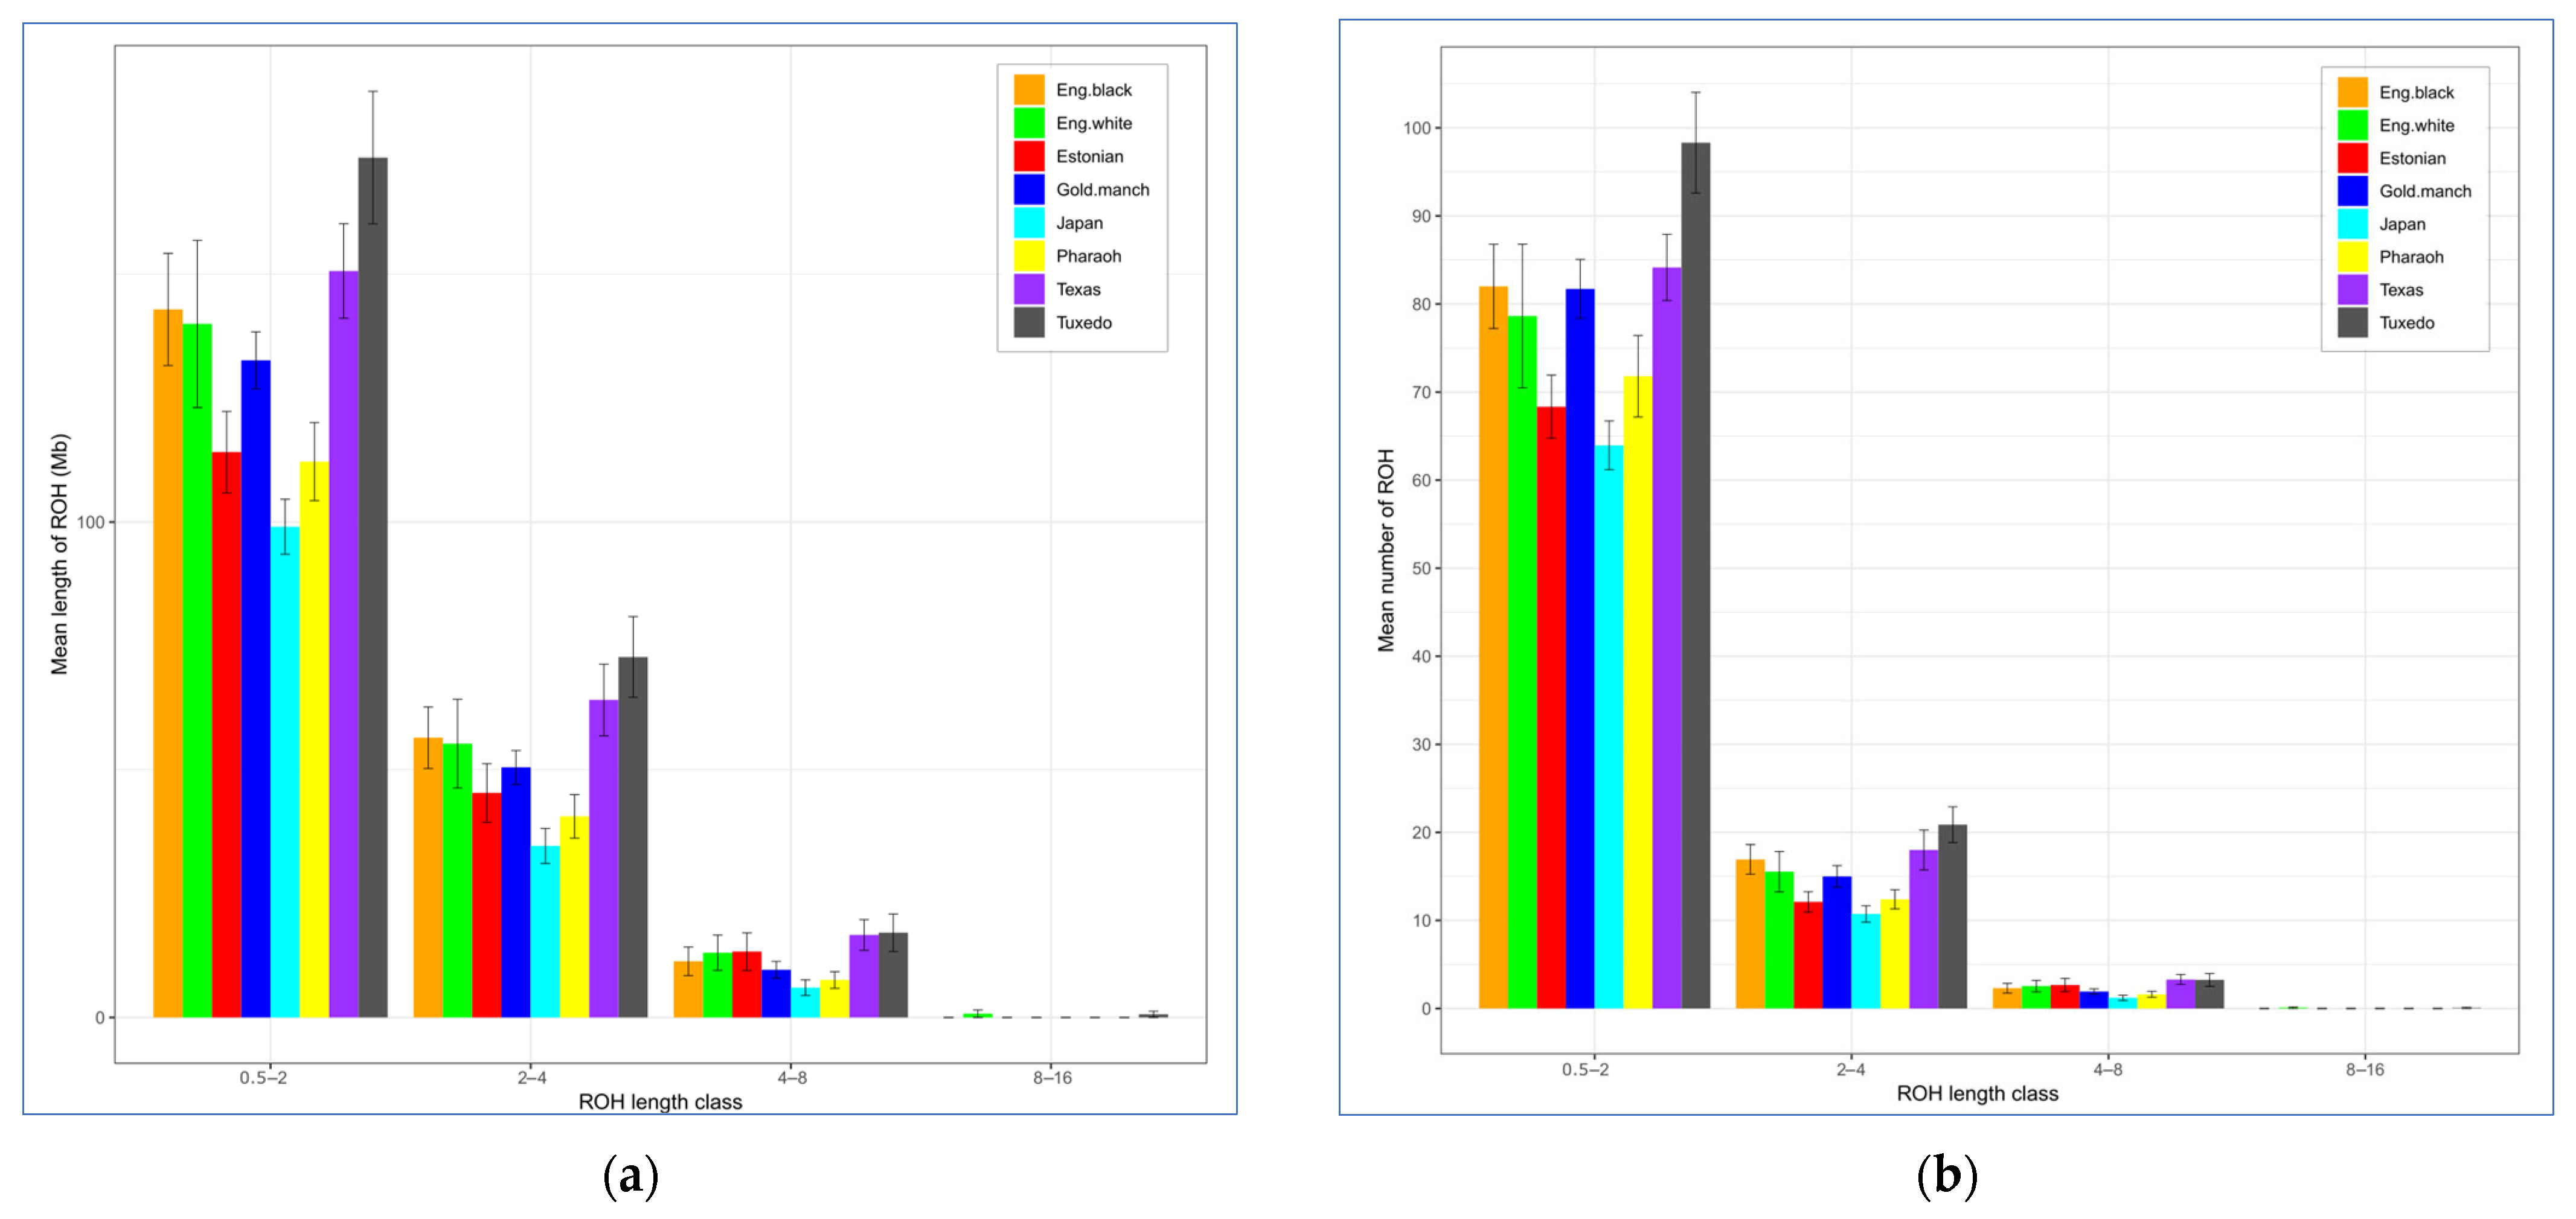
3.2. Analysis of Genetic Diversity

Using around 100 DNA samples from quails of as many different phenotypes as possible, we generated a GBS panel for genotyping the quail breeds. In terms of genetic diversity values (Table 3), TUX quails were characterized by lower values of genetic diversity, as measured by lower levels of expected heterozygosity (HE = 0.263 vs. the maximum value of 0.310, p < 0.001) and allelic richness (AR = 1.730 vs. the maximum value of 1.864, p < 0.001) as compared to the JAP breed. This can be explained by the higher intensity of breeding work in TUX that was aimed at consolidating the desired breed characteristics. The inbreeding coefficient (FIS) was represented by the maximum value for the JAP population (0.020, with a 95% confidence interval being from 0.016 to 0.024), which may be indicative of a likely growth in gene homozygosity in this population.
Due to the small number of birds in each breed, we also calculated unbiased measures of expected heterozygosity (UHE) and expected inbreeding rate (UFIS) adjusted for small samples. The former was highest in EST (0.313) and JAP (0.319). The latter coefficient was represented by positive values for all breeds ranging from the minimum of 0.011 in TEW to the maximum of 0.046 in JAP quails. High rates of UFIS were also found in EST (0.032) and MAG (0.031), as well as in the PHA population (0.035). This enabled us to conclude that there was a significantly higher homozygosity of genes in these four populations as compared to other breeds.

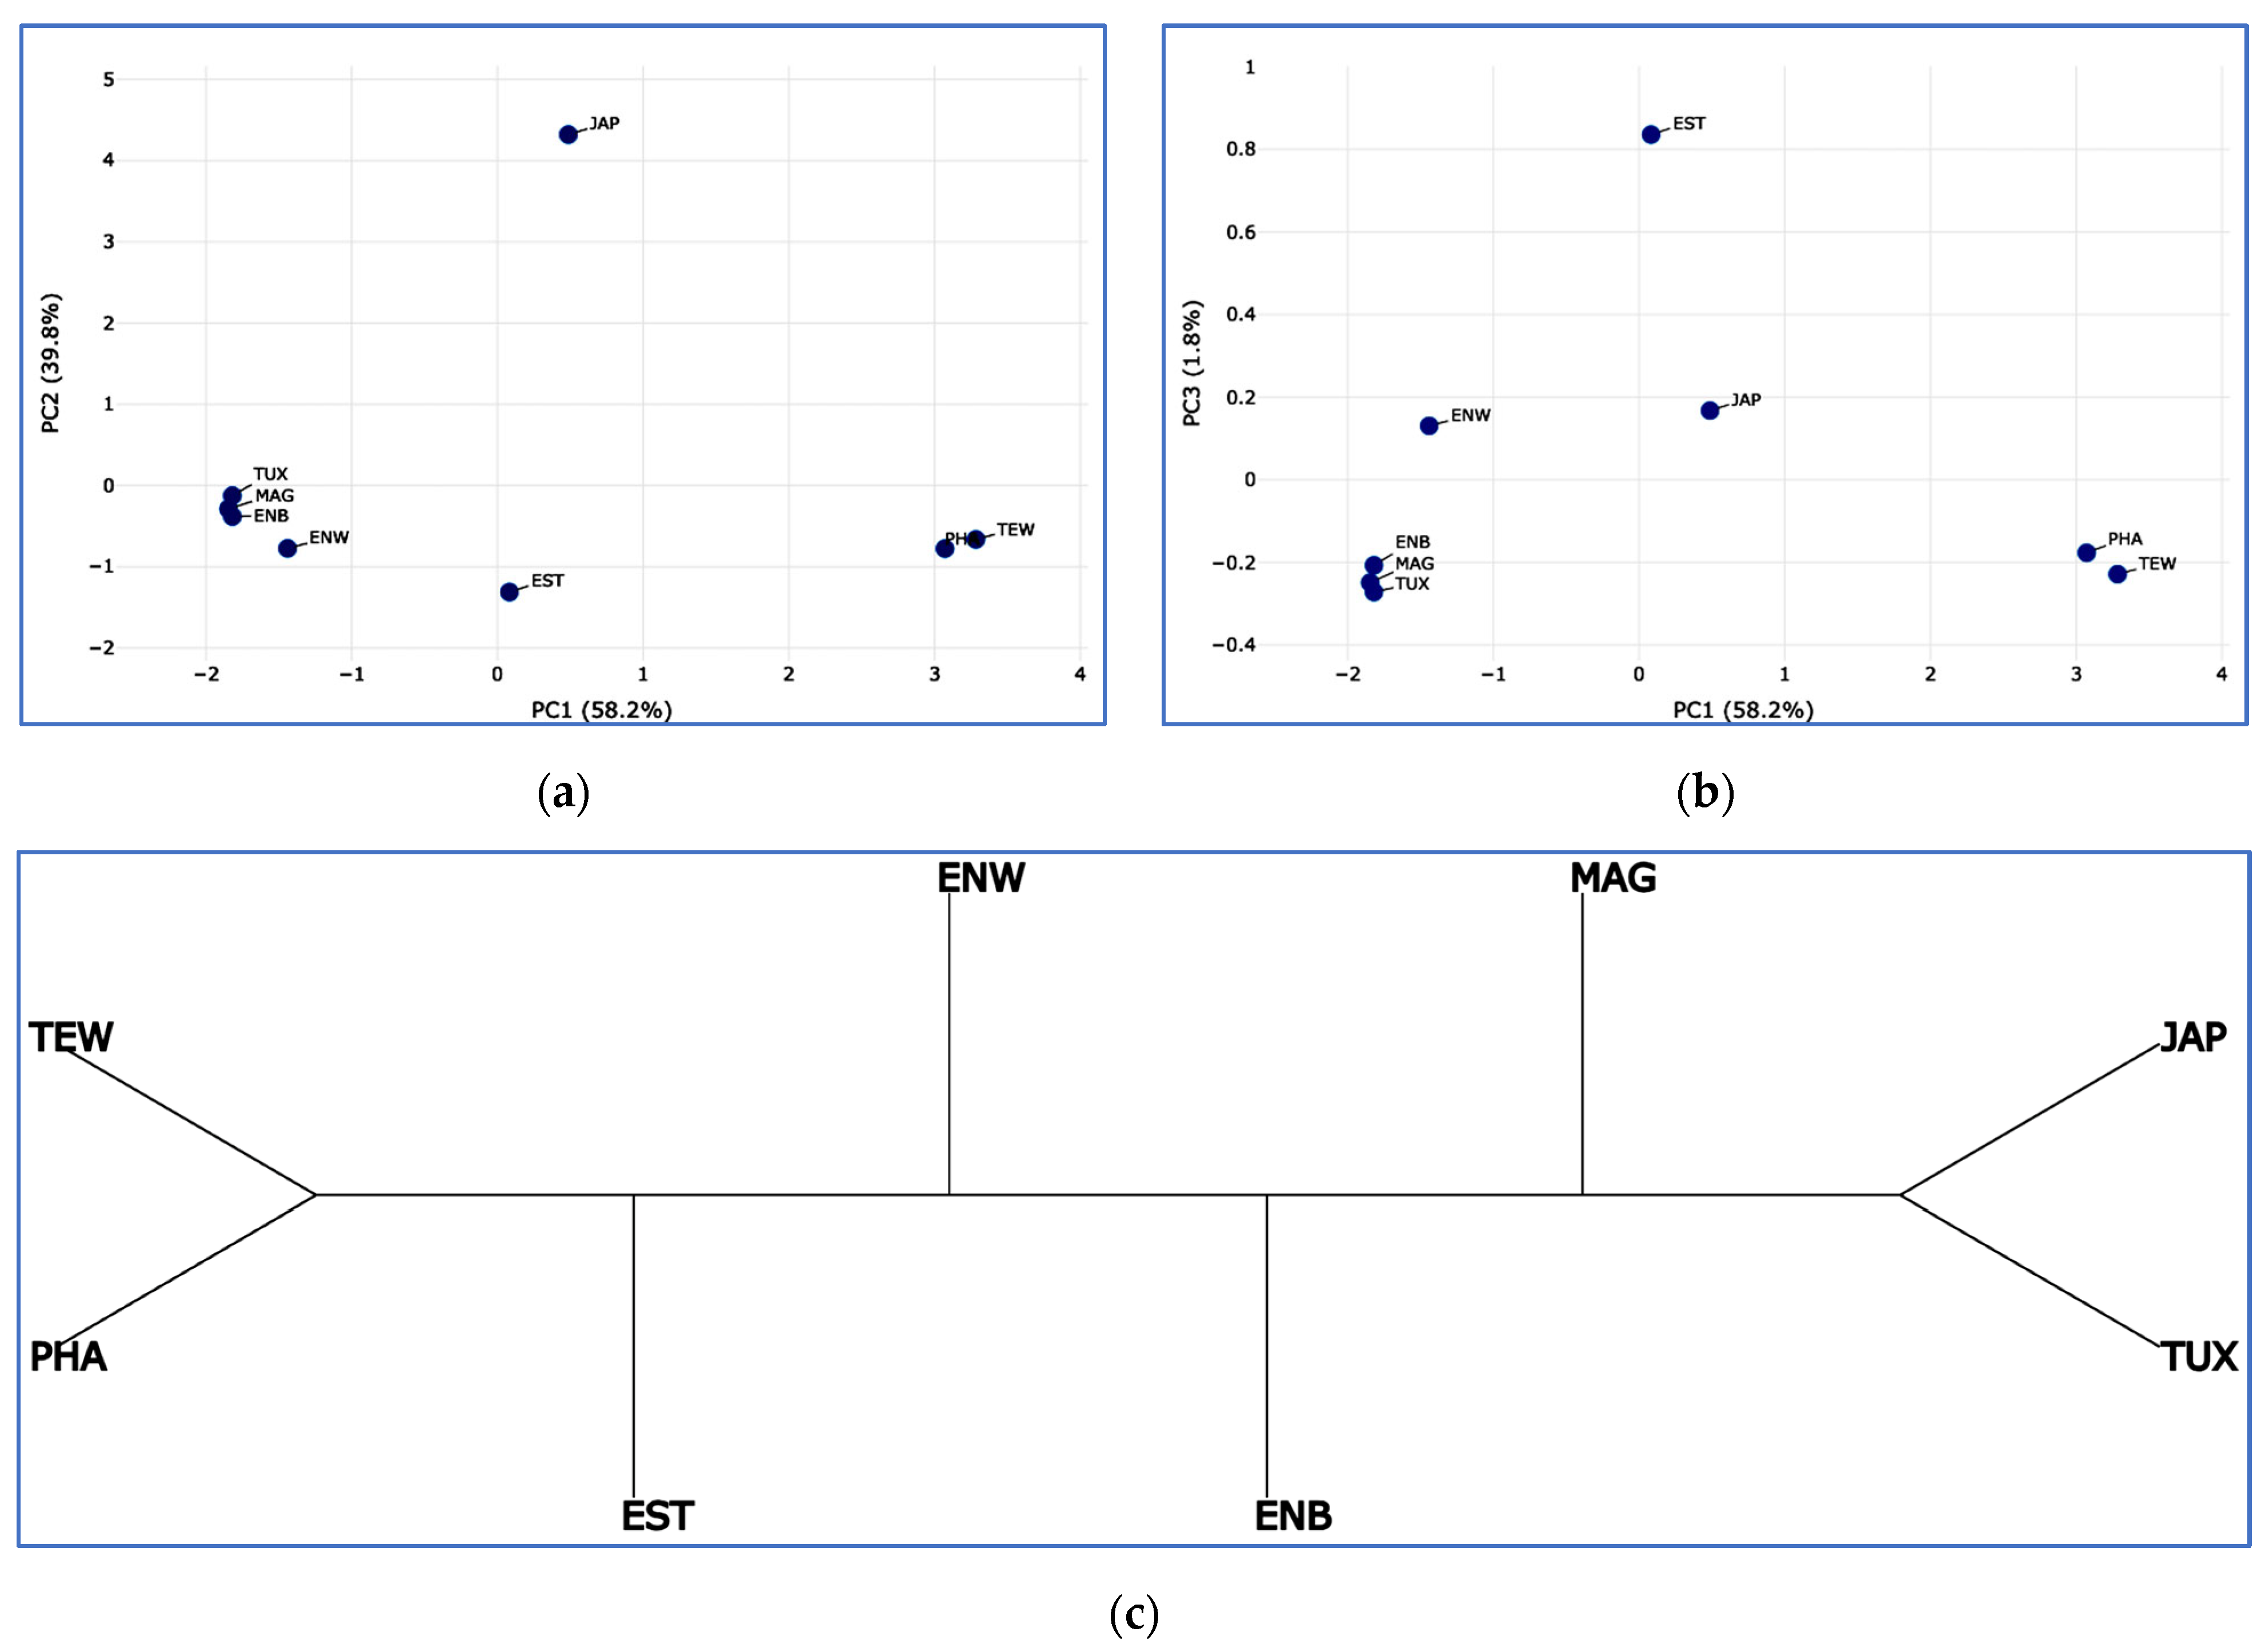
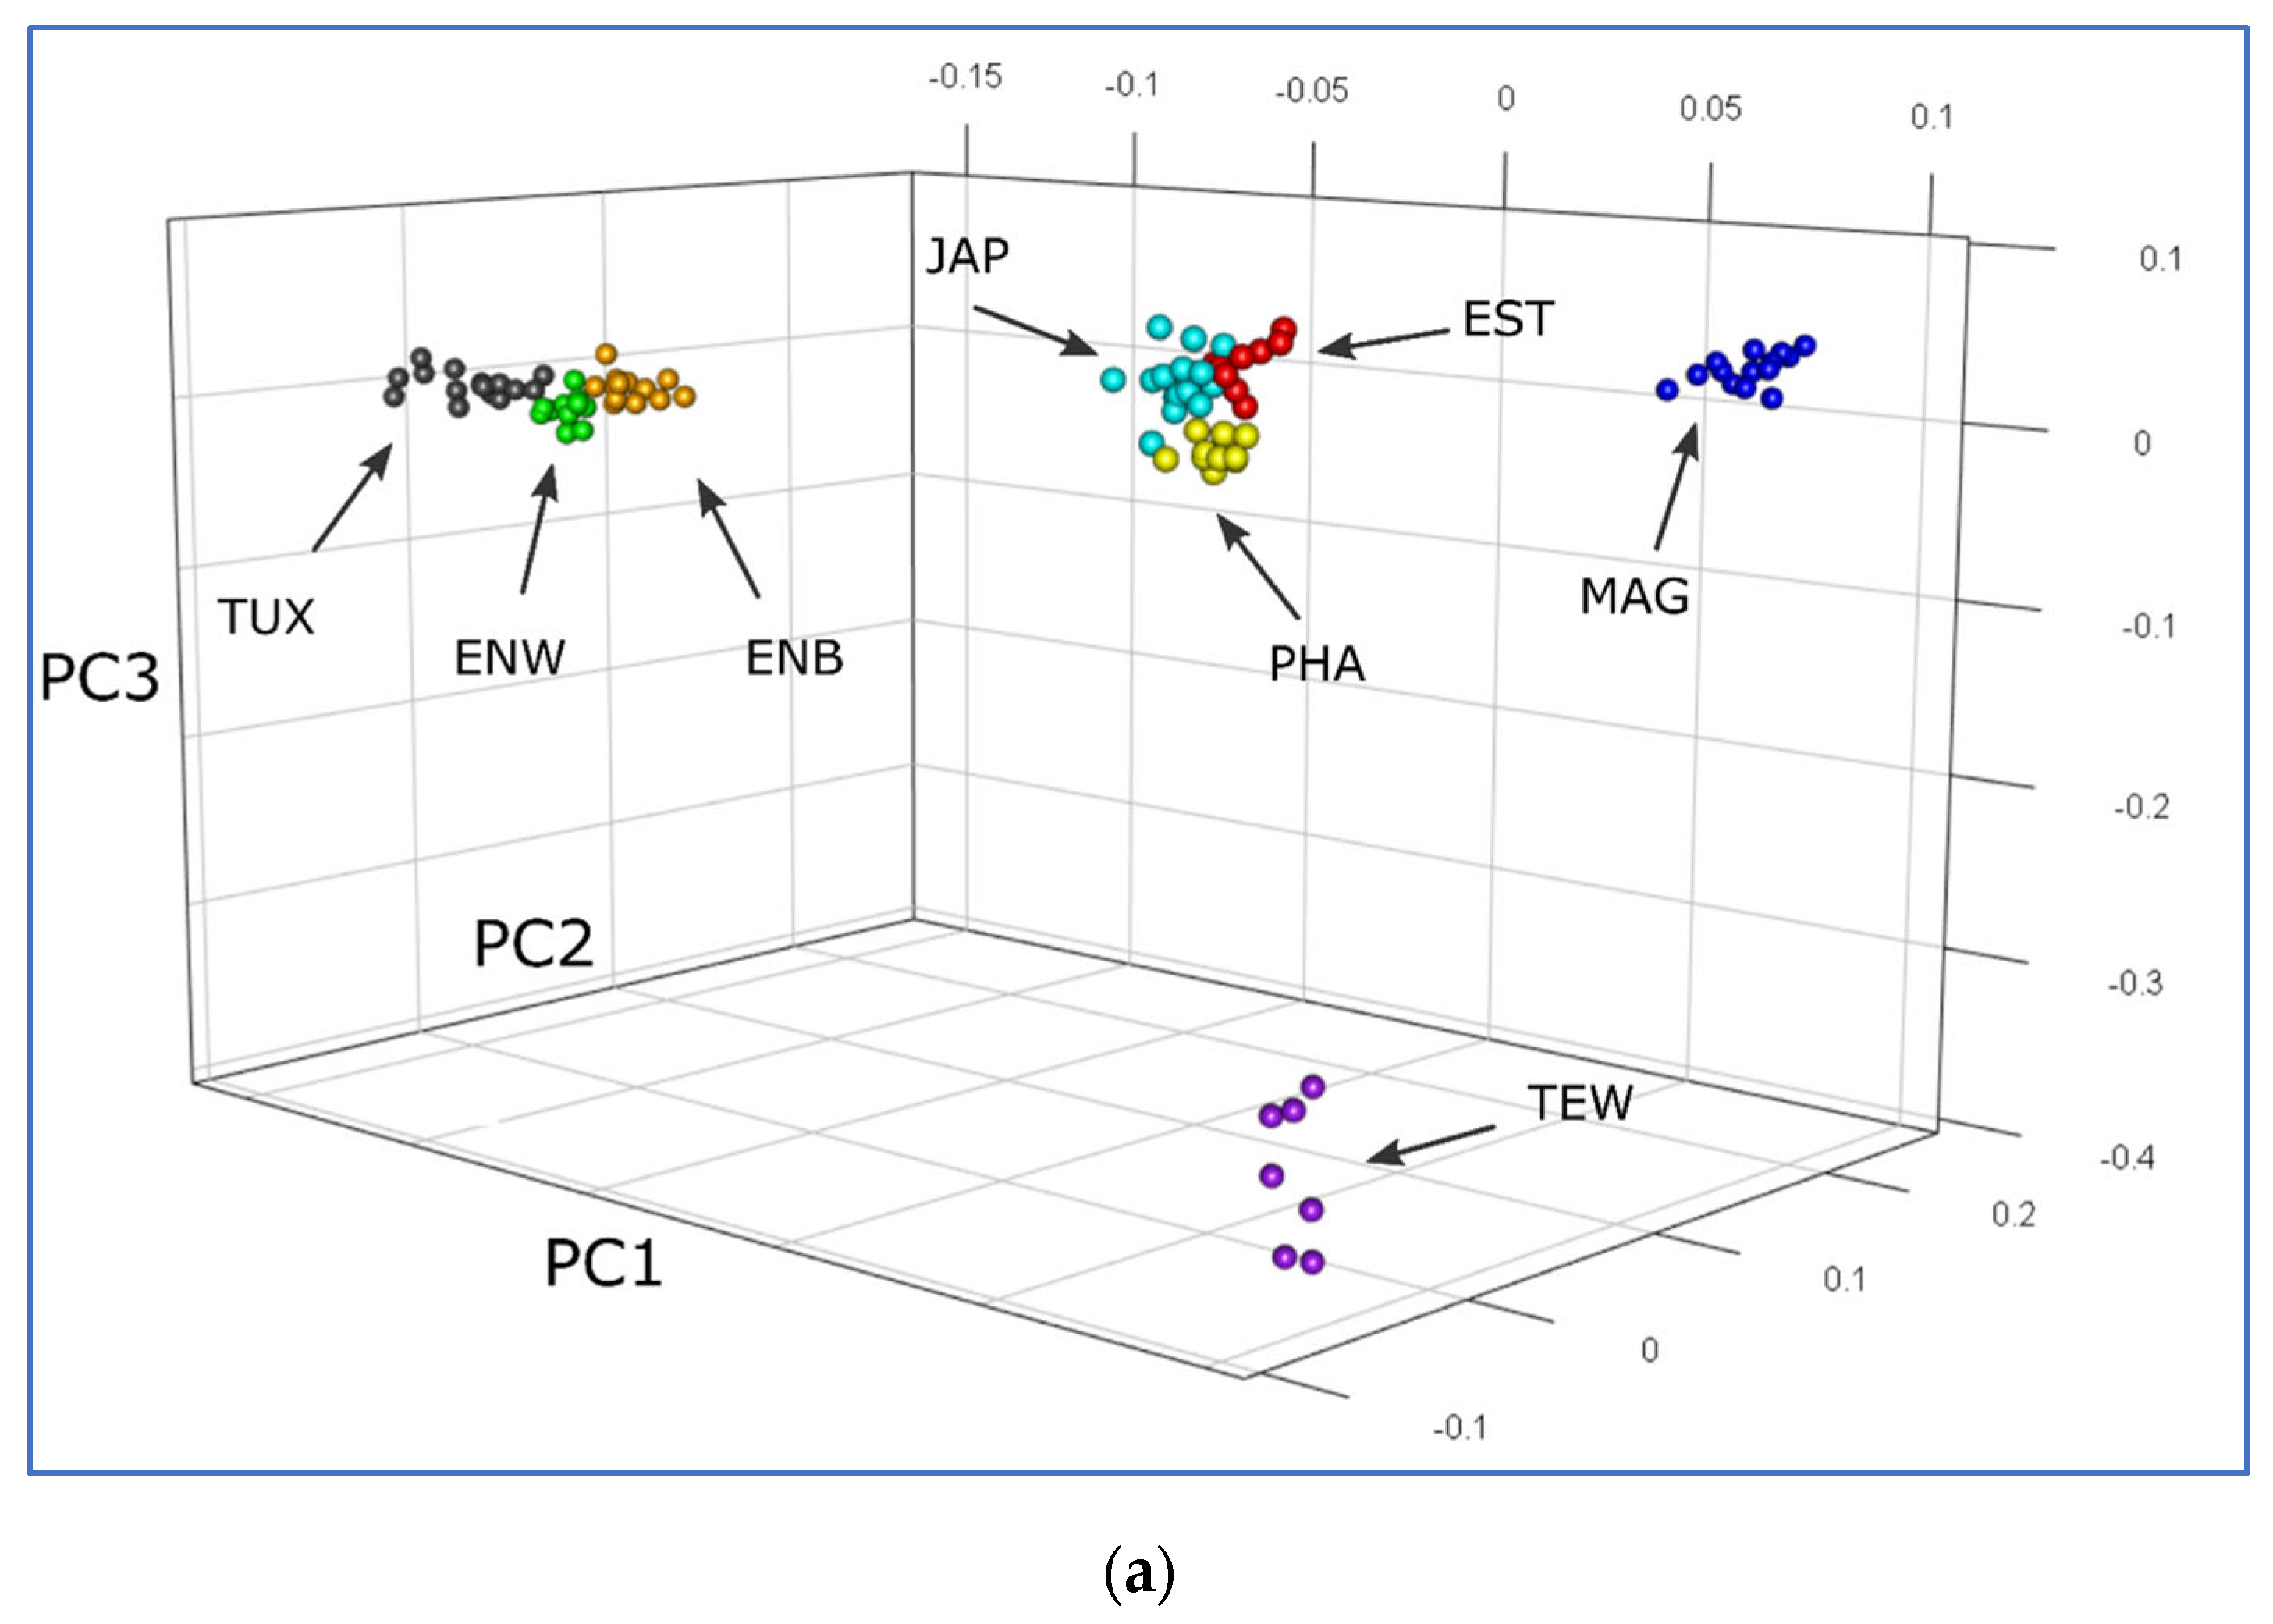
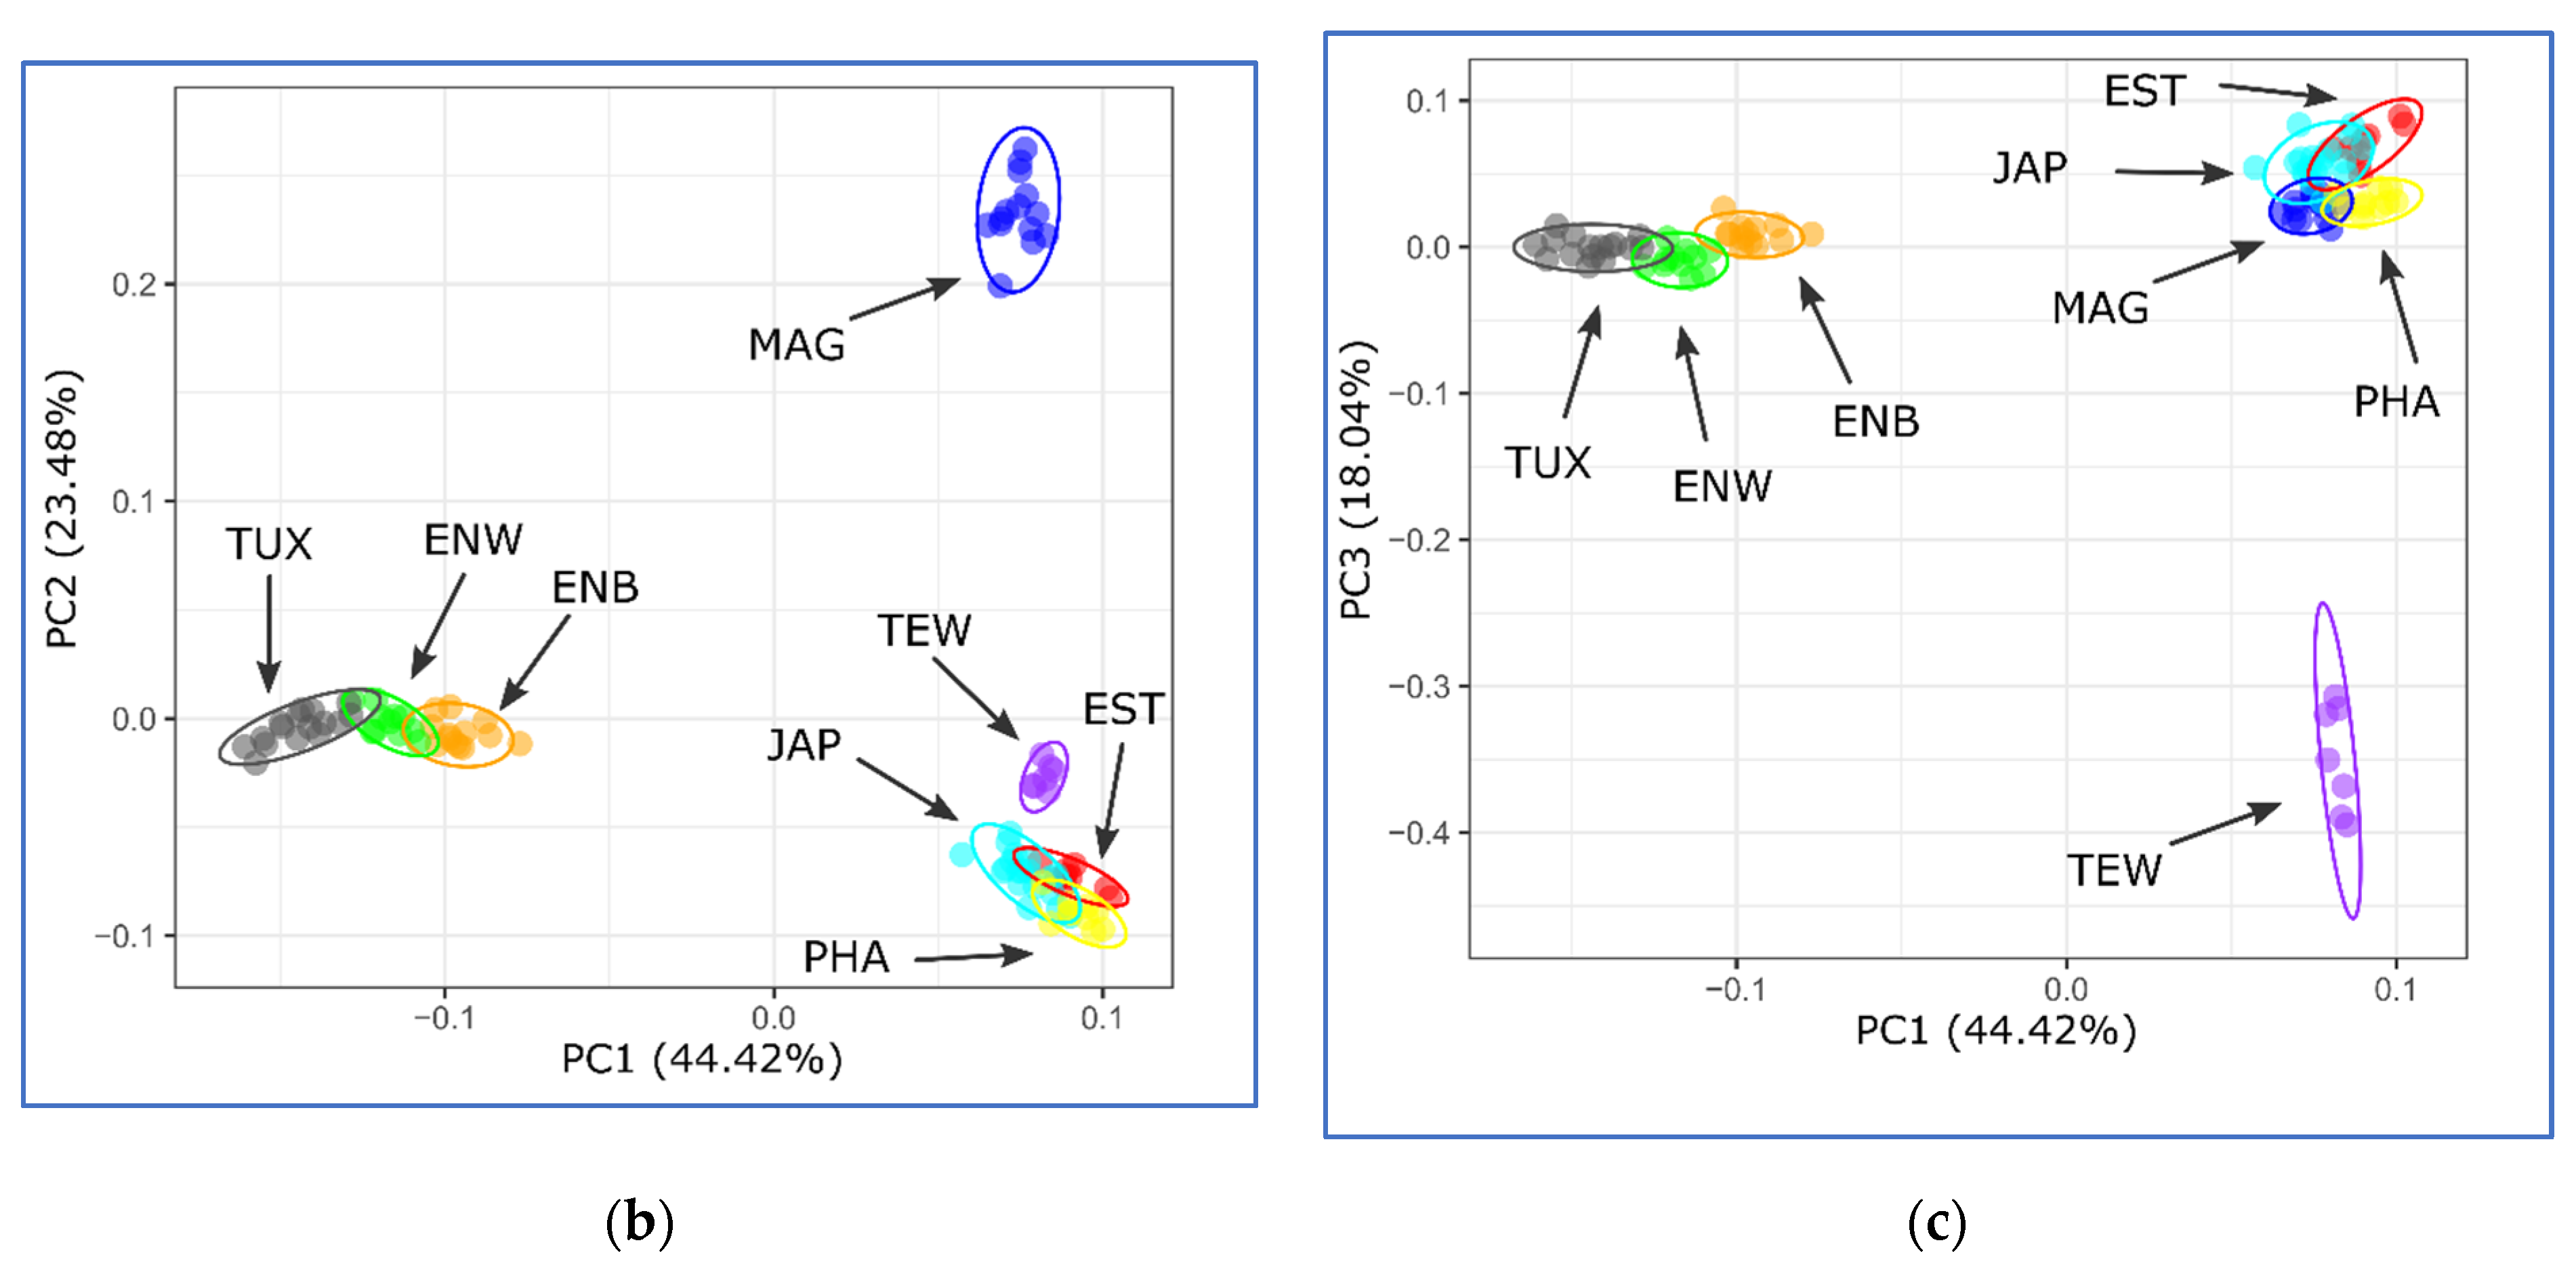
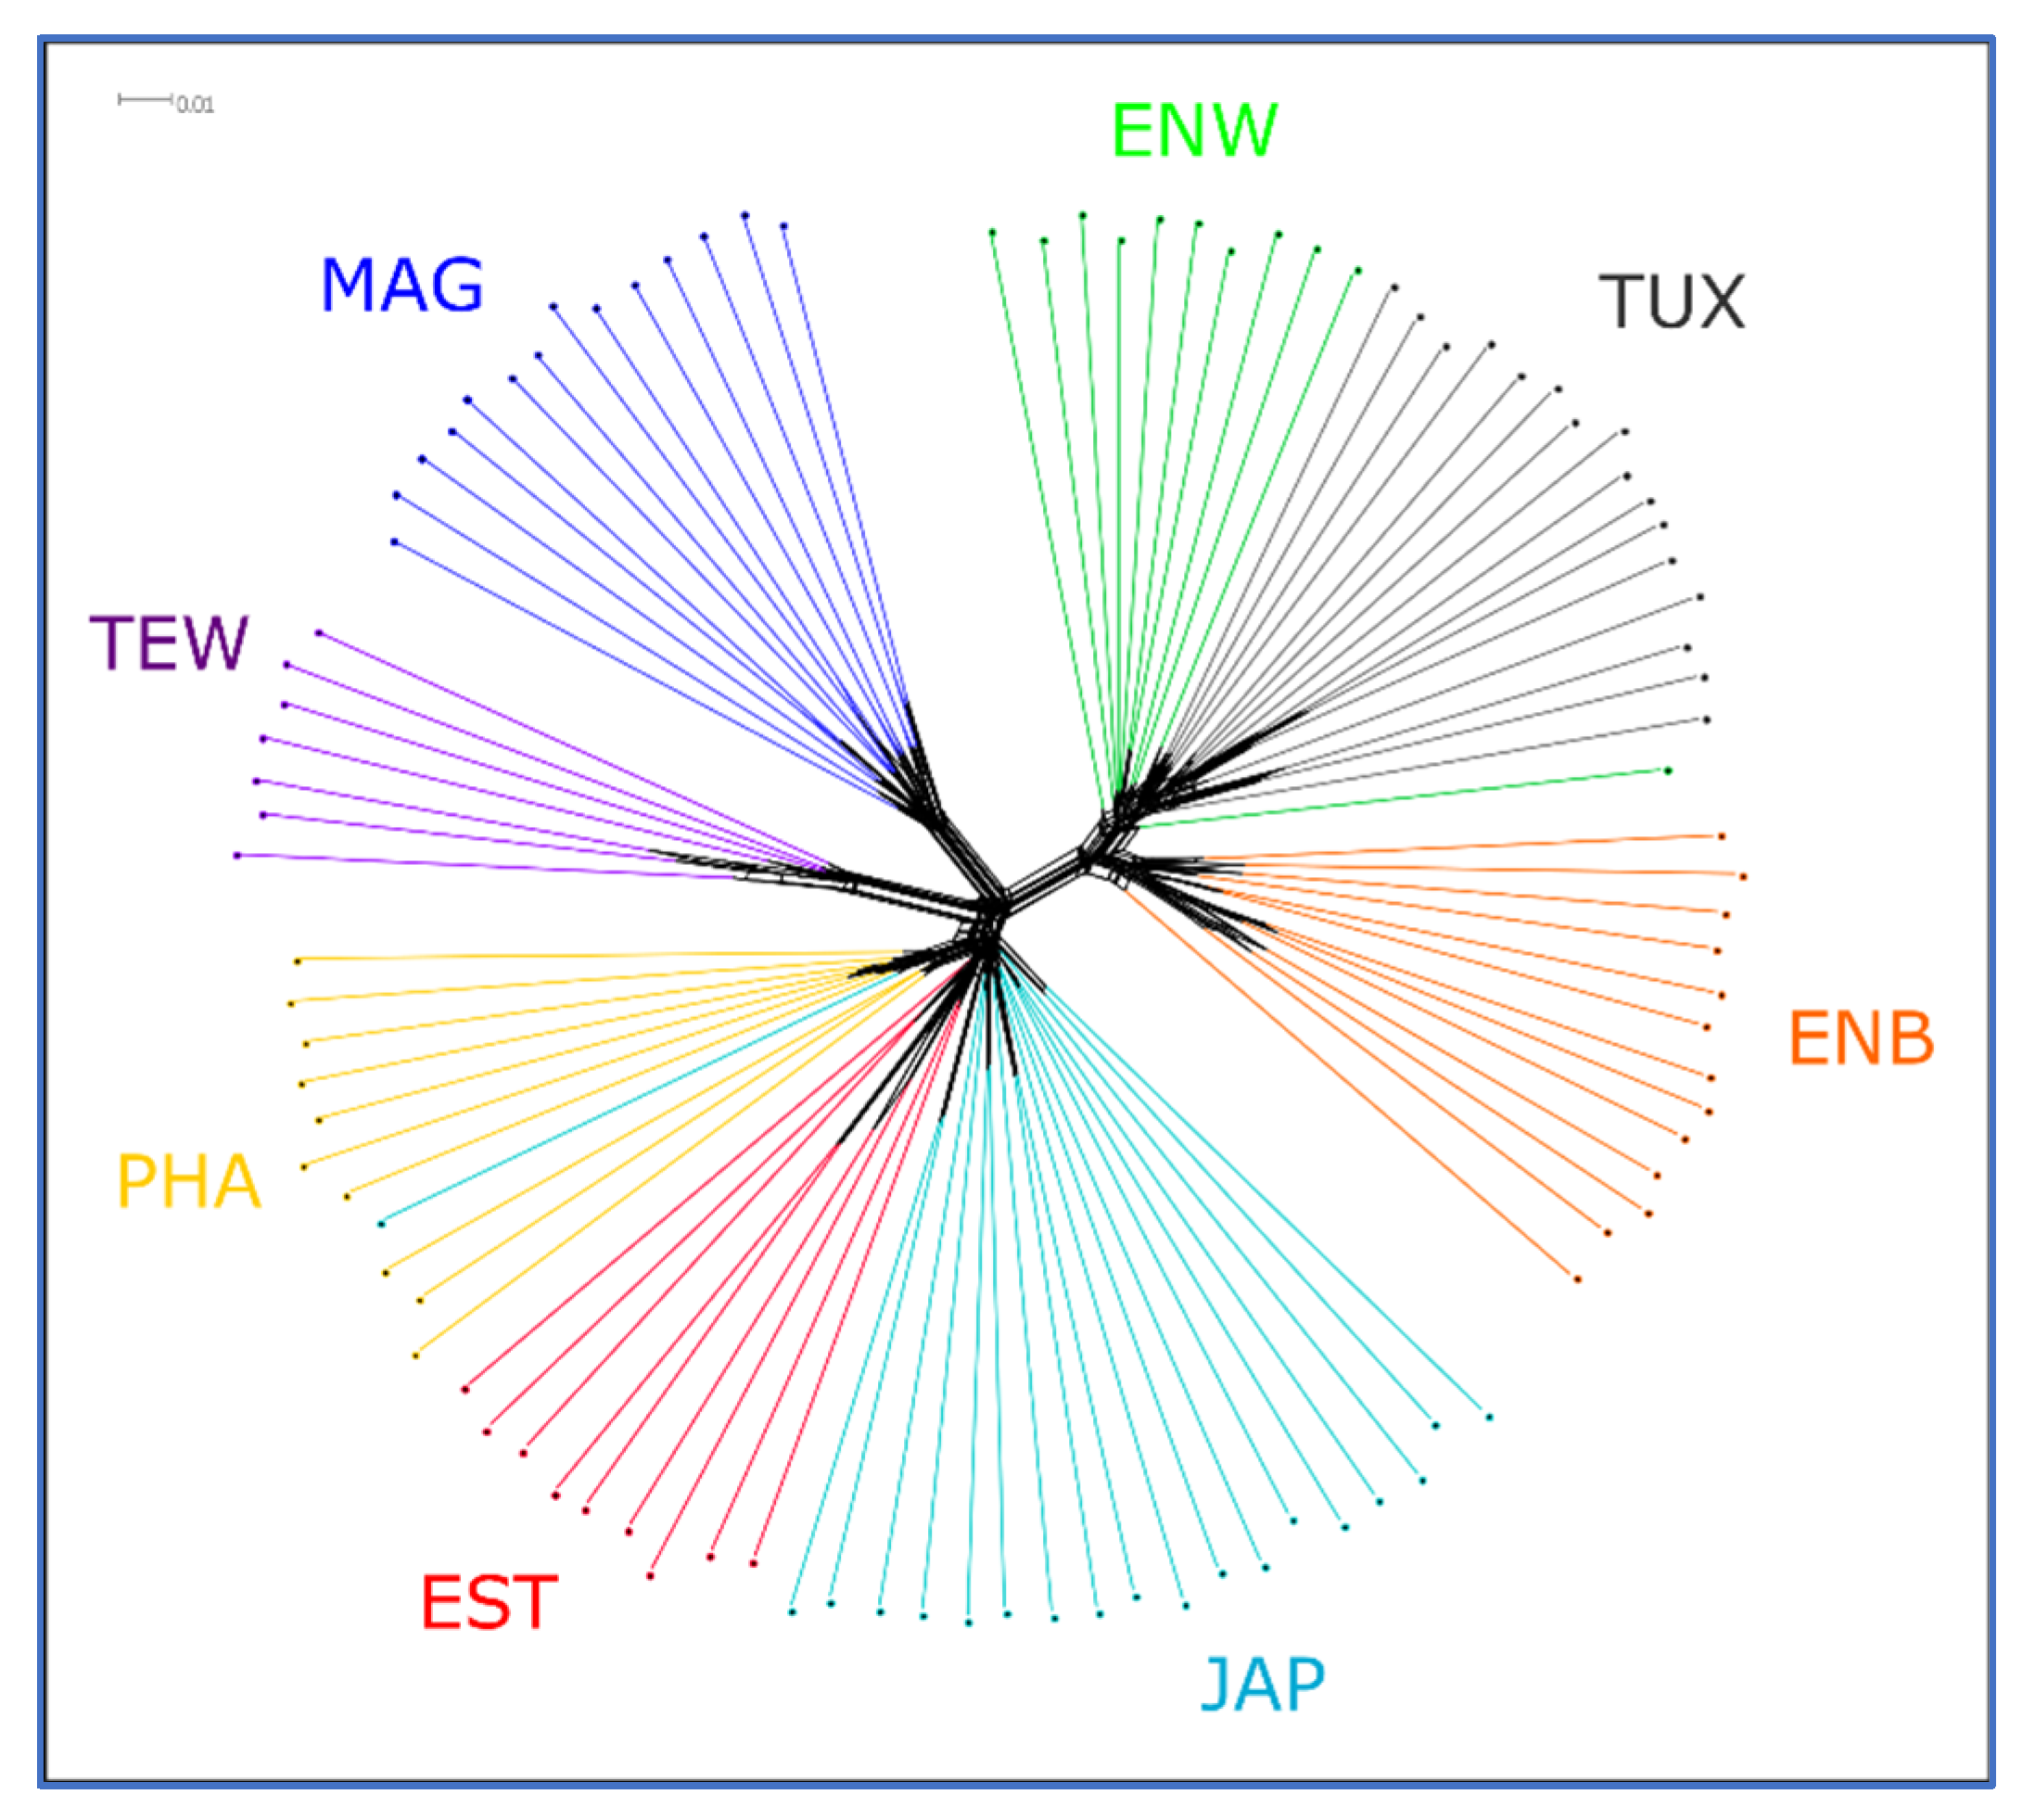
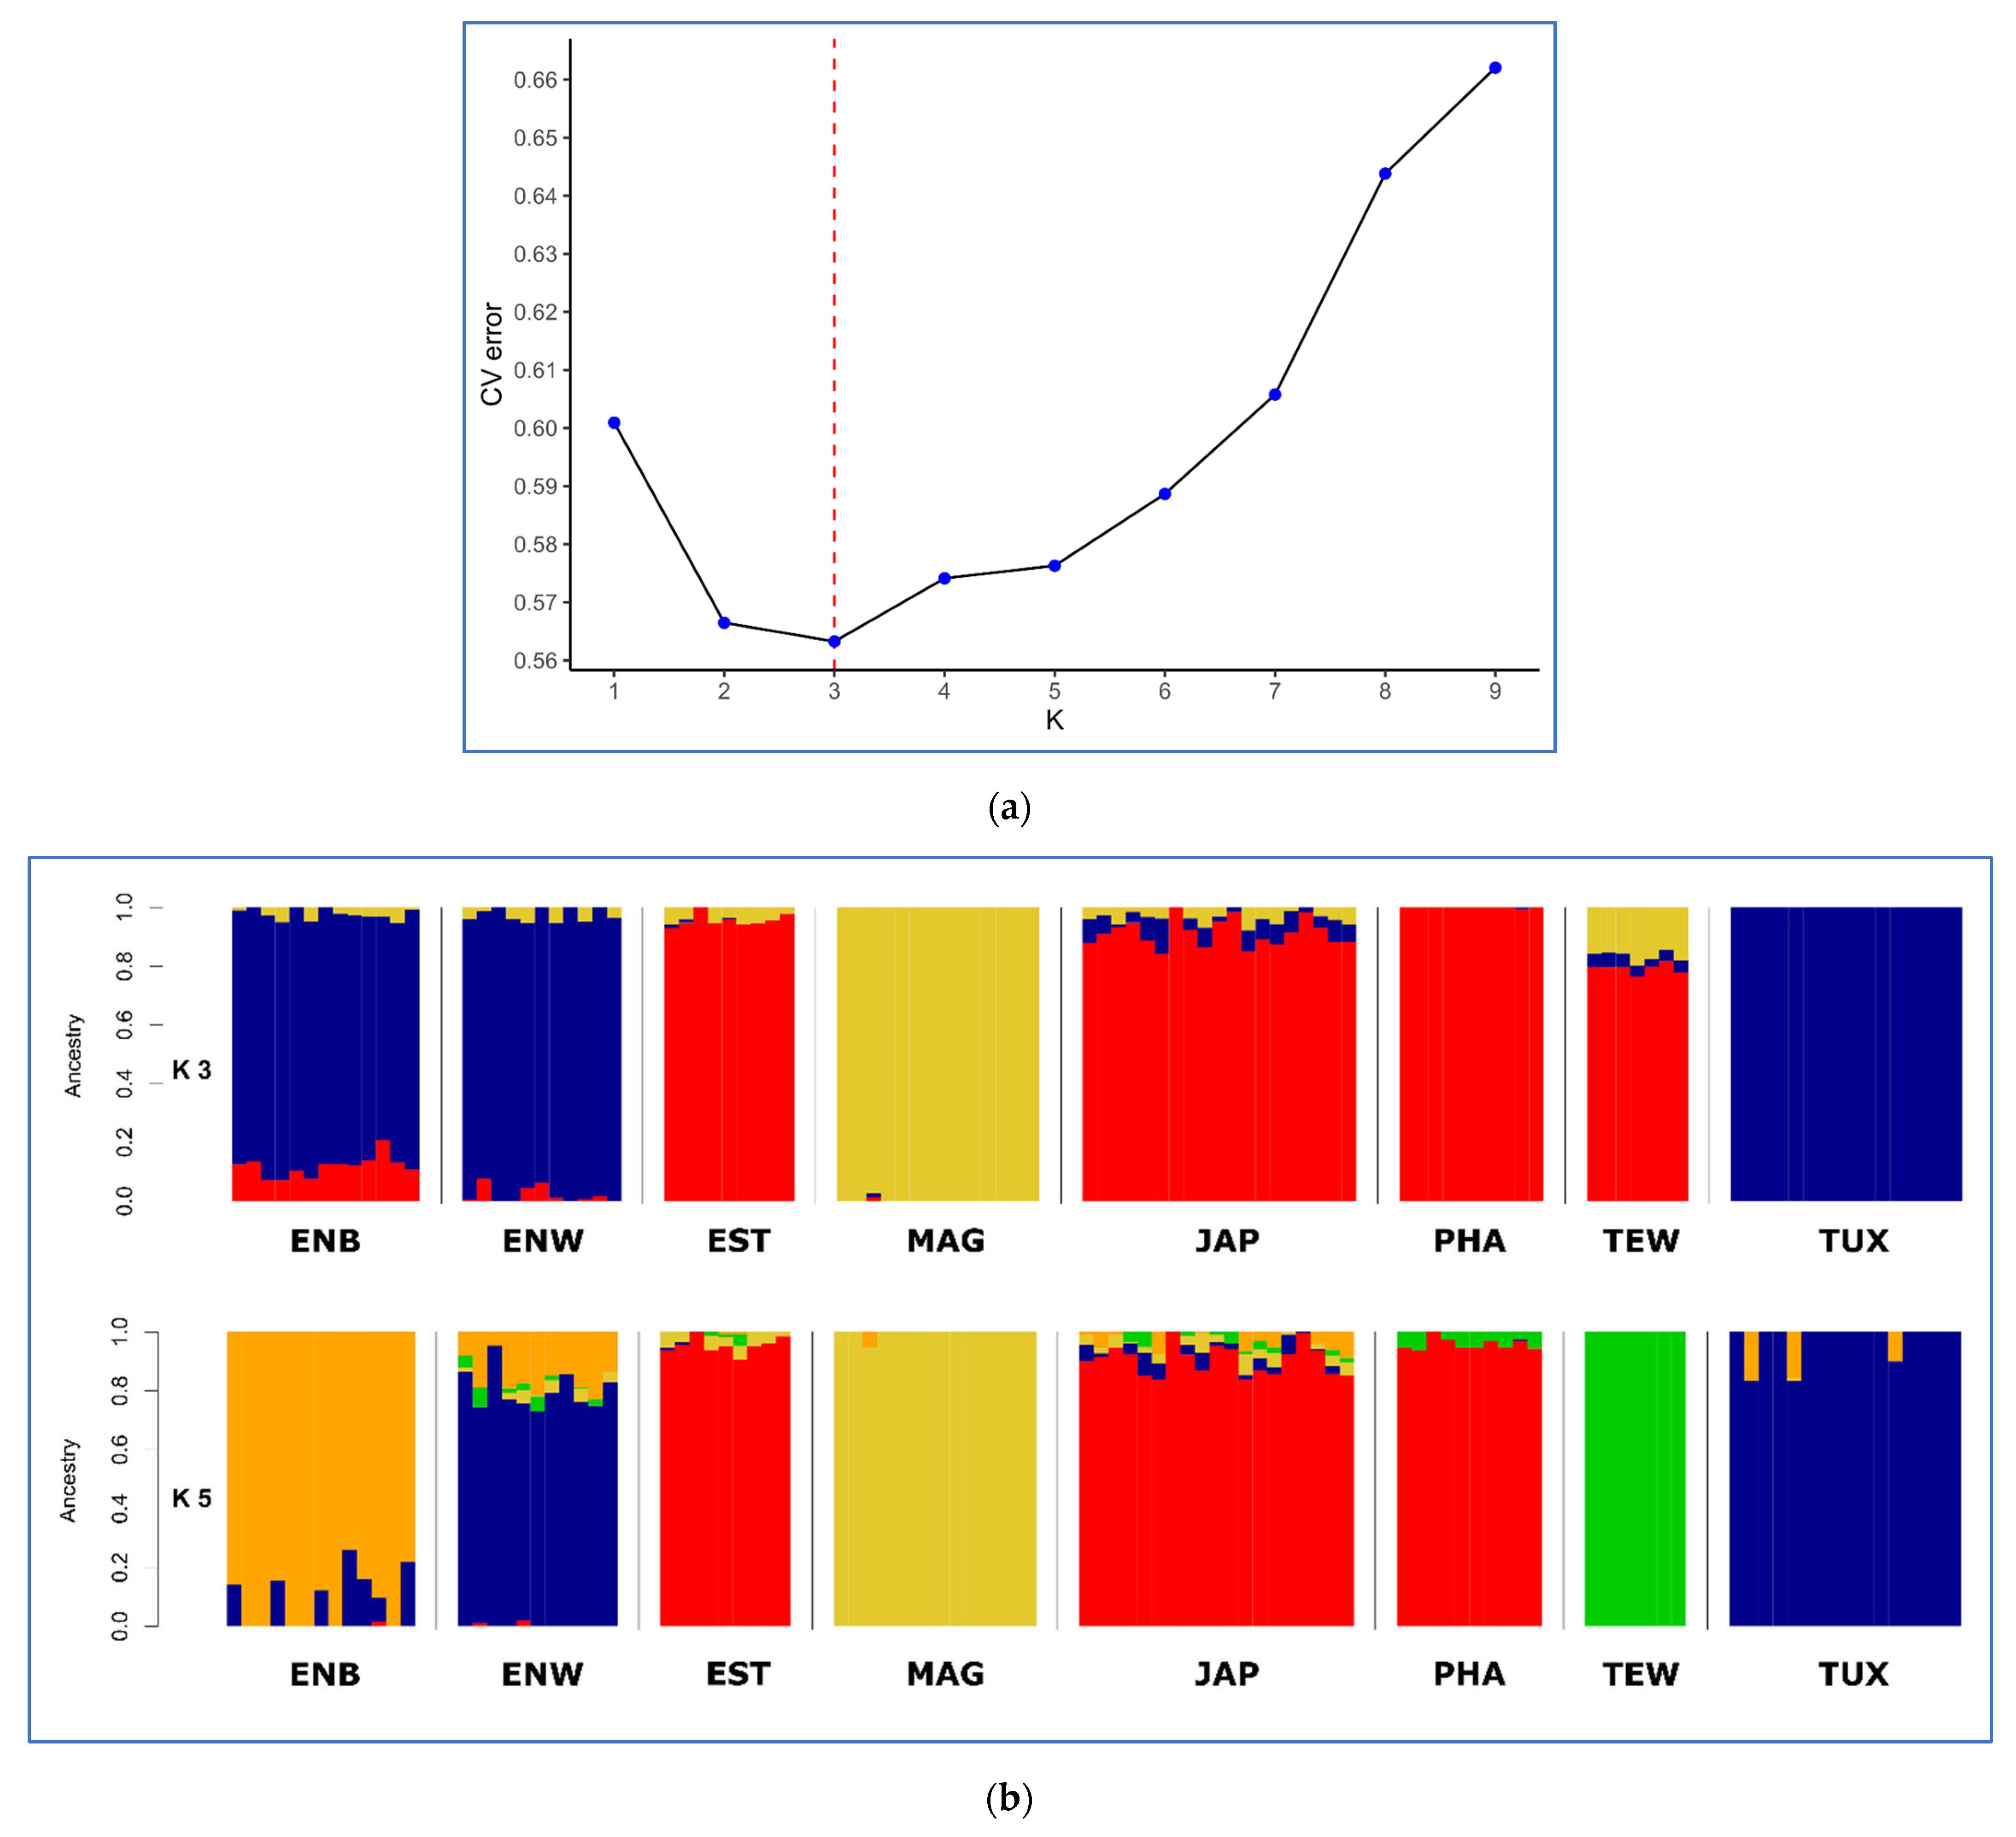
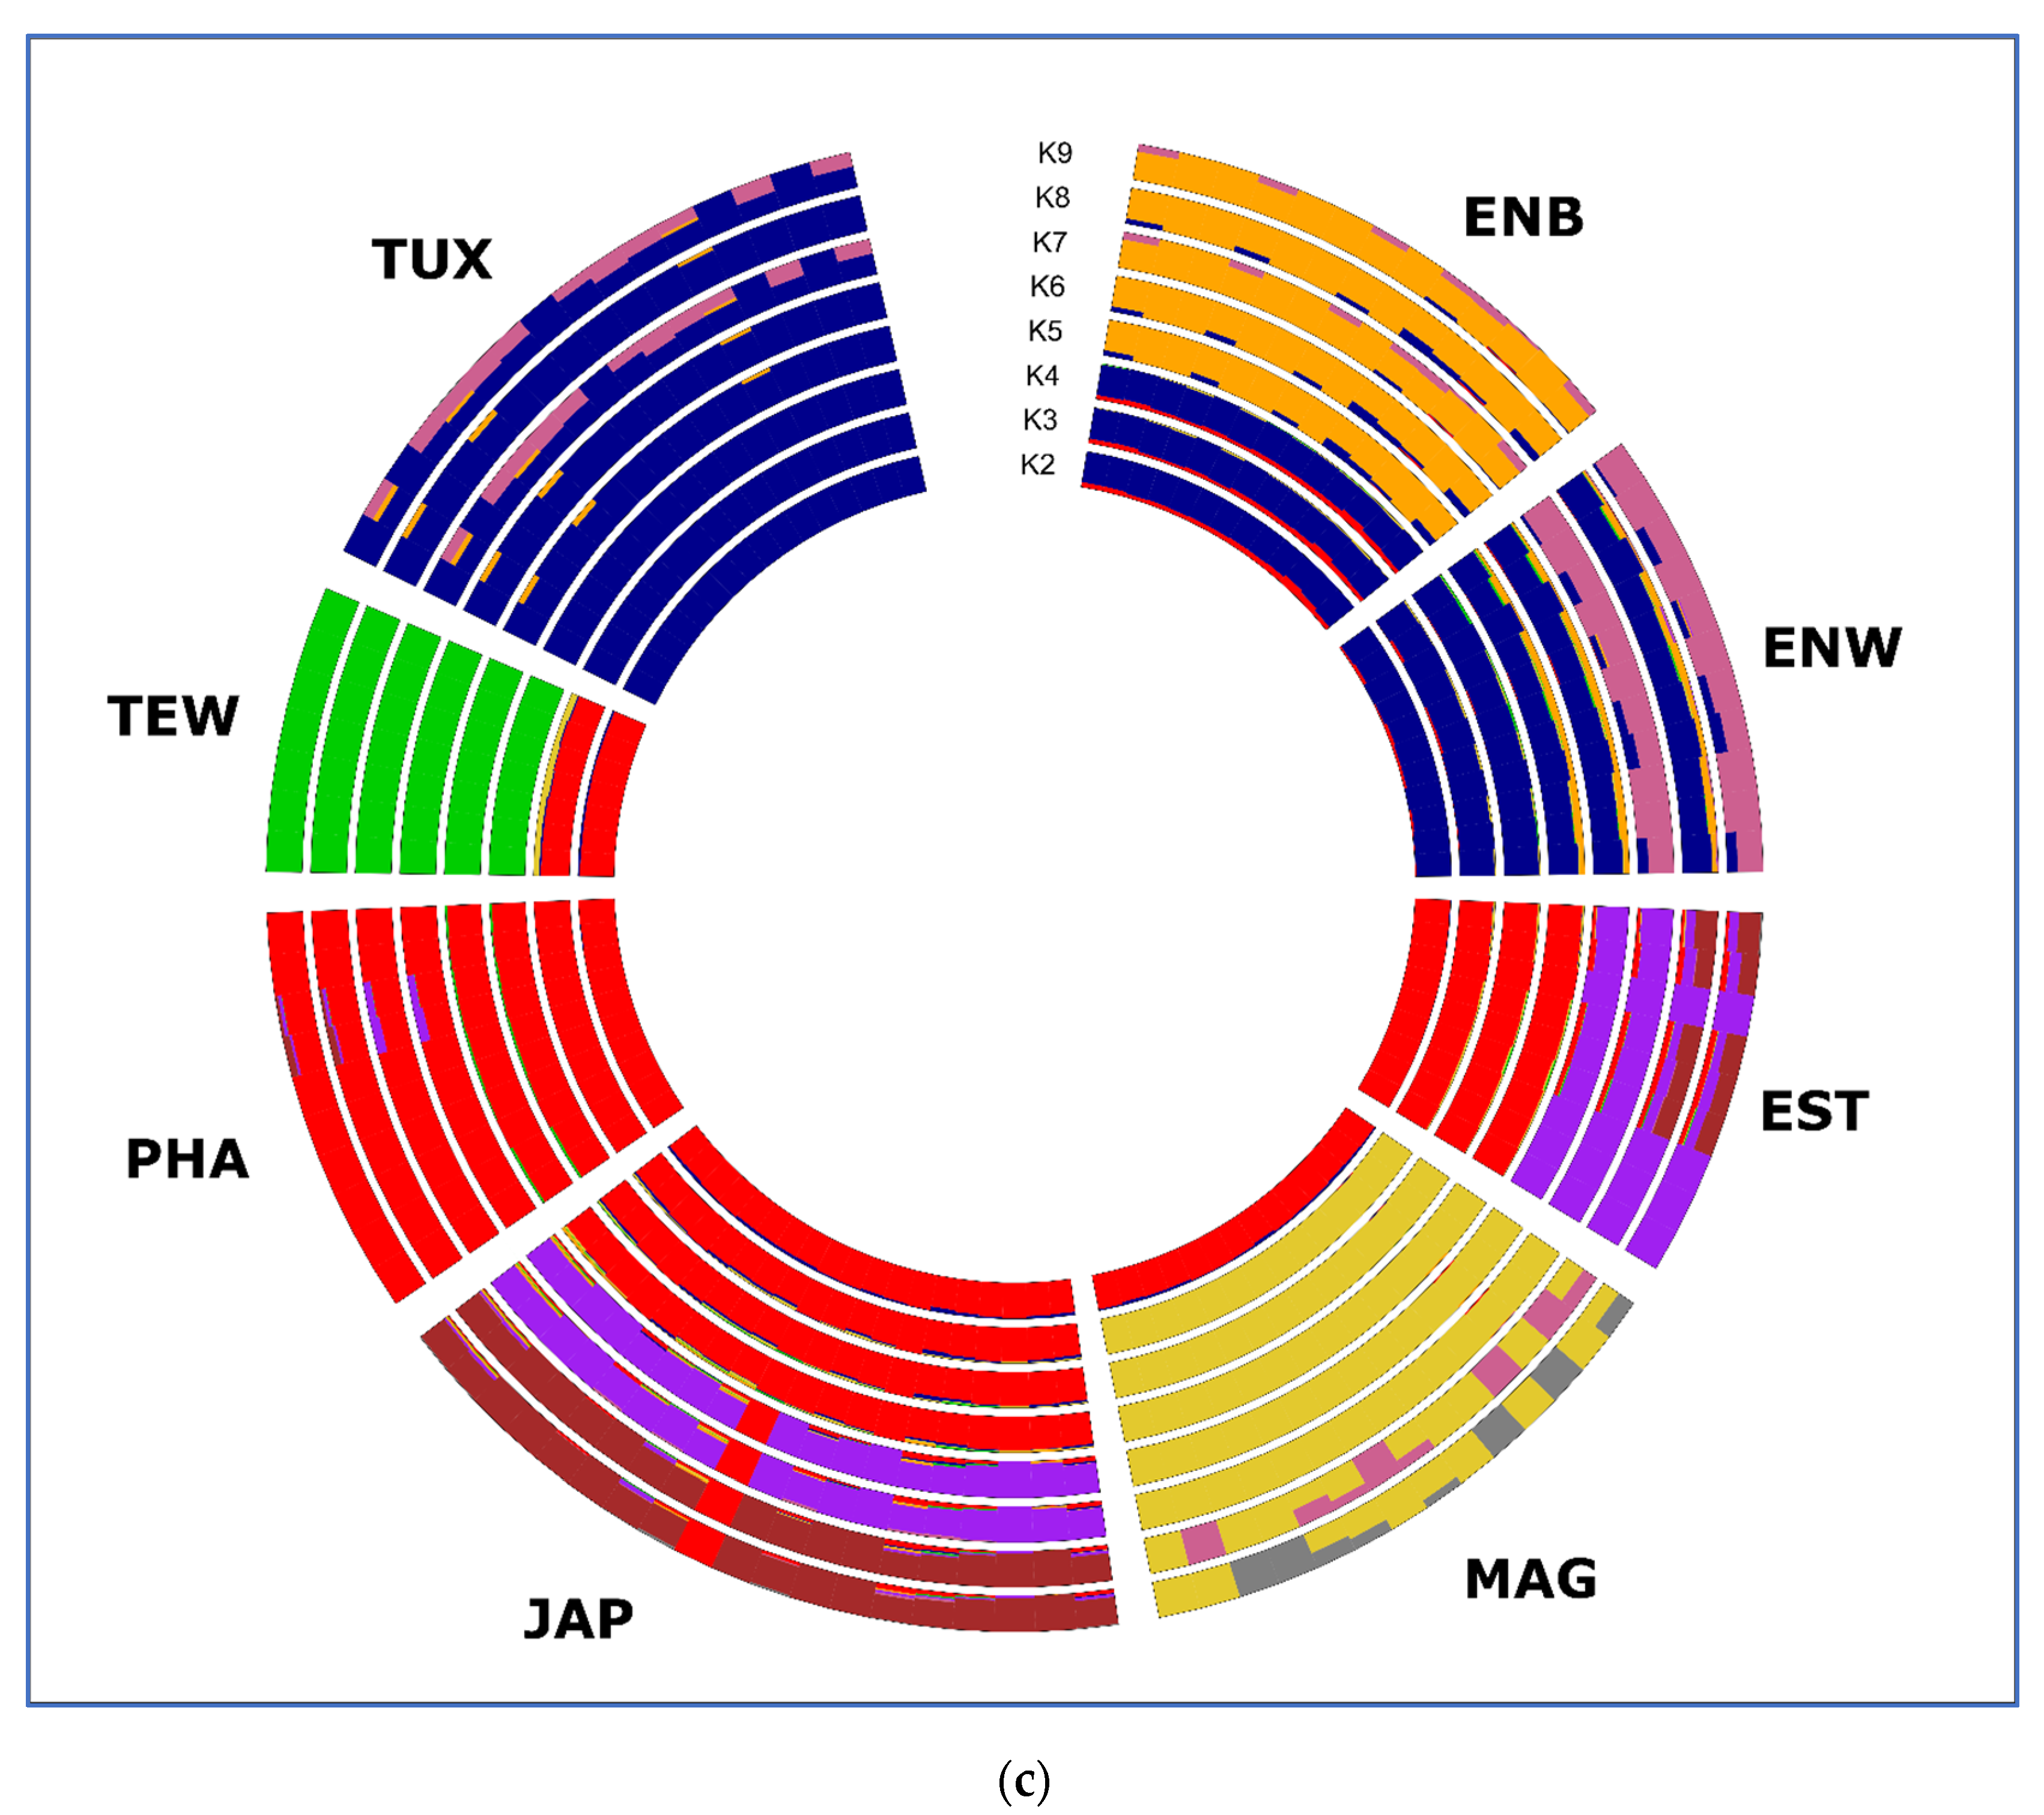
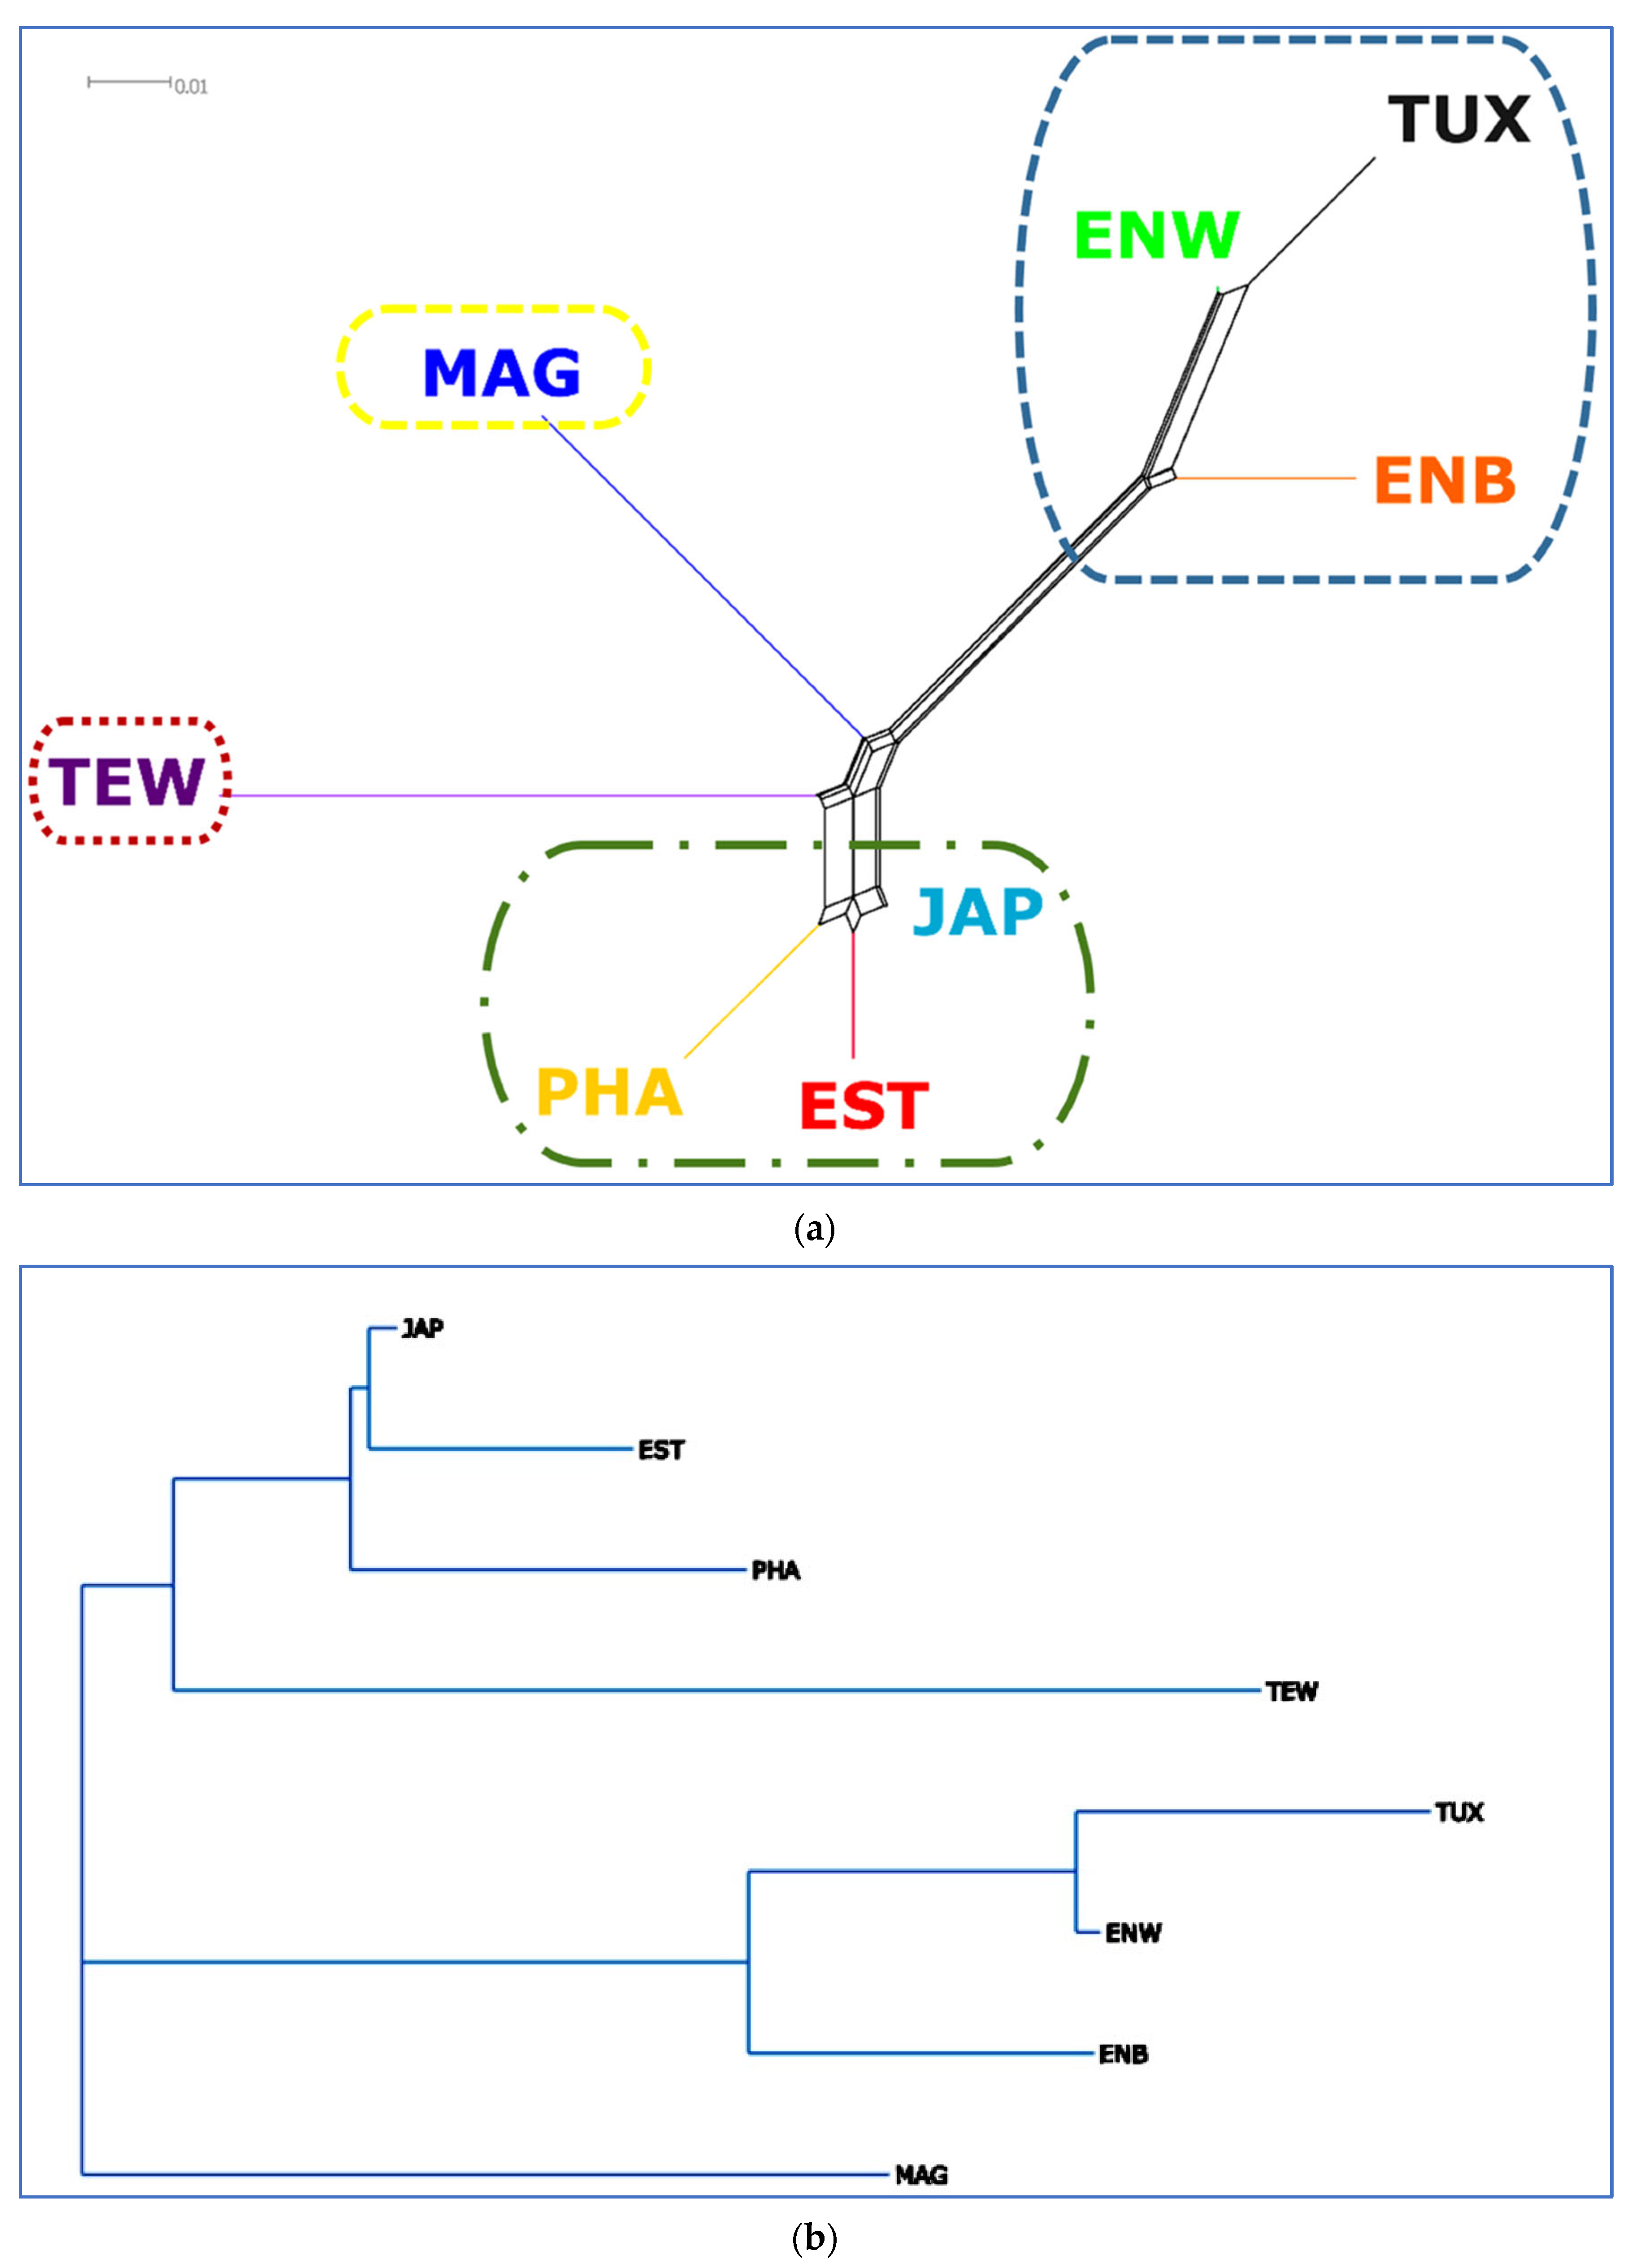
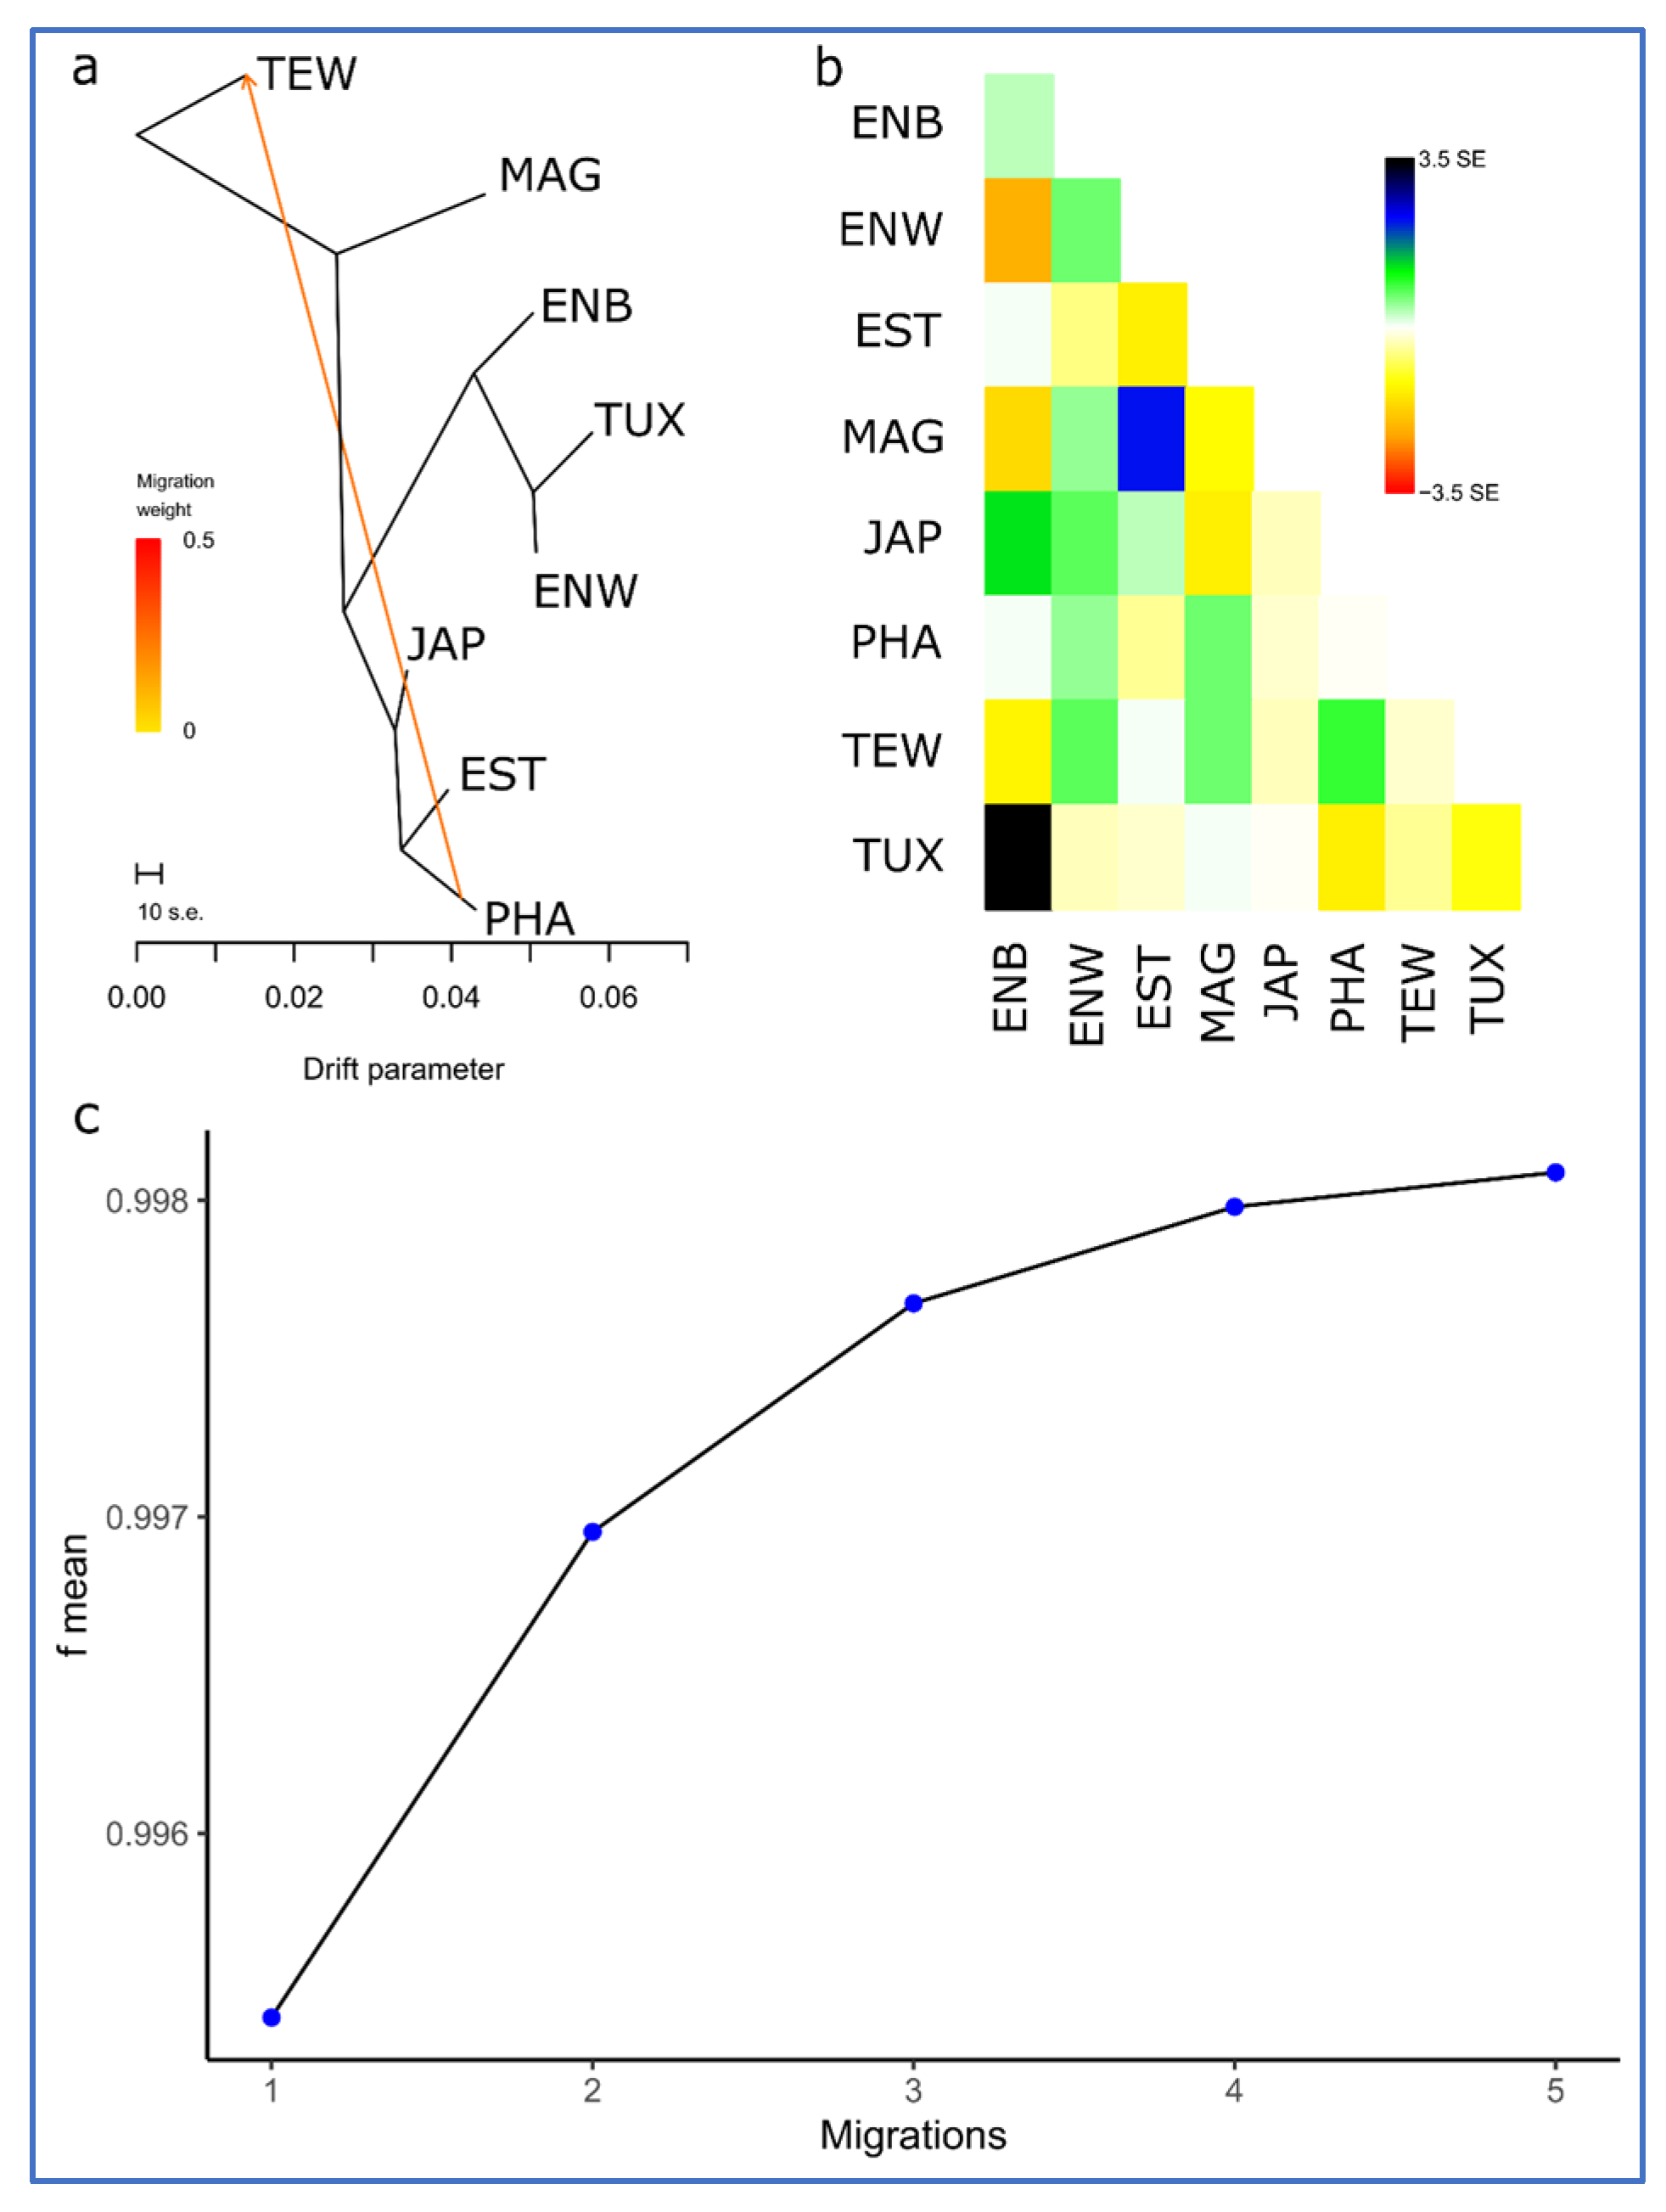
3.3. Between-Breed Genetic Relationships and Model-Based Clustering

PCA plots for various eight quail breeds based on the individual nucleotide sequence data as obtained using the GBS method are graphically presented in Figure 2.
The first component was responsible for 44.42% of genetic variability and differentiated the cluster of ENW, ENB and TUX from the cluster of JAP, EST, PHA and TEW. The second component conformed to 23.48% of genetic differences and showed the remote position of MAG relative to the other quail breeds, i.e., demonstrated its isolation from them. In the PC1–PC3 plane, TEW differentiated from the rest, and in the PC1–PC2 plane, the MAG population was separated from the others.
A Neighbor-Net tree based on the matrix of pairwise IBS distances for different quail population individuals revealed a clearcut breed differentiation judging from the distribution of individuals relative to each other in Figure 3.
During the Admixture-assisted analysis of ancestor populations and genetic impurities, calculations of the CV error for a different number of clusters (from 1 to 9) showed that the optimal number of clusters (K) was equal to 3 (Figure 4a,b). At K = 5, two groups of populations were clearly distinguished from each other as follows: (1) ENB + ENW + TUX, and (2) JAP + EST + PHA, while two single breeds, MAG and TEW, were genetically unique and distinct (Figure 4b). Clustering in the Admixture program (Figure 4c) demonstrated that MAG at K = 3 and TEW at K = 4 formed their own specific genomic pattern that was not observed in the other breeds. At the maximum tested level of clustering (K = 9), it was found that the genomic components predominantly represented in PHA were also present in EST and JAP, although this was already pronounced to a much lesser extent when K equaled 6 to 9. Shared genetic components were also observed in ENB (K = 4), ENW (K = 6 and K = 8), and TUX (K = 9).
The ENB, ENW and TUX breeds that formed a separate cluster partially overlapped each other. This was consistent with the history of the TUX descent through crossbreeding between ENW and English ENB, as well as the selection of these breeds for egg production. The formation of a joint cluster of JAP, EST, TEW and PHA breeds also conformed to the history of their origin and breeding. In particular, when creating EST, the PHA, JAP and ENW breeds were involved, and when developing TEW, the PHA breed was used.
To visualize the genetic distances between the studied populations, a dendrogram of phylogenetic networks were constructed based on pairwise FST genetic distances (Supplementary Table S2) and using the Neighbor-Net algorithm (Figure 5a).
The Neighbor-Net tree based on the values of pairwise FST genetic distances showed that the PHA, EST and JAP populations formed a juncture branch and were located close to each other at the bottom edge of the graph (Figure 5a), indicating their close genetic similarity. The neighboring branch localization of ENW, ENB, as well as TUX on the reconstructed network (Figure 5a) suggested a high genetic similarity of these quail breeds, too. The positioning of the MAG population at the root of the branch suggested that the improvement of this breed occurred mainly due to the selection of purebred quails with a low contribution from other breeds. TEW was also very clearly differentiated from the other breeds, although it was included in one large cluster along with JAP, EST and PHA. The Neighbor-Joining tree had a similar topology (Figure 5b).
Additionally, we analyzed the number and lengths of extended homozygous segments, i.e., ROHs (Table 4, Figure 6).
As can be seen from Figure 6, the greatest numbers of ROHs were within short (0.5–2 Mb) fragments. No ROHs longer than 16 Mb were found in the studied quail breeds. Those longer ROHs may be indicative of recent inbreeding events, and they were discovered in many studies in chickens (e.g., [59,60,61]). The largest number of fragments of medium length (2–4 and 4–8 Mb) was found in TEW and TUX, suggesting both ongoing breeding work aimed at consolidating desirable traits and the accumulation of homozygous fragments due to the small population size in these breeds. The smallest number and length of ROHs were observed in JAP and PHA.
All variants of migration events obtained using the TreeMix program and different number of iterations (from 1 to 30) are presented in Supplementary Figure S1. The analysis of migration events revealed the presence of expectable gene flows (migrations) between the breeds. In particular, a migration from PHA to TEW was determined for the best number of iterations (29 and 30; mean SE = 0.39; Supplementary Table S3). The respective dendrogram and residual matrix (heat map) are shown in Figure 7. When using other iteration numbers, there were also eight additional observations for the gene flow events between PHA and TEW (Supplementary Figure S1). This was fully confirmed by the known fact of using PHA as one of the progenitor breeds in the creation of TEW. In addition, it can be noted on the other graphs (with different number of iterations; Supplementary Figure S1) that another migration was repeated most often (15 of 30 iteration variants) between ENB and JAP. This also fits perfectly into the origin history of ENB as a mutation of JAP. Four cases of migrations between the ancestor of ENB, ENW and TUX were also observed, which is supported by the facts that ENB and ENW are mutants of JAP and TUX stemmed from crossing ENW and ENB (Table 1).

4. Discussion

In the era of integrative agriculture, there is a need, in the process of monitoring, breeding and selection, to link genetic and genomic technologies to breeding regimes for economically important traits (e.g., [24,62,63,64,65]). Performance traits are highest on the list for analysis. Many crucial areas of agricultural production and research such as plant and animal breeding and trait mapping call for reliable and scalable genotyping tools. One such approach that is ideal for non-human organisms is GBS [66,67,68,69,70], which can be effective for integrating genomic and performance data. In this regard, we made an attempt to demonstrate how “congruent” interbreed patterns of genomic architecture are with those for productivity traits in quails. In our GBS study, we, for the first time, collated and compared eight breeds of domestic quail. These represent a large share (~11%) of the world gene pool of quail breeds and three purposes of their use (in terms of productive traits), and they also illustrate the evolutionary component of the selection of individuals in the process of domestication and breeding of this bird species. Having assessed the performance traits and using IPI, we quite accurately confirmed the initial (conventional) classification of these breeds that has been established in the quail breeding practice depending on their selection direction and utility type.
The revealed phylogeny pattern based on genomic data, however, had a lower congruence with the breed configuration obtained from productivity traits using IPI. We note that the egg-type breeds TUX, ENB and ENW, which form a single cluster according to genomic data (see, for example, Figure 5), are located in Table 2 on three adjacent rows (with IPI from 8.3 to 9.0). Similarly, it can be seen that the meat-type breeds PHA and TEW, also located on two adjacent rows in Table 2 (IPI = ~5), were included in one large cluster on the phylogenetic tree. No other similar patterns were observed. Apparently, genomic data reflect not only the selection direction and utility type (due to specific breeding work with breeds), but also other features of the breeds, e.g., the history of their development (namely, the original breeds and populations), as well as genetic processes occurring in individual populations (gene flow, genetic drift, random or purposeful crossbreeding, etc.). Taking into account all of the above, we can confirm that, in a general sense and to a certain degree, data on history, management and phenotype are congruent with the description of the diversity between breeds/populations (e.g., [71]).
When analyzing genetic diversity of the eight breeds, we observed the difference between inbreeding measures based on FIS and ROH metrics. Most likely, these different estimates were a consequence of different approaches to calculating the two inbreeding indices. The FIS score is calculated based on the observed and expected heterozygosities and reflects a lack (or excess) of heterozygotes, while FROH conforms to the proportion of homozygous regions in the genome. The latter estimate appears to be more accurate than the former one because it directly assesses genomic homozygosity. These two indicators are normally calculated and reported in similar studies (e.g., [59,61,70]) to describe different aspects of the defined genomic diversity and homozygosity.
To date, there have been a number of investigations focusing on the genetic diversity in quails. These studies were mainly related to the assessment of the genotypes of domestic and wild quails in order to characterize the genetic structure of populations in these species [22,72,73], as well as the issues of their hybridization in the wild [74,75,76]. Most of the work in this area was executed using microsatellite and mtDNA markers [72,73,74,75,76,77]. However, the use of conventional molecular markers has drawbacks and limitations in the case of both mtDNA (e.g., [78,79,80]) and microsatellite markers (e.g., [81,82]). SNP-assisted applications are more advantageous (e.g., [83,84], and as demonstrated herein). In this paper, to explore the biology of different quail species, we employed a relatively new approach through the use of SNPs obtained via whole-genome sequencing and subsequent GBS analysis. The relevance and efficiency of implementing GBS for genome-wide genotyping has also been demonstrated in other poultry, model and non-model, species, including chickens [85], ducks [86,87] and geese [88]. For instance, Grzegorczyk et al. [88] studied the genetic diversity and phylogenetic relationships of 12 Polish goose breeds using the GBS approach and identified SNPs associated with economic traits. Zhu et al. [86] developed and tested the GBS protocol for ducks, which resulted in 169,209 significant SNPs. Using GBS in ducks, SNPs and genes associated with plumage color [87] and 18 carcass traits [89] were also identified.
This approach can sometimes be employed in combination with traditional molecular markers. For example, Mathur and DeWoody [90] examined the genetic diversity of three populations of the wild Montezuma quail (Cyrtonyx montezumae) using whole-genome sequencing data from 74 quails. Ogada et al. [22] utilized both mtDNA and GBS analyses to investigate the genetic diversity and demographic history of wild African harlequin quail populations of Siaya County. In the current study, we demonstrated the effectiveness of SNPs, as the currently most used molecular markers, and the GBS approach for a genome-wide comparative assessment of different breeds of domestic quail. At the same time, we confirmed the high resolution and analytical power of the GBS-derived SNP scanning method for solving problems in modern genetic research, as has been previously shown in similar studies [83,91]. For instance, Weigend et al. [83] reported the evaluation of clustering accuracy for 10 chicken populations into 10 cluster groups based on microsatellite markers and SNPs. Given that the SNP data generally contained more alleles than microsatellites, these two sets of data allowed a comparison between microsatellites and SNPs as genetic markers for biodiversity research in favor of more informative genome-wide SNPs.
Using GBS analysis for the first time to analyze the genomes of different domestic quail breeds, we observed a lower genetic diversity in TUX as compared to JAP quails (UHE = 0.265 vs. 0.319; Table 3). A possible reason for this may be genetic drift in the TUX population that is small in size (13 animals) and has been bred for a long time as a closed population. At the same time, the higher level of genetic diversity in JAP may also reflect the crossbred origin of the individuals used in this study. Our study confirmed that GBS analysis can be considered an appropriate tool for investigating intraspecific differentiation. Therefore, the discovered similarities/differences can be used as a marker of gene flow among the studied breed samples as was shown by us here as a result of TreeMix-assisted analysis of migration edges.
The results of PCA plotting, Neighbor-Net and Admixture clustering and other related genomic analyses (Figure 3, Figure 4, Figure 5, Figure 6 and Figure 7) clearly distinguished quail breeds and utility types in line with their specific genetic origins and selection for economically important traits. This differentiation can provide important information for the collection, conservation, research and utilization of quail genetic resources as shown in other poultry breeds [26,92,93,94,95,96]. In particular, using two genetically divergent breeds, JAP and TEW (e.g., Figure 2, Figure 3 and Figure 5), we recently created a model resource F2 population to perform a GWAS analysis of growth dynamics in quails [97]. As a result of crossing these two contrasting breeds (slow-growing egg-type JAP and fast-growing meat-type TEW), the F2 population had a significant range of variability in BW and other phenotypic traits and was instrumental in identifying a series of SNPs associated with BW and a number of the respective candidate genes [97].
Collectively, based on SNP genotypes using GBS analysis, our findings illustrated phylogenetic relationships for the eight quail breeds that represented the egg type, meat type and dual purpose of use. The phylogenetic trees built on the basis of GBS data showed that the JAP, PHA and EST breeds were genetically similar to a certain degree. In addition, according to the obtained tree configuration, it can be argued that these three breeds can be especially valuable sources of genetic variability since they were close to the root of the phylogenetic tree. MAG and TEW can be classified as genetically more distant relative to the other breeds studied and to one another. The clustering of ENB, ENW and TUX into one group corresponded, in terms of their relatedness, to the historical records of the development of these breeds. Overall, we were able to show that GBS analysis is an efficient and useful instrument for elucidating genomic architecture and divergence across different quail breeds.

5. Conclusions

Using the GBS molecular method in the present investigation, we evaluated, for the first time, the genetic diversity of the eight quail breeds (representing about 11% of the global quail germplasm) and identified their evolutionary relationships suggesting a possible relation to their performance. In particular, the respective genetic divergence was shown for the egg (JAP, ENW, ENB, TUX and MAG), meat (TEW and PHA) and dual-purpose (EST) utility types. This study contributes to the identification of genetic differentiation and determination of relatedness between the studied breeds. In addition, it was demonstrated for the first time that the GBS analysis method is instrumental in the intra- and inter-breed assessment of genetic variation in domestic quails. The information reported here facilitates a deeper understanding of the processes of breed formation and selection in quails and can be further used to improve their economically important traits by identifying significant SNPs and candidate genes associated with these traits.

Supplementary Materials

The following supporting information can be downloaded at: https://www.mdpi.com/article/10.3390/ani13223439/s1, Figure S1: Assessment of the degree of divergence and the level of gene flow between the studied quail breeds; Table S1: Pairwise interbreed Euclidean distances obtained for breed IPI values using the Phantasus program; Table S2: Pairwise FST-based interbreed genetic distances; Table S3: Mean SE values according to iteration number when calculating migration events obtained using the TreeMix program.

Author Contributions

Conceptualization, N.A.V. and N.A.Z.; methodology, A.S.A., P.V.L., D.V.A., V.I.F., V.G.N., J.S., G.B., J.C.M. and R.B.; software, A.S.A., P.V.L. and A.V.S.; validation, N.A.V., N.Y.G., A.N.V. and L.A.V.; formal analysis, M.N.R., A.S.A., P.V.L., A.V.S., D.V.A., V.I.F., V.G.N., J.S., G.B., J.C.M. and R.B.; investigation, N.Y.G., A.N.V., L.A.V., J.C.M. and R.B.; resources, D.V.A. and V.I.F.; data curation, N.A.V.; writing—original draft preparation, N.A.V., M.N.R. and P.V.L.; writing—review and editing, N.A.V., M.N.R., D.K.G., J.S., J.C.M. and N.A.Z.; visualization, N.A.V., M.N.R., A.S.A. and A.V.S.; supervision, N.A.V., D.K.G. and N.A.Z.; project administration, N.A.V. and N.A.Z.; funding acquisition, N.A.V. and N.A.Z. All authors have read and agreed to the published version of the manuscript.

Funding

This work was funded by the Russian Science Foundation, Grant No. 21-16-00086 (https://rscf.ru/en/project/21-16-00086, accessed on 25 September 2023), and by the Ministry of Science and Higher Education of the Russian Federation, Grant No. 075-15-2021-1037 (Internal No. 15.BRK.21.0001).

Institutional Review Board Statement

The study was conducted according to the guidelines of the Declaration of Helsinki and the LKEFRCAH ethical guidelines. Protocol No. 7 was approved by the LKEFRCAH Commission on the BioEthics of Animal Experiments on 10 August 2021.

Informed Consent Statement

Not applicable.

Data Availability Statement

The sequence data is accessible to readers on request.

Acknowledgments

Genotyping-by-sequencing services were provided by AgResearch (Lincoln, Canterbury, New Zealand; https://www.agresearch.co.nz/partnering-with-us/products-and-services/genomnz/genotyping-services/, accessed on 25 September 2023), under curation of Tracey Van Stijn ([email protected]).

Conflicts of Interest

The authors declare no conflict of interest.

References

  1. Venkitanarayanan, K.; Thakur, S.; Ricke, S.C. (Eds.) Food Safety in Poultry Meat Production; Springer International Publishing: Cham, Switzerland, 2019; ISBN 978-3-030-05010-8/978-3-030-05011-5. [Google Scholar] [CrossRef]
  2. Vorotnikov, V. Russia Puts Focus on ‘Non-Traditional’ Poultry; FoodNavigator Europe; William Reed Ltd.: Crawley, UK, 2014; Available online: https://www.foodnavigator.com/Article/2014/01/16/Russia-s-non-traditional-poultry-sees-planned-boost (accessed on 25 September 2023).
  3. Minvielle, F. What are quail good for in a chicken-focused world? Worlds Poult. Sci. J. 2009, 65, 601–608. [Google Scholar] [CrossRef]
  4. Romanov, M.N.; Sazanov, A.A.; Moiseyeva, I.G.; Smirnov, A.F. Poultry. In Genome Mapping and Genomics in Animals, Vol. 3: Genome Mapping and Genomics in Domestic Animals; Cockett, N.E., Kole, C., Eds.; Springer: Berlin/Heidelberg, Gemany; New York, NY, USA, 2009; pp. 75–141. ISBN 978-3-540-73834-3/978-3-540-73835-0. [Google Scholar] [CrossRef]
  5. Podstreshnyi, O.P.; Tereshchenko, O.V.; Katerynych, O.O.; Tkachyk, T.E.; Podstreshna, I.O. Production of Quail Eggs and Meat: Methodical Recommendations, 2nd ed.; Tereshchenko, O.V., Ed.; Poultry Research Institute, NAAS of Ukraine: Birky, Ukraine, 2010; Available online: https://www.researchgate.net/publication/342802513_Podstresnij_OP_Teresenko_OV_Katerinic_OO_Tkacik_TE_Podstresna_IO_Virobnictvo_perepelinih_aec_ta_m’asa_metodicni_rekomendacii_Uklad_OV_Teresenko_ta_in_pid_red_OV_Teresenka_-_2-e_vid_pererob_ta_dop_-_Bi (accessed on 25 September 2023). (In Ukrainian)
  6. Podstreshnyi, O.; Tereshchenko, O. Maintenance of adult quails. Ahrar. Krayina 2012, 6, 8–9. Available online: https://www.researchgate.net/publication/342832587_Podstresnij_O_Teresenko_O_Utrimanna_doroslih_perepeliv_Agrarna_kraina_-_2012_-_Cerven-_S_8-9 (accessed on 25 September 2023). (In Ukrainian).
  7. Podstreshnyi, O.; Tereshchenko, O. Feeding young quails. Ahrar. Krayina 2012, 7, 6. Available online: https://www.researchgate.net/publication/342832583_Podstresnij_O_Teresenko_O_Godivla_molodnaka_perepeliv_Agrarna_kraina_-_2012_-_Lipen_-_S_6_httpagrokrainacomuapoultry_farming268-godvlya-molodnyaka-perepelvhtml (accessed on 25 September 2023). (In Ukrainian).
  8. Shimakura, K. Notes on the genetics of the Japanese quail: I. The simple, Mendelian, autosomal, recessive character, “brown-splashed white”, of its plumage. Jpn. J. Genet. 1940, 16, 106–112, (In Japanese with English Summary). [Google Scholar] [CrossRef]
  9. Huss, D.; Poynter, G.; Lansford, R. Japanese quail (Coturnix japonica) as a laboratory animal model. Lab. Anim. 2008, 37, 513–519. [Google Scholar] [CrossRef]
  10. Chang, G.B.; Chang, H.; Liu, X.P.; Xu, W.; Wang, H.Y.; Zhao, W.M.; Olowofeso, O. Developmental research on the origin and phylogeny of quails. Worlds Poult. Sci. J. 2005, 61, 105–112. [Google Scholar] [CrossRef]
  11. Romanov, M.N.; Wezyk, S.; Cywa-Benko, K.; Sakhatsky, N.I. Poultry genetic resources in the countries of Eastern Europe—History and current state. Poult. Avian Biol. Rev. 1996, 7, 1–29. Available online: https://www.researchgate.net/publication/255710929_Poultry_genetic_resources_in_the_countries_of_Eastern_Europe_-_history_and_current_state (accessed on 25 September 2023).
  12. Volkovoy, S.; Bondarenko, Y. Japanese quail plumage rainbow. Priusadebnoye Khozyaystvo 1989, 5, 14–15. Available online: https://yablonka.net/world/zh/686-raduga-opereniya-yaponskogo-perepela.html (accessed on 25 September 2023). (In Russian).
  13. Genofond. Catalogue of Breeds: Quails; Official Site of the Company Genofond LLC: Sergiev Posad, Russia, 2015; Available online: http://www.genofond-sp.ru/quail.html (accessed on 25 September 2023). (In Russian)
  14. Baumgartner, J.; Bondarenko, Y.V. Search for Autosexing Strains and Crosses in Japanese Quail. In Proceedings of the 8th International Symposium on Actual Problems of Avian Genetics, Smolenice, Czechoslovakia, 3–6 April 1989; Slovak Society for Agriculture, Forestry, Food and Veterinary Sciences of Slovak Academy of Sciences: Bratislava, Czechoslovakia; Poultry Research and Production Institute: Ivanka pri Dunaji, Bratislava, Czechoslovakia; Czechoslovak Branch of WPSA: Smolenice, Czechoslovakia, 1989; pp. 262–265. [Google Scholar]
  15. Bondarenko, Y.V. Contemporary Methods for Determining the Sex of Young Domestic and Ornamental Birds, 4th ed.; NTUL: Sumy, Ukraine, 2020; Available online: https://web.archive.org/web/20220325163425/https:/repo.snau.edu.ua/bitstream/123456789/8319/1/%D0%9A%D0%BD%D0%B8%D0%B3%D0%B0%20%D0%91%D0%BE%D0%BD%D0%B4%D0%B0%D1%80%D0%B5%D0%BD%D0%BA%D0%BE_%2B17.12.%202019%20%D0%A0%D0%BE%D0%B7%D0%B1%D0%BB%D0%BE%D0%BA%D0%BE%D0%B2%D0%B0%D0%BD%D0%B0.pdf (accessed on 25 September 2023). (In Russian)
  16. Elshire, R.J.; Glaubitz, J.C.; Sun, Q.; Poland, J.A.; Kawamoto, K.; Buckler, E.S.; Mitchell, S.E. A robust, simple genotyping-by-sequencing (GBS) approach for high diversity species. PLoS ONE 2011, 6, e19379. [Google Scholar] [CrossRef]
  17. Gurgul, A.; Miksza-Cybulska, A.; Szmatoła, T.; Jasielczuk, I.; Piestrzyńska-Kajtoch, A.; Fornal, A.; Semik-Gurgul, E.; Bugno-Poniewierska, M. Genotyping-by-sequencing performance in selected livestock species. Genomics 2019, 111, 186–195. [Google Scholar] [CrossRef] [PubMed]
  18. Sonah, H.; Bastien, M.; Iquira, E.; Tardivel, A.; Légaré, G.; Boyle, B.; Normandeau, É.; Laroche, J.; Larose, S.; Jean, M.; et al. An improved genotyping by sequencing (GBS) approach offering increased versatility and efficiency of SNP discovery and genotyping. PLoS ONE 2013, 8, e54603. [Google Scholar] [CrossRef] [PubMed]
  19. Jacobs, J.; Clarke, S.; Faville, M.; Griffiths, A.; Cao, M.; Tan, R.; Van Stijn, T.; Anderson, R.; Ashby, R.; Rowe, S.; et al. Genotyping-by-sequencing Applications in Biology. In Proceedings of the Plant and Animal Genome XXV Conference, San Diego, CA, USA, 13–18 January 2017; Scherago International: Surfside, FL, USA, 2017. Abstract P0128. [Google Scholar] [CrossRef]
  20. De Donato, M.; Peters, S.O.; Mitchell, S.E.; Hussain, T.; Imumorin, I.G. Genotyping-by-sequencing (GBS): A novel, efficient and cost-effective genotyping method for cattle using next-generation sequencing. PLoS ONE 2013, 8, e62137. [Google Scholar] [CrossRef] [PubMed]
  21. Larson, W.A.; Seeb, L.W.; Everett, M.V.; Waples, R.K.; Templin, W.D.; Seeb, J.E. Genotyping by sequencing resolves shallow population structure to inform conservation of Chinook salmon (Oncorhynchus tshawytscha). Evol. Appl. 2014, 7, 355–369. [Google Scholar] [CrossRef] [PubMed]
  22. Ogada, S.; Otecko, N.O.; Moraa Kennedy, G.; Musina, J.; Agwanda, B.; Obanda, V.; Lichoti, J.; Peng, M.S.; Ommeh, S. Demographic history and genetic diversity of wild African harlequin quail (Coturnix delegorguei delegorguei) populations of Kenya. Ecol. Evol. 2021, 11, 18562–18574. [Google Scholar] [CrossRef] [PubMed]
  23. Ravagni, S.; Sanchez-Donoso, I.; Jiménez-Blasco, I.; Andrade, P.; Puigcerver, M.; Chorão Guedes, A.; Godinho, R.; Gonçalves, D.; Leitão, M.; Leonard, J.A.; et al. Evolutionary history of an island endemic, the Azorean common quail. Mol. Ecol. 2023. [Google Scholar] [CrossRef] [PubMed]
  24. Prituzhalova, A.O.; Volkova, N.A.; Kuzmina, T.I.; Vetokh, A.N.; Dzhagaev, A.Y. Monitoring of indicators of chromatin status in quails ovarian follicles granulosa cells of different directions of productivity. Agrar. Nauka 2023, 368, 53–57, (In Russian with English Summary). [Google Scholar] [CrossRef]
  25. Mills, A.D.; Crawford, L.L.; Domjan, M.; Faure, J.M. The behavior of the Japanese or domestic quail Coturnix japonica. Neurosci. Biobehav. Rev. 1997, 21, 261–281. [Google Scholar] [CrossRef] [PubMed]
  26. Ryabokon, Y.O.; Pabat, V.O.; Mykytyuk, D.M.; Frolov, V.V.; Katerynych, O.O.; Bondarenko, Y.V.; Mosyakina, T.V.; Gadyuchko, O.T.; Kovalenko, G.T.; Gritsenko, D.M.; et al. Catalog of Poultry Breeding Resources of Ukraine; Ryabokon, Y.O., Ed.; Poultry Research Institute: Kharkiv, Ukraine, 2005; Available online: http://avianua.com/archiv/plevreestr/per.pdf (accessed on 25 September 2023). (In Ukrainian)
  27. Domesticfutures. Quail Breeds: Characteristics with Photos; domesticfutures.com. 2021. Available online: https://domesticfutures.com/porody-perepelov-harakteristiki-s-fotografiyami-4457 (accessed on 25 September 2023).
  28. Genchev, A. Egg production potential of Manchurian Golden quail breeders. Agric. Sci. Technol. 2011, 3, 73–80. Available online: http://agriscitech.eu/wp-content/uploads/2014/05/GB_02.pdf (accessed on 25 September 2023).
  29. Purely Poultry. Gold Coturnix Quail Set; Purely Poultry: Durand, WI, USA, 2023; Available online: https://www.purelypoultry.com/index.php?main_page=product_info&products_id=1267 (accessed on 25 September 2023).
  30. German, N.Y.; Vetokh, A.N.; Dzhagaev, A.Y.; Ilyina, E.R.; Kotova, T.O. Morphometric parameters of eggs from breeds quail for meat. Vet. Kormlenie 2023, 2, 20–23, (In Russian with English Summary). [Google Scholar] [CrossRef]
  31. Vakhrameev, A.B.; Narushin, V.G.; Larkina, T.A.; Barkova, O.Y.; Peglivanyan, G.K.; Dysin, A.P.; Dementieva, N.V.; Makarova, A.V.; Shcherbakov, Y.S.; Pozovnikova, M.V.; et al. Disentangling clustering configuration intricacies for divergently selected chicken breeds. Sci. Rep. 2023, 13, 3319. [Google Scholar] [CrossRef] [PubMed]
  32. GraphPad Software. Dotmatics. Available online: https://www.graphpad.com/ (accessed on 18 October 2023).
  33. Dodds, K.G.; McEwan, J.C.; Brauning, R.; Anderson, R.M.; van Stijn, T.C.; Kristjánsson, T.; Clarke, S.M. Construction of relatedness matrices using genotyping-by-sequencing data. BMC Genom. 2015, 16, 1047. [Google Scholar] [CrossRef] [PubMed]
  34. AgResearch. DECONVQC; GitHub, Inc. 2016. Available online: https://github.com/AgResearch/DECONVQC (accessed on 25 September 2023).
  35. Andrews, S. FastQC: A Quality Control Tool for High Throughput Sequence Data; Version 0.10.1; Bioinformatics Group, Babraham Institute: Cambridge, UK, 2012; Available online: http://www.bioinformatics.babraham.ac.uk/projects/fastqc (accessed on 25 September 2023).
  36. Morris, K.M.; Hindle, M.M.; Boitard, S.; Burt, D.W.; Danner, A.F.; Eory, L.; Forrest, H.L.; Gourichon, D.; Gros, J.; Hillier, L.W.; et al. The quail genome: Insights into social behaviour, seasonal biology and infectious disease response. BMC Biol. 2020, 18, 14. [Google Scholar] [CrossRef]
  37. Szpak, M. Ensembl 104 Has Been Released; Ensembl Blog. 2021. Available online: https://www.ensembl.info/2021/05/05/ensembl-104-has-been-released/ (accessed on 25 September 2023).
  38. Martin, M. Cutadapt removes adapter sequences from high-throughput sequencing reads. EMBnet J. 2011, 17, 10–12. [Google Scholar] [CrossRef]
  39. Martin, M. Cutadapt. Version 3.4; GitHub, Inc. 2021. Available online: https://github.com/marcelm/cutadapt (accessed on 25 September 2023).
  40. Kang, J.; Dodds, K.; Byrne, S.; Faville, M.; Black, M.; Hess, A.; Hess, M.; McCulloch, A.; Jacobs, J.; Milbourne, D.; et al. snpGBS: A Simple and Flexible Bioinformatics Workflow to Identify SNPs from Genotyping-by-sequencing Data. In Exploiting Genetic Diversity of Forages to Fulfil Their Economic and Environmental Roles, Proceedings of the 34th Meeting of the EUCARPIA Fodder Crops and Amenity Grasses Section in Cooperation with the EUCARPIA Festulolium Working Group, Freising, Germany, 6–8 September 2021; Hartmann, S., Bachmann-Pfabe, S., Byrne, S., Feuerstein, U., Julier, B., Kölliker, R., Kopecky, D., Roldan-Ruiz, I., Ruttink, T., Sampoux, J.-P., et al., Eds.; Palacký University Press: Olomouc, Czech Republic, 2021; pp. 67–70. ISBN 978-80-244-5967-7/978-80-244-5968-4/978-80-244-5969-1. [Google Scholar] [CrossRef]
  41. AgResearch. snpGBS; GitHub, Inc. 2021. Available online: https://github.com/AgResearch/snpGBS (accessed on 25 September 2023).
  42. Langmead, B. bowtie2: A Fast and Sensitive Gapped Read Aligner. Version 2.4.4; GitHub, Inc. 2021. Available online: https://github.com/BenLangmead/bowtie2 (accessed on 25 September 2023).
  43. Li, H.; Handsaker, B.; Wysoker, A.; Fennell, T.; Ruan, J.; Homer, N.; Marth, G.; Abecasis, G.; Durbin, R.; 1000 Genome Project Data Processing Subgroup. The Sequence Alignment/Map format and SAMtools. Bioinformatics 2009, 25, 2078–2079. [Google Scholar] [CrossRef] [PubMed]
  44. Danecek, P.; Bonfield, J.K.; Liddle, J.; Marshall, J.; Ohan, V.; Pollard, M.O.; Whitwham, A.; Keane, T.; McCarthy, S.A.; Davies, R.M.; et al. Twelve years of SAMtools and BCFtools. GigaScience 2021, 10, giab008. [Google Scholar] [CrossRef]
  45. R Core Team. R: A Language and Environment for Statistical Computing; R Foundation for Statistical Computing: Vienna, Austria, 2018; Available online: https://www.r-project.org/ (accessed on 25 September 2023).
  46. Purcell, S.; Neale, B.; Todd-Brown, K.; Thomas, L.; Ferreira, M.A.; Bender, D.; Maller, J.; Sklar, P.; de Bakker, P.I.; Daly, M.J.; et al. PLINK: A tool set for whole-genome association and population-based linkage analyses. Am. J. Hum. Genet. 2007, 81, 559–575. [Google Scholar] [CrossRef]
  47. Keenan, K.; McGinnity, P.; Cross, T.F.; Crozier, W.W.; Prodohl, P.A. diveRsity: An R package for the estimation and exploration of population genetics parameters and their associated errors. Methods Ecol. Evol. 2013, 4, 782–788. [Google Scholar] [CrossRef]
  48. Kalinowski, S.T. Counting alleles with rarefaction: Private alleles and hierarchical sampling designs. Conserv. Genet. 2004, 5, 539–543. [Google Scholar] [CrossRef]
  49. Wickham, H. ggplot2: Elegant Graphics for Data Analysis; Springer: New York, NY, USA, 2009; ISBN 978-0-387-98141-3. [Google Scholar] [CrossRef]
  50. Huson, D.H.; Bryant, D. Application of phylogenetic networks in evolutionary studies. Mol. Biol. Evol. 2006, 23, 254–267. [Google Scholar] [CrossRef]
  51. Alexander, D.H.; Novembre, J.; Lange, K. Fast model-based estimation of ancestry in unrelated individuals. Genome Res. 2009, 19, 1655–1664. [Google Scholar] [CrossRef]
  52. Milanesi, M.; Capomaccio, S.; Vajana, E.; Bomba, L.; Garcia, J.F.; Ajmone-Marsan, P.; Colli, L. BITE: An R package for biodiversity analyses. bioRxiv 2017, 181610. [Google Scholar] [CrossRef]
  53. Zenkova, D.; Kamenev, V.; Sablina, R.; Artyomov, M.; Sergushichev, A. Phantasus: Visual and Interactive Gene Expression Analysis. 2018. Available online: https://ctlab.itmo.ru/phantasus (accessed on 25 September 2023). [CrossRef]
  54. Boc, A.; Diallo, A.B.; Makarenkov, V. T-REX: A web server for inferring, validating and visualizing phylogenetic trees and networks. Nucleic Acids Res. 2012, 40, W573–W579. [Google Scholar] [CrossRef] [PubMed]
  55. Saitou, N.; Nei, M. The neighbor-joining method: A new method for reconstructing phylogenetic trees. Mol. Biol. Evol. 1987, 4, 406–425. [Google Scholar] [CrossRef]
  56. Pickrell, J.K.; Pritchard, J.K. Inference of population splits and mixtures from genome-wide allele frequency data. PLoS Genet. 2012, 8, e1002967. [Google Scholar] [CrossRef] [PubMed]
  57. Fitak, R.R. OptM: Estimating the optimal number of migration edges on population trees using Treemix. Biol. Methods Protoc. 2021, 6, bpab017. [Google Scholar] [CrossRef] [PubMed]
  58. Biscarini, F.; Paolo Cozzi, P.; Gaspa, G.; Marras, G. detectRUNS: Detect Runs of Homozygosity and Runs of Heterozygosity in Diploid Genomes; R Package Version 0.9.6; The Comprehensive R Archive Network (CRAN); Institute for Statistics and Mathematics, Vienna University of Economics and Business: Vienna, Austria, 2019; Available online: https://CRAN.R-project.org/package=detectRUNS (accessed on 25 September 2023).
  59. Abdelmanova, A.S.; Dotsev, A.V.; Romanov, M.N.; Stanishevskaya, O.I.; Gladyr, E.A.; Rodionov, A.N.; Vetokh, A.N.; Volkova, N.A.; Fedorova, E.S.; Gusev, I.V.; et al. Unveiling comparative genomic trajectories of selection and key candidate genes in egg-type Russian White and meat-type White Cornish chickens. Biology 2021, 10, 876. [Google Scholar] [CrossRef]
  60. Rostamzadeh Mahdabi, E.; Esmailizadeh, A.; Ayatollahi Mehrgardi, A.; Asadi Fozi, M. A genome-wide scan to identify signatures of selection in two Iranian indigenous chicken ecotypes. Genet. Sel. Evol. 2021, 53, 72. [Google Scholar] [CrossRef]
  61. Cendron, F.; Mastrangelo, S.; Tolone, M.; Perini, F.; Lasagna, E.; Cassandro, M. Genome-wide analysis reveals the patterns of genetic diversity and population structure of 8 Italian local chicken breeds. Poult. Sci. 2021, 100, 441–451. [Google Scholar] [CrossRef]
  62. Moiseyeva, I.G.; Bannikova, L.V.; Altukhov, Y.P. State of poultry breeding in Russia: Genetic monitoring. Mezhdunar. S-kh. Zh. 1993, 5–6, 66–69. (In Russian) [Google Scholar]
  63. Bondarenko, Y.V.; Kutnyuk, P.I. Some Results of Genetic Monitoring of Embryonic Defects in Poultry Populations. In Gene Pool of Animal Breeds and Methods of its Use, Proceedings of the Materials of the International Scientific and Practical Conference Dedicated to the 110th Anniversary of the Birth of Academician N.D. Potemkin, Kharkov, Ukraine, 5–6 December 1995; Ministry of Agriculture and Food of Ukraine, Kharkov Zooveterinary Institute, RIO KhZVI: Kharkov, Ukraine, 1995; pp. 63–64. (In Russian) [Google Scholar]
  64. Bondarenko, Y.V.; Podstreshny, A.P. Genetic Monitoring of Chicken Populations. In Proceedings of the 2nd International Conference on Molecular Genetic Markers of Animals, Kiev, Ukraine, 15–17 May 1996; Agrarna Nauka: Kiev, Ukraine, 1996; pp. 47–48. (In Russian). [Google Scholar]
  65. Zakharov-Gesekhus, I.A.; Stolpovsky, Y.A.; Ukhanov, S.V.; Moiseyeva, I.G.; Sulimova, G.E. Monitoring the gene pools of animal populations in connection with selection tasks and the study of phylogeny. In Farm Animals; Russian Academy of Sciences: Moscow, Russia, 2007; pp. 122–124. (In Russian) [Google Scholar]
  66. Heffelfinger, C.; Fragoso, C.A.; Moreno, M.A.; Overton, J.D.; Mottinger, J.P.; Zhao, H.; Tohme, J.; Dellaporta, S.L. Flexible and scalable genotyping-by-sequencing strategies for population studies. BMC Genom. 2014, 15, 979. [Google Scholar] [CrossRef] [PubMed]
  67. Mischler, C.; Veale, A.; Van Stijn, T.; Brauning, R.; McEwan, J.C.; Maloney, R.; Robertson, B.C. Population connectivity and traces of mitochondrial introgression in New Zealand black-billed gulls (Larus bulleri). Genes 2018, 9, 544. [Google Scholar] [CrossRef] [PubMed]
  68. Rexer-Huber, K.; Veale, A.J.; Catry, P.; Cherel, Y.; Dutoit, L.; Foster, Y.; McEwan, J.C.; Parker, G.C.; Phillips, R.A.; Ryan, P.G.; et al. Genomics detects population structure within and between ocean basins in a circumpolar seabird: The white-chinned petrel. Mol. Ecol. 2019, 28, 4552–4572. [Google Scholar] [CrossRef]
  69. Wold, J.R.; Robertson, C.J.; Chambers, G.K.; Van Stijn, T.; Ritchie, P.A. Genetic connectivity in allopatric seabirds: Lack of inferred gene flow between Northern and Southern Buller’s albatross populations (Thalassarche bulleri ssp.). Emu-Austral Ornithol. 2021, 121, 113–123. [Google Scholar] [CrossRef]
  70. Foster, Y.; Dutoit, L.; Grosser, S.; Dussex, N.; Foster, B.J.; Dodds, K.G.; Brauning, R.; Van Stijn, T.; Robertson, F.; McEwan, J.C.; et al. Genomic signatures of inbreeding in a critically endangered parrot, the kākāpō. G3 2021, 11, jkab307. [Google Scholar] [CrossRef] [PubMed]
  71. Tixier-Boichard, M.; Coquerelle, G.; Vilela-Lamego, C.; Weigend, S.; Barre-Dirrie, A.; Groenen, M.; Crooijmans, R.; Vignal, A.; Hillel, J.; Freidlin, P.; et al. Contribution of Data on History, Management and Phenotype to the Description of the Diversity between Chicken Populations Sampled within the AVIANDIV Project. In Proceedings of the Poultry Genetics Symposium, Mariensee, Germany, 6–8 October 1999; Preisinger, R., Ed.; Working Group 3 of WPSA, Lohmann Tierzucht: Cuxhaven, Germany, 1999; pp. 15–21. Available online: https://jukuri.luke.fi/handle/10024/446389 (accessed on 25 September 2023).
  72. Nunome, M.; Nakano, M.; Tadano, R.; Kawahara-Miki, R.; Kono, T.; Takahashi, S.; Kawashima, T.; Fujiwara, A.; Nirasawa, K.; Mizutani, M.; et al. Genetic divergence in domestic Japanese quail inferred from mitochondrial DNA D-loop and microsatellite markers. PLoS ONE 2017, 12, e0169978. [Google Scholar] [CrossRef]
  73. Smith, S.; Fusani, L.; Boglarka, B.; Sanchez-Donoso, I.; Marasco, V. Lack of introgression of Japanese quail in a captive population of common quail. Eur. J. Wildl. Res. 2018, 64, 51. [Google Scholar] [CrossRef]
  74. Amaral, A.J.; Silva, A.B.; Grosso, A.R.; Chikhi, L.; Bastos-Silveira, C.; Dias, D. Detection of hybridization and species identification in domesticated and wild quails using genetic markers. Folia Zool. 2007, 56, 285–300. Available online: https://www.ivb.cz/wp-content/uploads/56_285-300.pdf (accessed on 25 September 2023).
  75. Barilani, M.; Deregnaucourt, S.; Gallego, S.; Galli, L.; Mucci, N.; Piombo, R.; Puigcerver, M.; Rimondi, S.; Rodríguez-Teijeiro, J.D.; Spanò, S.; et al. Detecting hybridization in wild (Coturnix c. coturnix) and domesticated (Coturnix c. japonica) quail populations. Biol. Conserv. 2005, 126, 445–455. [Google Scholar] [CrossRef]
  76. Chazara, O.; Minvielle, F.; Roux, D.; Bed’hom, B.; Feve, K.; Coville, J.-L.; Kayang, B.B.; Lumineau, S.; Vignal, A.; Boutin, J.-M.; et al. Evidence for introgressive hybridization of wild common quail (Coturnix coturnix) by domesticated Japanese quail (Coturnix japonica) in France. Conserv. Genet. 2010, 11, 1051–1062. [Google Scholar] [CrossRef]
  77. Sanchez-Donoso, I.; Vilà, C.; Puigcerver, M.; Butkauskas, D.; de la Calle, J.R.C.; Morales-Rodríguez, P.A.; Rodríguez-Teijeiro, J.D. Are farm-reared quails for game restocking really common quails (Coturnix coturnix): A genetic approach. PLoS ONE 2012, 7, e39031. [Google Scholar] [CrossRef] [PubMed]
  78. Oyun, N.Y.; Moiseyeva, I.G.; Sevastianova, A.A.; Vakhrameev, A.B.; Alexandrov, A.V.; Kuzevanova, A.Y.; Alimov, A.A.; Sulimova, G.E. Mitochondrial DNA polymorphism in different populations of Spangled Orloff chickens. Genetika 2015, 51, 1057–1065, (In Russian with English Summary). [Google Scholar] [CrossRef]
  79. Oyun, N.Y.; Moiseyeva, I.G.; Sevastianova, A.A.; Vakhrameev, A.B.; Alexandrov, A.V.; Kuzevanova, A.Y.; Alimov, A.A.; Sulimova, G.E. Mitochondrial DNA polymorphism in different populations of Orloff Spangled chicken breed. Russ. J. Genet. 2015, 51, 908–915. [Google Scholar] [CrossRef]
  80. Kowalczyk, M.; Staniszewski, A.; Kamiñska, K.; Domaradzki, P.; Horecka, B. Advantages, possibilities, and limitations of mitochondrial DNA analysis in molecular identification. Folia Biol. 2021, 69, 101–111. [Google Scholar] [CrossRef]
  81. Romanov, M.N.; Weigend, S. Genetic Diversity in Chicken Populations Based on Microsatellite Markers. In Proceedings of the Conference “From Jay Lush to Genomics: Visions for Animal Breeding and Genetics”, Ames, IA, USA, 16–18 May 1999; Dekkers, J.C.M., Lamont, S.J., Rothschild, M.F., Eds.; Iowa State University, Department of Animal Science: Ames, IA, USA, 1999; p. 174. Available online: https://web.archive.org/web/20050314091227/http://www.agbiotechnet.com/proceedings/jaylush.asp#34 (accessed on 25 September 2023).
  82. Mohammadabadi, M.R.; Nikbakhti, M.; Mirzaee, H.R.; Shandi, M.A.; Saghi, D.A.; Romanov, M.N.; Moiseyeva, I.G. Genetic variability in three native Iranian chicken populations of the Khorasan province based on microsatellite markers. Genetika 2010, 46, 572–576. Available online: https://www.researchgate.net/publication/44661596_Genetic_variability_in_three_native_Iranian_chicken_populations_of_the_Khorasan_province_based_on_microsatellite_markers (accessed on 25 September 2023). [CrossRef]
  83. Weigend, S.; Romanov, M.N.; Ben-Ari, G.; Hillel, J. Overview on the Use of Molecular Markers to Characterize Genetic Diversity in Chickens. In Proceedings of the XXII World’s Poultry Congress & Exhibition, Participant List & Full Text CD + Book of Abstracts, Istanbul, Turkey, 8–13 June 2004; WPSA—Turkish Branch: Istanbul, Turkey, 2004; p. 192. Available online: https://www.researchgate.net/publication/372751440_Overview_on_the_use_of_molecular_markers_to_characterize_genetic_diversity_in_chickens (accessed on 25 September 2023).
  84. Dementieva, N.V.; Shcherbakov, Y.S.; Tyshchenko, V.I.; Terletsky, V.P.; Vakhrameev, A.B.; Nikolaeva, O.A.; Ryabova, A.E.; Azovtseva, A.I.; Mitrofanova, O.V.; Peglivanyan, G.K.; et al. Comparative analysis of molecular RFLP and SNP markers in assessing and understanding the genetic diversity of various chicken breeds. Genes 2022, 13, 1876. [Google Scholar] [CrossRef] [PubMed]
  85. Hou, H.; Wang, X.; Zhang, C.; Tu, Y.; Lv, W.; Cai, X.; Xu, Z.; Yao, J.; Yang, C. Genomic analysis of GBS data reveals genes associated with facial pigmentation in Xinyang blue-shelled layers. Arch. Anim. Breed. 2020, 63, 483–491. [Google Scholar] [CrossRef]
  86. Zhu, F.; Cui, Q.Q.; Hou, Z.C. SNP discovery and genotyping using Genotyping-by-Sequencing in Pekin ducks. Sci. Rep. 2016, 6, 36223. [Google Scholar] [CrossRef]
  87. Sun, Y.; Wu, Q.; Lin, R.; Chen, H.; Zhang, M.; Jiang, B.; Wang, Y.; Xue, P.; Gan, Q.; Shen, Y.; et al. Genome-wide association study for the primary feather color trait in a native Chinese duck. Front. Genet. 2023, 14, 1065033. [Google Scholar] [CrossRef] [PubMed]
  88. Grzegorczyk, J.; Gurgul, A.; Oczkowicz, M.; Szmatoła, T.; Fornal, A.; Bugno-Poniewierska, M. Single nucleotide polymorphism discovery and genetic differentiation analysis of geese bred in Poland, using genotyping-by-sequencing (GBS). Genes 2021, 12, 1074. [Google Scholar] [CrossRef]
  89. Deng, M.T.; Zhu, F.; Yang, Y.Z.; Yang, F.X.; Hao, J.P.; Chen, S.R.; Hou, Z.C. Genome-wide association study reveals novel loci associated with body size and carcass yields in Pekin ducks. BMC Genom. 2019, 20, 1. [Google Scholar] [CrossRef] [PubMed]
  90. Mathur, S.; DeWoody, J.A. Genetic load has potential in large populations but is realized in small inbred populations. Evol. Appl. 2021, 14, 1540–1557. [Google Scholar] [CrossRef]
  91. Lake, J.A.; Dekkers, J.C.; Abasht, B. Genetic basis and identification of candidate genes for wooden breast and white striping in commercial broiler chickens. Sci. Rep. 2021, 11, 6785. [Google Scholar] [CrossRef] [PubMed]
  92. Moiseeva, I. Chicken genetic resources in Russia. Ptitsevodstvo 1995, 5, 12–15. (In Russian) [Google Scholar]
  93. Moiseyeva, I.G. The state of poultry genetic resources in Russia. Anim. Genet. Resour. 1996, 17, 73–86. [Google Scholar] [CrossRef]
  94. Weigend, S.; Romanov, M.N.; Rath, D. Methodologies to Identify, Evaluate and Conserve Poultry Genetic Resources. In Proceedings of the XXII World’s Poultry Congress & Exhibition, Participant List & Full Text CD + Book of Abstracts, Istanbul, Turkey, 8–13 June 2004; WPSA—Turkish Branch: Istanbul, Turkey, 2004; p. 84. Available online: https://www.researchgate.net/publication/250917228_Methodologies_to_identify_evaluate_and_conserve_poultry_genetic_resources (accessed on 25 September 2023).
  95. Sulimova, G.E.; Stolpovsky, Y.A.; Kashtanov, S.N.; Moiseeva, I.G.; Zakharov, I.A. Methods of managing the genetic resources of domesticated animals. In Fundamentals of Biological Resource Management: Collection of Scientific Articles; Rysin, L.P., Ed.; Partnership of Scientific Publications KMK LLC: Moscow, Russia, 2005; pp. 331–342. ISBN 5-87317-254-4. Available online: https://elibrary.ru/item.asp?id=50435256 (accessed on 25 September 2023). (In Russian)
  96. Tagirov, M.T.; Tereshchenko, L.V.; Tereshchenko, A.V. Substantiation of the possibility of using primary germ cells as material for the preservation of poultry genetic resources. Ptakhivnytstvo 2006, 58, 464–473. Available online: https://www.researchgate.net/publication/342751269_Tagirov_MT_Teresenko_LV_Teresenko_AV_Obosnovanie_vozmoznosti_ispolzovania_pervicnyh_zarodysevyh_kletok_v_kacestve_materiala_dla_sohranenia_geneticeskih_resursov_ptic_Ptahivnictvo_Mizvid_temat_nauk_zb_ (accessed on 25 September 2023). (In Russian with English Summary).
  97. German, N.Y.; Volkova, N.A.; Larionova, P.V.; Vetokh, A.N.; Volkova, L.A.; Sermyagin, A.A.; Shakhin, A.V.; Anshakov, D.V.; Fisinin, V.I.; Zinovieva, N.A. Genome-wide association studies of growth dynamics in quails Coturnix coturnix. Sel’skokhozyaistvennaya Biol. 2022, 57, 1136–1146, (In Russian with English Summary). [Google Scholar] [CrossRef]
Figure 1. Clustering reconstruction of the eight breeds studied using the IPI-based pairwise Euclidean distances. (a,b) PCA plots for first (PC1) and second (PC2) components (a), and for first (PC1) and third (PC3) components (b) using the Phantasus web tool [53]. (c) A Neighbor-Joining rootless axial tree built with no proportional edge length and using the Neighbor Joining method [55] and the online T-REX tool [54]. Quail breeds: JAP, Japanese; ENW, English White; ENB, English Black; TUX, Tuxedo; MAG, Manchurian Golden; EST, Estonian; PHA, Pharaoh; TEW, Texas White.
Animals 13 03439 g001
Figure 2. GBS-based PCA plots for the eight quail breeds studied. (a) View in 3D. (b) Plot composed in the plane of the first (X-axis, PC1) and second (Y-axis, PC2) components. (c) Plot drawn in the plane of the first (X-axis, PC1) and third (Y-axis, PC3) components. Quail breeds: JAP, Japanese; ENW, English White; ENB, English Black; TUX, Tuxedo; MAG, Manchurian Golden; EST, Estonian; PHA, Pharaoh; TEW, Texas White.
Animals 13 03439 g002aAnimals 13 03439 g002b
Figure 3. Neighbor-Net tree based on pairwise IBS distances. Quail breeds: JAP, Japanese; ENW, English White; ENB, English Black; TUX, Tuxedo; MAG, Manchurian Golden; EST, Estonian; PHA, Pharaoh; TEW, Texas White.
Animals 13 03439 g003
Figure 4. Admixture-assisted ancestry cluster analysis. (a) CV error calculations for different number of ancestral populations or clusters (from 1 to 9). (b) Horizontal view at K = 3 and 5 clusters. (c) Circular view for K equaling 2 to 9 clusters. Quail breeds: JAP, Japanese; ENW, English White; ENB, English Black; TUX, Tuxedo; MAG, Manchurian Golden; EST, Estonian; PHA, Pharaoh; TEW, Texas White.
Animals 13 03439 g004aAnimals 13 03439 g004b
Figure 5. Phylogenetic trees based on FST genetic distances characterizing the genetic relationships between the studied quail populations. (a) A reconstructed Neighbor-Net network. (b) A Neighbor-Joining rootless hierarchical horizontal tree built with proportional edge length and using the Neighbor Joining method [55] and the online T-REX tool [54]. Quail breeds: JAP, Japanese; ENW, English White; ENB, English Black; TUX, Tuxedo; MAG, Manchurian Golden; EST, Estonian; PHA, Pharaoh; TEW, Texas White.
Animals 13 03439 g005
Figure 6. Descriptive statistics of the runs of homozygosity (ROH) according to ROH length class. (a) Overall mean length of ROHs (Y-axis) according to ROH length class (X-axis; 0.5–2, 2–4, 4–8 and 8–16 Mb) (b). Mean number of ROHs (Y-axis) according to ROH length class (X-axis; 0.5–2, 2–4, 4–8 and 8–16 Mb). Quail breeds: JAP, Japanese; ENW, English White; ENB, English Black; TUX, Tuxedo; MAG, Manchurian Golden; EST, Estonian; PHA, Pharaoh; TEW, Texas White.
Animals 13 03439 g006
Figure 7. Assessed degree of divergence and the level of gene flow between the studied breeds using 30 iterations. (a) Rooted maximum likelihood tree with one migration event. Cut length 10 s.e. corresponds to ten times the average standard error (s.e.) estimated from the sample covariance matrix. Estimated gene flow is shown by an arrow pointing from a donor population (PHA) to a recipient one (TEW) and is colored red in proportion to the intensity of the gene flow. (b) Residual matrix derived from the TreeMix analysis for a single migration event expressed as the number of standard error deviations for the observations in the respective breeds. (c) Plot representing the proportion of variance (f-index) in the sample covariance matrix (¶W) accounted for by the model covariance matrix (W) as a function of the number of migration events. Quail breeds: JAP, Japanese; ENW, English White; ENB, English Black; TUX, Tuxedo; MAG, Manchurian Golden; EST, Estonian; PHA, Pharaoh; TEW, Texas White.
Animals 13 03439 g007
Table 1. Eight quail breeds involved in this study.
BreedCoden1OriginRefs
Egg type
Japanese
Animals 13 03439 i001
JAP19Japan; domesticated in Japan and China in 12th century or earlier; selected in the 1st half of the 20th century, brought to the USSR from Japan in the mid-20th century and/or from Yugoslavia in 1964[10,11,12,13,25,26,27]
English (British) White
Animals 13 03439 i002
ENW11England; a mutant from JAP quails; imported to the USSR from Hungary in 1987[12,13,24,27]
English (British) Black
Animals 13 03439 i003
ENB13England; a mutant from JAP quails; imported to the USSR from Hungary in 1971[13,27]
Tuxedo
Animals 13 03439 i004
TUX16from crossing ENW and ENB[12,13,27]
Manchurian (Manchu) Golden (or Golden Phoenix)
Animals 13 03439 i005
MAG14Marsh Farms, CA, USA, 1960s; bred by Albert Marsh as a natural mutant in a flock of brown-colored quails[12,13,27,28,29]
Dual purpose (or universal)
Estonian (or Kitevers)
Animals 13 03439 i006
EST9Estonia, 1988; from crossing JAP (a Moscow line), ENW and Pharaoh[11,13,27]
Meat type
Pharaoh
Animals 13 03439 i007
PHA10USA; wild-type plumage; an imported French fattening line used in this study[12,13,26,27,30]
Texas White (or Texas Pharaoh, White Pharaoh, Snowy)
Animals 13 03439 i008
TEW7Texas, USA; from crossing PHA and ENW[27,30]
1 n, number of individuals after quality control.
Table 2. Performance indicators 1 of females from the eight quail breeds studied (mean ± SD).
Breed 2nENEWBWIPI
6 Weeks6 Months
Egg type
JAP (a)41165.4 ± 14.7 a11.0 ± 0.9 a146.7 ± 13.6 a149.0 ± 13.2 a12.2 ± 1.2 a
ENW (b)11134.8 ± 8.5 a,b10.2 ± 1.0 a,b157.6 ± 12.7 a,b166.6 ± 9.0 a,b8.3 ± 1.2 a,b
ENB (c)11133.4 ± 8.0 a,c10.4 ± 0.9 c151.5 + 15.0 c159.5 ± 14.0 a,c8.8 ± 1.4 a,c
TUX (d)11131.1 ± 7.4 a,d10.2 ± 0.9 a,d141.4 ± 10.5 b,d149.0 ± 12.6 b,d9.0 ± 0.8 a,d
MAG (e)12147.5 ± 4.5 a,b,c,d,e10.6 ± 1.6 e168.2 ± 17.2 a,c,d,e180.1 ± 18.9 a,b,c,d,e8.8 ± 2.1 a,e
Dual purpose
EST (f)18148.9 ± 9.7 a,b,c,d,f11.8 ± 1.4 a,b,c,d,e,f248.2 ± 10.6 a,b,c,d,e,f247.3 ± 15.4 a,b,c,d,e,f7.1 ± 1.1 a,b,c,d,e,f
Meat type
PHA (g)12118.2 ± 8.2 a,b,c,d,e,f12.6 ± 0.8 a,b,c,d,e,f292.3 ± 16.2 a,b,c,d,e,f,g294.3 ± 19.5 a,b,c,d,e,f,g5.1 ± 0.6 a,b,c,d,e,f
TEW (h)23121.4 ± 18.7 a,b,c,d,e,f12.7 ± 1.0 a,b,c,d,e,f305.5 + 21.3 a.b,c,d,e,f,g317.7 ± 25.9 a,b,c,d,e,f,g4.9 ± 1.0 a,b,c,d,e,f
1 n, number of individuals; EN, egg number; EW, egg weight (g); BW, female body weight at 6 weeks and 6 months of age (g); IPI, Integral Performance Index. 2 Quail breeds: JAP, Japanese; ENW, English White; ENB, English Black; TUX, Tuxedo; MAG, Manchurian Golden; EST, Estonian; PHA, Pharaoh; TEW, Texas White. (a–h) Significant pairwise differences for breeds with the corresponding same superscript (p < 0.05); the absence of a corresponding common superscript indicates that the differences between the specific two breeds are insignificant.
Table 3. Characterization of the genetic diversity parameters 1 in the quail populations studied.
Breed 2HO (M ± SE)HE (M ± SE)UHE (M ± SE)AR (M ± SE)FIS [CI 95%]UFIS [Cl 95%]
Egg type
JAP0.303 ± 0.0010.310 ± 0.0010.319 ± 0.0011.864 ± 0.0010.020 [0.016; 0.024]0.046 [0.043; 0.049]
ENW0.281 ± 0.0010.273 ± 0.0010.287 ± 0.0011.778 ± 0.002−0.029 [−0.033; −0.025]0.020 [0.016; 0.024]
ENB0.282 ± 0.0010.276 ± 0.0010.287 ± 0.0011.774 ± 0.002−0.019 [−0.023; −0.015]0.020 [0.016; 0.024]
TUX0.265 ± 0.0010.263 ± 0.0010.271 ± 0.0011.730 ± 0.002−0.010 [−0.014; −0.006]0.022 [0.018; 0.026]
MAG0.286 ± 0.0010.285 ± 0.0010.295 ± 0.0011.790 ± 0.002−0.005 [−0.009; −0.001]0.031 [0.027; 0.035]
Dual purpose
EST0.302 ± 0.0010.295 ± 0.0010.313 ± 0.0011.839 ± 0.002−0.025 [−0.030; −0.020]0.032 [0.028; 0.036]
Meat type
PHA0.290 ± 0.0010.286 ± 0.0010.301 ± 0.0011.815 ± 0.002−0.017 [−0.021; −0.013]0.035 [0.031; 0.039]
TEW0.282 ± 0.0020.264 ± 0.0010.284 ± 0.0011.757 ± 0.003−0.067 [−0.072; −0.062]0.011 [0.006; 0.016]
1 HO, observed heterozygosity; M, mean value; SE, standard error; HE, expected heterozygosity; UHE, unbiased expected heterozygosity adjusted for small samples; AR, rarefied allelic richness; FIS, inbreeding coefficient [CI 95%, range variation of FIS coefficient at a confidence interval of 95%]; UFIS, unbiased inbreeding coefficient [CI 95%, range variation of UFIS coefficient at a confidence interval of 95%] adjusted for small samples. 2 Quail breeds: JAP, Japanese; ENW, English White; ENB, English Black; TUX, Tuxedo; MAG, Manchurian Golden; EST, Estonian; PHA, Pharaoh; TEW, Texas White.
Table 4. Runs of homozygosity (ROHs) descriptive statistics 1 for the studied breeds.
Breed 2ROH Length, Mb (M ± SE)ROH No. (M ± SE)FROH (M ± SE)
AverageMinMaxAverageMinMaxAverageMinMax
Egg type
JAP99.04 ± 5.5548.71138.5875.89 ± 3.38491040.119 ± 0.0070.060.17
ENW140.00 ± 16.888.43216.1096.82 ± 10.5571330.169 ± 0.0200.010.26
ENB142.92 ± 11.3258.47201.15101.23 ± 6.37541370.172 ± 0.0140.070.24
TUX173.54 ± 13.3636.79237.00122.50 ± 7.81311640.209 ± 0.0160.040.29
MAG132.63 ± 5.7791.63174.3598.64 ± 3.93691210.160 ± 0.0070.110.21
Dual purpose
EST114.11 ± 8.2356.47137.5383.11 ± 4.8349980.137 ± 0.0100.070.17
Meat type
PHA112.18 ± 7.8662.22157.9685.80 ± 5.01541080.135 ± 0.0090.070.19
TEW150.66 ± 9.54115.13191.32105.43 ± 4.74871220.181 ± 0.0110.140.23
1 ROH No., number of ROHs in a genome; Mb, megabases; M, mean value; SE, standard error; ROH Length, overall length of ROHs in a genome; FROH, inbreeding coefficient calculated based on ROHs. 2 Quail breeds: JAP, Japanese; ENW, English White; ENB, English Black; TUX, Tuxedo; MAG, Manchurian Golden; EST, Estonian; PHA, Pharaoh; TEW, Texas White.
Disclaimer/Publisher’s Note: The statements, opinions and data contained in all publications are solely those of the individual author(s) and contributor(s) and not of MDPI and/or the editor(s). MDPI and/or the editor(s) disclaim responsibility for any injury to people or property resulting from any ideas, methods, instructions or products referred to in the content.

