Article

Serum Metabolic Characterization of Vitamin E Deficiency in Holstein Cows during the Transition Period Based on Proton Nuclear Magnetic Resonance Spectroscopy

College of Animal Science and Veterinary Medicine, Heilongjiang Bayi Agricultural University, Daqing 163319, China
*
Author to whom correspondence should be addressed.
These authors contributed equally to this work.
Animals 2023, 13(18), 2957; https://doi.org/10.3390/ani13182957
Submission received: 17 July 2023 / Revised: 3 September 2023 / Accepted: 6 September 2023 / Published: 19 September 2023
(This article belongs to the Section Veterinary Clinical Studies)

Abstract

:

Simple Summary

The present study is the first to characterize metabolic changes associated with vitamin E deficiency in Holstein cows during the transition period. Our results highlight that cows with vitamin E deficiency are more likely to experience a negative energy balance characterized by alterations of common systemic metabolic processes and develop oxidative stress, inflammation, and ultimately liver injury. This study provides comprehensive information on blood metabolic characterization of vitamin E deficiency in dairy cows after calving.

Abstract

Vitamin E, a potent antioxidant, is a necessary and complex micronutrient for cows. During the transition period, vitamin E deficiency (VED) is among the highest prevalent micronutrient deficits in dairy cows. It may eventually result in oxidative stress and immunological malfunction, and it increases the risk of peripartum disorders. At present, detailed data on blood metabolites in VED cows are limited. Consequently, the purpose of this research was to examine the alterations in the serum metabolic profile of VED cows throughout the early postpartum period. Using comprehensive 1H nuclear magnetic resonance (1H NMR), the alterations in serum metabolic activities of VED cows were analyzed. In total, 28 multiparous Holstein cows were assigned according to serum α-tocopherol (α-Toc) concentrations into normal (α-Toc ≥ 4 μg/mL, n = 14) and VED (α-Toc < 3 μg/mL, n = 14) groups at 21 days postpartum, and their blood samples were collected for biochemical and 1H NMR analyses. A t-test on independent samples as well as multivariate statistics were used to assess the findings. In comparison with normal cows, VED cows showed significantly worse body condition scores, milk yield, and dry matter intake (p < 0.05). Significantly higher levels of serum non-esterified fatty acids, aspartate aminotransferase, low-density lipoprotein, and malonaldehyde were found in VED-affected cows, as well as lesser concentrations of serum albumin, high-density lipoprotein, and total antioxidant capacity in comparison with normal cows (p < 0.01), while other vitamins and minerals concentrations showed no distinction between the groups (p > 0.05). Furthermore, 24 upregulated serum metabolites were identified under VED conditions. The metabolomics pathway analysis of these metabolites demonstrated that a global metabolic response to VED in cows was represented by changes in 11 metabolic pathways, comprising energy, carbohydrate, and amino acid metabolism. From these results, we conclude that VED cows were more likely to experience a negative energy balance characterized by alterations of common systemic metabolic processes and develop oxidative stress, inflammation, and ultimately liver injury. This study provides the first evidence of metabolic changes in cows with VED.

1. Introduction

Vitamin E deficiency (VED) is the most prevalent micronutrient deficiency in dairy cattle, with a herd incidence rate of up to 21% during early lactation [1]. It leads to severe degenerating disorders, a reduction in the immune reaction, and possibly lameness, retained placenta, metritis, and mastitis, thereby bringing substantial financial loss to the global dairy sector [2,3]. Vitamin E, a potent antioxidant, is a necessary and complex micronutrient for cattle [4,5]. Its predominant component in the circulatory system is α-tocopherol (α-Toc) [6]. Vitamin E shortage can be induced by various factors such as alterations in α-Toc intake, elevated oxidative stress and lipid peroxidation, and the transfer of α-Toc into colostrum near calving [3]. To date, the physiological causes or processes underpinning VED during the transition period of high-yielding dairy cows remain unknown.
The plasma/serum levels of α-Toc in high-yielding dairy cattle reduce steadily during prepartum, beginning multiple weeks before calving, achieving a minimum at parturition, staying at low rates during the puerperium time (approximately 3–7 days), and rising afterward [7,8,9,10,11]. According to the National Research Council (NRC, 2001) standards [12], plasma/serum concentrations of α-Toc must be greater than 3 μg/mL throughout the transition period; otherwise, an α-Toc shortage, also known as VED, can occur. Therefore, VED for adult dairy cows is defined as serum α-Toc concentration < 3 μg/mL [1,3].
Over the past three decades, numerous studies have been conducted on the disease risk of VED and the influence of α-Toc supplements on the health of transition dairy cows and heifers. A comprehensive study by Haga et al. [3] revealed that VED in the transition period is a risk factor for peripartum disorders and reduced reproduction in dairy cows and that α-Toc supplements are an excellent method for preventing peripartum disorder in high-yielding dairy cows. Some proteins and metabolites may exhibit alterations during disease initiation and remain at the same altered level throughout the course of the disease. Unfortunately, few studies have investigated the altered proteins and metabolites in cows with VED during the transition period. Only recently, the proteomics characteristics of VED cows during early lactation were characterized in plasma [13]. However, no studies have reported metabolic changes in VED cows until now.
Recently, proton nuclear magnetic resonance (1H NMR) technology has been increasingly used for cows to probe the differences in metabolites between diseased and non-diseased states. However, these studies involved negative energy balance [14], inactive ovaries [15], displaced abomasum [16], milk fever [17], mastitis [18], and ketosis [19,20,21,22,23], but not VED. For metabolic phenotyping, 1H NMR spectroscopy is among the preferred analytical techniques [24]. The advantages of 1H NMR include that the sample pre-treatment is straightforward and non-destructive, and the identification of the metabolite is extensive [25]. Therefore, 1H NMR spectroscopy is a reasonable method to obtain more precise and detailed information on cows with VED. Oxidative stress is the consequence of imbalanced redox homeostasis due to a lack of sufficient antioxidants that neutralize reactive oxygen species, whereas metabolic alterations are likely to be mediated by oxidative stress [26]. Given that vitamin E is a strong antioxidant and its deficiency can lead to oxidative stress, we hypothesized that VED changes the metabolic status of dairy cows during the transition period. Thus, this study aimed to test this hypothesis by applying 1H NMR spectroscopy to analyze the metabolome of serum in VED and normal cows.

2. Materials and Methods

All animal operations were approved by the Institutional Animal Care and Use Committee of Heilongjiang Bayi Agricultural University (Daqing, China) (protocol code DWKJXY2023065; approval date: 15 January 2023).

2.1. Animals and Diets

The present study was conducted during the winter (January–February) of 2023. Twenty-eight clinically healthy multiparous Holstein dairy cows (singletons, 3.19 ± 0.27 of age, 2.2 ± 0.48 of parity, 635 ± 22.9 kg of weight, 34.6 ± 5.4 kg of daily milk yield, mean ± SD) from an intensive dairy farm of Heilongjiang in China were selected at 21 days postpartum in this research. Cows were assigned into normal (α-Toc ≥ 4 μg/mL, n = 14) and VED (α-Toc < 3 μg/mL, n = 14) groups based on serum α-Toc concentrations. Cows were kept in separated tie-stall barns bedded with kiln-dried sawdust and fed individually an early-lactation total mixed rations (TMR) diet following parturition. The formulation of TMR for early lactation followed the NRC (2001) [12] standards (Table 1). Cows were fed three times daily and were milked three times daily at 06:00, 14:00, and 22:00. Age, parity, weight, milk yield, and dry matter intake (DMI) were recorded using the specific software (Afifarm, Afimilk, Kibbutz Afikim, 1514800, Israel). Two qualified field veterinarians determined the body condition score (BCS) using a 5-point scale ranging from 1 to 5 with 0.25-unit intervals [27]. Blood samples for biochemical and 1H NMR analysis were obtained on day 21 relative to the calving date.

2.2. Blood Collection

Blood samples were collected only once from two groups of cows via the tail vein utilizing vacuum blood collecting tubes without any additives, and kept at room temperature for 30 min, then centrifuged at 3500× g for 10 min to obtain serum. Tubes of serum were kept frozen at −80 °C for the biochemical and 1H NMR testing.

2.3. Serum Detection

Serum levels of vitamin E (α-Toc), vitamin A (retinol), and vitamin C (ascorbic acid) were determined using high-performance liquid chromatography according to Siomek et al. [28]. Serum selenium, zinc, and copper levels were determined by inductively coupled plasma mass spectrometry as previously described [29].
Serum levels of β-hydroxybutyrate (BHB), non-esterified fatty acids (NEFA), glucose, aspartate aminotransferase (AST), alanine aminotransferase (ALT), albumin, total cholesterol (TC), low-density lipoprotein (LDL), high-density lipoprotein (HDL), calcium, phosphorus, and magnesium were analyzed using commercial biochemical assay kits (Mindray Biomedical Electronics Co., Ltd., Shenzhen, China) by the Mindray BS-830S fully automatic biochemistry analyzer (Mindray Biomedical Electronics Co., Ltd., Shenzhen, China) at the Biotechnology Centre of Heilongjiang Bayi Agricultural University. All measurements were conducted following the manufacturer’s guidelines.
The functions of total antioxidant capacity (TAC), superoxide dismutase (SOD), glutathione peroxidase (GSH-Px), catalase, and malondialdehyde (MDA) in serum were measured using commercial assay kits (Nanjing Built Biology, Nanjing, China) following the manufacturer’s instructions.

2.4. Sample Preparation

The testing procedure for 1H-NMR was carried out as described in [30]. In brief, 28 freezing serum samples were quickly defrosted in the room atmosphere. The serum sample (200 μL) was transferred utilizing a pipette into a 1.5 mL Eppendorf tube, and 400 μL of buffer (45 mM NaH2PO4/K2HPO4; 0.9% NaCl; pH: 7.4; 50% D2O) was then supplied. Following vortex and centrifugation (16,099× g, 10 min, 4 °C), 550 μL of the supernatant was transmitted to a 5 mm NMR tube for additional examination.

2.5. NMR Measurements

Proton NMR spectra were acquired on a Varian-600 MHz NMR spectrometer (Varian, Palo Alto, CA, USA) operating at 599.93 MHz. A water-suppressed Carr-Purcell-Meiboom-Gill sequence was used to obtain transversal relaxation periods. In total, 64 transients were captured using a spectral width of 12,000 Hz, a relaxing latency of 2.0 s, a combining time of 100 ms, and an acquisition time of 1.5 s at 25 °C. Reactant concentrations were in the micromolar range due to the detection limit of the NMR system.

2.6. Data Preprocessing

The NMR spectra were analyzed utilizing the MestReNova program (version 12.0.0, Mestrelab Research, St. Louis, MO, USA). The free induction decay signal of all the recorded 1H NMR spectra was submitted to an exponential window function with a broadening factor of 1 Hz. Then, a Fourier transform was applied to enhance the signal-to-noise proportion, and the spectral stage and baseline correction were conducted manually. The normalization of multivariable statistics followed the normalization of integrated statistics.

2.7. Multivariate Statistical Analysis

A multivariate study was conducted on the normalized information using the SIMCA tool (version 15.0, MKS Data Analytics Solutions, Umea, Sweden). First, the 1H NMR spectra were subjected to a principal component analysis (PCA) according to the mean-center scale to reveal broad variations. The spectra were subsequently evaluated using the supervised approach of orthogonal partial least-squares discriminant analysis (OPLS-DA). Using the goodness-of-fit parameter (R2) and goodness-of-prediction parameter (Q2), the performance for every model was detected. The OPLS-DA was employed to assess the statistical significance of changes in metabolite levels and the relevant correlation coefficients.

2.8. The Differential Metabolites Identification and the Analysis of the Metabolic Pathway

Based on the number of samples in the present test, the actual level of the correlation coefficient (r) > 0.5324 was utilized as the cut-off level for the significance of differential metabolites. The Euclidean distance matrix for the mathematical calculations of the differential metabolites was constructed for every series of analyses. Using the entire linkage technique, the divergent metabolites were clustered and shown as a heatmap of hierarchical clustering. The Kyoto Encyclopedia of Genes and Genomes (KEGG) database (www.kegg.jp/kegg/pathway.html, accessed on 16 July 2023) was used for the differential metabolites linked to several distinct metabolic pathways. The outcomes of the metabolic pathway investigation were displayed using a bubble plot.

2.9. Statistical Analysis

Cows served as the experimental units. Statistical analysis was performed with SPSS 22.0 software (IBM Corp, Armonk, NY, USA). The independent samples t-test was used to examine variations in clinical variables (age, parity, BCS, milk yield, DMI, vitamins, and minerals) and biochemical variables between cows with VED and normal cows. Probability (p) values < 0.05 and <0.01 were deemed to be statistically significant and extremely significant, respectively.

3. Results

3.1. Background Characteristics

Table 2 shows the background characteristics of the VED and normal groups. Age and parity were similar in both groups (p > 0.05), while BCS, milk yield, and DMI were significantly lower in the VED group contrasted with the normal group (p < 0.05). Serum vitamin E levels were significantly lower in the VED group than those in the normal group (2.59 ± 0.77 vs. 7.33 ± 1.38 μg/mL, p < 0.01). No significant differences were observed in other vitamins and minerals levels between the two groups (p > 0.05).

3.2. Serum Biochemical Measurements

Table 3 shows the serum biochemical indicators of the VED and normal groups. In contrast with the normal group, cows with VED had higher concentrations of serum NEFA, AST, LDL, and MDA and lower concentrations of serum albumin, HDL, and TAC (p < 0.01).

3.3. H NMR Spectra

A standard 1H NMR spectra of serum samples from the (A) normal and (B) VED groups are shown in Figure 1. All NMR signals (δ) were observed at 0.6–9.0 ppm (ppm represents the chemical shift). Downfield areas were vertically enlarged 32-fold for more clarification. After further excluding the chemical shift range of δ5.601–6.4 ppm affected by the residual water peak, 34 metabolites were identified from the NMR spectra (Supplementary Material Table S1).

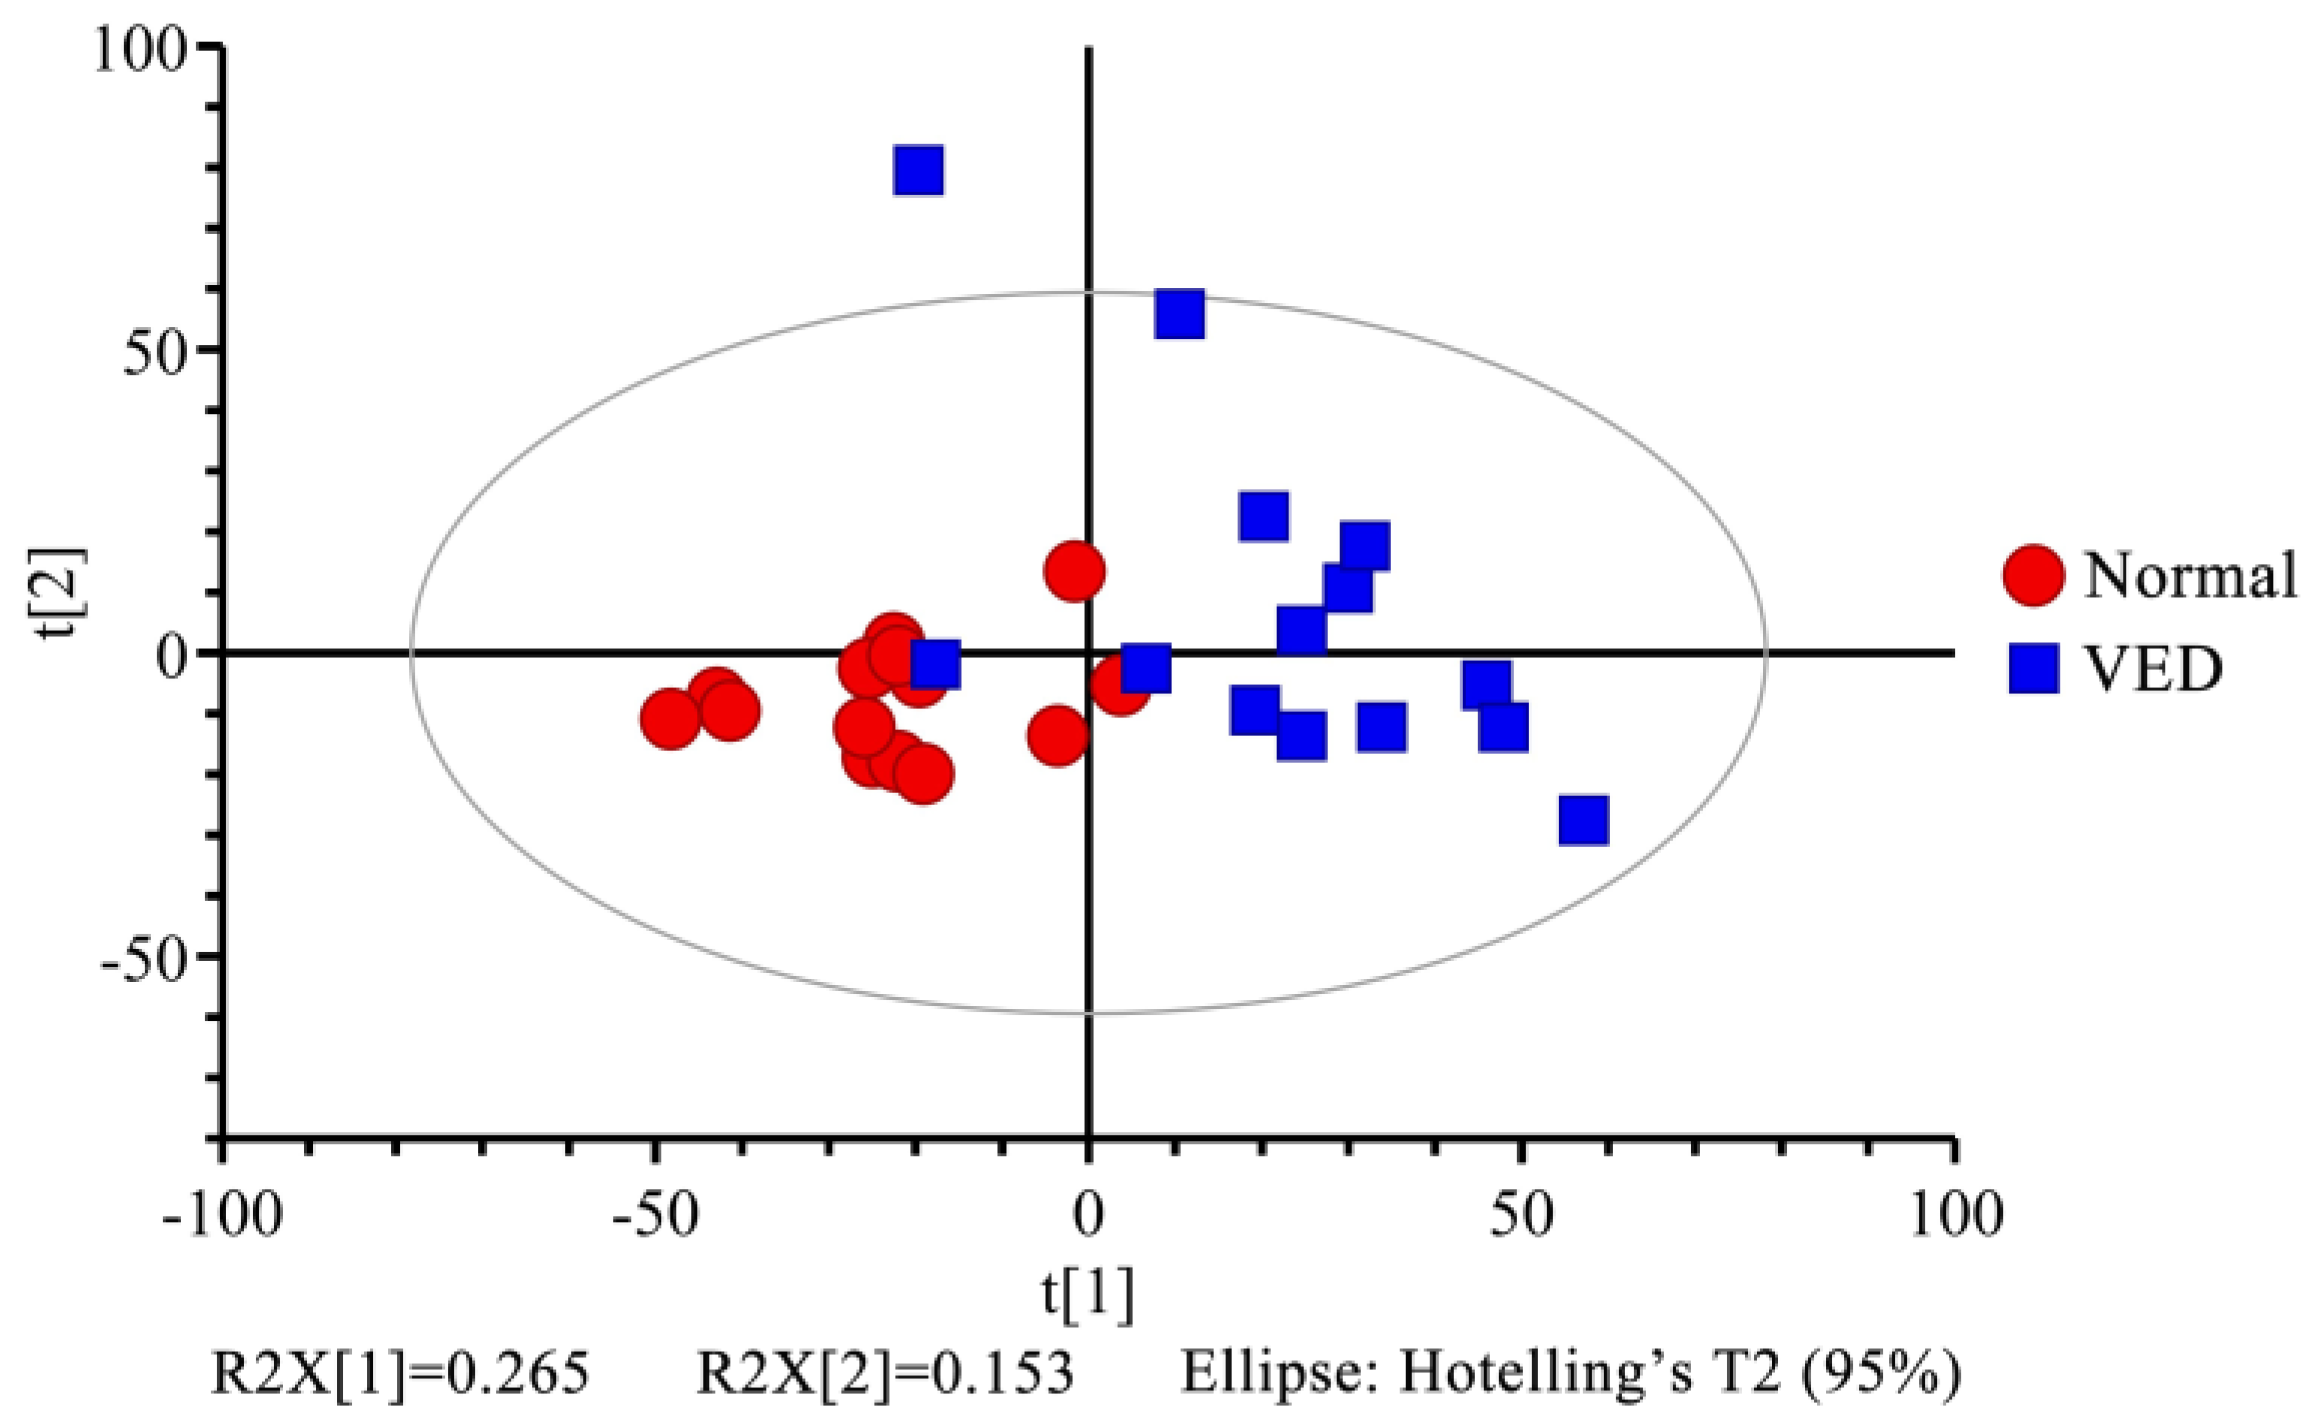
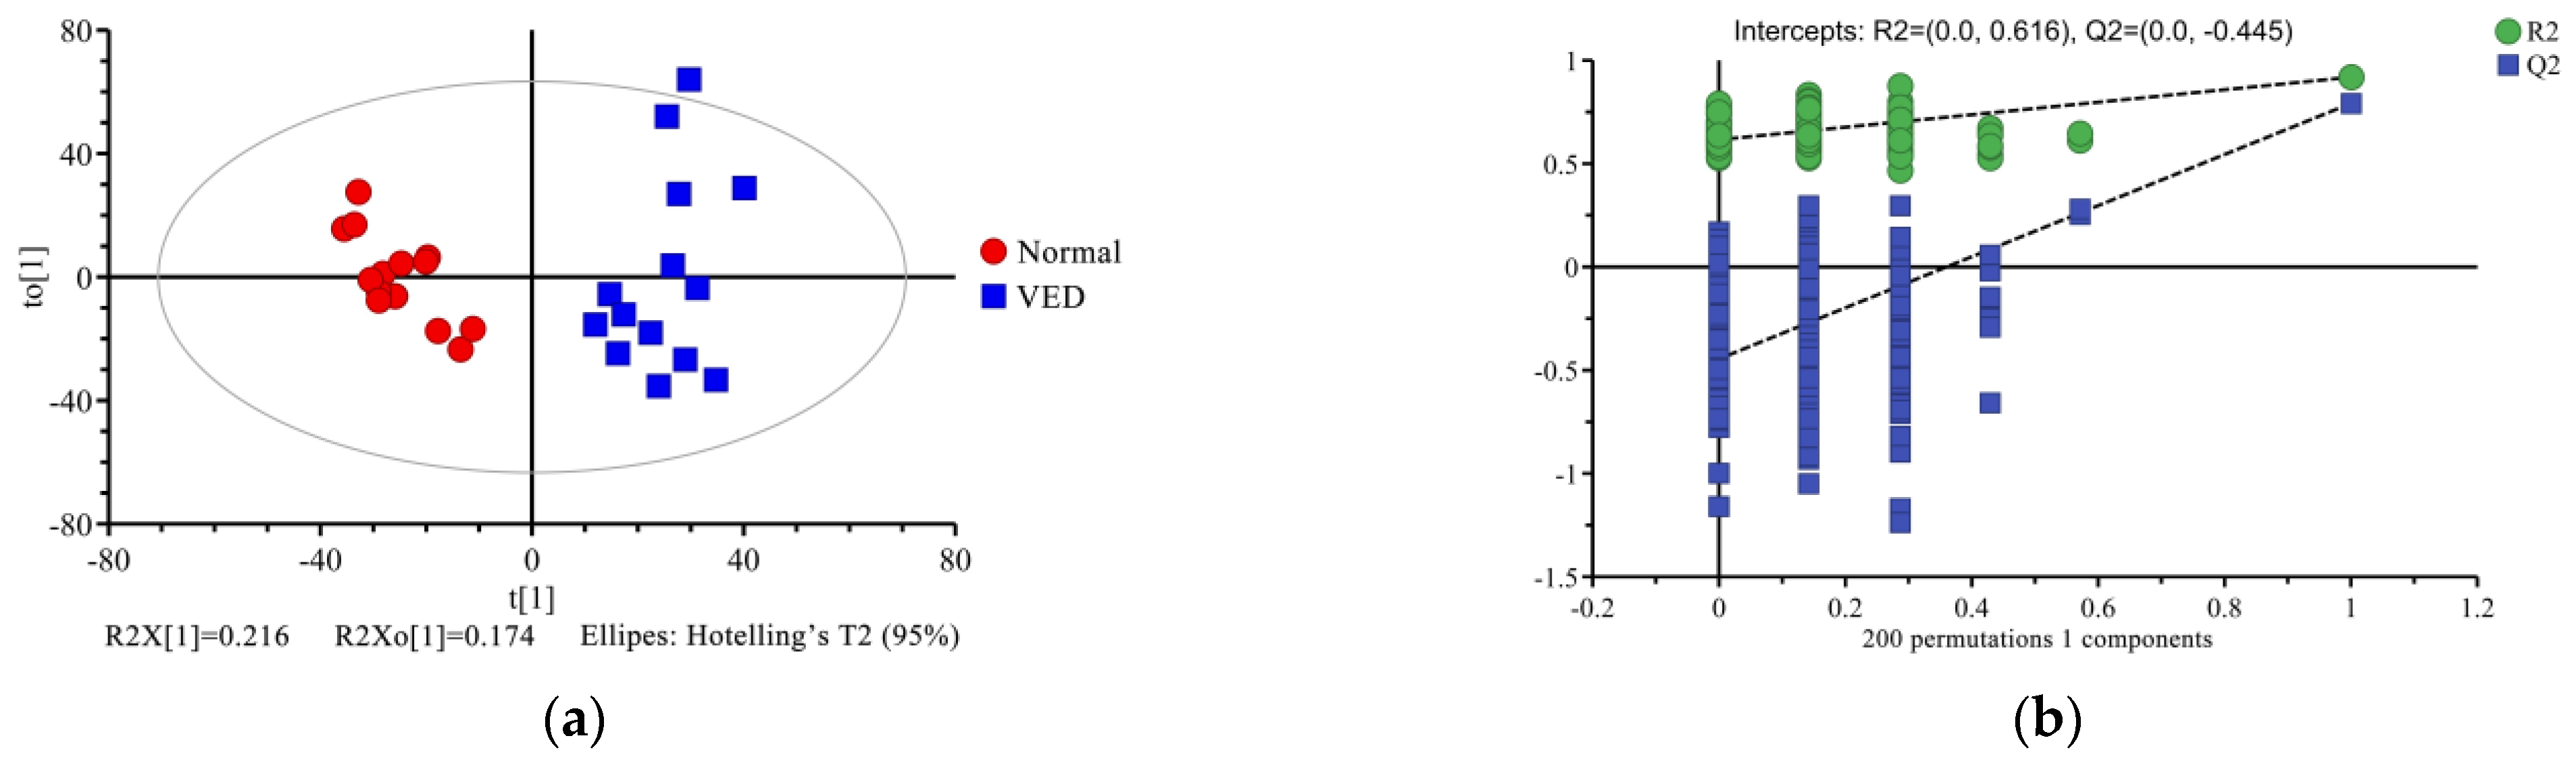
3.4. Multivariate Statistical Analysis

To explore the metabolic variations in serum across the normal and VED groups, the 1H NMR data were analyzed using multivariate statistics. First, we analyzed the metabolomic profiling of the 34 metabolites with unsupervised PCA. The PCA score plot showed little separation between normal and VED groups (R2X = 0.606, Q2 = 0.312) (Figure 2 and Table S2). Additionally, an OPLS-DA supervised model was conducted to achieve the best possible distinction (R2X = 0.390, R2Y = 0.918, and Q2 = 0.792) (Table S3). Since the R2Y and Q2 values were both higher than 0.4, the model was reliable and consistent (Figure 3a). When the Q2 result of the OPLS-DA model was close to 1, it achieved a high degree of accuracy. Because the results of the Q2 intercept were lower than 0.05, there was no overfitting (Figure 3b).

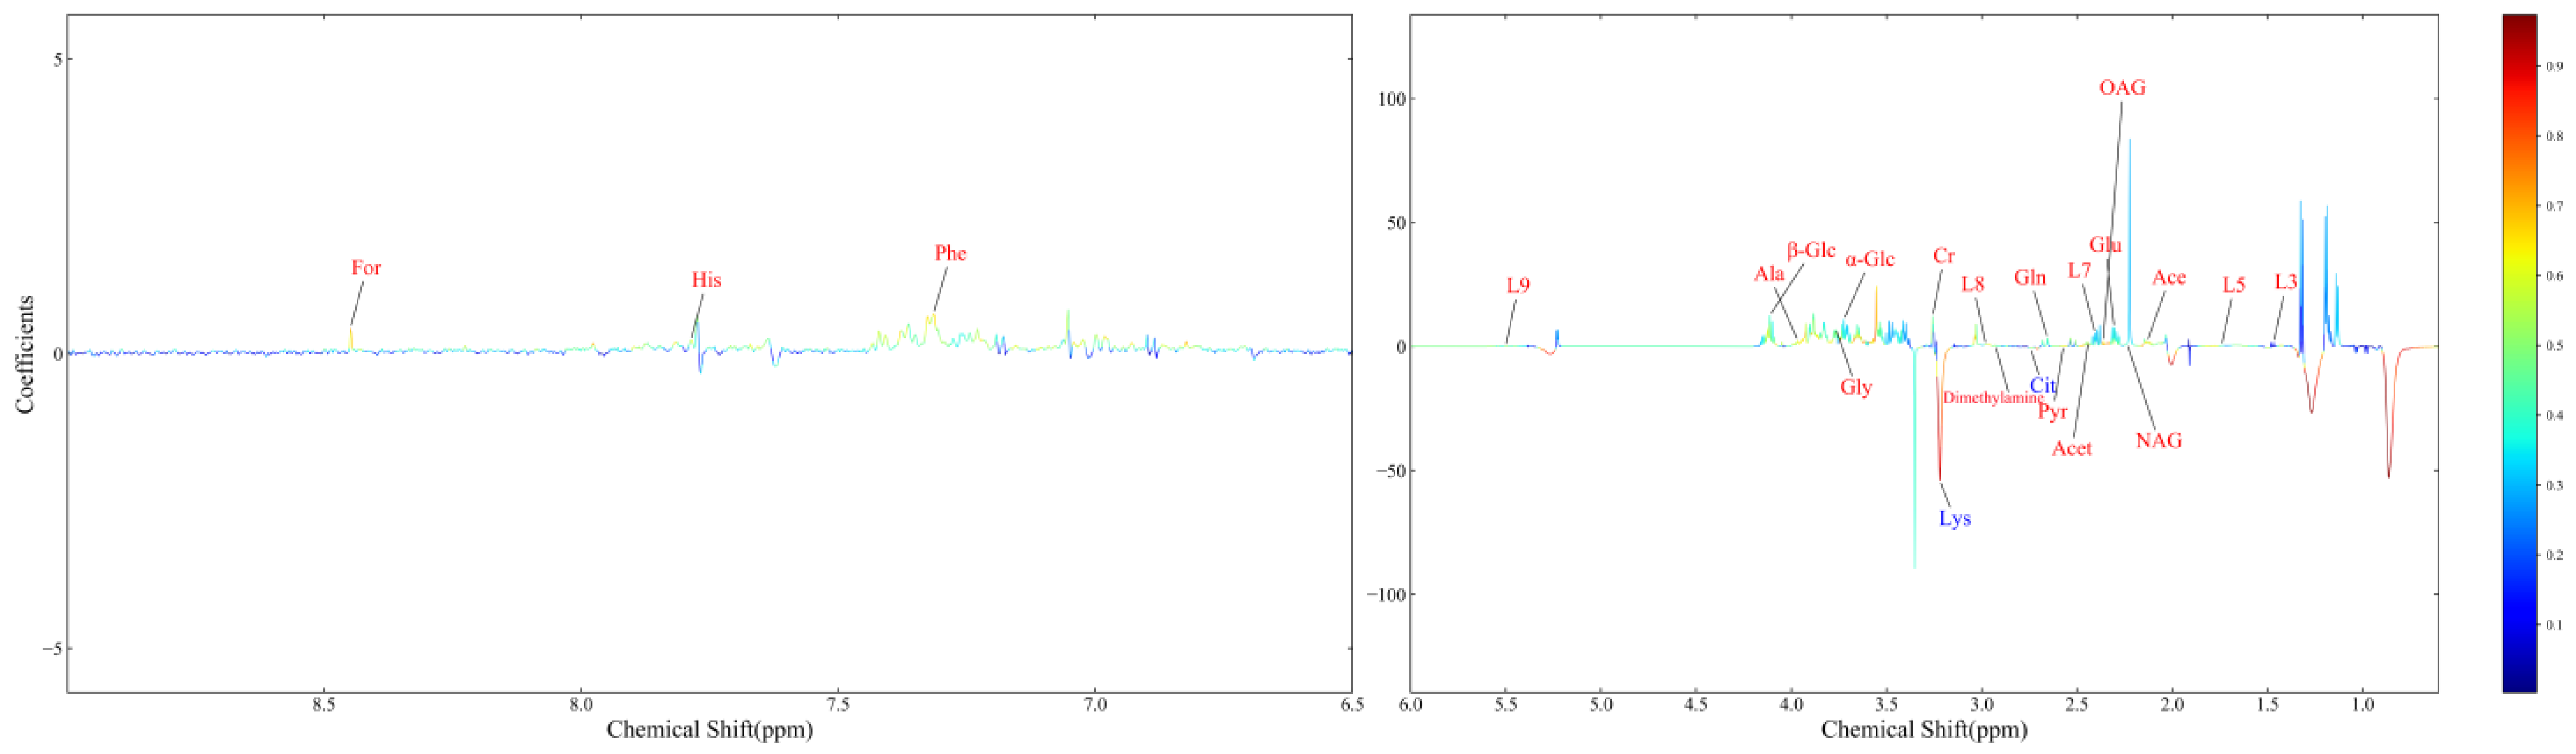
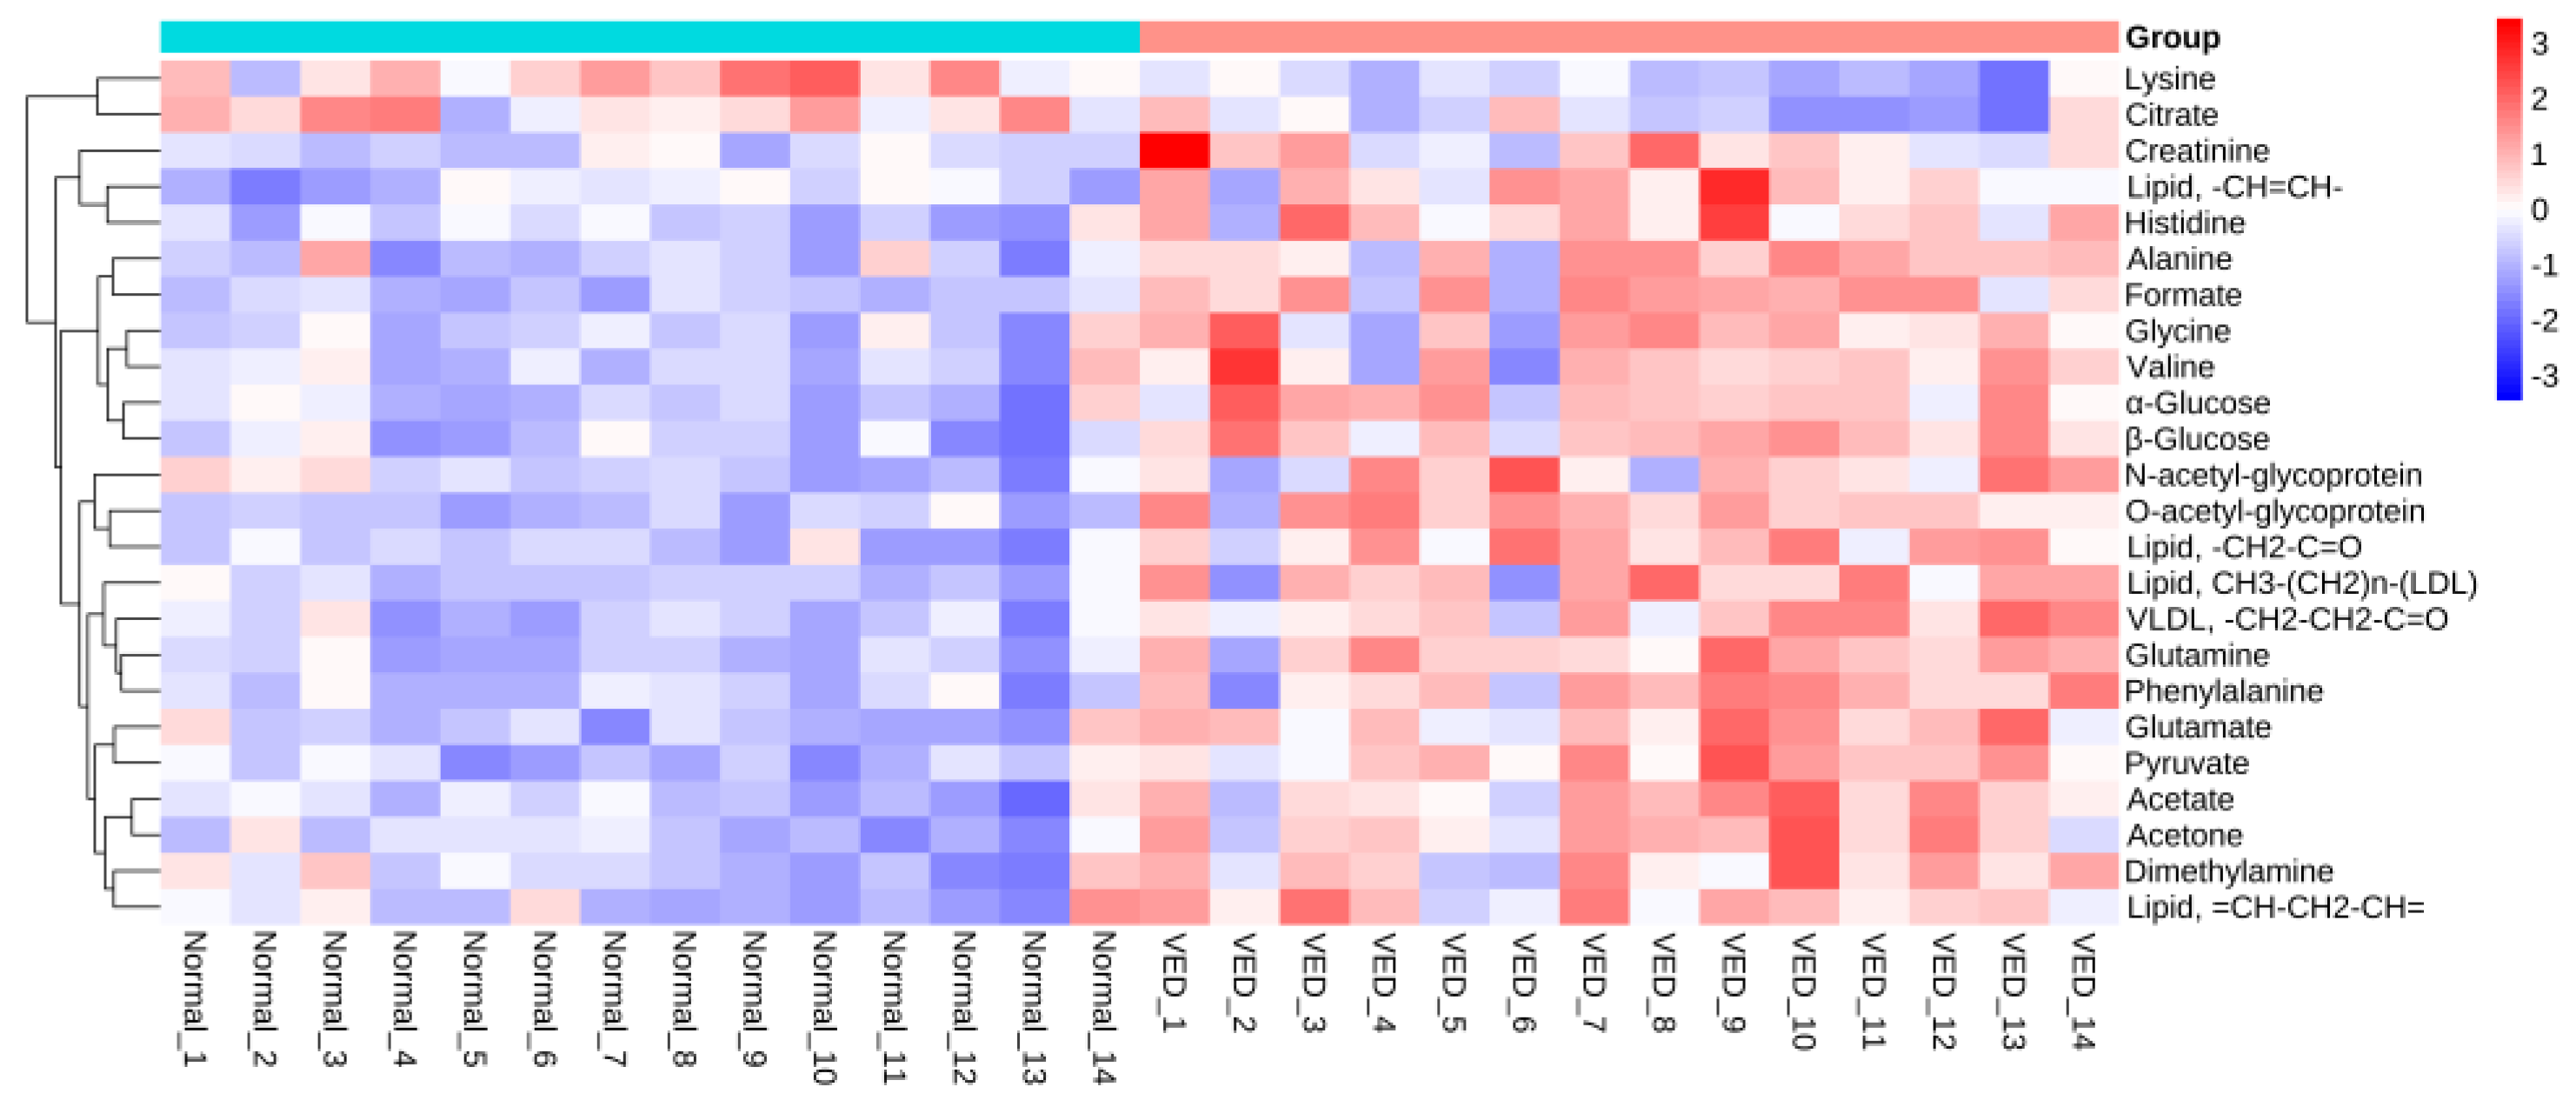
3.5. Differential Metabolites between the VED and Normal Groups

A polychromatic correlation coefficient loading graph was created (Figure 4) and employed to determine the distinct metabolites that were present in each of the two groups. The absolute value of the correlation coefficient was used as the encoding approach to determine the color of the polychromatic loading graphic. When the color was warmer, the absolute value of the correlation coefficient was higher, and the influence of the color on the intergroup variation was stronger. It was decided that a score of 0.5324 would constitute the cut-off for the overall significance of the correlation coefficient. There was a significant contribution to the intergroup variation created by the parameters matching the correlation coefficient that had an overall value of more than 0.5324 (p < 0.05). Table 4 shows the findings of the correlation coefficient assessment of 24 differential metabolites. The VED group, when contrasted with the normal group, had significantly higher serum levels of acetate, acetone, alanine, citrate, creatinine, dimethylamine, formate, glutamate, glutamine, glycine, histidine, LDL, very low-density lipoproteins (VLDL), lipids, lysine, N-acetyl-glycoprotein, O-acetyl-glycoprotein, phenylalanine, pyruvate, valine, and glucose. Furthermore, the relative levels of 24 differential metabolites in the normal and VED groups were visualized on a heat map (Figure 5).

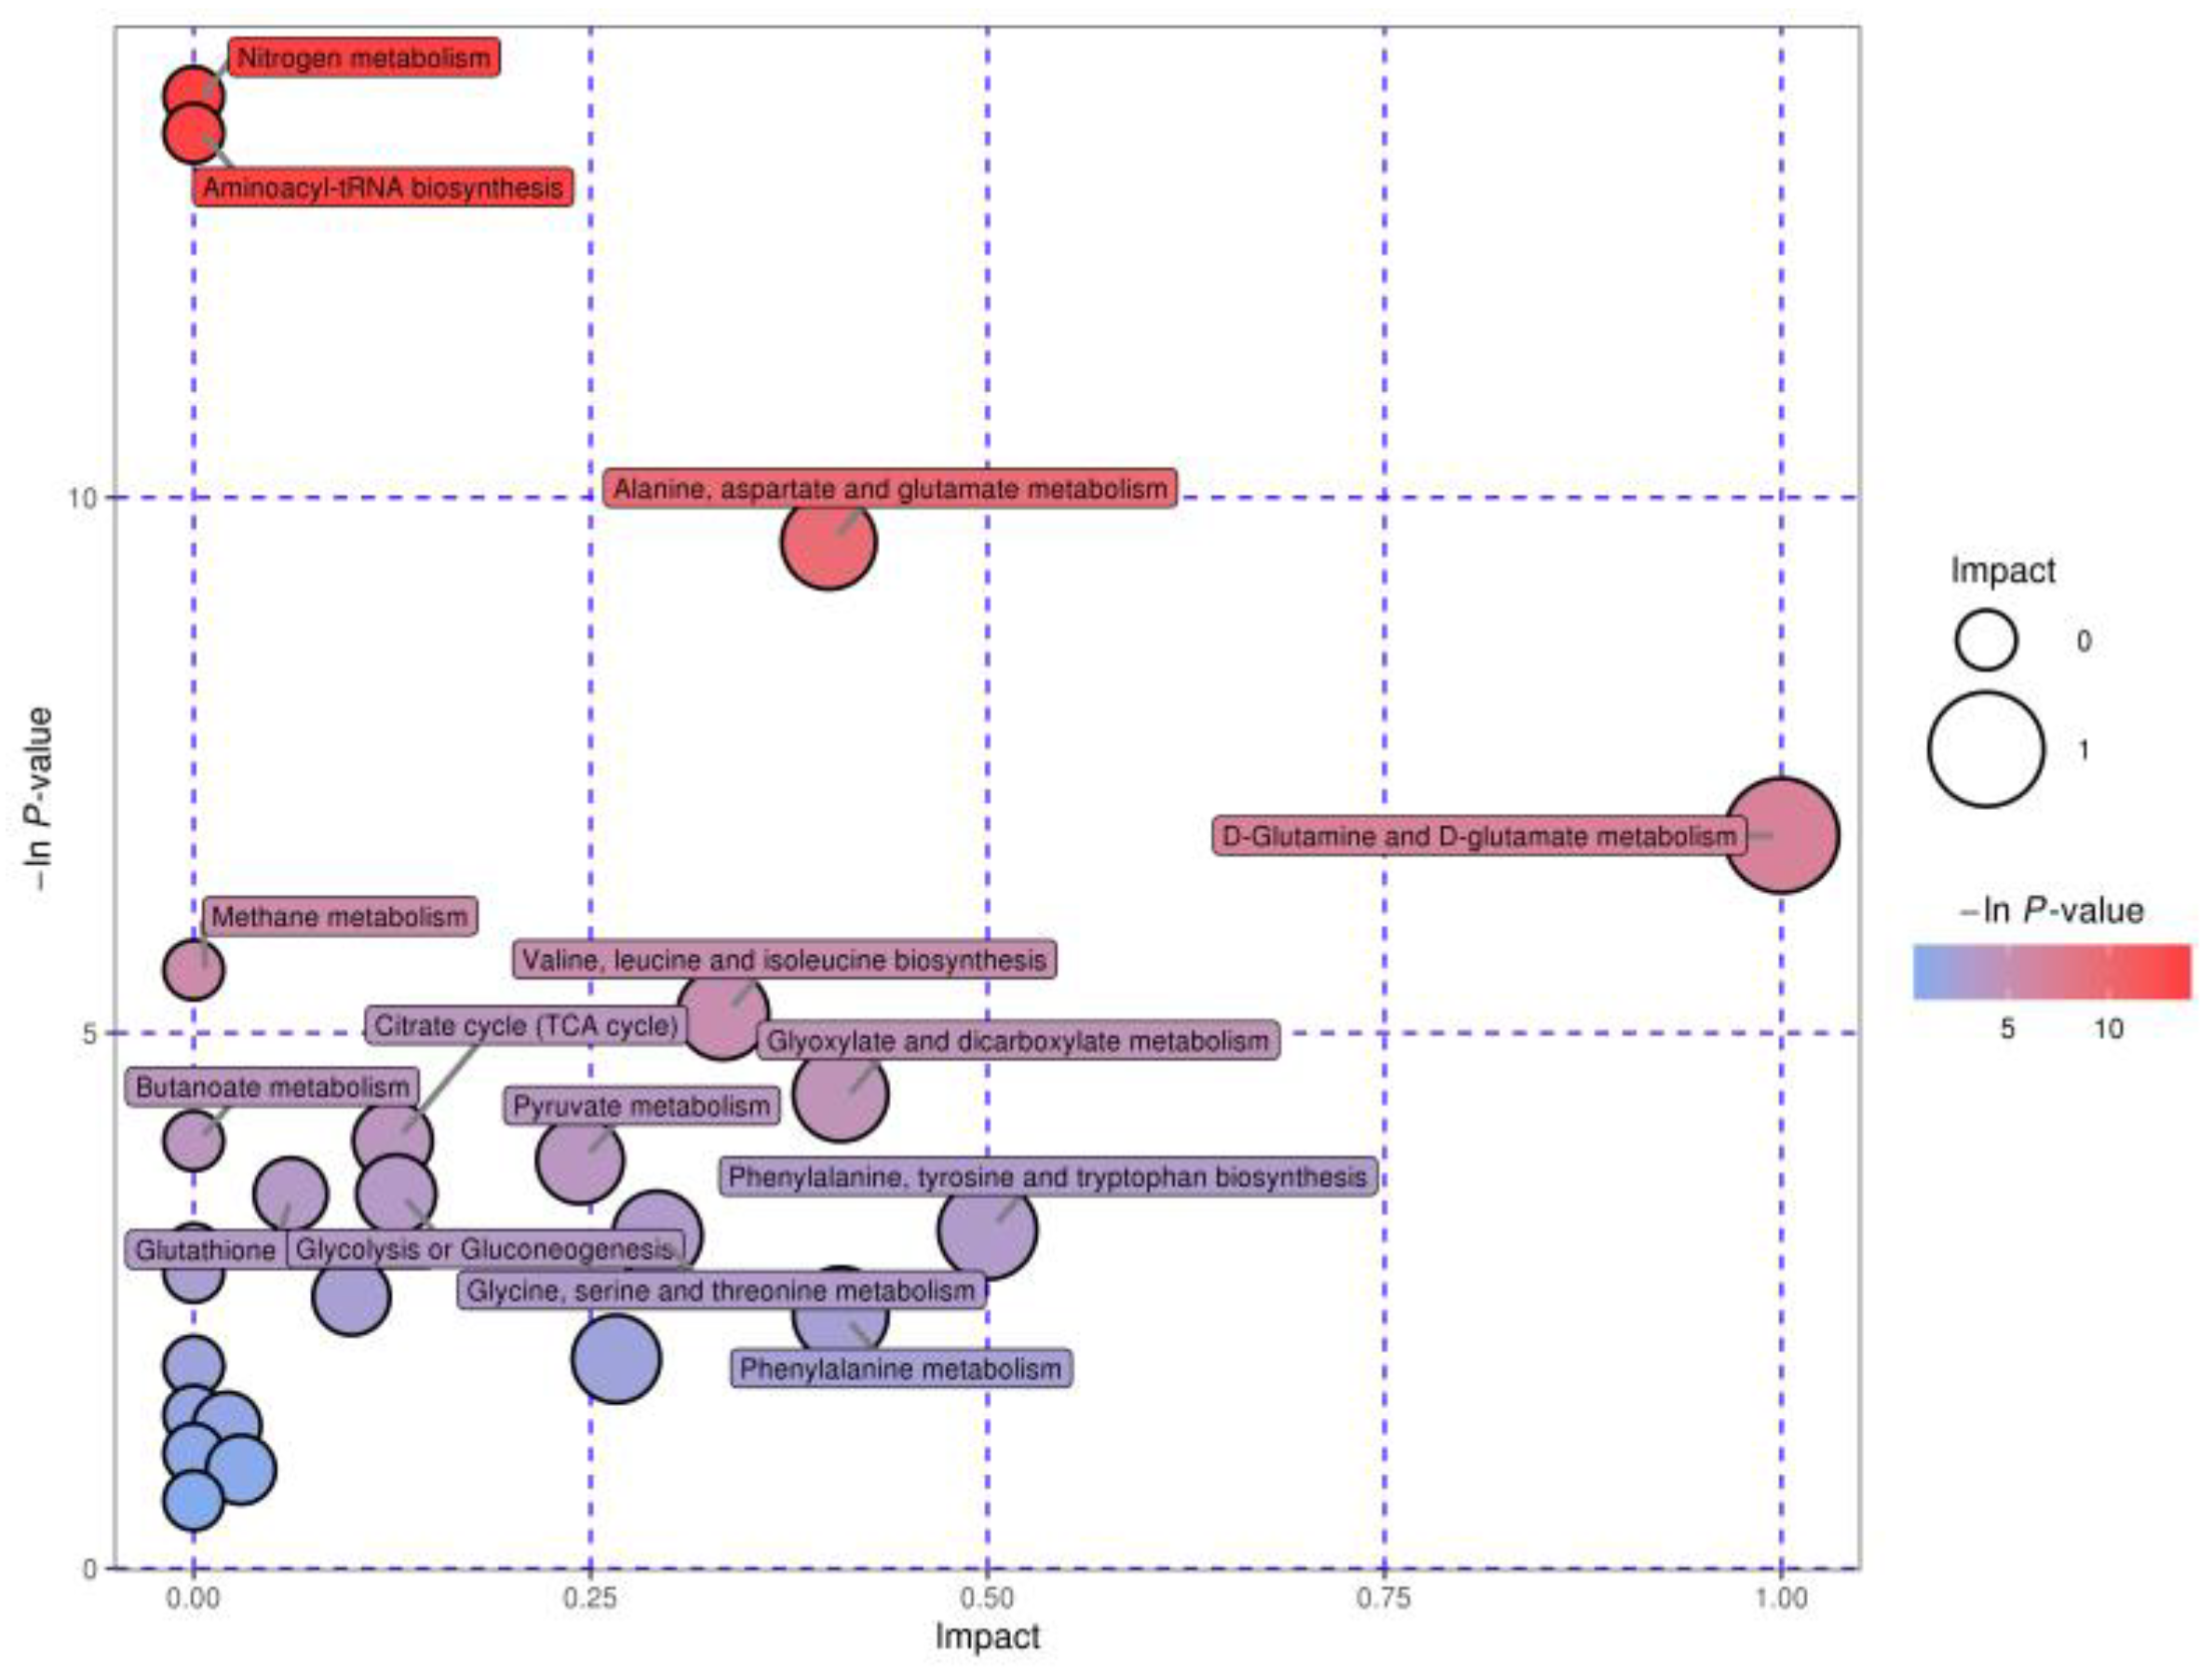
3.6. Characterization and Functional Analysis of the Key Metabolic Pathways

To further understand the biological implication of the differential metabolites, we performed metabolic pathway enrichment analysis using MetaboAnalyst 5.0 (https://www.metaboanalyst.ca/, accessed on 16 July 2023). An interactive visualization approach was utilized to illustrate the main pathways for the 24 metabolites that were found to be different between normal and VED cows (Figure 6). The findings of the primary pathway assessment are presented in Table 5. A total of nine pathway impacts >0.1 with p < 0.05 were found for the primary metabolic pathways. Among these pathways, four biological modules were involved in carbohydrate metabolism, including glyoxylate and dicarboxylate metabolism (impact = 0.41), pyruvate metabolism (impact = 0.18), glycolysis or gluconeogenesis (impact = 0.13), and citrate cycle (TCA cycle) (impact = 0.13). Five biological modules were involved in amino acid metabolism, including D-glutamine and D-glutamate metabolism (impact = 1.00); phenylalanine, tyrosine, and tryptophan biosynthesis (impact = 0.50); alanine, aspartate, and glutamate metabolism (impact = 0.40); valine, leucine, and isoleucine biosynthesis (impact = 0.33); and glycine, serine, and threonine metabolism (impact = 0.29). Furthermore, nitrogen metabolism and aminoacyl-tRNA biosynthesis were deemed to be possible target pathways (−ln p ≥ 10). According to these findings, 11 different metabolic pathways were significantly affected in the cows with VED.

4. Discussion

The present study investigated the metabolic changes associated with VED in dairy cows after calving by applying an untargeted metabolomics screening. Following the global non-target metabolomics screening, 24 differential metabolites that can relate to VED were described, and their correlating metabolomic pathways were also identified. The data presented provide the most comprehensive metabolomics analysis of VED in cows to date. These data may support a novel approach for the diagnosis of cows with VED in clinical practice in the future.
Most dairy cattle, during early lactation, undergo a period of negative energy balance (NEB) associated with multiple metabolic changes when DMI is reduced to levels lower than the required energy to maintain the body condition and the production of milk [16,31]. In the present study, we observed lower DMI and milk yield in the VED group relative to the normal group, indicating that VED may be accompanied by NEB. Moreover, the low milk yield can be attributed to a low DMI [32]; the latter may be one of the reasons for VED [7]. In the early phase after parturition in dairy cattle, negative energy balance is typically characterized by substantial mobilization of bodily energy stores [33]. Consequently, the lower postpartum BCS indicated that VED cows suffered an NEB [34]. Increased systemic concentrations of NEFA result from the breakdown of fat storage [35]. This reinforces the circulating NEFA outcomes obtained in the VED group. These data imply that VED cows exhibited an increase in lipid mobilization in the early lactation stage due to NEB.
Abnormal lipid metabolism is associated with the occurrence of VED. Very low-density lipoproteins such as TG-rich lipoprotein are synthesized in the liver [36]. The liver exports vitamin E to extrahepatic tissues through the secretion of VLDL [37]. In the circulatory system, VLDL is transformed into LDL, which becomes the primary transporter of vitamin E isomers to peripheral tissues [38]. Consequently, elevated VLDL values likewise elevate LDL levels [39]. In this investigation, we discovered that circulating VLDL and LDL levels are elevated in VED cows compared with normal cows. This suggests an increased vitamin E consumption in peripheral tissues of VED cows, contributing to the decreased vitamin E in circulation, eventually resulting in VED. In addition, the higher circulating concentrations of unsaturated lipids (L7, L8, L9) in VED cows may potentially be accounted for by the changes in liver fat metabolism [40].
When the energy demand increases but the supply is insufficient, energy metabolism becomes imbalanced [41]. In the current investigation, there was a statistically significant elevation in the serum concentrations of citrate, glucose, and pyruvate when VED was existent. This revealed that the VED cows had an imbalance in their energy metabolism. Citric acid levels, which are a key TCA intermediate, elevated significantly in the serum of the VED group, which indicated that the primary energy supply route, which is the TCA cycle, was blocked. Because the TCA cycle is the main critical system in the energy metabolism of the body, any disruption to this process will eventually result in an energy metabolism imbalance [42,43]. In addition, increased serum glucose and pyruvate levels in VED cows imply promoted gluconeogenesis and altered carbohydrate and energy metabolism. Insufficient energy, in turn, enhances other energy production pathways, such as the creatine and phosphate creatine balance system [44]. Creatine plays a key role in energy metabolism, and the majority of creatine is stored in skeletal muscle as creatine phosphate [45]. Creatinine is a breakdown product of the intracellular creatinine precursors creatine and creatine phosphate [46]. In this study, VED cows exhibited an increase in serum creatinine levels compared to normal cows. This result suggests that NEB in VED cows could be relieved by increasing muscle breakdown.
Vitamin E deficiency can alter amino acid metabolism. Eight differential amino acids were identified in this study. In VED cows, these amino acids were mainly involved in D-glutamine and D-glutamate metabolism; phenylalanine, tyrosine, and tryptophan biosynthesis; alanine, aspartate, and glutamate metabolism; valine, leucine, and isoleucine biosynthesis; and glycine, serine, and threonine metabolism. As the D-glutamine and D-glutamate metabolism pathway had an effective value of 1 showed that the D-glutamine and D-glutamate metabolism pathway as well as the metabolite D-glutamic acid, are major aspects of alterations in amino acid metabolism in VED cows. According to the outcome of their breakdown byproducts, the eight amino acids are classified as either glucogenic amino acids (alanine, glutamate, glutamine, glycine, histidine, and valine), ketogenic amino acids (lysine), or both ketogenic and glucogenic amino acids (phenylalanine) [47]. Gluconeogenic amino acids are those amino acids that when broken down, create either pyruvate or one of the metabolites of the TCA cycle (such as α-ketoglutarate, succinyl-CoA, fumarate, or oxaloacetate), all of which can transform into glucose [48]. On the other hand, ketogenic amino acids can be transformed into ketone bodies through the decomposition of lipids and the production of a source of energy [49]. In the present study, the above glucogenic and/or ketogenic amino acids in the serum were all increased in the VED cows compared with the normal cows. Therefore, the pattern of alterations in amino acid metabolism in VED cows could be explained by an increased synthesis of glucogenic precursors to promote gluconeogenesis and an increased synthesis of alternative energy substrate precursors to provide energy production.
Vitamin E deficiency may accelerate lipid oxidation. In the VED group, the concentrations of serum ketone bodies like acetone rose. The beta-oxidation of fatty acids in the mitochondria results in the production of acetone [50]. It was hypothesized that VED stimulated the β-oxidation of fatty acids since there was an elevation in the concentrations of acetone. In addition, the level of lipid peroxidation and lipid peroxidation byproducts that are generated is directly proportional to the amount of unsaturated fats [51]. The results of the present study confirmed this, with higher serum concentrations of unsaturated lipids (L7, L8, L9) and MDA in VED cows. The findings provide additional evidence of the more oxidized cell conditions, which can be achieved by an elevation in the oxidation of fatty acids. This is similar to a study in which VED triggered lipid peroxidation [52]. Malondialdehyde is the main byproduct of lipid peroxidation [53]. A rise in MDA values is associated with an increase in oxidative stress and destruction that is controlled by oxidation [54]. In addition, vitamin E is a strong antioxidant, and the decrease in its levels indicates a decline in the TAC, which also indirectly represents the values of oxidative stress non-enzymatic antioxidants [55]. In addition to high levels of MDA, cows with VED also exhibit low levels of TAC. Thus, VED can induce an oxidative stress response in cows.
Vitamin E deficiency can elicit inflammation. Hepatocytes, in response to the harm to the surrounding tissue, will produce acetylated glycoproteins, which will then act as inflammatory mediators [56]. N-acetylated glycoproteins are a type of acute-phase protein that is seen in higher levels during the initial phases of various pathologies, including inflammation, infection, neoplasia, stress, and trauma [57]. In response to cytokines, these "acute phase" acetyl glycoproteins are mostly generated in the liver parenchymal cells [46]. Oxidative stress can occur in cows with VED because of lipid peroxidation. In this investigation, N-acetyl glycoproteins and O-acetyl glycoproteins were found with larger signal strength in the spectra of serum from the VED group contrasted with the normal cows. This may have been in response to oxidative stress, and the VED cows could have had increased liver or peripheral inflammation.
In dairy cattle, hepatic damage and disorders are most likely to occur during the peripartum period because of the substantial shifts in lipid metabolism [58], oxidative stress, and inflammation that can occur during this time [59]. One common method for determining whether there was damage to the liver is to look for elevated levels of the enzyme AST [60]. A low quantity of albumin can impair immunological performance and hinder cellular immune function [61]. Albumin is another important liver function index that is widely recognized as an evaluation tool for the nutritive and inflammation state of the body [62]. In this study, the levels of AST correlated with hepatic injury were increased, and the levels of albumin were markedly lower in cows with VED related to the normal group. Hence, liver injury may occur in VED cows. In addition, a significant reduction in the serum concentrations of HDL was seen in the VED cows. This observation was consistent with a previous study showing that cows with hepatic injury had low HDL concentrations in the blood [63]. Thus, it is reasonable to speculate that cows with VED exhibit hepatic injury. Altogether, hepatic impairment in VED cows relates to the substantial shifts in lipid metabolism, oxidative stress, and inflammation that are generated by VED during early lactation.
Vitamin E deficiency can change rumen microbial metabolism. In dairy production, formate is produced endogenously by rumen methanogens, which use microbial fermentation to create formic acid and hydrogen [64]. Acetate is one of the principal volatile fatty acids produced by ruminal microorganisms through the fermentation of carbohydrates [65]. Dimethylamine is a choline metabolite mediated by microbiota [66]. Taken together, rumen microbiota can manufacture these products. In the present study, serum formate, acetate, and dimethylamine were elevated in the VED group when contrasted with the normal group, which is an interesting finding that VED might alter rumen microbial metabolism, consequently increasing these serum metabolites. However, further studies in rumen microbiota are required to confirm this.

5. Conclusions

In this study, a metabolomics framework following 1H NMR analysis was used to study metabolic changes in VED cows. We accordingly identified 24 metabolites that showed differential expression between VED and normal cows. Furthermore, 11 metabolic pathways involving energy, carbohydrate, and amino acid metabolism showed significant changes in VED cows. The present findings suggest that VED cows were more likely to experience a negative energy balance characterized by alterations of common systemic metabolic processes and develop oxidative stress, inflammation, and ultimately liver injury. To the best of our knowledge, this is the first research on the metabolic conditions of VED cows observed in vivo. Further studies should use targeted metabolomics to verify metabolite levels and analyze related regulatory enzymes in metabolic pathways of interest.

Supplementary Materials

The following supporting information can be downloaded at: https://www.mdpi.com/article/10.3390/ani13182957/s1, Table S1: 1H NMR assignments of major metabolites in serum of cows; Table S2: Model parameters of principal component analysis (PCA); Table S3: Model parameters of orthogonal partial least-squares discriminant analysis (OPLS-DA).

Author Contributions

Conceptualization, C.X.; methodology, J.C. and J.T.; writing—original draft preparation, Y.S. and H.W.; writing—review and editing, Y.B.; visualization, R.S. All authors have read and agreed to the published version of the manuscript.

Funding

This research was funded by Key Project of Natural Science Foundation of Heilongjiang Province of China, grant number ZD2021C006.

Institutional Review Board Statement

The animal study protocol was approved by the Ethics Committee of Heilongjiang Bayi Agricultural University (protocol code DWKJXY2023065; approval date: 15 January 2023).

Informed Consent Statement

Informed consent was obtained from all subjects involved in the study.

Data Availability Statement

The data presented in this study are available on request from the corresponding author.

Conflicts of Interest

The authors declare no conflict of interest.

References

  1. Beeckman, A.; Vicca, J.; Van Ranst, G.; Janssens, G.P.; Fievez, V. Monitoring of vitamin E status of dry, early and mid-late lactating organic dairy cows fed conserved roughages during the indoor period and factors influencing forage vitamin E levels. J. Anim. Physiol. Anim. Nutr. 2010, 94, 736–746. [Google Scholar] [CrossRef] [PubMed]
  2. Weiss, W.P. A 100-year review: From ascorbic acid to zinc—Mineral and vitamin nutrition of dairy cows. J. Dairy Sci. 2017, 100, 10045–10060. [Google Scholar] [CrossRef] [PubMed]
  3. Haga, S.; Ishizaki, H.; Roh, S. The physiological roles of vitamin E and hypovitaminosis E in the transition period of high-yielding dairy cows. Animals 2021, 11, 1088. [Google Scholar] [CrossRef]
  4. Kuhn, M.J.; Sordillo, L.M. Vitamin E analogs limit in vitro oxidant damage to bovine mammary endothelial cells. J. Dairy Sci. 2021, 104, 7154–7167. [Google Scholar] [CrossRef] [PubMed]
  5. Moghimi-Kandelousi, M.; Alamouti, A.A.; Imani, M.; Zebeli, Q. A meta-analysis and meta-regression of the effects of vitamin E supplementation on serum enrichment, udder health, milk yield, and reproductive performance of transition cows. J. Dairy Sci. 2020, 103, 6157–6166. [Google Scholar] [CrossRef]
  6. Strickland, J.M.; Wisnieski, L.; Herdt, T.H.; Sordillo, L.M. Serum retinol, β-carotene, and α-tocopherol as biomarkers for disease risk and milk production in periparturient dairy cows. J. Dairy Sci. 2021, 104, 915–927. [Google Scholar] [CrossRef]
  7. Haga, S.; Miyaji, M.; Nakano, M.; Ishizaki, H.; Matsuyama, H.; Katoh, K.; Roh, S. Changes in the expression of α-tocopherol–related genes in liver and mammary gland biopsy specimens of peripartum dairy cows. J. Dairy Sci. 2018, 101, 5277–5293. [Google Scholar] [CrossRef]
  8. Goff, J.P.; Stabel, J.R. Decreased plasma retinol, α-tocopherol, and zinc concentration during the periparturient period: Effect of milk fever. J. Dairy Sci. 1990, 73, 3195–3199. [Google Scholar] [CrossRef]
  9. Weiss, W.P.; Todhunter, D.A.; Hogan, J.S.; Smith, K.L. Effect of duration of supplementation of selenium and vitamin E on periparturient dairy cows. J. Dairy Sci. 1990, 73, 3187–3194. [Google Scholar] [CrossRef]
  10. Weiss, W.P.; Hogan, J.S.; Smith, K.L.; Hoble, K.H. Relationships among selenium, vitamin E, and mammary gland health in commercial dairy herds. J. Dairy Sci. 1990, 73, 381–390. [Google Scholar] [CrossRef]
  11. Kumagai, H.; Chaipan, Y. Changes of vitamin E status of periparturient dairy cows and newborn calves. Anim. Sci. J. 2004, 75, 541–547. [Google Scholar] [CrossRef]
  12. NRC. Nutrient Requirements of Dairy Cattle, 7th ed.; The National Academies Press: Washington, DC, USA, 2001. [Google Scholar]
  13. Qian, W.; Yu, H.; Zhang, C.; Zhang, H.; Fu, S.; Xia, C. Plasma proteomics characteristics of subclinical vitamin E deficiency of dairy cows during early lactation. Front. Vet. Sci. 2021, 8, 723898. [Google Scholar] [CrossRef] [PubMed]
  14. Xu, W.; van Knegsel, A.; Saccenti, E.; van Hoeij, R.; Kemp, B.; Vervoort, J. Metabolomics of milk reflects a negative energy balance in cows. J. Proteome Res. 2020, 19, 2942–2949. [Google Scholar] [CrossRef] [PubMed]
  15. Zhao, C.; Bai, Y.; Fu, S.; Wu, L.; Xia, C.; Xu, C. Comparison of metabolic alterations in serum and milk whey between inactive ovaries and estrus dairy cows. Front. Vet. Sci. 2021, 7, 609391. [Google Scholar] [CrossRef]
  16. Basoglu, A.; Baspinar, N.; Tenori, L.; Licari, C.; Gulersoy, E. Nuclear magnetic resonance (NMR)-based metabolome profile evaluation in dairy cows with and without displaced abomasum. Vet. Q. 2020, 40, 1–15. [Google Scholar] [CrossRef] [PubMed]
  17. Sun, Y.; Xu, C.; Li, C.; Xia, C.; Xu, C.; Wu, L.; Zhang, H. Characterization of the serum metabolic profile of dairy cows with milk fever using 1H-NMR spectroscopy. Vet. Q. 2014, 34, 159–163. [Google Scholar] [CrossRef]
  18. Zhu, C.; Tang, K.; Lu, X.; Tang, J.; Laghi, L. An untargeted metabolomics investigation of milk from dairy cows with clinical mastitis by 1H-NMR. Foods 2021, 10, 1707. [Google Scholar] [CrossRef]
  19. Zhao, C.; Bai, Y.; Fu, S.; Wu, L.; Xia, C.; Xu, C. Metabolic alterations in dairy cows with subclinical ketosis after treatment with carboxymethyl chitosan-loaded, reduced glutathione nanoparticles. J. Vet. Intern. Med. 2020, 34, 2787–2799. [Google Scholar] [CrossRef]
  20. Eom, J.S.; Lee, S.J.; Kim, H.S.; Choi, Y.; Jo, S.U.; Lee, S.S.; Kim, E.T.; Lee, S.S. Metabolic profiling of serum and urine in lactating dairy cows affected by subclinical ketosis using proton nuclear magnetic resonance spectroscopy. J. Anim. Sci. Technol. 2022, 64, 247–261. [Google Scholar] [CrossRef]
  21. Lisuzzo, A.; Laghi, L.; Faillace, V.; Zhu, C.; Contiero, B.; Morgante, M.; Mazzotta, E.; Gianesella, M.; Fiore, E. Differences in the serum metabolome profile of dairy cows according to the BHB concentration revealed by proton nuclear magnetic resonance spectroscopy (1H-NMR). Sci. Rep. 2022, 12, 2525. [Google Scholar] [CrossRef]
  22. Eom, J.S.; Kim, H.S.; Lee, S.J.; Choi, Y.Y.; Jo, S.U.; Kim, J.; Lee, S.S.; Kim, E.T.; Lee, S.S. Metabolic profiling of rumen fluid and milk in lactating dairy cattle influenced by subclinical ketosis using proton nuclear magnetic resonance spectroscopy. Animals 2021, 11, 2526. [Google Scholar] [CrossRef] [PubMed]
  23. Sun, L.W.; Zhang, H.Y.; Wu, L.; Shu, S.; Xia, C.; Xu, C.; Zheng, J.S. (1)H-Nuclear magnetic resonance-based plasma metabolic profiling of dairy cows with clinical and subclinical ketosis. J. Dairy Sci. 2014, 97, 1552–1562. [Google Scholar] [CrossRef] [PubMed]
  24. Rodriguez-Martinez, A.; Ayala, R.; Posma, J.M.; Harvey, N.; Jiménez, B.; Sonomura, K.; Sato, T.A.; Matsuda, F.; Zalloua, P.; Gauguier, D.; et al. pJRES binning algorithm (JBA): A new method to facilitate the recovery of metabolic information from pJRES 1H NMR spectra. Bioinformatics 2019, 35, 1916–1922. [Google Scholar] [CrossRef] [PubMed]
  25. Wei, T.; Shu, Q.; Ning, J.; Wang, S.; Li, C.; Zhao, L.; Zheng, H.; Gao, H. The protective effect of basic fibroblast growth factor on diabetic nephropathy through remodeling metabolic phenotype and suppressing oxidative stress in mice. Front. Pharmacol. 2020, 11, 66. [Google Scholar] [CrossRef] [PubMed]
  26. Putman, A.K.; Brown, J.L.; Gandy, J.C.; Wisnieski, L.; Sordillo, L.M. Changes in biomarkers of nutrient metabolism, inflammation, and oxidative stress in dairy cows during the transition into the early dry period. J. Dairy Sci. 2018, 101, 9350–9359. [Google Scholar] [CrossRef]
  27. Edmonson, A.J.; Lean, I.J.; Weaver, L.D.; Farver, T.; Webster, G. A body condition scoring chart for Holstein dairy cows. J. Dairy Sci. 1989, 72, 68–78. [Google Scholar] [CrossRef]
  28. Siomek, A.; Gackowski, D.; Rozalski, R.; Dziaman, T.; Szpila, A.; Guz, J.; Olinski, R. Higher leukocyte 8-oxo-7,8-dihydro-2′-deoxyguanosine and lower plasma ascorbate in aging humans? Antioxid. Redox Signal. 2007, 9, 143–150. [Google Scholar] [CrossRef]
  29. Meyer, S.; Markova, M.; Pohl, G.; Marschall, T.A.; Pivovarova, O.; Pfeiffer, A.F.H.; Schwerdtle, T. Development, validation and application of an ICP-MS/MS method to quantify minerals and (ultra-)trace elements in human serum. J. Trace Elem. Med. Biol. 2018, 49, 157–163. [Google Scholar] [CrossRef]
  30. Wang, Q.; Zhang, Y.; Zheng, N.; Guo, L.; Song, X.; Zhao, S.; Wang, J. Biological system responses of dairy cows to aflatoxin B1 exposure revealed with metabolomic changes in multiple biofluids. Toxins 2019, 11, 77. [Google Scholar] [CrossRef]
  31. Wathes, D.C.; Fenwick, M.; Cheng, Z.; Bourne, N.; Llewellyn, S.; Morris, D.G.; Kenny, D.; Murphy, J.; Fitzpatrick, R. Influence of negative energy balance on cyclicity and fertility in the high producing dairy cow. Theriogenology 2007, 68, S232–S241. [Google Scholar] [CrossRef]
  32. Lopreiato, V.; Mezzetti, M.; Cattaneo, L.; Ferronato, G.; Minuti, A.; Trevisi, E. Role of nutraceuticals during the transition period of dairy cows: A review. J. Anim. Sci. Biotechnol. 2020, 11, 96. [Google Scholar] [CrossRef] [PubMed]
  33. Morris, D.G.; Waters, S.M.; McCarthy, S.D.; Patton, J.; Earley, B.; Fitzpatrick, R.; Murphy, J.J.; Diskin, M.G.; Kenny, D.A.; Brass, A.; et al. Pleiotropic effects of negative energy balance in the postpartum dairy cow on splenic gene expression: Repercussions for innate and adaptive immunity. Physiol. Genom. 2009, 39, 28–37. [Google Scholar] [CrossRef] [PubMed]
  34. Safa, S.; Soleimani, A.; Heravi Moussavi, A. Improving productive and reproductive performance of Holstein dairy cows through dry period management. Asian-Australas. J. Anim. Sci. 2013, 26, 630–637. [Google Scholar] [CrossRef]
  35. Hare, K.S.; Wood, K.M.; Fitzsimmons, C.; Penner, G.B. Oversupplying metabolizable protein in late gestation for beef cattle: Effects on postpartum ruminal fermentation, blood metabolites, skeletal muscle catabolism, colostrum composition, milk yield and composition, and calf growth performance. J. Anim. Sci. 2019, 97, 437–455. [Google Scholar] [CrossRef]
  36. Nanashima, N.; Horie, K.; Kitajima, M.; Takamagi, S.; Mikami, K.; In, N.; Tomisawa, T. Hypocholesterolemic effect of Blackcurrant (Ribes nigrum) extract in healthy female subjects: A pilot study. Molecules 2021, 26, 4085. [Google Scholar] [CrossRef] [PubMed]
  37. Kiyose, C. Absorption, transportation, and distribution of vitamin E homologs. Free. Radic. Biol. Med. 2021, 177, 226–237. [Google Scholar] [CrossRef]
  38. Naidoo, N.; van Dam, R.M.; Koh, W.P.; Chen, C.; Lee, Y.P.; Yuan, J.M.; Ong, C.N. Plasma vitamin E and coenzyme Q10 are not associated with a lower risk of acute myocardial infarction in Singapore Chinese adults. J. Nutr. 2012, 142, 1046–1052. [Google Scholar] [CrossRef]
  39. Kusmayadi, A.; Bachtiar, K.R.; Prayitno, C.H. The effects of mangosteen peel (Garcinia mangostana L.) and Turmeric (Curcuma domestica Val) flour dietary supplementation on the growth performance, lipid profile, and abdominal fat content in Cihateup ducks. Vet. World 2019, 12, 402–408. [Google Scholar] [CrossRef]
  40. Graf, D.; Weitkunat, K.; Dötsch, A.; Liebisch, G.; Döring, M.; Krüger, R.; Vatareck, E.; von Coburg, E.; Loh, G.; Watzl, B. Specific wheat fractions influence hepatic fat metabolism in diet-induced obese mice. Nutrients 2019, 11, 2348. [Google Scholar] [CrossRef]
  41. Yang, Y.; Ding, Z.; Wang, Y.; Zhong, R.; Feng, Y.; Xia, T.; Xie, Y.; Yang, B.; Sun, X.; Shu, Z. Systems pharmacology reveals the mechanism of activity of Physalis alkekengi L. var. franchetii against lipopolysaccharide-induced acute lung injury. J. Cell. Mol. Med. 2020, 24, 5039–5056. [Google Scholar]
  42. Guo, P.; Wang, J.; Dong, G.; Wei, D.; Li, M.; Yang, M.; Kong, L. NMR-based metabolomics approach to study the chronic toxicity of crude ricin from castor bean kernels on rats. Mol. Biosyst. 2014, 10, 2426–2440. [Google Scholar] [CrossRef]
  43. Li, P.; Liao, S.; Wang, J.; Xu, D.; Zhang, Q.; Yang, M.; Kong, L. NMR metabolic profiling of lipopolysaccharide-induced mice sepsis and the treatment effects of berberine. RSC Adv. 2016, 6, 47474–47485. [Google Scholar] [CrossRef]
  44. Fu, X.; Wang, J.; Liao, S.; Lv, Y.; Xu, D.; Yang, M.; Kong, L. 1H NMR-based metabolomics reveals refined-Huang-Lian-Jie-Du-Decoction (BBG) as a potential ischemic stroke treatment drug with efficacy and a favorable therapeutic window. Front. Pharmacol. 2019, 10, 337. [Google Scholar] [CrossRef]
  45. He, D.T.; Gai, X.R.; Yang, L.B.; Li, J.T.; Lai, W.Q.; Sun, X.L.; Zhang, L.Y. Effects of guanidinoacetic acid on growth performance, creatine and energy metabolism, and carcass characteristics in growing-finishing pigs. J. Anim. Sci. 2018, 96, 3264–3273. [Google Scholar] [CrossRef] [PubMed]
  46. Forni Ogna, V.; Ogna, A.; Vuistiner, P.; Pruijm, M.; Ponte, B.; Ackermann, D.; Gabutti, L.; Vakilzadeh, N.; Mohaupt, M.; Martin, P.Y.; et al. New anthropometry-based age- and sex-specific reference values for urinary 24-hour creatinine excretion based on the adult Swiss population. BMC Med. 2015, 13, 40. [Google Scholar] [CrossRef]
  47. Takeuchi, F.; Nishikata, N.; Nishimura, M.; Nagao, K.; Kawamura, M., Jr. Leucine-enriched essential amino acids enhance the antiseizure effects of the ketogenic diet in rats. Front. Neurosci. 2021, 15, 637288. [Google Scholar] [CrossRef] [PubMed]
  48. Taherizadeh, M.; Khoshnia, M.; Shams, S.; Hesari, Z.; Joshaghani, H. Clinical significance of plasma levels of gluconeogenic amino acids in esophageal cancer patients. Asian Pac. J. Cancer Prev. 2020, 21, 2463–2468. [Google Scholar] [CrossRef] [PubMed]
  49. Sajitz-Hermstein, M.; Nikoloski, Z. A novel approach for determining environment-specific protein costs: The case of Arabidopsis thaliana. Bioinformatics 2010, 26, i582–i588. [Google Scholar] [CrossRef] [PubMed]
  50. Liu, G.; Yan, T.; Wang, J.; Huang, Z.; Chen, X.; Jia, G.; Wu, C.; Zhao, H.; Xue, B.; Xiao, L.; et al. Biological system responses to zearalenone mycotoxin exposure by integrated metabolomic studies. J. Agric. Food Chem. 2013, 61, 11212–11221. [Google Scholar] [CrossRef]
  51. Ore, A.; Olayinka, E.T. Influence of moxifloxacin on hepatic redox status and plasma biomarkers of hepatotoxicity and nephrotoxicity in rat. Biochem. Res. Int. 2015, 2015, 192724. [Google Scholar] [CrossRef]
  52. Zhang, J.; Head, B.; Leonard, S.W.; Choi, J.; Tanguay, R.L.; Traber, M.G. Vitamin E deficiency dysregulates thiols, amino acids and related molecules during zebrafish embryogenesis. Redox Biol. 2021, 38, 101784. [Google Scholar] [CrossRef] [PubMed]
  53. Carracedo, J.; Ramírez-Carracedo, R.; Martínez de Toda, I.; Vida, C.; Alique, M.; De la Fuente, M.; Ramírez-Chamond, R. Protein carbamylation: A marker reflecting increased age-related cell oxidation. Int. J. Mol. Sci. 2018, 19, 1495. [Google Scholar] [CrossRef]
  54. He, B.; Li, H.; Hu, M.; Dong, W.; Wei, Z.; Li, J.; Yao, W.; Guo, X. Association between serum interleukin-17A level and high-altitude deacclimatization syndrome. Mediat. Inflamm. 2016, 2016, 1732352. [Google Scholar] [CrossRef] [PubMed]
  55. Zhou, X.Q.; Yao, Z.W.; Peng, Y.; Mao, S.S.; Xu, D.; Qin, X.F.; Zhang, R.J. PQQ ameliorates D-galactose induced cognitive impairments by reducing glutamate neurotoxicity via the GSK-3β/Akt signaling pathway in mouse. Sci. Rep. 2018, 8, 8894. [Google Scholar] [CrossRef]
  56. Liu, X.W.; Tang, C.L.; Zheng, H.; Wu, J.X.; Wu, F.; Mo, Y.Y.; Liu, X.; Zhu, H.J.; Yin, C.L.; Cheng, B.; et al. Investigation of the hepatoprotective effect of Corydalis saxicola Bunting on carbon tetrachloride-induced liver fibrosis in rats by 1H-NMR-based metabonomics and network pharmacology approaches. J. Pharm. Biomed. Anal. 2018, 159, 252–261. [Google Scholar] [CrossRef] [PubMed]
  57. Guo, Y.S.; Tao, J.Z. 1H nuclear magnetic resonance-based plasma metabolomics provides another perspective of response mechanisms of newborn calves upon the first colostrum feeding. J. Anim. Sci. 2018, 96, 1769–1777. [Google Scholar] [CrossRef]
  58. Drackley, J.K. Biology of dairy cows during the transition period: The final frontier? J. Dairy Sci. 1999, 82, 2259–2273. [Google Scholar] [CrossRef]
  59. Trevisi, E.; Amadori, M.; Cogrossi, S.; Razzuoli, E.; Bertoni, G. Metabolic stress and inflammatory response in high-yielding, periparturient dairy cows. Res. Vet. Sci. 2012, 93, 695–704. [Google Scholar] [CrossRef]
  60. Couperus, A.M.; Schroeder, F.; Klukas, R.; Huber, J.; Wittek, T.; Peham, J.R. Influence of different lactation stages on circadian rhythmicity of metabolic biomarkers in dairy cows: A pilot study. Animals 2021, 11, 1043. [Google Scholar] [CrossRef]
  61. Liu, X.; Guo, X.; Zhang, Z. Preoperative serum hypersensitive-c-reactive-protein (Hs-CRP) to albumin ratio predicts survival in patients with luminal B subtype breast cancer. OncoTargets Ther. 2021, 14, 4137–4148. [Google Scholar] [CrossRef]
  62. Zhou, W.; Fang, Y.; Han, X.; Kuang, T.; Xu, X.; Lou, W.; Wang, D. The value of alkaline phosphatase-to-albumin ratio in detecting synchronous metastases and predicting postoperative relapses among patients with well-differentiated pancreatic neuroendocrine neoplasms. J. Oncol. 2020, 2020, 8927531. [Google Scholar] [CrossRef]
  63. Esmaeilnejad, B.; Dalir-Naghadeh, B.; Tavassoli, M.; Asri-Rezaei, S.; Mahmoudi, S.; Rajabi, S.; Aligolzadeh, A.; Akbari, H.; Morvaridi, A. Assessment of hepatic oxidative damage, paraoxonase-1 activity, and lipid profile in cattle naturally infected with Babesia bigemina. Trop. Anim. Health Prod. 2021, 53, 219. [Google Scholar] [CrossRef]
  64. Morgavi, D.P.; Forano, E.; Martin, C.; Newbold, C.J. Microbial ecosystem and methanogenesis in ruminants. Animal 2010, 4, 1024–1036. [Google Scholar] [CrossRef] [PubMed]
  65. Yanibada, B.; Hohenester, U.; Pétéra, M.; Canlet, C.; Durand, S.; Jourdan, F.; Boccard, J.; Martin, C.; Eugène, M.; Morgavi, D.P.; et al. Inhibition of enteric methanogenesis in dairy cows induces changes in plasma metabolome highlighting metabolic shifts and potential markers of emission. Sci. Rep. 2020, 10, 15591. [Google Scholar] [CrossRef] [PubMed]
  66. Yang, Y.; Liu, Y.; Zheng, L.; Zhang, Q.; Gu, Q.; Wang, L.; Wang, L. 1H NMR based serum metabolic profiles associated with pathological progression of pancreatic islet β cell tumor in Rip1-Tag2 mice. Int. J. Biol. Sci. 2015, 11, 595–603. [Google Scholar] [CrossRef] [PubMed]
Figure 1. Typical 1H-NMR spectra (600.13 MHz) of serum acquired from the (A) normal and (B) vitamin E deficiency (VED) groups. The horizontal scale represents the chemical shift (ppm). The area with a range of δ5.601–9.0 ppm is magnified 32-fold in comparison to the area with a range of δ0.6–5.6 ppm. For, formate; His, histidine; Phe, phenylalanine; Tyr, tyrosine; L9, lipid, -CH=CH-; α-Glc, α-glucose; Lac, lactate; Cr, creatinine; β-Glc, β-glucose; Ala, alanine; Val, valine; Gly, glycine; PC/GPC, phosphorylcholine/glycerophosphocholine; Cho, choline; Lys, lysine; L8, lipid, =CH-CH2-CH=; Dim, dimethylamine; Cit, citrate; Gln, glutamine; Pyr, pyruvate; Glu, glutamate; Acet, acetone; L7, lipid, -CH2-C=O; OAG, O-acetyl-glycoprotein; NAG, N-acetyl-glycoprotein; L6, lipid, -CH2-CH=CH-; Ace, acetate; L5, VLDL, -CH2-CH2-C=O; L3, lipid, CH3-(CH2)n-(LDL); 3-HB, 3-hydroxybutyrate; Ile, isoleucine; Leu, leucine; L2, lipid, CH3-(CH2)n-(VLDL); L1, lipid, CH3-(CH2)n-(LDL).
Animals 13 02957 g001
Figure 2. Principal component testing scores of the normal and VED groups plotted side by side. t [1] = initial main component. t [2] = second main component.
Animals 13 02957 g002
Figure 3. Orthogonal partial least-squares discriminant analysis (OPLS-DA) scores (a) and permutation testing of the OPLS-DA framework (b) for the normal and VED groups, respectively. t [1] = initial primary element of the matrix. to [1] = orthogonal primary element. The plot of Q2 derived from the permutation testing included in the OPLS-DA framework is the intercept limit of Q2, which is calculated with the regression line.
Animals 13 02957 g003
Figure 4. The OPLS-DA loading plot for the normal group and VED group.
Animals 13 02957 g004
Figure 5. Heatmap visualization of the 24 differential metabolites identified in serum samples from the VED and normal groups.
Animals 13 02957 g005
Figure 6. KEGG pathway enrichment analysis comparing the VED and normal groups. Each bubble in the diagram depicts a metabolic pathway, and its abscissa and size show the degree of the pathway influence variables in the topological analyses. The ordinates and colors of the bubbles show the p values (−ln p-value) of the enrichment test, with darker colors indicating a greater level of enrichment.
Animals 13 02957 g006
Table 1. Ingredient and chemical composition of the early-lactation TMR diet for 28 multiparous Holstein dairy cows.
IngredientContent (g/kg DM)
Corn silage250
Alfalfa hay120
Oat hay130
Corn grain, ground251
Wheat bran55
Soybean meal106
Rapeseed meal25
Cottonseed cake45
Calcium carbonate5
Salt5
Calcium phosphate3
Mineral and vitamin premix 15
Chemical composition
Organic matter919.3
CP176.4
Ether extract31.3
NDF353.1
ADF191.0
Non-fiber carbohydrate 2358.7
Ca8.3
P4.2
1 Contained per kg premix: 20,000 mg Fe, 1600 mg Cu, 8000 mg Mn, 7500 mg Zn, 120 mg I, 20 mg Co, 820,000 IU vitamin A, 300,000 IU vitamin D and 10,000 IU vitamin E. 2 Non-fiber carbohydrate, calculated by 1000 − (CP + NDF + Fat + Ash).
Table 2. Background characteristics of the vitamin E deficiency (VED) group and normal group.
ParametersNormal (n = 14)VED (n = 14)p-Value
Age3.16 ± 0.273.22 ± 0.130.230
Parity2.22 ± 0.642.14 ± 0.550.363
BCS3.29 ± 0.243.06 ± 0.270.012
Milk yield (kg/d)35.98 ± 2.5433.23 ± 2.370.003
DMI (kg/d)15.24 ± 0.3414.61 ± 0.49<0.001
Vitamin E (μg/mL)7.33 ± 1.382.59 ± 0.77<0.001
Vitamin A (μg/mL)0.19 ± 0.060.18 ± 0.050.318
Vitamin C (μg/mL)2.66 ± 0.342.45 ± 0.670.153
Selenium (μg/mL)0.05 ± 0.010.05 ± 0.010.683
Zinc (μg/mL)1.22 ± 0.261.28 ± 0.230.262
Copper (μg/mL)0.98 ± 0.310.96 ± 0.240.425
Calcium (mmol/L)2.08 ± 0.692.07 ± 0.930.487
Phosphorus (mmol/L)2.72 ± 0.382.60 ± 0.290.178
Magnesium (mmol/L)1.54 ± 0.311.43 ± 0.460.232
VED, vitamin E deficiency; BCS, body condition score; DMI, dry matter intake.
Table 3. Comparison of serum biochemical indicators between the VED and normal groups.
ParametersNormal (n = 14)VED (n = 14)p-Value
BHB (mmol/L)1.02 ± 0.341.14 ± 0.390.197
NEFA (mmol/L)0.51 ± 0.180.78 ± 0.18<0.001
Glucose (mmol/L)5.90 ± 2.596.84 ± 2.380.163
AST (U/L)74.06 ± 3.6295.46 ± 7.10<0.001
ALT (U/L)43.60 ± 8.3042.76 ± 8.860.399
Albumin (g/L)58.01 ± 8.6246.87 ± 7.69<0.001
TC (mmol/L)5.65 ± 1.455.98 ± 1.840.301
LDL (mmol/L)3.93 ± 0.945.05 ± 0.820.001
HDL (mmol/L)1.51 ± 0.211.13 ± 0.22<0.001
TAC (mmol/L)0.54 ± 0.170.24 ± 0.10<0.001
SOD (U/mL)114.30 ± 14.67122.20 ± 15.320.088
GSH-Px (U/mL)31.65 ± 8.0529.08 ± 8.490.209
Catalase (U/mL)21.75 ± 1.6422.57 ± 1.190.071
MDA (mmol/L)9.84 ± 1.5112.59 ± 2.04<0.001
BHB, β-hydroxybutyrate; NEFA, non-esterified fatty acids; AST, aspartate aminotransferase; ALT, alanine aminotransferase; TC, total cholesterol; LDL, low-density lipoprotein; HDL, high-density lipoprotein; TAC, total antioxidant capacity; SOD, superoxide dismutase; GSH-Px, glutathione peroxidase; MDA, malondialdehyde.
Table 4. Differential serum metabolites of the VED and normal groups screened with 1H NMR.
No.Metabolitesr aTrend bp-Value
1Acetate0.70930.0001
2Acetone0.7099<0.0001
3Alanine0.68120.0003
4Citrate0.58860.0023
5Creatinine0.56320.0046
6Dimethylamine0.57600.0016
7Formate0.7439<0.0001
8Glutamate0.7495<0.0001
9Glutamine0.8136<0.0001
10Glycine0.64640.0015
11Histidine0.67200.0001
12Lipid, CH3-(CH2)n-(LDL)0.67180.0004
13VLDL, -CH2-CH2-C=O0.7018<0.0001
14Lipid, -CH2-C=O0.7270<0.0001
15Lipid, =CH-CH2-CH=0.66440.0005
16Lipid, -CH=CH-0.58730.0005
17Lysine0.7403<0.0001
18N-acetyl-glycoprotein0.57380.0034
19O-acetyl-glycoprotein0.8071<0.0001
20Phenylalanine0.70100.0001
21Pyruvate0.7923<0.0001
22Valine0.59150.0025
23α-Glucose0.7466<0.0001
24β-Glucose0.7968<0.0001
a r: correlation coefficient; b Trend: change trend compared with normal group. (↑): upregulated.
Table 5. The main pathways affected between VED and normal groups.
Main PathwayTotal aHits bRaw p cHolm p d−ln(p) eImpact f
Nitrogen metabolism94<0.001<0.00113.750
Aminoacyl-tRNA biosynthesis647<0.001<0.00113.400
Alanine, aspartate, and glutamate metabolism234<0.0010.0059.580.40
D-Glutamine and D-glutamate metabolism520.0010.0836.841.00
Valine, leucine, and isoleucine biosynthesis1120.0060.4295.180.33
Glyoxylate and dicarboxylate metabolism1620.0120.8964.430.41
Citrate cycle2020.01813.990.13
Pyruvate metabolism2220.02213.810.24
Glycolysis or gluconeogenesis2620.03013.490.13
Phenylalanine, tyrosine, and tryptophan biosynthesis410.04313.160.50
Glycine, serine, and threonine metabolism3220.04513.110.29
a Total: the total number of compounds in the pathway; b Hits: the corresponding number of metabolites in one pathway; c Raw p: the original p value measured by the enrichment testing; d Holm p: the p-value modified utilizing Holm-Bonferroni approach; e −ln(p): the negative logarithm base e of the p-value; f Impact: the pathway influence value calculated from pathway topology analysis.
Disclaimer/Publisher’s Note: The statements, opinions and data contained in all publications are solely those of the individual author(s) and contributor(s) and not of MDPI and/or the editor(s). MDPI and/or the editor(s) disclaim responsibility for any injury to people or property resulting from any ideas, methods, instructions or products referred to in the content.

