
Development of a Web App to Convert Blood Insulin Concentrations among Various Immunoassays Used in Horses
 , ,
, ,
Abstract
:Simple Summary
Abstract
1. Introduction
2. Materials and Methods
2.1. Assay Comparison Data
2.2. Estimation of Conversion Formulae
2.3. Integration into a Web App
3. Results
3.1. Available Assays and Data Sources
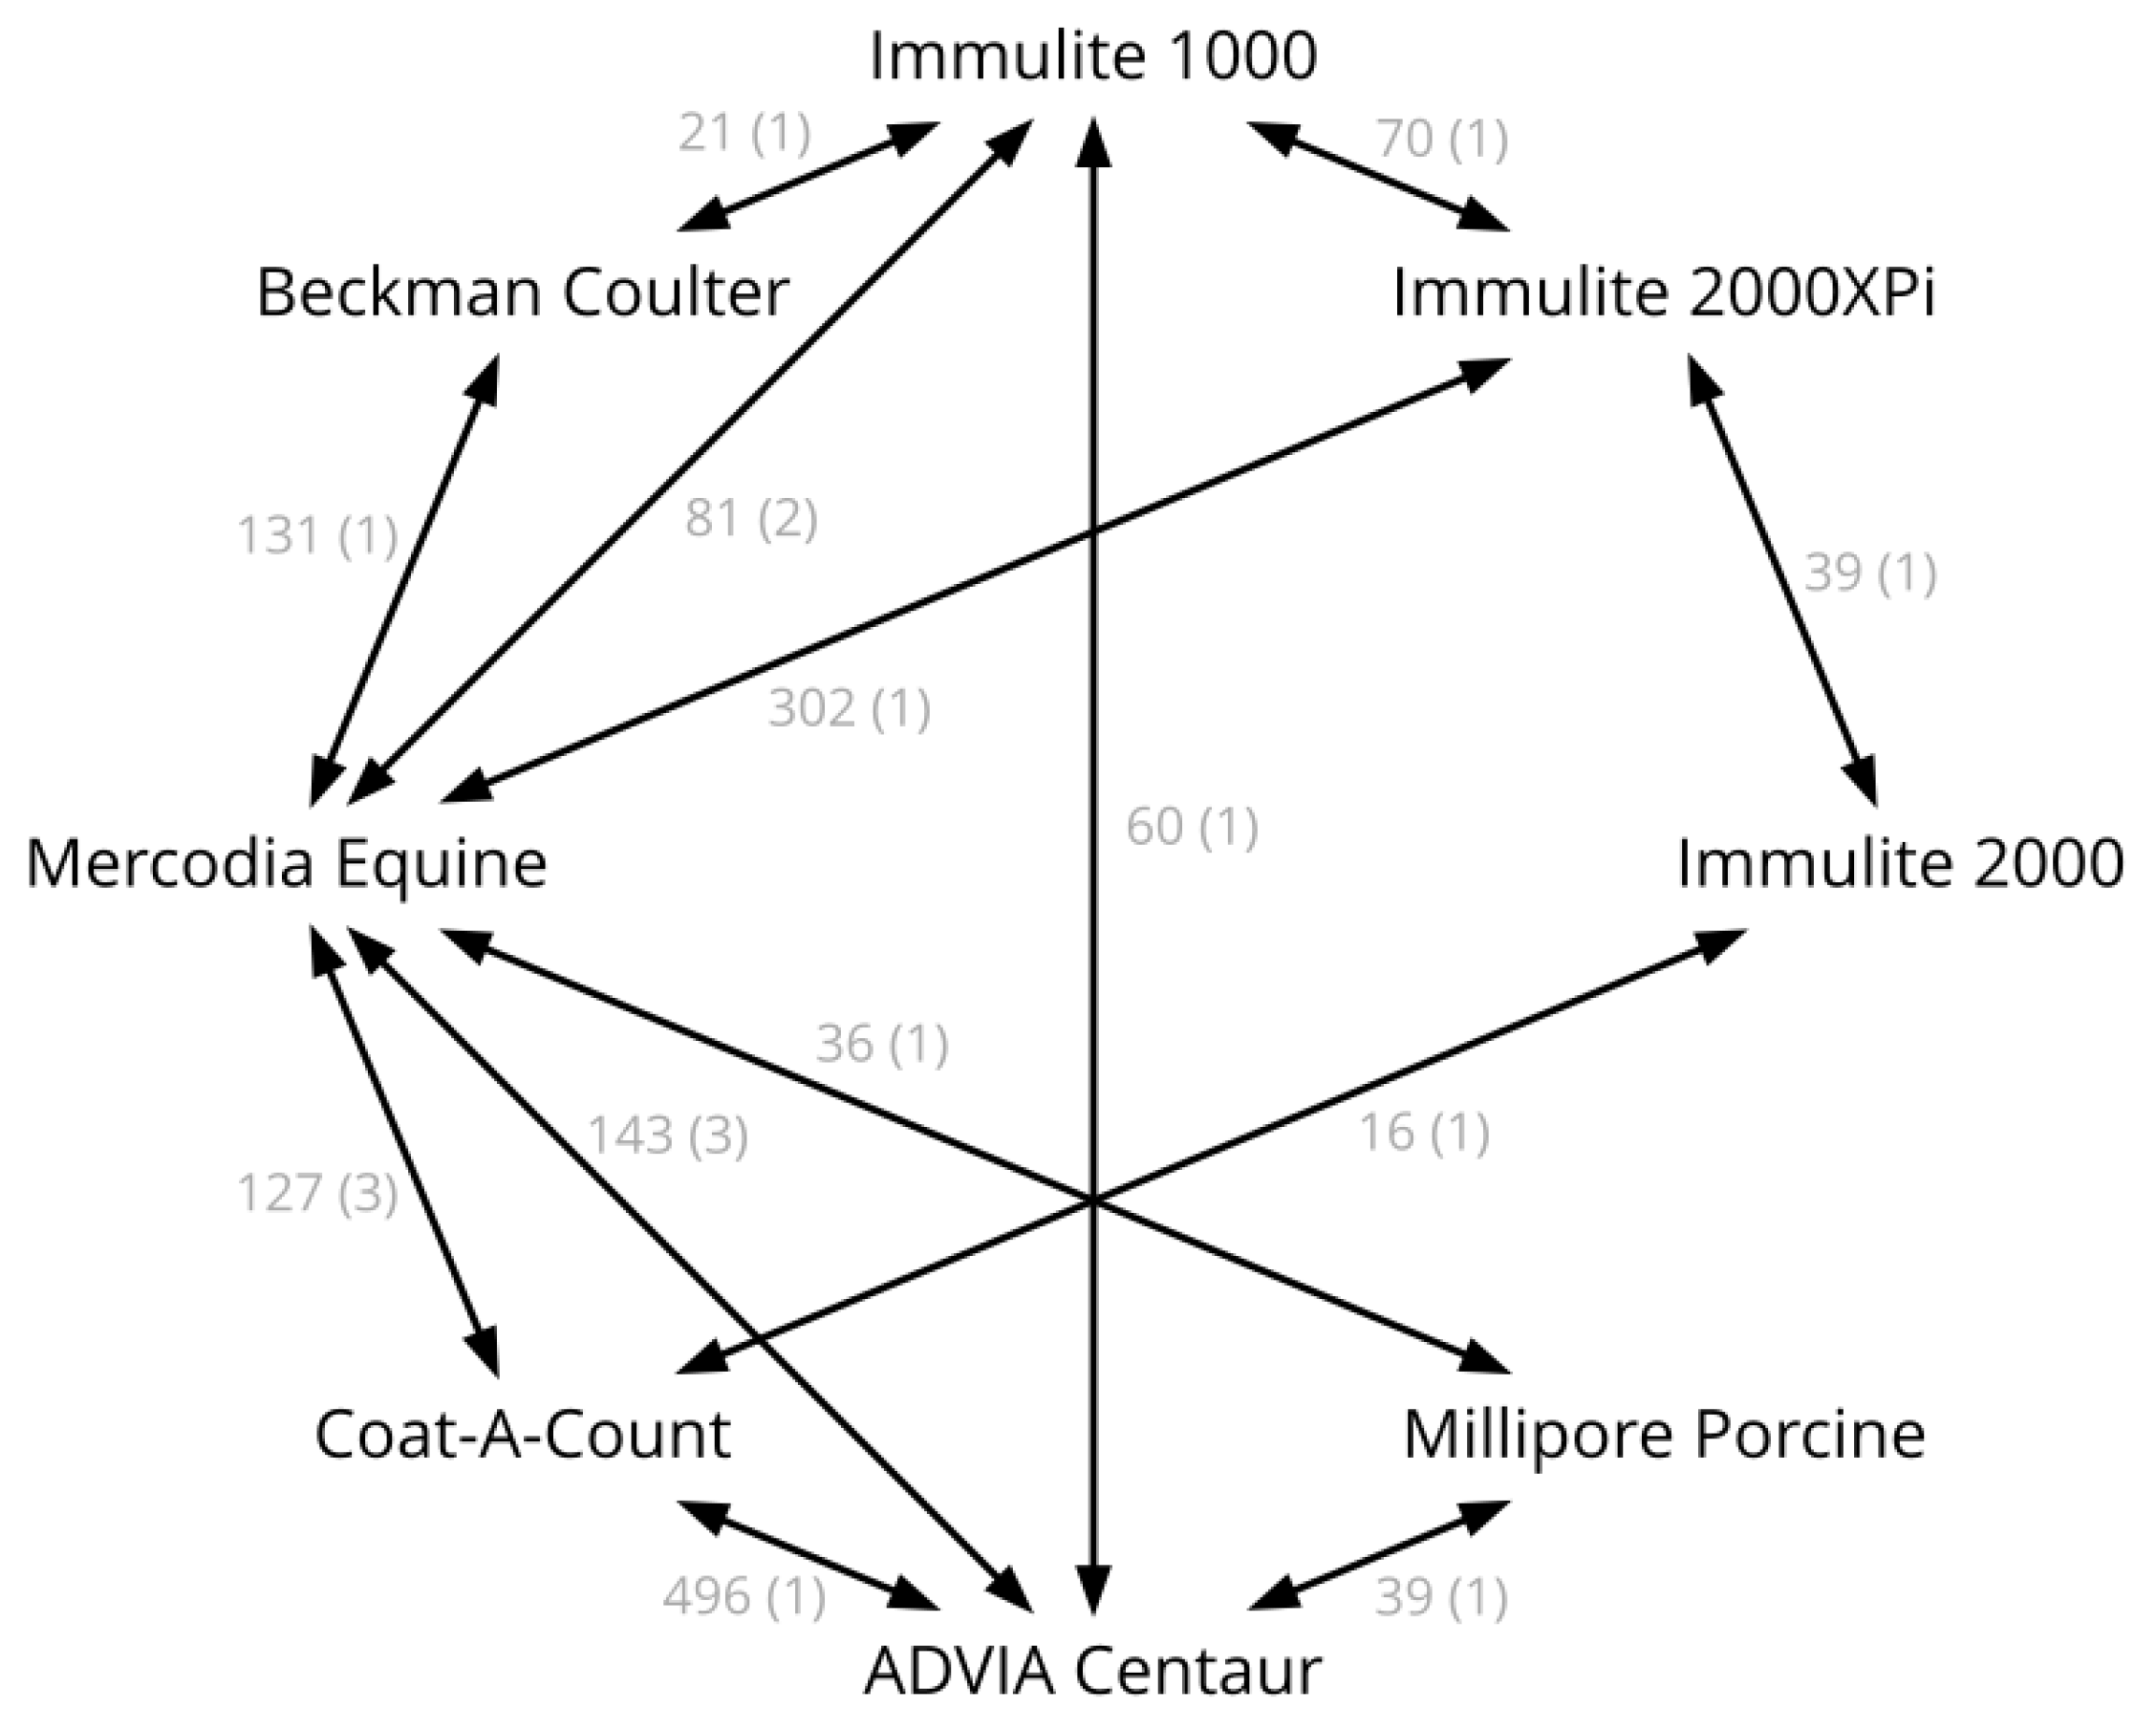
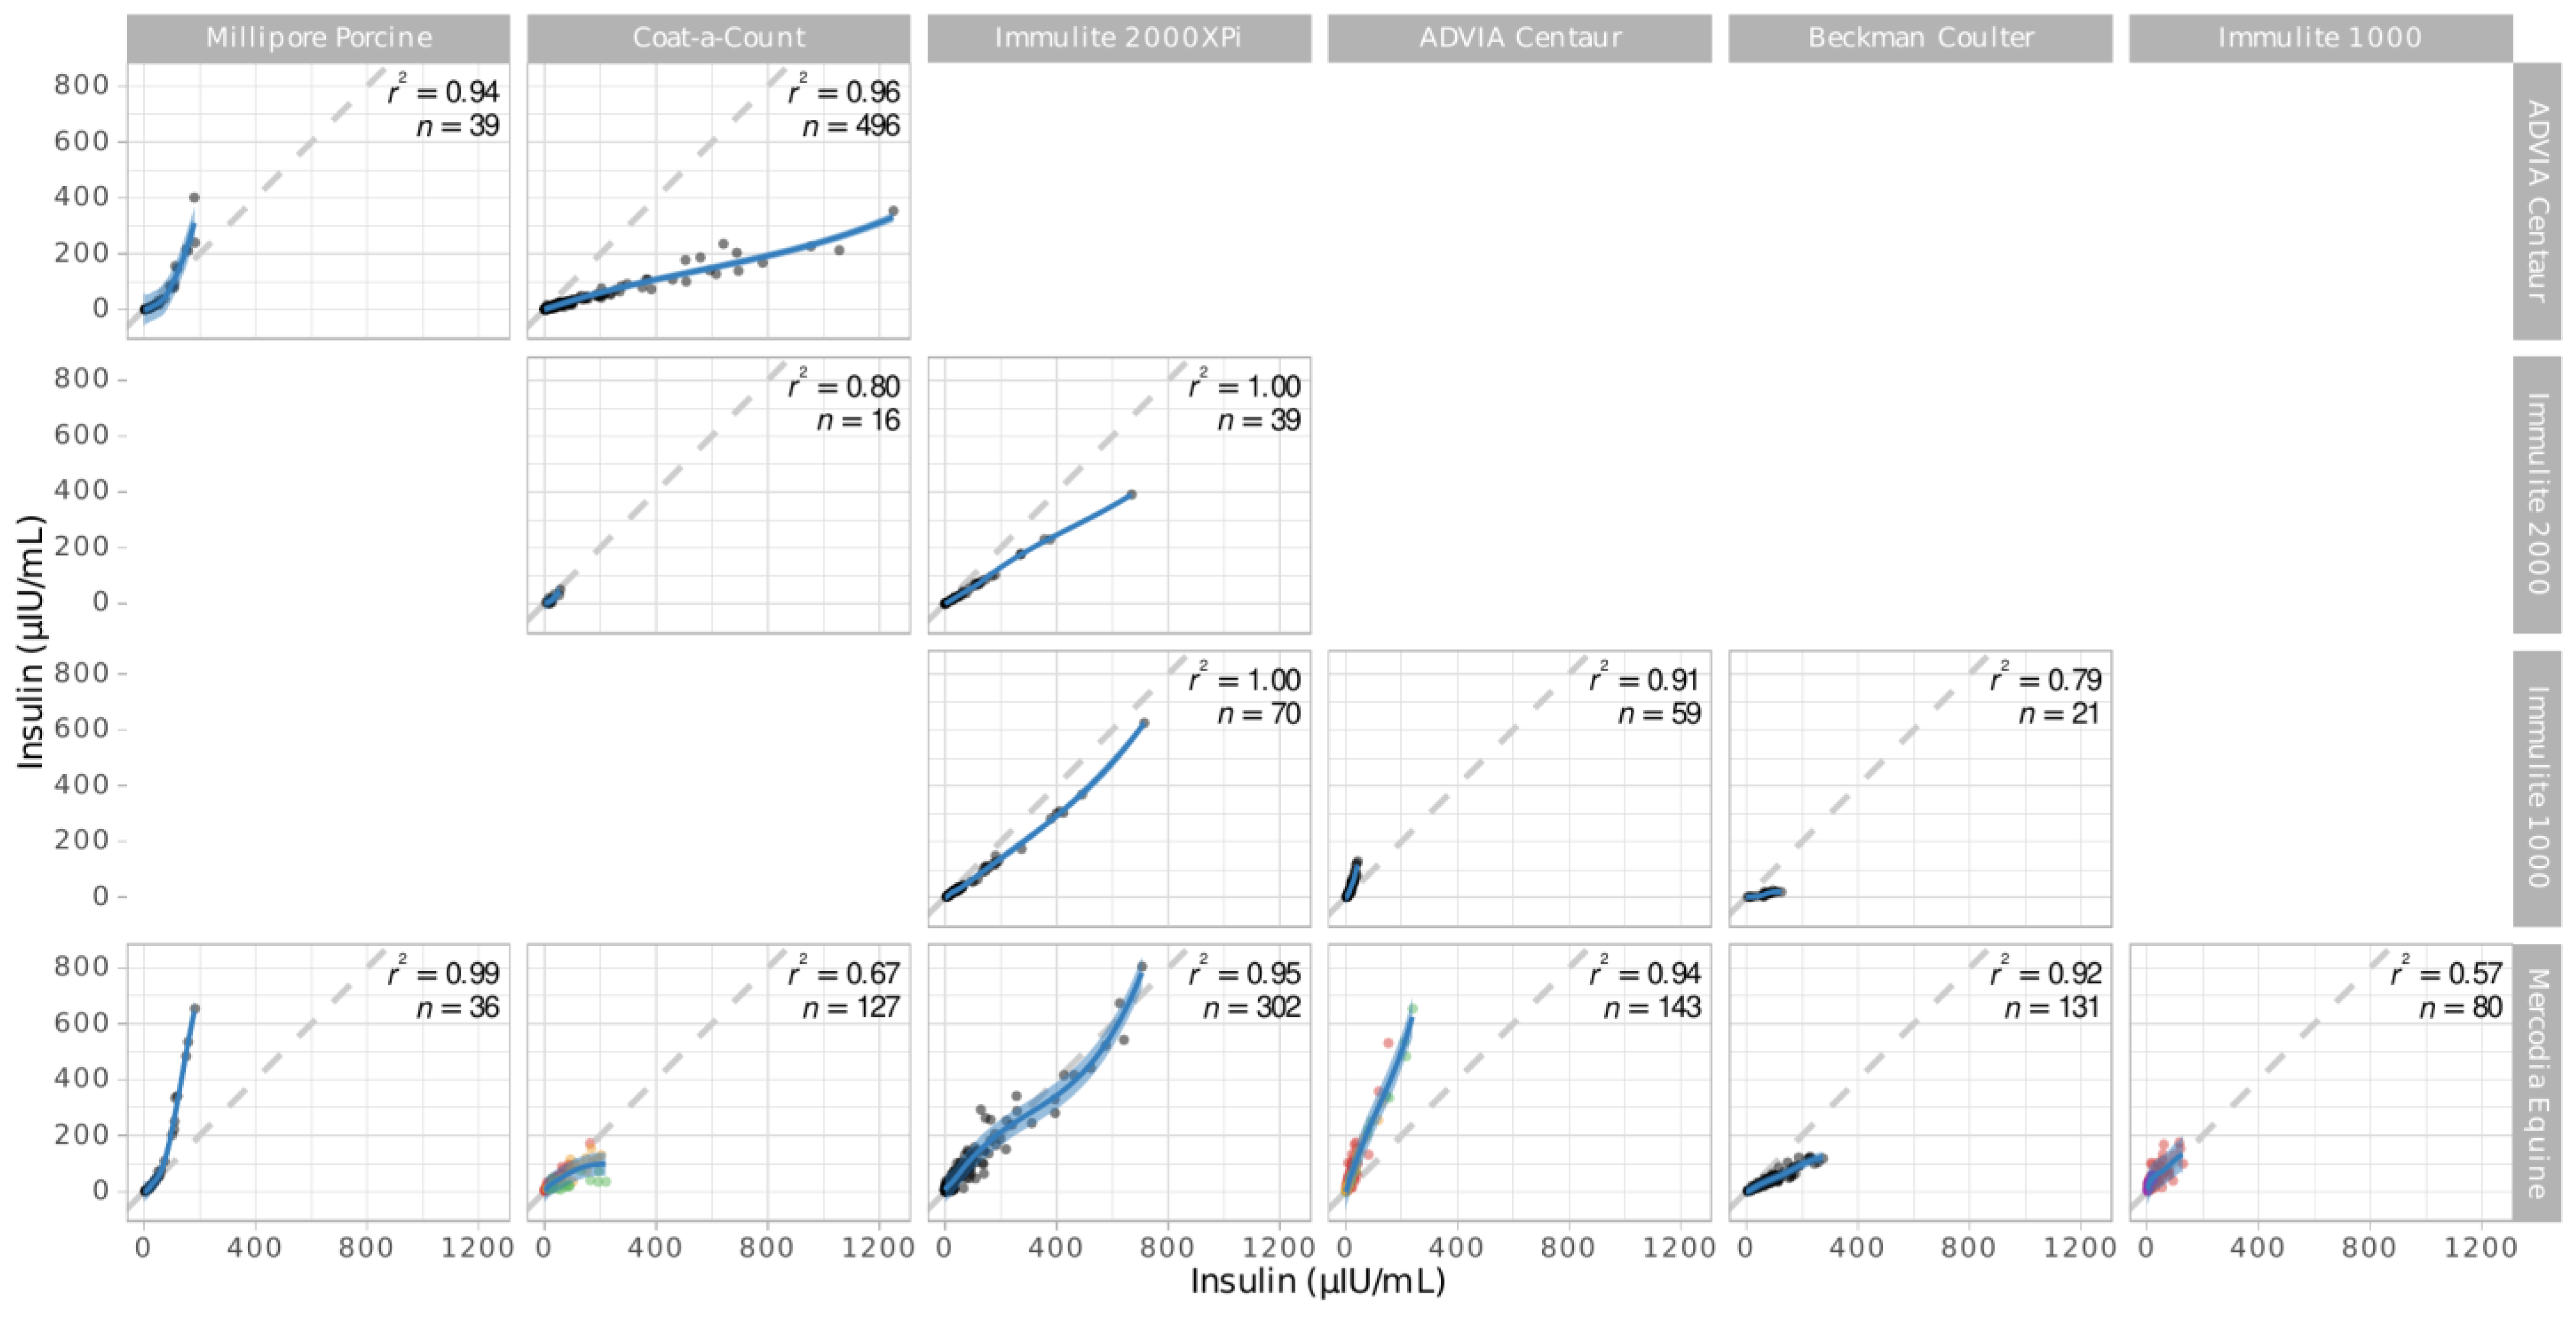
3.2. Assay Pairs
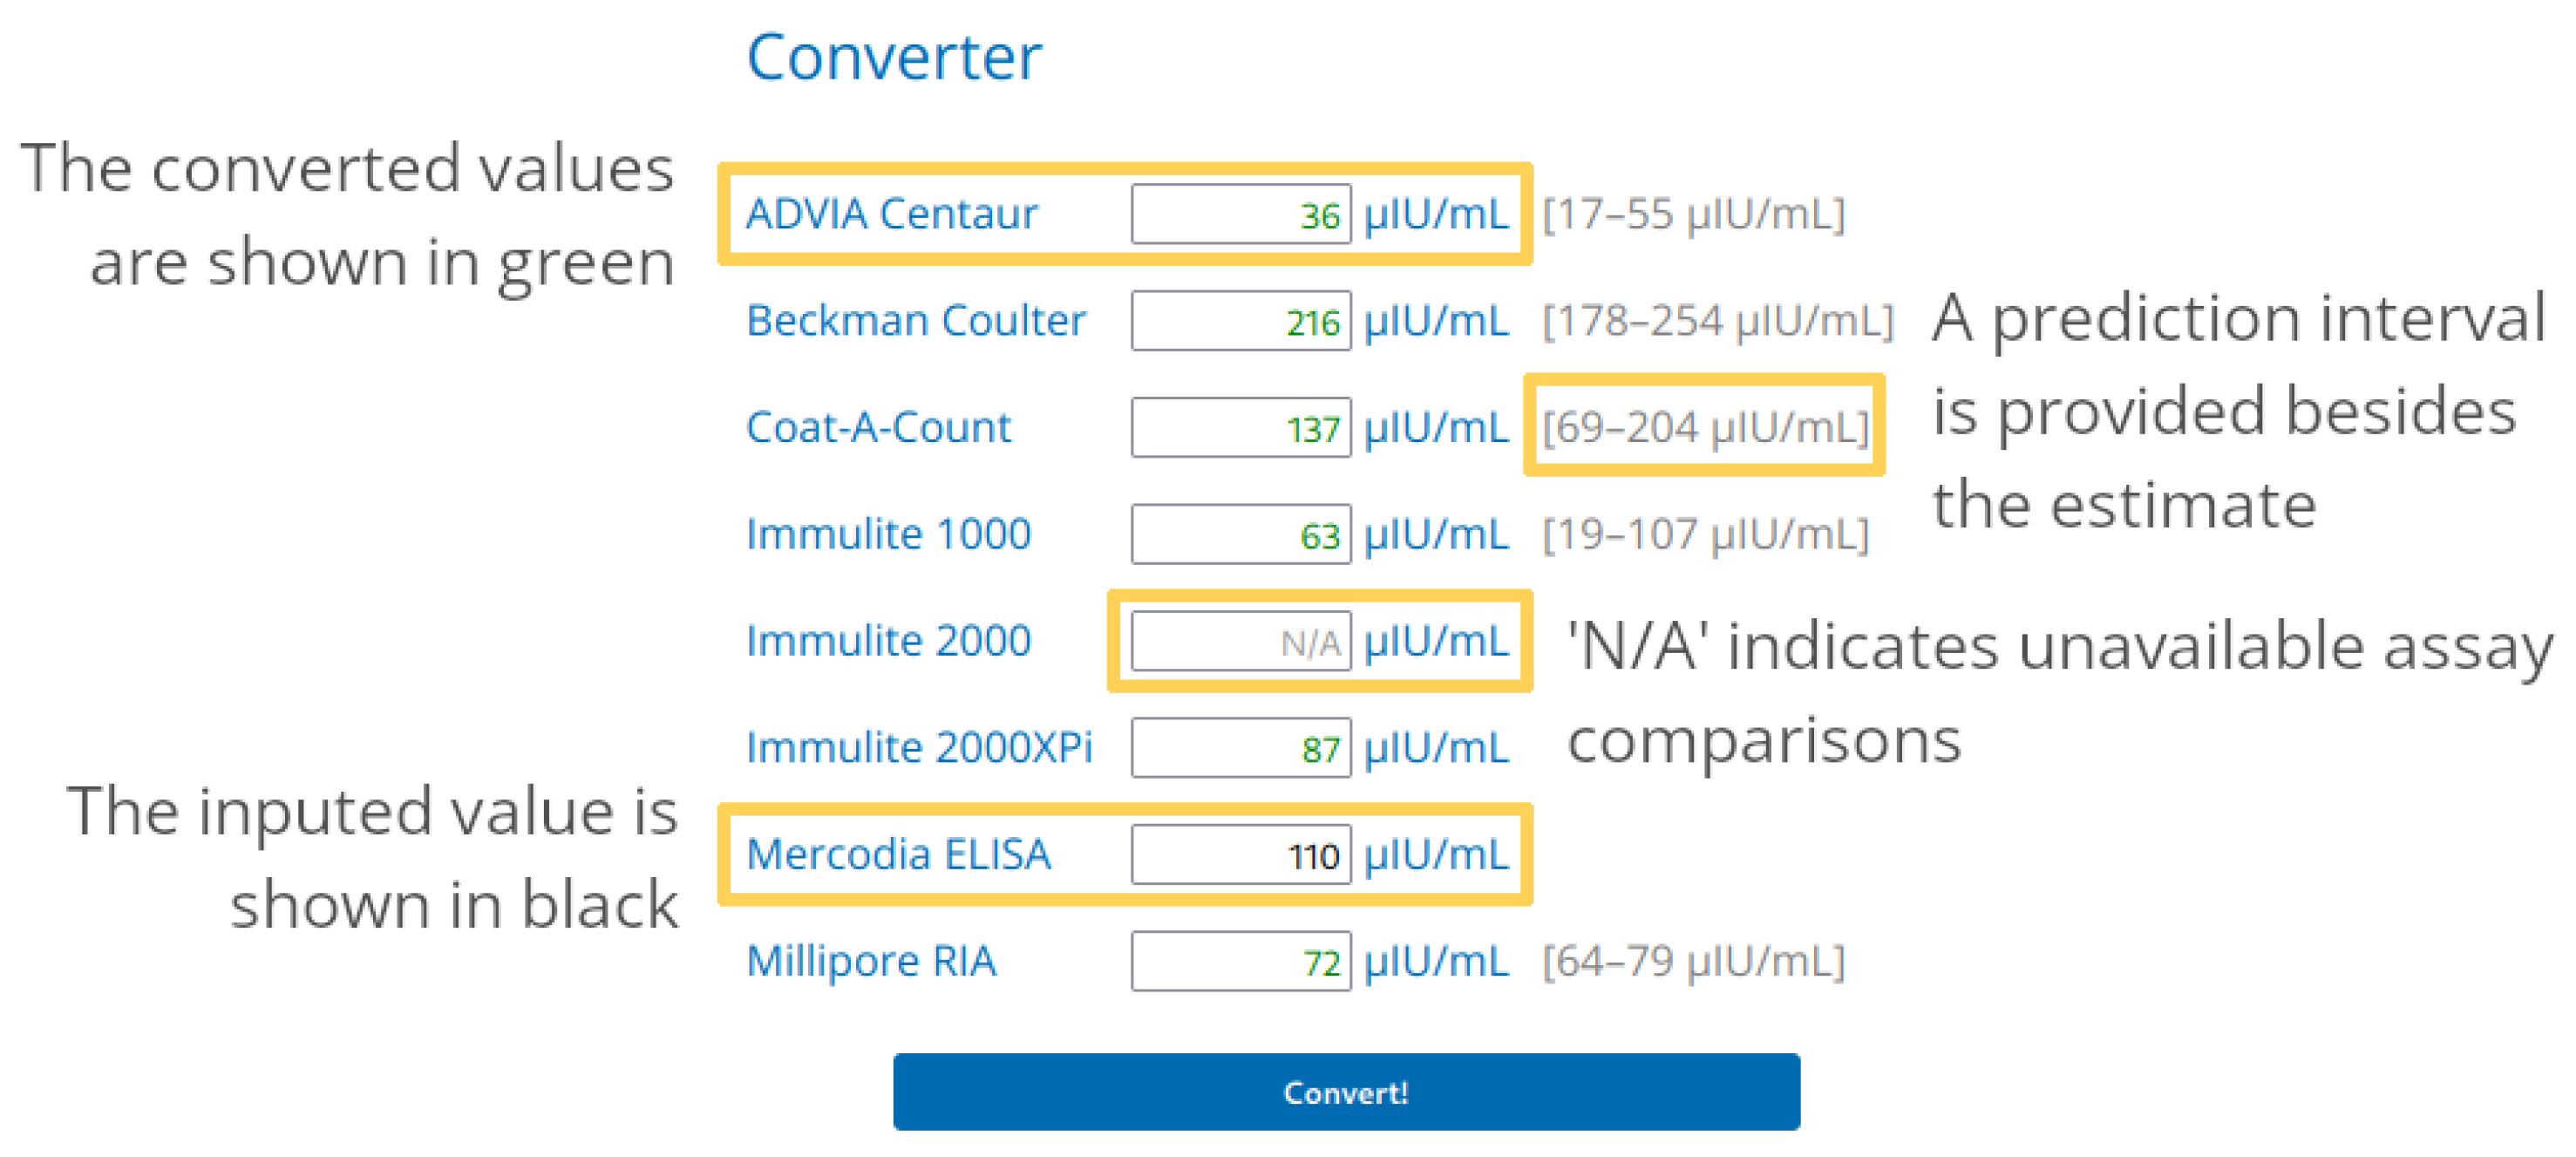
3.3. Web App Usage
3.4. Example: Comparison of Published Cut-Offs
4. Discussion
4.1. Use and Limitations of the App
4.2. Comparison of Cut-Off Values
5. Conclusions
Author Contributions
Funding
Institutional Review Board Statement
Informed Consent Statement
Data Availability Statement
Conflicts of Interest
References
- Frank, N.; Tadros, E.M. Insulin Dysregulation. Equine Vet. J. 2014, 46, 103–112. [Google Scholar] [CrossRef] [PubMed]
- Asplin, K.E.; Sillence, M.N.; Pollitt, C.C.; McGowan, C.M. Induction of Laminitis by Prolonged Hyperinsulinaemia in Clinically Normal Ponies. Vet. J. 2007, 174, 530–535. [Google Scholar] [CrossRef]
- Bailey, S.R.; Habershon-Butcher, J.L.; Ransom, K.J.; Elliott, J.; Menzies-Gow, N.J. Hypertension and Insulin Resistance in a Mixed-Breed Population of Ponies Predisposed to Laminitis. Am. J. Vet. Res. 2008, 69, 122–129. [Google Scholar] [CrossRef] [PubMed]
- Luthersson, N.; Mannfalk, M.; Parkin, T.D.H.; Harris, P. Laminitis: Risk Factors and Outcome in a Group of Danish Horses. J. Equine Vet. Sci. 2017, 53, 68–73. [Google Scholar] [CrossRef]
- Karikoski, N.P.; Horn, I.; McGowan, T.W.; McGowan, C.M. The Prevalence of Endocrinopathic Laminitis among Horses Presented for Laminitis at a First-Opinion/Referral Equine Hospital. Domest. Anim. Endocrinol. 2011, 41, 111–117. [Google Scholar] [CrossRef] [PubMed]
- Durham, A.E.; Frank, N.; McGowan, C.M.; Menzies-Gow, N.J.; Roelfsema, E.; Vervuert, I.; Feige, K.; Fey, K. ECEIM Consensus Statement on Equine Metabolic Syndrome. J. Vet. Intern. Med. 2019, 33, 335–349. [Google Scholar] [CrossRef] [PubMed]
- Bertin, F.R.; de Laat, M.A. The Diagnosis of Equine Insulin Dysregulation. Equine Vet. J. 2017, 49, 570–576. [Google Scholar] [CrossRef] [PubMed]
- Lindåse, S.; Nostell, K.; Askerfelt, I.; Bröjer, J. A Modified Oral Sugar Test for Evaluation of Insulin and Glucose Dynamics in Horses. Acta Vet. Scand. 2015, 57, 55–63. [Google Scholar] [CrossRef]
- Smith, S.; Harris, P.A.; Menzies-Gow, N.J. Comparison of the In-Feed Glucose Test and the Oral Sugar Test. Equine Vet. J. 2016, 48, 224–227. [Google Scholar] [CrossRef]
- Dunbar, L.K.; Mielnicki, K.A.; Dembek, K.A.; Toribio, R.E.; Burns, T.A. Evaluation of Four Diagnostic Tests for Insulin Dysregulation in Adult Light-Breed Horses. J. Vet. Intern. Med. 2016, 30, 885–891. [Google Scholar] [CrossRef]
- Jocelyn, N.A.; Harris, P.A.; Menzies-Gow, N.J. Effect of Varying the Dose of Corn Syrup on the Insulin and Glucose Response to the Oral Sugar Test. Equine Vet. J. 2018, 50, 836–841. [Google Scholar] [CrossRef] [PubMed]
- Warnken, T.; Delarocque, J.; Schumacher, S.; Huber, K.; Feige, K. Retrospective Analysis of Insulin Responses to Standard Dosed Oral Glucose Tests (OGTs) via Naso-Gastric Tubing towards Definition of an Objective Cut-off Value. Acta Vet. Scand. 2018, 60, 4. [Google Scholar] [CrossRef] [PubMed]
- Van Den Wollenberg, L.; Vandendriessche, V.; van Maanen, K.; Counotte, G.H.M. Comparison of Two Diagnostic Methods to Detect Insulin Dysregulation in Horses Under Field Conditions. J. Equine Vet. Sci. 2020, 88, 102954. [Google Scholar] [CrossRef] [PubMed]
- Frank, N.; Bailey, S.; Bertin, F.-R.; Burns, T.; de Laat, M.; Durham, A.; Kritchevsky, J.; Menzies-Gow, N. Recommendations for the Diagnosis and Treatment of Equine Metabolic Syndrome (EMS). Equine Endocrinol. Group 2022. Available online: https://sites.tufts.edu/equineendogroup/files/2022/10/EMS-EEG-Recommendations-2022.pdf (accessed on 14 December 2022).
- Öberg, J.; Bröjer, J.; Wattle, O.; Lilliehöök, I. Evaluation of an Equine-Optimized Enzyme-Linked Immunosorbent Assay for Serum Insulin Measurement and Stability Study of Equine Serum Insulin. Comp. Clin. Path 2011, 21, 1291–1300. [Google Scholar] [CrossRef]
- Tinworth, K.D.; Wynn, P.C.; Boston, R.C.; Harris, P.A.; Sillence, M.N.; Thevis, M.; Thomas, A.; Noble, G.K. Evaluation of Commercially Available Assays for the Measurement of Equine Insulin. Domest. Anim. Endocrinol. 2011, 41, 81–90. [Google Scholar] [CrossRef]
- Borer-Weir, K.E.; Bailey, S.R.; Menzies-Gow, N.J.; Harris, P.A.; Elliott, J. Evaluation of a Commercially Available Radioimmunoassay and Species-Specific ELISAs for Measurement of High Concentrations of Insulin in Equine Serum. Am. J. Vet. Res. 2012, 73, 1596–1602. [Google Scholar] [CrossRef]
- Banse, H.E.; McCann, J.; Yang, F.; Wagg, C.; McFarlane, D. Comparison of Two Methods for Measurement of Equine Insulin. J. Vet. Diagn. Investig. 2014, 26, 527–530. [Google Scholar] [CrossRef]
- Warnken, T.; Huber, K.; Feige, K. Comparison of Three Different Methods for the Quantification of Equine Insulin. BMC Vet. Res. 2016, 12, 196. [Google Scholar] [CrossRef]
- Carslake, H.B.; Pinchbeck, G.L.; McGowan, C.M. Evaluation of a Chemiluminescent Immunoassay for Measurement of Equine Insulin. J. Vet. Intern. Med. 2017, 31, 568–574. [Google Scholar] [CrossRef]
- Ho, E.N.M.; Wan, T.S.M.; Wong, A.S.Y.; Lam, K.K.H.; Stewart, B.D. Doping Control Analysis of Insulin and Its Analogues in Equine Plasma by Liquid Chromatography—Tandem Mass Spectrometry. J. Chromatogr. A 2008, 1201, 183–190. [Google Scholar] [CrossRef]
- National Institute for Biological Standards and Control (NIBSC) NIBSC—Products—Insulin. Available online: https://www.nibsc.org/products/brm_product_catalogue/sub_category_listing.aspx?search=insulin (accessed on 1 May 2023).
- Robbins, D.C.; Andersen, L.; Bowsher, R.; Chance, R.; Dinesen, B.; Frank, B.; Gingerich, R.; Goldstein, D.; Widemeyer, H.-M.; Haffner, S.; et al. Report of the American Diabetes Association’s Task Force on Standardization of the Insulin Assay. Diabetes 1996, 45, 242–256. [Google Scholar] [CrossRef] [PubMed]
- Staten, M.A.; Stern, M.P.; Miller, W.G.; Steffes, M.W.; Campbell, S.E. Insulin Assay Standardization. Diabetes Care 2010, 33, 205–206. [Google Scholar] [CrossRef] [PubMed]
- Hörber, S.; Achenbach, P.; Schleicher, E.; Peter, A. Harmonization of Immunoassays for Biomarkers in Diabetes Mellitus. Biotechnol. Adv. 2020, 39, 107359. [Google Scholar] [CrossRef] [PubMed]
- Carslake, H.B.; Pinchbeck, G.L.; McGowan, C.M. Equine Metabolic Syndrome in UK Native Ponies and Cobs Is Highly Prevalent with Modifiable Risk Factors. Equine Vet. J. 2021, 53, 923–934. [Google Scholar] [CrossRef]
- R Core Team. R: A Language and Environment for Statistical Computing; R Core Team: Vienna, Austria, 2023. [Google Scholar]
- Mullen, K.M.; van Stokkum, I.H.M. Nnls: The Lawson-Hanson Algorithm for Non-Negative Least Squares (NNLS) 2012. Available online: https://cran.r-project.org/web/packages/nnls/nnls.pdf (accessed on 1 May 2023).
- Wang, W.; Yan, J. Shape-Restricted Regression Splines with R Package. J. Data Sci. 2021, 19, 498–517. [Google Scholar] [CrossRef]
- ECMA International. ECMA-262–ECMAScript® 2022 Language Specification 2022. Available online: https://262.ecma-international.org/13.0/index.html (accessed on 28 January 2023).
- World Wide Web Consortium HTML 5.3 2023. Available online: https://html.spec.whatwg.org/ (accessed on 28 January 2023).
- World Wide Web Consortium CSS Snapshot 2023. Available online: https://www.w3.org/TR/css-2023/ (accessed on 28 January 2023).
- The Apache Software Foundation. Apache License, Version 2.0; The Apache Software Foundation: Wilmington, DE, USA, 2004.
- de Laat, M.A.; Warnken, T.; Delarocque, J.; Reiche, D.B.; Grob, A.J.; Feige, K.; Carslake, H.B.; Durham, A.E.; Sillence, M.N.; Thane, K.E.; et al. Carbohydrate Pellets to Assess Insulin Dysregulation in Horses. J. Vet. Intern. Med. 2022, 37, 302–314. [Google Scholar] [CrossRef]
- Lindåse, S.; Nostell, K.; Bergsten, P.; Forslund, A.; Bröjer, J. Evaluation of Fasting Plasma Insulin and Proxy Measurements to Assess Insulin Sensitivity in Horses. BMC Vet. Res. 2021, 17, 78. [Google Scholar] [CrossRef]
- Olley, R.B.; Carslake, H.B.; Ireland, J.L.; McGowan, C.M. Comparison of Fasted Basal Insulin with the Combined Glucose-Insulin Test in Horses and Ponies with Suspected Insulin Dysregulation. Vet. J. 2019, 252, 105351. [Google Scholar] [CrossRef]
- Menzies-Gow, N.J.; Harris, P.A.; Elliott, J. Prospective Cohort Study Evaluating Risk Factors for the Development of Pasture-Associated Laminitis in the United Kingdom. Equine Vet. J. 2017, 49, 300–306. [Google Scholar] [CrossRef]
- Meier, A.D.; de Laat, M.A.; Reiche, D.B.; Pollitt, C.C.; Walsh, D.M.; McGree, J.M.; Sillence, M.N. The Oral Glucose Test Predicts Laminitis Risk in Ponies Fed a Diet High in Nonstructural Carbohydrates. Domest. Anim. Endocrinol. 2018, 63, 1–9. [Google Scholar] [CrossRef]
- Carter, R.A.; Treiber, K.H.; Geor, R.J.; Douglass, L.; Harris, P.A. Prediction of Incipient Pasture-Associated Laminitis from Hyperinsulinaemia, Hyperleptinaemia and Generalised and Localised Obesity in a Cohort of Ponies. Equine Vet. J. 2009, 41, 171–178. [Google Scholar] [CrossRef] [PubMed]
- Equine Endocrinology Group; Frank, N.; Bailey, S.R.; Bertin, F.R.; de Laat, M.A.; Durham, A.E.; Kritchevsky, J.; Menzies-Gow, N. Recommendations for the Diagnosis and Treatment of Equine Metabolic Syndrome (EMS). Equine Endocrinol. Group 2020. Available online: https://web.archive.org/web/20201024032654/https://sites.tufts.edu/equineendogroup/files/2020/09/200592_EMS_Recommendations_Bro-FINAL.pdf (accessed on 14 December 2022).
- Köller, G.; Bassewitz, K.; Schusser, G.F. Referenzbereiche von Insulin, Insulinähnlichem Wachstumsfaktor 1 (IGF-1) Und Adrenokortikotropem Hormon Bei Ponys. Tierarztl. Prax. Ausg. G Grosstiere—Nutztiere 2016, 44, 19–25. [Google Scholar] [CrossRef] [PubMed]
- Fitzgerald, D.M.; Walsh, D.M.; Sillence, M.N.; Pollitt, C.C.; de Laat, M.A. Insulin and Incretin Responses to Grazing in Insulin-Dysregulated and Healthy Ponies. J. Vet. Intern. Med. 2018, 33, 225–232. [Google Scholar] [CrossRef] [PubMed]
- Hart, K.A.; Wochele, D.M.; Norton, N.A.; Mcfarlane, D.; Wooldridge, A.A.; Frank, N. Effect of Age, Season, Body Condition, and Endocrine Status on Serum Free Cortisol Fraction and Insulin Concentration in Horses. J. Vet. Intern. Med. 2016, 30, 653–663. [Google Scholar] [CrossRef] [PubMed]
- Rapson, J.L.; Schott, H.C.; Nielsen, B.D.; McCutcheon, L.J.; Harris, P.A.; Geor, R.J. Effects of Age and Diet on Glucose and Insulin Dynamics in the Horse. Equine Vet. J. 2018, 50, 690–696. [Google Scholar] [CrossRef]
- Morgan, R.A.; McGowan, T.W.; Mcgowan, C.M. Prevalence and Risk Factors for Hyperinsulinaemia in Ponies in Queensland, Australia. Aust. Vet. J. 2014, 92, 101–106. [Google Scholar] [CrossRef]
- Nielsen, B.D.; O’Connor-Robison, C.I.; Spooner, H.S.; Shelton, J. Glycemic and Insulinemic Responses Are Affected by Age of Horse and Method of Feed Processing. J. Equine Vet. Sci. 2010, 30, 249–258. [Google Scholar] [CrossRef]
- Borer, K.E.; Bailey, S.R.; Menzies-Gow, N.J.; Harris, P.A.; Elliott, J. Effect of Feeding Glucose, Fructose, and Inulin on Blood Glucose and Insulin Concentrations in Normal Ponies and Those Predisposed to Laminitis. J. Anim. Sci. 2012, 90, 3003–3013. [Google Scholar] [CrossRef]
- Pratt-Phillips, S.; Kutzner-Mulligan, J.; Marvin, R.; Brown, H.; Sykes, C.; Federico, J. The Effect of Feeding Two or Three Meals Per Day of Either Low or High Nonstructural Carbohydrate Concentrates on Postprandial Glucose and Insulin Concentrations in Horses. J. Equine Vet. Sci. 2014, 34, 1251–1256. [Google Scholar] [CrossRef]
- Bamford, N.J.; Baskerville, C.L.; Harris, P.A.; Bailey, S.R. Postprandial Glucose, Insulin, and Glucagon-like Peptide-1 Responses of Different Equine Breeds Adapted to Meals Containing Micronized Maize. J. Anim. Sci. 2015, 93, 3377–3383. [Google Scholar] [CrossRef]
- Youden, W.J. Index for Rating Diagnostic Tests. Cancer 1950, 3, 32–35. [Google Scholar] [CrossRef] [PubMed]
- Knowles, E.J.; Elliott, J.; Harris, P.A.; Chang, Y.; Menzies-Gow, N.J. Predictors of Laminitis Development in a Cohort of Nonlaminitic Ponies. Equine Vet. J. 2023, 55, 12–23. [Google Scholar] [CrossRef] [PubMed]


| Assay Name | Assay Family | |
|---|---|---|
| A | ADVIA Centaur Insulin Assay, Siemens Healthcare | CLIA |
| B | Coat-A-Count Insulin, Siemens Healthcare | RIA |
| C | Immulite 1000 Insulin Assay, Siemens Healthcare | CLIA |
| D | Immulite 2000 Insulin Assay, Siemens Healthcare | CLIA |
| E | Immulite 2000XPi Insulin Assay, Siemens Healthcare | CLIA |
| F | Insulin(e) IRMA KIT, Immunotech, Beckman Coulter | RIA |
| G | Equine Insulin ELISA, Mercodia | ELISA |
| H | Porcine Insulin RIA, Merck Millipore | RIA |
| Source | Assays Compared | Number of Samples | Comments |
|---|---|---|---|
| Öberg et al., 2011 [15] | B vs. G | 80 | |
| Tinworth et al., 2011 [16] | B vs. G | 18 | |
| Borer-Weir et al., 2012 [17] | B vs. G | 29 | |
| Warnken et al., 2016 [19] | A vs. G A vs. H G vs. H | 36 39 36 | |
| Carslake et al., 2017 [20] | B vs. D | 16 | |
| Carslake et al., 2021 [26] | D vs. E | 39 | |
| De Laat et al., 2022 [34] | E vs. G | 302 | Raw data kindly provided by Boehringer Ingelheim |
| Durham, unpublished | C vs. E | 70 | Diagnostic samples |
| Fey, unpublished | A vs. B | 496 | Diagnostic samples |
| Warnken and Delarocque, unpublished | C vs. G A vs. G A vs. C | 60 77 60 | Ethics committee file number 33.8-42502-04-17/2646 |
| Warnken, unpublished | C vs. G C vs. F F vs. G | 21 21 131 | Ethics committee file number 3.14-42502-04-13/1259 |
| Warnken, unpublished | A vs. G | 30 | Diagnostic samples |
| Reference | Assay | Feeding | Outcome | CO Metric | CO (µIU/mL) | Conv. CO (µIU/mL) |
|---|---|---|---|---|---|---|
| Lindase et al., 2021 [35] | Mercodia Equine | Fasted | EHC | Youden’s index | 9.5 | 9.5 |
| de Laat et al., 2022 [34] | Mercodia Equine | Fasted | Cluster | Balanced sens. and spec. 1 | 10.4 | 10.4 |
| Olley et al., 2019 [36] | Immulite 1000 or 2000 | Fasted | CGIT | Youden’s index | 5.2 | 22 |
| Menzies-Gow et al., 2017 [37] | Coat-a-Count | Unfasted | Laminitis | Youden’s index | 21.8 | 26 |
| Meier et al., 2018 [38] | ADVIA Centaur | Fasted | High NSC diet laminitis | CART | 8.5 | 28 |
| Carter et al., 2009 [39] | Coat-a-Count | Unfasted (hay) | Pasture associated laminitis | AUC in ROC | 32 | 33 |
| EEG 2020 [40] | Immulite 2000XPi | Unfasted (hay) | 31 | 41 | ||
| EEG 2020 [40] | Immulite 1000 | Unfasted (hay) | 20 | 49 | ||
| Köller et al., 2016 [41] | Immulite 2000 | Unfasted (hay) | Healthy | 95% confidence interval 2 | 21 | 49 |
Disclaimer/Publisher’s Note: The statements, opinions and data contained in all publications are solely those of the individual author(s) and contributor(s) and not of MDPI and/or the editor(s). MDPI and/or the editor(s) disclaim responsibility for any injury to people or property resulting from any ideas, methods, instructions or products referred to in the content. |
© 2023 by the authors. Licensee MDPI, Basel, Switzerland. This article is an open access article distributed under the terms and conditions of the Creative Commons Attribution (CC BY) license (https://creativecommons.org/licenses/by/4.0/).
Share and Cite
Delarocque, J.; Feige, K.; Carslake, H.B.; Durham, A.E.; Fey, K.; Warnken, T. Development of a Web App to Convert Blood Insulin Concentrations among Various Immunoassays Used in Horses. Animals 2023, 13, 2704. https://doi.org/10.3390/ani13172704
Delarocque J, Feige K, Carslake HB, Durham AE, Fey K, Warnken T. Development of a Web App to Convert Blood Insulin Concentrations among Various Immunoassays Used in Horses. Animals. 2023; 13(17):2704. https://doi.org/10.3390/ani13172704
Chicago/Turabian StyleDelarocque, Julien, Karsten Feige, Harry B. Carslake, Andy E. Durham, Kerstin Fey, and Tobias Warnken. 2023. "Development of a Web App to Convert Blood Insulin Concentrations among Various Immunoassays Used in Horses" Animals 13, no. 17: 2704. https://doi.org/10.3390/ani13172704