Article

Time to Step Up Conservation: Climate Change Will Further Reduce the Suitable Habitats for the Vulnerable Species Marbled Polecat (Vormela peregusna)

1
The Station of Forest Seedling Quarantine and Pest Management, Changji 831100, China
2
Locust and Rodent Control Headquarters of Xinjiang Uygur Autonomous Region, Urumqi 830000, China
3
Center for Biological Disaster Prevention and Control, National Forestry and Grassland Administration, Shenyang 110031, China
4
Institute of Ecological Conservation and Restoration, Chinese Academy of Forestry, Beijing 100091, China
*
Author to whom correspondence should be addressed.
Animals 2023, 13(14), 2341; https://doi.org/10.3390/ani13142341
Submission received: 8 June 2023 / Revised: 12 July 2023 / Accepted: 14 July 2023 / Published: 18 July 2023
(This article belongs to the Special Issue Protecting Endangered Species)

Abstract

:

Simple Summary

Assessing suitable habitats for species has great potential to guide the management and conservation of threatened species, especially rare species that are poorly studied and remote from human populations. Vormela peregusna, a mustelid mammal endemic to Eurasia, was assessed as vulnerable by the International Union for Conservation of Nature in 2015 due to its low population size and increasing human threats. We used the ensemble model to assess the distribution of suitable areas for V. peregusna under current and future climate change conditions to contribute to the better protection of endangered animals.

Abstract

Habitat loss and human threats are putting the marbled polecat (Vormela peregusna) on the brink of extinction. Numerous recent studies have found that climate change will further deteriorate the living environment of endangered species, leading to their eventual extinction. In this study, we used the results of infrared camera surveys in China and worldwide distribution data to construct an ensemble model consisting of 10 commonly used ecological niche models to specify potential suitable habitat areas for V. peregusna under current conditions with similar environments to the sighting record sites. Changes in the suitable habitat for V. peregusna under future climate change scenarios were simulated using mid-century (2050s) and the end of the century (2090s) climate scenarios provided by the Coupled Model Intercomparison Project Phase 6 (CMIP6). We evaluated the accuracy of the model to obtain the environmental probability values (cutoff) of the V. peregusna distribution, the current distribution of suitable habitats, and future changes in moderately and highly suitable habitat areas. The results showed that the general linear model (GLM) was the best single model for predicting suitable habitats for V. peregusna, and the kappa coefficient, area under the curve (AUC), and true skill statistic (TSS) of the ensemble model all exceeded 0.9, reflecting greater accuracy and stability than single models. Under the current conditions, the area of suitable habitat for V. peregusna reached 3935.92 × 104 km2, suggesting a wide distribution range. In the future, climate change is predicted to severely affect the distribution of V. peregusna and substantially reduce the area of suitable habitats for the species, with 11.91 to 33.55% of moderately and highly suitable habitat areas no longer suitable for the survival of V. peregusna. This shift poses an extremely serious challenge to the conservation of this species. We suggest that attention be given to this problem in Europe, especially the countries surrounding the Black Sea, Asia, China, and Mongolia, and that measures be taken, such as regular monitoring and designating protected areas for the conservation of vulnerable animals.

1. Introduction

Determining how to protect endangered species is one of the main problems faced in conservation biology [1,2]. The most recent evaluation showed that over 42,100 species are at risk of extinction to varying degrees, a number that amounts to 28% of all species assessed [3]. Habitat loss and fragmentation are among the most important issues currently observed. Understanding habitat suitability and the factors that influence species habitats is the basis for the protection of threatened species [4,5]. In general, the risk of warming due to climate change will exacerbate the loss of species habitat [6]. Additionally, the loss of fauna may be imminent if scientifically sound conservation measures are not developed, especially for animals that are already scarce.
Habitat analysis is an important prerequisite for conservation planning and managerial decision making [7] and is urgently needed to enhance the conservation of endangered species. Species distribution models (SDMs) use environmental variables associated with species distribution sites to predict the ecological needs and potential distribution of species and are widely used in invasion biology, conservation biology, global change biology, and risk of disease transmission [8]. Similar to other ecological models, ecological niche models have uncertainty in their predictions, which are closely related to species distribution sites, environmental variables, and model algorithms and parameters, among which the species distribution sites and model algorithms have the greatest effects [9]. There are more than 30 SDMs available [10], each with different advantages; however, it is difficult to choose the optimal assessment model for species that have rarely been studied [11]. Biomod2 is an ensemble model based on a variety of single models [12] and provides better prediction accuracy and spatial sensitivity to small sample sets than do single models, which are prone to overfitting and uncertainty [13,14,15].
Vormela peregusna is the only small mammal in the genus Vormela of the order Carnivora of the class Mammalia [16]. V. peregusna is valuable for ecosystem stability and medical research. On the one hand, it is a major predator of desert rodents [17] and can effectively protect desert vegetation from rodent damage; on the other hand, V. peregusna is associated with many tick-borne pathogens [18], and research on this species has helped constrain the transmission mechanisms of zoonotic diseases. Unfortunately, despite the value of this species, the risk to the survival of V. peregusna is very concerning. As early as 2008, V. peregusna was included on the Red List of Threatened Species by the International Union for Conservation of Nature (IUCN), and a subsequent reassessment found that the V. peregusna population declined by 30% in a decade [19], reaching a classification of vulnerable. Although China, Bulgaria [20], and other countries have classified V. peregusna as a protected species, thus far, no countries have established targeted conservation measures to save V. peregusna from extinction.
We hypothesize that there is a direct relationship between the species distribution of V. peregusna and its food sources, and since there are no efficient methods to monitor V. peregusna populations at a broad scale, currently, most records come from opportunistic sightings [21]. Observations from southern Europe show that V. peregusna prefers to appear in farmland–grassland interlaced areas with good vegetation conditions [22]. However, this situation is completely different in Asia and the Middle East, with records of occurrences in countries such as Iraq, China, and Mongolia coming from sparsely vegetated hilly and desert areas [23,24]. Another strong piece of evidence is that, in infrared camera monitoring of V. peregusna’s main food Rhombomys opimus, it was found that the activity rhythm of V. peregusna was positively correlated with that of R. opimus [25]. When the activity of R. opimus increased or decreased with seasonal changes, the activity pattern of V. peregusna also changed accordingly. Although the effect of food on the survival of V. peregusna has not yet been clearly determined, it will be of great help to protect V. peregusna if protected areas can be delineated by considering the suitable range and occurrence of rodents.
Habitat loss is the main reason for the endangerment of V. peregusna. In Europe, the conversion of much grassland to cropland has reduced the suitable habitat for V. peregusna, while in Asia, land desertification is the main threat to V. peregusna [26]. Several past studies have found that climate change will have a dramatic impact on the stability of desert and grassland ecosystems [27,28]. Studies from Central Asian grasslands have shown that changes in precipitation are the main factor causing changes in grassland vegetation [29], and studies on the survival of desert fauna have also shown a significant decline in desert bird populations over the past century due to temperature and precipitation [30]. It is also important to address whether the habitat of V. peregusna, as a desert and grassland habitat species, will be affected by climate change.
In this study, we collected monitoring data obtained with infrared cameras in the desert areas of northwest China and reports of V. peregusna distribution worldwide to improve the accuracy of model-based distribution predictions. Ten single models were established based on Biomod2, and the ability of different models to predict suitable habitat areas for V. peregusna was compared. An ensemble model was used to predict the distribution of V. peregusna and changes in suitable habitat areas in current and future situations. Specifically, our aims were to (a) provide new strategies for conducting suitable habitat studies of species with small populations, (b) enhance the conservation of vulnerable animals, and (c) recommend conservation priority areas for effective conservation in the future.

2. Materials and Methods

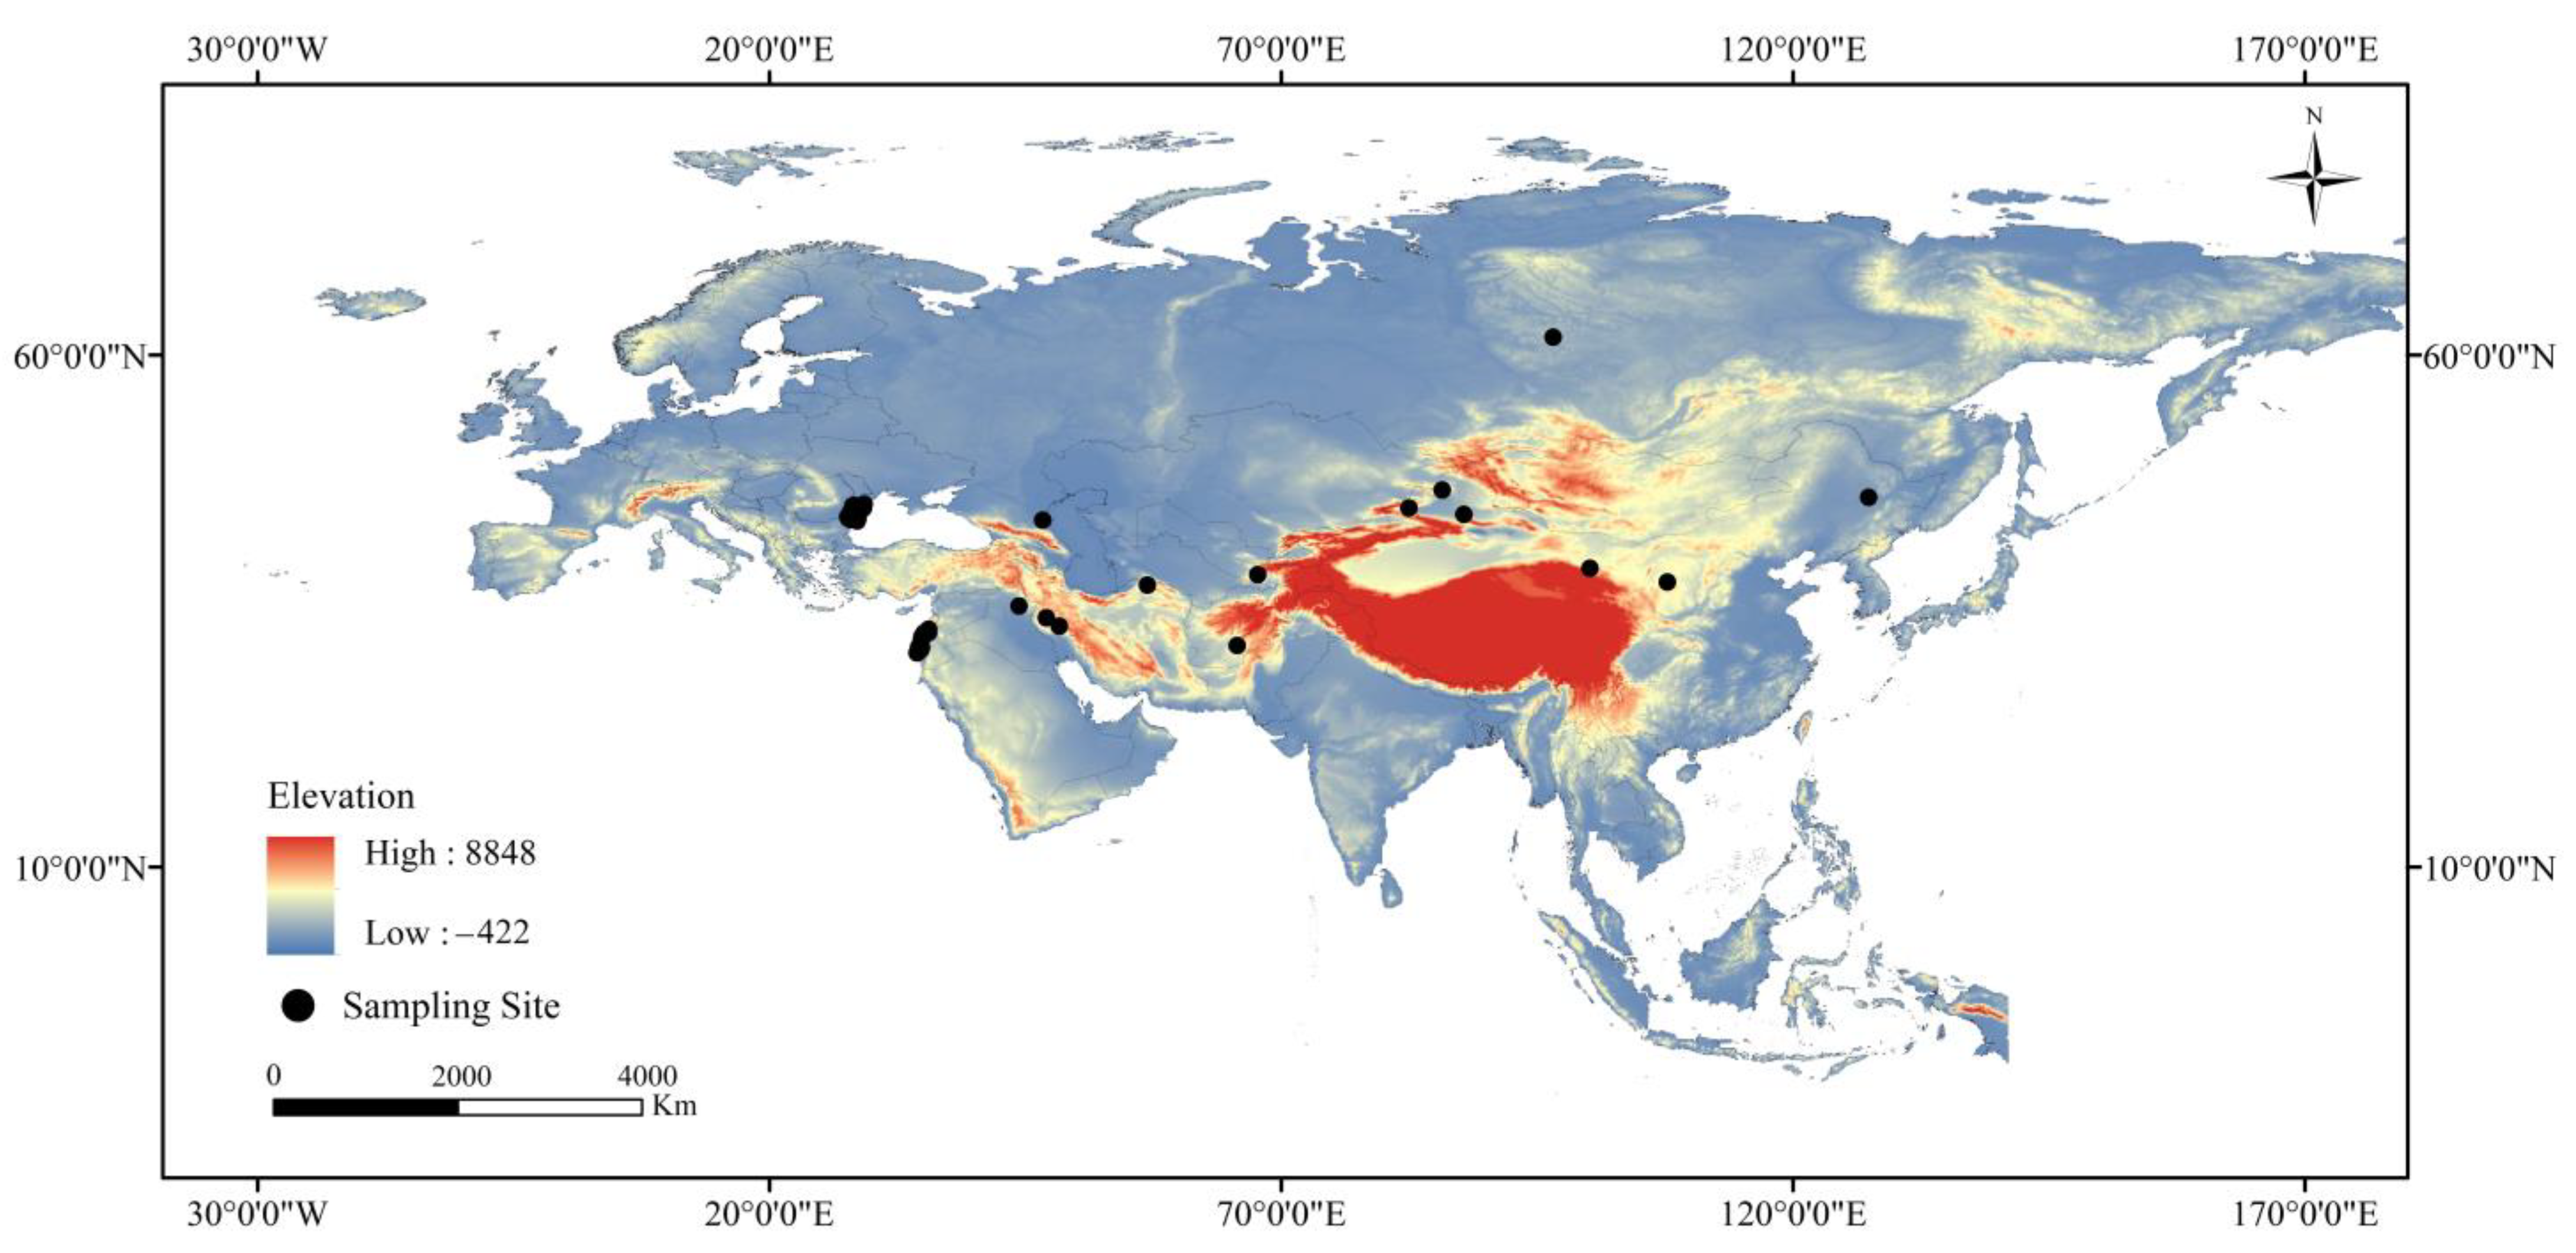
2.1. Occurrence Data

In previous studies, we used infrared cameras to monitor rodent pests in desert areas of China, and 12 V. peregusna distribution points were identified [25]. Additionally, a total of 491 distribution points was obtained by searching the database of the Global Biodiversity Information Facility (http://www.gbif.org, accessed on 18 October 2022) and research articles related to the distribution of V. peregusna [31,32,33,34]. Due to the duplication of many point co-ordinates, we removed redundant data to reduce the error caused by the clustering effect so that only one distribution point was retained in each grid (100 km2). Ultimately, 101 valid points were obtained (Figure 1), and the latitude and longitude co-ordinates of each point are shown in Table S1.

2.2. Selection and Processing of Environmental Variables

We used 31 environmental variables for modeling, and these environmental variables were shown to be directly related to R. opimus distribution in our earlier modeling [35]: 19 bioclimatic factors, 9 soil factors, and 3 topographic factors. The climate data were downloaded from the WorldClim database (http://worldclim.org, accessed on 19 October 2022), and the future climate scenarios were downloaded from the BCC-CSM (Beijing Climate Center, China Meteorological Administration, Beijing, China). These scenarios included those with low (SSP126), moderate (SSP245), and high (SSP585) emissions of greenhouse gases [36]. The soil and topographic factor data were obtained from the Harmonized World Soil Database (HWSD) of the Food and Agriculture Organization of the United Nations (http://www.fao.org/faostat/en/#data, accessed on 19 October 2022), with the spatial resolution of each factor set to 10 arc min [37].
The interactions between environmental factors can lead to collinearity issues during modeling and subsequent overfitting [38]. First, variance inflation factor (VIF) analysis was used to select the most important environmental variables. Second, R was used to conduct a Pearson correlation analysis, reduce the complexity of the model, and improve its prediction accuracy. Factors with a correlation less than 0.8 were preliminarily selected, and, from those, factors with a VIF less than 10 were retained. Then, based on the Pearson correlation test results, factors with a correlation coefficient less than 0.8 were retained, and factors with correlation coefficients greater than 0.8 were omitted. A total of 18 environmental variables were selected (Table 1).

2.3. Model Construction

To reduce the modeling bias caused by the uncertainty inherent in models, we first performed fitting with 10 single methods included in Biomod2: a generalized additive model (GAM), a generalized boosted regression model (GBM), a general linear model (GLM), a random forest (RF), the multivariate adaptive regression splines (MARS) method, classification tree analysis (CTA), an artificial neural network (ANN), the surface range envelope (SRE) method, flexible discriminant analysis (FDA), and the maximum entropy (Maxent) method. Before constructing the model, it was necessary to process the species distribution data. Biomod2 provides several methods to generate nonexistence (pseudoabsence) points from background research data [39]. The “random” command was used to randomly generate 1200 pseudoabsence data points for model simulation. Then, the “biomod_tuning” command was used to optimize the model parameters and select 70% of the sample data for training. The remaining 30% of the sample data were used to verify the performance of the model [40]. The resulting single models were evaluated using 3 metrics: the true skill statistic (TSS), AUC, and kappa coefficient [41].
Single models with accuracies that met the selected standard were integrated into an ensemble model using a weighted average approach [42]. First, the results of the single models used in the construction of the ensemble model were normalized so that the predictions of single SDMs were in the range of [0, 1]. This process was repeated 10 times to avoid random errors associated with the use of a single model. Then, the weights for model combination were determined based on the AUC and TSS values of each model, and the single models used to construct the ensemble model were determined with fixed cutoffs of TSS > 0.7 and AUC > 0.8. The higher the average AUC and TSS values were after multiple runs, the greater the weight assigned to the corresponding single model was when it was incorporated into the ensemble model.

2.4. Changes in the Spatial Pattern of the Suitable Distribution Ranges of Species

The 0/1 probability value cutoff of “suitable” or “unsuitable” was obtained by running the model. The spatial units with values below the cutoff were considered unsuitable habitats, and the spatial units with values above the cutoff were divided into 3 equal parts, corresponding to minimally, moderately, and highly suitable habitats [43]. Two time nodes, namely, the middle of this century and the end of this century, were selected to analyze the future suitable area changes of V. peregusna, and the average values from 2040–2060 (2050s) and 2080–2100 (2090s) were calculated [44]. Based on the “binary_meth” operation in Biomod2, we obtained the results of the suitable/unsuitable (0/1) simulation and used the “biomod_rangesize” function to calculate the changes in the spatial pattern of the suitable areas of R. opimus under future climate change scenarios [45]. Finally, the results, in matrix format, were loaded into ArcGIS v10.4.1 for visual representation.

3. Results

3.1. Model Accuracy

Among the 10 models evaluated, only the GAM failed to run successfully due to the difficulty in obtaining parameter values; the other 9 models were all run successfully, and a total of 90 sets of results were obtained. The different models were compared (Figure S1), and the GBM displayed the highest accuracy and the best stability for the three evaluation metrics, suggesting that it was the best choice for assessing suitable habitats for V. peregusna using a single model. Although higher scores were obtained for the FDA and RF models, they each yielded one data anomaly in the calculation process. Moreover, low scores were obtained for the other models, which failed to reach acceptable performance levels. From the 90 sets of results, we selected a total of 39 eligible models to construct the ensemble model. The final ensemble model yielded a kappa coefficient of 0.91, a TSS value of 0.94, and an AUC value of 0.96, indicating excellent results.

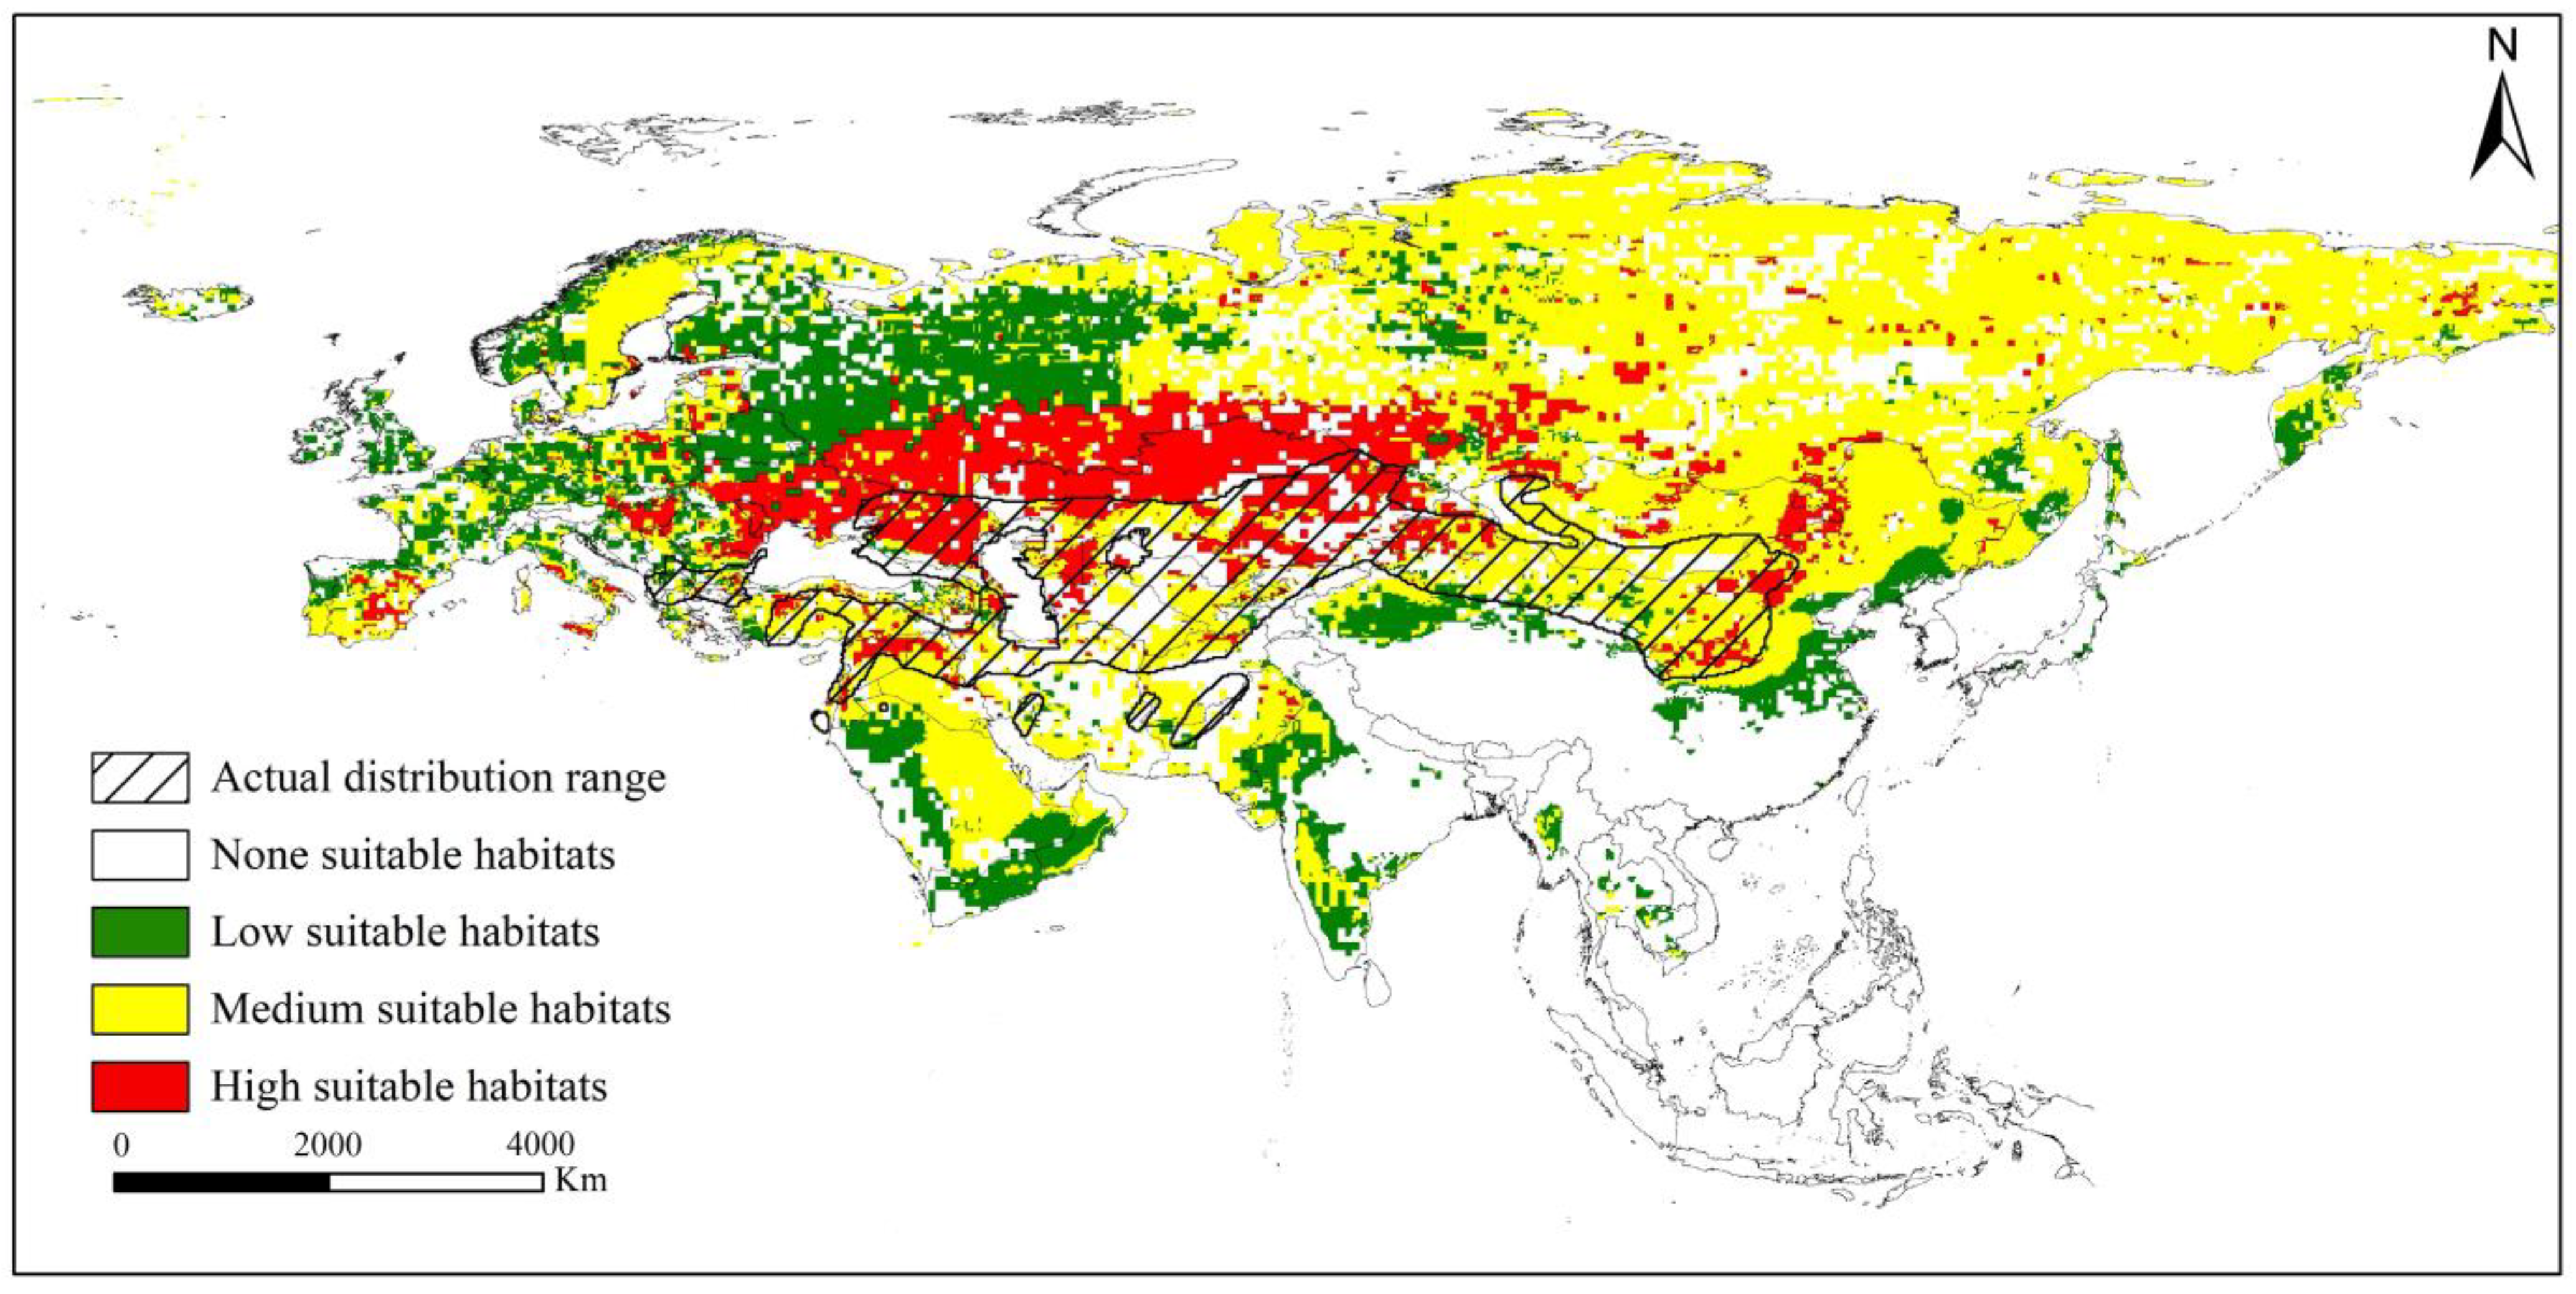
3.2. Current Distribution Range

Suitable habitats for V. peregusna were found over almost all of Eurasia, except in a few tropical areas in Southeast Asia. Based on the current climate scenario, the suitable habitats for V. peregusna covered 3935.92 × 104 km2, of which moderately suitable habitats accounted for 2415.17 × 104 km2, followed by low-suitability habitats (867.99 × 10⁴ km2). Highly suitable habitats accounted for the smallest area (652.76 × 10⁴ km2). The highly suitable habitats were mainly found in the following regions: (1) the plain area at the border of China and Mongolia in the east, (2) the plateau area from the Orkhon River to Khangai Mountain in the west–central part of Mongolia, (3) the area from 40 to 50° N from Bulgaria and Ukraine in the west to the Junger Basin in China and the Siberian Plain in Russia in the east, and (4) sporadic highly suitable habitats in Spain, Italy, Hungary, Poland, Lithuania, Latvia, and the far east of Russia (Figure 2).

3.3. Future Changes in Suitable Habitat Area

Based on the three future climate scenarios, the geographical distributions of moderately and highly suitable habitats for V. peregusna were predicted to decrease to varying degrees (Figure 3). Although the percentages of the increases and decreases differed in various scenarios, the decrease in the area of suitable habitats for V. peregusna was much larger than the corresponding increase in each scenario. The lost suitable habitats were mainly in Europe, and most areas from northern to southern Europe were predicted to no longer be suitable for V. peregusna survival, especially in several countries around the Black Sea, where many V. peregusna have been recorded. Increases and decreases in the area of suitable habitats were variable in other regions, with decreases occurring in the eastern part of Saudi Arabia, in the border area between northeastern China and Russia, and on the Western Siberian Plain. Regions with increases in the area of suitable habitats were concentrated around the Ural Mountains in Russia, in the central and southern parts of the Arabian Peninsula, in North China, and in central Xinjiang, China.
The predicted area changes in each scenario indicated that both SSP126 and SSP585 in the middle of this century will result in extensive losses of moderately and highly suitable habitats for V. peregusna (Table 2), with the lost area exceeding 900 × 104 km2, accounting for 30% of the area of existing suitable habitats. In comparison, the case of SSP245 was relatively optimistic, but the lost area still reached 646 × 104 km2, which was 21.06% less than that in the current period. At the end of this century, SSP245 is projected to be the scenario with the most severe decrease in the area of suitable habitats for V. peregusna, and the species range is predicted to decrease to only two-thirds of the existing distribution area, with a loss of 35.83% of suitable habitat. SSP126 is the most optimistic scenario for habitat suitability based on the predicted results. Notably, the percentages of area gain and loss for V. peregusna habitats are projected to be 5.89% and 11.91%, respectively, with an overall change of only 11.91%. The change in the area of suitable habitat under SSP585 is predicted to be stable at the end of this century, and the increases and decreases in suitable habitat area are expected to be consistent with those at 50° S.

4. Discussion

In general, species ecological niches evolve at a much slower rate than climate change [46], and species respond to rapid climate change by dispersing to new suitable habitats, adapting, or becoming extinct [47]. Despite the widespread distribution of V. peregusna in Eurasia, it is alarming that our assessment indicated that a 12 to 34% decrease in the suitable habitats for V. peregusna may occur in the coming decades, implying that the survival of V. peregusna may be severely affected by climate change; this trend is largely associated with the extremely low number of V. peregusna per unit area of distribution and the poor migratory capacity of the species [19]. However, the future predictions obtained with the model in this study are relatively uncertain. Our results only indicate the probability of potential occurrence and do not represent real changes in the species distribution or habitat area [48]. In addition to the environment, the main factors affecting the distribution of the species include various biological and nonbiological factors, such as competition, disease, and human disturbances [49].
In contrast to the results of ecological niche modeling studies for other species [50,51], the modeling results for V. peregusna in this study did not show a clear pattern of response to different climatic scenarios, i.e., no shift of suitable habitats to higher latitudes or a significant decrease in the area of suitable habitats with increasing temperature. Surprisingly, the moderate carbon emission concentration at the end of this century is projected to result in the largest decrease in the suitable area for V. peregusna. We speculate that the reason for this result is directly related to the unique living habits of V. peregusna and the selection of environmental factors retained in the model. V. peregusna is the only mustelid animal that hibernates [25], and its food sources are predominantly rodents and lizards. Precipitation and soil factors accounted for more than 80% of the environmental influence in the modeling process, and temperature parameters, which were most influenced by changes in climate scenarios, accounted for only 0.66% of the influence in the ensemble model. Although it did not have a direct impact, climate change still had a substantial effect on the suitable habitats of V. peregusna, indicating that current wildlife conservation efforts face serious challenges and that it is necessary to pay increased attention to climate change to avoid species extinction.
To enhance biodiversity conservation, we recommend the following two measures to ensure that V. peregusna will not become an endangered species in the future. First, for regions with low climate impacts, the protection of V. peregusna should be strengthened, human interference and the use of anticoagulant rodenticides should be reduced, in situ protection should be enhanced, nature reserves should be established as soon as possible, and the hunting and trading of wild animals should be closely monitored. Second, for regions with relatively fragile climates, it is necessary to strengthen captive management, tentatively adopt ex situ conservation measures, promote domestication and breeding, and implement overall population resource monitoring.
The IUCN Red List is the most widely used wildlife conservation standard and reference for prioritizing conservation and ecological research [52], and the accuracy of Red List assessments has global implications [53]. IUCN assessments primarily consider the current drivers of species declines, such as population fluctuations and human pressure on populations and their suitable habitats, without adequately identifying potential future risks, such as threats posed by climate change [54,55]. Combined with studies of other listed species [56,57,58], we suggest that the IUCN consider the threats posed by climate change in future assessment efforts and incorporate distribution changes resulting from climate change into the assessment metrics for Red List species.
With the ensemble model, we effectively mitigated overfitting and improved the accuracy of predictions, but it is undeniable that the use of models to study species distributions has certain limitations. First, the results of the model are species distribution predictions, not the actual distribution of a species [59]. Second, the reproduction and migration of species are complex and dynamic processes. Natural disasters, human activities, and intraspecific competition are also important factors that influence species distributions. No existing prediction model can capture interspecies competition well. In this study, we only considered environmental factors, and this limitation may have affected the prediction accuracy to a certain extent. Third, too sparse a sample size can lead to errors in the prediction results of ecological niche models; therefore, further global co-operation is required to improve the ability to assess and protect wildlife through data sharing.

5. Conclusions

This study applied the ensemble model to evaluate the spatial distribution of the potential habitat of the endangered species V. peregusna in Eurasia and the effects of future climate change on its habitat suitability. The results showed that GBM is the best single model for predicting suitable habitats for V. peregusna, and the ensemble model showed higher accuracy and stability than single models. Under current conditions, the area of suitable habitats for V. peregusna has reached 3935.92 × 104 km2, making it a species with a wide distribution range. In the future, climate change will severely affect the distribution and substantially reduce the area of suitable habitats for V. peregusna, thus posing an extremely serious challenge to the conservation of V. peregusna. These findings are expected to support the development of practical solutions to prevent the extinction of V. peregusna populations.

Supplementary Materials

The following supporting information can be downloaded at: https://www.mdpi.com/article/10.3390/ani13142341/s1, Supplementary Table S1: Distribution points of Vormela peregusna; Supplementary Figure S1: Comparison of AUC, kappa coefficient, and TSS evaluations of 9 models.

Author Contributions

Conceptualization, X.W.; methodology, X.C. and X.W.; software, X.C. and Y.H.; validation, J.L. and Q.C.; formal analysis, Y.S. and D.C.; investigation, F.J.; writing—original draft preparation, X.C. and Y.H.; writing—review and editing, J.L. and X.W.; visualization, F.J., J.L. and Q.C.; supervision, X.W.; project administration, X.W.; funding acquisition, X.W. All authors have read and agreed to the published version of the manuscript.

Funding

This work was supported by the National Forestry and Grassland Administration Forestry plant new varieties and patent protection application [KJZXXP202212].

Institutional Review Board Statement

Not applicable.

Informed Consent Statement

Not applicable.

Data Availability Statement

The original contributions presented in this study are included in the article/Supplementary Material, and further inquiries can be directed to the corresponding author.

Conflicts of Interest

The authors declare no conflict of interest.

References

  1. Thapa, A.; Wu, R.; Hu, Y.; Nie, Y.; Singh, P.B.; Khatiwada, J.R.; Yan, L.; Gu, X.; Wei, F. Predicting the potential distribution of the endangered red panda across its entire range using MaxEnt modeling. Ecol. Evol. 2018, 8, 10542–10554. [Google Scholar] [CrossRef] [Green Version]
  2. Scherrer, D.; Christe, P.; Guisan, A. Modelling bat distributions and diversity in a mountain landscape using focal predictors in ensemble of small models. Divers. Distrib. 2019, 25, 770–782. [Google Scholar] [CrossRef] [Green Version]
  3. International Union for Conservation of Nature. The IUCN Red List of Threatened Species. Version 2022-2. Available online: https://www.iucnredlist.org (accessed on 15 December 2022).
  4. Hoekstra, J.M.; Boucher, T.M.; Ricketts, T.H.; Roberts, C. Confronting a biome crisis: Global disparities of habitat loss and protection. Ecol. Lett. 2005, 8, 23–29. [Google Scholar] [CrossRef]
  5. He, F.; Hubbell, S.P. Species-area relationships always overestimate extinction rates from habitat loss. Nature 2011, 473, 368–371. [Google Scholar] [CrossRef] [PubMed]
  6. Coristine, L.E.; Kerr, J.T. Habitat loss, climate change, and emerging conservation challenges in Canada. Can. J. Zool. 2011, 89, 435–451. [Google Scholar] [CrossRef]
  7. Galante, P.J.; Triguero, S.C.; Paz, A.; Aiello-Lammens, M.; Gerstner, B.E.; Johnson, B.A.; Kass, J.M.; Merow, C.; Noguera-Urbano, E.A.; Pinilla-Buitrago, G.E.; et al. changeRangeR: An R package for reproducible biodiversity change metrics from species distribution estimates. Conserv. Sci. Pract. 2022, 5, e12863. [Google Scholar] [CrossRef]
  8. Brodie, S.; Smith, J.A.; Muhling, B.A.; Barnett, L.A.K.; Carroll, G.; Fiedler, P.; Bograd, S.J.; Hazen, E.L.; Jacox, M.G.; Andrews, K.S.; et al. Recommendations for quantifying and reducing uncertainty in climate projections of species distributions. Glob. Chang. Biol. 2022, 28, 6586–6601. [Google Scholar] [CrossRef] [PubMed]
  9. Hodel, R.G.J.; Soltis, D.E.; Soltis, P.S. Hindcast-validated species distribution models reveal future vulnerabilities of mangroves and salt marsh species. Ecol. Evol. 2022, 12, e9252. [Google Scholar] [CrossRef]
  10. Norberg, A.; Abrego, N.; Blanchet, F.G.; Adler, F.R.; Anderson, B.J.; Anttila, J.; Araújo, M.B.; Dallas, T.; Dunson, D.; Elith, J.; et al. A comprehensive evaluation of predictive performance of 33 species distribution models at species and community levels. Ecol. Monogr. 2019, 89, e01370. [Google Scholar] [CrossRef]
  11. Tez, C.; Gündüz, I.; Kefelioğlu, H. Contributions to distribution, reproduction biology and ecology of Vormela peregusna (Güldenstaedt, 1770) (Mammalia: Carnivora) in Turkey. Pak. J. Biol. Sci. 2001, 4, 74–76. [Google Scholar] [CrossRef]
  12. Gama, M.; Crespo, D.; Dolbeth, M.; Anastácio, P. Predicting global habitat suitability for Corbicula fluminea using species distribution models: The importance of different environmental datasets. Ecol. Model. 2016, 319, 163–169. [Google Scholar] [CrossRef] [Green Version]
  13. Di Cola, V.; Broennimann, O.; Petitpierre, B.; Breiner, F.T.; D’Amen, M.; Randin, C.; Engler, R.; Pottier, J.; Pio, D.; Dubuis, A.; et al. ecospat: An R package to support spatial analyses and modeling of species niches and distributions. Ecography 2017, 40, 774–787. [Google Scholar] [CrossRef]
  14. Hao, T.; Elith, J.; Lahoz-Monfort, J.J.; Guillera-Arroita, G. Testing whether ensemble modelling is advantageous for maximising predictive performance of species distribution models. Ecography 2020, 43, 549–558. [Google Scholar] [CrossRef] [Green Version]
  15. Schickele, A.; Leroy, B.; Beaugrand, G.; Goberville, E.; Hattab, T.; Francour, P.; Raybaud, V. Modelling European small pelagic fish distribution: Methodological insights. Ecol. Model. 2020, 416, 108902. [Google Scholar] [CrossRef]
  16. Puzachenko, A.Y.; Abramov, A.V.; Rozhnov, V.V. Cranial variation and taxonomic content of the marbled polecat Vormela peregusna (Mustelidae, Carnivora). Mamm. Biol. 2017, 83, 10–20. [Google Scholar] [CrossRef]
  17. Ben-David, M.; Pellis, S.M.; Pellis, V.C. Feeding habits and predatory behaviour in the marbled polecat (Vormela peregusna syriaca): I. Killing methods in relation to prey size and prey behaviour. Behaviour 1991, 118, 127–143. [Google Scholar] [CrossRef]
  18. Liu, G.; Zhao, S.; Tan, W.; Hornok, S.; Yuan, W.; Mi, L.; Wang, S.; Liu, Z.; Zhang, Y.; Hazihan, W.; et al. Rickettsiae in red fox (Vulpes vulpes), marbled polecat (Vormela peregusna) and their ticks in northwestern China. Parasit. Vectors 2021, 14, 204. [Google Scholar] [CrossRef]
  19. Abramov, A.V.; Kranz, A.; Maran, T. Vormela peregusna. In The IUCN Red List of Threatened Species 2016; International Union for Conservation of Nature and Natural Resources: Gland, Switzerland, 2016. [Google Scholar] [CrossRef]
  20. Zidarova, S. Present distribution of the marble polecat Vormela peregusna (Güldenstädt, 1770) (Carnivora: Mustelidae) in central Western Bulgaria, with an observation on its defensive behavior. Acta Zool. Bulg. 2022, 74, 403–408. [Google Scholar]
  21. Wright, P.G.R.; Croose, E.; Hunter, S.B.; MacPherson, J.; Çoraman, E.; Yarotskiy, V.; Moisieieva, V.; Karapandža, B.; Hoxha, B.; Madalina, P.; et al. Can social media be used to inform the distribution of the marbled polecat, Vormela peregusna? Mammal Res. 2023, 68, 295–304. [Google Scholar] [CrossRef]
  22. Ivanov, V.; Spassov, N. Some new data on the distribution, habitats and ecology of the threatened European mustelids Mustela eversmanii and Vormela peregusna in Bulgaria. Hist. Nat. Bulg. 2015, 21, 267–271. [Google Scholar]
  23. AL-Sheikhly, O.S.; Ararat, K.; Ahmed, S.H. New records for the first time in six decades of the Vulnerable Marbled Polecat Vormela peregusna in Iraq. Small Carniv. Conserv. 2022, 60, e60004. [Google Scholar]
  24. Dulamtseren, S.; Shar, S.; Murdoch, J.; Reading, R.P.; Gantulga, J.; Usukhjrargal, D.; Suuri, B. Contributions to the distribution of the marbled polecat (Vormela peregusna Guldenstaedt, 1770) in Mongolia. Small Carniv. Conserv. 2009, 40, 29–32. [Google Scholar]
  25. Wen, X.; Cheng, X.; Dong, Y.; Wang, Q.; Lin, X. Analysis of the activity rhythms of the great gerbil (Rhombomys opimus) and its predators and their correlations based on infrared camera technology. Glob. Ecol. Conserv. 2020, 24, e01337. [Google Scholar] [CrossRef]
  26. Werner, N.Y. Small carnivores, big database—Inferring possible small carnivore distribution and population trends in Israel from over 30 years of recorded sightings. Small Carniv. Conserv. 2012, 47, 17–25. [Google Scholar]
  27. He, B.; Tuya, W.; Qinchaoketu, S.; Nanzad, L.; Yong, M.; Kesi, T.; Sun, C. Climate Change Characteristics of Typical Grassland in the Mongolian Plateau from 1978 to 2020. Sustainability 2022, 14, 16529. [Google Scholar] [CrossRef]
  28. Vale, C.G.; Brito, J.C. Desert-adapted species are vulnerable to climate change: Insights from the warmest region on Earth. Glob. Ecol. Conserv. 2015, 4, 369–379. [Google Scholar] [CrossRef] [Green Version]
  29. Iknayan, K.J.; Beissinger, S.R. Collapse of a desert bird community over the past century driven by climate change. Proc. Natl. Acad. Sci. USA 2018, 115, 8597–8602. [Google Scholar] [CrossRef] [Green Version]
  30. Chen, T.; Bao, A.; Jiapaer, G.; Guo, H.; Zheng, G.; Jiang, L.; Chang, C.; Tuerhanjiang, L. Disentangling the relative impacts of climate change and human activities on arid and semiarid grasslands in central asia during 1982–2015. Sci. Total Environ. 2019, 53, 1311–1325. [Google Scholar] [CrossRef]
  31. Gherman, C.M.; Sándor, A.D.; Kalmár, Z.; Marinov, M.; Mihalca, A.D. First report of Borrelia burgdorferi sensu lato in two threatened carnivores: The Marbled polecat, Vormela peregusna and the European mink, Mustela lutreola (Mammalia: Mustelidae). BMC Vet. Res. 2012, 8, 137. [Google Scholar] [CrossRef] [Green Version]
  32. Liu, X.; Yang, M.; Liu, G.; Zhao, S.; Yuan, W.; Xiao, R.; Hazihan, W.; Hornok, S.; Wang, Y. Molecular evidence of Rickettsia raoultii, “Candidatus Rickettsia barbariae” and a novel Babesia genotype in marbled polecats (Vormela peregusna) at the China-Kazakhstan border. Parasit. Vectors 2018, 11, 450. [Google Scholar] [CrossRef] [Green Version]
  33. Hadad, E.; Charter, M.; Kosicki, J.Z.; Yosef, R. Prey-base does not influence breeding success in eagle owls (Bubo bubo) in Judea, Israel. Animals 2022, 12, 1280. [Google Scholar] [CrossRef]
  34. Gray, A.; Brito, J.C.; Edwards, C.W.; Figueiró, H.V.; Koepfli, K.P. First complete mitochondrial genome of the Saharan striped polecat (Ictonyx libycus). Mitochondrial DNA Pt. B Resour. 2022, 7, 1957–1960. [Google Scholar] [CrossRef] [PubMed]
  35. Wen, X.; Zhao, G.; Cheng, X.; Chang, G.; Dong, X.; Lin, X. Prediction of the potential distribution pattern of the great gerbil (Rhombomys opimus) under climate change based on ensemble modelling. Pest Manag. Sci. 2022, 78, 3128–3134. [Google Scholar] [CrossRef] [PubMed]
  36. Li, W.; Zhang, Y.; Shi, X.; Zhou, W.; Huang, A.; Mu, M.; Qiu, B.; Ji, J. Development of land surface model BCC_AVIM2.0 and its preliminary performance in LS3MIP/CMIP6. J. Meteorol. Res. 2019, 33, 851–869. [Google Scholar] [CrossRef]
  37. Graham, M.H. Confronting multicollinearity in ecological multiple regression. Ecology 2003, 84, 2809–2815. [Google Scholar] [CrossRef] [Green Version]
  38. Rose, E.L. Multivariate analysis of categorical data: Theory. Struct. Equ. Model. 1995, 2, 274–276. [Google Scholar] [CrossRef]
  39. Thuiller, W.; Lafourcade, B.; Engler, R.; Araújo, M.B. BIOMOD—A platform for ensemble forecasting of species distributions. Ecography 2009, 32, 369–373. [Google Scholar] [CrossRef]
  40. Singh, K.; McClean, C.J.; Büker, P.; Hartley, S.E.; Hill, J.K. Mapping regional risks from climate change for rainfed rice cultivation in India. Agric. Syst. 2017, 156, 76–84. [Google Scholar] [CrossRef] [PubMed]
  41. Allouche, O.; Tsoar, A.; Kadmon, R. Assessing the accuracy of species distribution models: Prevalence, kappa and the true skill statistic (TSS). J. Appl. Ecol. 2006, 43, 1223–1232. [Google Scholar] [CrossRef]
  42. Fourcade, Y.; Besnard, A.G.; Secondi, J. Paintings predict the distribution of species, or the challenge of selecting environmental predictors and evaluation statistics. Glob. Ecol. Biogeogr. 2018, 27, 245–256. [Google Scholar] [CrossRef]
  43. Liu, C.; White, M.; Newell, G. Selecting thresholds for the prediction of species occurrence with presence-only data. J. Biogeogr. 2013, 40, 778–789. [Google Scholar] [CrossRef]
  44. Patasaraiya, M.K.; Devi, R.M.; Sinha, B.; Bisaria, J. Predicting impacts of climate change on teak and sal forests in central India using maximum entropy modeling: An approach for future conservation and silvicultural strategies. For. Sci. 2023, fxad014. [Google Scholar] [CrossRef]
  45. Guisan, A.; Thuiller, W.; Zimmermann, N.E. Habitat Suitability and Distribution Models: With Applications in R; Ecology, Biodiversity and Conservation); Cambridge University Press: Cambridge, UK, 2017. [Google Scholar]
  46. Quintero, I.; Wiens, J.J. Rates of projected climate change dramatically exceed past rates of climatic niche evolution among vertebrate species. Ecol. Lett. 2013, 16, 1095–1103. [Google Scholar] [CrossRef] [PubMed]
  47. Christmas, M.J.; Breed, M.F.; Lowe, A.J. Constraints to and conservation implications for climate change adaptation in plants. Conserv. Genet. 2016, 17, 305–320. [Google Scholar] [CrossRef] [Green Version]
  48. Blair, M.E.; Le, M.D.; Xu, M. Species distribution modeling to inform transboundary species conservation and management under climate change: Promise and pitfalls. Front. Biogeogr. 2022, 14, e54662. [Google Scholar] [CrossRef]
  49. Ikeda, T.; Higashide, D.; Shichijo, T. Impact of human disturbance in Japan on the distribution and diel activity pattern of terrestrial mammals. J. Nat. Conserv. 2022, 70, 126293. [Google Scholar] [CrossRef]
  50. Kufa, C.A.; Bekele, A.; Atickem, A. Impacts of climate change on predicted habitat suitability and distribution of Djaffa Mountains Guereza (Colobus guereza gallarum, Neumann 1902) using MaxEnt algorithm in Eastern Ethiopian Highland. Glob. Ecol. Conserv. 2022, 35, e02094. [Google Scholar] [CrossRef]
  51. Baral, K.; Adhikari, B.; Bhandari, S.; Kunwar, R.M.; Sharma, H.P.; Aryal, A.; Ji, W. Impact of climate change on distribution of common leopard (Panthera pardus) and its implication on conservation and conflict in Nepal. Heliyon 2023, 9, e12807. [Google Scholar] [CrossRef]
  52. Pimm, S.L.; Jenkins, C.N.; Abell, R.; Brooks, T.M.; Gittleman, J.L.; Joppa, L.N.; Raven, P.H.; Roberts, C.M.; Sexton, J.O. The biodiversity of species and their rates of extinction, distribution, and protection. Science 2014, 344, 1246752. [Google Scholar] [CrossRef]
  53. Guan, T.; Owens, J.R.; Kong, Y.; Jian, Y.; Gu, X.; Song, Y. The need for IUCN species distribution update—The case from takin (Budorcas taxicolor) in Southwest China. Ecol. Evol. 2022, 12, e9222. [Google Scholar] [CrossRef]
  54. Foden, W.B.; Butchart, S.H.; Stuart, S.N.; Vié, J.C.; Akçakaya, H.R.; Angulo, A.; DeVantier, L.M.; Gutsche, A.; Turak, E.; Cao, L.; et al. Identifying the world’s most climate change vulnerable species: A systematic trait-based assessment of all birds, amphibians and corals. PLoS ONE 2013, 8, e65427. [Google Scholar] [CrossRef] [PubMed] [Green Version]
  55. Wheatley, C.J.; Beale, C.M.; Bradbury, R.B.; Pearce-Higgins, J.W.; Critchlow, R.; Thomas, C.D. Climate change vulnerability for species-assessing the assessments. Glob. Chang. Biol. 2017, 23, 3704–3715. [Google Scholar] [CrossRef] [PubMed] [Green Version]
  56. Akçakaya, H.R.; Butchart, S.H.M.; Watson, J.E.M.; Pearson, R.G. Preventing species extinctions resulting from climate change. Nat. Clim. Chang. 2014, 4, 1048–1049. [Google Scholar] [CrossRef]
  57. Wessely, J.; Hülber, K.; Gattringer, A.; Kuttner, M.; Moser, D.; Rabitsch, W.; Schindler, S.; Dullinger, S.; Essl, F. Habitat-based conservation strategies cannot compensate for climate-change-induced range loss. Nat. Clim. Chang. 2017, 7, 823–827. [Google Scholar] [CrossRef]
  58. Bonnot, T.W.; Cox, W.A.; Thompson, F.R.; Millspaugh, J.J. Threat of climate change on a songbird population through its impacts on breeding. Nat. Clim. Chang. 2018, 8, 718–722. [Google Scholar] [CrossRef]
  59. Liu, C.; White, M.; Newell, G. Measuring and comparing the accuracy of species distribution models with presence—Absence data. Ecography 2011, 34, 232–243. [Google Scholar] [CrossRef]
Figure 1. Distribution of records of V. peregusna.
Animals 13 02341 g001
Figure 2. The current suitable distribution range of V. peregusna.
Animals 13 02341 g002
Figure 3. The spatial pattern changes in potential moderately and highly suitable areas for V. peregusna in different periods.
Animals 13 02341 g003
Table 1. Environmental variables with their contributions and suitable value ranges.
CodeEnvironmental VariableVariable Importance
bio16Precipitation in wettest quarter23.34
t_caco3Topsoil calcium carbonate content14.46
bio18Precipitation in warmest quarter13.94
t_tebTopsoil teb.12.36
bio3Isothermality10.65
elevElevation7.27
t_cec_clayTopsoil CEC (CLAY)4.77
bio19Precipitation in coldest quarter4.26
bio17Precipitation in driest quarter2.18
bio15Precipitation seasonality2.04
t_caco4Topsoil gypsum content1.00
slopeSlope0.99
bio5Max. temperature0.66
t_eceTopsoil salinity (Elco)0.56
t_gravelTopsoil gravel content0.43
t_ocTopsoil organic carbon0.41
t_espTopsoil sodicity (ESP)0.37
t-sandTopsoil sand fraction0.30
Table 2. Changes in moderately and highly suitable areas for V. peregusna in different climate scenarios in the future.
PeriodsClimate ScenarioSuitable Habitat Area (×104 km2)Loss (×104 km2)Stable
(×104 km2)
Gain (×104 km2)Species Range Change (%)Percentage Loss (%)Percentage Gain (%)
Current 3067.93
2050SSP1262226.43978.642089.29137.14−27.4331.904.47
SSP2452553.79646.182421.75132.04−16.7621.064.30
SSP5852226.66926.292141.6485.02−27.4230.192.77
2090SSP1262702.43546.162521.77180.66−11.9117.805.89
SSP2452038.781099.211968.7270.06−33.5535.832.28
SSP5852213.48978.592089.34124.14−27.8531.904.05
Disclaimer/Publisher’s Note: The statements, opinions and data contained in all publications are solely those of the individual author(s) and contributor(s) and not of MDPI and/or the editor(s). MDPI and/or the editor(s) disclaim responsibility for any injury to people or property resulting from any ideas, methods, instructions or products referred to in the content.

