

Measurement of Ammonia and Hydrogen Sulfide Emission from Three Typical Dairy Barns and Estimation of Total Ammonia Emission for the Chinese Dairy Industry

Abstract
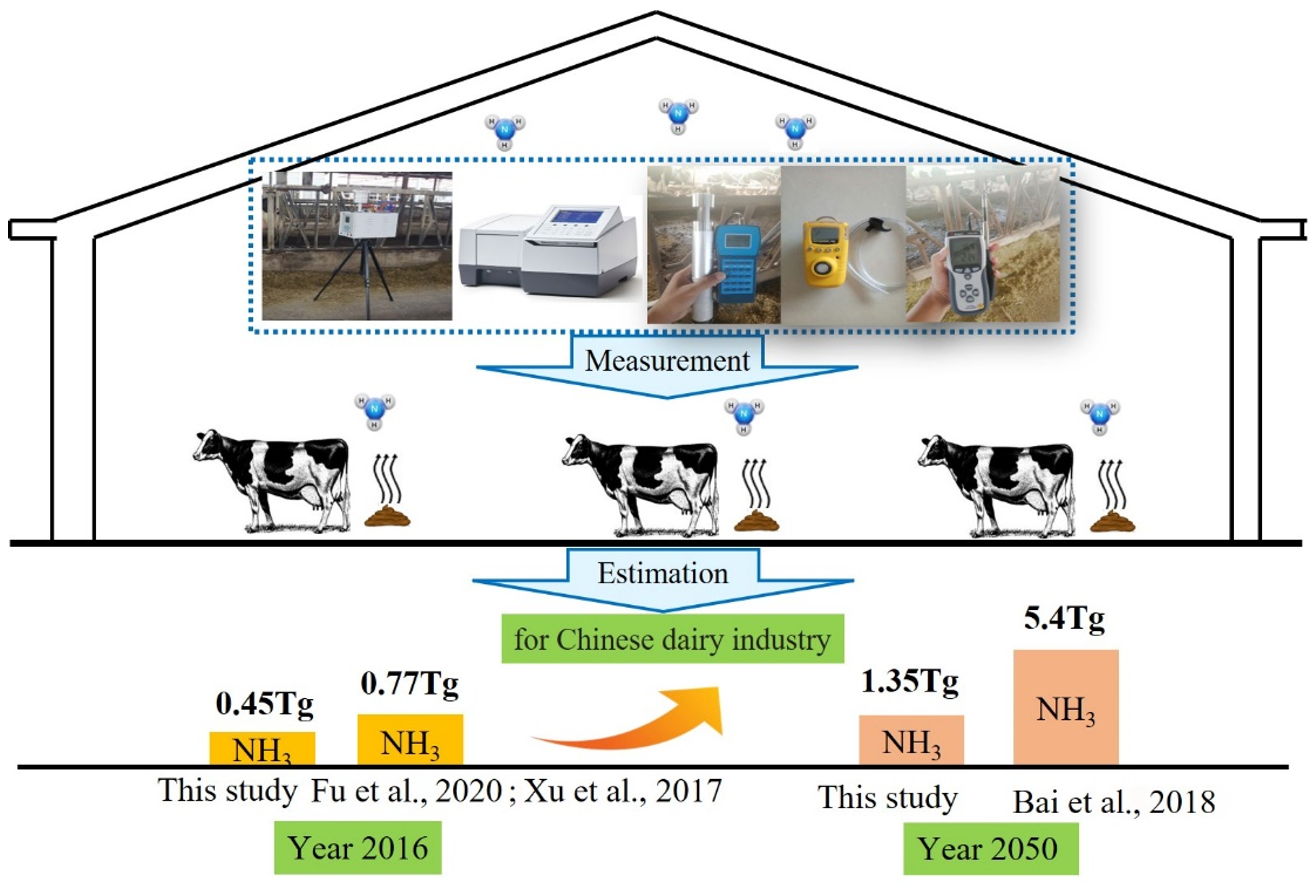
:Simple Summary
Abstract
1. Introduction
2. Materials and Methods
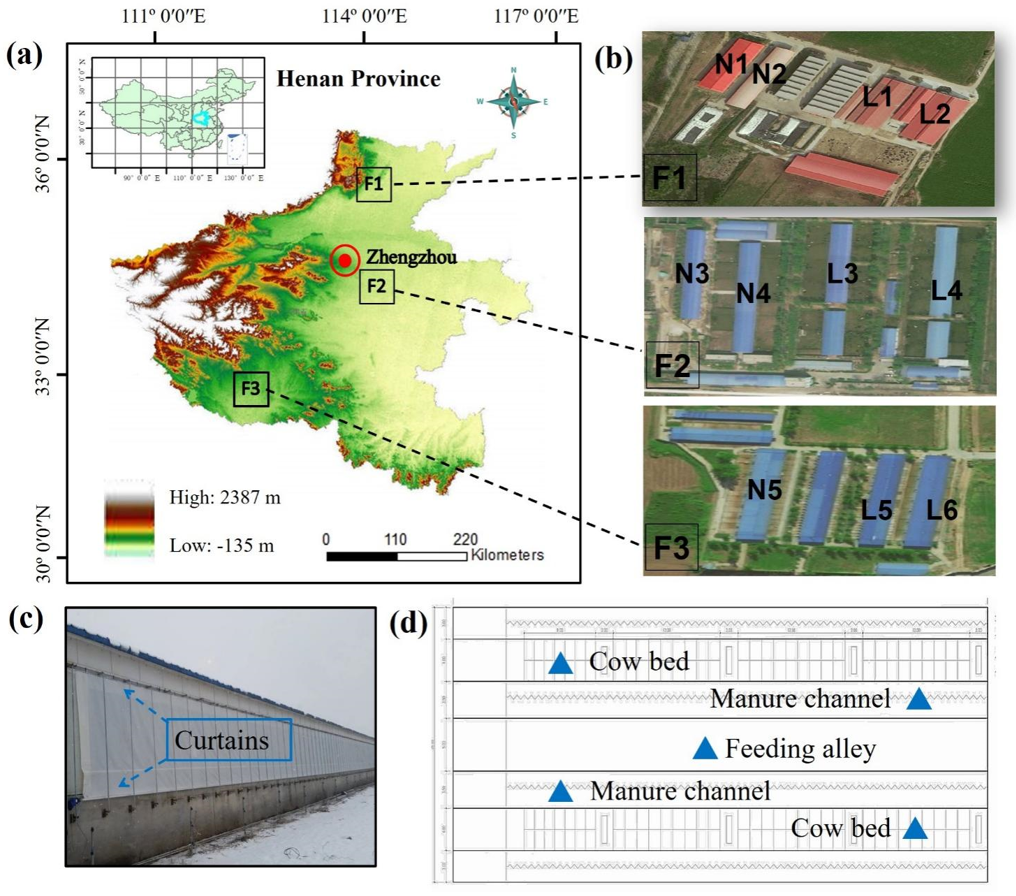
2.1. Site and Building Description
2.2. Experimental Periods, Production and Feed
2.3. Measurement of Gas Concentrations and Environmental Parameters
2.4. Calculation of Ventilation Rate and Emission Rate
2.5. Data Analyses
3. Results and Discussion
3.1. Environmental Parameters
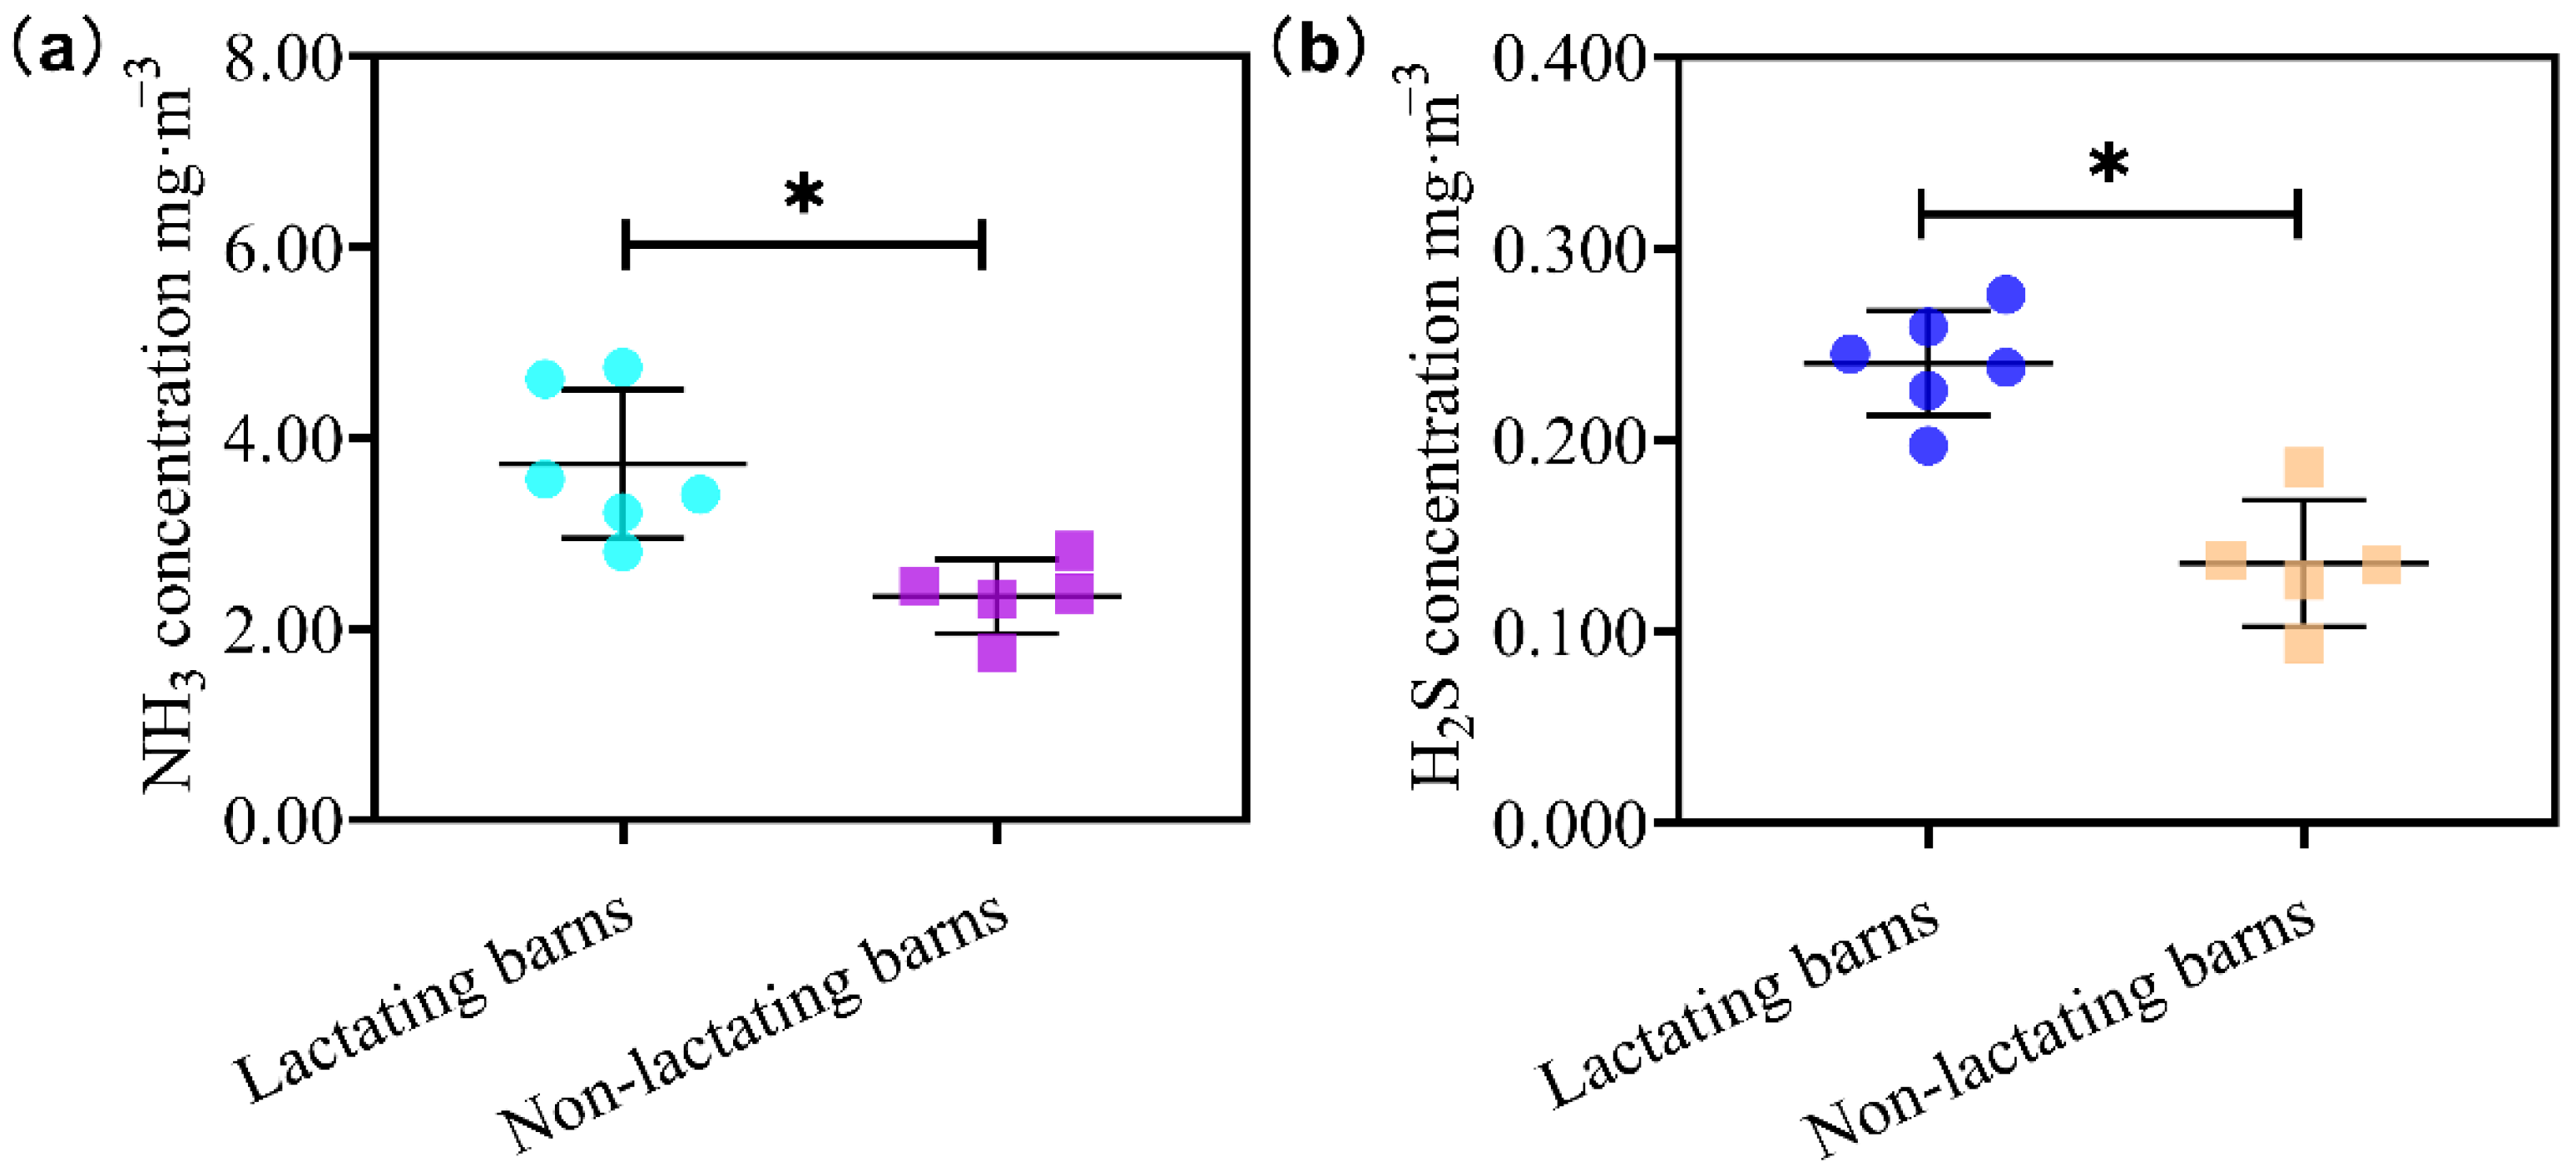
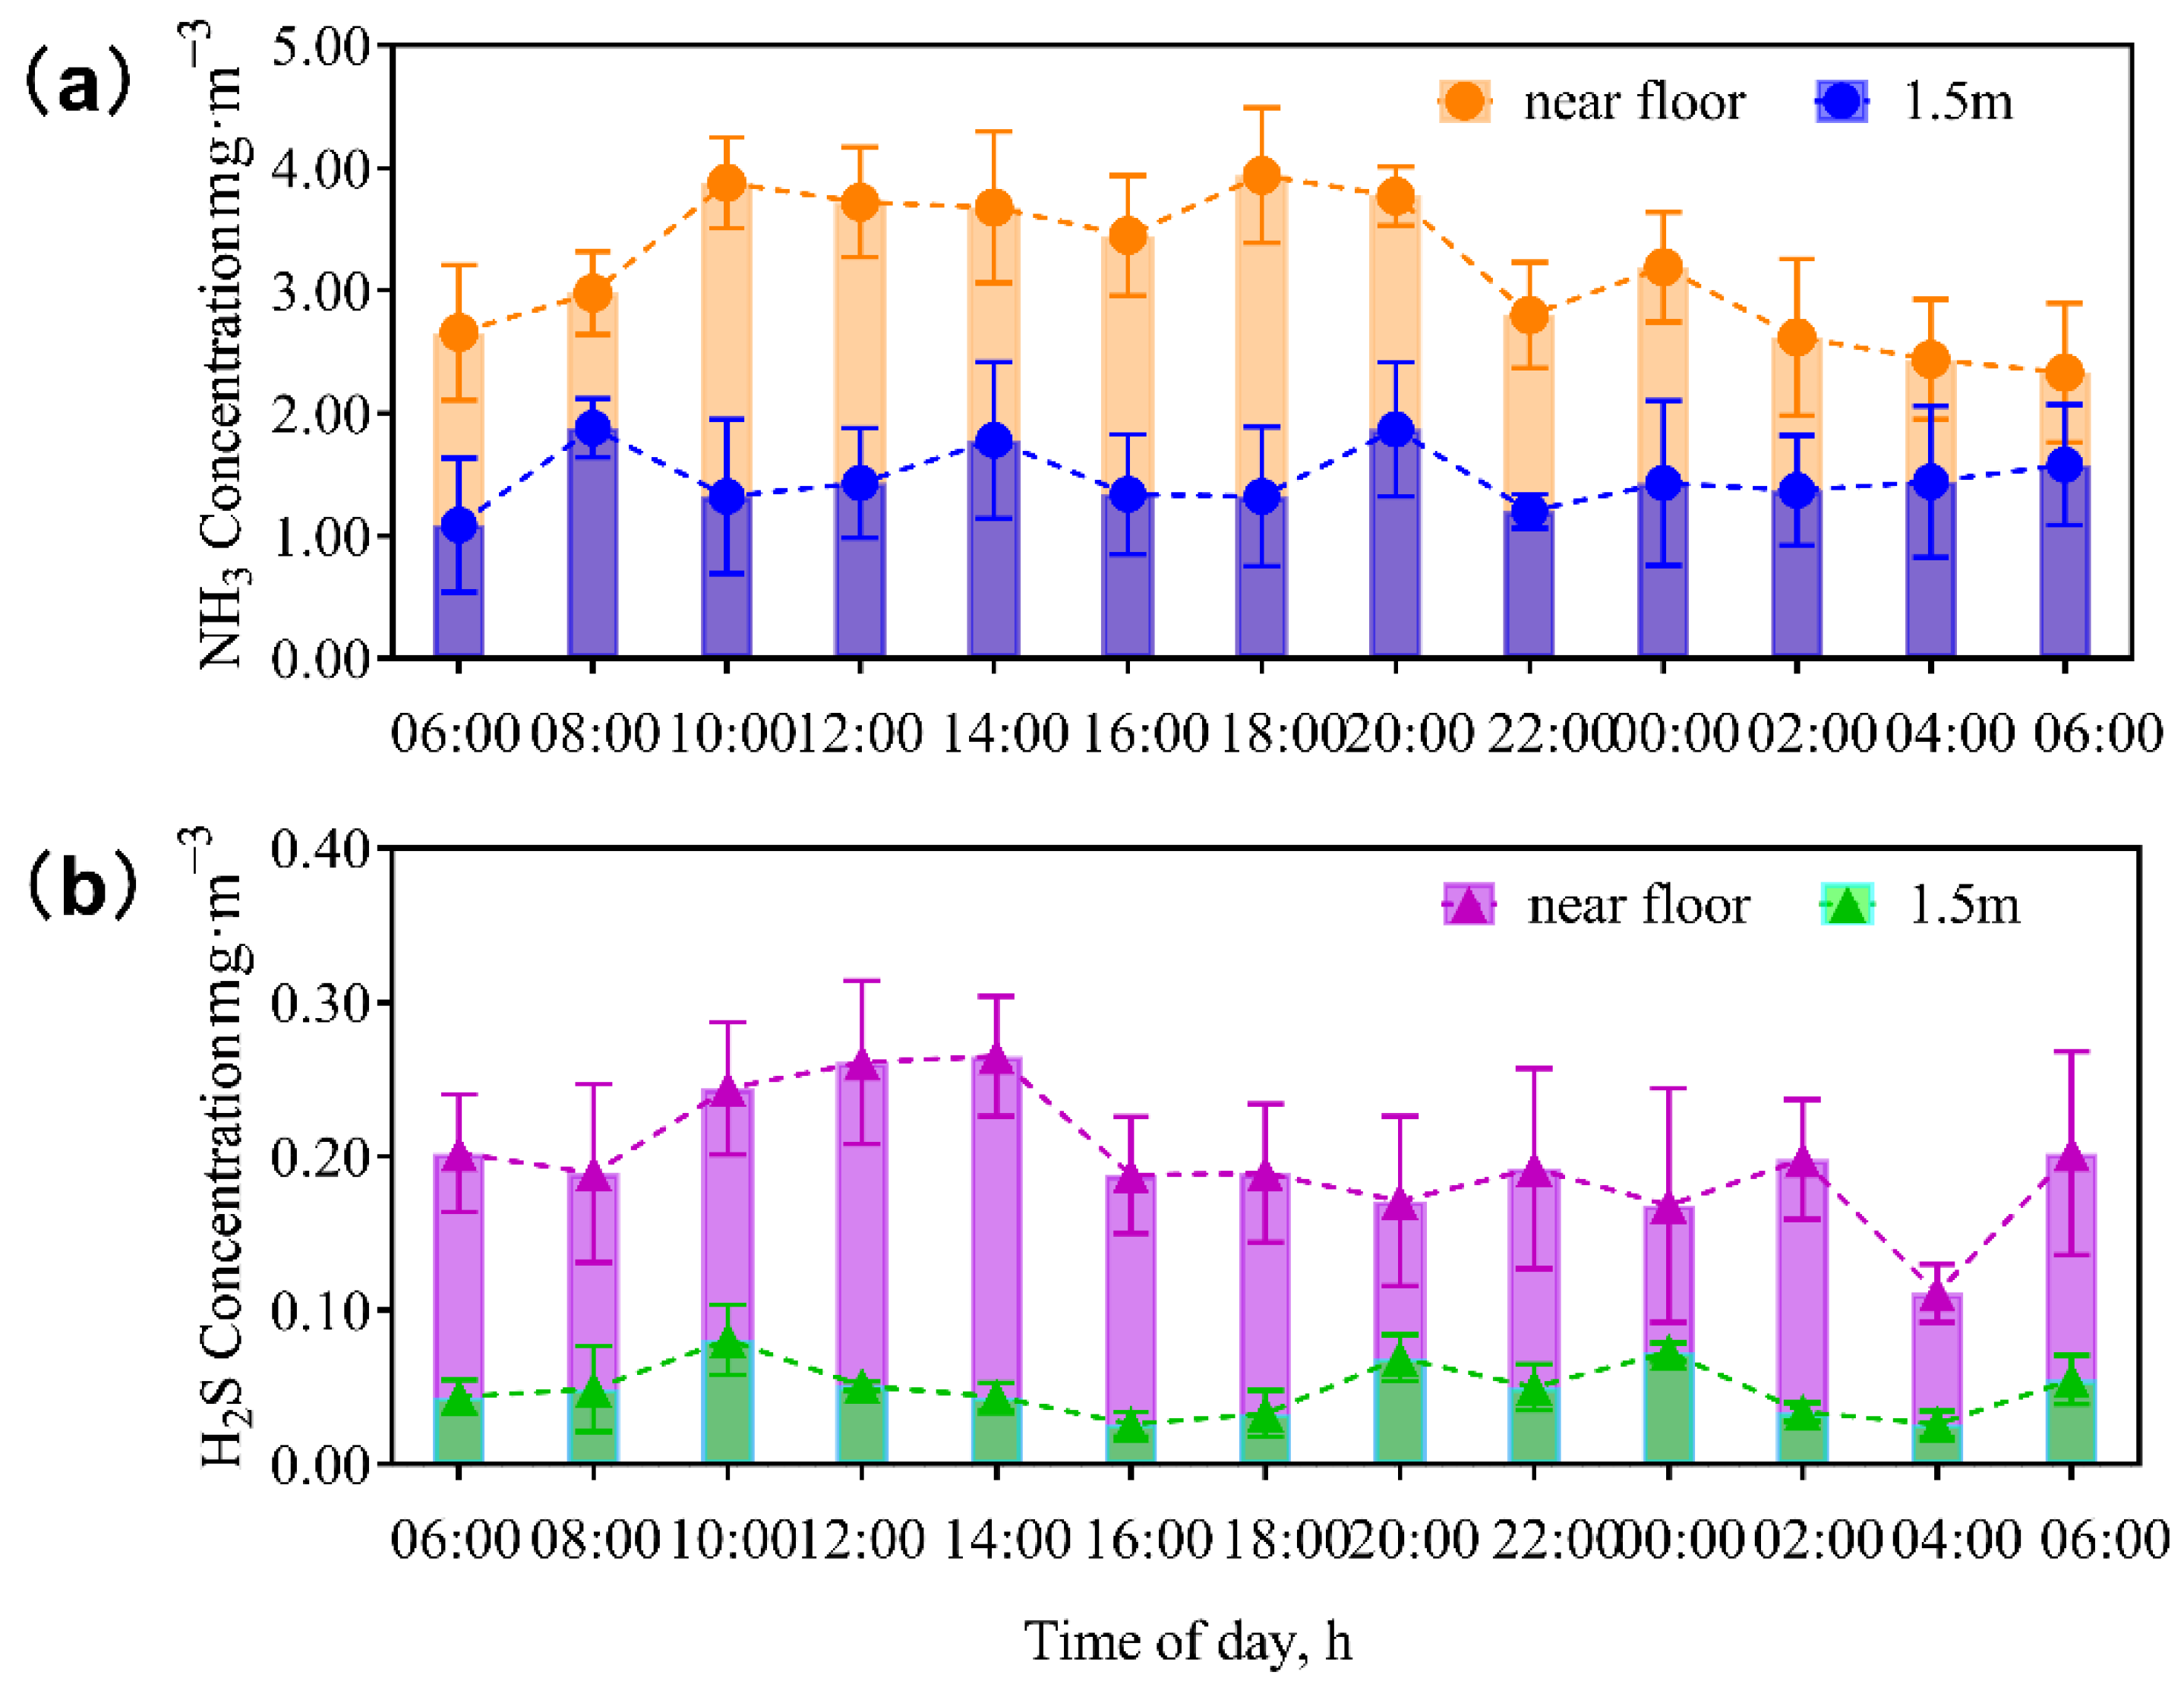
3.2. Concentrations of NH3 and H2S in the Barns
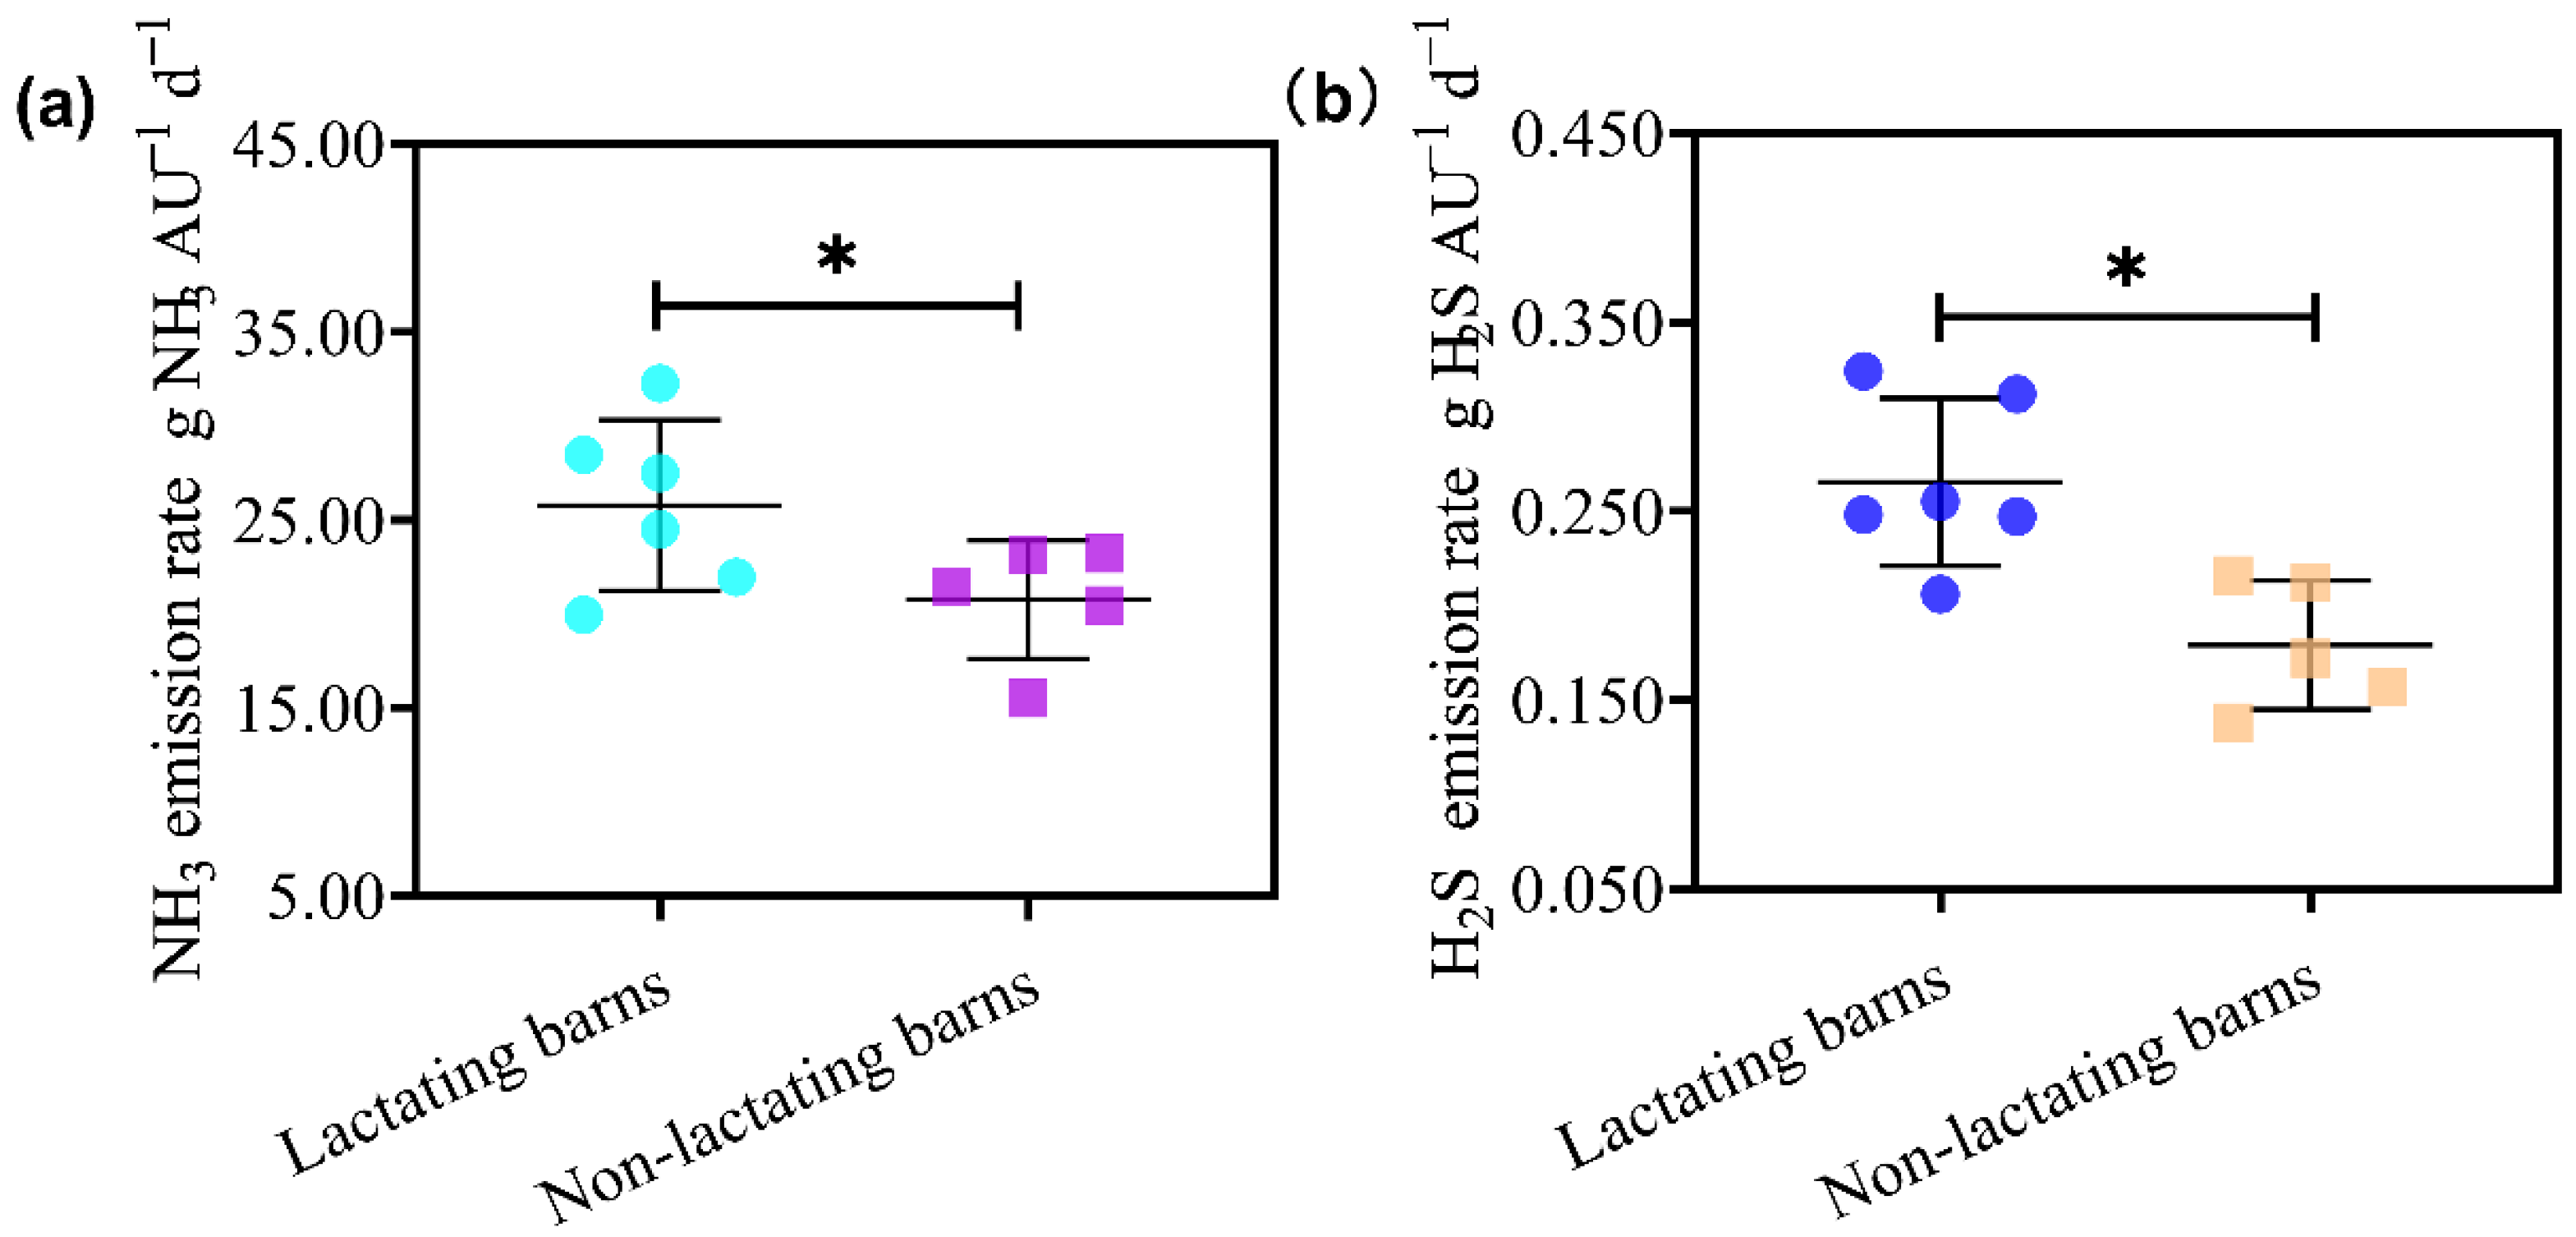
3.3. Emission Rates of NH3 and H2S
3.4. Estimation of NH3 Emission from Chinese Dairy Industry
4. Conclusions
Author Contributions
Funding
Institutional Review Board Statement
Informed Consent Statement
Data Availability Statement
Acknowledgments
Conflicts of Interest
References
- National Research Council. Air Emissions from Animal Feeding Operations: Current Knowledge, Future Needs; The National Academies Press: Washington, DC, USA, 2003. [Google Scholar]
- Meng, Z.Y.; Xu, X.B.; Lin, W.L.; Ge, B.Z.; Xie, Y.L.; Song, B.; Jia, S.H.; Zhang, R.; Peng, W.; Wang, Y.; et al. Role of ambient ammonia in particulate ammonium formation at a rural site in the north China plain. Atmos. Chem. Phys. 2018, 18, 167–184. [Google Scholar] [CrossRef] [Green Version]
- Behera, S.N.; Sharma, M. Investigating the potential role of ammonia in ion chemistry of fine particulate matter formation for an urban environment. Sci. Total Environ. 2010, 408, 3569–3575. [Google Scholar] [CrossRef] [PubMed]
- Yang, Y.Y.; Liao, W.H.; Wang, X.J.; Liu, C.J.; Xie, Q.; Gao, Z.L.; Ma, W.Q.; He, Y. Quantification of ammonia emissions from dairy and beef feedlots in the Jing-Jin-Ji district, China. Agric. Ecosyst. Environ. 2016, 232, 29–37. [Google Scholar] [CrossRef]
- Gu, B.; Zhang, L.; Van Dingenen, R.; Vienom, M.; Van Grinsven, H.J.; Zhang, X.; Chen, Y.; Wang, S.; Ren, C.; Rao, S.; et al. Abating ammonia is more cost-effective than nitrogen oxides for mitigating PM2.5 air pollution. Science 2021, 374, 758–762. [Google Scholar] [CrossRef] [PubMed]
- Bai, Z.H.; Lee, M.R.; Ledgard, L.; Ma, S.; Oenema, O.; Velthof, G.L.; Ma, W.Q.; Guo, M.C.; Zhao, Z.Q.; Wei, S.; et al. Global environmental costs of China’s thirst for milk. Glob. Chang. Biol. 2018, 24, 2198–2211. [Google Scholar] [CrossRef] [PubMed]
- Wattiaux, M.A.; Uddin, M.E.; Letelier, P.; Jackson, R.D.; Larson, R.A. Invited review: Emission and mitigation of greenhouse gases from dairy farms: The cow, the manure, and the field. Appl. Anim. Sci. 2019, 35, 238–254. [Google Scholar] [CrossRef]
- Velthof, G.L.; Van Bruggen, C.; Groenestein, C.M.; De Haan, B.J.; Hoogeveen, M.W.; Huijsmans, J.F.M. A model for inventory of ammonia emissions from agriculture in the Netherlands. Atmos. Environ. 2012, 46, 248–255. [Google Scholar] [CrossRef]
- Rotz, C.A.; Stout, R.C.; Holly, M.A.; Kleinman, P.J.A. Regional environmental assessment of dairy farms. J. Dairy Sci. 2020, 103, 3275–3288. [Google Scholar] [CrossRef] [PubMed] [Green Version]
- Dasarathy, S.; Mookerjee, R.P.; Rackayova, V.; Thrane, V.R.; Vairappan, B.; Ott, P.; Rose, C.F. Ammonia toxicity: From head to toe? Metab. Brain Dis. 2017, 32, 529–538. [Google Scholar] [CrossRef]
- Du, Y.; Ge, Y.; Ren, Y.; Fan, X.; Pan, K.; Lin, L.; Wu, X.; Min, Y.; Meyerson, L.A.; Heino, M.; et al. A global strategy to mitigate the environmental impact of China’s ruminant consumption boom. Nat. Commun. 2018, 9, 4133. [Google Scholar] [CrossRef] [PubMed] [Green Version]
- Heinzen, T. Recent developments in the quantification and regulation of air emissions from animal feeding operations. Curr. Environ. Health Rep. 2015, 2, 25–32. [Google Scholar] [CrossRef] [PubMed] [Green Version]
- Feilberg, A.; Hansen, M.J.; Liu, D.; Nyord, T. Contribution of livestock H2S to total sulfur emissions in a region with intensive animal production. Nat. Commun. 2017, 8, 1069. [Google Scholar] [CrossRef] [Green Version]
- Wu, C.; Yang, F.; Brancher, M.; Liu, J.; Qu, C.; Piringer, M.; Schauberger, G. Determination of ammonia and hydrogen sulfide emissions from a commercial dairy farm with an exercise yard and the health-related impact for residents. Environ. Sci. Pollut. Res. 2020, 27, 37684–37698. [Google Scholar] [CrossRef] [PubMed]
- Shi, Z.F.; Sun, X.Q.; Lu, Y.; Xi, L.; Zhao, X. Emissions of ammonia and hydrogen sulfide from typical dairy barns in central China and major factors influencing the emissions. Sci. Rep. 2019, 9, 13821. [Google Scholar] [CrossRef] [Green Version]
- Saha, C.K.; Ammon, C.; Berg, W.; Fiedler, M.; Loebsin, C.; Sanftleben, P.; Brunsch, R.; Amon, T. Seasonal and diel variations of ammonia and methane emissions from a naturally ventilated dairy building and the associated factors influencing emissions. Sci. Total Environ. 2014, 468–469, 53–62. [Google Scholar] [CrossRef]
- Mendes, L.B.; Pieters, J.G.; Snoek, D.; Ogink, N.W.M.; Demeyer, P. Reduction of ammonia emissions from dairy cattle cubicle houses via improved management-or design-based strategies: A modeling approach. Sci. Total Environ. 2017, 574, 520–531. [Google Scholar] [CrossRef]
- National Environmental Protection Agency. Air and Waste Gas Monitoring and Analysis Methods, 4th ed.; China Environmental Sciences Press: Beijing, China, 2011. [Google Scholar]
- CIGR. Working Group Report on: Heat and Moisture Production at Animal and House Level; Danish Institute of Agricultural Sciences (DIAS): Horsens, Denmark, 2002. [Google Scholar]
- Samer, M.; Berg, W.; Mueller, H.; Fiedler, M.; Glaeser, M.; Ammon, C.; Sanftleben, P.; Brunsch, R. Radioactive 85Kr and CO2 balance for ventilation rate measurements and gaseous emissions quantification through naturally ventilated barns. Trans. ASAE. 2011, 54, 1137–1148. [Google Scholar] [CrossRef]
- Samer, M.; Loebsin, C.; Fiedler, M.; Ammon, C.; Berg, W.; Sanftleben, P.; Brunsch, R. Heat balance and tracer gas technique for airflow rates measurement and gaseous emissions quantification in naturally ventilated livestock buildings. Energy Build. 2011, 43, 3718–3728. [Google Scholar] [CrossRef]
- Hao, C.; Pan, Y.; Zhang, Z.; Zeng, Y. Kinetic determination of urease activity in fresh pig feces and slurry and the effect on ammonia production at different conditions. Sustainability 2019, 11, 6396. [Google Scholar] [CrossRef] [Green Version]
- Dai, X.R.; Karring, H. A determination and comparison of urease activity in feces and fresh manure from pig and cattle in relation to ammonia production and pH changes. PLoS ONE 2014, 9, e110402. [Google Scholar] [CrossRef]
- Lambertz, C.; Sanker, C.; Gauly, M. Climatic effects on milk production traits and somatic cell score in lactating Holstein-Friesian cows in different housing systems. J. Dairy Sci. 2014, 97, 319–329. [Google Scholar] [CrossRef] [Green Version]
- GB/T 18407.5-2003; Safety Qualification for Agricultural Product—Environment Requirement for Origin of Non-Environmental Pollution Milk and Dairy Products. Northeast Agricultural University: Harbin, China, 2003. Available online: https://www.chinesestandard.net/PDF/English.aspx/GBT18407.5-2003 (accessed on 11 July 2023).
- David, B.; Mejdell, C.; Michel, V.; Lund, V.; Moe, R.O. Air quality in alternative housing systems may have an impact on laying hen welfare. part II-ammonia. Animals 2015, 5, 886–896. [Google Scholar] [CrossRef] [PubMed] [Green Version]
- Index of Chemical Names. 1988 OSHA PEL Project Documentation; The National Institute for Occupational Safety and Health (NIOSH): Washington, DC, USA, 1988. Available online: https://www.cdc.gov/niosh/pel88/npelname.html (accessed on 11 July 2023).
- Hristov, A. Technical note: Contribution of ammonia emitted from livestock to atmospheric fine particulate matter (PM2.5) in the United States. J. Dairy Sci. 2011, 94, 3130–3136. [Google Scholar] [CrossRef]
- Uddin, M.E.; Wattiaux, M. Effect of source and level of forage in the diet on in vitro ammonia emission from manure of Holstein and Jersey dairy cows. JDSC 2021, 2, 16–20. [Google Scholar] [CrossRef] [PubMed]
- FAO. Food and Agriculture Data. Available online: http://www.fao.org/faostat/en/#data/QL (accessed on 21 May 2021).
- Bougouin, A.; Leytem, A.; Dijkstra, J.; Dungan, R.S.; Kebreab, E. Nutritional and Environmental Effects on Ammonia Emissions from Dairy Cattle Housing: A Meta-Analysis. J. Environ. Qual. 2016, 45, 1123–1132. [Google Scholar] [CrossRef] [Green Version]
- Maasikmets, M.; Teinemaa, E.; Kaasik, A.; Kimmel, V. Measurement and analysis of ammonia, hydrogen sulphide and odour emissions from the cattle farming in Estonia. Biosyst. Eng. 2015, 139, 48–59. [Google Scholar] [CrossRef]
- Mazur, K.; Roman, K.; Wardal, W.J.; Borek, K.; Barwicki, J.; Kierończyk, M. Emission of harmful gases from animal production in Poland. Environ. Monit. Assess. 2021, 193, 341. [Google Scholar] [CrossRef]
- Hristov, A.; Hanigan, M.; Cole, A.; Todd, R.; Mcallister, T.; Ndegwa, P.; Rotz, A. Ammonia emissions from dairy farms and beef feedlots: A review. Can. J. Anim. Sci. 2011, 91, 1–35. [Google Scholar] [CrossRef] [Green Version]
- Rotz, C.A.; Stout, R.; Leytem, A.; Feyereisen, G.; Kleinman, P. Environmental assessment of united states dairy farms. J. Clean. Prod. 2021, 315, 128153. [Google Scholar] [CrossRef]
- Fu, H.; Luo, Z.; Hu, S. A temporal-spatial analysis and future trends of ammonia emissions in China. Sci. Total Env. 2020, 731, 138897. [Google Scholar] [CrossRef]
- Xu, P.; Koloutsou-vakakis, S.; Rood, M.J.; Luan, S. Projections of NH3 emissions from manure generated by livestock production in China to 2030 under six mitigation scenarios. Sci. Total Environ. 2017, 607, 78–86. [Google Scholar] [CrossRef] [PubMed]


| Environment Parameters 1 | Indoor | Outdoor | ||||||||
|---|---|---|---|---|---|---|---|---|---|---|
| Mean 2 | SD | CV/% | Min | Max | Mean 2 | SD | CV/% | Min | Max | |
| Temperature (°C) | 6.2 a | 3.3 | 78.6 | 2.6.5 | 12.1 | 2.1 b | 0.7 | 33.3 | −6.2 | 9.7 |
| Relative humidity (%) | 69.1 a | 6.9 | 14.4 | 58.0 | 79.5 | 50.2 b | 10.3 | 20.5 | 55.0 | 80.1 |
| Wind speed (m/s) | 1.36 b | 0.31 | 22.8 | 0.49 | 1.94 | 2.77 a | 1.01 | 36.5 | 1.25 | 3.90 |
| CO2 (mg/m3) | 509.0 a | 88.5 | 17.4 | 422.1 | 548.1 | 389.0 b | 44.5 | 11.4 | 350.7 | 431.1 |
| Air pressure (kPa) | 98.8 | 1.9 | 2.0 | 96.6 | 99.8 | 96.5 | 1.1 | 1.14 | 92.6 | 97.8 |
| TSP 3 (mg/m3) | 0.288 | 0.045 | 15.6 | 0.147 | 0.269 | 0.242 | 0.043 | 12.6 | 0.163 | 0.245 |
Disclaimer/Publisher’s Note: The statements, opinions and data contained in all publications are solely those of the individual author(s) and contributor(s) and not of MDPI and/or the editor(s). MDPI and/or the editor(s) disclaim responsibility for any injury to people or property resulting from any ideas, methods, instructions or products referred to in the content. |
© 2023 by the authors. Licensee MDPI, Basel, Switzerland. This article is an open access article distributed under the terms and conditions of the Creative Commons Attribution (CC BY) license (https://creativecommons.org/licenses/by/4.0/).
Share and Cite
Shi, Z.; Xi, L.; Zhao, X. Measurement of Ammonia and Hydrogen Sulfide Emission from Three Typical Dairy Barns and Estimation of Total Ammonia Emission for the Chinese Dairy Industry. Animals 2023, 13, 2301. https://doi.org/10.3390/ani13142301
Shi Z, Xi L, Zhao X. Measurement of Ammonia and Hydrogen Sulfide Emission from Three Typical Dairy Barns and Estimation of Total Ammonia Emission for the Chinese Dairy Industry. Animals. 2023; 13(14):2301. https://doi.org/10.3390/ani13142301
Chicago/Turabian StyleShi, Zhifang, Lei Xi, and Xin Zhao. 2023. "Measurement of Ammonia and Hydrogen Sulfide Emission from Three Typical Dairy Barns and Estimation of Total Ammonia Emission for the Chinese Dairy Industry" Animals 13, no. 14: 2301. https://doi.org/10.3390/ani13142301