
Characteristics and Traceability Analysis of Microbial Assemblage in Fine Particulate Matter from a Pig House
by
Miao Wang
1,2, 
Siyi Peng
1,2,
Dongru Liu
1,2,
Dingbiao Long
2,3,4,
Zuohua Liu
1,2,3 and
Shihua Pu
2,3,4,* 1
College of Animal Science and Technology, Southwest University, Chongqing 402460, China
2
Chongqing Academy of Animal Sciences, Changlong Avenue, Chongqing 402460, China
3
National Center of Technology Innovation for Pigs, Chongqing 402460, China
4
Scientific Observation and Experiment Station of Livestock Equipment Engineering in Southwest, Ministry of Agriculture and Rural Affairs, Chongqing 402460, China
*
Author to whom correspondence should be addressed.
Animals 2023, 13(6), 1058; https://doi.org/10.3390/ani13061058
Submission received: 12 February 2023
/
Revised: 12 March 2023
/
Accepted: 13 March 2023
/
Published: 15 March 2023
(This article belongs to the Section Pigs)
Abstract
:Simple Summary
Fine Particulate Matter (PM2.5) can severely harm human and animal health because it can carry many harmful microorganisms and enter the deep respiratory tract. Due to the high breeding density and poor ventilation in large-scale pig farms, the concentration of PM2.5 is higher indoors than outdoors. Therefore, it is very important to understand the composition of harmful microorganisms carried by PM2.5 in pig houses and trace their sources and interactions with the environment. This study first monitored the environment of a piggery, identified the species and abundance of pathogenic bacteria and allergens on the collected PM2.5 samples using high-throughput sequencing, then analyzed the interactions between microbial communities and between communities and environmental factors using network analysis, and finally, used the SourceTracker tool to predict the microbial traceability of PM2.5. The results showed that the contribution of feces to producing airborne microorganisms was much higher than that of feed.
Abstract
Fine particulate matter (PM2.5) can carry numerous substances and penetrate deep into the respiratory tract due to its small particle size; associated harmful microorganisms are suspected to increase health risks for humans and animals. To find out the microbial compositions of PM2.5 in piggeries, their interaction and traceability, we collected PM2.5 samples from a piggery while continuously monitoring the environmental indicators. We also identified pathogenic bacteria and allergens in the samples using high-throughput sequencing technology. We analyzed the microbial differences of PM2.5 samples at different heights and during different times of day and investigated the microbial dynamics among the PM2.5 samples. To better understand the interaction between microorganisms and environmental factors among different microbial communities, we applied the network analysis method to identify the correlation among various variables. Finally, SourceTracker, a commonly used microbial traceability tool, was used to predict the source of airborne microorganisms in the pig house. We identified 14 potential pathogenic bacteria and 5 allergens from PM2.5 in the pig houses, of which Acinetobacter was the dominant bacterium in all samples (relative abundance > 1%), which warrants attention. We found that bacteria and fungi directly affected the the microbial community. The bacterial community mainly played a positive role in the microbial community. Environmental variables mainly indirectly and positively affected microbial abundance. In the SourceTracker analysis using fecal matter and feed as sources and PM2.5 sample as sink, we found that fecal matter made the greatest contribution to both bacterial and fungal components of PM2.5. Our findings provide important insights into the potential risks of pathogens in PM2.5 to human and animal health and their main sources.
1. Introduction
Intensive pig production leads to high density concentrations of particulate matter (PM) in pig houses, resulting in a high incidence of respiratory diseases in pigs and posting serious health risks to pig farm workers [1,2]. Fine particulate matter (PM2.5) with a small particle size and a large specific surface area, can easily adsorb and carry harmful substances, and enter the alveoli [3,4]. The threat of PM2.5 to public health has attracted worldwide attention [5]. As one of the primary agricultural sources, PM2.5 in pig farms has a high concentration and complex components, making it a major threat to pig welfare and the health of pig farm workers.
PM2.5 in piggeries is significantly different from that in the atmospheric environment, with a high proportion of microorganisms originating from biological sources. Previous studies have reported high concentrations of airborne microorganisms and their derivatives in farms, including potential pathogenic bacteria, allergens and endotoxins [6]. These substances are harmful to humans and pigs, indicating that the threat of PM2.5 to public health in farms may be aggravated by microbial components. In recent years, the rapid development of high-throughput technology has enabled many researchers to explore the changes in microbial composition in the environment by species and their abundance, through DNA sequencing [7,8]. It has been recognized that the abundance and composition of airborne microorganisms are affected by many factors, including environmental variables (temperature, relative humidity, ventilation, etc.), sources, seasonal changes, and human or animal activities, etc. [9,10]. For example, a relatively high temperature is the primary condition for bacterial growth, while low temperature is a limiting factor [11]. It should be emphasized that differences in the structure of airborne microbial communities may alter the proportion and activity of toxicogenic components within them, with consequent changes in the impact on animal and human health [12]. Therefore, a thorough understanding of the relationship between environmental factors and airborne microorganisms is of great importance in assessing their health risks and developing scientific control strategies.
Previous studies have focused on the relationship between airborne microorganisms and the environment in farms mainly based on seasonal differences [13,14]. However, the density, number and growth stage of animals in breeding houses can vary significantly over such a long period, potentially affecting analysis results. Therefore, a quarterly monitoring analysis is also worth exploring. Additionally, although some previous studies have identified PM2.5 sources in farms, such as feed, dander, feces, urine, bedding, and skin, the contribution of each source remains unclear [15]. Therefore, paying attention to the dynamic changes of airborne microorganisms in pig houses in the short term and quantitatively analyzing their sources may play a positive role in improving the environment of pig houses.
In this study, environmental parameters in the pig house were monitored in the spring season, while different PM2.5 samples were collected at different heights and times of the day. Through DNA sequencing techniques, the potential pathogenic bacteria and allergens were identified, and the interactions between bacterial, fungal and environmental variables were explored by network analysis. On this basis, the source of bacteria and fungi was analyzed using the SourceTracker method. Our findings can provide reference for the environmental regulation of farms.
2. Materials and Methods
2.1. Pig House Management and Environmental Information Collection
In this study, a fattening pig house in Rongchang District of Chongqing City was selected for environmental monitoring and analysis. The pig house had dimensions of 37.35 × 11.66 × 3.30 m (length × width × height), with each fence measuring 4.15 × 5.24 m long and featuring a leaky floor (4.15 × 1.18 m). In the pig house, a total of 110 pigs, weighing 70 to 90 kg each, were evenly distributed in 12 pig pens. Additional information on the structure, ventilation system, feeding and management of the pig house can be found in Pu et al. [16]. From 10 April to 25 April 2022, environmental data were monitored and samples of indoor environment were collected. The breeders feed pigs at 8:30 a.m. and 3:00 p.m. every day and cleaned the house. Temperature and relative humidity were monitored every 5 min using HOBO (U23-001, Onset, Bourne, MA, USA) and recorded. The PM2.5 concentration was measured using the ‘weighing method’ during the day (7:30–19:30) and night (19:30–7:30). The monitoring points for the above indicators were located at 1.7 m and 0.6 m in the middle of the piggery channel. In addition, the ventilation rate in the pig house was automatically recorded after being adjusted by the animal husbandry building ventilation environment controller (TC1208, Chongqing Metea Electronic Technology Co., Ltd., Chongqing, China).
2.2. Sample Collection and Processing
PM2.5 samples were collected using a quartz fiber filter (MK360, 90 mm) and an environmental particle collector (2030 medium flow intelligent TSP sampler, Qingdao Laoying Environmental Technology Co., Ltd., Qingdao, China). The sampler was placed at a height of 1.7 m and 0.6 m in the middle of the aisle in the pig house. The flow rate of the collector was set to 100 L·min−1 for 12 h of continuous sampling. Pretreated filter membranes were placed in the cutting head of the collector and were replaced twice a day at 7–8 am and 19:00–20:00 pm to obtain PM2.5 samples corresponding to daytime and nighttime. Feed (Chongqing Huiguang Company, Chongqing, China, 930 model) and fresh pig feces were also collected every other day when the filter membrane was replaced. The collected samples of PM2.5, feed and feces were immediately placed in an ice box and sent to the laboratory −80 °C freezer as soon as possible for subsequent analysis.
The collected quartz membrane samples were divided into four categories based on altitude and time of day (High altitude during the day, Low altitude during the day, High altitude at night and Low altitude at night). Ten membranes were randomly selected from each category and processed together using the following procedure. First, the membranes were cut into 1 cm2 pieces and placed in a sterilized 250 mL beaker. Then, 150 mL of high purity water (18.2 MΩ) was added. The beaker was sealed with a sterile membrane and placed in a sterile beaker for ultrasonic oscillation for 60 min. Next, the liquid was filtered by using a 0.2 μm membrane (width 50 mm, Tianjin Jinteng Experimental Equipment Co., Ltd., Tianjin, China). The filtered liquid was analyzed for ammonium ion (NH4+) and nitrate ion (NO3−) content in the solution by a spectrophotometry-based hash instrument (DR6000, Hach, Loveland, CO, USA). The filtered microporous membranes were collected for subsequent microbial sequencing.
2.3. DNA Extraction, High-Throughput Sequencing and Data Processing
The collected PM2.5 samples were grouped and mixed based on height and time of day (i.e., day and night); thus, four types of PM2.5 samples were obtained. Bacterial and fungal component analysis was performed on each sample, which was repeated three times. At the same time, feed and feces samples were also analyzed for microbial composition for traceability comparison. The names of each corresponding sample are shown in Table 1.
First, the total DNA in each sample was extracted by using Biomarker Soil Genomic DNA Kit (RK02005). Then, the bacterial and fungal genes of the samples were amplified in the following two ways. Bacteria primer information was: F: ACTCCTACGGGAGGCAGCA and R: GGACTACHVGGGTWTCTAAT. The PCR amplification program was 95 °C for 5 min, then 30 cycles of 95 °C for 30 s, 50 °C for 30 s, 72 °C for 60 s, and finally extended at 72 °C for 5 min. Fungal primer information was: F: CTTGGTCATTTAGAGGAAGTAA; R:GCTGCGTTCTTCATCGATGC. The PCR amplification program was run at 95 °C for 5 min, followed by 35 cycles of 95 °C, 50 °C and 72 °C (all for 1 min, and finally extended at 72 °C for 7 min).
The amplified products were purified, quantified and homogenized to creat a sequencing library. Firstly, the quality control of the constructed library was carried out, and the qualified library was sequenced on the Illumina HiSeq 2500 platform. After base call analysis, the original image data file was converted into the original sequencing readings, and the results were stored in the FASTQ file format, containing sequence information (Reads) and corresponding sequencing quality information. Sequence processing includes several steps, including using Trimmomatic v0.33 software to filter the quality of the original readings obtained by sequencing, and then using Cutadapt 1.9.1 software to identify and remove primer sequences to obtain clean readings without primer sequences. Then, the paired sequences were spliced by Usearch v10 software, the clean readings of each sample were spliced by overlap, and the spliced data were filtered according to the length range of different regions. Finally, the chimeric sequence was removed by UCHIME v4.2 software to obtain the final valid data.
2.4. Sequence Processing and Bioinformatics Analysis
QIIME software was used to process 16S and ITS1 gene sequences. After low-quality sequences and chimeras were filtered, the effective sequences of bacteria and fungi were normalized to compare the same sequencing depth of all PM2.5 samples. Usearch software was used to cluster Reads at a similarity level of 97.0% to obtain operational taxonomic units (OTUs). The Silva database was used as a reference database to use the naive Bayesian classifier combined with the alignment method to perform taxonomic annotations on the feature sequence to obtain the species classification information corresponding to each feature. Sample community composition at each species classification level was then counted. The ACE index was used to measure species abundance, and Shannon index was used to measure species diversity. Principal coordinate analysis (PCoA) was used to analyze the differences among different types of samples. Analysis of similarities (Anosim) was further used to test for differences in beta diversity. Biomarkers of the microbial taxa were analyzed using the linear discriminant analysis (LDA) effect size (LEfSe) analysis with a threshold of 4 for LDA. Network analysis was used to explore the interactions among bacteria, fungi, and environment. Firstly, the Spearman correlation analysis of environmental parameters, bacteria and fungi within and between groups was performed using R language (4.2.1 edition) to obtain the correlation matrix. The p value was corrected for the false positive rate. The correlation matrices with correlation coefficients r ≥ 0.7 and r ≤ −0.7 at the p < 0.01 level are defined as strong positive and negative interactions, respectively. Gephi software (version 0.9) was used to visualize the interaction among bacterial, fungal, and environmental parameters, and to obtain network topology properties.
2.5. Microbial Traceability
This study employed SourceTracker to analyze the microbial composition of PM2.5. As a classic microbial traceability tool based on Bayesian algorithm, it has been widely used in medical and health care, soil environment and other fields [17,18]. Here, bacteria and fungi from PM2.5 samples were considered as “sinks” for traceability, while bacteria and fungi from feed and fecal samples were considered as ‘sources’. Categorical units that cannot be mapped to the input source were classified as ‘unknown’. In the R language (version 4.2.1), the Source Tracker operating parameters were sparse depth 1000, pre-simulation run 100, restart 10, alpha 0.001, beta 0.01, with high sensitivity, specificity and accuracy.
2.6. Statistical Analysis
Conventional statistical data were analyzed using the social science statistical software package (SPSS 26.0, Chicago, IL, USA). GraphPad Prism Version 9 software (GraphPad, San Diego, CA, USA) was used for mapping. For normally distributed data, we performed the unpaired t test, while for non-normal distributions, we used the non-parametric test (Mann–Whitney U test). Data were expressed as mean ± standard error (SD). p value less than 0.05 was considered significant. The Relative Standard Deviation (RSD) was obtained by calculating the ratio of the standard deviation to the average predicted value. The purpose of using RSD value was to determine the consistency of the results when applying the default SourceTracker settings, as the variability of SourceTracker when running the model can raise concerns about the accuracy of the prediction results.
3. Results
3.1. Environment Variables
The environmental variables in the pig house have obvious diurnal variation characteristics (Table 2). Specifically, PM2.5 concentration, ventilation rate and temperature were significantly higher during the day than at night (p < 0.05). The concentration of PM2.5 fluctuated from 22.91 to 95.61 μg·m−3. Both by day and at night, the concentration of PM2.5 were significantly higher at a height of 1.7 m than that at 0.6 m (p < 0.05). The ventilation rate ranged from 6.4 to 47 m³·h−1, and low ventilation was maintained at night. Temperature and humidity fluctuated between 12.31–25.18 and 40.06–88.43%, respectively. The humidity was significantly higher at night than during the day (p < 0.05). In addition, the contents of water-soluble ions NH4+ and NO3− in PM2.5 were 2.07–5.14 μg∙m−3 and 0.61–1.31 μg∙m−3, respectively. Their concentrations in daytime samples were significantly higher than those at night (p < 0.05).
3.2. Bacterial and Fungal Community Diversity
Based on the Good’s coverage value (>97%), the sequences generated by Illumina sequencing captured most of the bacteria and fungi in the feed, PM2.5, and feces samples. While some differences in microbial diversity were observed among samples, abundance (ACE) and diversity (Shannon) of bacteria were significantly higher than those of fungi (Table 3).
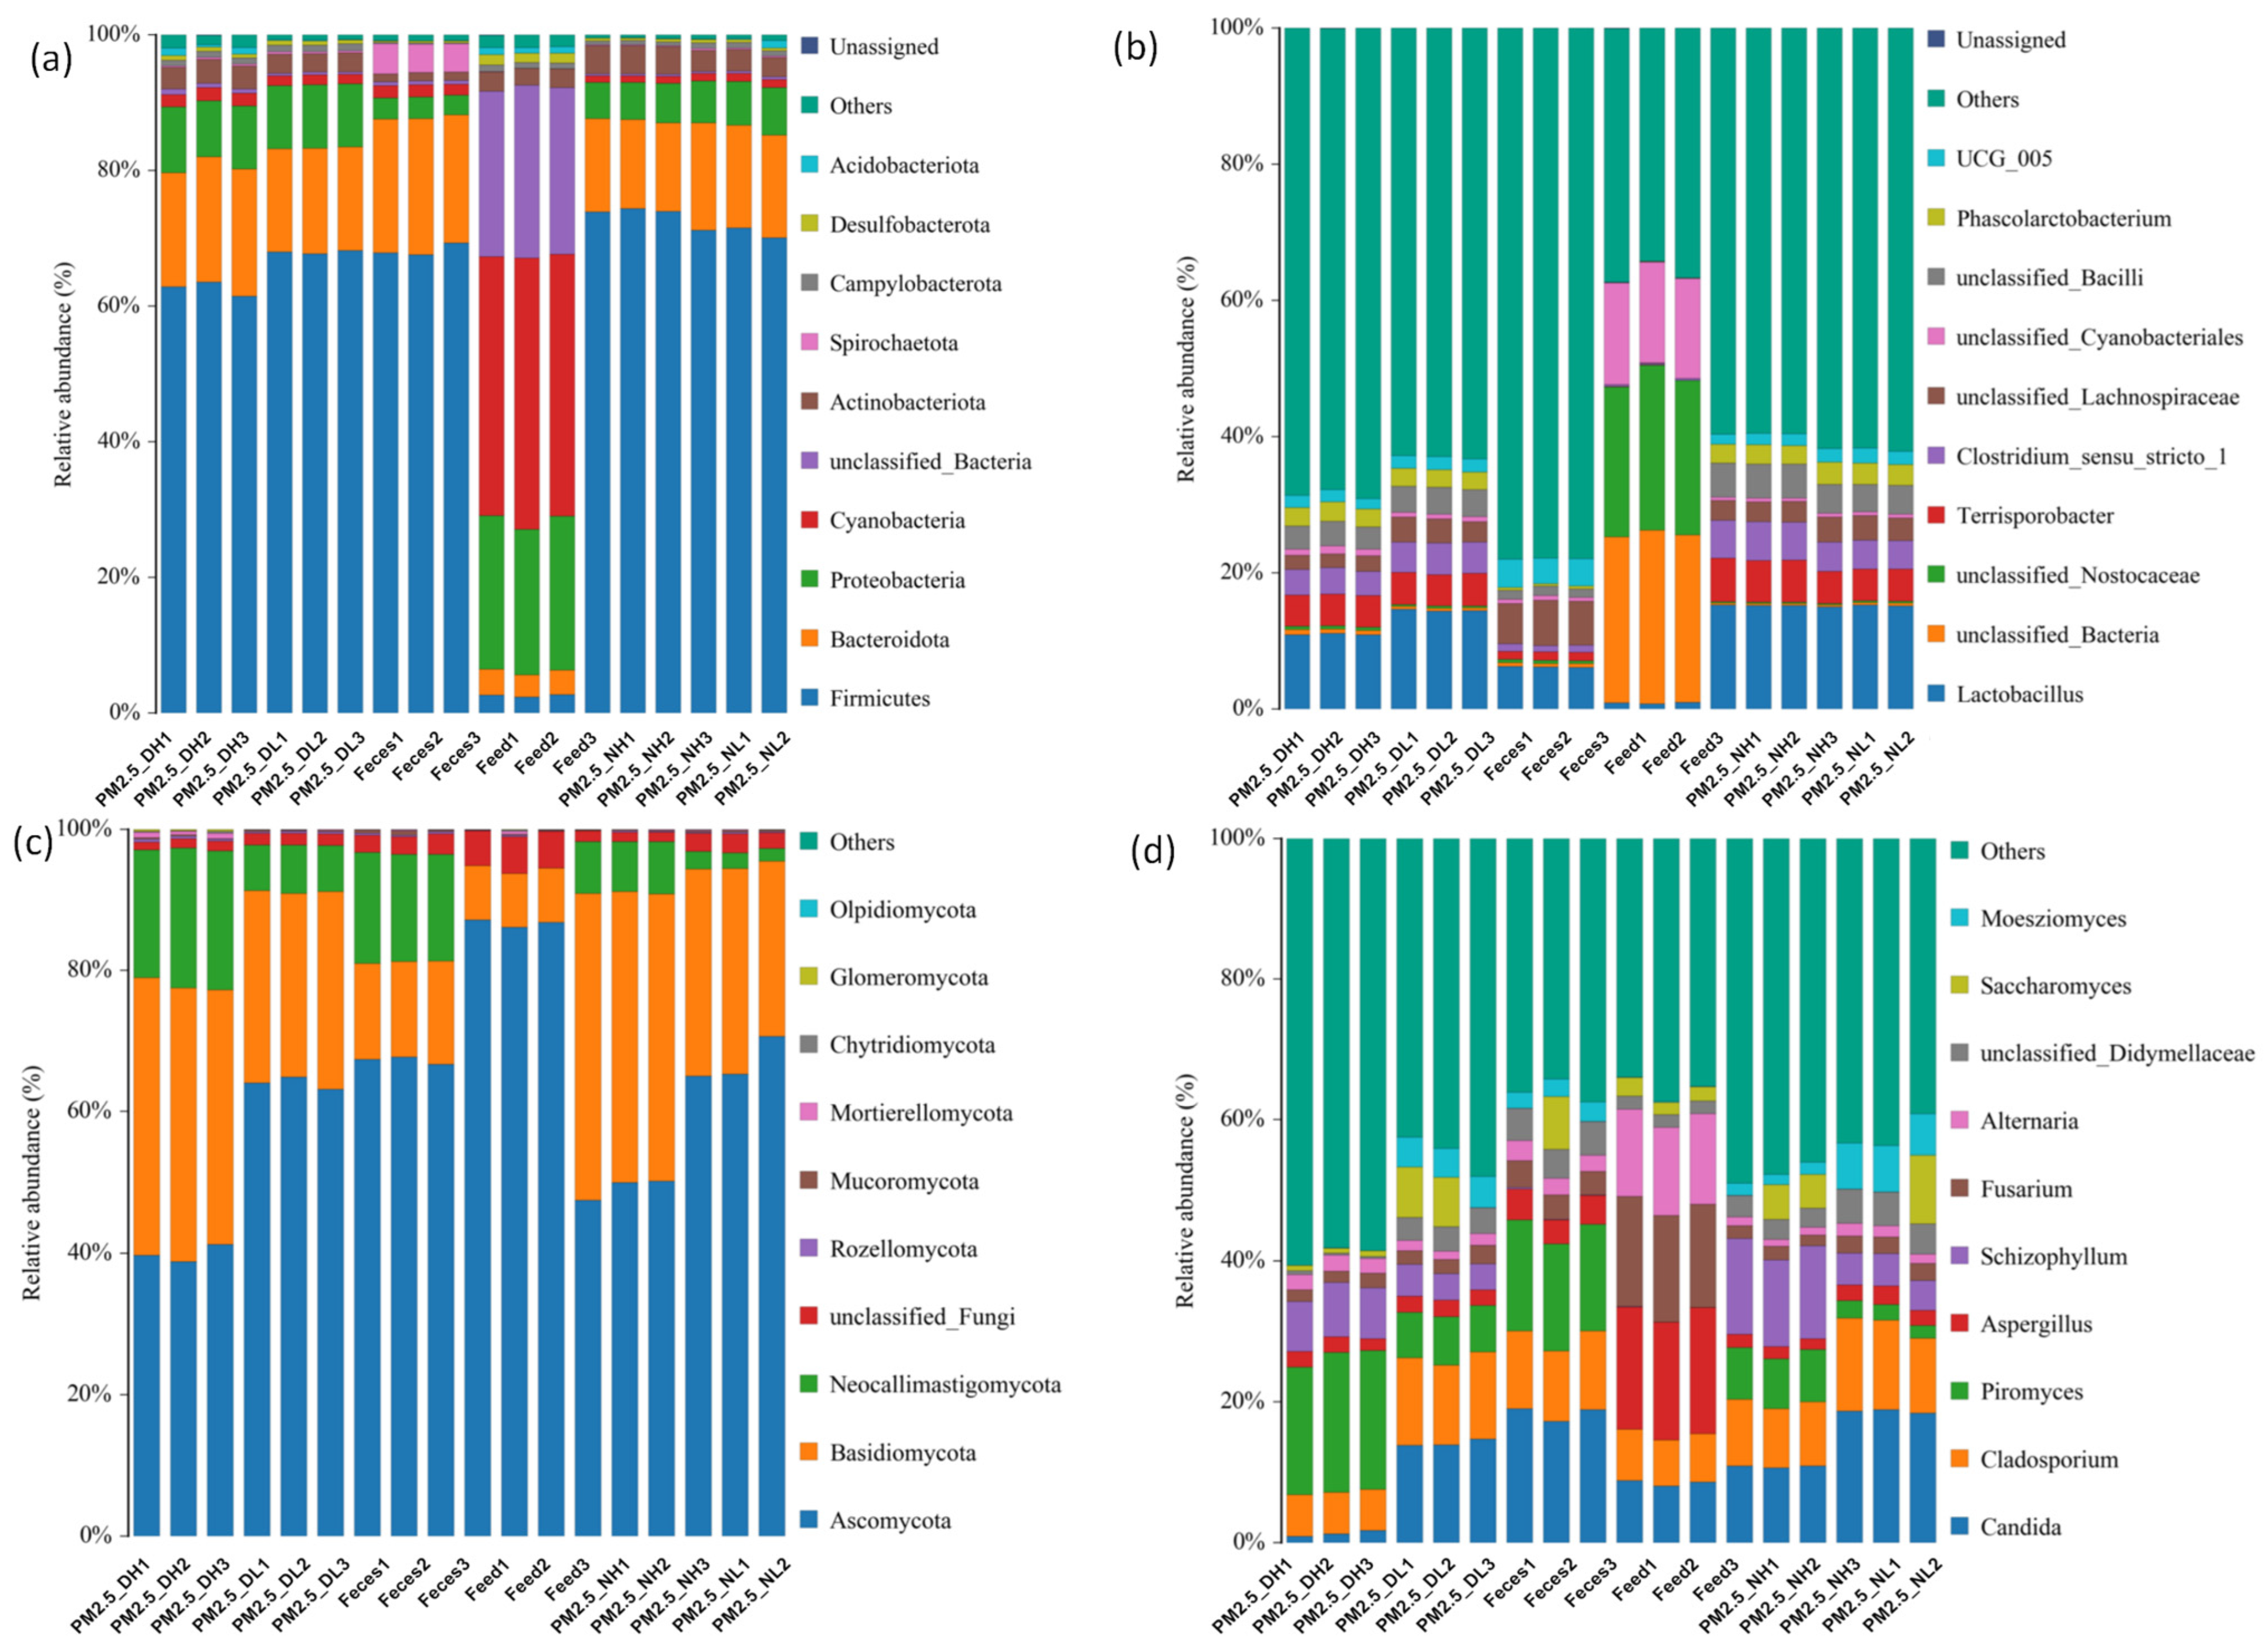
At the phylum level, feces and PM2.5 samples had similar bacterial compositions (Figure 1a), mainly composed of Firmicutes (61.45–74.41%), followed by Bacteroidota (13.07–18.44%) and Proteobacteria (5.32–9.73%). The bacterial composition of the feed was very different from PM2.5 at the phylum level. It was mainly composed of Cyanobacteria (38.18–39.97%), followed by Proteobacteria (21.47–22.69%). The relative abundance of Firmicutes and Bacteroidota in feed bacteria were less than 5 %. In terms of fungal composition (Figure 1c), Ascomycota (38.73–87.16%) had the highest relative abundance in all samples, followed by Basidiomycota (7.64–43.37%). Neocallimastigomycota accounted for 1.83–19.73% in PM2.5 and feces samples, but was not detected in feed.
At the genus level, Lactobacillus had the highest relative abundance of bacteria in PM2.5 and feces samples (6.09–15.25%), while it was less than 1% in feed (Figure 1b). In terms of fungi, although the top ten abundances of fungi were consistent among different groups of PM2.5, there were some differences in relative abundance (Figure 1d). Candida accounted for only 0.94–1.25% of PM2.5 samples collected at 1.7 m during the day, while the relative abundance of Candida in other PM2.5 samples ranged from 10.88% to 19.04%. Piromyces (1.83–19.84%) and Schizophyllum (3.7–13.61%) also varied greatly among PM2.5 samples. Schizophyllum was detected in feces, and other fungus of which were close to those in PM2.5. The main bacteria in the feed were Fusarium (14.67–15.61%), Aspergillus (16.72–17.87%) and Alternaria (12.31–12.75%), containing some Candida (8.04–8.85%) and Cladosporium (6.54–7.24%).
3.3. Microbial Dynamics in PM2.5
Figure 2 shows that the confidence ellipses of bacteria (Figure 2a) and fungi (Figure 2c) in different groups are separated, indicating differences in the composition of bacteria and fungi in PM2.5 samples under the four groups. LEfSe analysis further identified the marker microorganisms in each group. Bacteroides and Lactobacillus were identified only at high and low altitude during the day, respectively. Their relative abundance in the corresponding group samples was significantly different from that of other groups, and their evolutionary relationship from order to species level bacteria can show differences (Figure 2b). Compared with bacteria, more marker fungi were identified (Figure 2d). The LDA value of Piromyces was the highest at high altitude during the day, followed by Apiotrichum, Cutaneotrichosporon, Debaryomyces and Botryotinia. Moesziomyces, Candida and Cladosporium were identified at low altitude at night, and Schizophyllum was identified at high altitude at night.
3.4. Identification of Harmful Microorganisms in PM2.5 and Network Interactions among Microorganisms
BugBase phenotype prediction identified 14 potential pathogenic bacterial genera in PM2.5 samples (Table 4), with a total relative abundance between 12.01% and 13.82%. The distribution of different bacterial genera in different types of PM2.5 was different. Among them, Acinetobacter had the greatest potential hazard and were the dominant bacteria in all samples (relative abundance >1%), while their relative abundance was not significantly different among various PM2.5 samples. The potential hazards of Bacteroides and Staphylococcus were slightly weaker than Acinetobacter, but they were also common opportunistic pathogens. Bacteroides was significantly higher in PM2.5 samples at high altitude during the day than in other categories, and Staphylococcus was significantly higher in PM2.5 samples at high altitude at night than in other categories (p < 0.05). In addition, referring to 123 fungal allergens published by Birgit et al. [19], 5 fungal allergens were found in PM2.5 samples (Table 5). Aspergillus was a potentially harmful bacterium, which was significantly lower than other environments at night, while the total abundance of potential allergens in this type of samples was the highest.
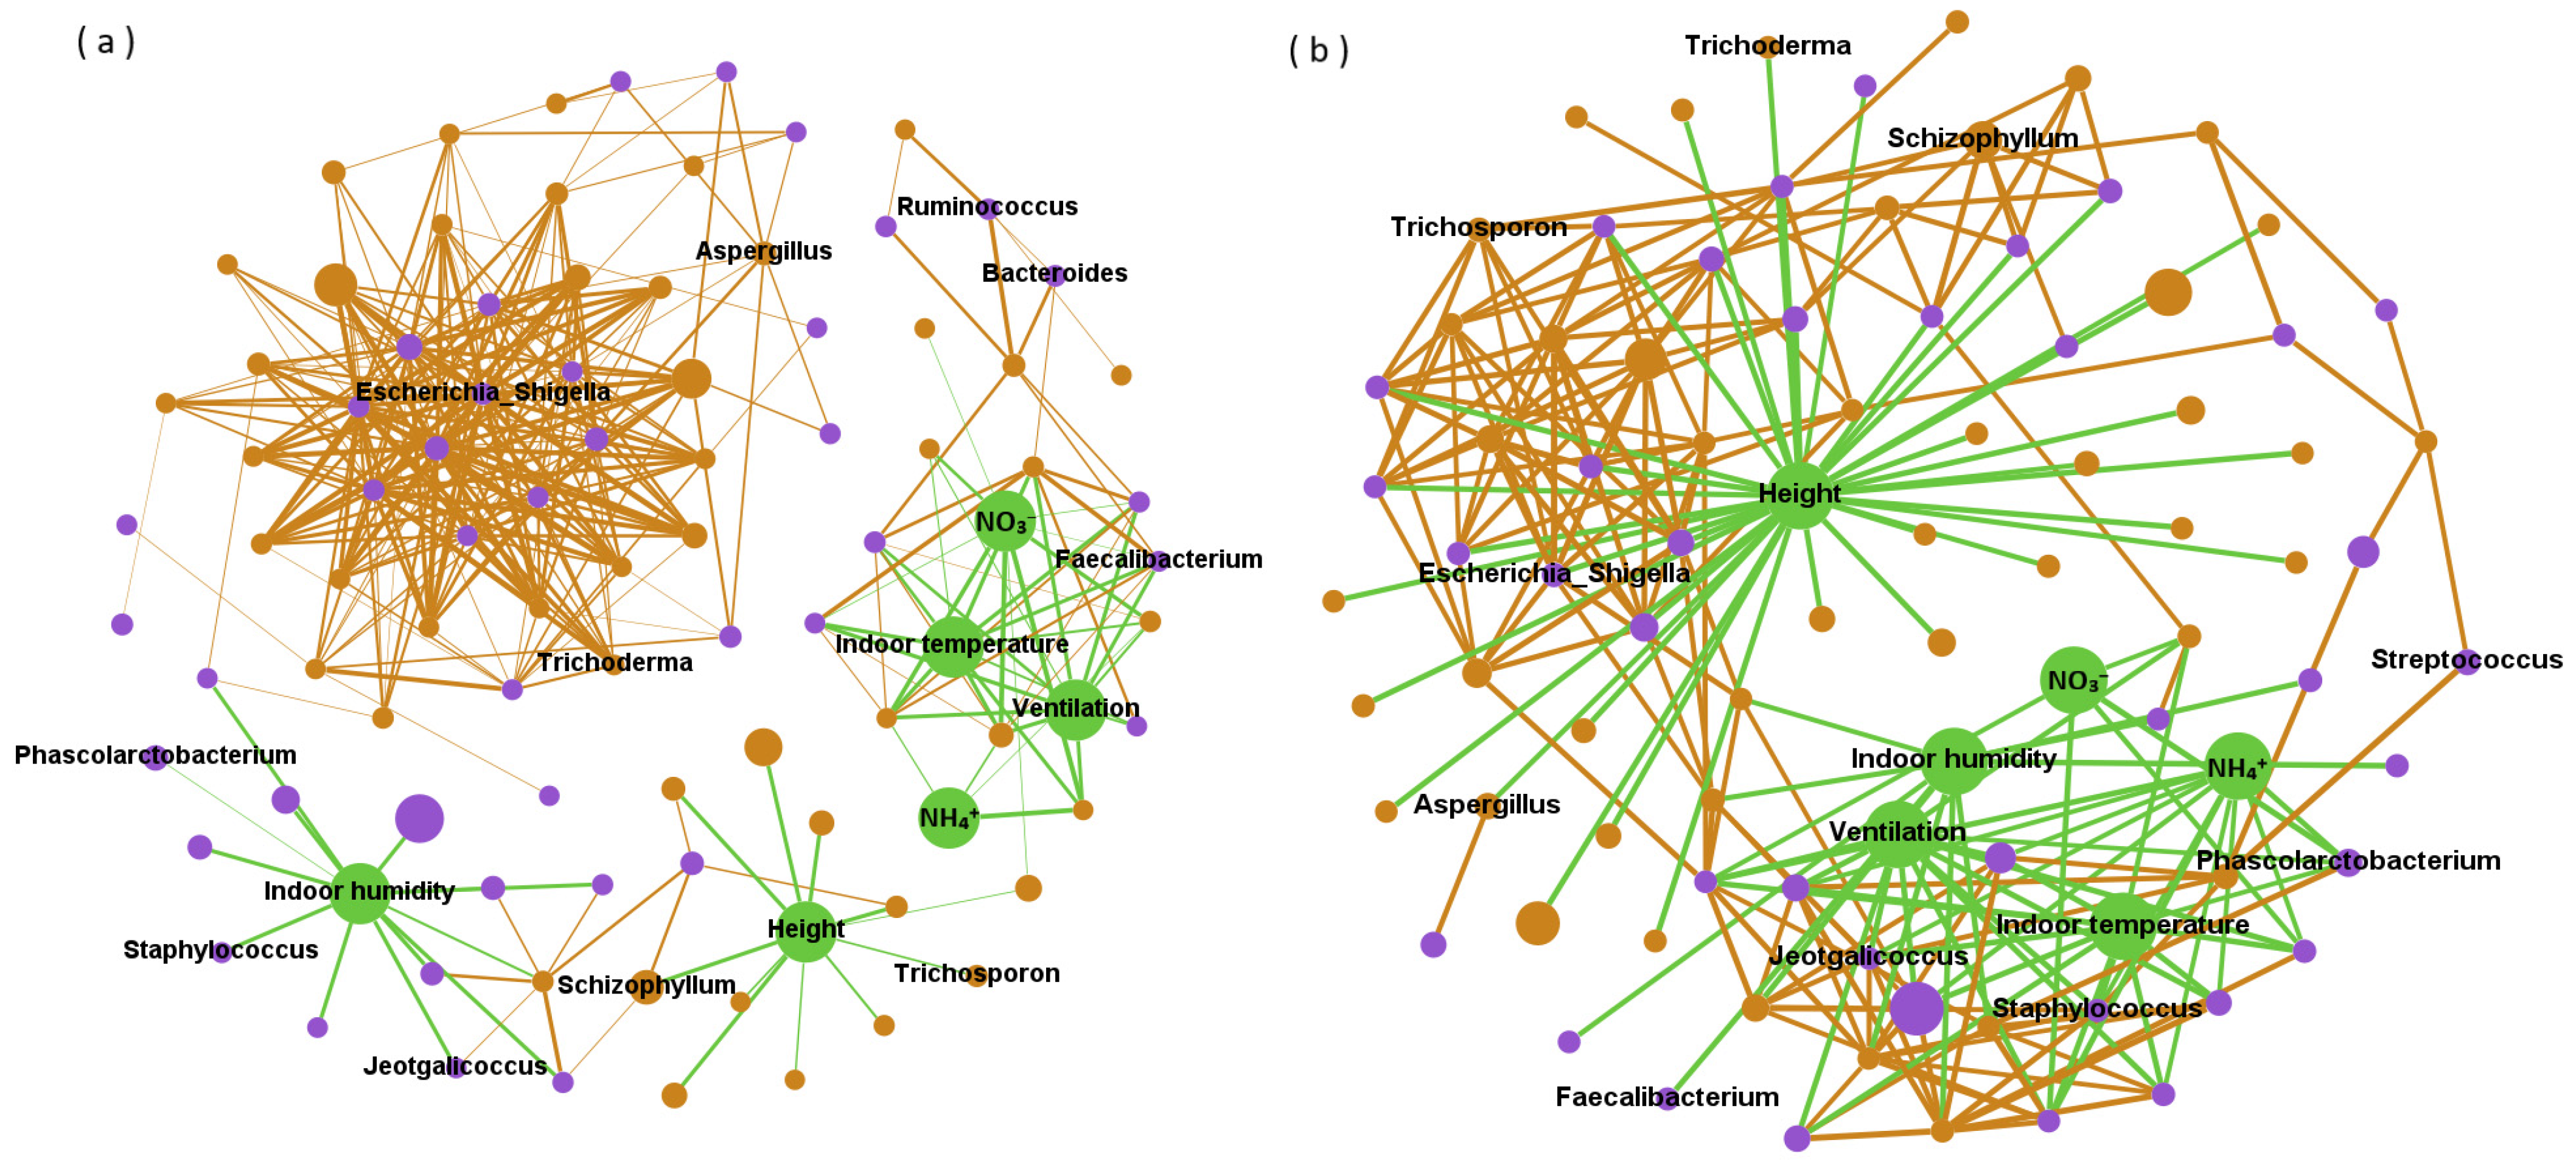
Network analysis revealed network interactions among bacteria, fungi, and environmental variables (Figure 3), and used the degree and betweenness centrality in the network structure to indicate the direct and indirect impacts on microbial abundance, respectively. Bacteria mainly played a positive role in the network structure. Among them, ten kinds of bacteria such as Escherichia_Shigella, Prevotellaceae_NK3B31_group and Coprococcus can directly had a positive impact on the abundance of more than sixteen microorganisms (degree ≥ 16). Environmental variables mainly indirectly positively affected microbial abundance. In this study, the betweenness centrality values of Indoor humidity, Height and NO3− in the network structure were all higher than 1500 (with an average of 222). In terms of negative correlation, Height, Indoor temperature and Ventilationd were environmental parameters that directly negatively affected multiple microorganisms (the degrees were 38, 13 and 13, respectively). Fungi Epicoccum, Debaryomyces and Piromyces can also have a direct negative impact on a variety of microorganisms, and their degree values were 11. In addition, the indirect negative correlation between height and microbial abundance was stronger than other factors. The betweenness centrality value of height in the negative correlation network was 2081, while that of Campylobacter was only 620.
3.5. Traceability Analysis
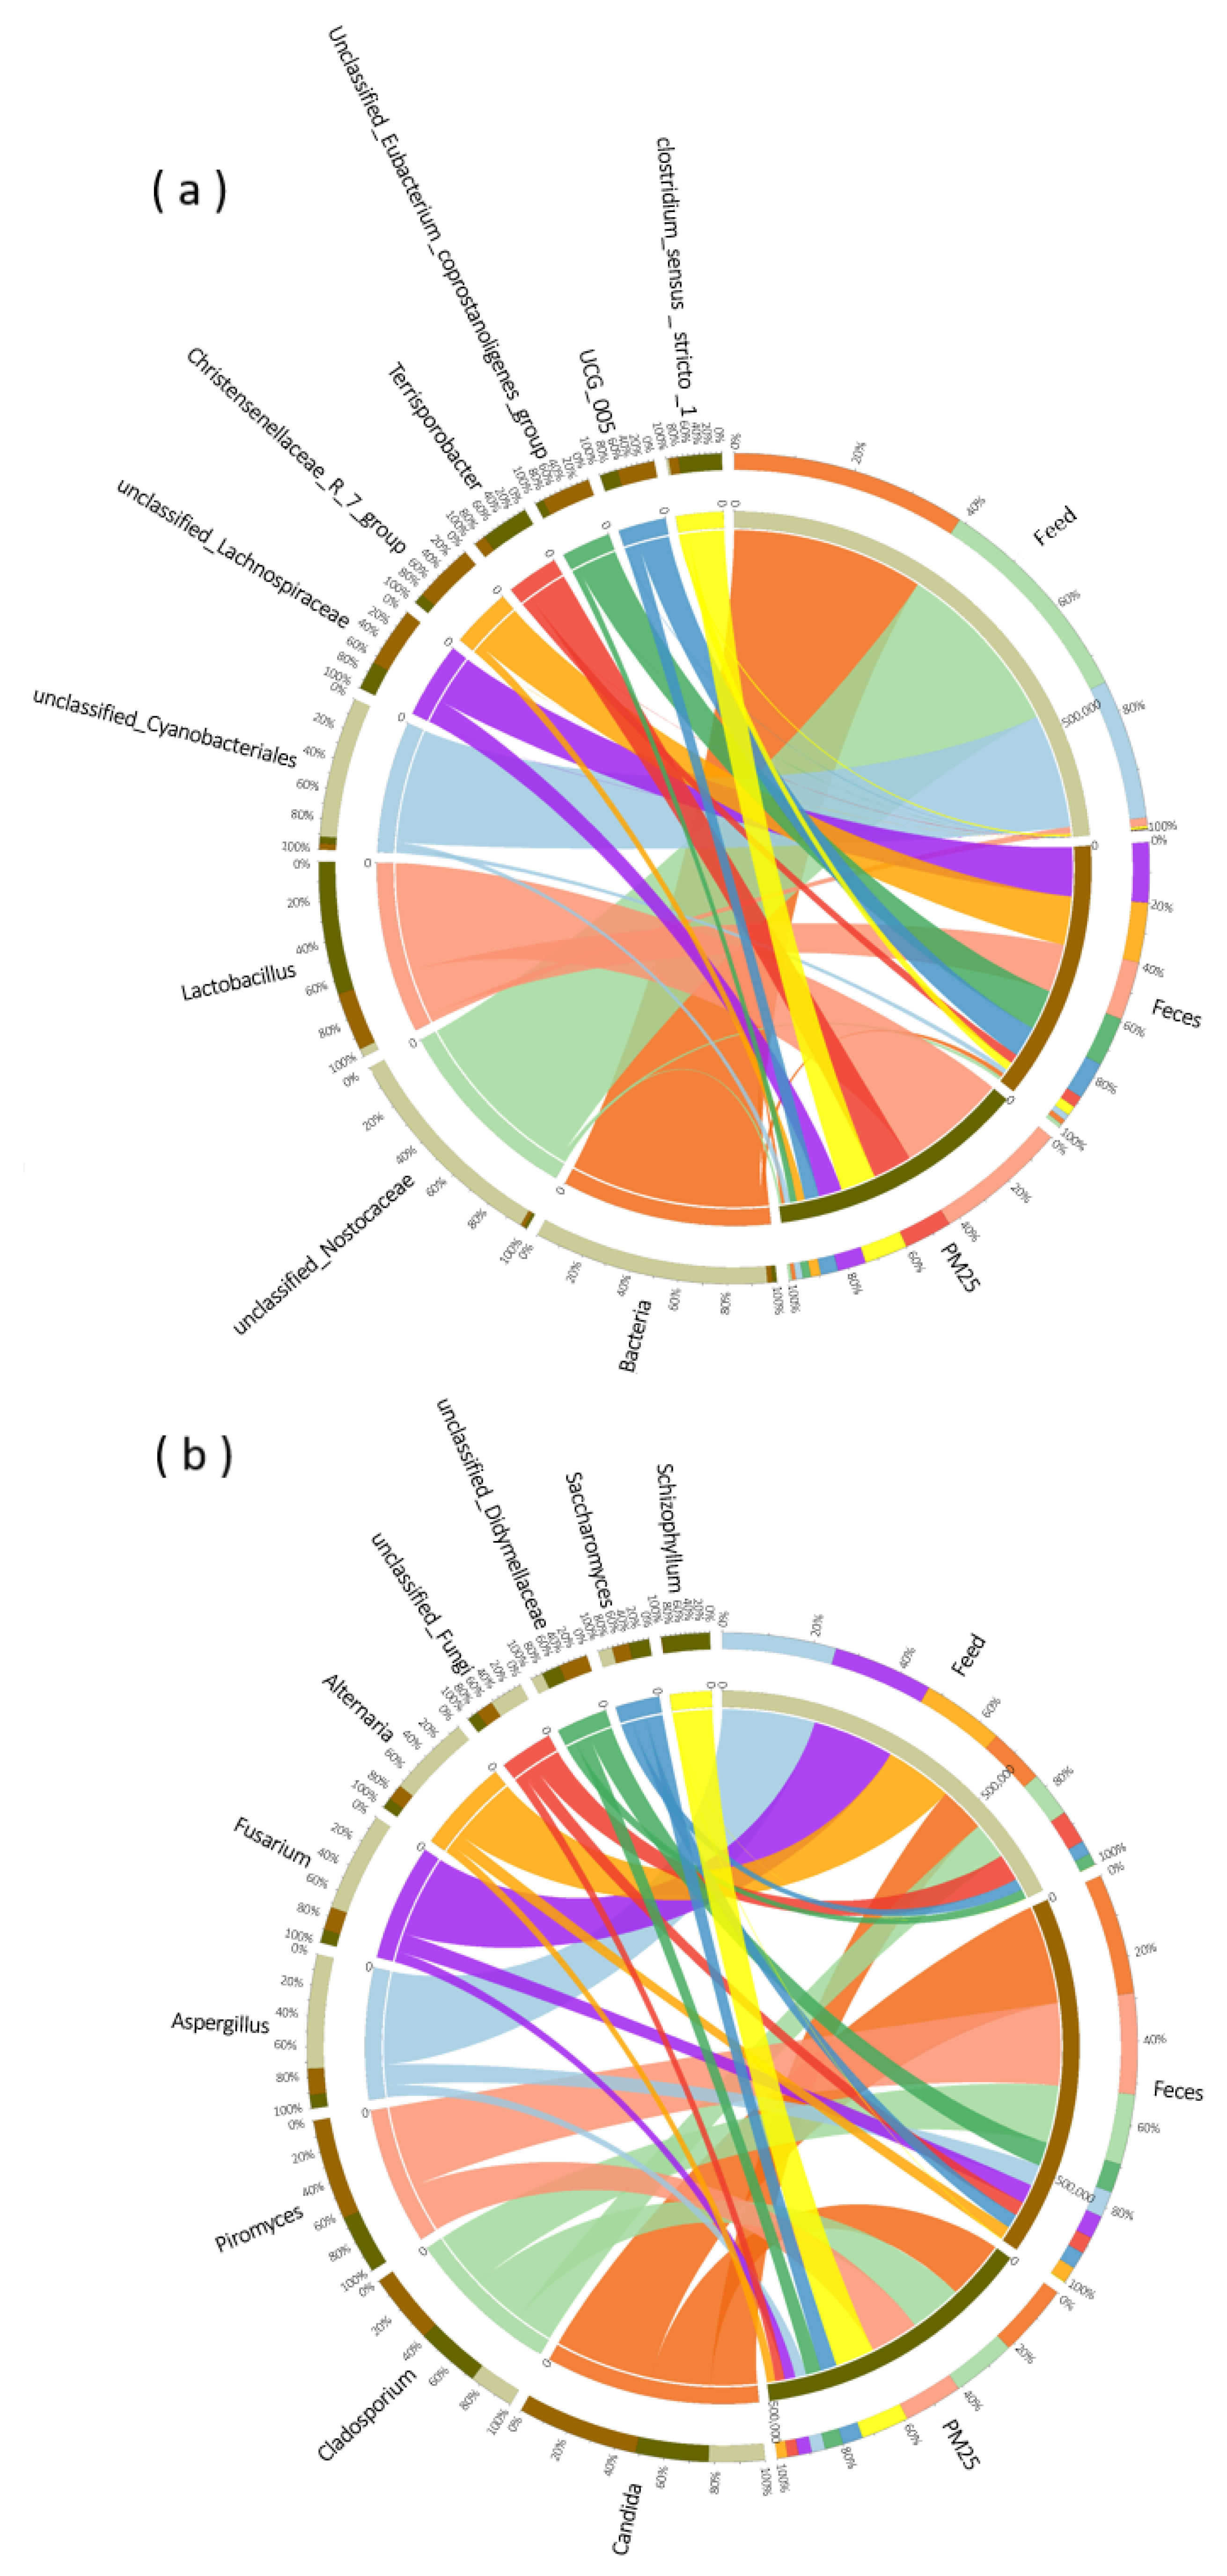
The composition of the top ten dominant bacteria and fungi in feed, feces and PM2.5 samples were compared (Figure 4). In both in PM2.5 and feces, Lactobacillus, Terrisporobacter, Clostridium_sensu_stricto_1, unclassified_Lachnospiraceae and UCG_005 were the main dominant bacteria. There was only a small amount of Lactobacillus and Clostridium_sensu_stricto_1 in feed, with the majority being unclassified _ Nostocaceae and unclassified_Cyanobacteriales. In terms of dominant fungi, only the relative abundance of Schizophyllum differed significantly between the PM2.5 and feces samples, with the other dominant fungi being close in species and abundance. The dominant fungi in feed were also present in PM2.5, although there was a large difference in relative abundance.
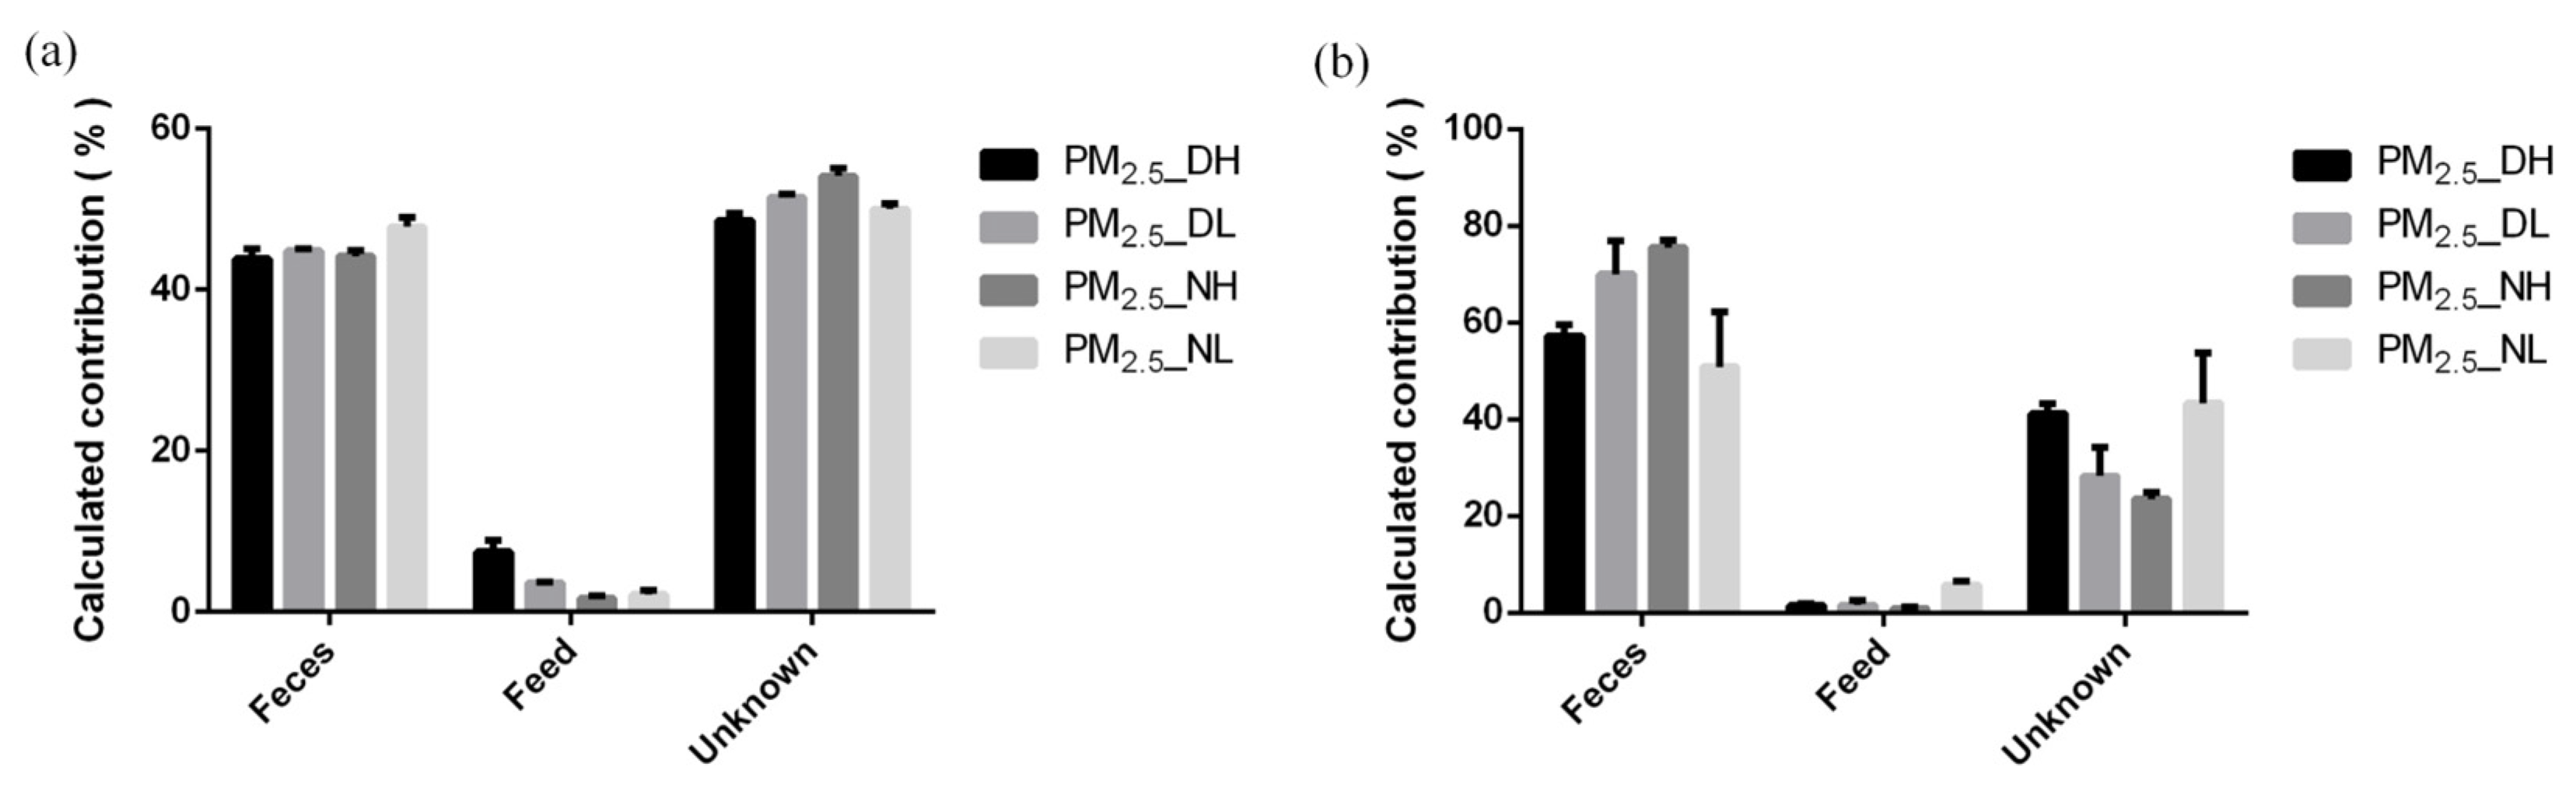
SourceTracker calculation results showed that manure in the pig house was the primary source of airborne microorganisms, while feed contributed little (Figure 5). In this experiment, the contribution of feces to airborne bacteria ranged from 42.77% to 49.07%, while the contribution of feed was only 1.44–8.69%. Moreover, the contribution of feces to airborne fungi was from 43.53–75.23%, and the contribution of feed was 0.59–6.40%. After five SourceTracker runs, it was observed that the fecal source and the feed source of PM2.5 samples, both collected at 1.7 m at night, had a lower RSD value and a higher RSD value, respectively (Table 6).
4. Discussion
4.1. Environmental Variables inside the Pig House
The PM2.5 concentrations in this experiment were close to those reported in previous studies [20] and exceeded the limit of 35 μg·m−3 in the Ambient Air Quality Standard (GB3095-2012) issued by the Ministry of Environmental Protection in China. During the spring season, because the pig house had a low density of pigs and a ventilation level ranging from 6.4 to 47.0 m3·h−1, PM2.5 concentrations close to 200 were not reached, as reported by Shang et al. [21]. However, it should be noted that the latest PM2.5 limit proposed by the World Health Organization (WHO) has been lowered from 25 to 10 μg·m−3, indicating that even low concentrations of PM2.5 can be hazardous to humans and animals.
The environmental variables were higher during the day than at night, which may be related to the higher temperature and the more frequent activity of pigs during the day than at night. Some studies have found that PM concentrations in pig houses are significantly affected by pig activity [22,23]. When the pigs were fed or frightened, their activity increased and PM concentration increased significantly. Additionally, as this experiment was carried out in spring, the diurnal temperature changes outside the house had a direct impact on indoor temperature and microbial activity. Higher temperatures led to an increase in microbial activity and pollutant emissions, such as ammonia, and negatively affected air quality [24]. In addition, during the monitoring period, the concentration of PM2.5 at high altitude (1.7 m) were significantly higher than that at low altitude (0.6 m). This may be attributed to the light mass of PM2.5, which is more easily suspended in the air than coarse particles. Understanding the diurnal changes of the environmental parameters, such as PM2.5, in the pig house can help regulate the environment in the pig house more precisely.
Inorganic secondary ions, represented by NH4+ and NO3−, can be used as marker substances for identifying the production of secondary particles from air pollutants such as ammonia (NH3) and nitrogen oxides (NOx) in the house. This process takes place through a series of chemical reactions between acidic and alkaline gases as precursors, and has been detected in the air environment in several scenarios in recent years [25,26]. The content of NH4+ and NO3− detected during the day were significantly higher than that at night (p < 0.05), which was related to increased pig activity during the day and poorer air quality in the house. Although Roumeliotis et al. [27] found that more than 50% of PM2.5 in European chicken houses was derived from secondary particles, the proportion of water-soluble ions in PM2.5 in the pig house in this study was very low. This suggests that the PM2.5 in this environment was predominantly produced directly by some substances in the house.
4.2. Airborne Microbial Varies and Network Interaction
The α diversity showed that compared with airborne fungi, the airborne bacteria in the pig house seemed to be more abundant and have a more complex community structure. Yan et al. found that bacteria accounted for more than 90% of PM2.5 microbial components in pig houses using metagenomic technology, which was consistent with the findings of this study [28]. Eisenlöffel et al. [29] measured the concentration of airborne bacteria in a pig house to be 2.2–5.2 × 10⁵ colony-forming units (CFU)/m3. In the composition of of phylum level airborne microorganisms, Firmicutes was the most dominant bacterial phylum, which was consistent with previous research conducted in piggeries [30,31]. Conversely, some studies have reported that the most abundant phylum in pig farms bioaerosols is Proteobacteria rather than Firmicutes [32]. This discrepancy may be caused by the collection of samples from the external environment surrounding the piggery, because Du et al. [33] believed that Proteobacteria was the most abundant bacterial phylum in residential areas, and its proportion was greatly different from that of the PM2.5 in piggeries. Therefore, the composition of airborne microorganisms in pig houses may be affected by the point locations where the samples are collected. The point locations outside the pig house may vary in many ways depending on the external environment, whereas the airborne microbial community structure inside the pig house is relatively stable.
Lactobacillus and Acinetobacter are the most noteworthy bacteria in the generic microbial composition. Lactobacillus has the highest abundance among the identified bacteria, and is commonly found in nature. It rarely causes diseases and plays an important role in intestinal health of pigs. Branched chain fatty acids (BCFAs) produced by Atopostipes have an important influence on dietary digestion [34]. In contrast, Acinetobacter is the most harmful to health among the identified potential pathogens. Tang et al. [35] identified Acinetobacter, Streptococcus, Escherichia-Shigella, and Pseudomonas as the pathogenic bacteria, in both PM2.5 and the respiratory tract of pigs. Acinetobacter can easily cause respiratory tract infection, bacteremia, meningitis, urogenital tract wound and skin infection while the body’s resistance weakens or skin damage occurs [36]. Acinetobacter has strong adhesion ability and grows easily in humid environments. It has been found many times in breeding environments in the past reports [37]. As far as fungi are concerned, there are many kinds of Candida, but only a few of them can cause diseases to humans, and Candida albicans is the most common one. Attention should be paid to the aflatoxins produced by Aspergillus flavus among potential sensitizing fungi; they have been classified as Class 1 carcinogens by the Cancer Research Institute of the WHO, and can damage human and animal liver tissues. In severe cases, they can lead to liver cancer and even death.
Due to the diurnal variation and height, the microbial composition of the four types of PM2.5 samples showed significant differences (Adonis; p < 0.01). However, the specific effects of altitude, daytime and night on airborne microorganisms remain unclear, possibly due to the complex effects of environment on microbial communities. Network analysis has revealed that certain indicators such as temperature and altitude are positively correlated with some factors, but negatively correlated with others. Combinations such as intersymbiosis, co-colonization and niche overlap make bacteria and fungi coexist under various interactions [38,39]. In this study, we found a positive correlation between bacteria and microbial community, which was consistent with the results reported by Ma et al. [5] Microorganisms in PM2.5 have strong coagulation and modularization characteristics. Compared with fungi, bacteria have more complex interactions, especially in positive correlation networks. There are 10 kinds of bacteria that can directly affect other microorganisms to a higher degree, while 3 kinds of fungi can negatively affect many kinds of microorganisms directly. As for environmental factors, they mainly indirectly affect microbial abundance. Fungal spores in the air will be affected by short-term temperature changes, vertical heat flow and mechanical agitation [40]. In addition, a humid environment is more conducive to microbial growth, and NO3− is considered as a nutrient for bacterial growth and metabolic activities, so they are mainly positively correlated. Airborne microorganisms in piggeries have temporal and spatial variations, but environmental effects may differ across different genera. The interaction of bacteria in airborne microorganisms is mainly synergistic.
4.3. Traceability Analysis
In this study, the microbial compositions of these three groups were compared. The compositions of dominant bacteria and fungi in feed and PM2.5 were very different, contradicting the previous view that feed is the main source of PM2.5 in piggeries [41]. The microbial composition of PM2.5 was consistent with that reported previously, and most of the microbial composition in feed was from animals, while most of the microbial composition in feed was from plants. The possible reason may be the formula feed is widely used in pig feed now, which is mainly composed of energy feed, protein feed and premix. The energy feed and protein feed as the main body of the formula mostly use plant raw materials such as corn, soybean meal, and rapeseed meal. Secondly, the nutritional components of feed itself, the production process, the content of additives and other aspects may also affect its microbial composition to a certain extent [42]. The bacterial composition of feces was similar to that of PM2.5 and both of them had the highest relative abundance of Lactobacillus, a kind of bacterium which can colonize the intestinal tract of pigs [43]. Thus, the relative abundance of Lactobacillus in feces increase continuously, which may be the main reason why Lactobacillus in feces was much higher than that in feed. Moreover, except Schizophyllum, other fungi in feces were similar to PM2.5 samples. To sum up, the microbial community structure of PM2.5 and feces were similar, while the feed seemed to be very different.
Further calculations by SourceTracker showed that the fecal source of PM2.5 in the air of the closed pig house was much more than feed. SourceTracker works by modeling environment samples as mixed sinks of several sources. It then assigns all the OTUs in the environmental sink sample to one source and classifies an OTU as “Unknown” if it cannot be assigned to a source. In this study, the unknown source of the PM2.5 microbial community accounted for a large proportion, and the taxa of the unknown source may come from unidentified sources in the piggery, such as external air, soil, pig dander and hair, etc. [44], and may also include the air protozoan microbial community in the piggery. The SourceTracker method has limitations in identifying the sources with similar bacterial communities [45] and needs to be further optimized in its running speed and result accuracy. To enhance the reliability of SourceTracker’s proportional prediction, RSD was calculated by 5 independent SourceTracker runs. The source with the largest proportion and the smallest RSD value indicates higher confidence, such as the fecal source of PM2.5 samples with a height of 1.7 m collected at night. For the feed source for this sample, the program shows greater variability in quantifying low source contributors. SourceTracker may only predict the presence of a low proportion of sources and cannot quantify a low proportion of source inputs. RSD values of all predicted sources in all PM2.5 samples were less than 100%, indicating consistent results when applying the SourceTracker setting of this experiment.
5. Conclusions
There are abundant potential pathogenic bacteria on PM2.5 in piggeries. In this study, DNA was extracted from PM2.5, feces and feed samples in the piggery and 16S high-throughput sequencing was performed. The results indicate that the composition and abundance of the bacterial community between samples were significantly higher than those of fungi. We identified 14 potential pathogens and 5 allergens in PM2.5. Acinetobacter with relative abundance >1% in all samples was the most potentially harmful, followed by Bacteroides and Staphylococcus. The network analysis revealed that bacteria played a positive role in the network structure, and environmental variables mainly indirectly and positively affected microbial abundance On this basis, the SourceTracker program was used to trace the source of PM2.5 samples, and it was found that the contribution of feces was significantly higher than that of feed. In conclusion, this study provides important evidence that PM2.5 airborne microorganisms in piggeries mainly come from piggery feces. Future research should investigate the relationship between airborne microorganisms and feces in pig houses and explore the regulation of harmful microorganisms in the air of livestock houses by taking measures to treat feces.
Author Contributions
Conceptualization, S.P. (Shihua Pu) and M.W.; methodology, S.P. (Shihua Pu) and M.W.; software, S.P. (Siyi Peng) and D.L. (Dongru Liu); validation, D.L. (Dingbiao Long) and M.W.; formal analysis, S.P. (Siyi Peng) and M.W.; investigation, D.L. (Dongru Liu) and M.W.; resources, Z.L. and S.P. (Shihua Pu); data curation, S.P. (Shihua Pu) and S.P. (Siyi Peng); writing—original draft preparation, M.W.; writing—review and editing, S.P. (Shihua Pu) and S.P. (Siyi Peng); visualization, S.P. (Shihua Pu) and S.P. (Siyi Peng); supervision, D.L. (Dingbiao Long); project administration, S.P. (Shihua Pu) and D.L. (Dingbiao Long); funding acquisition, S.P. (Shihua Pu) and Z.L. All authors have read and agreed to the published version of the manuscript.
Funding
This research was financially supported by Chongqing Scientific research institution performance incentive and guidance special project (cstc2021jxj100021), the Modern Agroindustry Technology Research System (CARS-35), National Center of Technology Innovation for Pigs, National Center of Technology Innovation for Pigs Award and Subsidy Special Project (21610).
Institutional Review Board Statement
Not applicable.
Informed Consent Statement
Not applicable.
Data Availability Statement
The data that support the findings of this study are available from the corresponding author, upon reasonable request.
Conflicts of Interest
The authors declare no conflict of interest.
References
- Lu, F.; Xu, D.; Cheng, Y.; Dong, S.; Guo, C.; Jiang, X. Systematic review and meta-analysis of the adverse health effects of ambient PM2.5 and PM10 pollution in the Chinese population. Environ. Res. 2015, 136, 196–204. [Google Scholar] [CrossRef] [PubMed]
- Liu, D.; Mariman, R.; Gerlofs-Nijland, M.E.; Boere, J.F.; Folkerts, G.; Cassee, F.R.; Pinelli, E. Microbiome composition of airborne particulate matter from livestock farms and their effect on innate immune receptors and cells. Sci. Total Environ. 2019, 688, 1298–1307. [Google Scholar] [CrossRef] [PubMed]
- Kulmala, M.; Asmi, A.; Lappalainen, H.K.; Baltensperger, U.; Brenguier, J.L. General overview: European integrated project on aerosol cloud climate and air quality interactions (EUCAARI)—Integrating aerosol research from nano to global scales. Atmos. Chem. Phys. 2011, 11, 13061–13143. [Google Scholar] [CrossRef] [Green Version]
- Husarova, S.; Vaitilingom, M.; Deguillaume, L.; Traikia, M.; Vinatier, V.; Sancelme, M.; Amato, P.; Matulova, M.; Delort, A.-M. Biotransformation of methanol and formaldehyde by bacteria isolated from clouds. Comparison with radical chemistry. Atmos. Environ. 2011, 45, 6093–6102. [Google Scholar] [CrossRef]
- Ma, L.; Yabo, S.D.; Lu, L.; Jiang, J.; Meng, F.; Qi, H. Seasonal variation characteristics of inhalable bacteria in bioaerosols and antibiotic resistance genes in Harbin. J. Haz. Mat. 2023, 446, 130597. [Google Scholar] [CrossRef] [PubMed]
- Stelitano, D.; Squillaci, G.; Santella, B.; Chianese, A.; D’Oriano, V.; Finamore, E.; Franci, G. Airborne microbial flora in buffalo farms in a Mediterranean climate. Transl. Med. Rep. 2019, 3, 6–13. [Google Scholar] [CrossRef] [Green Version]
- Xu, Z.; Yao, M. Monitoring of bioaerosol inhalation risks in different environments using a six-stage Andersen sampler and the PCR-DGGE method. Environ. Monit. Assess. 2013, 185, 3993–4003. [Google Scholar] [CrossRef]
- Tanaka, D.; Fujiyoshi, S.; Maruyama, F.; Goto, M.; Koyama, S.; Kanatani, J.I.; Isobe, J.; Watahiki, M.; Sakatoku, A.; Kagaya, S.; et al. Size resolved characteristics of urban and suburban bacterial bioaerosols in Japan as assessed by 16S rRNA amplicon sequencing. Sci. Rep. 2020, 10, 12406. [Google Scholar] [CrossRef]
- Fan, X.; Gao, J.; Pan, K.; Li, D.; Dai, H.; Li, X. More obvious air pollution impacts on variations in bacteria than fungi and their co-occurrences with ammonia-oxidizing microorganisms in PM2.5. Environ. Pollut. 2019, 251, 668–680. [Google Scholar] [CrossRef]
- Xu, C.; Chen, H.; Liu, Z.; Sui, G.; Li, D.; Kan, H.; Chen, J. The decay of airborne bacteria and fungi in a constant temperature and humidity test chamber. Environ. Int. 2021, 157, 106816. [Google Scholar] [CrossRef]
- Smets, W.; Moretti, S.; Denys, S.; Lebeer, S. Airborne bacteria in the atmosphere: Presence, purpose, and potential. Atmos. Environ. 2016, 139, 214–221. [Google Scholar] [CrossRef]
- Just, N.; Blais Lecours, P.; Marcoux-Voiselle, M.; Kirychuk, S.; Veillette, M.; Singh, B.; Duchaine, C. Archaeal characterization of bioaerosols from cage-housed and floor-housed poultry operations. Can. J. Microbiol. 2013, 59, 46–50. [Google Scholar] [CrossRef] [PubMed] [Green Version]
- Chen, H.; Yan, H.; Xiu, Y.; Jiang, L.; Zhang, J.; Chen, G.; Yu, X.; Zhu, H.; Zhao, X.; Li, Y.; et al. Seasonal dynamics in bacterial communities of closed-cage broiler houses. Front. Vet. Sci. 2022, 9, 1019005. [Google Scholar] [CrossRef] [PubMed]
- Tang, Q.; Huang, K.; Liu, J.; Shen, D.; Dai, P.; Li, Y.; Li, C. Seasonal variations of microbial assemblage in fine particulate matter from a nursery pig house. Sci. Total Environ. 2020, 708, 134921. [Google Scholar] [CrossRef] [PubMed]
- Cambra-López, M.; Aarnink, A.J.A.; Zhao, Y.; Calvet, S.; Torres, A.G. Airborne particulate matter from livestock production systems: A review of an air pollution problem. Environ. Pollut. 2010, 158, 1–17. [Google Scholar] [CrossRef]
- Pu, S.; Rong, X.; Zhu, J.; Zeng, Y.; Yue, J.; Lim, T.; Long, D. Short-Term Aerial Pollutant Concentrations in a Southwestern China Pig-Fattening House. Atmosphere 2021, 12, 103. [Google Scholar] [CrossRef]
- Knights, D.; Kuczynski, J.; Charlson, E.S.; Zaneveld, J.; Mozer, M.C.; Collman, R.G.; Bushman, F.D.; Knight, R.; Kelley, S.T. Bayesian community-wide culture-independent microbial source tracking. Nat. Methods 2011, 8, 761–763. [Google Scholar] [CrossRef] [Green Version]
- Yang, W.; Yuan, Q.; Li, Z.; Du, Z.; Wu, G.; Yu, J.; Hu, J. Translocation and Dissemination of Gut Bacteria after Severe Traumatic Brain Injury. Microorganisms 2022, 10, 2082. [Google Scholar] [CrossRef]
- Birgit, S.N.; Ursula, D.; Verena, P.L.; Raphaela, R.; Michael, B. The spectrum of fungal allergy. Int. Arch. Allergy Immunol. 2008, 145, 58–86. [Google Scholar]
- Pu, S.; Peng, S.; Zhu, J.; Liu, Z.; Long, D.; Lim, T. Characteristics of PM2.5 and Its Correlation with Feed, Manure and NH3 in a Pig-Fattening House. Toxics 2022, 10, 145. [Google Scholar] [CrossRef]
- Shang, B.; Liu, Y.; Dong, H.; Tao, X.; Yao, H. Particulate matter concentrations and emissions of a fattening pig facility in northern China. Atmos. Pollut. Res. 2020, 11, 1902–1911. [Google Scholar] [CrossRef]
- Costa, A.; Borgonovo, F.; Leroy, T.; Berckmans, D.; Guarino, M. Dust concentration variation in relation to animal activity in a pig barn. Biosyst. Eng. 2009, 104, 118–124. [Google Scholar] [CrossRef]
- Li, Y.M.; Xu, Z.W.; Huang, Z.Y. Effects of fresh air system on air quality, piglet performance, blood biochemical and immune indexes of closed piggery in cold season. Chin. J. Anim. Sci. 2013, 49, 83–87. [Google Scholar]
- Koerkamp, P. Review on emissions of ammonia from housing systems for laying hens in relation to sources, processes, building design and manure handling. J. Agric. Eng. Res. 1994, 59, 73–87. [Google Scholar] [CrossRef]
- Pilinis, C.; Charalampidis, P.E.; Mihalopoulos, N.; Pandis, S.N. Contribution of particulate water to the measured aerosol optical properties of aged aerosol—ScienceDirect. Atmos. Environ. 2014, 82, 144–153. [Google Scholar] [CrossRef]
- Li, N.; Zhang, H.; Zhu, S.; Liao, H.; Hu, J.; Tang, K.; Li, J. Secondary PM2.5 dominates aerosol pollution in the Yangtze River Delta region: Environmental and health effects of the Clean air Plan. Environ. Int. 2023, 171, 107725. [Google Scholar] [CrossRef]
- Roumeliotis, T.S.; Heyst, B. Investigation of SecondaZoury Particulate Matter Formation in a Layer Barn. In Proceedings of the Environment Viii, Iguassu Falls, Brazil, 31 August–4 September 2008. [Google Scholar]
- Yan, H.; Zhang, L.; Guo, Z.; Zhang, H.; Liu, J. Production phase affects the bioaerosol microbial composition and functional potential in swine confinement buildings. Animals 2019, 9, 90. [Google Scholar] [CrossRef] [Green Version]
- Eisenlöffel, L.; Reutter, T.; Horn, M.; Schlegel, S.; Truyen, U.; Speck, S. Impact of UVC-sustained recirculating air filtration on airborne bacteria and dust in a pig facility. PLoS ONE 2019, 14, e225047. [Google Scholar] [CrossRef] [Green Version]
- Kraemer, J.G.; Aebi, S.; Oppliger, A.; Hilty, M. The indoor-air microbiota of pig farms drives the composition of the pig farmers’nasal microbiota in a season dependent and farm-specific manner. Appl. Environ. Microbiol. 2019, 85, e03038–e03118. [Google Scholar]
- Hong, S.; Park, J.; Jeong, H.; Kim, M. Evaluation of the microbiome composition in particulate matter inside and outside of pig houses. J. Anim. Sci. Technol. 2021, 63, 640–650. [Google Scholar] [CrossRef]
- Wu, N.; Xie, S.; Zeng, M.; Xu, X.; Wang, X. Impacts of pile temperature on antibiotic resistance, metal resistance and microbial community during swine manure composting. Sci. Total Environ. 2020, 744, 140920. [Google Scholar] [CrossRef]
- Du, P.; Du, R.; Ren, W.; Lu, Z.; Fu, P. Seasonal variation characteristic of inhalable microbial communities in PM2. 5 in Beijing city, China. Sci. Total Environ. 2018, 610, 308–315. [Google Scholar] [CrossRef] [PubMed]
- Cho, S.; Hwang, O.; Park, S. Effect of Dietary Protein Levels on Composition of Odorous Compounds and Bacterial Ecology in Pig Manure. Asian Austral. J. Anim. 2015, 28, 1362–1370. [Google Scholar] [CrossRef] [PubMed]
- Tang, Q.; Huang, K.; Liu, J.Z.; Jin, X.M.; Li, C.M. Distribution characteristics of bioaerosols inside pig houses and the respiratory tract of pigs. Ecotoxicol. Environ. Safety 2021, 212, 112006. [Google Scholar] [CrossRef]
- Adams, F.G.; Trappetti, C.; Waters, J.K.; Zang, M.; Brazel, E.B.; Paton, J.C.; Snel, M.F.; Eijkelkamp, B.A. To make or take: Bacterial lipid homeostasis during infection. MBio 2021, 12, e0092821. [Google Scholar] [CrossRef] [PubMed]
- Cui, C.Y.; Chen, C.; Liu, B.T.; He, Q.; Wu, X.T.; Sun, R.Y.; Zhang, Y.; Sun, J. Co-occurrence of plasmid-mediated tigecycline and carbapenem resistance in Acinetobacter spp. from waterfowls and their neighboring environment. AAC Medlin. 2020, 64, e02502-19. [Google Scholar] [CrossRef]
- Faust, K.; Raes, J. Microbial interactions: From networks to models. Nat. Rev. Microbiol. 2012, 10, 538–550. [Google Scholar] [CrossRef]
- Hoppe, B.; Kahl, T.; Karasch, P.; Wubet, T.; Bauhus, J.; Buscot, F.; Krueger, D. Network analysis reveals ecological links between N-fixing bacteria and wooddecaying fungi. PLoS ONE 2014, 9, e88141. [Google Scholar] [CrossRef] [Green Version]
- Li, D.W.; Kendrick, B. Functional relationships between airborne fungal spores and enviromental factors in Kitchener-Waterloo, Ontario, as detected by Canonical correspondence analysis. Grana 1994, 33, 166–176. [Google Scholar] [CrossRef]
- Cambra-Lopez, M.; Hermosilla, T.; Aarnink, A.J.A.; Ogink, N.W.M. A methodology to select particle morpho-chemical characteristics to use insource apportionment of particulate matter from livestock houses. Comput. Electron. Agr. 2012, 81, 14–23. [Google Scholar] [CrossRef] [Green Version]
- O’Meara, F.M.; Gardiner, G.E.; O’Doherty, J.V.; Clarke, D.; Cummins, W.; Lawlor, P.G. Effect of wet/dry, fresh liquid, fermented whole diet liquid, and fermented cereal liquid feeding on feed microbial quality and growth in grow-finisher pigs. J. Anim. Sci. 2020, 98, skaa166. [Google Scholar] [CrossRef] [PubMed]
- Chen, C.Y.; Zhou, Y.Y.; Fu, H.; Xiong, X.W.; Fang, S.M.; Jiang, H.; Huang, L.S. Expanded catalog of microbial genes and metagenome-assembled genomes from the pig gut microbiome. Nat. Commun. 2021, 12, 1106. [Google Scholar] [CrossRef] [PubMed]
- Donham, K.J.; Scallon, L.J.; Popendorf, W.; Treuhaft, M.W.; Roberts, R.C. Characterization of dusts collected from swine confinement buildings. Am. Ind. Hyg. Assoc. J. 1986, 47, 404–410. [Google Scholar] [CrossRef]
- Brown, C.M.; Mathai, P.P.; Loesekann, T.; Staley, C.; Sadowsky, M.J. Influence of Library Composition on Source Tracker Predictions for Community-Based Microbial Source Tracking. Environ. Sci. Tech. 2019, 53, 60–68. [Google Scholar] [CrossRef] [PubMed]
Figure 1.
Distribution of bacteria (a,b) and fungi (c,d) in samples; (a,c) indicate composition at the phylum level and (b,d) indicate composition at the genus level.
Figure 1.
Distribution of bacteria (a,b) and fungi (c,d) in samples; (a,c) indicate composition at the phylum level and (b,d) indicate composition at the genus level.

Figure 2.
PCoA and LEfSe analysis of bacterial (a,b) and fungal (c,d) differences between PM2.5 samples.
Figure 2.
PCoA and LEfSe analysis of bacterial (a,b) and fungal (c,d) differences between PM2.5 samples.

Figure 3.
Network of positive (a) and negative (b) correlations among bacteria (purple), fungi (brown) and environmental parameters (green). Note: The figure shows the relative abundance of the top 50 bacteria and fungi, and the size of the circle corresponds to the level of their relative abundance. The potentially harmful microorganisms and environmental variables were labeled.

Figure 4.
Species composition of bacteria (a) and fungi (b) in PM2.5, feed and feces samples.

Figure 5.
Traceability analysis of bacteria (a) and fungi (b) by SourceTracker method.


Table 1.
Sample information and group name.
| Sample Information | Group Name | |
|---|---|---|
| Samples collected during the day | High altitude | PM2.5_DH |
| Low altitude | PM2.5_DL | |
| Samples collected at night | High altitude | PM2.5_NH |
| Low altitude | PM2.5_NL | |
| Feed samples during sampling | Feed | |
| Fecal samples during sampling | Fece | |
Table 2.
Environment variables inside the pig house during the experiment.
| Item | PM2.5 (μg·m−3) | Ventilation (m³·h−1) | Humidity (%) | Temperature (°C) | NH4+ (μg∙m−3) | NO3− (μg∙m−3) | |
|---|---|---|---|---|---|---|---|
| High altitude during the day (1.7 m; 7:30–19:30) | Mean ± SD | 64.47 ± 19.07 a | 19.26 ± 18.36 a | 59.1 ± 14.51 a | 20.37 ± 4.36 a | 3.67 ± 0.12 a | 1.17 ± 0.09 a |
| Max | 95.61 | 47 | 78.76 | 25.12 | 3.92 | 1.31 | |
| Min | 40.09 | 6.4 | 41.03 | 16.01 | 3.57 | 1.08 | |
| Low altitude during the day (0.6 m; 7:30–19:30) | Mean ± SD | 55.25 ± 17.46 b | 19.26 ± 18.36 a | 61.09 ± 12.29 a | 20.64 ± 4.18 a | 4.57 ± 0.41 b | 1.21 ± 0.06 a |
| Max | 90.32 | 47 | 79.11 | 25.18 | 5.14 | 1.29 | |
| Min | 37.91 | 6.4 | 40.06 | 16.63 | 4.12 | 1.12 | |
| High altitude at night (1.7 m; 19:30–7:30) | Mean ± SD | 46.47 ± 15.63 b | 7.18 ± 1.33 b | 74.27 ± 10.01 b | 15.19 ± 2.41 b | 2.97 ± 0.21 c | 0.77 ± 0.03 b |
| Max | 76.85 | 10 | 88.43 | 18.12 | 3.39 | 0.81 | |
| Min | 30.34 | 6.4 | 55.12 | 12.31 | 2.73 | 0.73 | |
| Low altitude at night (0.6 m; 19:30–7:30) | Mean ± SD | 41.25 ± 12.62 c | 7.18 ± 1.33 b | 75.31 ± 8.82 b | 15.89 ± 3.15 b | 2.2 ± 0.13 c | 0.67 ± 0.05 b |
| Max | 60.61 | 10 | 87.17 | 18.92 | 2.41 | 0.72 | |
| Min | 22.91 | 6.4 | 56.31 | 12.71 | 2.07 | 0.61 |
Note: Different superscript letters in the same column represent significant variation (p ≤ 0.05), while the same letter represents no significant variation (p > 0.05). SD, standard deviation.
Table 3.
α diversity index of different groups of samples.
| The α Diversity Index | Sample | Bacterial | Fungi |
|---|---|---|---|
| ACE | PM2.5_DH | 1481.53 ± 44.1 a | 511.79 ± 44.12 b |
| PM2.5_DL | 1064.23 ± 47.13 a | 458.72 ± 17.72 b | |
| PM2.5_NH | 911.16 ± 21.78 a | 324.83 ± 14.94 b | |
| PM2.5_NL | 1239.42 ± 44.33 a | 411.39 ± 90.88 b | |
| Feces | 935.49 ± 48.66 a | 410.13 ± 20.92 b | |
| Feed | 889.8 ± 12.54 a | 472.49 ± 6.06 b | |
| Shannon | PM2.5_DH | 8.42 ± 0.06 a | 6.15 ± 0.07 b |
| PM2.5_DL | 7.97 ± 0.04 a | 6.48 ± 0.13 b | |
| PM2.5_NH | 8.14 ± 0.04 a | 5.9 ± 0.04 b | |
| PM2.5_NL | 6.95 ± 0.14 a | 6 ± 0.13 b | |
| Feces | 7.83 ± 0.02 a | 6.36 ± 0.12 b | |
| Feed | 7.56 ± 0.03 a | 6.35 ± 0.03 b |
The values are shown as mean ± standard deviation (SD). Means within each row followed by different superscript letters were significantly different (p < 0.05).
Table 4.
The relative abundance of potential pathogenic bacteria in PM2.5 samples.
| Bacteria | PM2.5_DH | PM2.5_DL | PM2.5_NH | PM2.5_NL |
|---|---|---|---|---|
| Phascolarctobacterium | 2.73 ± 0.05 | 2.59 ± 0.02 | 2.76 ± 0.03 | 3.14 ± 0.1 |
| Streptococcus | 1.59 ± 0.06 | 1.92 ± 0.07 | 2.09 ± 0.05 | 1.82 ± 0.11 |
| Bacteroides | 2.65 ± 0.18 | 0.47 ± 0.03 | 0.37 ± 0.01 | 0.51 ± 0.01 |
| Acinetobacter | 1.14 ± 0.04 | 1.31 ± 0.02 | 1.29 ± 0.04 | 1.07 ± 0.03 |
| Ruminococcus | 1.1 ± 0.03 | 0.73 ± 0.04 | 0.7 ± 0.02 | 0.86 ± 0.02 |
| Prevotella | 0.9 ± 0.18 | 1.25 ± 0.09 | 1.32 ± 0.02 | 1.22 ± 0.1 |
| Escherichia_Shigella | 0.79 ± 0.04 | 1.51 ± 0.01 | 0.93 ± 0.02 | 1.61 ± 0.01 |
| Staphylococcus | 0.37 ± 0.01 | 0.45 ± 0.06 | 1.17 ± 0.05 | 0.73 ± 0.11 |
| Faecalibacterium | 0.86 ± 0.05 | 0.59 ± 0.04 | 0.43 ± 0.02 | 0.53 ± 0.02 |
| Jeotgalicoccus | 0.24 ± 0.02 | 0.32 ± 0.01 | 0.69 ± 0.04 | 0.44 ± 0.02 |
| Treponema | 0.23 ± 0.02 | 0.31 ± 0.02 | 0.17 ± 0.01 | 0.25 ± 0.01 |
| Pseudomonas | 0.22 ± 0.01 | 0.24 ± 0.02 | 0.15 ± 0.02 | 0.13 ± 0.01 |
| Oscillospira | 0.17 ± 0.02 | 0.29 ± 0.03 | 0.29 ± 0.03 | 0.32 ± 0.08 |
| Achromobacter | 0 | 1.04 ± 0.04 | 0 | 0.03 ± 0.01 |
| Total bacterial pathogen | 13 ± 0.69 | 13.03 ± 0.43 | 12.36 ± 0.34 | 12.66 ± 0.45 |
Table 5.
The relative abundance of potential allergens in PM2.5 samples.
| Fungi | PM2.5_NH | PM2.5_DH | PM2.5_NL | PM2.5_DL |
|---|---|---|---|---|
| Schizophyllum | 13.27 ± 0.42 | 7.33 ± 0.23 | 4.43 ± 0.07 | 4.23 ± 0.21 |
| Aspergillus | 1.71 ± 0.13 | 2.13 ± 0.19 | 2.27 ± 0.12 | 2.32 ± 0.02 |
| Trichosporon | 1.29 ± 0.11 | 1.59 ± 0.1 | 1.16 ± 0.22 | 1.07 ± 0.08 |
| Trichoderma | 0.57 ± 0.04 | 0.01 ± 0.01 | 0.71 ± 0.11 | 0.62 ± 0.09 |
| Wallemia | 0.04 ± 0.01 | 0.09 ± 0.02 | 0.04 ± 0.01 | 0.06 ± 0.02 |
| Total fungal allergen | 16.87 ± 0.71 | 11.16 ± 0.56 | 8.61 ± 0.53 | 8.29 ± 0.42 |
Table 6.
Relative Standard Deviation Analysis of SourceTracker Results after Five Independent Runs of Select Samples.
Table 6.
Relative Standard Deviation Analysis of SourceTracker Results after Five Independent Runs of Select Samples.
| Sample | Source | Bacteria | Fungi | ||
|---|---|---|---|---|---|
| Average Proportion (%) | RSD | Average Proportion (%) | RSD | ||
| PM2.5_DH | Feces | 43.5% | 1.59% | 57.4% | 0.32% |
| Feed | 7.5% | 1.52% | 1.6% | 4.62% | |
| Unknown | 49.0% | 1.20% | 41.1% | 0.40% | |
| PM2.5_DL | Feces | 45.5% | 1.15% | 69.6% | 0.75% |
| Feed | 3.6% | 3.86% | 1.5% | 7.42% | |
| Unknown | 50.9% | 0.98% | 28.9% | 1.71% | |
| PM2.5_NH | Feces | 44.1% | 0.92% | 75.5% | 0.19% |
| Feed | 1.8% | 5.10% | 1.1% | 10.48% | |
| Unknown | 54.2% | 0.62% | 23.4% | 0.55% | |
| PM2.5_NL | Feces | 48.4% | 1.26% | 50.5% | 1.74% |
| Feed | 2.2% | 3.11% | 5.9% | 4.67% | |
| Unknown | 49.4% | 1.25% | 43.6% | 1.44% | |
Disclaimer/Publisher’s Note: The statements, opinions and data contained in all publications are solely those of the individual author(s) and contributor(s) and not of MDPI and/or the editor(s). MDPI and/or the editor(s) disclaim responsibility for any injury to people or property resulting from any ideas, methods, instructions or products referred to in the content. |
© 2023 by the authors. Licensee MDPI, Basel, Switzerland. This article is an open access article distributed under the terms and conditions of the Creative Commons Attribution (CC BY) license (https://creativecommons.org/licenses/by/4.0/).
Share and Cite
MDPI and ACS Style
Wang, M.; Peng, S.; Liu, D.; Long, D.; Liu, Z.; Pu, S. Characteristics and Traceability Analysis of Microbial Assemblage in Fine Particulate Matter from a Pig House. Animals 2023, 13, 1058. https://doi.org/10.3390/ani13061058
AMA Style
Wang M, Peng S, Liu D, Long D, Liu Z, Pu S. Characteristics and Traceability Analysis of Microbial Assemblage in Fine Particulate Matter from a Pig House. Animals. 2023; 13(6):1058. https://doi.org/10.3390/ani13061058
Chicago/Turabian StyleWang, Miao, Siyi Peng, Dongru Liu, Dingbiao Long, Zuohua Liu, and Shihua Pu. 2023. "Characteristics and Traceability Analysis of Microbial Assemblage in Fine Particulate Matter from a Pig House" Animals 13, no. 6: 1058. https://doi.org/10.3390/ani13061058
Note that from the first issue of 2016, this journal uses article numbers instead of page numbers. See further details here.