

Comparative Analysis of the Composition of Fatty Acids and Metabolites between Black Tibetan and Chaka Sheep on the Qinghai—Tibet Plateau
 , ,
, ,
Abstract
:Simple Summary
Abstract
1. Introduction
2. Materials and Methods
2.1. Experimental Design
2.2. Analysis of Muscle Fiber Characteristics
2.3. Analysis of Chemical Components in Mutton
2.4. Analysis of Fatty Acids
2.5. Preparation of Longissimus Dorsi for LC-MS and Identification of Compounds
2.6. Statistical Analysis
3. Results
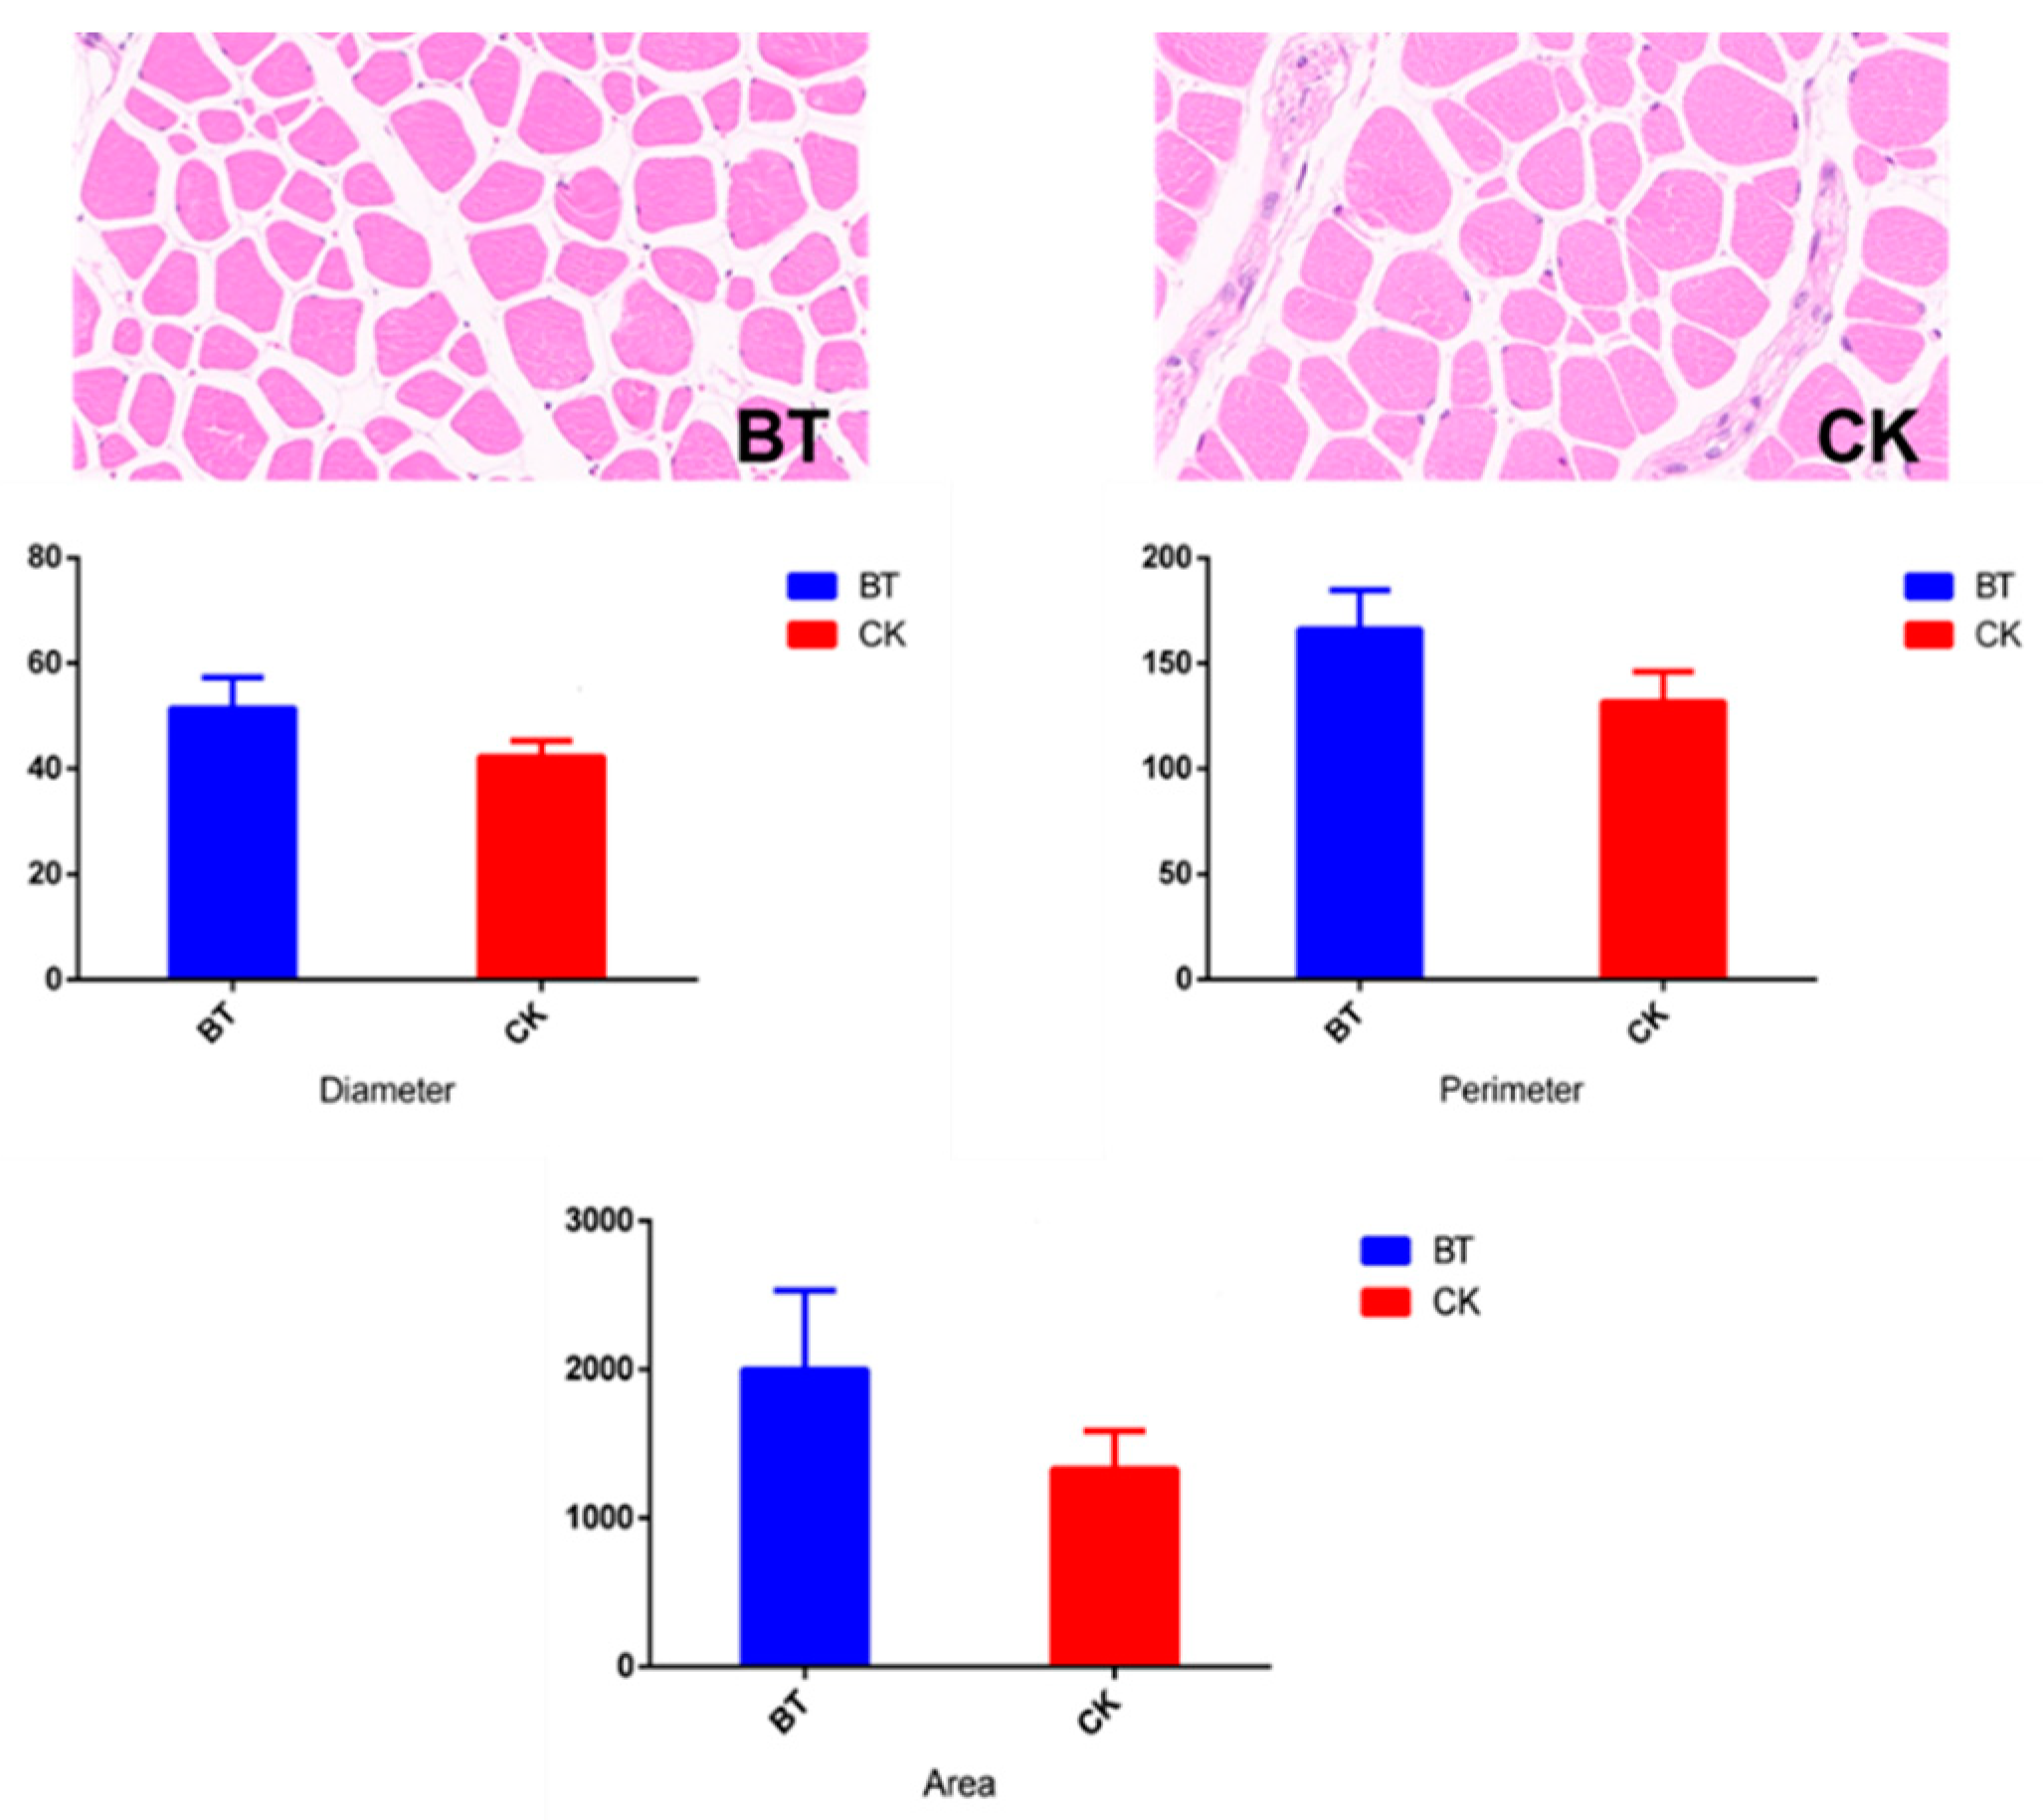
3.1. Muscle Fiber Characteristics
3.2. Chemical Components of Mutton
3.3. Fatty Acids
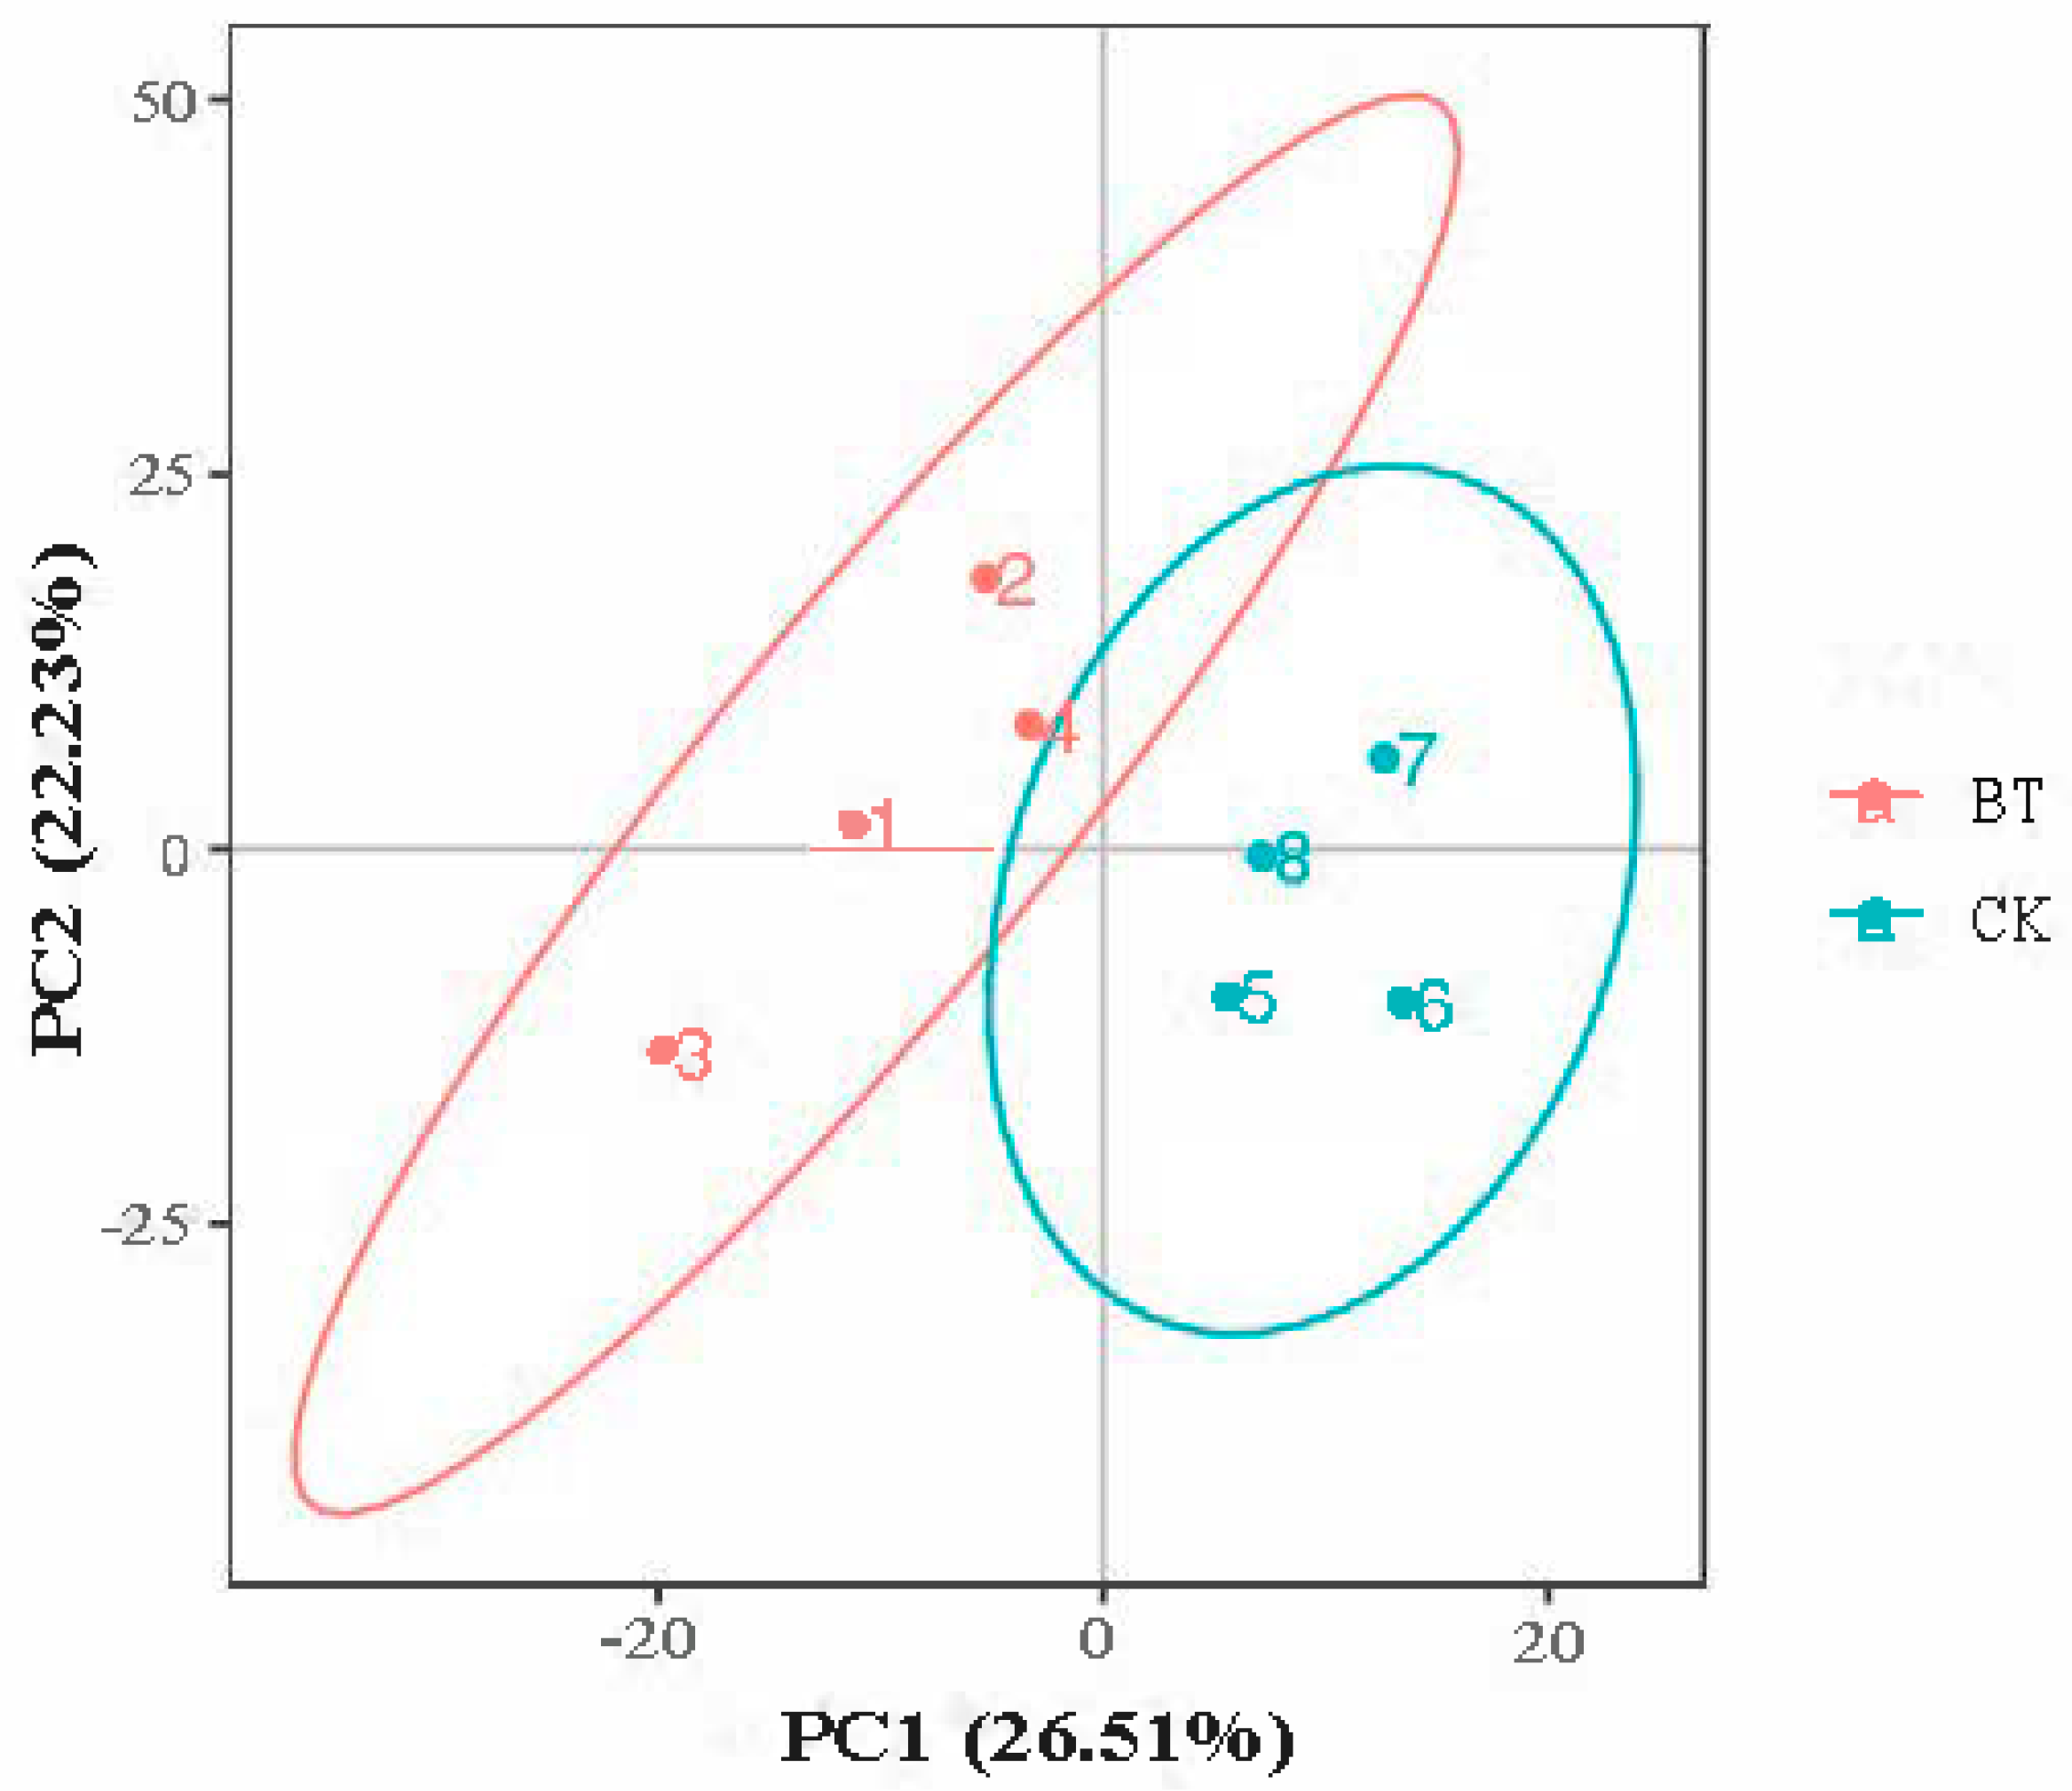
3.4. PCA Analysis
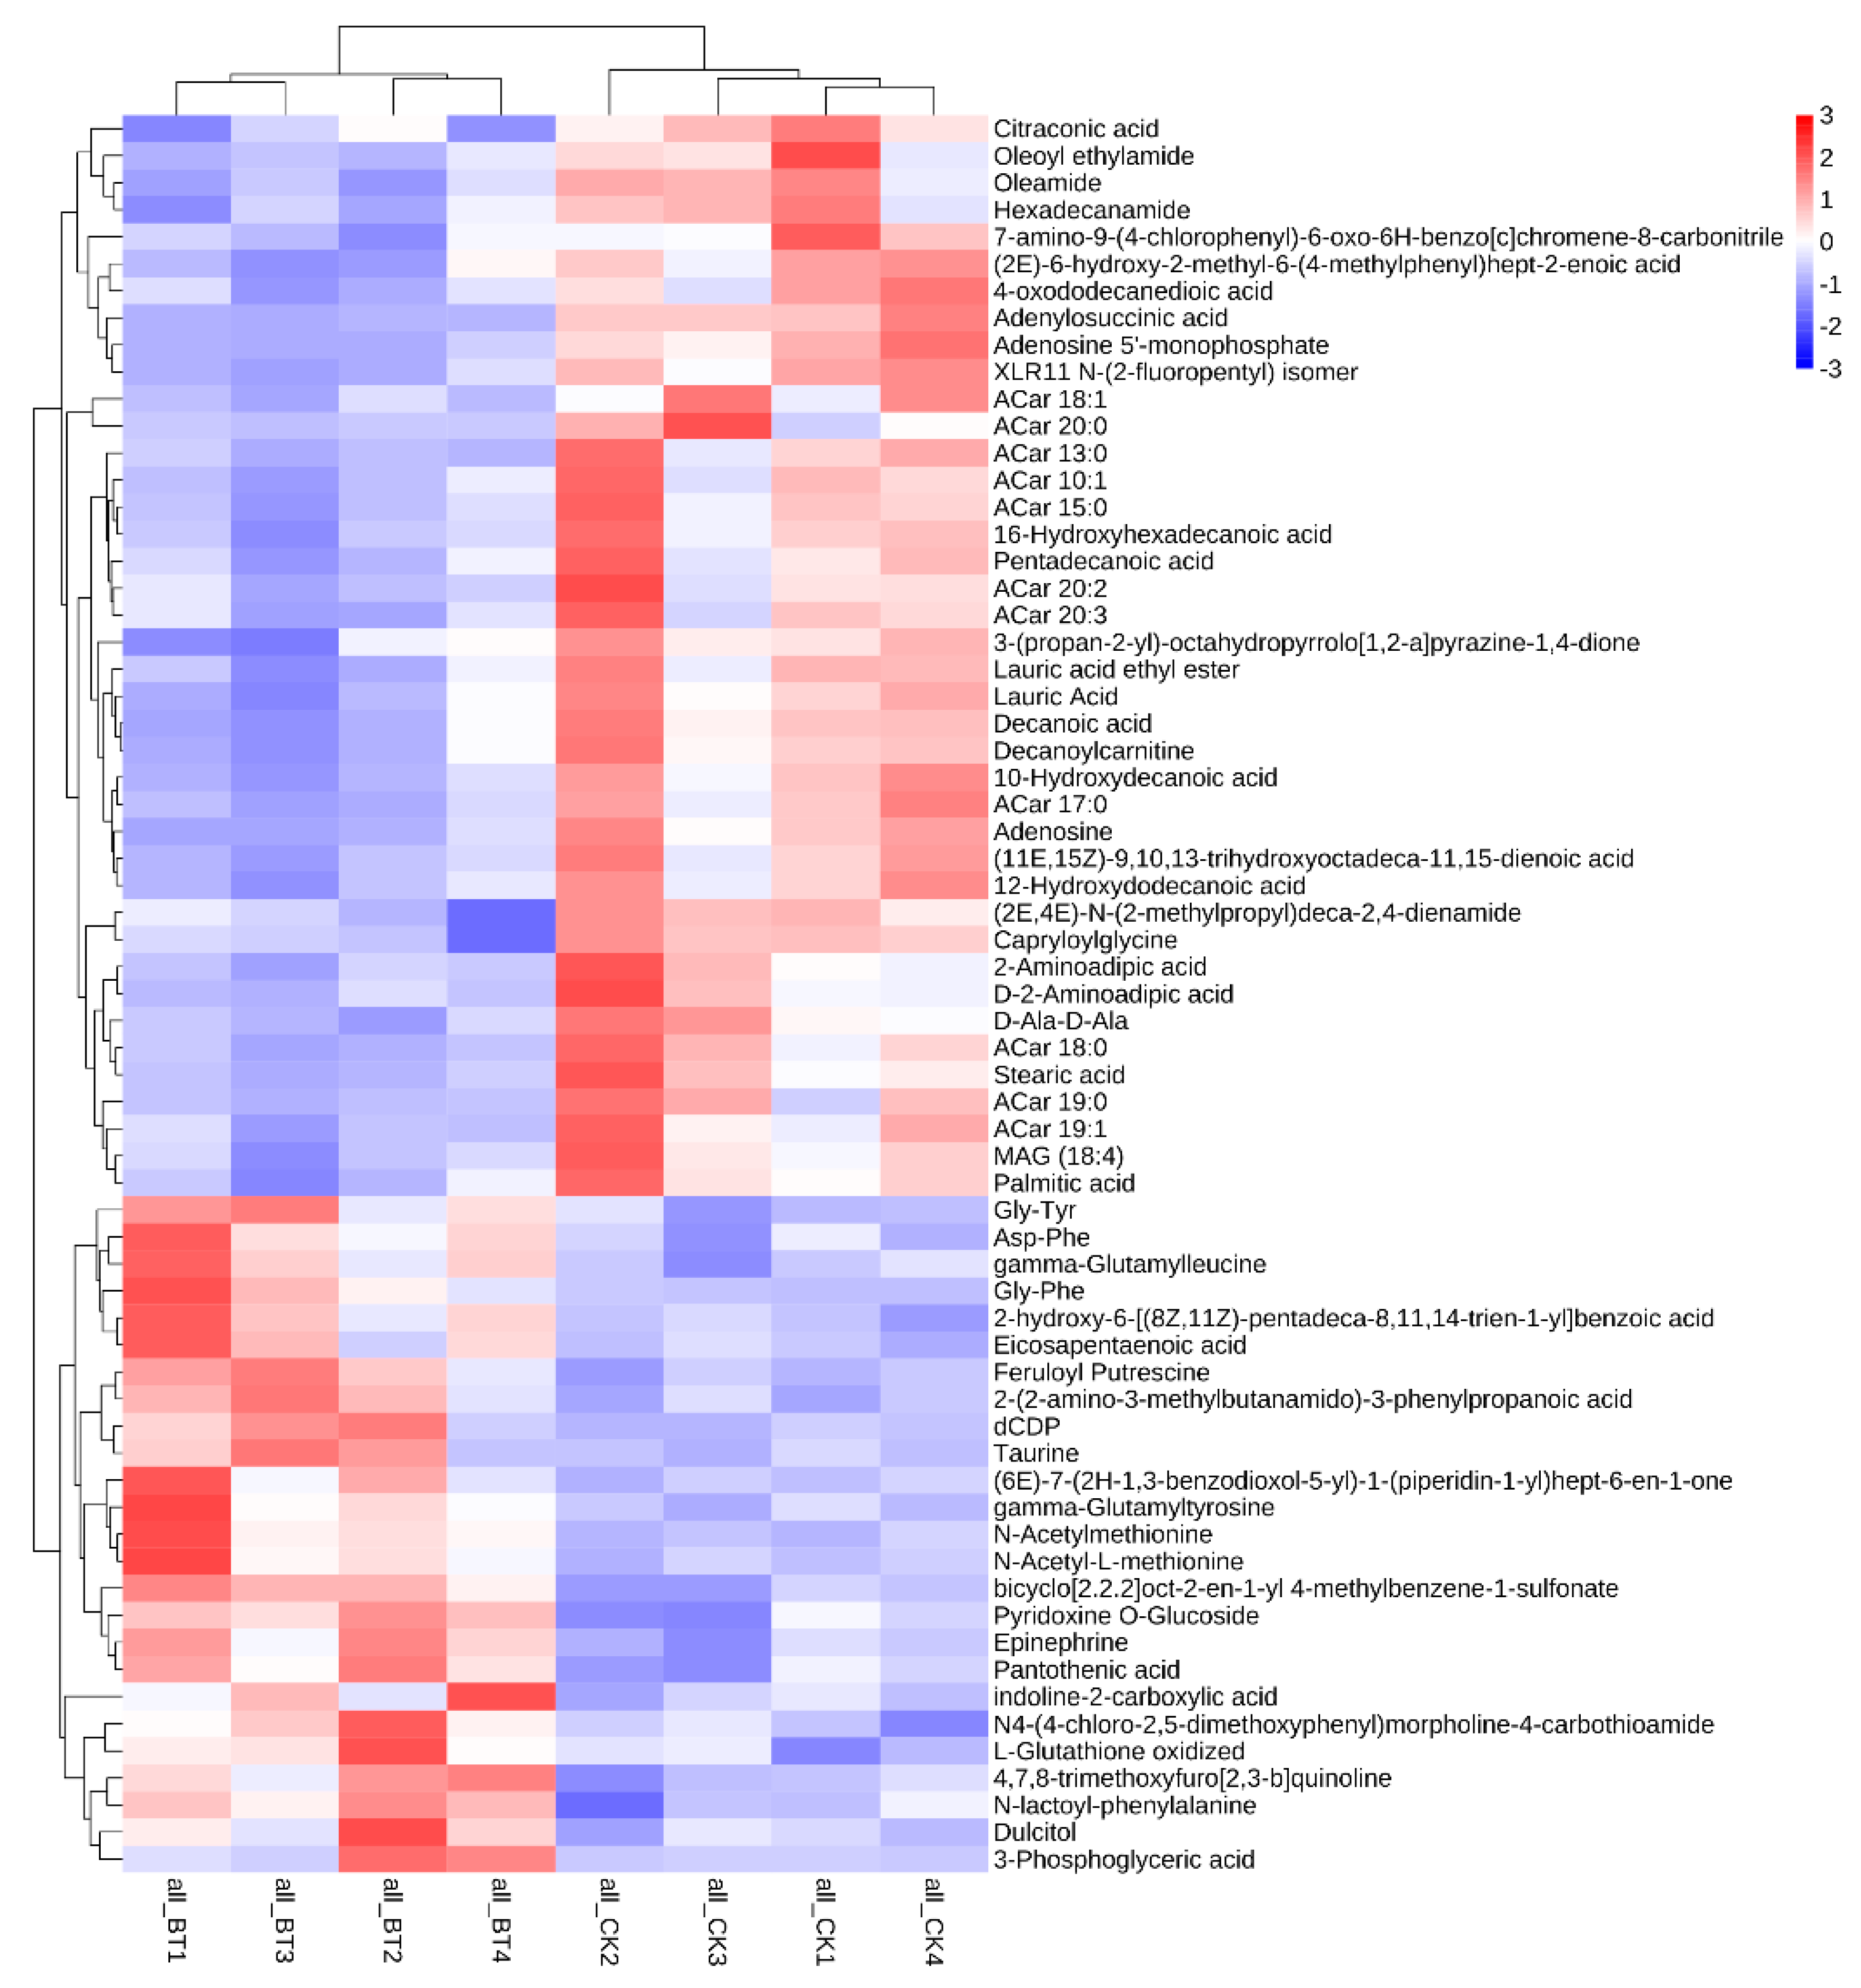
3.5. Metabolic Biomarkers
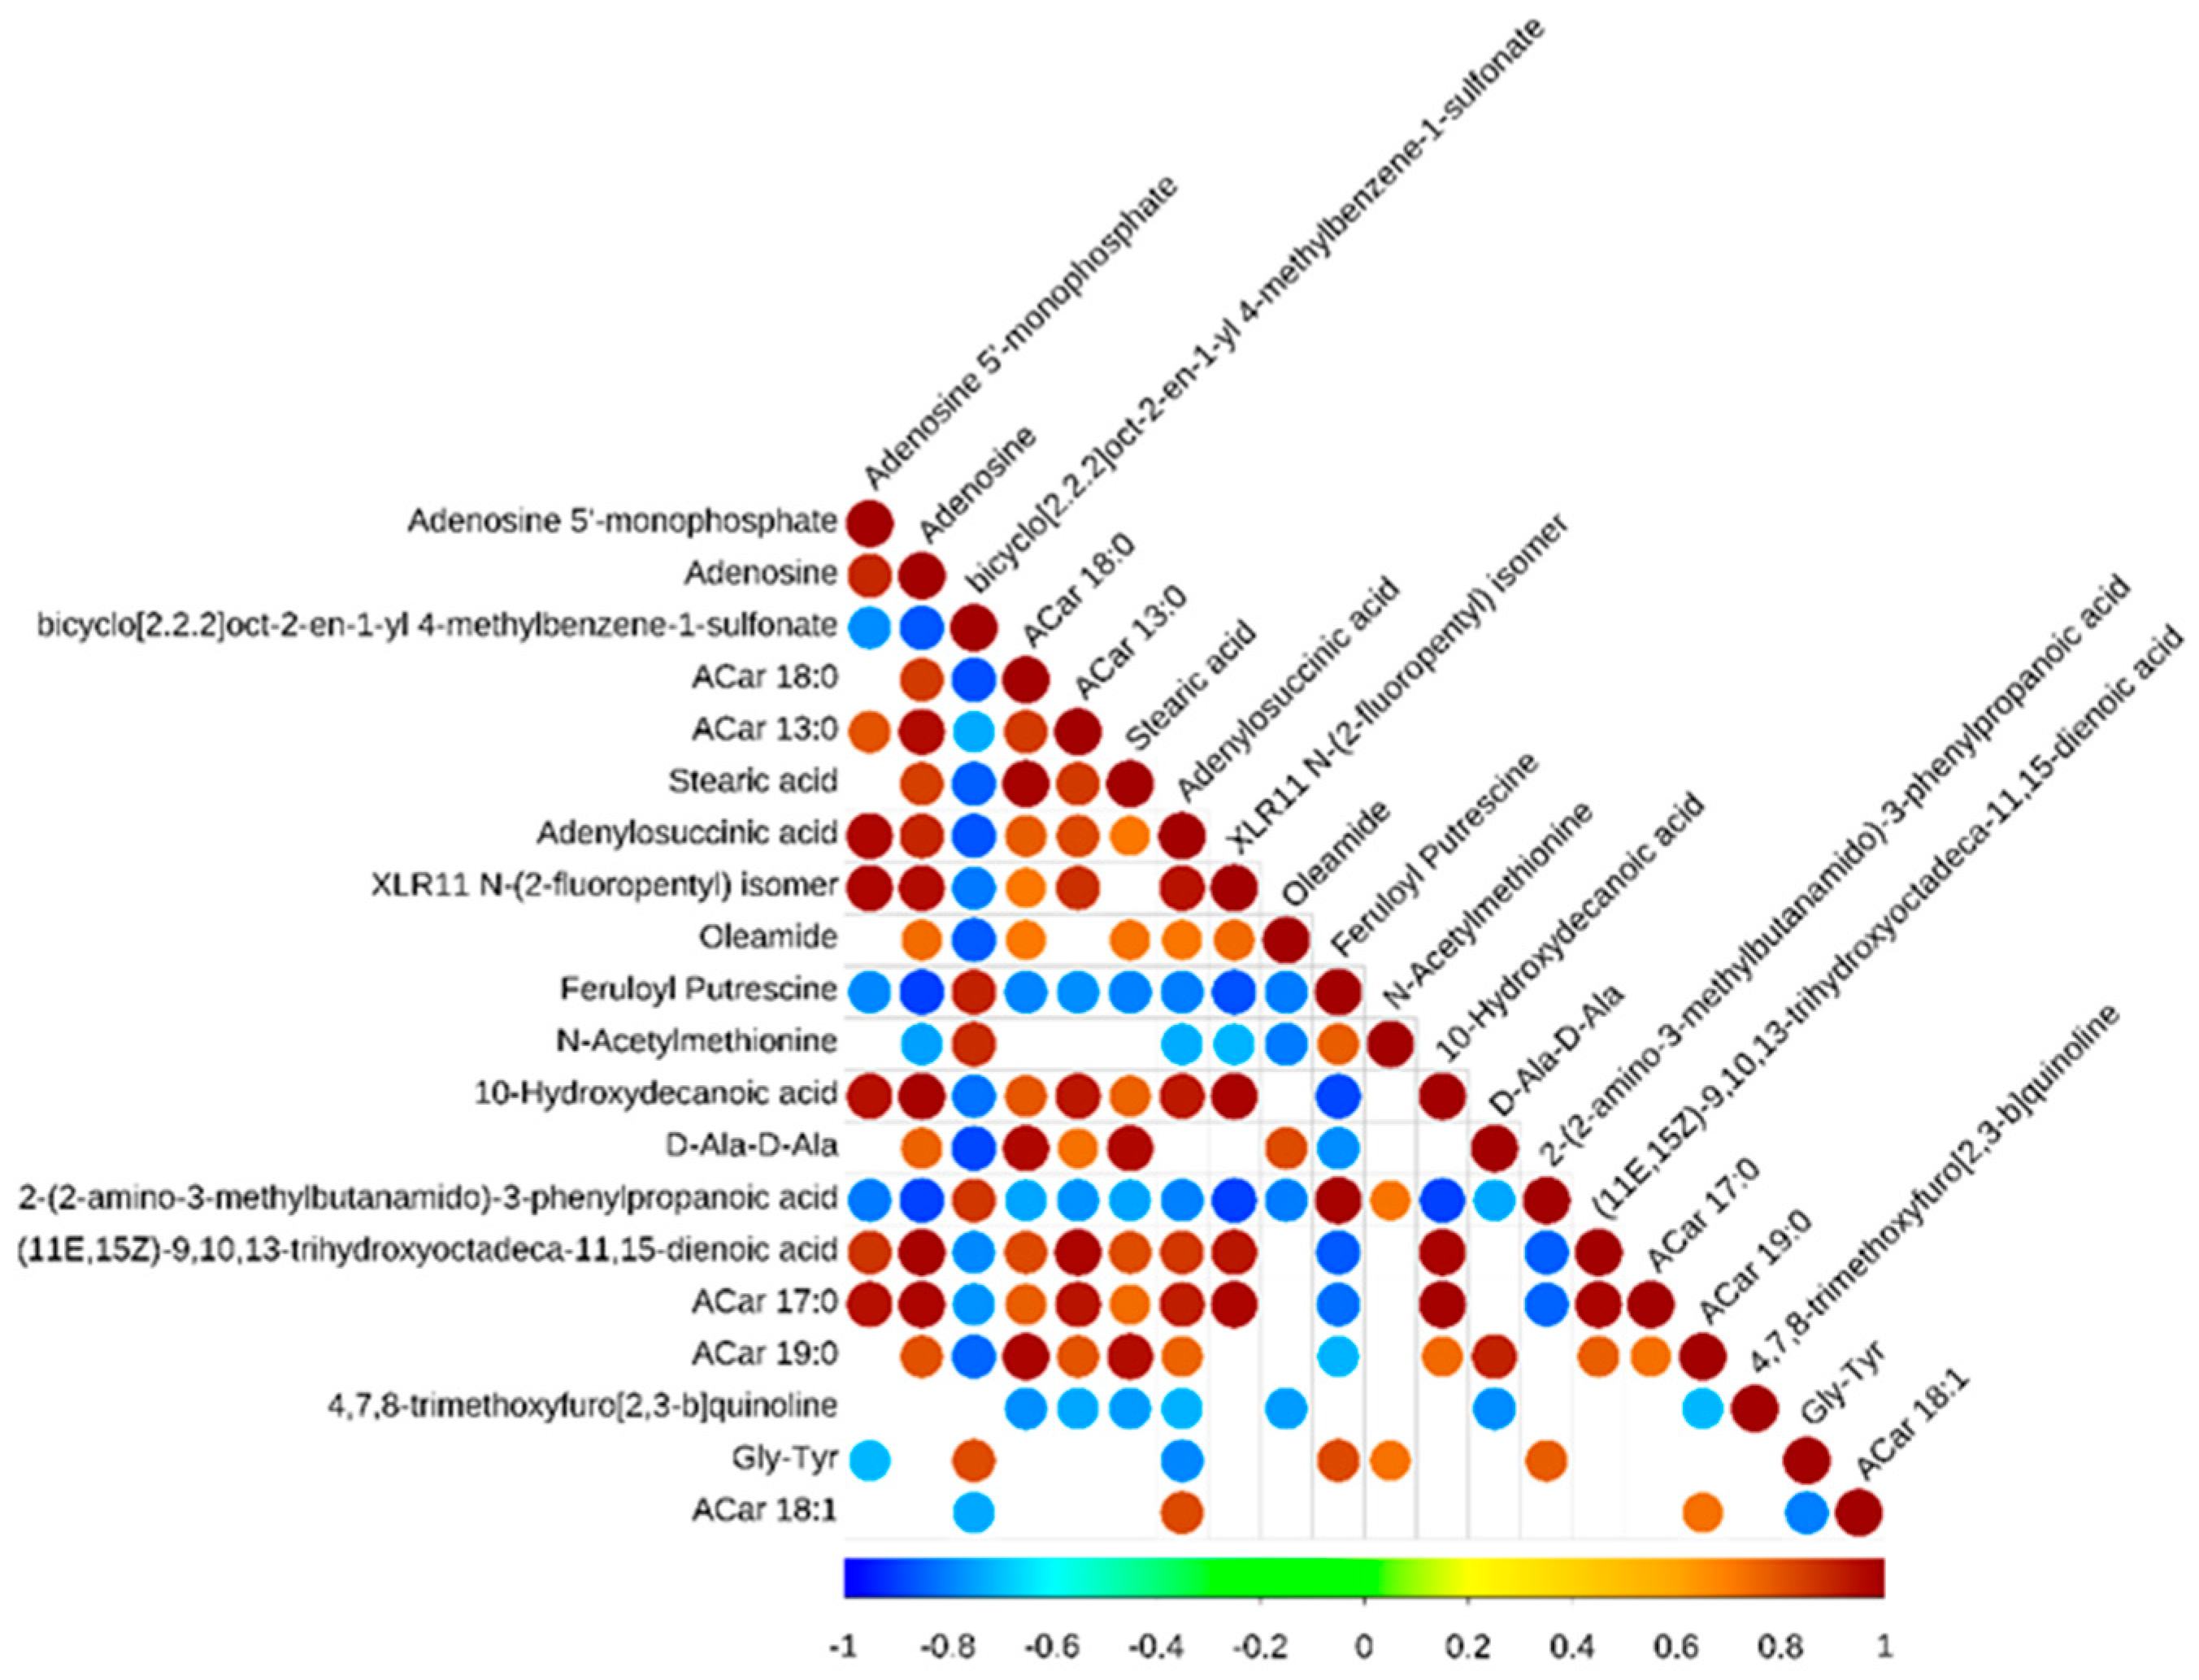
3.6. Correlation Analysis
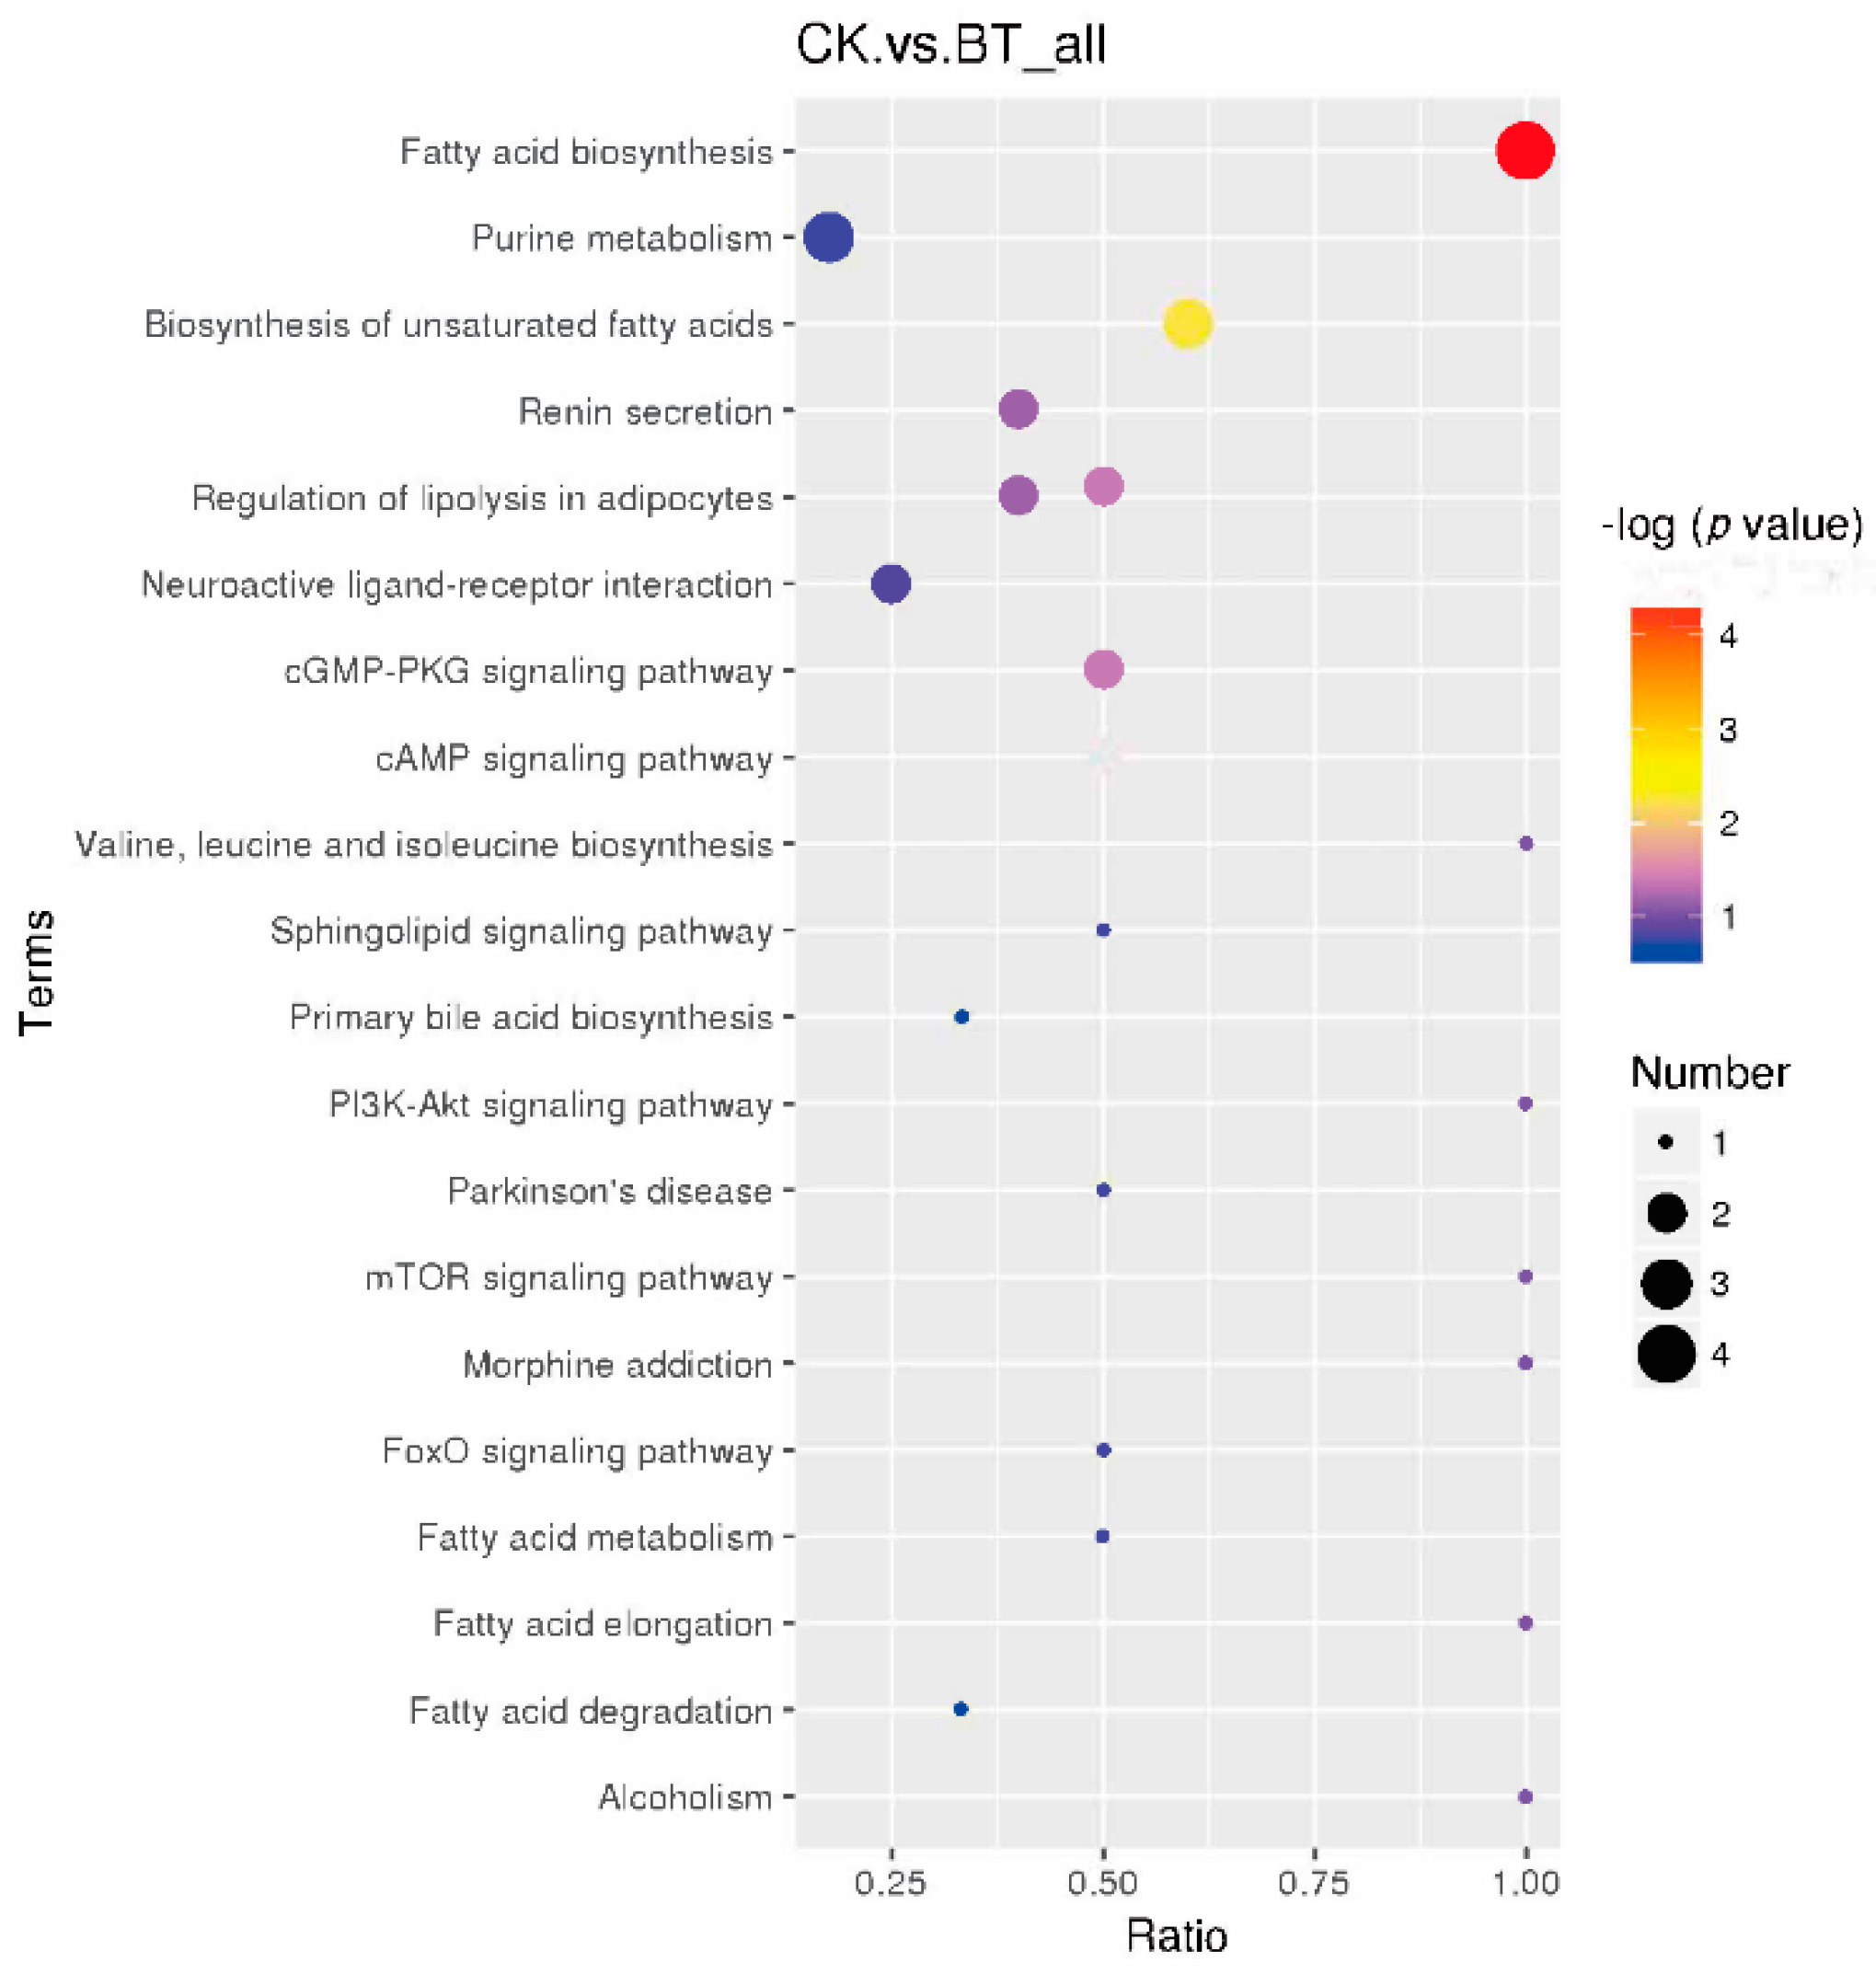
3.7. KEGG Pathways
4. Discussion
5. Conclusions
Author Contributions
Funding
Institutional Review Board Statement
Informed Consent Statement
Data Availability Statement
Acknowledgments
Conflicts of Interest
References
- Wiener, G.; Han, J.L.; Long, R.J. The Yak, 2nd ed.; RAP Publication: Bangkok, Thailand, 2003. [Google Scholar]
- Cui, G.X.; Yuan, F.; Degen, A.A.; Liu, S.M.; Zhou, J.W.; Shang, Z.H.; Ding, L.M.; Mi, J.D.; Wei, X.H.; Long, R.J. Composition of the milk of yaks raised at different altitudes on the Qinghai-Tibet Plateau. Int. Dairy J. 2016, 59, 29–35. [Google Scholar] [CrossRef]
- Alvarenga, T.I.R.C.; Chen, Y.; Furusho-Garcia, I.F.; Perez, J.; Olalquiaga, R.; Hopkins, D.L. Manipulation of omega-3 PUFAs in lamb: Phenotypic and genotypic views. Compr. Rev. Food. Sci. F. 2015, 14, 189–204. [Google Scholar] [CrossRef]
- Zhang, Q.; Que, M.; Li, W.; Gao, S.; Tan, X.; Bu, D. Gangba sheep in the Tibetan plateau: Validating their unique meat quality and grazing factor analysis. J. Environ. Sci. 2021, 101, 117–122. [Google Scholar] [CrossRef]
- Cheng, J.; Zhao, H.; Chen, N.; Cao, X.; Hanif, Q.; Pi, L.; Hu, L.; Chaogetu, B.; Huang, Y.; Lan, X.; et al. Population structure, genetic diversity, and selective signature of Chaka sheep revealed by whole genome sequencing. BMC Genom. 2020, 21, 520. [Google Scholar] [CrossRef]
- Wang, X.; Xu, T.; Zhang, X.; Geng, Y.; Kang, S.; Xu, S. Effects of dietary protein levels on growth performance, carcass traits, serum metabolites, and meat composition of Tibetan sheep during the cold season on the Qinghai-Tibet Plateau. Animals 2020, 10, 801. [Google Scholar] [CrossRef]
- Zhang, M.; Guo, Y.; Su, R.; Corazzin, M.; Li, J.; Huang, H.; Zhang, Y.; Yao, D.; Su, L.; Zhao, L.; et al. Effects of physical exercise on muscle metabolism and meat quality characteristics of Mongolian sheep. Food. Sci. Nutr. 2022, 10, 1494–1509. [Google Scholar] [CrossRef]
- Karisa, B.K.; Thomson, J.; Wang, Z.; Li, C.; Montanholi, Y.R.; Miller, S.P.; Moore, S.S.; Plastow, G.S. Plasma metabolites associated with residual feed intake and other productivity performance traits in beef cattle. Livest. Sci. 2014, 165, 200–211. [Google Scholar] [CrossRef]
- Warner, R.D.; Jacob, R.H.; Rosenvold, K.; Rochfort, S.; Trenerry, C.; Plozza, T.; McDonagh, M.B. Altered post-mortem metabolism identified in very fast chilled lamb M. longissimus thoracis et lumborum using metabolomic analysis. Meat Sci. 2015, 108, 155–164. [Google Scholar] [CrossRef]
- Wang, B.; Luo, Y.; Su, R.; Yao, D.; Hou, Y.; Liu, C.; Du, R.; Jin, Y. Impact of feeding regimens on the composition of gut microbiota and metabolite profiles of plasma and feces from Mongolian sheep. J. Microbiol. 2020, 58, 472–482. [Google Scholar] [CrossRef]
- Zhang, X.; Xu, T.; Wang, X.; Geng, Y.; Zhao, N.; Hu, L.; Liu, H.; Kang, S.; Xu, S. Effect of dietary protein levels on dynamic changes and interactions of ruminal microbiota and metabolites in yaks on the Qinghai-Tibet Plateau. Front. Microbiol. 2021, 12, 684340. [Google Scholar] [CrossRef]
- Muroya, S.; Ueda, S.; Komatsu, T.; Miyakawa, T.; Ertbjerg, P. MEATabolomics: Muscle and meat metabolomics in domestic animals. Metabolites 2020, 10, 188. [Google Scholar] [CrossRef] [PubMed]
- Association of Official Analytical Chemists (AOAC). Official Methods of Analysis, 16th ed.; AOAC International: Washington, DC, USA, 1997. [Google Scholar]
- Folch, J.; Lees, M.; Stanley, G.H.S. A simple method for the isolation and purification of total lipides from animal tissues. J. Biol. Chem. 1957, 226, 497–509. [Google Scholar] [CrossRef]
- Want, E.; Masson, P.; Michopoulos, F.; Wilson, I.D.; Theodoridis, G.; Plumb, R.S.; Shockcor, J.; Loftus, N.; Elaine, H.; Nicholson, J.K. Global metabolic profiling of animal and human tissues via UPLC-MS. Nat. Protoc. 2013, 8, 17–32. [Google Scholar] [CrossRef] [PubMed]
- Wen, B.; Mei, Z.; Zeng, C.; Liu, S. MetaX: A flexible and comprehensive software for processing metabolomics data. BMC Bioinform. 2017, 18, 183. [Google Scholar] [CrossRef] [PubMed] [Green Version]
- Huang, Y.N.; Ao, Q.W.; Jiang, Q.Y.; Guo, Y.F.; Lan, G.Q.; Jiang, H.S. Comparisons of different myosin heavy chain types, AMPK, and PGC-1α gene expression in the longissimus dorsi muscles in Bama Xiang and Landrace pigs. Genet. Mol. Res. 2016, 15, 15028379. [Google Scholar] [CrossRef] [PubMed]
- Şirin, E.; Aksoy, Y.; Uğurlu, M.; Çiçek, Ü.; Önenç, A.; Ulutaş, Z.; Şen, U.; Kuran, M. The relationship between muscle fiber characteristics and some meat quality parameters in Turkish native sheep breeds. Small Rumin. Res. 2017, 150, 46–51. [Google Scholar] [CrossRef]
- Bünger, L.; Navajas, E.A.; Stevenson, L.; Lambe, N.R.; Maltin, C.A.; Simm, G.; Fisher, A.V.; Chang, K.C. Muscle fibre characteristics of two contrasting sheep breeds: Scottish Blackface and Texel. Meat Sci. 2009, 81, 372–381. [Google Scholar] [CrossRef]
- Wang, Y.; Wang, Z.; Hu, R.; Peng, Q.; Xue, B.; Wang, L. Comparison of carcass characteristics and meat quality between Simmental crossbred cattle, Cattle-yaks, and Xuanhan yellow cattle. J. Sci. Food. Agr. 2021, 101, 3927–3932. [Google Scholar] [CrossRef]
- Shija, D.S.; Mtenga, L.A.; Kimambo, A.E.; Laswai, G.H.; Mushi, D.E.; Mgheni, D.M.; Mwilawa, A.J.; Shirima, E.J.M.; Safari, J.G. Chemical composition and meat quality attributes of indigenous sheep and goats from traditional production system in Tanzania. Asian. Austral. J. Anim. 2013, 26, 295–302. [Google Scholar] [CrossRef] [Green Version]
- Lee, J.H.; Kannan, G.; Eega, K.R.; Kouakou, B.; Getz, W.R. Nutritional and quality characteristics of meat from goats and lambs finished under identical dietary regime. Small Rumin. Res. 2008, 74, 255–259. [Google Scholar] [CrossRef]
- Aurousseau, B.; Bauchart, D.; Faure, X.; Galot, A.L.; Prache, S.; Micol, D.; Priolo, A. Indoor fattening of lambs raised on pasture. Part 1: Influence of stall finishing duration on lipid classes and fatty acids in the longissimus thoracis muscle. Meat Sci. 2007, 76, 241–252. [Google Scholar] [CrossRef] [PubMed]
- Mezöszentgyörgyi, D.; Husvéth, F.; Lengyel, A.; Szegleti, C.; Komlósi, I. Genotype-related variations in subcutaneous fat composition in sheep. Anim. Sci. J. 2001, 72, 607–612. [Google Scholar] [CrossRef]
- Van Harten, S.; Kilminster, T.; Scanlon, T.; Milton, J.; Oldham, C.; Greeff, J.; Almeida, A.M. Fatty acid composition of the ovine longissimus dorsi muscle: Effect of feed restriction in three breeds of different origin. J. Sci. Food. Agr. 2015, 96, 1777–1782. [Google Scholar] [CrossRef] [PubMed]
- Lopes, L.S.; Martins, S.R.; Chizzotti, M.L.; Busato, K.C.; Oliveira, I.M.; Machado Neto, O.R.; Paulino, P.V.R.; Lanna, D.P.D.; Ladeira, M.M. Meat quality and fatty acid profile of Brazilian goats subjected to different nutritional treatments. Meat Sci. 2014, 97, 602–608. [Google Scholar] [CrossRef] [PubMed] [Green Version]
- Smith, S.B.; Gill, C.A.; Lunt, D.K.; Brooks, M.A. Regulation of fat and fatty acid composition in beef cattle. Asian Austral. J. Anim. 2009, 22, 1225–1233. [Google Scholar] [CrossRef]
- Gonzales-Barron, U.; Popova, T.; Bermúdez Piedra, R.; Tolsdorf, A.; Geß, A.; Pires, J.; Domínguez, R.; Chiesa, F.; Brugiapaglia, A.; Viola, I.; et al. Fatty acid composition of lamb meat from Italian and German local breeds. Small Rumin. Res. 2021, 200, 106384. [Google Scholar] [CrossRef]
- Raes, K.; Fievez, V.; Chow, T.T.; Ansorena, D.; Demeyer, D.; De Smet, S. Effect of diet and dietary fatty acids on the transformation and incorporation of C18 fatty acids in double-muscled Belgian blue young bulls. J. Agr. Food Chem. 2004, 52, 6035–6041. [Google Scholar] [CrossRef] [Green Version]
- Scerra, M.; Luciano, G.; Caparra, P.; Foti, F.; Cilione, C.; Giorgi, A.; Scerra, V. Influence of stall finishing duration of Italian Merino lambs raised on pasture on intramuscular fatty acid composition. Meat Sci. 2011, 89, 238–242. [Google Scholar] [CrossRef]
- Zhang, X.; Han, L.; Hou, S.; Raza, S.H.A.; Wang, Z.; Yang, B.; Sun, S.; Ding, B.; Gui, L.; Simal-Gandara, J.; et al. Effects of different feeding regimes on muscle metabolism and its association with meat quality of Tibetan sheep. Food Chem. 2022, 374, 131611. [Google Scholar] [CrossRef]
- Pedley, A.M.; Benkovic, S.J. A new view into the regulation of purine metabolism: The purinosome. Trends Biochem. Sci. 2017, 42, 141–154. [Google Scholar] [CrossRef]
- Huang, Q.; Dong, K.; Wang, Q.; Huang, X.; Wang, G.; An, F.; Luo, Z.; Luo, P. Changes in volatile flavor of yak meat during oxidation based on multi-omics. Food Chem. 2022, 371, 131103. [Google Scholar] [CrossRef] [PubMed]
- Stayton, M.M.; Rudolph, F.B.; Fromm, H.J. Regulation, genetics, and properties of adenylosuccinate synthetase: A review. Curr. Top. Cell. Regul. 1983, 22, 103–141. [Google Scholar] [CrossRef] [PubMed]
- De Oliveira, C.C.; Paiva Caria, C.R.; Ferreira Gotardo, E.M.; Ribeiro, M.L.; Gambero, A. R adenylosuccinateA adenosine receptor agonists in adipose tissue inflammation induced by obesity in mice. Eur. J. Pharmacol. 2017, 799, 154–159. [Google Scholar] [CrossRef] [PubMed]
- De Carvalho, F.G.; Barbieri, R.A.; Carvalho, M.B.; Dato, C.C.; Campos, E.Z.; Gobbi, R.B.; Papoti, M.; Silva, A.S.R.; de Freitas, E.C. Taurine supplementation can increase lipolysis and affect the contribution of energy systems during front crawl maximal effort. Amino Acids. 2018, 50, 189–198. [Google Scholar] [CrossRef] [Green Version]
- Fain, J.N.; Garcĩa-Sáinz, J.A. Adrenergic regulation of adipocyte metabolism. J. Lipid Res. 1983, 24, 945–966. [Google Scholar] [CrossRef]
- Sarmadi, B.H.; Ismail, A. Antioxidative peptides from food proteins: A review. Peptides 2010, 31, 1949–1956. [Google Scholar] [CrossRef]
- Grimble, G.K. The significance of peptides in clinical nutrition. Annu. Rev. Nutr. 1994, 14, 419–447. [Google Scholar] [CrossRef]
- Sarower, M.G.; Hasanuzzaman, A.; Biswas, B.; Abe, H. Taste producing components in fish and fisheries products: A review. Intl. J. Food. Ferment. Technol. 2012, 2, 113–121. [Google Scholar]


| BT 1 | CK 2 | SEM 3 | p-Value | |
|---|---|---|---|---|
| Diameter, μm | 51.46 ± 5.867 | 42.23 ± 3.102 | 3.319 | 0.032 |
| Perimeter, μm | 166.14 ± 18.604 | 131.78 ± 14.362 | 11.751 | 0.026 |
| Area, μm2 | 1998.64 ± 531.776 | 1328.74 ± 257.096 | 295.332 | 0.064 |
| BT 1 | CK 2 | SEM 3 | p-Value | |
|---|---|---|---|---|
| DM | 26.57 ± 0.473 | 27.38 ± 1.589 | 0.958 | 0.452 |
| Ash | 2.27 ± 0.235 | 1.71 ± 0.192 | 0.151 | 0.010 |
| EE | 3.51 ± 0.184 | 5.07 ± 2.132 | 1.070 | 0.239 |
| CP | 19.87 ± 0.598 | 19.13 ± 0.668 | 0.448 | 0.145 |
| (%) | BT 1 | CK 2 | SEM 3 | p-Value |
|---|---|---|---|---|
| C10:0 | 0.02 ± 0.004 | 0.05 ± 0.014 | 0.007 | 0.036 |
| C14:0 | 0.43 ± 0.086 | 0.48 ± 0.213 | 0.115 | 0.686 |
| C15:0 | 0.24 ± 0.021 | 0.28 ± 0.011 | 0.012 | 0.030 |
| C15:1 | 6.63 ± 0.671 | 6.21 ± 1.112 | 0.650 | 0.549 |
| C16:0 | 13.95 ± 0.619 | 15.27 ± 1.571 | 0.845 | 0.168 |
| C16:1 | 2.11 ± 0.138 | 2.09 ± 0.135 | 0.097 | 0.804 |
| C17:0 | 1.05 ± 0.110 | 1.05 ± 0.050 | 0.060 | 0.937 |
| C17:1 | 6.50 ± 0.314 | 5.71 ± 0.884 | 0.469 | 0.143 |
| C18:0 | 10.48 ± 0.512 | 11.90 ± 2.581 | 1.315 | 0.353 |
| tC18:1 | 0.76 ± 0.098 | 1.12 ± 0.234 | 0.778 | 0.030 |
| C18:1 | 25.98 ± 2.447 | 25.68 ± 2.878 | 1.315 | 0.614 |
| tC18:2 | 0.33 ± 0.046 | 0.42 ± 0.149 | 0.078 | 0.290 |
| C18:2 | 10.80 ± 0.632 | 10.10 ± 2.552 | 1.315 | 0.614 |
| C18:3 | 2.02 ± 0.219 | 1.69 ± 0.393 | 0.225 | 0.192 |
| C20:1 | 0.16 ± 0.053 | 0.19 ± 0.138 | 0.074 | 0.751 |
| C20:3 | 5.28 ± 0.674 | 5.26 ± 0.994 | 0.600 | 0.975 |
| C20:5 | 2.01 ± 0.256 | 1.59 ± 0.409 | 0.242 | 0.141 |
| C22:6 | 0.72 ± 0.120 | 0.69 ± 0.233 | 0.131 | 0.800 |
| SFAs 4 | 26.17 ± 0.732 | 29.03 ± 4.259 | 2.160 | 0.235 |
| UFAs 5 | 63.29 ± 0.787 | 60.74 ± 3.418 | 1.753 | 0.196 |
| MUFAs 6 | 42.14 ± 2.001 | 40.99 ± 1.131 | 1.149 | 0.358 |
| PUFAs 7 | 20.83 ± 1.358 | 19.33 ± 4.444 | 2.323 | 0.544 |
| n-6 PUFAs | 11.52 ± 0.667 | 10.79 ± 2.748 | 1.414 | 0.622 |
| n-3 PUFAs | 9.30 ± 0.916 | 8.54 ± 1.726 | 0.976 | 0.466 |
| n-6/n-3 | 1.25 ± 0.118 | 1.25 ± 0.115 | 0.082 | 0.951 |
Publisher’s Note: MDPI stays neutral with regard to jurisdictional claims in published maps and institutional affiliations. |
© 2022 by the authors. Licensee MDPI, Basel, Switzerland. This article is an open access article distributed under the terms and conditions of the Creative Commons Attribution (CC BY) license (https://creativecommons.org/licenses/by/4.0/).
Share and Cite
Guo, T.; Wang, X.; Zhang, Q.; Wei, L.; Liu, H.; Zhao, N.; Hu, L.; Xu, S. Comparative Analysis of the Composition of Fatty Acids and Metabolites between Black Tibetan and Chaka Sheep on the Qinghai—Tibet Plateau. Animals 2022, 12, 2745. https://doi.org/10.3390/ani12202745
Guo T, Wang X, Zhang Q, Wei L, Liu H, Zhao N, Hu L, Xu S. Comparative Analysis of the Composition of Fatty Acids and Metabolites between Black Tibetan and Chaka Sheep on the Qinghai—Tibet Plateau. Animals. 2022; 12(20):2745. https://doi.org/10.3390/ani12202745
Chicago/Turabian StyleGuo, Tongqing, Xungang Wang, Qian Zhang, Lin Wei, Hongjin Liu, Na Zhao, Linyong Hu, and Shixiao Xu. 2022. "Comparative Analysis of the Composition of Fatty Acids and Metabolites between Black Tibetan and Chaka Sheep on the Qinghai—Tibet Plateau" Animals 12, no. 20: 2745. https://doi.org/10.3390/ani12202745