Article

Weighted Single-Step Genome-Wide Association Study Uncovers Known and Novel Candidate Genomic Regions for Milk Production Traits and Somatic Cell Score in Valle del Belice Dairy Sheep

by
Hossein Mohammadi
1,*,
Amir Hossein Khaltabadi Farahani
1,
Mohammad Hossein Moradi
1,
Salvatore Mastrangelo
2,
Rosalia Di Gerlando
2,
Maria Teresa Sardina
2,
Maria Luisa Scatassa
3,
Baldassare Portolano
2 and
Marco Tolone
2
1
Department of Animal Sciences, Faculty of Agriculture and Natural Resources, Arak University, Arak 38156-8-8349, Iran
2
Dipartimento Scienze Agrarie, Alimentari e Forestali, University of Palermo, 90128 Palermo, Italy
3
Istituto Zooprofilattico Sperimentale della Sicilia “A. Mirri”, 90129 Palermo, Italy
*
Author to whom correspondence should be addressed.
Animals 2022, 12(9), 1155; https://doi.org/10.3390/ani12091155
Submission received: 3 March 2022 / Revised: 5 April 2022 / Accepted: 25 April 2022 / Published: 29 April 2022
(This article belongs to the Section Animal Genetics and Genomics)

Abstract

:

Simple Summary

Milk production is the most economically crucial dairy sheep trait and constitutes the major genetic enhancement purpose via selective breeding. Also, mastitis is one of the most frequently encountered diseases, having a significant impact on animal welfare, milk yield, and quality. The aim of this study was to identify genomic region(s) associated with the milk production traits and somatic cell score (SCS) in Valle del Belice sheep using single-step genome-wide association (ssGWA) and genotyping data from medium density SNP panels. We identified several genomic regions (OAR1, OAR2, OAR3, OAR4, OAR6, OAR9, and OAR25) and candidate genes implicated in milk production traits and SCS. Our findings offer new insights into the genetic basis of milk production traits and SCS in dairy sheep.

Abstract

The objective of this study was to uncover genomic regions explaining a substantial proportion of the genetic variance in milk production traits and somatic cell score in a Valle del Belice dairy sheep. Weighted single-step genome-wide association studies (WssGWAS) were conducted for milk yield (MY), fat yield (FY), fat percentage (FAT%), protein yield (PY), protein percentage (PROT%), and somatic cell score (SCS). In addition, our aim was also to identify candidate genes within genomic regions that explained the highest proportions of genetic variance. Overall, the full pedigree consists of 5534 animals, of which 1813 ewes had milk data (15,008 records), and 481 ewes were genotyped with a 50 K single nucleotide polymorphism (SNP) array. The effects of markers and the genomic estimated breeding values (GEBV) of the animals were obtained by five iterations of WssGBLUP. We considered the top 10 genomic regions in terms of their explained genomic variants as candidate window regions for each trait. The results showed that top ranked genomic windows (1 Mb windows) explained 3.49, 4.04, 5.37, 4.09, 3.80, and 5.24% of the genetic variances for MY, FY, FAT%, PY, PROT%, and total SCS, respectively. Among the candidate genes found, some known associations were confirmed, while several novel candidate genes were also revealed, including PPARGC1A, LYPLA1, LEP, and MYH9 for MY; CACNA1C, PTPN1, ROBO2, CHRM3, and ERCC6 for FY and FAT%; PCSK5 and ANGPT1 for PY and PROT%; and IL26, IFNG, PEX26, NEGR1, LAP3, and MED28 for SCS. These findings increase our understanding of the genetic architecture of six examined traits and provide guidance for subsequent genetic improvement through genome selection.

1. Introduction

Milk production and udder health are economically important traits affecting dairy farming profitability. Improvement of milk production traits will directly bring greater benefits to dairy operations, and improved mastitis resistance will reduce cost of mastitis treatments [1]. Mastitis is the most common inflammatory condition that develops as a result of infection with pathogenic microorganisms or physical trauma. The expense of lost milk, as well as diminished milk output and quality, are all related to significant economic losses for the dairy sheep industry [2]. Somatic cell count (SCC) or log transformed SCC (somatic cell score, SCS) has relatively higher heritability compared to mastitis (from 0.14 to 0.19 for SCS and from 0.02 to 0.05 for mastitis) and are used as the first trait to improve mastitis resistance [3]. Uncovering regions of the genome associated with milk-related traits and SCS is essential to get inside the biological mechanism involved in their phenotypic expression [4].
In this context, genome-wide association studies (GWAS) are a good way to discover associations between single-nucleotide polymorphism (SNP) markers across the genome and a trait of interest. Nevertheless, the strength of these studies is generally conditioned by the sample available with accurate genotypic and phenotypic data. There are usually a lot of individuals with phenotypes and pedigree, but only a small number with genotypic data. Wang et al. [5] proposed the single-step GWAS (ssGWAS) as an approach to get around this limitation. The ssGWAS method assumes that all SNPs have the same variance, which is improbable in the case of characteristics with segregating main genes or quantitative trait loci (QTL). To overcome the limitations of single-step genomic BLUP (ssGBLUP), a method known as weighted single-step genomic BLUP (WssGBLUP) uses unequal variance or weights for all SNPs [6].
The WssGBLUP [6] is a method that provides the estimation of SNP effects using GEBV predicted by single-step genomic BLUP (ssGBLUP) [7] on the basis of all phenotypes, genotypes, and pedigree data. Furthermore, WssGWAS allows for unequal variances for SNPs, which increases the accuracy of SNP effect estimation [6]. Therefore, the WssGWAS might work better than classical GWAS methods when few animals are available with phenotypic and genotypic data, and the traits are under the control of a QTL with large effects [8]. As a result, using a sliding window method, WssGWAS allows researchers to give a different weight to the SNPs and to test many markers at the same time. Therefore, this approach could allow obtaining more accurate estimations of the genetic parameters than traditional GWAS, resulting in higher QTL detection power [9].
The WssGWAS has been successfully applied for milk production traits and feed efficiency in cattle [10,11,12,13] and in goats [14], and for wool and weight traits in sheep [15]. However, few studies examining milk production traits and SCS in dairy sheep have been conducted using WssGWAS.
The Valle del Belice (VDB) is the main economically important dairy breed reared in Sicily. Nowadays, part of the milk produced by this breed is transformed into two PDO (Protected Designation of Origin) cheeses: the mono-breed Vastedda della Valle del Belice and the Pecorino Siciliano. Preliminary analyses on GWAS for milk production and quality traits have been reported in the VDB breed [16]. However, no studies have been obtained so far in this breed using WssGWAS. Hence, the goals were (1) to identify SNP windows that account for the greater amount of the genetic variance in milk yield (MY), fat yield (FY) and percentage (FAT%), protein yield (PY) and percentage (PROT%), and somatic cell score (SCS) in Valle del Belice breed using a weighted single-step approach and (2) to investigate for putative candidate genes within them.

2. Materials and Methods

2.1. Phenotypes and Pedigree

The pedigree file included 5534 animals with 178 sires and 2548 dams. About 15,000 observations were collected for 1813 Valle del Belice sheep from 15 different herds between 2006 and 2016. The A4 recording procedure was followed to record the following data [17]: daily milk yield (MY), fat yield (FY), fat percentage (FAT%), protein yield (PY), protein percentage (PROT%), and milk SCC. SCC was log-transformed into somatic cell score (SCS) [18]. A detailed summary of the phenotypic records for each trait is in Table 1.

2.2. Genotyping and Quality Control

A total of 481 ewes were genotyped with the Illumina OvineSNP50K BeadChip. The ovine genome sequence assembly Oar_v4.0 revealed chromosomal coordinates for each SNP. Quality control was performed using the PLINK v. 1.9 [19]. Animals and markers that did not fulfil the following criteria were removed from the analysis: (i) minor allele frequency 2% or less, (ii) call rate per individual and per SNP 95% or greater and (iii) no extreme deviation from Hardy-Weinberg equilibrium (p ≥ 0.001, Bonferroni corrected). A total of 469 ewes and 37,228 SNPs were retained for analysis after quality control.

2.3. Weighted Single-Step Genome-Wide Association Study

Since this approach can use both genotyped and ungenotyped animals in the pedigree, a total of 1332 ungenotyped animals were included in the analysis. Moreover, 5534 individuals in the pedigree file were used to estimate GEBV and SNP effects, recognizing that sample size might affect the power of GWAS [8].
The analyses were carried out using the BLUPF90 family programs. In particular, the RENUMF90 package was used to renumber animals and effects sequentially and construct the input files for AIREMLF90 and BLUPF90 modules to predict GEBV [9]. Finally, the postGSf90 package was used to perform the WssGWAS [7].
The six traits were analyzed using the following single trait animal model in WssGBLUP [14]:
y = X β + Z h t d + Z a + W p + e
where y is the vector of phenotypic observations, and β is the vector of fixed effects as reported in [16]. It was assumed that
α ~ N ( 0 , H σ a 2 ) ;   p ~ N ( 0 , I σ p 2 ) ;   e ~ N ( 0 , I σ e 2 )
where σ a 2 σ p 2 , , and σ e 2 were the random additive genetic variance, random permanent environmental and residual variance, respectively. I denoted the identity matrix, and H was a blend of pedigrees and the SNP derived matrix. The inverse of matrix H was calculated as follows:
H 1 = A 1 + [ 0 0 0 G 1 A 22 1 ]
where A represented the numerator relationship matrix for all individuals based on the pedigree; A22 was the numerator relationship matrix for the genotyped animals; the G matrix was a genomic relationship matrix that was constructed according the method of VanRaden et al. [20]:
G = Z D Z i = 1 M 2 p i   ( 1 p i )
where Z is the marker matrix coded for allele frequencies (aa = 0; Aa = 1, and AA = 2), and D is a diagonal matrix of weights for SNP variances. M is the number of markers, and p i is equal to the minor allele frequency of the ith SNP. For ssGWAS, the SNP effects and weights were determined iteratively as follows [5]:
Step 1: in the first iteration (t = 1), D(t) = I; G(t) = ZD(t) Z λ , where λ is a normalization constant or a variance ratio that was estimated following VanRaden et al. [20]:
λ = σ u 2 σ a 2 = 1 i = 1 M 2 p i   ( 1 p i )
Step 2: estimated GEBV for all animals using the ssGBLUP approach;
Step 3: calculated SNP effects as: u ^ ( t ) = λ D ( t ) Z G ( t ) 1 a ^ g , where u ^ ( t ) is a vector of the SNP effects estimation and a ^ g was the GEBV of individuals with genotypes;
Step 4: the weight of each SNP is equal to: d i ( t + 1 ) = u ^ i ( t ) 2 2 p i ( 1 p i ) , where i is the ith SNP;
Step 5: the SNP weights are normalized to keep the total genetic variance constant:
D ( t + 1 ) = t r ( D ( 1 ) ) t r ( D ( t + 1 ) ) D ( t + 1 ) ;
Step 6: the weighted matrix G is calculated: G ( t + 1 ) = Z D ( t + 1 ) Z λ ; and
Step 7: loop back to step 2.
The number of iterations for weighting procedure in WssGWAS was determined as the iteration number that maximized the accuracy of predictions. Iterations increase the weights of SNPs with large effects and decrease those with small effects [6]. The procedure was run for five iterations on the basis of the accuracies of GEBV for our study. The proportion of variance explained by non-overlapping windows was estimated using the PostGSf90 algorithm by summing the variance of SNPs within 1 megabase (Mb) [21].

2.4. Detection of top SNP Windows and Functional Annotations of Candidate Genes

Putative candidate genes were identified based on initial and final coordinates of each selected window on the Oar v4.0 assembly of the ovine genome, using the NCBI Genome Data Viewer (https://www.ncbi.nlm.nih.gov/genome/gdv/?org=ovis-aries, accessed on 20 November 2015), within the top 10 windows explaining the highest percentage of additive genetic variance. The selection of the top 10 windows explaining the highest percentages of additive genetic variance is a methodology widely used in association studies to evaluate several traits in different animal species [15,22,23]. For all identified genes, literature and database searches were performed to investigate the metabolic function of the genes identified. We used the DAVID bioinformatics database (http://david.abcc.ncifcrf.gov/, accessed on 21 December 2021) to conduct Gene Ontology (GO) and Kyoto Encyclopedia of Genes and Genomes (KEGG) enrichment analysis to better understand the biological processes and pathways represented by these candidate genes. Fisher’s exact test was used to determine which terms were significantly enriched (p < 0.05).

3. Results and Discussion

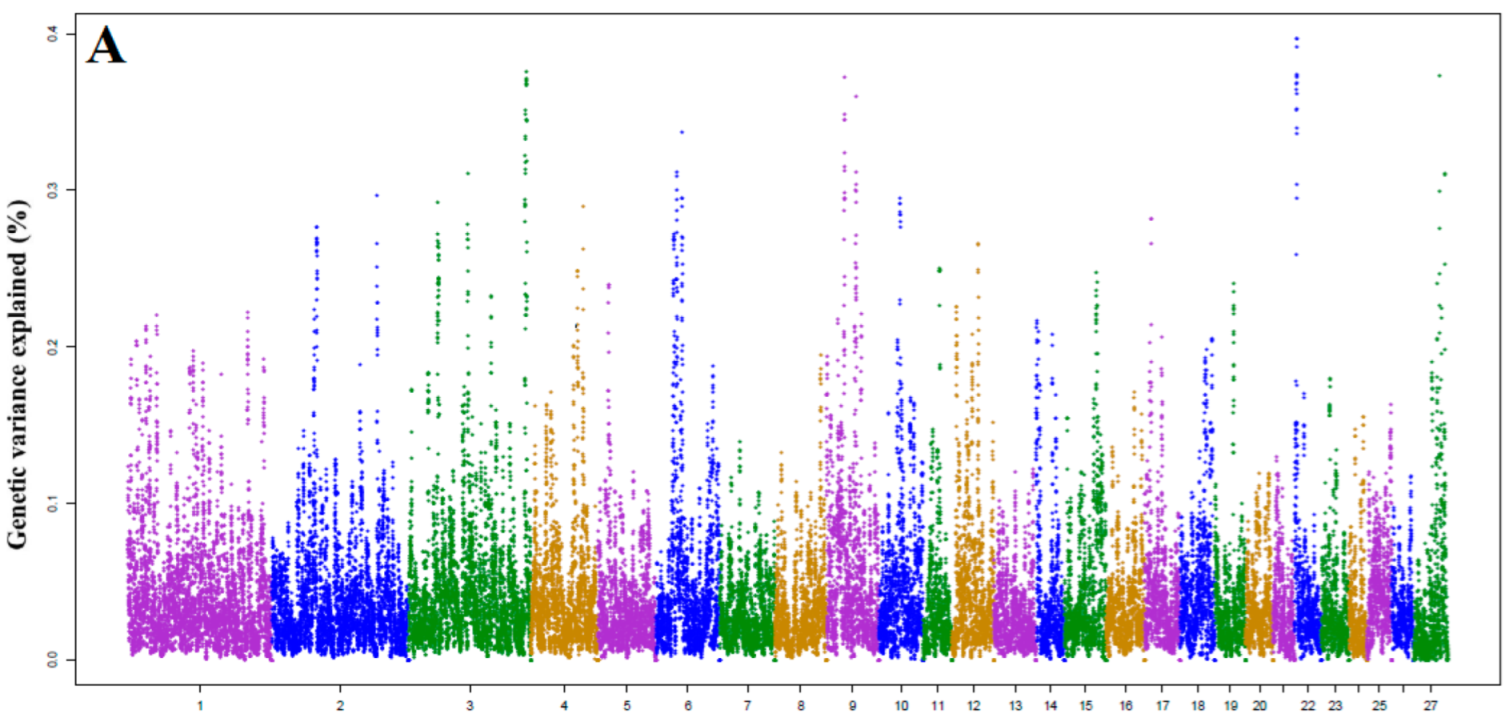
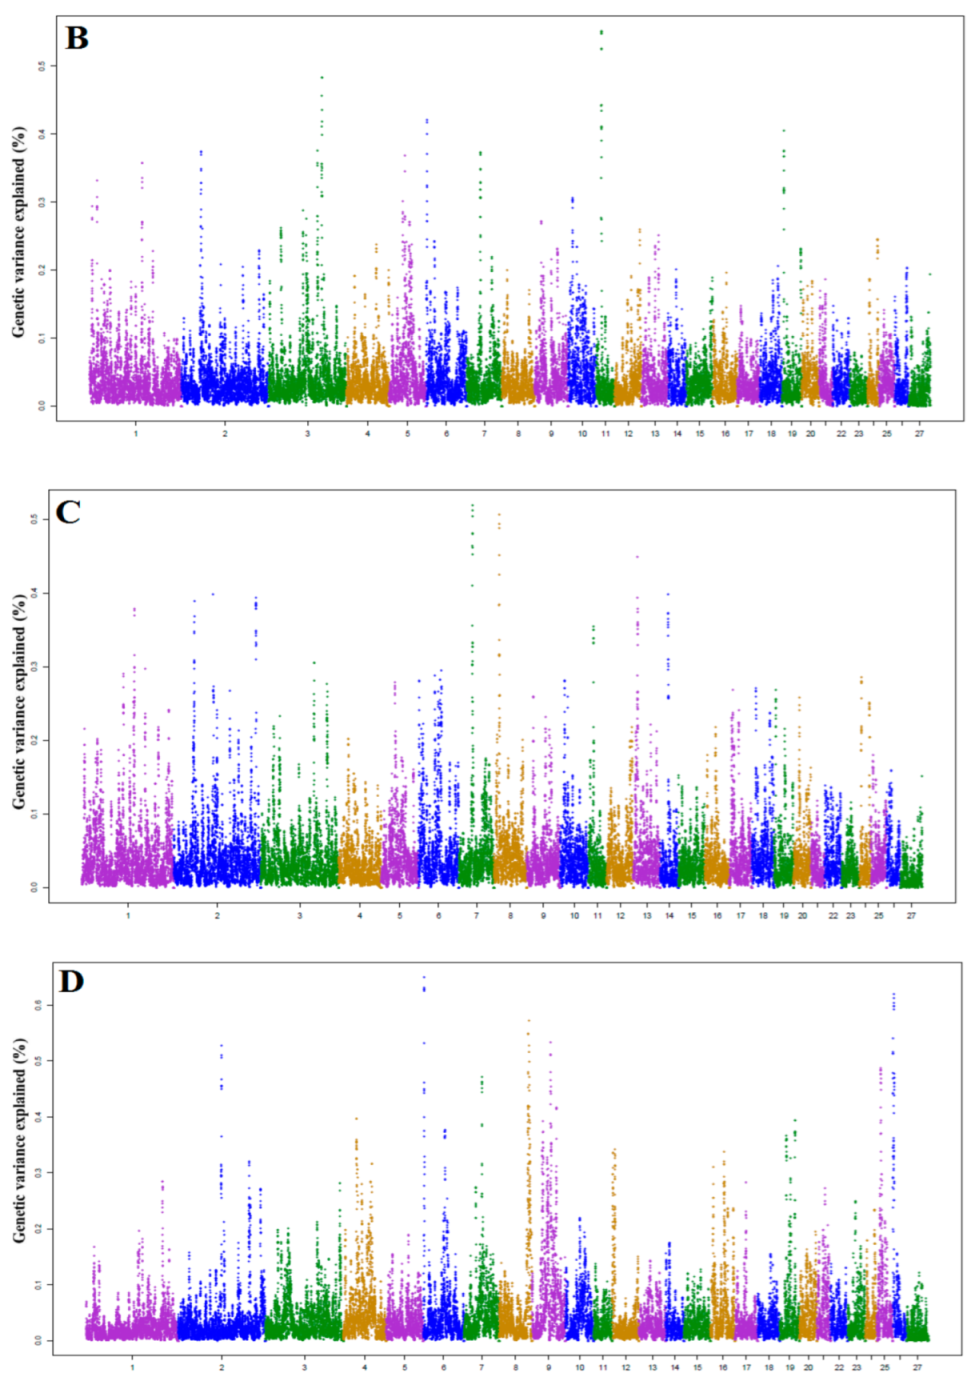
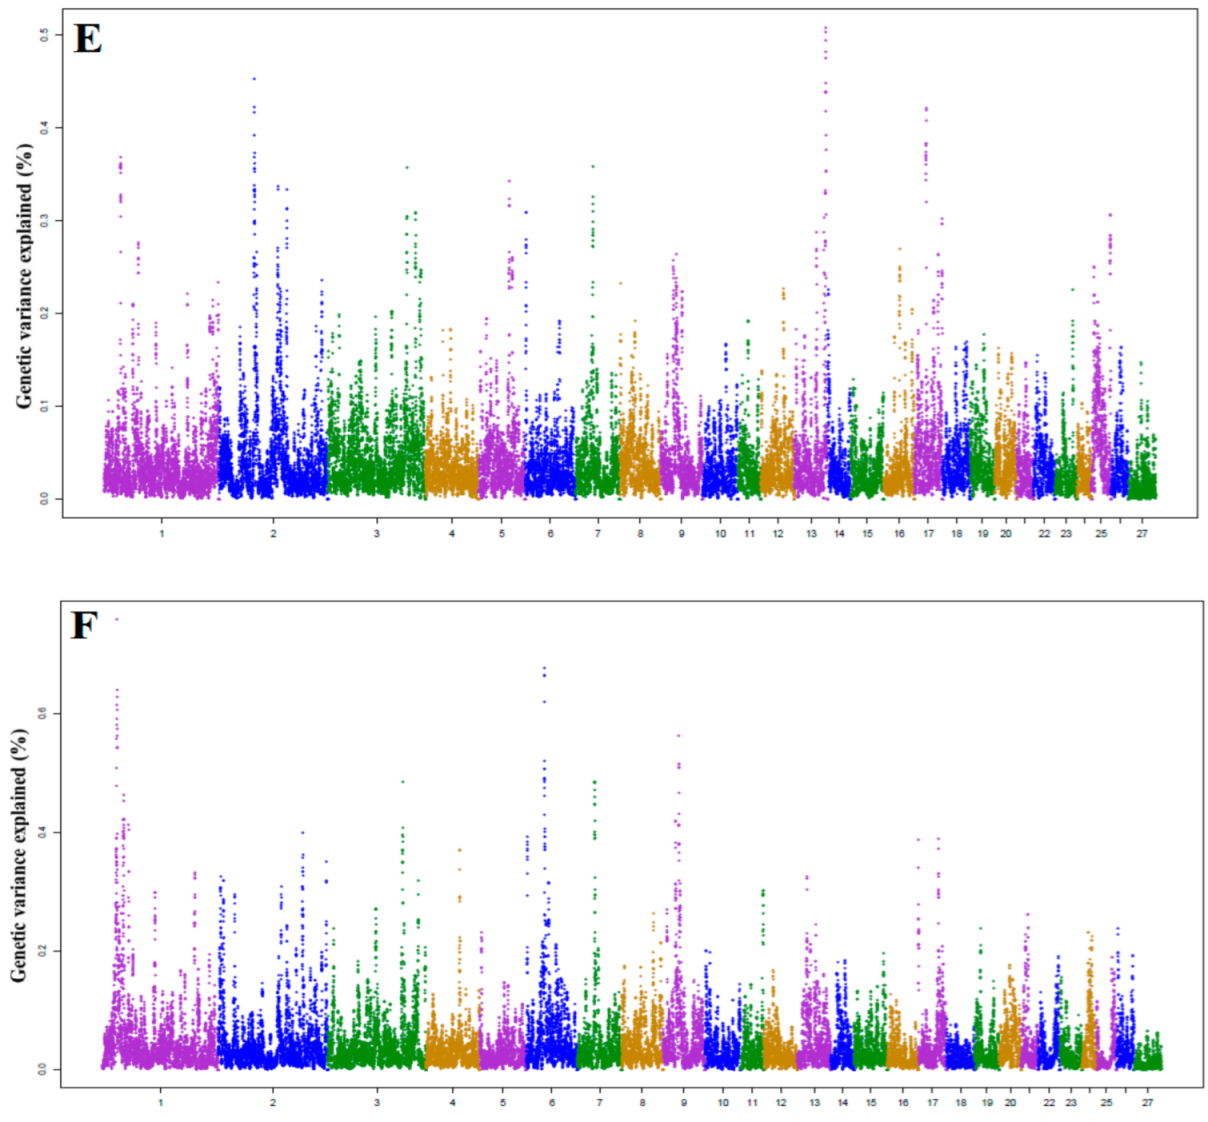
3.1. Identification of Genomic Region and Candidate Genes

In our previous study, a classical GWAS (single-SNP GWAS) was performed for SCS in the VDB breed [16]. In the present investigation, many more genomic region windows affecting this trait were identified, and the explained genetic variance was up to 0.75%, which demonstrated that the WssGWAS was more successful in identifying window compared with our previous analysis.
Of the top 10 genomic windows identified for SCS, one was reported in our prior GWAS results and contained the gene NEGR1 [16]. NEGR1 (on OAR1) is a member of the LON family of immunoglobulins (IgLON) of Glycosylated (GPI-anchored) cell adhesion molecules that also includes Limbic system-associated membrane protein (LAMP), neurotrimin [24]. The gene is related with medium white blood cell count in Yak [25].
In addition, we found several genes which were not previously reported for the studied traits. For example, ROBO2, a fat-related QTL in marbling score [26], was identified as a novel candidate gene for milk fat yield and protein yield in the present study.
Across the six traits, the total genetic variation explained by the top 10 ranked windows varied from 3.49% (MY) to 5.24% (SCS). The largest genetic variance explained by a window was 0.75% for SCS and 0.64% for milk fat percentage, respectively. However, the majority of the windows explained less than 0.5%, and these low-contributing regions spread throughout the genome for all analyzed traits. This suggests that both milk production traits and SCS are moderately to highly polygenic, that is many regions over the genome contribute to the genetic variation of the traits (Figure 1).
The top 10 ranked windows for each trait by that explained the largest proportion of additive genetic variance and the important candidate genes for all investigated traits are presented in Table 2, Table 3, Table 4 and Table 5. The characteristics of these window regions for the six traits are explained in detail in the following paragraphs.

3.2. Candidate Genes for Milk Yield (MY)

Using the WssGWAS method, the top 10 identified genomic regions related with milk yield, in terms of percentage of genetic variance explained (%), were detected on chromosomes 3, 4, 6, 9, 22, and 27. The discovered genomic regions explained 0.29–0.39% of the additive genetic variances and jointly explained 3.49% for MY. Within these windows, there were 33 known genes (Figure 1A and Table 2).
The most important window region was located on OAR6: 47,499,788–48,496,456 bp, and explained 0.33% of the genetic variance for MY.
Two genes were previously reported to directly regulate milk yield [27,28]. The PPARGC1A gene is involved in the activation of various significant hormone receptors, in thermogenesis, gluconeogenesis, glucose transport, and β-oxidation of fatty acids [29].
Polymorphism of PPARGC1A gene in Italian Mediterranean buffaloes was associated with milk yield and protein percentage [28]. In Italian Holstein cattle, the SNPs harbored in PPARGC1A gene on BTA6 were linked with milk yield, protein yield and percentage [27]. Consequently, PPARGC1A could act as a marker gene for milk production traits also in the Valle del Belìce breed. LYPLA1 has been reported as candidate gene in the regulation of prolactin secretion, feed intake and gain in cattle [30], and as marker involved in milk yield in Chios dairy sheep population [31].
The second most important window (OAR4: 92,470,191–93,383,584 bp) was located inside the leptin (LEP) gene, which is of great importance in animal growth and metabolism [32]. It controls feed intake, energy metabolism, and body fat distribution [33]. Genetic variants identified in LEP have been proven to affect milk production in cows [34]. Furthermore, a polymorphism located in the LEP gene was found to be associated with milk production in Najdi sheep breed [35].
Other genes were demonstrated to have mechanisms indirectly related to milk yield [36]. The MYH9 gene is a member of the myosin superfamily which shares the common characteristics of the hydrolytic activity of ATPase, actin binding, and potential for kinetic energy transduction. Myosin plays an important role in muscle growth and contraction [37]. Moreover, Lopdell et al. [38] found that MYH9 is associated with milk phenotypes in cattle together with CSF2RB.

3.3. Candidate Genes for Milk Fat Yield (FY) and Fat Percentage (FAT%)

For FY, there were nine chromosomes that contain associated genomic regions, including chromosomes OAR1, 2, 3, 5, 6, 7, 11, 13, and 19. The percentage of genetic variance for these windows ranged from 0.30 to 0.55%. Within these regions, 56 known genes were identified to be associated with FY (Figure 1B and Table 3).
Two candidate genes were previously reported for FY: CACNA1C [39] and PTPN1 [40]. CACNA1C is part of a group of genes that give instructions for constructing calcium channels. Long-chain fatty acids are implicated in the calcium channel activation processes, probably acting at some near lipid binding sites on these channels or directly over the channel protein itself [39]. The CACNA1C was reported as a milk fatty acids profile candidate gene in Santa Inês ewes [39].
The gene PTPN1 is associated with milk cholesterol content. In fact, it is a key gene for plasma total and high-density lipoprotein cholesterol (HDL-CHL) [40] and directly linked to CHL. A region on OAR1 in position 156,102,645–157,082,096 bp was found to be associated with milk fat and protein yield. This region contains the gene ROBO2. This window was detected within guidance receptor 2 (ROBO2) of the ROBO family [41]. According to previous studies, ROBO2 was associated with fat metabolism, particularly in the fatty acid profile and includes C18:3 IMF [26,42].
For FAT%, top 10 windows in seven different chromosomes (OAR2, 6, 7, 8, 9, 25, and 26) were identified (Figure 1D and Table 3). Results showed that these windows explained 0.41–0.64% of the genetic variance for FAT%.
The most important window, OAR25: 12,322,443–13,278,443 bp, accounted for 0.48% of the genetic variance of FAT% and was found within the cholinergic receptor gene, muscarinic 3 (CHRM3). This gene plays an essential role in lipid metabolism, which may have an effect on the milk fat yield [43]. Mei et al. [44] stated that highly significant SNPs for meat quality in Qinchuan cattle were found inside CHRM3 gene.
Another important window for fat yield was found on chromosome 25 between 45,303,771 and 46,293,771 bp. This region contained ERCC6, an important candidate gene involved in milk fat in Canadian Holsteins [45]. The involvement of ERCC6 gene in milk production has been poorly investigated so further studies are needed.

3.4. Candidate Genes for Milk Protein Yield and Protein Percentage

Top 10 windows genomic regions with a high impact on PY were located on chromosomes 1, 2, 3, 7, 8, 9, 11, 13, and 14. The proportion of genetic variance for these windows ranged from 0.30 to 0.51%. A total of 44 known genes associated with protein yield were identified in these regions (Figure 1C and Table 4).
From these regions, genomic regions located on chromosome 2 (from 63,313,028 to 64,303,381 bp) were found in protein yield. PCSK5 gene product is known to directly inactivate endothelial lipase and indirectly cleave and activate angiopoetin-like protein 3, a natural inhibitor of endothelial lipase. A recent study reports PCSK5 as gene linked to meat quality traits in beef cattle [46]. Further studies are necessary to clarify the role of the PCSK5 gene in the milk protein yield association.
Relevant window for protein yield was found on OAR9 between 77,706,323 and 78,625,358 bp. Among the putative candidate genes mapped within this window, we found Angiopoietin-1 (ANGPT1), which explained more than 0.35% of the genetic variance. ANGPT1 is mainly produced by cardiac, skeletal and smooth muscle cells, and adventitial cells [47]. The association of ANGPT1 gene with milk quality in Chinese Holstein has been reported in a previous study [48].
Regarding milk protein percentage, the top window identified OAR1, 2, 3, 5, 7, 13, and 17, together with 30 genes close to the most important SNP within each window (Figure 1E and Table 4). The identified genomic windows explained 0.33–0.50% of the genetic variance for PROT%. Interestingly, these genomic regions were not reported in recognized QTL regions for milk protein percentage.

3.5. Candidate Genes for SCS

Genomic windows linked to SCS were found in five chromosomes, OAR1, 3, 6, 7, 9 where 37 known genes were associated with the trait (Figure 1F and Table 5). The proportion of genetic variance for these windows ranged from 0.41 to 0.75%.
The most important windows, OAR3: 161,701,025–162,705,420 bp, and 213,347,420–214,351,547 bp, contributed to 0.90% of the genetic variance of SCS.
Three genes were previously reported as candidate for immune response, namely, IL26 [49], IFNG [50], and PEX26 [51].
The protein encoded by IL26 is a member of the IL10 family of cytokines [52], which has anti-bacterial activity against various bacteria, including Staphylococcus aureus [49], suggesting a broader role in host defenses.
The critical function of the IFNG gene in the coordination of immunity against bacteria suggested a potential role of this gene in the bovine paratuberculosis susceptibility [50]. In addition, the IFNG gene was previously associated with host innate immune response against Brucella in goats [53].
PEX26 is a peroxisomal membrane protein that acts as a membrane anchor for the PEX1-PEX6 complex and has been previously reported to be associated with immune response traits in Canadian Holstein cattle [51].
Additionally, other genes were demonstrated to have mechanisms related to SCS. Previous significant QTL on chromosome 6 containing candidate genes (LAP3, MED28, FAM184B, DCAF16, NCAPG, and LCORL) related to milk production traits in cattle [1,13], were also identified in this study. In this region, MED28 could be a causative gene affecting SCS in Valle del Belice sheep. The gene MED28 is expressed in the mammary gland during lactation and is associated to breast cancer [54], whereas LAP3 is a regulator of hormone and plays a role in maturation, inactivation, and degradation of proteins [55]. In mammals, LAPs contribute to processing of some bioactive peptides and vesicle trafficking to the plasma membrane, and they also have a role in MHC I antigen presentation [56].

3.6. Functional Annotation of Enrichment Analysis

In order to better understand the biological processes and pathways, genes surrounding the SNPs within each window were searched. Hence, KEGG and GO enrichment analysis were performed. Five GO terms and one KEGG pathways were enriched for the analyzed milk production traits and somatic cell score. The enriched GO terms are involved in positive regulation of protein phosphorylation (GO: 0001934) consisting of ANGPT1 and PTPN1 genes; positive regulation of protein complex assembly (GO: 0031334) consisting of ERCC6, RAP1B, and LCP1 genes; lipoprotein metabolic process (GO: 0042157) including LYPLA1 and SCARB1 genes; regulation of leukocyte proliferation (GO: 0002682) including DLG1, IL7, LAPTM5, and TFRC genes; regulation of immune system process (GO: 0031334) consisting of IFNG, IL7, and LAPTM5 genes; and IL-17 signaling pathway (oar: 04657) consisting of IFNG, IL17RB, and MMP9. The results of GO and KEGG enrichment analyses further suggests that milk production and somatic cell score are traits in which many genes are involved.

4. Conclusions

This research conducted a weighted GWAS using a single-step procedure and found many genomic regions and candidate genes in relation to five milk production traits and SCS, indicating a polygenic nature of the studied traits. Novel candidate genes implicated in milk production traits and SCS were also identified. Our findings offer new insights into the genetic basis of milk production traits and SCS in Valle del Belice sheep, and more in general in dairy sheep. These results can be used to search for causative mutations and for breeding through marker-assisted selection to improve the production and quality of milk yield in Valle del Belice sheep. Further research with more information on animals, records, and genotypes is required to validate our findings and the practical implications of this for genomic selection.

Author Contributions

Conceptualization, H.M. and M.T.; methodology, H.M., A.H.K.F. and M.H.M.; formal analysis, H.M., A.H.K.F. and M.T.; data curation, S.M., R.D.G. and M.T.S.; writing—original draft preparation, H.M.; writing—review and editing, H.M., S.M. and M.T.; supervision, M.L.S., B.P. and M.T; funding acquisition, B.P. All authors have read and agreed to the published version of the manuscript.

Funding

This research was financed by LEO: Livestock Environment Opendata, PSRN 2014-2020-Sottomisura: 16.2, Project number PRJ-0185, CUP: J84I18000090007.

Institutional Review Board Statement

Blood samples were collected by veterinarians of the local health authorities in the frame of sanitary programs; hence, no permission from the animal research ethics committee was necessary. Veterinarians adhered to standard procedures and relevant national guidelines to ensure appropriate animal care.

Informed Consent Statement

Not applicable.

Data Availability Statement

Conflicts of Interest

The authors declare that they do not have any conflict of interest.

References

  1. Buaban, S.; Lengnudum, K.; Boonkum, W.; Phakdeedindan, P. Genome-wide association study on milk production and somatic cell score for Thai dairy cattle using weighted single-step approach with random regression test-day model. J. Dairy Sci. 2022, 105, 468–494. [Google Scholar] [CrossRef] [PubMed]
  2. Öner, Y.; Serrano, M.; Sarto, P.; Iguácel, L.P.; Piquer-Sabanza, M.; Estrada, O.; Juan, T.; Calvo, J.H. Genome-Wide Association Studies of Somatic Cell Count in the Assaf Breed. Animals 2021, 11, 1531. [Google Scholar] [CrossRef] [PubMed]
  3. Pösö, J.; Mäntysaari, E.A. Relationships between clinical mastitis, somatic cell score, and production for the first three lactations of Finnish Ayrshire. J. Dairy Sci. 1996, 79, 1284–1291. [Google Scholar] [CrossRef]
  4. Ilie, D.E.; Mizeranschi, A.E.; Mihali, C.V.; Neamț, R.I.; Goilean, G.V.; Georgescu, O.I.; Zaharie, D.; Carabaș, M.; Huțu, I. Genome-Wide Association Studies for Milk Somatic Cell Score in Romanian Dairy Cattle. Genes 2021, 12, 1495. [Google Scholar] [CrossRef]
  5. Wang, H.; Misztal, I.; Aguilar, I.; Legarra, A.; Muir, W.M. Genome-wide association mapping including phenotypes from relatives without genotypes. Genet. Res. 2012, 94, 73–83. [Google Scholar] [CrossRef] [Green Version]
  6. Wang, H.; Misztal, I.; Aguilar, I.; Legarra, A.; Fernando, R.L.; Vitezica, Z.; Okimoto, R.; Wing, T.; Hawken, R.; Muir, W.M. Genome-wide association mapping including phenotypes from relatives without genotypes in a single-step (ssGWAS) for 6-week body weight in broiler chickens. Front. Genet. 2014, 5, 134. [Google Scholar] [CrossRef] [Green Version]
  7. Aguilar, I.; Misztal, I.; Johnson, D.L.; Legarra, A.; Tsuruta, S.; Lawlor, T.J. Hot topic: A unified approach to utilize phenotypic, full pedigree, and genomic information for genetic evaluation of Holstein final score. J. Dairy Sci. 2010, 93, 743–752. [Google Scholar] [CrossRef]
  8. Marques, D.B.D.; Bastiaansen, J.W.M.; Broekhuijse, M.L.W.J.; Lopes, M.S.; Knol, E.F.; Harlizius, B.; Guimarães, S.E.F.; Silva, F.F.; Lopes, P.S. Weighted single-step GWAS and gene network analysis reveal new candidate genes for semen traits in pigs. Genet. Sel. Evol. 2018, 50, 40. [Google Scholar] [CrossRef] [Green Version]
  9. Misztal, I.; Tsuruta, S.; Lourenco, D.A.L.; Masuda, Y.; Aguilar, I.; Legarra, A.; Vitezica, Z. Manual for BLUPF90 Family of Programs. University of Georgia, 2018. Available online: http://nce.ads.uga.edu/wiki/lib/exe/fetch.php?media=blupf90all7.pdf (accessed on 22 May 2014).
  10. Atashi, H.; Salavati, M.; De Koster, J.; Ehrlich, J.; Crowe, M.; Opsomer, G.; GplusE Consortium; Hostens, M. Genome-wide association for milk production and lactation curve parameters in Holstein dairy cows. J. Anim. Breed Genet. 2020, 137, 292–304. [Google Scholar] [CrossRef]
  11. Brunes, L.C.; Baldi, F.; Lopes, F.B.; Lôbo, R.B.; Espigolan, R.; Costa, M.F.O.; Stafuzza, N.B.; Magnabosco, C.U. Weighted single-step genome-wide association study and pathway analyses for feed efficiency traits in Nellore cattle. J. Anim. Breed Genet. 2021, 138, 23–44. [Google Scholar] [CrossRef]
  12. Raschia, M.A.; Nani, J.P.; Carignano, H.A.; Amadio, A.F.; Maizon, D.O.; Poli, M.A.; Nacional, I.; Agropecuaria, D.T.; De Genética, I.; Favret, E.A.; et al. Weighted single-step genome-wide association analyses for milk traits in Holstein and Holstein x Jersey crossbred dairy cattle. Livest. Sci. 2020, 242, 104294. [Google Scholar] [CrossRef]
  13. Zhou, C.; Li, C.; Cai, W.; Liu, S.; Yin, H.; Shi, S.; Zhang, Q.; Zhang, S. Genome-Wide Association Study for Milk Protein Composition Traits in a Chinese Holstein Population Using a Single-Step Approach. Front. Genet. 2019, 10, 72. [Google Scholar] [CrossRef] [PubMed] [Green Version]
  14. Teissier, M.; Larroque, H.; Robert-Granie, C. Accuracy of genomic evaluation with weighted single-step genomic best linear unbiased prediction for milk production traits, udder type traits, and somatic cell scores in French dairy goats. J. Dairy Sci. 2019, 102, 3142–3154. [Google Scholar] [CrossRef] [PubMed] [Green Version]
  15. Zhao, B.; Luo, H.; Huang, X.; Wei, C.; Di, J.; Tian, Y.; Fu, X.; Li, B.; Liu, G.E.; Fang, L.; et al. Integration of a single-step genome-wide association study with a multi-tissue transcriptome analysis provides novel insights into the genetic basis of wool and weight traits in sheep. Genet. Sel. Evol. 2021, 53, 56. [Google Scholar] [CrossRef] [PubMed]
  16. Sutera, A.M.; Moscarelli, A.; Mastrangelo, S.; Sardina, M.T.; Di Gerlando, R.; Portolano, B.; Tolone, M. Genome-Wide Association Study Identifies New Candidate Markers for Somatic Cells Score in a Local Dairy Sheep. Front. Genet. 2021, 12, 643531. [Google Scholar] [CrossRef] [PubMed]
  17. ICAR. International Agreement of Recording Practices. International Committee for Animal Recording. 2014. Available online: https://www.icar.org/index.php/icar-recording-guidelines/ (accessed on 1 January 2020).
  18. Ali, A.; Shook, G.E. An optimum transformation for somatic cell count in milk. J. Dairy Sci. 1980, 63, 487–490. [Google Scholar] [CrossRef]
  19. Chang, C.C.; Chow, C.C.; Tellier, L.C.; Vattikuti, S.; Purcell, S.M.; Lee, J.J. Second-generation PLINK: Rising to the challenge of larger and richer datasets. Gigascience 2015, 4, 7. [Google Scholar] [CrossRef]
  20. VanRaden, P.M.; Van Tassell, C.P.; Wiggans, G.R.; Sonstegard, T.S.; Schnabel, R.D.; Taylor, J.F.; Schenkel, F.S. Invited review: Reliability of genomic predictions for North American Holstein bulls. J. Dairy Sci. 2009, 92, 16–24. [Google Scholar] [CrossRef] [Green Version]
  21. Sweett, H.; Fonseca, P.A.S.; Suárez-Vega, A.; Livernois, A.; Miglior, F.; Cánovas, A. Genome-wide association study to identify genomic regions and positional candidate genes associated with male fertility in beef cattle. Sci. Rep. 2020, 10, 20102. [Google Scholar] [CrossRef]
  22. Otto, P.I.; Guimarães, S.E.F.; Calus, M.P.L.; Vandenplas, J.; Machado, M.A.; Panetto, J.C.C.; da Silva, M.V.G.B. Single-step genome-wide association studies (GWAS) and post-GWAS analyses to identify genomic regions and candidate genes for milk yield in Brazilian Girolando cattle. J. Dairy Sci. 2020, 103, 10347–10360. [Google Scholar] [CrossRef]
  23. Yin, H.; Zhou, C.; Shi, S.; Fang, L.; Liu, J.; Sun, D.; Jiang, L.; Zhang, S. Weighted Single-Step Genome-Wide Association Study of Semen Traits in Holstein Bulls of China. Front. Genet. 2019, 10, 1053. [Google Scholar] [CrossRef] [PubMed] [Green Version]
  24. Noh, K.; Lee, H.; Choi, T.Y.; Joo, Y.; Kim, S.J.; Kim, H.; Kim, J.Y.; Jahng, J.W.; Lee, S.; Choi, S.Y.; et al. Negr1 controls adult hippocampal neurogenesis and affective behaviors. Mol. Psychiatry 2019, 8, 1189–1205. [Google Scholar] [CrossRef] [PubMed]
  25. Ma, X.; Jia, C.; Fu, D.; Chu, M.; Ding, X.; Wu, X.; Guo, X.; Pei, J.; Bao, P.; Liang, C.; et al. Analysis of Hematological Traits in Polled Yak by Genome-Wide Association Studies Using Individual SNPs and Haplotypes. Genes 2019, 10, 463. [Google Scholar] [CrossRef] [PubMed] [Green Version]
  26. Gao, G.; Gao, N.; Li, S.; Kuang, W.; Zhu, L.; Jiang, W.; Yu, W.; Guo, J.; Li, Z.; Yang, C.; et al. Genome-Wide Association Study of Meat Quality Traits in a Three-Way Crossbred Commercial Pig Population. Front. Genet. 2021, 12, 614087. [Google Scholar] [CrossRef]
  27. Fontanesi, L.; Calò, D.G.; Galimberti, G.; Negrini, R.; Marino, R.; Nardone, A.; Ajmone-Marsan, P.; Russo, V. A candidate gene association study for nine economically important traits in Italian Holstein cattle. Anim. Genet. 2014, 45, 576–580. [Google Scholar] [CrossRef]
  28. Hosseini, S.M.; Tingzhu, Y.; Pasandideh, M.; Liang, A.; Hua, G.; Farmanullah, S.N.M.; Raza, S.H.A.; Salzano, A.; Campanile, G.; Gasparrini, B.; et al. Genetic Association of PPARGC1A Gene Single Nucleotide Polymorphism with Milk Production Traits in Italian Mediterranean Buffalo. Biomed. Res. Int. 2021, 21, 3653157. [Google Scholar] [CrossRef]
  29. Khatib, H.; Zaitoun, I.; Wiebelhaus-Finger, J.; Chang, Y.M.; Rosa, G.J. The association of bovine PPARGC1A and OPN genes with milk composition in two independent Holstein cattle populations. J. Dairy Sci. 2007, 90, 2966–2970. [Google Scholar] [CrossRef]
  30. Lindholm-Perry, A.K.; Kuehn, L.A.; Smith, T.P.; Ferrell, C.L.; Jenkins, T.G.; Freetly, H.C.; Snelling, W.M. A region on BTA14 that includes the positional candidate genes LYPLA1, XKR4 and TMEM68 is associated with feed intake and growth phenotypes in cattle(1). Anim. Genet. 2012, 43, 216–219. [Google Scholar] [CrossRef]
  31. Banos, G.; Clark, E.L.; Bush, S.J.; Dutta, P.; Bramis, G.; Arsenos, G.; Hume, D.A.; Psifidi, A. Genetic and genomic analyses underpin the feasibility of concomitant genetic improvement of milk yield and mastitis resistance in dairy sheep. PLoS ONE 2019, 14, e0214346. [Google Scholar] [CrossRef] [Green Version]
  32. Avondo, M.; Di Trana, A.; Valenti, B.; Criscione, A.; Bordonaro, S.; De Angelis, A.; Giorgio, D.; Di Gregorio, P. Leptin Gene Polymorphism in Goats Fed with Diet at Different Energy Level: Effects on Feed Intake, Milk Traits, Milk Fatty Acids Composition, and Metabolic State. Animals 2019, 9, 424. [Google Scholar] [CrossRef] [Green Version]
  33. Abousoliman, I.; Reyer, H.; Oster, M.; Muráni, E.; Mourad, M.; Rashed, M.A.; Mohamed, I.; Wimmers, K. Analysis of Candidate Genes for Growth and Milk Performance Traits in the Egyptian Barki Sheep. Animals 2020, 10, 197. [Google Scholar] [CrossRef] [PubMed] [Green Version]
  34. Trakovicka, A.; Moravcikova, N.; Minarovic, T.; Alica Navratilova, A. SNPs analyses of the bovine LEP and PIT-1 genes by multiplex PCR-RFLP method and their effect on milk performance traits in Slovak Simmental cattle. J. Cent. Eur. Agric. 2015, 16, 65–75. [Google Scholar] [CrossRef]
  35. Mahmoud, A.; Saleh, A.; Almealamah, N.; Ayadi, M.; Matar, A.; Abou-Tarboush, F.; Aljumaah, R.; Abouheif, M. Polymorphism of leptin gene and its association with milk traits in Najdi sheep. J. Appl. Microbiol. 2014, 8, 2953–2959. [Google Scholar]
  36. MacLeod, I.M.; Bowman, P.J.; Vander Jagt, C.J.; Haile-Mariam, M.; Kemper, K.E.; Chamberlain, A.J.; Schrooten, C.; Hayes, B.J.; Goddard, M.E. Exploiting biological priors and sequence variants enhances QTL discovery and genomic prediction of complex traits. BMC Genom. 2016, 17, 144. [Google Scholar] [CrossRef] [PubMed] [Green Version]
  37. Xiang, R.; MacLeod, I.M.; Daetwyler, H.D.; de Jong, G.; O’Connor, E.; Schrooten, C.; Chamberlain, A.J.; Goddard, M.E. Genome-wide fine-mapping identifies pleiotropic and functional variants that predict many traits across global cattle populations. Nat. Commun. 2021, 12, 860. [Google Scholar] [CrossRef] [PubMed]
  38. Lopdell, T.J.; Tiplady, K.; Couldrey, C.; Johnson, T.J.J.; Keehan, M.; Davis, S.R.; Harris, B.L.; Spelman, R.J.; Snell, R.G.; Littlejohn, M.D. Multiple QTL underlie milk phenotypes at the CSF2RB locus. Genet. Sel. Evol. 2019, 51, 3. [Google Scholar] [CrossRef] [Green Version]
  39. Rovadoscki, G.A.; Pertile, S.F.N.; Alvarenga, A.B.; Cesar, A.S.M.; Pértille, F.; Petrini, J.; Franzo, V.; Soares, W.V.B.; Morota, G.; Spangler, M.L.; et al. Estimates of genomic heritability and genome-wide association study for fatty acids profile in Santa Inês sheep. BMC Genom. 2018, 1, 375. [Google Scholar] [CrossRef]
  40. Do, D.N.; Schenkel, F.S.; Miglior, F.; Zhao, X.; Ibeagha-Awemu, E.M. Genome wide association study identifies novel potential candidate genes for bovine milk cholesterol content. Sci. Rep. 2018, 1, 13239. [Google Scholar] [CrossRef]
  41. Yamamoto, N.; Kashiwagi, M.; Ishihara, M.; Kojima, T.; Maturana, A.D.; Kuroda, S.; Niimi, T. Robo2 contains a cryptic binding site for neural EGFL-like (NELL) protein 1/2. J. Biol. Chem. 2019, 294, 4693–4703. [Google Scholar] [CrossRef] [Green Version]
  42. Sato, S.; Uemoto, Y.; Kikuchi, T.; Egawa, S.; Kohira, K.; Saito, T.; Sakuma, H.; Miyashita, S.; Arata, S.; Suzuki, K. Genome-wide association studies reveal additional related loci for fatty acid composition in a Duroc pig multigenerational population. Anim. Sci. J. 2017, 10, 1482–1490. [Google Scholar] [CrossRef]
  43. Goshu, H.A.; Xiaoyun, W.; Chu, M.; Pengjia, B.; Xue, D.X.; Zhi, P. Novel copy number variations of the CHRM3 gene associated with gene expression and growth traits in Chinese Datong yak (Bos grunniens). J. Appl. Anim. Res. 2020, 1, 156–165. [Google Scholar] [CrossRef] [Green Version]
  44. Mei, C.; Wang, H.; Liao, Q.; Khan, R.; Raza, S.H.A.; Zhao, C.; Wang, H.; Cheng, G.; Tian, W.; Li, Y.; et al. Genome-wide analysis reveals the effects of artificial selection on production and meat quality traits in Qinchuan cattle. Genomics 2019, 6, 1201–1208. [Google Scholar] [CrossRef] [PubMed]
  45. Ibeagha-Awemu, E.M.; Peters, S.O.; Akwanji, K.A.; Imumorin, I.G.; Zhao, X. High density genome wide genotyping-by-sequencing and association identifies common and low frequency SNPs, and novel candidate genes influencing cow milk traits. Sci. Rep. 2016, 6, 31109. [Google Scholar] [CrossRef] [PubMed] [Green Version]
  46. Lei, H. Impact of Genetics on Meat Quality of Pigs and Beef Cattle. Ph.D. Thesis, University of Alberta, Edmonton, AB, Canada, 2019; pp. 1–275. [Google Scholar]
  47. Brindle, N.P.; Saharinen, P.; Alitalo, K. Signaling and functions of angiopoietin-1 in vascular protection. Circ. Res. 2006, 8, 1014–1023. [Google Scholar] [CrossRef] [PubMed]
  48. Jiang, J.; Liu, L.; Gao, Y.; Shi, L.; Li, Y.; Liang, W.; Sun, D. Determination of genetic associations between indels in 11 candidate genes and milk composition traits in Chinese Holstein population. BMC Genet. 2019, 1, 48. [Google Scholar] [CrossRef] [Green Version]
  49. Wang, D.; Liu, L.; Augustino, S.M.A.; Duan, T.; Hall, T.J.; MacHugh, D.E.; Dou, J.; Zhang, Y.; Wang, Y.; Yu, Y. Identification of novel molecular markers of mastitis caused by Staphylococcus aureus using gene expression profiling in two consecutive generations of Chinese Holstein dairy cattle. J. Anim. Sci. Biotechnol. 2020, 11, 98. [Google Scholar] [CrossRef]
  50. Pinedo, P.J.; Buergelt, C.D.; Donovan, G.A.; Melendez, P.; Morel, L.; Wu, R.; Langaee, T.Y.; Rae, D.O. Candidate gene polymorphisms (BoIFNG, TLR4, SLC11A1) as risk factors for paratuberculosis infection in cattle. Prev. Vet. Med. 2009, 4, 189–196. [Google Scholar] [CrossRef]
  51. Thompson-Crispi, K.A.; Sargolzaei, M.; Ventura, R.; Abo-Ismail, M.; Miglior, F.; Schenkel, F.; Mallard, B.A. A genome-wide association study of immune response traits in Canadian Holstein cattle. BMC Genom. 2014, 1, 559. [Google Scholar] [CrossRef] [Green Version]
  52. Knappe, A.; Hör, S.; Wittmann, S.; Fickenscher, H. Induction of a novel cellular homolog of interleukin-10, AK155, by transformation of T lymphocytes with herpesvirus saimiri. J. Virol. 2000, 8, 3881–3887. [Google Scholar] [CrossRef] [Green Version]
  53. Hasenauer, F.C.; Rossi, U.A.; Caffaro, M.E.; Raschia, M.A.; Maurizio, E.; Poli, M.A.; Rossetti, C.A. Association of TNF rs668920841 and INRA111 polymorphisms with caprine brucellosis: A case-control study of candidate genes involved in innate immunity. Genomics 2020, 6, 3925–3932. [Google Scholar] [CrossRef]
  54. Huang, C.Y.; Chou, Y.H.; Hsieh, N.T.; Chen, H.H.; Lee, M.F. MED28 regulates MEK1-dependent cellular migration in human breast cancer cells. J. Cell Physiol. 2012, 12, 3820–3827. [Google Scholar] [CrossRef] [PubMed]
  55. Zheng, X.; Ju, Z.; Wang, J.; Li, Q.; Huang, J.; Zhang, A.; Zhong, J.; Wang, C. Single nucleotide polymorphisms, haplotypes and combined genotypes of LAP3 gene in bovine and their association with milk production traits. Mol. Biol. Rep. 2011, 6, 4053–4061. [Google Scholar] [CrossRef] [PubMed]
  56. Kloetzel, P.M.; Ossendorp, F. Proteasome and peptidase function in MHC-class-I-mediated antigen presentation. Curr. Opin. Immunol. 2004, 1, 76–81. [Google Scholar] [CrossRef] [PubMed]
Figure 1. Manhattan plots of the additive genetic variance (%) explained by 1.0 Mb window of adjacent SNPs for milk production traits and SCS: (A) milk yield, (B) fat yield, (C) protein yield, (D) fat percentage, (E) protein percentage, and (F) SCS. Each dot represents a window.
Animals 12 01155 g001aAnimals 12 01155 g001bAnimals 12 01155 g001c
Table 1. Descriptive statistics for studied traits.
TraitsNumberMean ± SDCV(%)Min-Maxh2
MY (g)15,0081318 ± 55241.9162–41400.10
FY (g)15,00891.06 ± 34.9138.343.91–393.530.06
FAT (%)15,0087.08 ± 1.0915.412.53–10.800.11
PY (g)15,00875.43 ± 29.8139.522.93–238.980.09
PROT (%)15,0085.80 ± 0.6511.162.14–8.100.15
SCS15,0082.67 ± 0.720.271–5.310.04
SD, standard deviation; CV, coefficient of variation; Min-Max, minimum and maximum values; h2: heritability.
Table 2. Identification of genes based on additive genetic variance explained by top 10 window regions for milk yield trait.
TraitOARStart (bp)Stop (bp)% VEGenes
MY225,250,1876,225,0660.396PCDH15, U6
3214,344,054215,239,7510.375EPS8, PTPRO, RERG, PDE6H, ARHGDIB, ERP27, MGP
27106,515,599107,465,3960.373-
931,897,58432,871,8810.372C9H8orf76, TBC1D31, DERL1, ZHX2
954,661,24655,632,3830.359TMEM70, LY96, JPH1, GDAP1, MIR2052
3212,632,779213,605,4350.351LMO3, MGST1
647,499,78848,496,4560.337PPARGC1A
640,445,16741,445,8590.311LYPLA1, FAM13A, NAP1L5
3107,748,212108,707,6040.310LYG2, MRPL30, MITD1, C2orf15, MYH9, TSGA10, MGAT4A
492,470,19193,383,5840.291KCND2, LEP, TSPAN12
OAR = ovis aries chromosome; %VE = percentage of explained genetic variance.
Table 3. Identification of genes based on additive genetic variance explained by top 10 window regions for milk fat yield and fat percentage traits.
TraitChrStart (bp)Stop (bp)% VEGenes
FY1117,769,57618,742,5050.551GOSR2, RPRML, LYZL6, RDM1, PLEKHM1, ARHGAP27, MAP3K14, FMNL1, HEXIM2, HEXIM1, ACBD4, PLCD3, NMT1
3151,003,018151,972,4750.483ANO6, DBX2, NELL2
63,644,4804,610,3540.420BBS7, CCNA2, EXOSC9, SMIM43
195,602,3396,570,5190.404GADL1, OSBPL10, STT3B
3229,350,131230,350,1310.376ATP6V1E1, TUBA8, CDC42EP1, LGALS2, GGA1, CACNA1C, U6, PDXP
256,504,18957,464,7960.373-
737,844,73138,839,9310.373SNAP23, LRRC57, HAUS2, CDAN1, TTBK2, UBR1, TMEM62, CCNDBP1, EPB42
547,771,92048,762,9850.368TCF7, CDKL3, UBE2B, JADE2, SAR1B, SEC24A, CAMLG, DDX46, C5orf24
1156,102,645157,082,0960.357ROBO2, U2
1381,534,94482,519,9440.301UBE2V1, CEBPB, PTPN1, PARD6B, BCAS4, DPM1, KCNG1, MOCS3
FAT%63,563,8774,559,4720.649NAF1, BBS7, CCNA2, EXOSC9, SMIM43
263,879,7924,875,1040.619-
882,898,82383,853,0760.571ESR1, SYNE1, MYCT1, VIP
879,925,76780,905,8730.550UST, TAB2, ZC3H12D, PPIL4, GINM1, KATNA1, LATS1, NUP43, PCMT1, LRP11
26700,9161,677,6760.540DLGAP2, CLN8, CETN2, KBTBD11, MYOM2
953,991,92354,979,0700.533RDH10, ELOC, TMEM70, LY96
2124,285,685125,280,4770.527FAM168B, PLEKHB2
2512,322,44313,278,4430.483ZNF248, BMS1, CHRM3, ZNF33B
750,459,24851,446,2000.470RORA, ICE2, ANXA2
2545,303,77146,293,7710.419DRGX, ERCC6, SLC18A3, C25H10orf53, OGDHL, PARG, TIMM23B, SNORA74, MARCHF8, ZFAND4
Table 4. Identification of genes based on additive genetic variance explained by top 10 window regions for milk protein yield and protein percentage traits.
TraitChrStart (bp)Stop (bp)% VEGenes
PY737,844,73138,839,9310.518SNAP23, LRRC57, HAUS2, CDAN1, TTBK2, UBR1, TMEM62, CCNDBP1
814,481,63115,471,9540.505HDDC2, TPD52L1, RNF217, NKAIN2
1312,488,72613,487,3500.449SFMBT2, ITIH5, ITIH2, ATP5F1C, TAF3, GATA3
2111,987,606112,986,9640.398KIF13B, MSRA, PRSS51, PRSS55, PINX1
1425,500,65026,497,5920.397MT1A, MT1C, MT2, OGFOD1, OGFOD1, NUDT21, AMFR, GNAO1, CES5A
263,313,028 64,303,3810.393VPS13A, FOXB2, GCNT1, RFK, PCSK5
259,313,02860,303,3810.388-
1156,123,514157,114,9450.379ROBO2, U2
977,706,32378,625,3580.354ANGPT1, ABRA, OXR1
3151,003,018151,972,4750.305ANO6, DBX2, NELL2
PROT%1377,917,67778,910,0660.507DNTTIP1, TNNC2, SNX21, ACOT8, CTSA, PLTP, PCIF1, ZNF335, MMP9
280,632,04181,604,7960.452KDM4C, DMAC1
1729,494,46430,441,0720.420-
138,670,05939,649,7630.368TM2D1, PATJ, KANK4
737,916,71138,872,8040.357CDAN1, TTBK2, UBR1, TMEM62, EPB42
3179,367,669180,265,1700.357-
572,168,94273,159,4510.342SOX30, THG1L, LSM11, CLINT1
2134,606,095135,598,7900.337TTC21B, GALNT3
2154,466,090155,460,5610.332ZNF804A
1376,376,35777,356,2280.332YWHAB, PABPC1L, STK4, KCNS1, MATN4
Table 5. Identification of genes based on additive genetic variance explained by top 10 window regions for SCS.
TraitChrStart (bp)Stop (bp)% VEGenes
SCS133,955,43734,931,9480.758U6, OMA1, TACSTD2
641,728,56342,727,1050.677LAP3, MED28, FAM184B, DCAF16, NCAPG, LCORL
934,510,19135,480,9170.562PRKDC, MCM4, EFCAB1, SNAI2, PPDPFL
132,365,83833,350,5640.557PLPP3, PRKAA2, C8A, DAB1
738,236,46239,205,4260.485UBR1, TMEM62, CCNDBP1, EPB42
3213,347,420214,351,5470.484LMO3, MGST1, SLC15A5, PEX26, STRAP
149,775,15350,755,4990.463NEGR1
3161,701,025162,705,4200.421CPM, SLC35E3, NUP107, RAP1B, MDM1, IL22, IL26, IFNG
928,511,25029,492,8670.420LRATD2
161,734,83062,648,4800.413ADGRL2
Publisher’s Note: MDPI stays neutral with regard to jurisdictional claims in published maps and institutional affiliations.

