The Effect of Integrating Genomic Information into Genetic Evaluations of Chinese Merino Sheep


 ,
,
Abstract
:Simple Summary
Abstract
1. Introduction
2. Materials and Methods
2.1. Phenotype Data
2.2. Genotype Data
2.3. Variance Component Estimation
2.4. Prediction Accuracy
3. Results
3.1. Genetic Parameters of Wool Traits
3.2. Accuracy of EBV and GEBV Predictions
4. Discussion
4.1. Genetic Parameters of Wool Traits
4.2. Accuracy of EBV and GEBV Predictions
5. Conclusions
Author Contributions
Funding
Acknowledgments
Conflicts of Interest
Appendix A

| Traits 1 | PBLUP | ssGBLUP |
|---|---|---|
| SC | −0.03 | −0.12 |
| CRIM | −0.04 | 0.25 |
| OIL | −0.14 | −0.12 |
| BS | −0.14 | 0.04 |
| FL | 0.02 | 0.05 |
| GFW | −0.01 | 0.27 |
| MFD | 0.00 | 0.04 |
| CN | −0.19 | 0.17 |
| BWPS | −0.14 | 0.00 |


References
- Di, J.; Zhang, Y.; Tian, K.; Lazate; Liu, J.; Xu, X.; Zhang, Y.; Zhang, T. Estimation of (co)variance components and genetic parameters for growth and wool traits of Chinese superfine merino sheep with the use of a multi-trait animal model. Livest. Sci. 2011, 138, 278–288. [Google Scholar] [CrossRef]
- Di, J.; Ainiwaer, L.; Xu, X.; Zhang, Y.; Yu, L.; Li, W. Genetic trends for growth and wool traits of Chinese superfine Merino sheep using a multi-trait animal model. Small Ruminant Res. 2014, 117, 47–51. [Google Scholar] [CrossRef]
- Meuwissen, T.H.E.; Hayes, B.J.; Goddard, M.E. Prediction of total genetic value using genome-wide dense marker maps. Genetics 2001, 157, 1819–1829. [Google Scholar] [PubMed]
- Daetwyler, H.D.; Hickey, J.M.; Henshall, J.M.; Dominik, S.; Gredler, B.; Werf, J.H.J.V.; Hayes, B.J. Accuracy of estimated genomic breeding values for wool and meat traits in a multi-breed sheep population. Anim. Prod. Sci. 2010, 50, 1004–1010. [Google Scholar] [CrossRef] [Green Version]
- Swan, A.A.; Johnston, D.J.; Brown, D.J.; Tier, B.; Graser, H. Integration of genomic information into beef cattle and sheep genetic evaluations in Australia. Anim. Prod. Sci. 2012, 52, 126–132. [Google Scholar] [CrossRef] [Green Version]
- Moghaddar, N.; Swan, A.A.; van der Werf, J.H.J. Genomic prediction of weight and wool traits in a multi-breed sheep population. Anim. Prod. Sci. 2014, 54, 544–549. [Google Scholar] [CrossRef]
- Santos, B.F.S.; Amer, P.R.; Granleese, T.; Byrne, T.J.; Hogan, L.; Gibson, J.P.; van der Werf, J.H.J. Assessment of the genetic and economic impact of performance recording and genotyping in Australian commercial sheep operations. J. Anim. Breed. Genet. 2018, 135, 221–237. [Google Scholar] [CrossRef]
- Swan, A.A.; Brown, D.J.; Tier, B.; van der Werf, J.H.J. Use of genomic information to estimate breeding values for carcass traits in sheep. Proc. Assoc. Advmt. Anim. Breed. Genet. 2011, 19, 331–334. [Google Scholar]
- Daetwyler, H.D.; Swan, A.A.; van der Werf, J.H.; Hayes, B.J. Accuracy of pedigree and genomic predictions of carcass and novel meat quality traits in multi-breed sheep data assessed by cross-validation. Genet. Sel. Evol. 2012, 44, 1–11. [Google Scholar] [CrossRef] [Green Version]
- Bolormaa, S.; Gore, K.; van der Werf, J.H.J.; Hayes, B.J.; Daetwyler, H.D. Design of a low-density SNP chip for the main Australian sheep breeds and its effect on imputation and genomic prediction accuracy. Anim. Genet. 2015, 46, 544–556. [Google Scholar] [CrossRef]
- Cesarani, A.; Gaspa, G.; Correddu, F.; Cellesi, M.; Dimauro, C.; Macciotta, N.P.P. Genomic selection of milk fatty acid composition in Sarda dairy sheep: Effect of different phenotypes and relationship matrices on heritability and breeding value accuracy. J. Dairy Sci. 2019, 102, 3189–3203. [Google Scholar] [CrossRef] [PubMed] [Green Version]
- Baloche, G.; Legarra, A.; Sallé, G.; Larroque, H.; Astruc, J.M.; Robert-Granié, C.; Barillet, F. Assessment of accuracy of genomic prediction for French Lacaune dairy sheep. J. Dairy Sci. 2014, 97, 1107–1116. [Google Scholar] [CrossRef] [PubMed] [Green Version]
- van der Werf, J.H.J. Potential benefit of genomic selection in sheep. Proc. Assoc. Advmt. Anim. Breed. Genet. 2009, 18, 38–41. [Google Scholar]
- Zeng, X.; Chen, H.; Jia, B.; Zhao, Z.; Hui, W.; Wang, Z.; Du, Y. Identification of SNPs within the sheep PROP1 gene and their effects on wool traits. Mol. Biol. Rep. 2011, 38, 2723–2728. [Google Scholar] [CrossRef]
- Liu, Y.X.; Shi, G.Q.; Wang, H.X.; Wan, P.C.; Tang, H.; Yang, H.; Guan, F. Polymorphisms of KAP6, KAP7, and KAP8 genes in four Chinese sheep breeds. Genet. Mol. Res. 2014, 13, 3438–3445. [Google Scholar] [CrossRef]
- Rong, E.G.; Yang, H.; Zhang, Z.W.; Wang, Z.P.; Yan, X.H.; Li, H.; Wang, N. Association of methionine synthase gene polymorphisms with wool production and quality traits in Chinese Merino population. J. Anim. Sci. 2015, 93, 4601–4609. [Google Scholar] [CrossRef]
- Itenge, T.O.; Hickford, J.G.H.; Forrest, R.H.J.; McKenzie, G.W.; Frampton, C.M. Improving the quality of wool through the use of gene markers. S. Afr. J. Anim. Sci. 2009, 39, 219–222. [Google Scholar]
- Wang, Z.; Zhang, H.; Yang, H.; Wang, S.; Rong, E.; Pei, W.; Li, H.; Wang, N. Genome-wide association study for wool production traits in a Chinese Merino sheep population. PLoS ONE. 2014, 9, 1–8. [Google Scholar] [CrossRef]
- Ma, Q.; Liu, X.; Pan, J.; Ma, L.; Ma, Y.; He, X.; Zhao, Q.; Pu, Y.; Li, Y.; Jiang, L. Genome-wide detection of copy number variation in Chinese indigenous sheep using an ovine high-density 600 K SNP array. PLoS ONE 2017, 7, 1–10. [Google Scholar] [CrossRef]
- Zhai, M.; Xie, Y.; Yang, M.; Mu, J.; Zhao, Z. Investigation of the relationships between wool quality and microsatellite in Hybrids of Australian Merino and Chinese Merino. Kafkas. Univ. Vet. Fak. Derg. 2019, 25, 163–170. [Google Scholar]
- Liu, S.; He, S.; Chen, L.; Li, W.; Di, J.; Liu, M. Estimates of linkage disequilibrium and effective population sizes in Chinese Merino (Xinjiang type) sheep by genome-wide SNPs. Genes Genom. 2017, 39, 733–745. [Google Scholar] [CrossRef] [PubMed] [Green Version]
- Bolormaa, S.; Swan, A.A.; Brown, D.J.; Hatcher, S.; Moghaddar, N.; van der Werf, J.H.; Goddard, M.E.; Daetwyler, H.D. Multiple-trait QTL mapping and genomic prediction for wool traits in sheep. Genet. Sel. Evol. 2017, 49, 1–22. [Google Scholar] [CrossRef] [PubMed] [Green Version]
- Bolormaa, S.; Brown, D.J.; Swan, A.A.; van der Werf, J.H.J.; Hayes, B.J.; Daetwyler, H.D. Genomic prediction of reproduction traits for Merino sheep. Anim. Genet. 2017, 48, 338–348. [Google Scholar] [CrossRef] [PubMed]
- Legarra, A.; Christensen, O.F.; Aguilar, I.; Misztal, I. Single Step, a general approach for genomic selection. Livest. Sci. 2014, 166, 54–65. [Google Scholar] [CrossRef]
- Legarra, A.; Aguilar, I.; Misztal, I. A relationship matrix including full pedigree and genomic information. J. Dairy Sci. 2009, 92, 4656–4663. [Google Scholar] [CrossRef] [Green Version]
- Chen, C.Y.; Misztal, I.; Aguilar, I.; Legarra, A.; Muir, W.M. Effect of different genomic relationship matrices on accuracy and scale. J. Anim. Sci. 2011, 89, 2673–2679. [Google Scholar] [CrossRef] [Green Version]
- Lourenco, D.A.L.; Tsuruta, S.; Fragomeni, B.O.; Masuda, Y.; Aguilar, I.; Legarra, A.; Bertrand, J.K.; Amen, T.S.; Wang, L.; Moser, D.W.; et al. Genetic evaluation using single-step genomic best linear unbiased predictor in American Angus. J. Anim. Sci. 2015, 93, 2653–2662. [Google Scholar] [CrossRef] [Green Version]
- Molina, A.; Muñoz, E.; Díaz, C.; Menéndez-Buxadera, A.; Ramón, M.; Sánchez, M.; Carabaño, M.J.; Serradilla, J.M. Goat genomic selection: Impact of the integration of genomic information in the genetic evaluations of the Spanish Florida goats. Small Rumin. Res. 2018, 163, 72–75. [Google Scholar] [CrossRef]
- Zhou, L.; Wang, Y.; Yu, J.; Yang, H.; Kang, H.; Zhang, S.; Wang, C.; Liu, J. Improving genomic prediction for two Yorkshire populations with a limited size using the single-step method. Anim. Genet. 2019, 50, 391–394. [Google Scholar] [CrossRef]
- Gao, N.; Teng, J.; Pan, R.; Li, X.; Ye, S.; Li, J.; Zhang, H.; Zhang, X.; Zhang, Z. Accuracy of whole genome prediction with single-step GBLUP in a Chinese yellow-feathered chicken population. Livest. Sci. 2019, 230, 1–7. [Google Scholar] [CrossRef]
- Zhao, B.; Fu, X.; Tian, K.; Huang, X.; Di, J.; Bai, Y.; Xu, X.; Tiue, Y.; Wu, W.; Ablat, S.; et al. Identification of SNPs and expression patterns of FZD3 gene and its effect on wool traits in Chinese Merino sheep (Xinjiang Type). J. Integr. Agric. 2019, 18, 2351–2360. [Google Scholar] [CrossRef]
- Purcell, S.; Neale, B.; Todd-Brown, K.; Thomas, L.; Ferreira, M.A.R.; Bender, D.; Maller, J.; Sklar, P.; de Bakker, P.I.W.; Daly, M.J.; et al. PLINK: A Tool Set for Whole-Genome Association and Population-Based Linkage Analyses. Am. J. Hum. Genet. 2007, 81, 559–575. [Google Scholar] [CrossRef] [PubMed] [Green Version]
- Henderson, C.R. Best linear unbiased estimation and prediction under a selection model. Biometrics. 1975, 31, 423–447. [Google Scholar] [CrossRef] [PubMed] [Green Version]
- Aguilar, I.; Misztal, I.; Johnson, D.L.; Legarra, A.; Tsuruta, S.; Lawlor, T.J. Hot topic: A unified approach to utilize phenotypic, full pedigree, and genomic information for genetic evaluation of Holstein final score. J. Dairy Sci. 2010, 93, 743–752. [Google Scholar] [CrossRef]
- Misztal, I.; Tsuruta, S. Manual for BLUPF90 Family of Programs; University of Georgia: Athens, Greece, 2015. [Google Scholar]
- Plummer, M.; Best, N.; Cowles, K.; Vines, K.; Sarkar, D.; Bates, D.; Almond, R.; Magnusson, A. R package: Output Analysis and Diagnostics for MCMC; Repository: CRAN; 2018; pp. 17–18. [Google Scholar]
- Safari, E.; Fogarty, N.M.; Gilmour, A.R.; Atkins, K.D.; Mortimer, S.I.; Swan, A.A.; Brien, F.D.; Greeff, J.C.; van der Werf, J.H.J. Across population genetic parameters for wool, growth, and reproduction traits in Australian Merino sheep. 2. Estimates of heritability and variance components. Aust. J. Agric. Res. 2007, 58, 177. [Google Scholar] [CrossRef]
- Swan, A.A.; Brown, D.J.; van der Werf, J.H.J. Genetic variation within and between subpopulations of the Australian Merino breed. Anim. Prod. Sci. 2016, 56, 87–94. [Google Scholar] [CrossRef]
- Dominik, S.; Swan, A.A. Genetic and phenotypic parameters for reproduction, production and bodyweight traits in Australian fine-wool Merino sheep. Anim. Prod. Sci. 2018, 58, 1–6. [Google Scholar] [CrossRef]
- Mortimer, S.I.; Hatcher, S.; Fogarty, N.M.; van der Werf, J.H.J.; Brown, D.J.; Swan, A.A.; Jacob, R.H.; Geesink, G.H.; Hopkins, D.L.; Edwards, J.E.H. Genetic correlations between wool traits and carcass traits in Merino sheep. J. Anim. Sci. 2017, 95, 2385–2398. [Google Scholar] [CrossRef] [Green Version]
- Hanford, K.J.; Snowder, G.D.; Van Vleck, L.D. Models with nuclear, cytoplasmic, and environmental effects for production traits of Columbia sheep. J. Anim. Sci. 2003, 81, 1926–1932. [Google Scholar] [CrossRef] [Green Version]
- Hanford, K.J.; Van Vleck, L.D.; Snowder, G.D. Estimates of genetic parameters and genetic trend for reproduction, weight, and wool characteristics of Polypay sheep. Livest. Sci. 2006, 102, 72–82. [Google Scholar] [CrossRef] [Green Version]
- Hanford, K.J.; Van Vleck, L.D.; Snowder, G.D. Estimates of genetic parameters and genetic change for reproduction, weight, and wool characteristics of Rambouillet sheep. Small Rumin. Res. 2005, 57, 175–186. [Google Scholar] [CrossRef]
- Matebesi, R.P.A.M.; Cloete, S.W.P.; Van Wyk, J.B.; Olivier, J.J. The relationships between faecal worm egg count and subjectively assessed wool and conformation traits in the Tygerhoek Merino flock. S. Afr. J. Anim. Sci. 2014, 44, 220–227. [Google Scholar] [CrossRef] [Green Version]
- Matebesi, R.P.A.M.; Cloete, S.W.P.; Van Wyk, J.B.; Olivier, J.J. Relationship of ewe reproduction with subjectively assessed wool and conformation traits in the Elsenburg Merino flock. S. Afr. J. Anim. Sci. 2018, 48, 29–38. [Google Scholar] [CrossRef] [Green Version]
- Matebesi, R.P.A.M.; van Wyk, J.B.; Cloete, S.W.P. Relationships of subjectively assessed wool and conformation traits with objectively measured wool and live weight traits in the Tygerhoek Merino flock. S. Afr. J. Anim. Sci. 2009, 39, 188–196. [Google Scholar] [CrossRef] [Green Version]
- Kumar, A.; Sawal, R.K.; Narula, H.K.; Kumar, S.; Kumar, R. Subjective and objective/machine evaluation of wool luster in Magra sheep vis-a-vis wool grading and animal selection. J. Nat. Fibers. 2019, 16, 644–651. [Google Scholar] [CrossRef]
- Veerkamp, R.F.; Mulder, H.A.; Thompson, R.; Calus, M.P.L. Genomic and pedigree-based genetic parameters for scarcely recorded traits when some animals are genotyped. J. Dairy Sci. 2011, 94, 4189–4197. [Google Scholar] [CrossRef]
- Forni, S.; Aguilar, I.; Misztal, I. Different genomic relationship matrices for single-step analysis using phenotypic, pedigree and genomic information. Genet. Sel. Evol. 2011, 43, 1–7. [Google Scholar] [CrossRef] [Green Version]
- Powell, J.E.; Visscher, P.M.; Goddard, M.E. Reconciling the analysis of IBD and IBS in complex trait studies. Nat. Rev. Genet. 2010, 11, 800–805. [Google Scholar] [CrossRef]
- Haile, M.M.; Nieuwhof, G.J.; Beard, K.T.; Konstatinov, K.V.; Hayes, B.J. Comparison of heritabilities of dairy traits in Australian Holstein-Friesian cattle from genomic and pedigree data and implications for genomic evaluations. J. Anim. Breed. Genet. 2012, 130, 20–31. [Google Scholar] [CrossRef]
- Loberg, A.; Dürr, J.W.; Fikse, W.F.; Jorjani, H.; Crooks, L. Estimates of genetic variance and variance of predicted genetic merits using pedigree or genomic relationship matrices in six Brown Swiss cattle populations for different traits. J. Anim. Breed. Genet. 2015, 132, 376–385. [Google Scholar] [CrossRef]
- Kijas, J.W.; Porto-Neto, L.; Dominik, S.; Reverter, A.; Bunch, R.; McCulloch, R.; Hayes, B.J.; Brauning, R.; McEwan, J. Linkage disequilibrium over short physical distances measured in sheep using a high-density SNP chip. Anim. Genet. 2014, 45, 754–757. [Google Scholar] [CrossRef] [PubMed]
- Casellas, J.; Piedrafita, J. Accuracy and expected genetic gain under genetic or genomic evaluation in sheep flocks with different amounts of pedigree, genomic and phenotypic data. Livest. Sci. 2015, 183, 58–63. [Google Scholar] [CrossRef]
- Li, L.; Swan, A.A.; Tier, B. Approximating the accuracy of single step EBVs. Proc. Assoc. Advmt. Anim. Breed. Genet. 2017, 22, 1–4. [Google Scholar]
- Ventura, R.V.; Miller, S.P.; Dodds, K.G.; Auvray, B.; Lee, M.; Bixley, M.; Clarke, S.M.; McEwan, J.C. Assessing accuracy of imputation using different SNP panel densities in a multi-breed sheep population. Genet. Sel. Evol. 2016, 48, 1–20. [Google Scholar] [CrossRef] [PubMed] [Green Version]
- Nordbø, Ø.; Gjuvsland, A.B.; Eikje, L.S.; Meuwissen, T. Level-biases in estimated breeding values due to the use of different SNP panels over time in ssGBLUP. Genet. Sel. Evol. 2019, 51, 1–8. [Google Scholar] [CrossRef] [PubMed] [Green Version]
- Brown, D.J.; Swan, A.A.; Boerner, V.; Li, L.; Gurman, P.M.; McMillan, A.J.; van der Werf, J.J.H.; Chandler, H.R.; Tier, B.; Banks, R.G. Single-Step Genetic Evaluations in the Australian Sheep Industry. In Proceedings of the 11th World Congress of Genetics Applied to Livestock Production, Auckland, New Zealand, 11–16 February 2018. [Google Scholar]
- Chen, L.; Ekine-Dzivenu, C.; Vinsky, M.; Basarab, J.; Aalhus, J.; Dugan, M.E.R.; Fitzsimmons, C.; Stothard, P.; Li, C. Genome-wide association and genomic prediction of breeding values for fatty acid composition in subcutaneous adipose and longissimus lumborum muscle of beef cattle. BMC Genet. 2015, 16, 1–15. [Google Scholar] [CrossRef] [Green Version]
- Yoshida, G.M.; Carvalheiro, R.; Rodríguez, F.H.; Lhorente, J.P.; Yáñez, J.M. Single-step genomic evaluation improves accuracy of breeding value predictions for resistance to infectious pancreatic necrosis virus in rainbow trout. Genomics. 2019, 111, 127–132. [Google Scholar] [CrossRef] [Green Version]
- Teissier, M.; Larroque, H.; Robert-Granié, C. Weighted single-step genomic BLUP improves accuracy of genomic breeding values for protein content in French dairy goats: A quantitative trait influenced by a major gene. Genet. Sel. Evol. 2018, 50, 1–12. [Google Scholar] [CrossRef]
| Trait 1 | Scale of Assessment | ||||
|---|---|---|---|---|---|
| 1 | 2 | 3 | 4 | 5 | |
| SC | poor | below average | average | above average | excellent |
| CRIM | poor | below average | average | above average | excellent |
| OIL | dark yellow | faint yellow | milk white | white | - |
| BS | narrow | below average | average | above average | wide |
| Traits 1 | Number | Minimum | Maximum | Average | SD | CV | |
|---|---|---|---|---|---|---|---|
| Subjectively-assessed wool traits | SC | 28390 | 1.00 | 5.00 | 2.78 | 0.84 | 0.30 |
| CRIM | 19356 | 1.00 | 5.00 | 3.83 | 0.82 | 0.21 | |
| OIL | 21173 | 1.00 | 4.00 | 3.36 | 0.78 | 0.23 | |
| BS | 27110 | 1.00 | 5.00 | 2.80 | 1.22 | 0.44 | |
| Objectively-measured traits | FL/cm | 28658 | 6.00 | 15.00 | 10.12 | 1.10 | 0.11 |
| GFW/kg | 27379 | 1.00 | 9.00 | 3.98 | 0.94 | 0.24 | |
| MFD/μm | 5140 | 12.77 | 28.13 | 18.41 | 2.28 | 0.12 | |
| CN/per 2.5 cm | 4326 | 7.00 | 25.00 | 12.50 | 2.53 | 0.20 | |
| BWPS/kg | 25676 | 20.00 | 78.00 | 34.30 | 5.47 | 0.16 |
| PBLUP | (ssGBLUP) | |||||||
|---|---|---|---|---|---|---|---|---|
| Traits 1 | ||||||||
| SC | 0.011 (0.002) | 0.014 (0.006) | 0.029 (0.014) | 0.201 (0.046) | 0.011 (0.002) | 0.014 (0.006) | 0.029 (0.013) | 0.204 (0.046) |
| CRIM | 0.370 (0.340) | 1.523 (0.901) | 2.796 (1.86) | 0.079 (0.071) | 0.463 (0.376) | 1.619 (0.864) | 2.934 (1.761) | 0.107 (0.070) |
| OIL | 0.196 (0.086) | 1.366 (0.077) | 1.245 (1.364) | 0.070 (0.037) | 0.210 (0.088) | 1.418 (0.786) | 1.297 (1.431) | 0.072 (0.039) |
| BS | 0.183 (0.028) | 0.350 (0.153) | 0.593 (0.391) | 0.163 (0.049) | 0.179 (0.028) | 0.312 (0.153) | 0.597 (0.373) | 0.165 (0.049) |
| FL | 0.302 (0.016) | 0.228 (0.029) | 0.579 (0.014) | 0.272 (0.016) | 0.308 (0.016) | 0.227 (0.029) | 0.578 (0.014) | 0.277 (0.016) |
| GFW | 0.123 (0.008) | 0.245 (0.031) | 0.343 (0.007) | 0.173 (0.013) | 0.123 (0.008) | 0.246 (0.003) | 0.343 (0.007) | 0.173 (0.013) |
| MFD | 0.827 (0.127) | 0.309 (0.080) | 2.408 (0.117) | 0.233 (0.035) | 1.024 (0.114) | 0.302 (0.076) | 2.201 (0.101) | 0.290 (0.031) |
| CN | 0.506 (0.167) | 0.276 (0.083) | 4.880 (0.182) | 0.089 (0.029) | 0.859 (0.191) | 0.255 (0.078) | 4.542 (0.197) | 0.152 (0.032) |
| BWPS | 5.767 (0.346) | 8.064 (1.072) | 12.189 (0.298) | 0.222 (0.015) | 5.790 (0.336) | 8.009 (1.052) | 12.166 (0.284) | 0.223 (0.015) |
| Whole Population | Genotyped Subpopulation | |||||||
|---|---|---|---|---|---|---|---|---|
| Traits 1 | PBLUP | ssGBLUP | Δacc (%) | Correlation | PBLUP | ssGBLUP | Δacc (%) | Correlation |
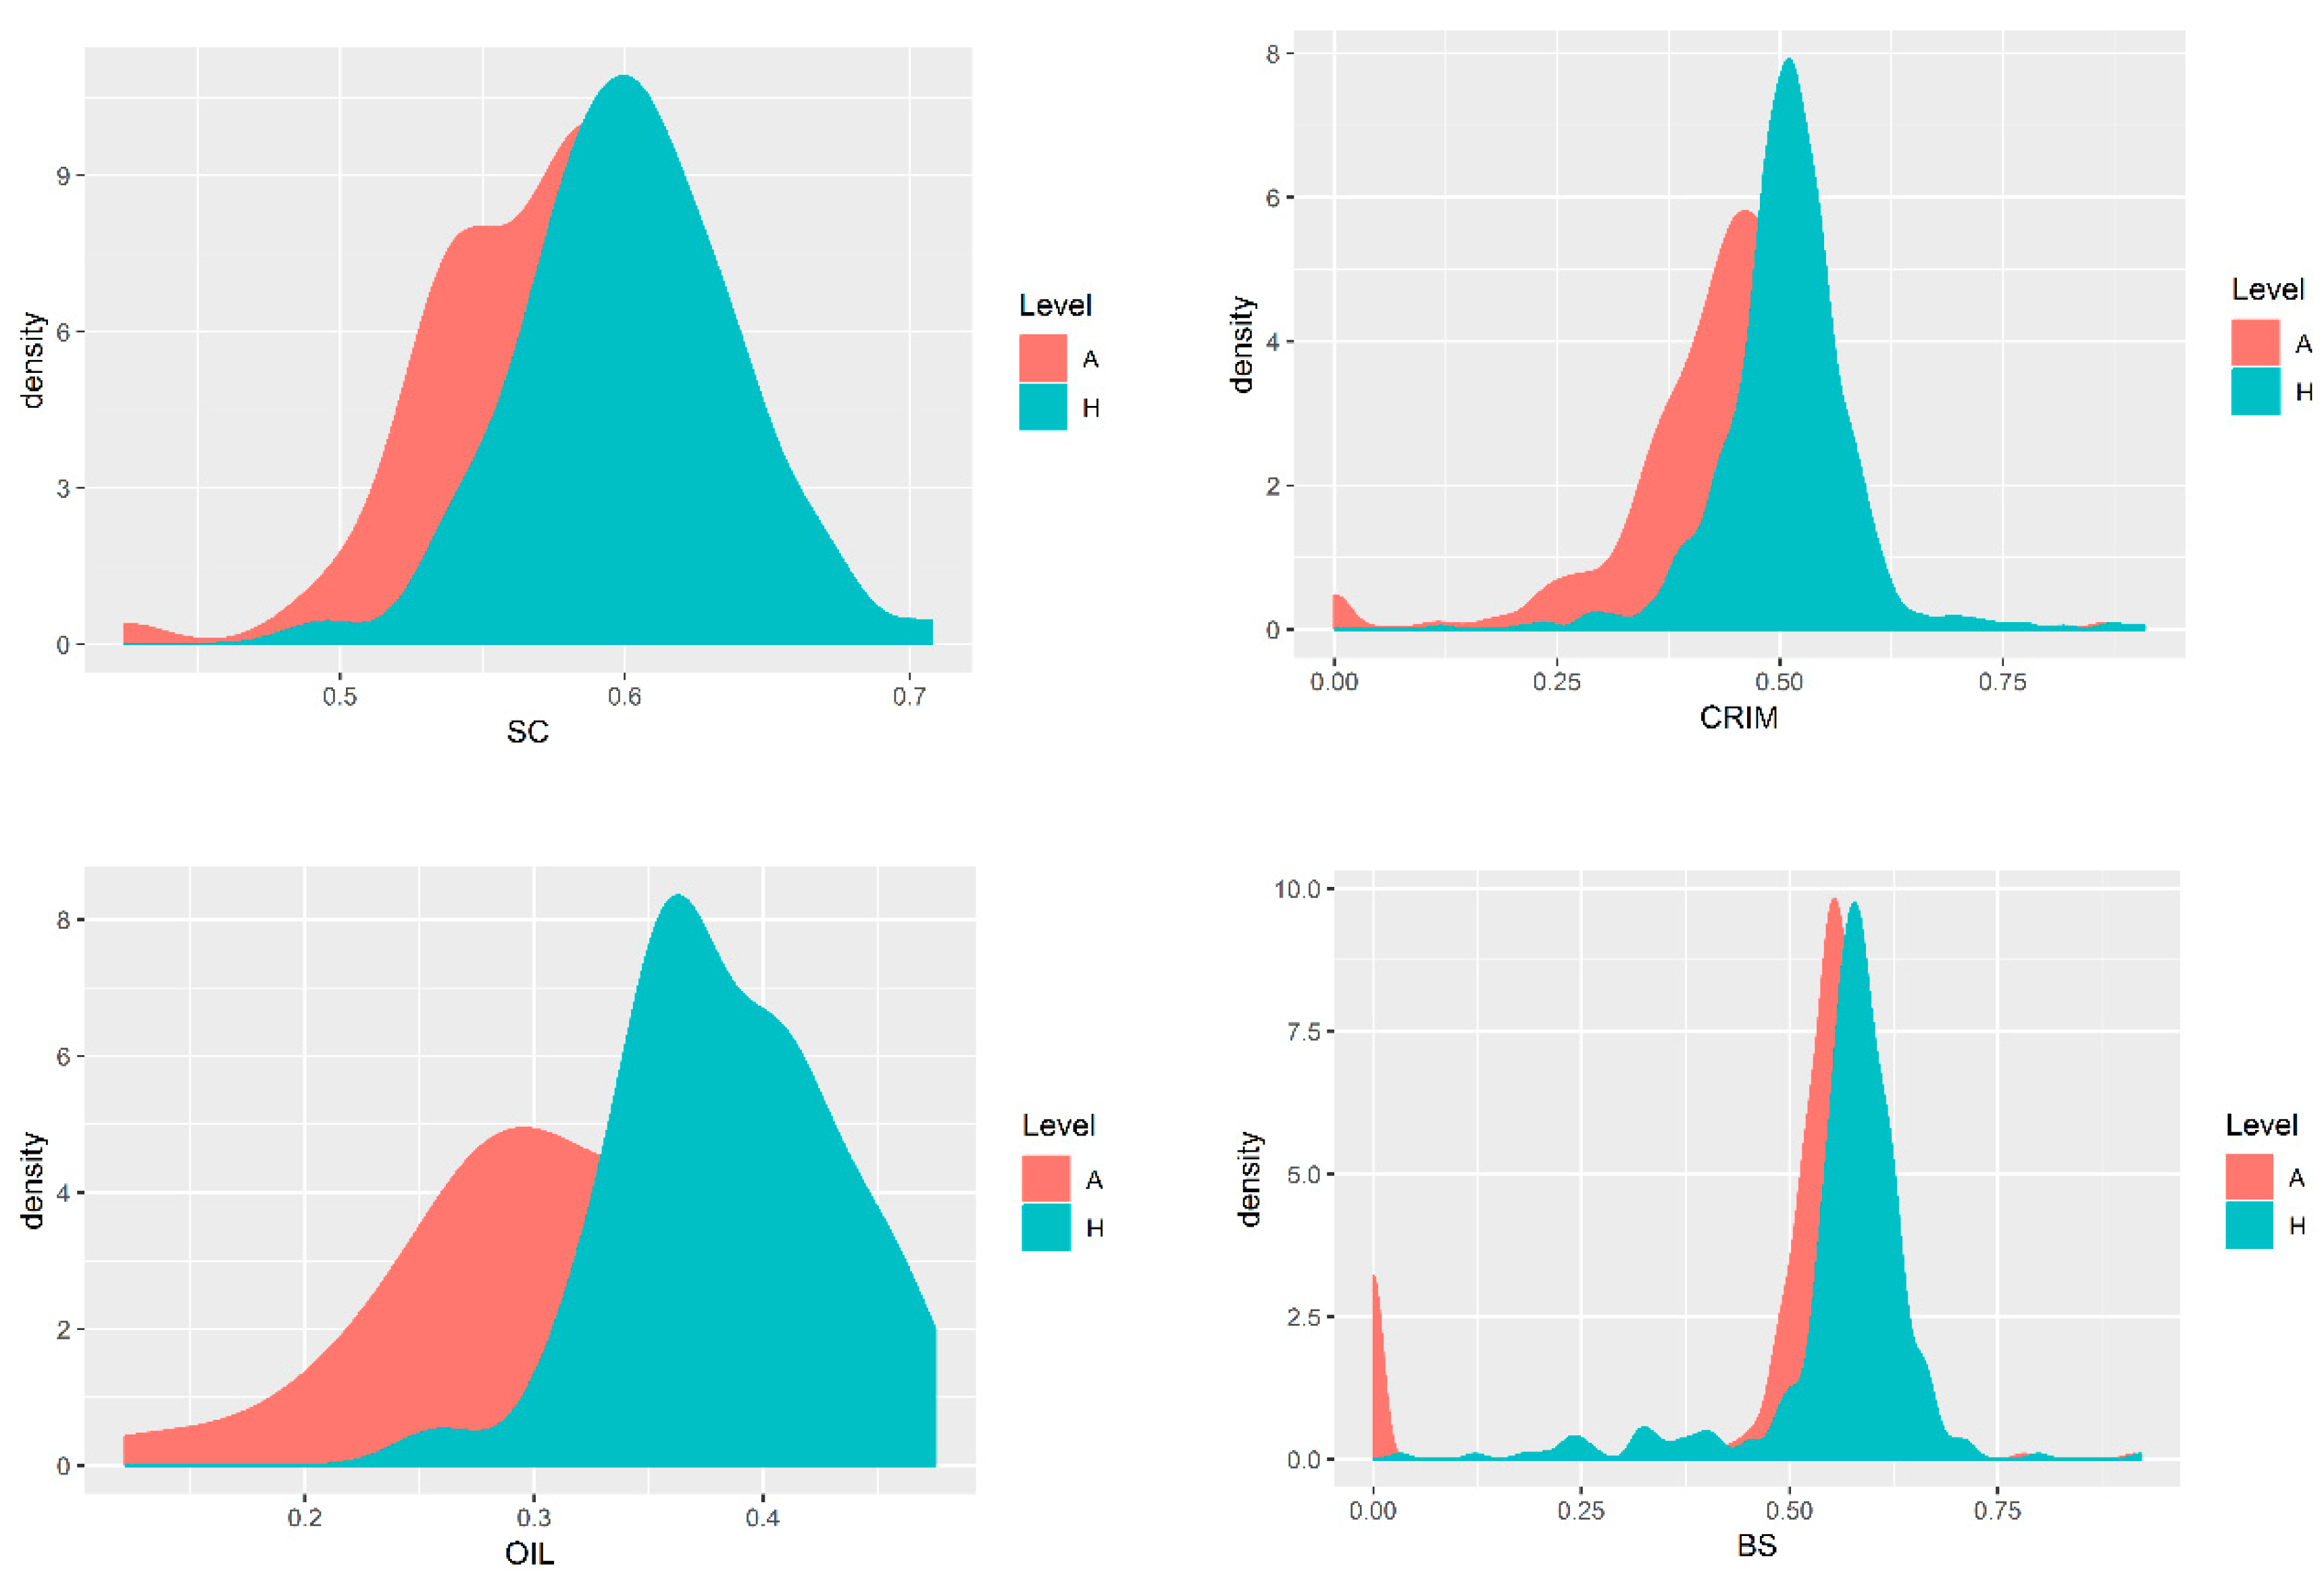
| SC | 0.532 | 0.539 | 0.699 | 0.855 ** | 0.569 | 0.602 | 3.274 | 0.769 ** |
| CRIM | 0.367 | 0.433 | 6.638 | 0.767 ** | 0.430 | 0.507 | 7.712 | 0.664 ** |
| OIL | 0.389 | 0.414 | 2.518 | 0.777 ** | 0.318 | 0.384 | 6.659 | 0.682 ** |
| BS | 0.517 | 0.527 | 0.993 | 0.852 ** | 0.503 | 0.563 | 6.032 | 0.752 ** |
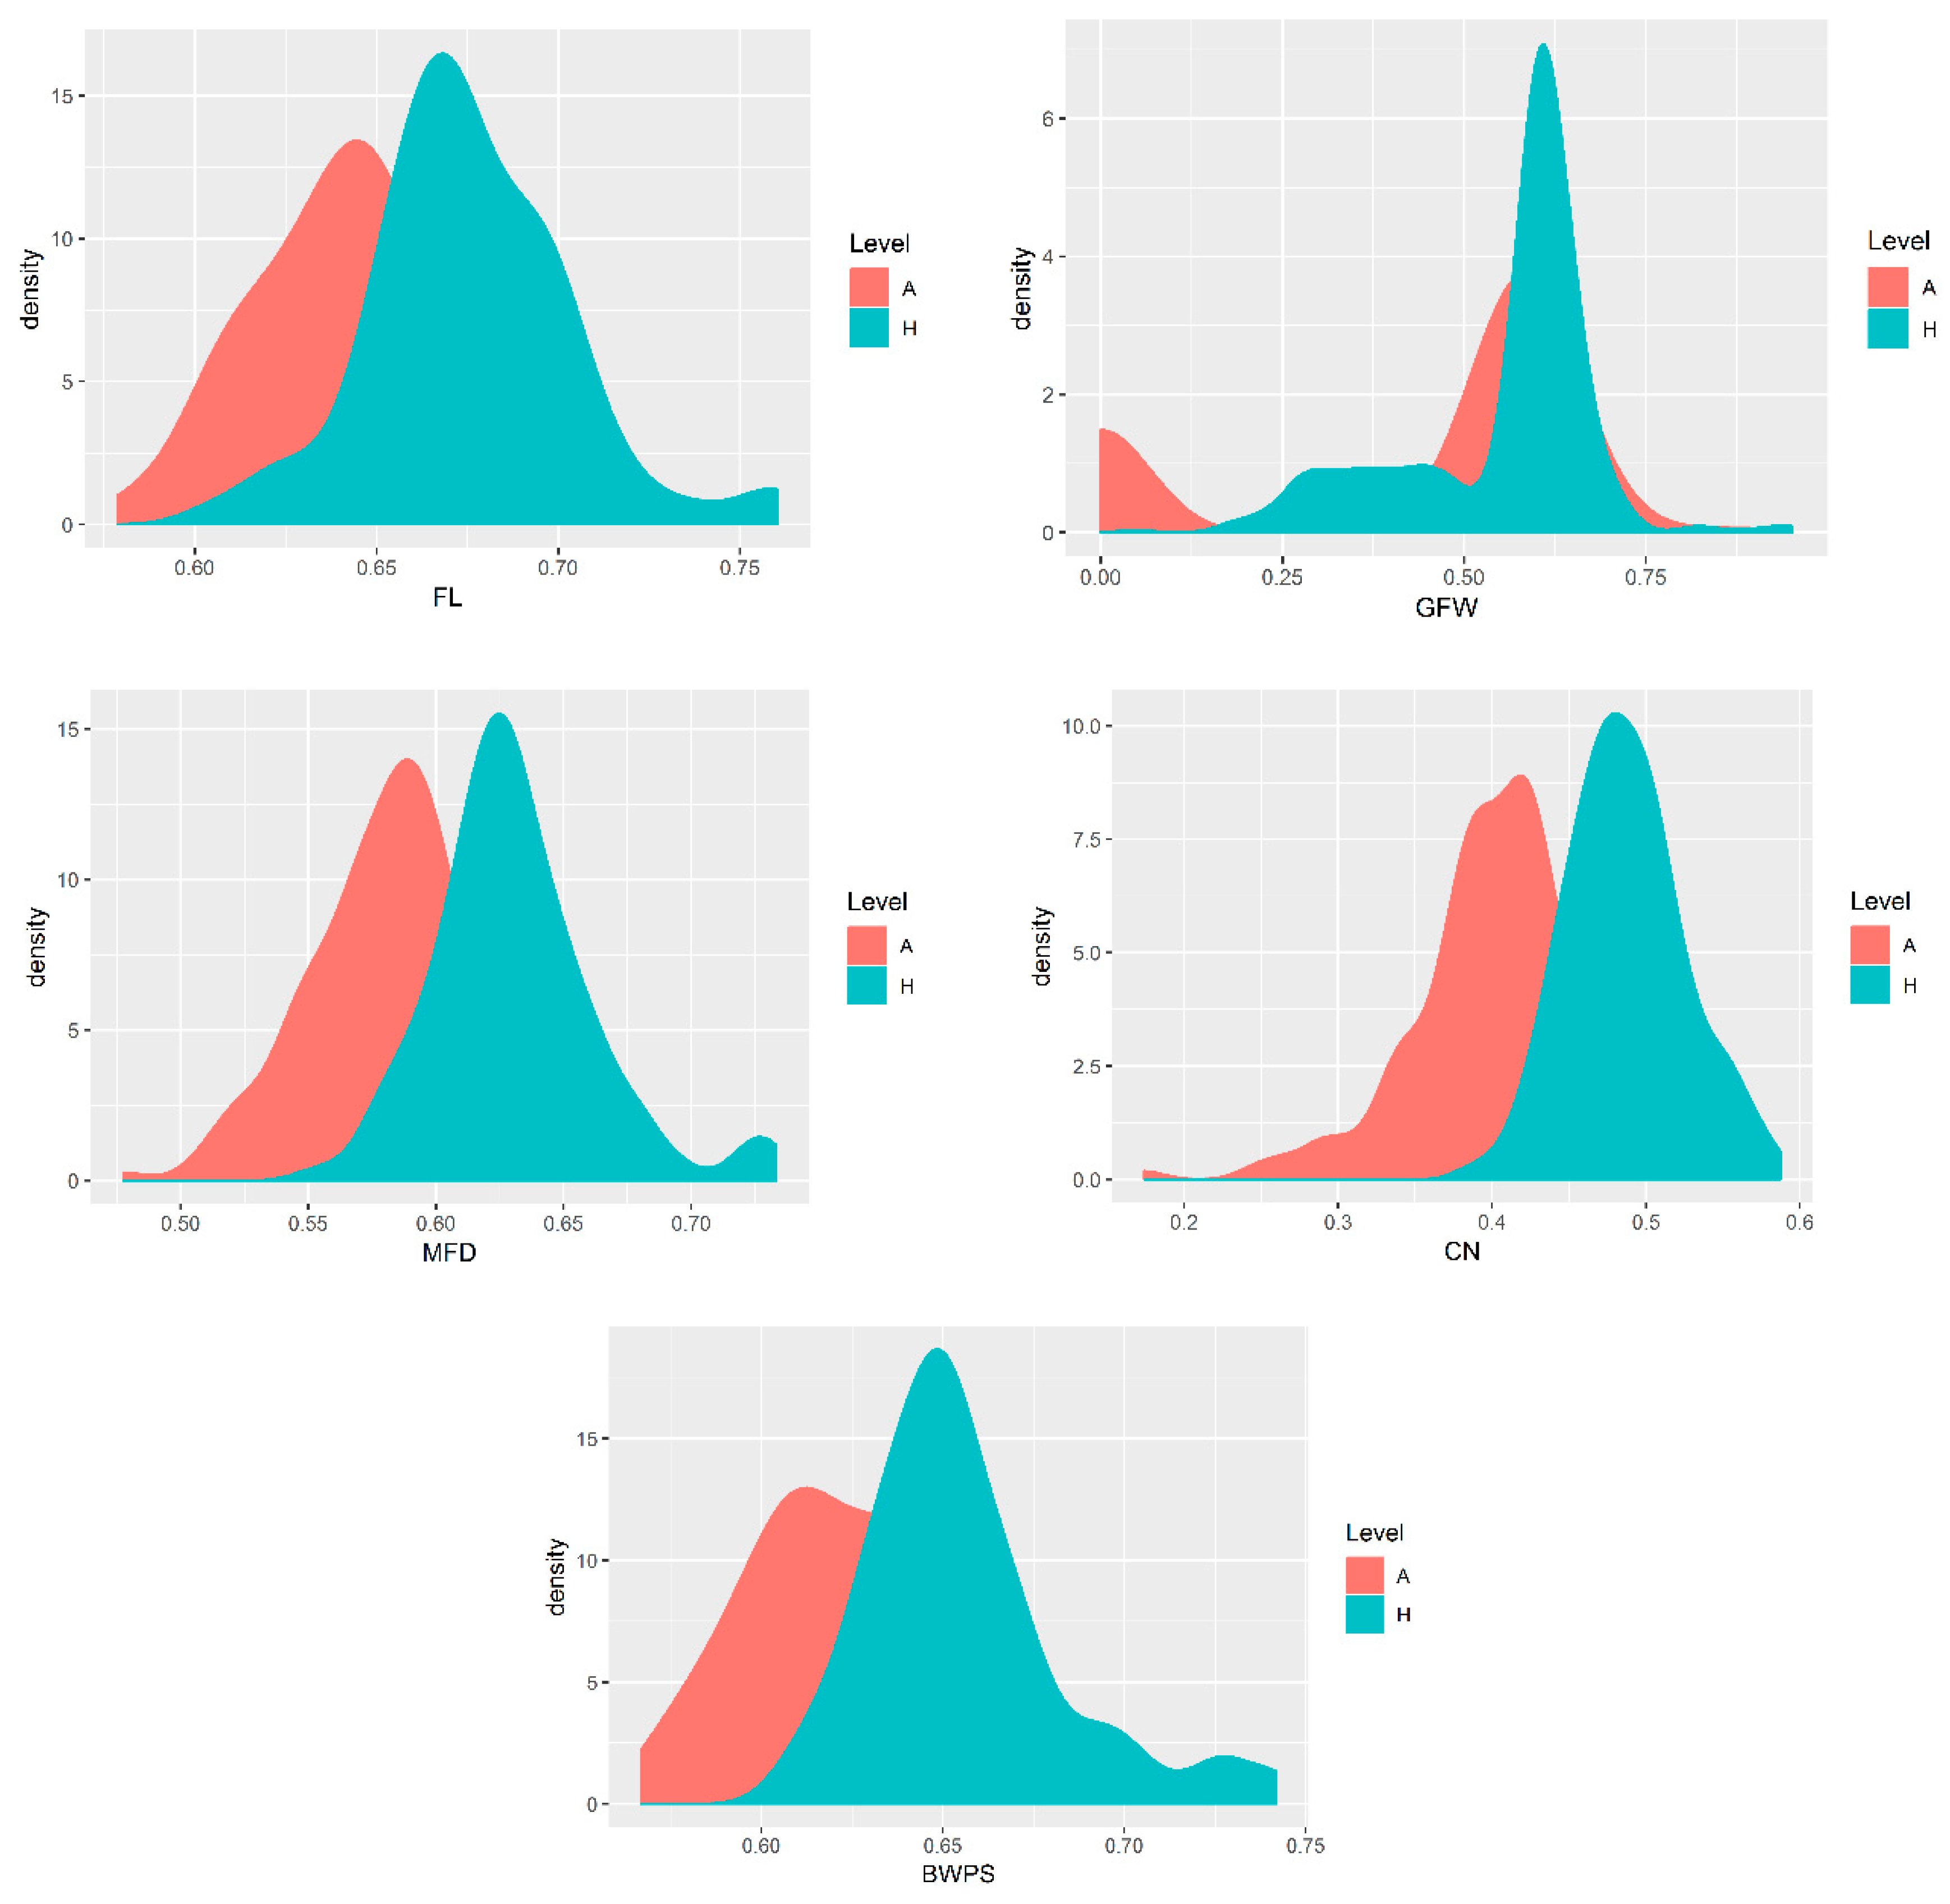
| FL | 0.559 | 0.563 | 0.372 | 0.862 ** | 0.646 | 0.676 | 3.016 | 0.668 ** |
| GFW | 0.517 | 0.523 | 0.595 | 0.854 ** | 0.436 | 0.553 | 11.736 | 0.705 ** |
| MFD | 0.476 | 0.521 | 4.544 | 0.833 ** | 0.580 | 0.630 | 5.012 | 0.580 ** |
| CN | 0.362 | 0.437 | 7.486 | 0.717 ** | 0.400 | 0.487 | 8.659 | 0.525 ** |
| BWPS | 0.562 | 0.573 | 1.089 | 0.858 ** | 0.623 | 0.656 | 3.237 | 0.598 ** |
© 2020 by the authors. Licensee MDPI, Basel, Switzerland. This article is an open access article distributed under the terms and conditions of the Creative Commons Attribution (CC BY) license (http://creativecommons.org/licenses/by/4.0/).
Share and Cite
Wei, C.; Luo, H.; Zhao, B.; Tian, K.; Huang, X.; Wang, Y.; Fu, X.; Tian, Y.; Di, J.; Xu, X.; et al. The Effect of Integrating Genomic Information into Genetic Evaluations of Chinese Merino Sheep. Animals 2020, 10, 569. https://doi.org/10.3390/ani10040569
Wei C, Luo H, Zhao B, Tian K, Huang X, Wang Y, Fu X, Tian Y, Di J, Xu X, et al. The Effect of Integrating Genomic Information into Genetic Evaluations of Chinese Merino Sheep. Animals. 2020; 10(4):569. https://doi.org/10.3390/ani10040569
Chicago/Turabian StyleWei, Chen, Hanpeng Luo, Bingru Zhao, Kechuan Tian, Xixia Huang, Yachun Wang, Xuefeng Fu, Yuezhen Tian, Jiang Di, Xinming Xu, and et al. 2020. "The Effect of Integrating Genomic Information into Genetic Evaluations of Chinese Merino Sheep" Animals 10, no. 4: 569. https://doi.org/10.3390/ani10040569