Comparison of the Efficiency of BLUP and GBLUP in Genomic Prediction of Immune Traits in Chickens
by
Jin Zhang
1,2,†, 
Jie Wang
1,2,†,
Qinghe Li
1,2,
Qiao Wang
1,2,
Jie Wen
1,2 and
Guiping Zhao
1,2,* 1
Institute of Animal Sciences, Chinese Academy of Agricultural Sciences, Beijing 100193, China
2
State Key Laboratory of Animal Nutrition, Beijing 100193, China
*
Author to whom correspondence should be addressed.
†
These authors contributed equally to this work.
Animals 2020, 10(3), 419; https://doi.org/10.3390/ani10030419
Submission received: 13 January 2020
/
Revised: 1 March 2020
/
Accepted: 1 March 2020
/
Published: 3 March 2020
(This article belongs to the Section Animal Genetics and Genomics)
Abstract
:Simple Summary
With the rapid development of the poultry industry, outbreaks of certain avian diseases such as avian influenza, Newcastle disease, and salmonellosis can cause severe loss to local economies. An effective method to avoid this problem may be developing resistant lines on the basis of immune response traits. In our study, when the number of genotyped reference animals was small, the traditional pedigree-based method (BLUP) was more efficient than the genetic linear unbiased prediction of genomes (GBLUP) method in predicting the genetic parameters of sheep red blood cell antibody titer (SRBC), the ratio of heterophils to lymphocytes (H/L), the spleen immune index (SII) and the spleen weight at 100 d (SW) in Beijing oil chickens.
Abstract
Poultry diseases pose a large threat to poultry production. Selection to improve immune traits is a feasible way to prevent and control avian diseases. The objective of this study was to investigate the efficiency of estimation of genetic parameters for antibody response to avian influenza virus (Ab-AIV), antibody response to Newcastle disease virus (Ab-NDV), sheep red blood cell antibody titer (SRBC), the ratio of heterophils to lymphocytes (H/L), immunoglobulin G (IgG), the spleen immune index (SII), thymus immune index (TII), thymus weight at 100 d (TW) and the spleen weight at 100 d (SW) in Beijing oil chickens, by using the best linear unbiased prediction (BLUP) method and genomic best linear unbiased prediction (GBLUP) method. The phenotypic data used in the two methods were the same and were from 519 individuals. With the BLUP model, Ab-AIV, Ab-NDV, SRBC, H/L, IgG, TII, and TW had low heritability ranging from 0.000 to 0.281, whereas SII and SW had high heritability of 0.631 and 0.573. With the GBLUP model, all individuals were genotyped with Illumina 60K SNP chips, and Ab-AIV, Ab-NDV, SRBC, H/L and IgG had low heritability ranging from 0.000 to 0.266, whereas SII, TII, TW and SW had moderate heritability ranging from 0.300 to 0.472. We compared the prediction accuracy obtained from BLUP and GBLUP through 50 time 5-fold cross-validation (CV), and the results indicated that BLUP provided a slightly higher accuracy of prediction than GBLUP in this population.
1. Introduction
In poultry breeding, the main objective traits are growth and reproduction traits, whereas, little attention has been paid to the selection of immune traits. Regular immunization is a large expense in poultry production, and the problem of poultry diseases remains very serious [1,2,3]. Selection of immune traits is able to not only improve poultry disease resistance but also effectively control production costs. In chicken breeding, immune performance evaluation commonly includes the following: antibody response to avian influenza virus (Ab-AIV), antibody response to Newcastle disease virus (Ab-NDV), sheep red blood cells (SRBC), ratio of heterophils to lymphocytes (H/L), immune organ index (spleen immune index (SII), thymus immune index (TII), thymus weight at 100 d (TW) and spleen weight at 100 d (SW)) and serum immunoglobulin G (IgG).
SRBC is a non-pathogenic multivalent antigen that has been widely used in animal humoral immune response studies, it reflects the level of antibodies produced by the body [4]. SRBC antibodies are positively correlated with infection with Newcastle disease virus, Staphylococcus aureus and so forth [5,6]. Several studies have shown that the selection of this trait can improve the genetic resistance of poultry [7,8]. H/L is an immune trait that directly responds to the corresponding immune effects at the cellular level. Individuals with low H/L values usually have high resistance to heat stress [9,10,11]. Al-Murrani [10] has used this value as a selection criterion for Salmonella typhimurium resistance and has suggested that H/L is highly heritable in chickens. In general, SRBC and H/L can be more suitable as indicators for the breeding of new strains with high disease resistance. Both can measure the body’s general disease resistance and have stable heritability; consequently, selecting the traits can improve general disease resistance in chickens.
Accurate and reliable estimation of genetic parameters is a prerequisite for rational breeding programs during the animal breeding process. In recent years, with the detection of single nucleotide polymorphism (SNP) markers and the rapid development of biochip technology, new genetic-prediction methods have been developed, notably the genetic linear unbiased prediction of genomes (GBLUP) method [12]. Genomic selection represents a revolution beyond traditional breeding and is based on calculation of the genomic estimated breeding value (GEBV) according to genome-wide marker information [13]. Generally, genomic selection achieves a higher estimation accuracy than the conventional estimated breeding value based on pedigree [14,15,16]. This selection method is useful for traits that are difficult and expensive to measure [17,18], such as the avian influenza antibody titer, the immune response against sheep red blood cells and the Newcastle disease antibody titer; it allows for higher accuracy of the estimated breeding value to be obtained. Several reports have demonstrated that genomic selection is more advantageous than the conventional method on the basis of pedigree information in poultry [19,20,21].
The objective of this study was to estimate genetic parameters of nine immune traits and to compare the accuracy of BLUP and GBLUP in genomic prediction on immune traits in Beijing oil chickens.
2. Materials and Methods
2.1. Ethics Statement
Ethical approval on animal care and experimental procedures were performed in accordance with the Animal Ethics Committee of the Institute of Animal Sciences, Chinese Academy of Agricultural Sciences (IAS-CAAS, Beijing, China) with the following reference number: IASCAASAE-03.
2.2. Population and Phenotypes
The data were collected from 519 Beijing oil chicken cocks raised at the Chang ping Experimental Base of Institute of Animal Sciences. The Beijing oil chicken is an indigenous Chinese breed characterized by slow growth and high meat quality. All birds were from the same batch, the offspring of 53 cocks and 199 hens. At 100 d of age, the chickens were killed, and blood and serum samples were collected. We recorded immune traits including Ab-AIV, Ab-NDV, SRBC, H/L, IgG, SII, TII, TW and SW (Table 1).
Ab-AIV, AI-NDV, and SRBC antibody levels in the serum samples were measured with hemagglutination inhibition tests according to previous studies [22,23,24,25] and were expressed as the log2 value of the corresponding dilutions. H/L was measured by using blood smears made with fresh blood [24]. Briefly, after staining with Wright’s Giemsa solution, the heterophils and lymphocytes on the blood smears were counted under a light microscope. IgG in the serum samples was measured with an indirect ELISA kit (Cusabio, Wuhan, China) [23]. The weights of the spleen, thymus and carcass were measured to detect the SII, TII, TW and SW.
SII (%) = weight of spleen(g)/weight of carcass(g)
TII (%) = weight of thymus(g)/weight of carcass(g)
2.3. Genotype Data
Genomic DNA was extracted from blood samples with a conventional phenol method, and then genotyping was performed with 60K SNP chips (Illumina, San Diego, CA, USA). All 519 chickens with immune trait records were genotyped. PLINK (V1.07) software was used to control for the quality of chip genotype data, with individual call rates > 90%, SNP locus call rates > 95% and minor allele frequency > 1%. After quality control, 46 876 SNP markers and 519 individuals were used.
2.4. Statistical Model
In this study, two methods, a pedigree-based BLUP method with a pedigree-based relationship matrix and a GBLUP method based on genomic relationship matrix, were used to predict the breeding value.
2.4.1. BLUP
The traditional animal model with a pedigree-based relationship matrix was applied to predict breeding values for each trait separately [26]. The model was defined as:
where y was the vector of phenotypic values (Ab-AIV, Ab-NDV, SRBC, H/L, IgG, SII, TII, TW and SW), μ was the overall mean, 1 was a vector of 1, a was the vector of additive genetic effects, following a normal distribution of N(0, Aσa2), where A was the pedigree-based genetic relationship matrix, and σa2 was the variance of additive genetic effects. Z was the incidence matrix associating a with y, and e was the vector of random residuals with distribution of N (0, Iσe2), in which I was the identity matrix, and σe2 was the variance of residuals.
2.4.2. GBLUP
The GBLUP model was used to predict the GEBV of all genotyped individuals [12].
where the definitions of y, Z and e were the same as those in the BLUP model, g was the vector of genomic breeding values to be estimated, following a normal distribution of N(0, Gσg2), in which σg2 was the variance of additive genetic effects, and G was the marker-based genomic relationship matrix. Z was the incidence matrix linking g to y, and e was the vector of random residuals following a normal distribution of N (0, Iσe2), in which σe2 was the variance of residuals. The estimation of variance components and the prediction of breeding values were performed with the Asreml package [27].
2.5. Cross-Validation
Cross-validation (CV) is usually used to obtain a reliable and stable model, and to evaluate the quality of the model [28,29]. In this study, 5-fold CV was applied to assess the accuracy of the genomic predictions. The method to create subsets of sampling was used according to a previous study [30]. Briefly, 519 birds were randomly divided into five subsets. In each fold of validation, one data set was used as the test data set, and the other four data sets were used as reference datasets. All data sets were used to build a model. To account for sampling variation, splitting was repeated 50 times. The CV was performed with the Asreml package and caret package [27,31].
Predictive Ability: Correlation between phenotype and breeding value (y: phenotype; : breeding value)
Prediction Accuracy: Accuracy of breeding values (g: actual breeding value; : predicted breeding values; h: Arithmetic square root of heritability
3. Results
3.1. Descriptive Statistics and Estimates of Genetic Parameters
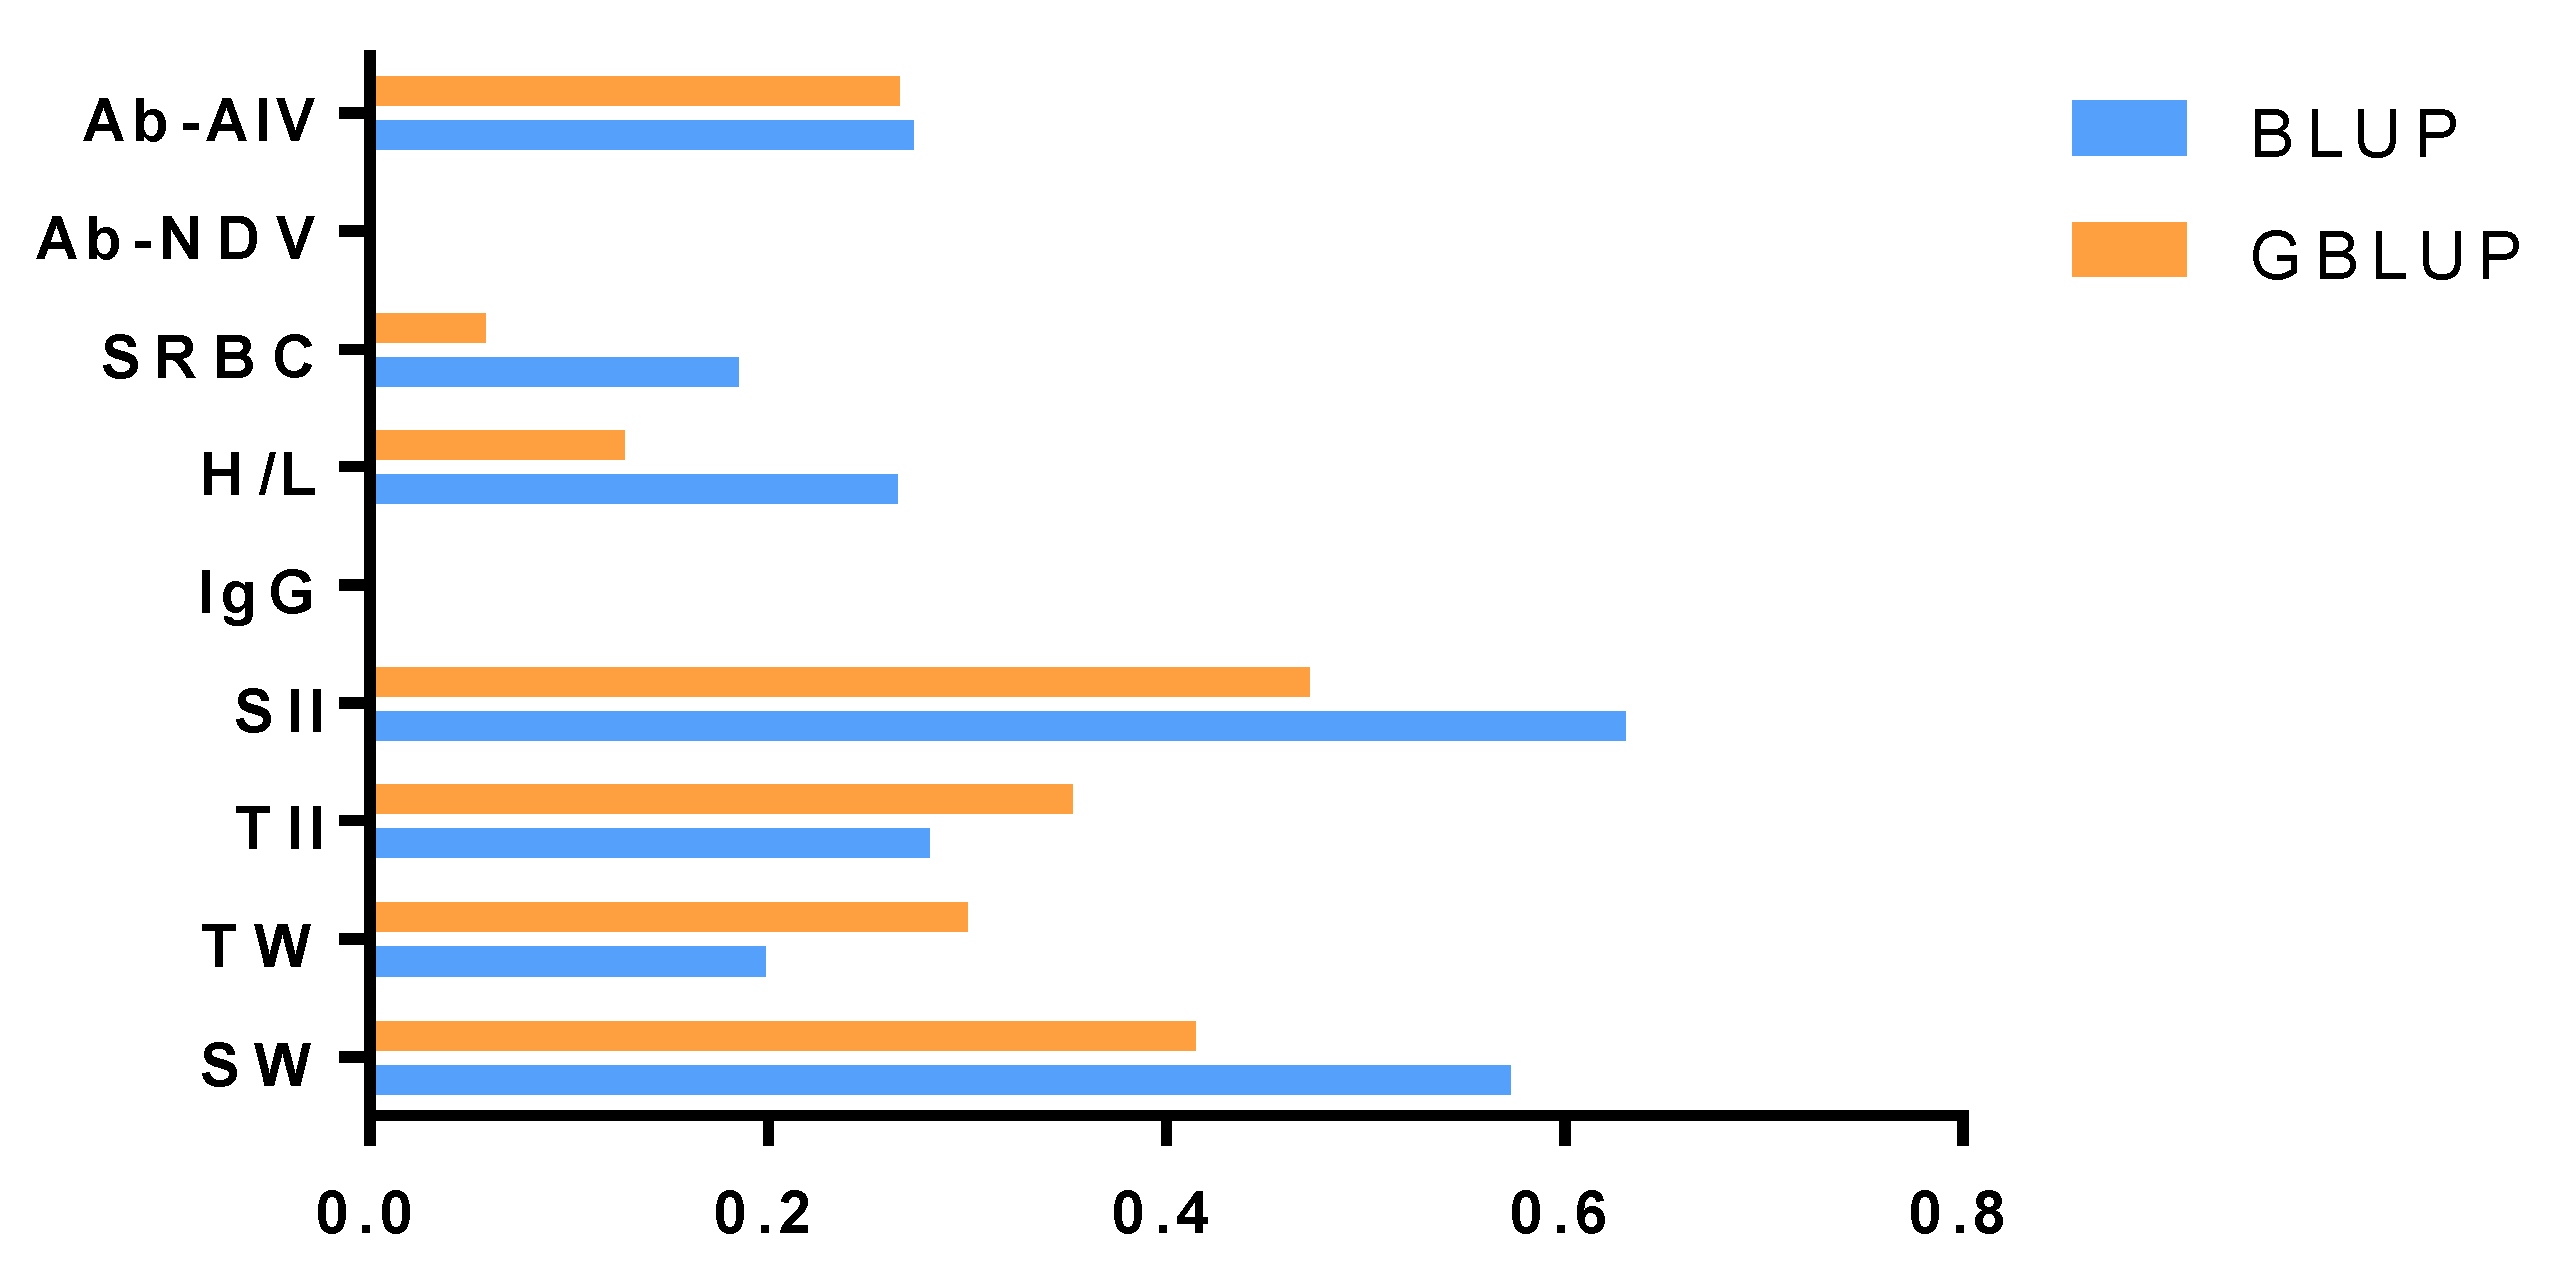
The estimated genetic parameters for the nine immune traits were presented in Table 2 and Table 3. According to the heritability of the nine immune traits, we compared the differences between the heritability estimated with the BLUP and GBLUP methods in Figure 1. The estimates of heritability of SRBC, H/L, SII and SW were generally higher with the BLUP model than the GBLUP model.
Using the entire dataset, we found that the heritability of the nine immune traits ranged from 0 to 0.631 with the pedigree-based BLUP model. Across the nine analyzed traits, the estimated heritability of SII was the highest, at 0.631. The standard error (SE) values of estimated heritability for all traits were less than 0.110. The heritability of Ab-NDV and IgG was almost 0, and Ab-AIV, SRBC, H/L, TII and TW had low heritability ranging from 0.185 to 0.281. However, SII and SW had high heritability of 0.631 and 0.573, respectively. With the GBLUP model, SRBC, Ab-NDV and IgG had the lowest heritability. Ab-AIV and H/L had low heritability of 0.266 and 0.128, respectively. SII, TII, TW and SW had moderate heritability ranging from 0.300 to 0.472. The SE of estimated heritability was less than 0.090.
3.2. The Accuracy of Genomic Prediction with the BLUP and GBLUP Methods
As shown in Table 4, the accuracy of predictions from 50 time 5-fold CV was calculated on SRBC and H/L immune traits through a pedigree-based BLUP model and GBLUP model. In the two scenarios, the GBLUP model had a lower predictive ability. The prediction accuracy between the conventional model and genomic model differed slightly, for SRBC, the mean of prediction accuracy from the BLUP was 0.091 higher than GBLUP.
3.3. Breeding Values of Various Traits Predicted with BLUP and GBLUP for Birds with Low or High SRBC and H/L
Table 5 and Table 6 show the means for different phenotypic traits on the basis of 30 efficient and 30 inefficient values of SRBC and H/L. These individuals with extreme values were selected according to estimated breeding values from BLUP or GBLUP models. For SRBC, as shown in Table 5, comparison of phenotypic values for the 30 birds with extreme values indicated that the nine immune traits had no significant differences, but there was a slight difference between the two methods, and the mean phenotypic value of SRBC with BLUP was higher than that with GBLUP (p = 0.081), For H/L, as shown in Table 6, there was also no significant difference between the two methods, but the phenotypic mean of H/L for the 30 birds with efficient values was 0.134 with BLUP but 0.153 with GBLUP. Thus, selecting for SRBC and H/L was more efficient with the BLUP than the GBLUP model.
4. Discussion
In this study, the estimated heritability of nine immune traits ranged from 0.00 to 0.631 with a pedigree-based BLUP model and from 0.000 to 0.472 with the GBLUP model. Therefore, the estimate of heritability was higher with the BLUP method. For the BLUP model, the estimates of heritability for the two main selected immune traits, SRBC and H/L, were 0.185 and 0.265, respectively. SRBC and H/L had low heritability in Beijing oil chickens, which is in line with findings from previous studies. Boa-Amponsem has reported that maternal antibody levels affect antibody titers in next-generation chickens, and the heritability of chickens responding to antibodies produced by SRBC is relatively stable [32]. Al-Murrani has demonstrated that H/L is highly heritable in chickens [33]. The heritability of Ab-NDV and Ab-AIV is 0.478 and 0.301 according to a report of Liu, et al. [30], but the estimates of heritability of the two traits in our study were lower, at 0 and 0.273, respectively, a finding possibly associated with the genetic background of the chickens. In the spleen and thymus, which are important immune organs in birds, the estimated heritability of the immune organ index was 0.631 and 0.281, the estimated heritability of immune organ weight was 0.573 and 0.199, respectively, thus indicating that the two immune traits are positively correlated with spleen weight and thymus weight at 100 d. With the GBLUP model, the estimated heritability of nine immune traits was lower than that with the BLUP model.
The SEs of heritability estimates were low. Although the dataset in our study was small, there are some possible reasons that may explain this finding. First, the individuals were from a single farm and lived in the same environment during the same period; thus, the model was simple, and relatively few parameters needed to be estimated. Second, the dataset had good structure in estimating genetic parameters because of the appropriate numbers of half-siblings and full-siblings.
We selected SRBC and H/L as the target immune traits to detect the accuracy through 50 time 5-fold CV. Compared with the GBLUP method, the traditional BLUP method had slightly higher accuracy for the two immune traits, and the accuracy of prediction for H/L was higher than that for SRBC. Our results differed from those in previous reports [34,35], in which genomic information has been found to outperform pedigree in estimating relatedness for two possible reasons. On the one hand, the heritability for H/L and SRBC traits was below moderate, thus enabling sufficient accuracy of the traditional BLUP method, and the improvement from genomic prediction was not as large as expected. On the other hand, owing to the existence of missing heritability, the 60K SNP chip cannot be used to accurately determine the genetic relationships between individuals [36]. Moreover, one study has indicated that the expected value of BLUP might be high [37]. Another study has also indicated that prediction accuracy increases monotonically with the size of the training population [38,39], thus also suggesting a reason for the slightly lower accuracy of GBLUP than BLUP in this study (519 individuals).
5. Conclusions
Our research aimed to analyze the efficiency of BLUP and GBLUP in genomic prediction on immune traits in chickens. Estimates of heritability of SRBC, H/L, SII and SW were higher with the BLUP model than the GBLUP model. Importantly, the BLUP model led to slightly higher accuracy in genetic parameter prediction than the GBLUP model in our study.
Author Contributions
Conceptualization, J.Z., and J.W. (Jie Wang); methodology, G.Z.; software, J.W. (Jie Wang); validation, Q.W., J.W. (Jie Wen), Q.L., and G.Z.; formal analysis, G.Z.; writing—original draft preparation, J.Z.; writing—review and editing, J.Z. and J.W. (Jie Wang). All authors have read and agreed to the published version of the manuscript.
Funding
This research was funded by the National Natural Science Foundation of China (No. 31572393), the China Agriculture Research System (CARS42) and the Agricultural Science and Technology Innovation Program (ASTIPIAS04) of the Chinese Academy of Agricultural Sciences.
Acknowledgments
We acknowledge Guangdong Xinguang Nongmu Co., Ltd. (Foshan, China) for their kind gift of Cobb chickens. We thank International Science Editing (http://www.internationalscienceediting.com) for editing this manuscript.
Conflicts of Interest
The authors declare that they have no conflicts of interest.
References
- Capua, I.; Alexander, D.J. Avian influenza infection in birds: A challenge and opportunity for the poultry veterinarian. Poult. Sci. 2009, 88, 842–846. [Google Scholar] [CrossRef] [PubMed]
- Swayne, D.E.; King, D.J. Avian influenza and Newcastle disease. J. Am. Vet. Med. Assoc. 2005, 222, 1534–1540. [Google Scholar] [CrossRef] [PubMed] [Green Version]
- Sartore, S.; Bonfati, L.; Lorenzetto, M.; Cecchinato, M.; Marangon, S. The effects of control measures on the economic burden associated with epidemics of avian influenza in Italy. Poult. Sci. 2010, 89, 1115–1121. [Google Scholar] [CrossRef] [PubMed]
- Baelmans, R.; Parmentier, H.K.; Nieuwland, M.G.; Dorny, P.; Demey, F.; Berkvens, D. Haemolytic Complement Activity and Humoral Immune Responses to Sheep Red Blood Cells in Indigenous Chickens and in Eight German Dahlem Red Chicken Lines with Different Combinations of Major Genes (dwarf, naked neck and frizzled) of Tropical Interest. Trop. Anim. Health Prod. 2005, 37, 173–186. [Google Scholar] [CrossRef] [PubMed]
- Gross, W.G.; Siegel, P.B.; Hall, R.W.; Domermuth, C.H.; Duboise, R.T. Production and persistence of antibodies in chickens to sheep erythrocytes. 2. Resistance to infectious diseases. Poult. Sci. 1980, 59, 205–210. [Google Scholar] [CrossRef] [PubMed]
- Mashaly, M.M.; Heetkamp, M.J.; Parmentier, H.K.; Schrama, J.W. Influence of genetic selection for antibody production against sheep blood cells on energy metabolism in laying hens. Poult. Sci. 2000, 79, 519–524. [Google Scholar] [CrossRef]
- Siwek, M.; Cornelissen, S.J.B.; Buitenhuis, A.J.; Nieuwland, M.G.B.; Bovenhuis, H.; Crooijmans, R.P.M.A.; Groenen, M.A.M.; Parmentier, H.K.; van der Poel, J.J. Quantitative trait loci for body weight in layers differ from quantitative trait loci specific for antibody responses to sheep red blood cells. Poult. Sci. 2004, 83, 853–859. [Google Scholar] [CrossRef]
- Wijga, S.; Parmentier, H.K.; Nieuwland, M.G.B.; Bovenhuis, H. Genetic parameters for levels of natural antibodies in chicken lines divergently selected for specific antibody response. Poult. Sci. 2009, 88, 1805–1810. [Google Scholar] [CrossRef]
- Dehnhard, N.; Quillfeldt, P.; Hennicke, J.C. Leucocyte profiles and H/L ratios in chicks of Red-tailed Tropicbirds reflect the ontogeny of the immune system. J. Comp. Physiol. B. 2011, 181, 641–648. [Google Scholar] [CrossRef]
- Al-Murrani, W.K.; Al-Rawi, A.J.; Al-Hadithi, M.F.; Al-Tikriti, B. Association between heterophil/lymphocyte ratio, a marker of ’resistance’ to stress, and some production and fitness traits in chickens. Br. Poult. Sci. 2006, 47, 443–448. [Google Scholar] [CrossRef]
- Lentfer, T.L.; Pendl, H.; Gebhardt-Henrich, S.G.; Fröhlich, E.K.F.; Von Borell, E. H/L ratio as a measurement of stress in laying hens—methodology and reliability. Br. Poult. Sci. 2015, 56, 157–163. [Google Scholar] [CrossRef] [PubMed]
- Vanraden, P.M. Efficient Methods to Compute Genomic Predictions. J. Dairy Sci. 2008, 91, 4414–4423. [Google Scholar] [CrossRef] [PubMed] [Green Version]
- Koning, d.D.-J. Meuwissen et al. on Genomic Selection. Genetics 2016, 203, 5–7. [Google Scholar] [CrossRef] [PubMed] [Green Version]
- Wolc, A.; Arango, J.; Jankowski, T.; Settar, P.; Dekkers, J.C.M. Pedigree and genomic analyses of feed consumption and residual feed intake in laying hens. Poult. Sci. 2013, 92, 2270–2275. [Google Scholar] [CrossRef] [PubMed]
- Wolc, A.; Settar, P.; Fulton, J.E.; Dekkers, J.C.M. Persistence of accuracy of genomic estimated breeding values over generations in layer chickens. Genet. Sel. Evol. 2011, 43, 23. [Google Scholar] [CrossRef] [PubMed] [Green Version]
- Wolc, A.; Honghua, H.Z.; Arango, J.; Settar, P.; Fulton, J.E.; O’Sullivan, N.P.; Preisinger, R.; Stricker, C.; Habier, D.; Fernando, R.L.; et al. Response and inbreeding from a genomic selection experiment in layer chickens. Genet. Sel. Evol. 2015, 47, 59. [Google Scholar] [CrossRef] [Green Version]
- Meuwissen, T.; Hayes, B.; Goddard, M. Accelerating Improvement of Livestock with Genomic Selection. Annu. Rev. Anim. Biosci. 2013, 1, 221–237. [Google Scholar] [CrossRef]
- Goddard, M.E.; Hayes, B.J. Mapping genes for complex traits in domestic animals and their use in breeding programmes. Nat. Rev. Genet. 2009, 10, 381–391. [Google Scholar] [CrossRef]
- Smaragdov, M.G. [SNP assisted total genomic selection as a possible accelerator of traditional selection]. Genetika 2009, 45, 725–728. [Google Scholar]
- Liu, T.; Luo, C.; Wang, J.; Ma, J.; Shu, D.; Lund, M.S.; Su, G.; Qu, H.; Zhang, Q. Assessment of the genomic prediction accuracy for feed efficiency traits in meat-type chickens. PLoS ONE 2017, 12, e0173620. [Google Scholar] [CrossRef]
- Song, H.; Zhang, J.; Zhang, Q.; Ding, X. Using Different Single-Step Strategies to Improve the Efficiency of Genomic Prediction on Body Measurement Traits in Pig. Front. Genet. 2019, 9, 730. [Google Scholar] [CrossRef] [PubMed] [Green Version]
- Comin, A.; Klinkenberg, D.; Marangon, S. Serological diagnosis of avian influenza in poultry: Is the haemagglutination inhibition test really the ’gold standard’? Influenza Other Respir. Viruses 2012, 7, 257–264. [Google Scholar] [CrossRef] [PubMed] [Green Version]
- Graham, D.A.; Mawhinney, K.A.; Adair, B.M.; Merza, M. Testing of bovine sera by ELISA for IgG, IgM and IgA rheumatoid factors. Vet. Immunol. Immunop. 1998, 61, 239–250. [Google Scholar] [CrossRef]
- Onbaşılar, E.E.; Sahnur E., D.; Züleyha, K.; Ender, K.; Sunay, D. The influence of different beak trimming age on performance, H-L ratio and antibody production to SRBC in laying hens. Trop. Anim. Health Prod. 2008, 41, 221–227. [Google Scholar] [CrossRef]
- Cadman, H.F.; Kelly, P.J.; de Angelis, N.D.; Rohde, C.; Collins, N.; Zulu, T. Comparison of enzyme-linked immunosorbent assay and haemagglutination inhibition test for the detection of antibodies against Newcastle disease virus in ostriches (Struthio camelus). Avian Pathol. 1997, 26, 357–363. [Google Scholar] [CrossRef]
- Henderson, C.R. Best Linear Unbiased Estimation and Prediction under a Selection Model. Biometrics 1975, 31, 423–447. [Google Scholar] [CrossRef] [PubMed] [Green Version]
- Hardie, L.C.; Vandehaar, M.J.; Tempelman, R.J.; Weigel, K.A.; Spurlock, D.M. The genetic and biological basis of feed efficiency in mid-lactation Holstein dairy cows. J. Dairy Sci. 2017, 100, 9061–9075. [Google Scholar] [CrossRef] [Green Version]
- Su, G.; Guldbrandtsen, B.; Gregersen, V.R.; Lund, M.S. Preliminary investigation on reliability of genomic estimated breeding values in the Danish Holstein population. J. Dairy Sci. 2010, 93, 1175–1183. [Google Scholar] [CrossRef] [Green Version]
- Andrés, L.; Robert-Granie, C.; Manfredi, E.; Elsen, J.-M. Performance of genomic selection in mice. Genetics 2008, 180, 611–618. [Google Scholar]
- Liu, T.; Qu, H.; Luo, C.; Li, X.; Shu, D.; Lund, M.S.; Su, G.; Krammer, F. Genomic selection for the improvement of antibody response to Newcastle disease and avian influenza virus in chickens. PLoS ONE 2014, 9, e112685. [Google Scholar] [CrossRef] [Green Version]
- Kuhn, M. Building predictive models in R using the caret package. J. Stat. Softw. 2008, 28, 1–26. [Google Scholar] [CrossRef] [Green Version]
- Boa-Amponsem, K.; Dunnington, E.A.; Siegel, P.B. Antibody transmitting ability of hens from lines of chickens differing in response to SRBC antigen. Br. Poult. Sci. 1997, 38, 480–484. [Google Scholar] [CrossRef] [PubMed]
- Al-Murrani, W.K.; Al-Rawi, I.K.; Raof, N.M. Genetic resistance to Salmonella typhimurium in two lines of chickens selected as resistant and sensitive on the basis of heterophil/lymphocyte ratio. Br. Poult. Sci. 2002, 43, 501–507. [Google Scholar] [CrossRef] [PubMed]
- Wang, J. Pedigrees or markers: Which are better in estimating relatedness and inbreeding coefficient? Theoretical Population Biol. 2016, 107, 4–13. [Google Scholar] [CrossRef]
- Bérénos, C.; Ellis, P.A.; Pilkington, J.G.; Pemberton, J.M. Estimating quantitative genetic parameters in wild populations: A comparison of pedigree and genomic approaches. Mol. Ecol. 2014, 23, 3434–3451. [Google Scholar] [CrossRef] [Green Version]
- Makowsky, R.; Pajewski, N.M.; Klimentidis, Y.C.; Vazquez, A.I.; Duarte, C.W.; Allison, D.B.; de los Campos, G.; Gibson, G. Beyond Missing Heritability: Prediction of Complex Traits. PloS Genet. 2011, 7, e1002051. [Google Scholar] [CrossRef] [Green Version]
- Muir, W.M. Comparison of genomic and traditional BLUP-estimated breeding value accuracy and selection response under alternative trait and genomic parameters. J. Anim. Breed Genet. 2015, 124, 342–355. [Google Scholar] [CrossRef]
- Weigel, K.A.; De Los Campos, G.; Gonzalez-Redo, O.; Naya, H.; Wu, X.L.; Long, N.; Rosa, G.J.M.; Gianola, D. Predictive ability of direct genomic values for lifetime net merit of Holstein sires using selected subsets of single nucleotide polymorphism markers. J. Dairy Sci. 2009, 92, 5248–5257. [Google Scholar] [CrossRef] [Green Version]
- Vazquez, A.I.; Rosa, G.J.M.; Weigel, K.A.; de Ios Campos, G.; Gianola, D.; Allison, D.B. Predictive ability of subsets of single nucleotide polymorphisms with and without parent average in US Holsteins. J. Dairy Sci. 2010, 93, 5942–5949. [Google Scholar] [CrossRef] [Green Version]
Figure 1.
Comparison of heritability estimated with the best linear unbiased prediction (BLUP) model (Blue bar) and genetic linear unbiased prediction of genomes (GBLUP) model (orange bar). The x-axis is the value of heritability, and the y-axis is the name of the immune trait.
Figure 1.
Comparison of heritability estimated with the best linear unbiased prediction (BLUP) model (Blue bar) and genetic linear unbiased prediction of genomes (GBLUP) model (orange bar). The x-axis is the value of heritability, and the y-axis is the name of the immune trait.


Table 1.
Descriptive statistics of nine immune traits.
| Trait 1 | N-Obs 2 | Average | SD 3 | Min Value | Max Value |
|---|---|---|---|---|---|
| Ab-AIV | 455 | 9.479 | 1.558 | 5.000 | 12.000 |
| Ab-NDV | 384 | 5.505 | 1.262 | 3.000 | 9.000 |
| SRBC | 519 | 7.788 | 1.191 | 4.000 | 10.000 |
| H/L | 519 | 0.438 | 0.294 | 0.024 | 1.579 |
| IgG | 466 | 542.855 | 219.233 | 144.670 | 1754.730 |
| SII | 519 | 0.150 | 0.037 | 0.059 | 0.303 |
| TII | 514 | 0.477 | 0.174 | 0.043 | 1.045 |
| TW | 515 | 7.217 | 2.786 | 0.460 | 17.610 |
| SW | 519 | 2.269 | 0.622 | 0.800 | 4.360 |
1 Ab-AIV, antibody response to avian influenza virus; Ab-NDV, antibody response to Newcastle disease virus; SRBC, sheep red blood cell antibody titer; H/L, the ratio of heterophils to lymphocytes; IgG (ng/ml), immunoglobulin G; SII (%), spleen immune index; TII (%), thymus immune index; TW (g), thymus weight at 100 d; SW (g), spleen weight at 100 d.; 2 number of observations.3 Standard deviation.
Table 2.
Genetic parameters estimated from all data with the best linear unbiased prediction (BLUP) model.
Table 2.
Genetic parameters estimated from all data with the best linear unbiased prediction (BLUP) model.
| Trait 1 | σa 2 | σe 3 | h 4 | |||
|---|---|---|---|---|---|---|
| Component | Std. Error | Component | Std. Error | Estimate | Std. Error | |
| Ab-AIV | 0.662 | 0.261 | 1.764 | 0.245 | 0.273 | 0.101 |
| Ab-NDV | 0 | 0 | 1.593 | 0.115 | 0 | 0 |
| SRBC | 0.263 | 0.128 | 1.157 | 0.131 | 0.185 | 0.087 |
| H/L | 0.022 | 0.009 | 0.064 | 0.008 | 0.265 | 0.100 |
| IgG | 0.006 | 0 | 9409.678 | 617.111 | 0 | 0 |
| SII | 0.001 | 0 | 0.001 | 0 | 0.631 | 0.110 |
| TII | 0.009 | 0.003 | 0.022 | 0.003 | 0.281 | 0.098 |
| TW | 1.546 | 0.722 | 6.233 | 0.726 | 0.199 | 0.089 |
| SW | 0.223 | 0.052 | 0.166 | 0.038 | 0.573 | 0.109 |
1 Ab-AIV, antibody response to avian influenza virus; Ab-NDV, antibody response to Newcastle disease virus; SRBC, sheep red blood cell antibody titer; H/L, the ratio of heterophils to lymphocytes; IgG (ng/ml), immunoglobulin G; SII (%), spleen immune index; TII (%), thymus immune index; TW (g), thymus weight at 100 d; SW (g), spleen weight at 100 d. 2 the variance of additive genetic effects. 3 the variance of residuals. 4 heritability.
Table 3.
Genetic parameters estimated from all data with the genetic linear unbiased prediction of genomes (GBLUP) model.
Table 3.
Genetic parameters estimated from all data with the genetic linear unbiased prediction of genomes (GBLUP) model.
| Trait 1 | σg 2 | σe 3 | h 4 | |||
|---|---|---|---|---|---|---|
| Component | Std. Error | Component | Std. Error | Estimate | Std. Error | |
| Ab-AIV | 0.644 | 0.224 | 1.774 | 0.210 | 0.266 | 0.086 |
| Ab-NDV | 0 | 0 | 1.593 | 0.115 | 0 | 0 |
| SRBC | 0.082 | 0.087 | 1.337 | 0.116 | 0.058 | 0.061 |
| H/L | 0.011 | 0.006 | 0.075 | 0.007 | 0.128 | 0.065 |
| IgG | 0.003 | 0 | 9409.681 | 617.111 | 0 | 0 |
| SII | 0.001 | 0 | 0.001 | 0 | 0.472 | 0.083 |
| TII | 0.011 | 0.003 | 0.020 | 0.002 | 0.353 | 0.086 |
| TW | 2.332 | 0.701 | 5.434 | 0.619 | 0.300 | 0.082 |
| SW | 0.158 | 0.036 | 0.223 | 0.028 | 0.415 | 0.080 |
1 Ab-AIV, antibody response to avian influenza virus; Ab-NDV, antibody response to Newcastle disease virus; SRBC, sheep red blood cell antibody titer; H/L, the ratio of heterophils to lymphocytes; IgG (ng/ml), immunoglobulin G; SII (%), spleen immune index; TII (%), thymus immune index; TW (g), thymus weight at 100 d; SW (g), spleen weight at 100 d. 2 the variance of additive genetic effects. 3 the variance of residuals. 4 heritability.
Table 4.
The accuracy of prediction for sheep red blood cells (SRBC) and heterophils to lymphocytes (H/L) traits in 50 time 5-fold cross-validation (CV).
Table 4.
The accuracy of prediction for sheep red blood cells (SRBC) and heterophils to lymphocytes (H/L) traits in 50 time 5-fold cross-validation (CV).
| Trait 1 | SRBC | H/L | ||||
|---|---|---|---|---|---|---|
| Predictive Ability | Prediction Accuracy | Unbiasedness | Predictive Ability | Prediction Accuracy | Unbiasedness | |
| BLUP | 0.132 ± 0.0242 2 | 0.307 ± 0.056 | 1.000 ± 0.001 | 0.185 ± 0.030 | 0.326 ± 0.528 | 0.999 ± 0.006 |
| GBLUP | 0.052 ± 0.027 | 0.216 ± 0.112 | 1.000 ± 0.000 | 0.119 ± 0.025 | 0.333 ± 0.069 | 0.999 ± 0.004 |
| P-value 3 | 1.082 × 10 −28 | 1.082 × 10 −28 | 9.282 × 10 −01 | 2.309 × 10 −20 | 2.309 × 10 −20 | 9.164 × 10 −01 |
1 SRBC, sheep red blood cell antibody titer; H/L, the ratio of heterophils to lymphocytes; 2 mean ± SE; 3 Student’s t-test.
Table 5.
Mean and standard deviation of breeding values of various traits predicted from the two methods for birds with low or high SRBC.
Table 5.
Mean and standard deviation of breeding values of various traits predicted from the two methods for birds with low or high SRBC.
| Model | Group 1 | Ab-AIV 2 | SRBC | Ab-NDV | H/L | IgG | SII | TII | TW | SW |
|---|---|---|---|---|---|---|---|---|---|---|
| BLUP | SRBCeff | 9.240 ± 1.964 | 9.567 ± 0.504 | 5.500 ± 1.303 | 0.446 ± 0.358 | 651.166 ± 330.626 | 0.140 ± 0.036 | 0.438 ± 0.152 | 6.541 ± 2.554 | 2.054 ± 0.585 |
| GBLUP | SRBCeff | 9.346 ± 1.788 | 9.300 ± 0.651 | 5.500 ± 1.251 | 0.442 ± 0.358 | 545.036 ± 252.567 | 0.141 ± 0.029 | 0.450 ± 0.163 | 6.794 ± 0.714 | 2.103 ± 0.517 |
| p-value 3 | 0.841 | 0.081 | 1.000 | 0.968 | 0.191 | 0.898 | 0.780 | 0.714 | 0.734 | |
| BLUP | SRBCineff | 9.708 ± 1.301 | 5.533 ± 0.860 | 5.818 ± 1.468 | 0.611 ± 0.352 | 558.716 ± 296.872 | 0.151 ± 0.049 | 0.440 ± 0.117 | 6.757 ± 2.012 | 2.297 ± 0.793 |
| GBLUP | SRBCineff | 9.870 ± 1.180 | 5.933 ± 1.048 | 5.789 ± 1.548 | 0.512 ± 0.240 | 591.997 ± 282.724 | 0.146 ± 0.047 | 0.466 ± 0.141 | 7.078 ± 2.287 | 2.201 ± 0.780 |
| p-value | 0.659 | 0.112 | 0.952 | 0.208 | 0.693 | 0.678 | 0.440 | 0.573 | 0.639 |
1 SRBCeff, the top 30 chickens with efficient values and high anti-SRBC antibody titer; SRBCineff, the bottom 30 chickens with inefficient values and low anti-SRBC antibody titer; 2 Ab-AIV, antibody response to avian influenza virus; SRBC, sheep red blood cell antibody titer; Ab-NDV, antibody response to Newcastle disease virus; H/L, the ratio of heterophils to lymphocytes; IgG, immunoglobulin G (ng/ml); SII (%), spleen immune index; TII (%), thymus immune index; TW (g), thymus weight at 100 d; SW (g), spleen weight at 100 d; 3 Student’s t-test.
Table 6.
Mean and standard deviation of breeding values of various traits predicted from the two methods for birds with low or high H/L.
Table 6.
Mean and standard deviation of breeding values of various traits predicted from the two methods for birds with low or high H/L.
| Model | Group 1 | Ab-AIV 2 | SRBC | Ab-NDV | H/L | IgG | SII | TII | TW | SW |
|---|---|---|---|---|---|---|---|---|---|---|
| BLUP | H/Leff | 9.393 ± 1.792 | 7.600 ± 1.102 | 5.304 ± 1.185 | 0.134 ± 0.062 | 537.249 ± 207.421 | 0.145 ± 0.037 | 0.528 ± 0.142 | 7.614 ± 2.077 | 2.114 ± 0.582 |
| GBLUP | H/Leff | 9.500 ± 1.679 | 7.733 ± 1.112 | 5.455 ± 1.101 | 0.153 ± 0.075 | 544.312 ± 226.187 | 0.137 ± 0.036 | 0.480 ± 0.181 | 6.904 ± 2.701 | 1.967 ± 0.618 |
| p-value 3 | 0.822 | 0.643 | 0.662 | 0.296 | 0.905 | 0.408 | 0.266 | 0.264 | 0.347 | |
| BLUP | H/Lineff | 9.818 ± 1.220 | 7.567 ± 1.194 | 5.750 ± 1.446 | 1.100 ± 0.340 | 585.091 ± 181.843 | 0.165 ± 0.046 | 0.479 ± 0.172 | 7.595 ± 2.954 | 2.616 ± 0.797 |
| GBLUP | H/Lineff | 9.348 ± 1.613 | 7.367 ± 1.129 | 5.286 ± 1.309 | 0.949 ± 0.393 | 580.645 ± 238.276 | 0.167 ± 0.046 | 0.473 ± 0.195 | 7.518 ± 3.564 | 2.634 ± 0.856 |
| p-value | 0.278 | 0.508 | 0.287 | 0.115 | 0.942 | 0.873 | 0.903 | 0.928 | 0.932 |
1 H/Leff, the top 30 chickens with efficient values and low ratio of heterophils to lymphocytes; H/Lineff, the bottom 30 chickens with inefficient values and low ratio of heterophils to lymphocytes; 2 Ab-AIV, antibody response to avian influenza virus; SRBC, sheep red blood cell antibody titer; Ab-NDV, antibody response to Newcastle disease virus; H/L, the ratio of heterophils to lymphocytes; IgG, immunoglobulin G (ng/ml); SII (%), spleen immune index; TII (%), thymus immune index; TW (g), thymus weight at 100 d; SW (g), spleen weight at 100 d; 3 Student’s t-test.
© 2020 by the authors. Licensee MDPI, Basel, Switzerland. This article is an open access article distributed under the terms and conditions of the Creative Commons Attribution (CC BY) license (http://creativecommons.org/licenses/by/4.0/).
Share and Cite
MDPI and ACS Style
Zhang, J.; Wang, J.; Li, Q.; Wang, Q.; Wen, J.; Zhao, G. Comparison of the Efficiency of BLUP and GBLUP in Genomic Prediction of Immune Traits in Chickens. Animals 2020, 10, 419. https://doi.org/10.3390/ani10030419
AMA Style
Zhang J, Wang J, Li Q, Wang Q, Wen J, Zhao G. Comparison of the Efficiency of BLUP and GBLUP in Genomic Prediction of Immune Traits in Chickens. Animals. 2020; 10(3):419. https://doi.org/10.3390/ani10030419
Chicago/Turabian StyleZhang, Jin, Jie Wang, Qinghe Li, Qiao Wang, Jie Wen, and Guiping Zhao. 2020. "Comparison of the Efficiency of BLUP and GBLUP in Genomic Prediction of Immune Traits in Chickens" Animals 10, no. 3: 419. https://doi.org/10.3390/ani10030419
Note that from the first issue of 2016, this journal uses article numbers instead of page numbers. See further details here.