Figure 1.
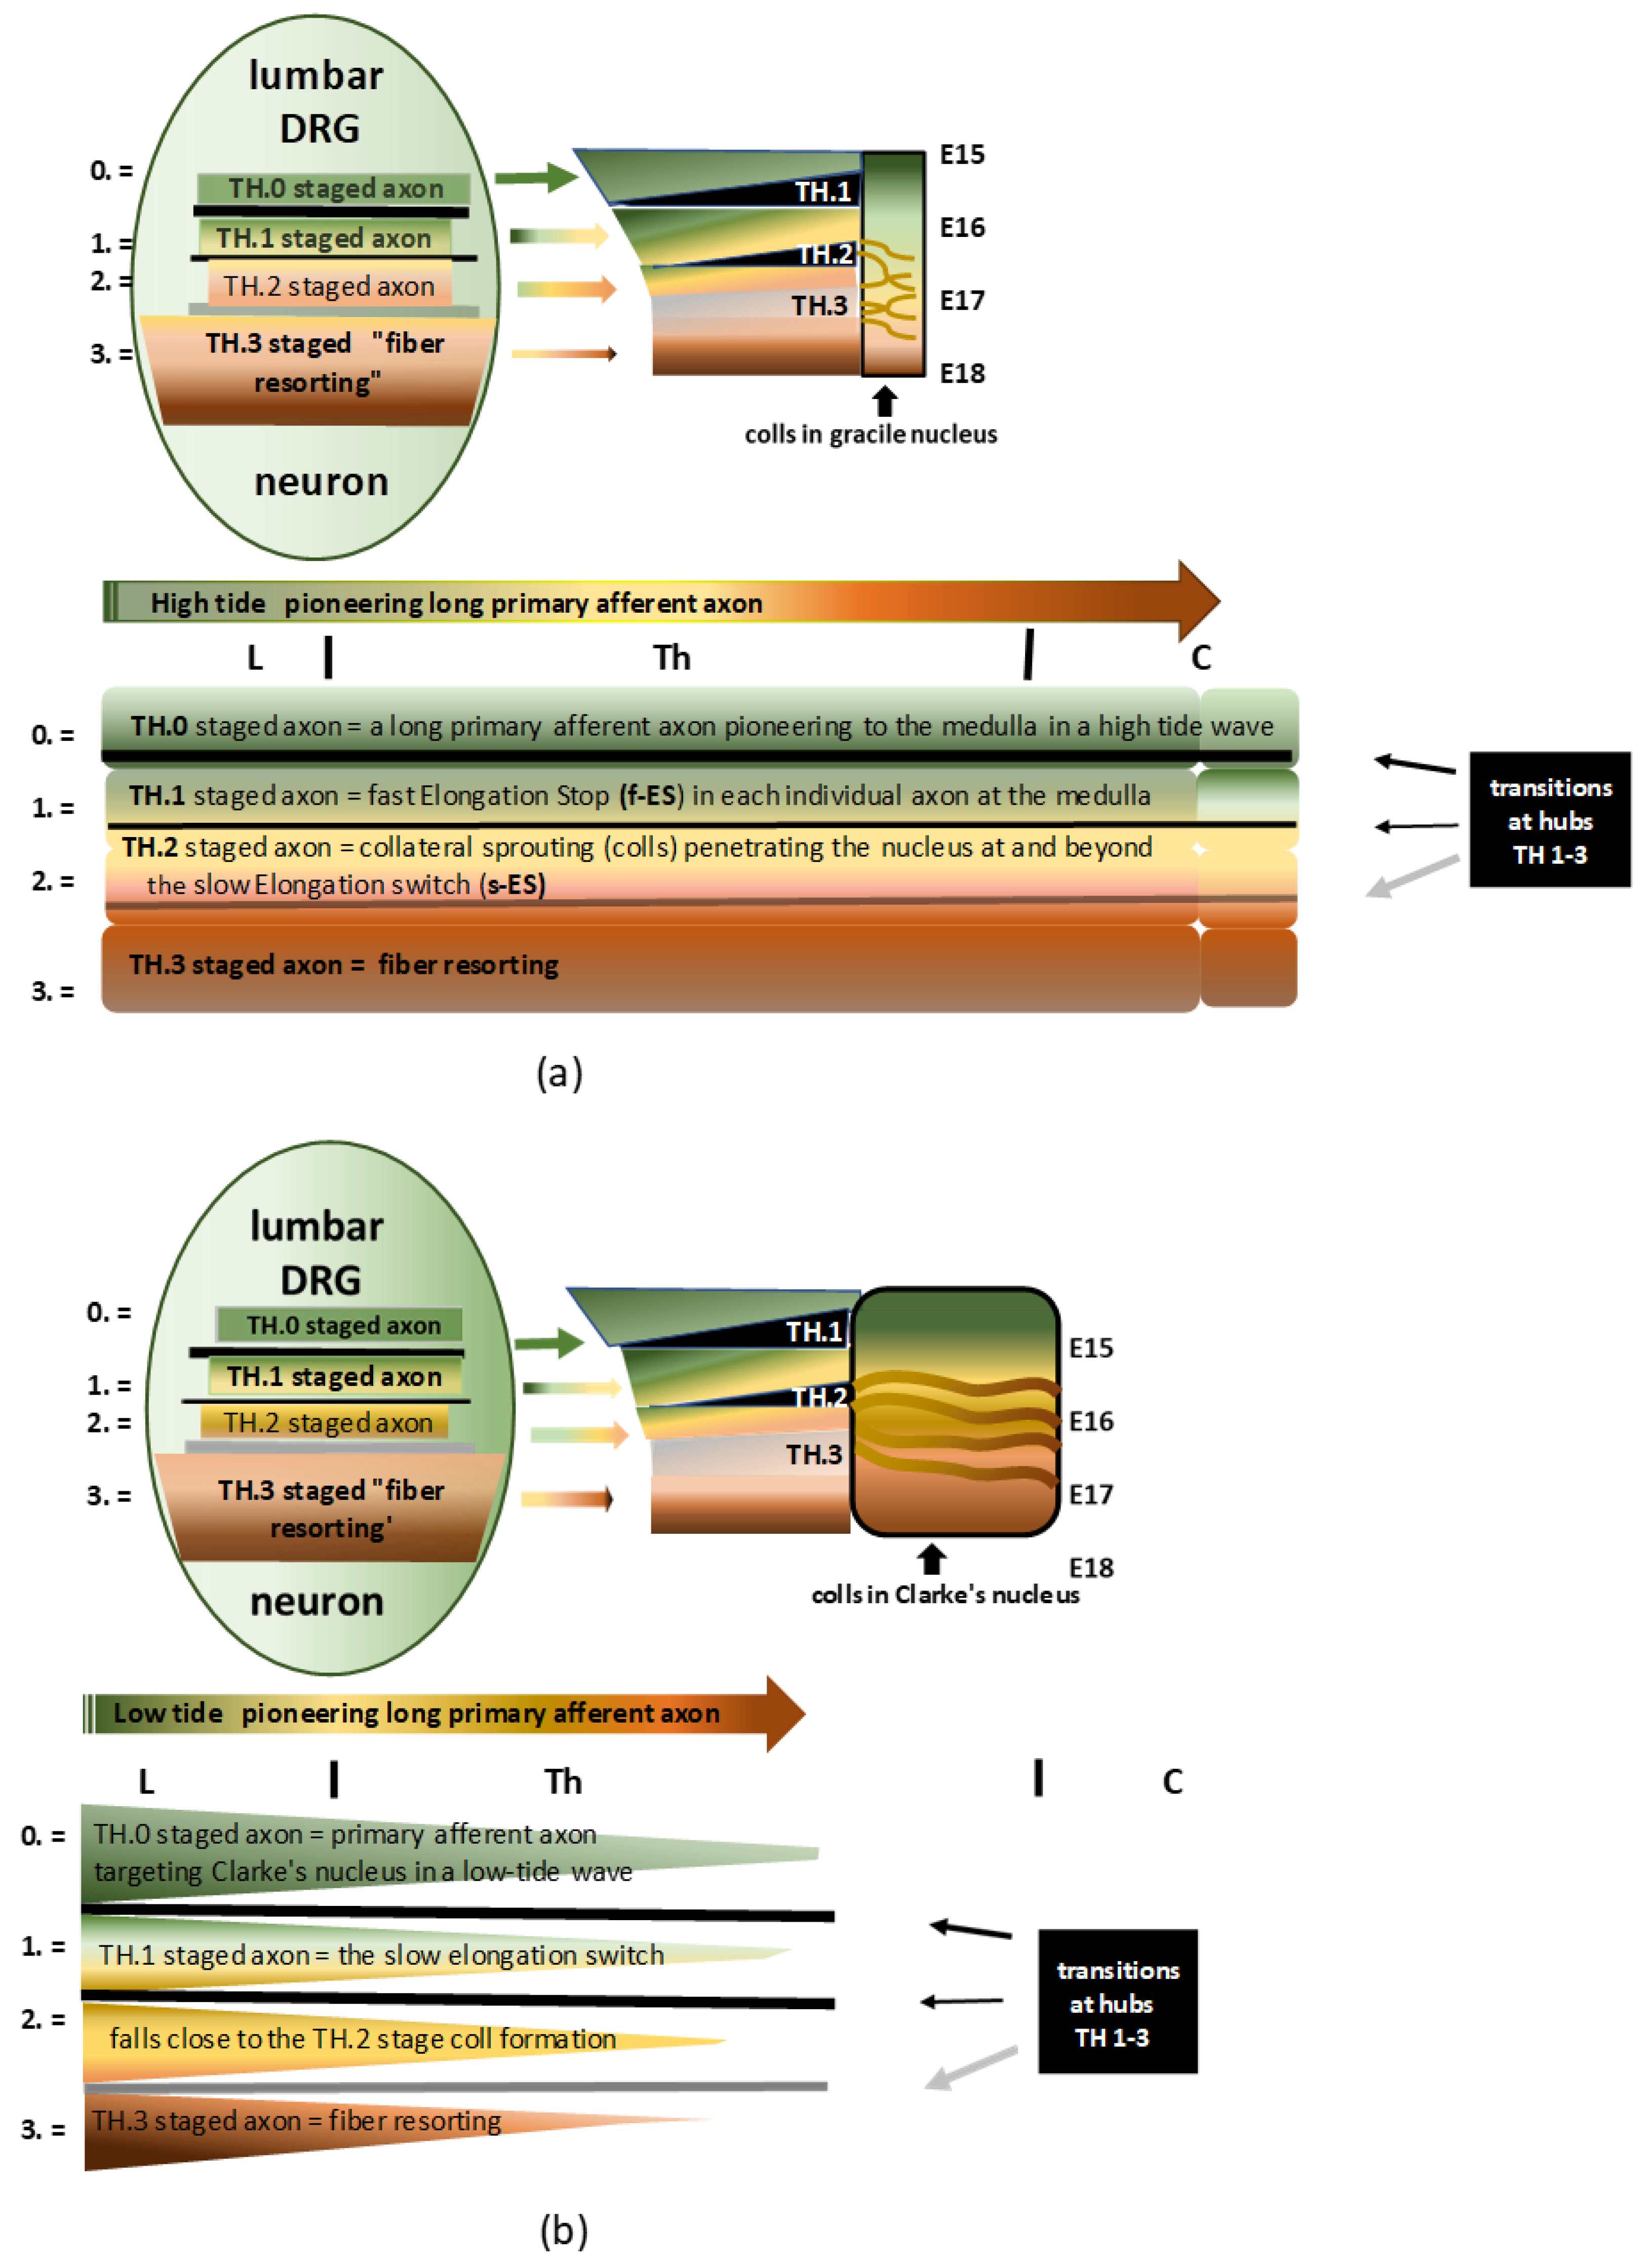
(a) Infographic of the DRG neuron’s development governing the central branch’s long primary afferent pioneering axon and maturation in a high-tide wave to the gracile nucleus. The four consecutive stages on the assembly line are colored green, yellow, light brown, and dark brown, denoted by 0, 1, 2, and 3, respectively. The pioneering axon is colored green; beyond the f-ES, the axon is colored yellow; the s-ES turns the axon light brown and entails the TH.2 stage of colls; next, the axon is colored darker brown, figuring the fiber resorting process. The modesty of the black and grey bars masks the complexity of the hypothetical in-between transition hub (TH) network. The stations on the assembly line build the developmental cascade of the long primary afferent system. See the text for descriptive details. (b) Infographic of the DRG neuron’s development governing the central branch’s long primary afferent pioneering axon and maturation in a low-tide wave to Clarke’s nucleus. The four consecutive stages on the assembly line are colored green, ocher, light brown, and dark brown, denoted by 0, 1, 2, and 3, respectively. The color ocher indicates the axon terminates less far rostral. The slow elongation switch might fall close to the initiation of collateral formation.
Figure 1.
(a) Infographic of the DRG neuron’s development governing the central branch’s long primary afferent pioneering axon and maturation in a high-tide wave to the gracile nucleus. The four consecutive stages on the assembly line are colored green, yellow, light brown, and dark brown, denoted by 0, 1, 2, and 3, respectively. The pioneering axon is colored green; beyond the f-ES, the axon is colored yellow; the s-ES turns the axon light brown and entails the TH.2 stage of colls; next, the axon is colored darker brown, figuring the fiber resorting process. The modesty of the black and grey bars masks the complexity of the hypothetical in-between transition hub (TH) network. The stations on the assembly line build the developmental cascade of the long primary afferent system. See the text for descriptive details. (b) Infographic of the DRG neuron’s development governing the central branch’s long primary afferent pioneering axon and maturation in a low-tide wave to Clarke’s nucleus. The four consecutive stages on the assembly line are colored green, ocher, light brown, and dark brown, denoted by 0, 1, 2, and 3, respectively. The color ocher indicates the axon terminates less far rostral. The slow elongation switch might fall close to the initiation of collateral formation.
![Anatomia 02 00032 g001]()
Figure 2.
(
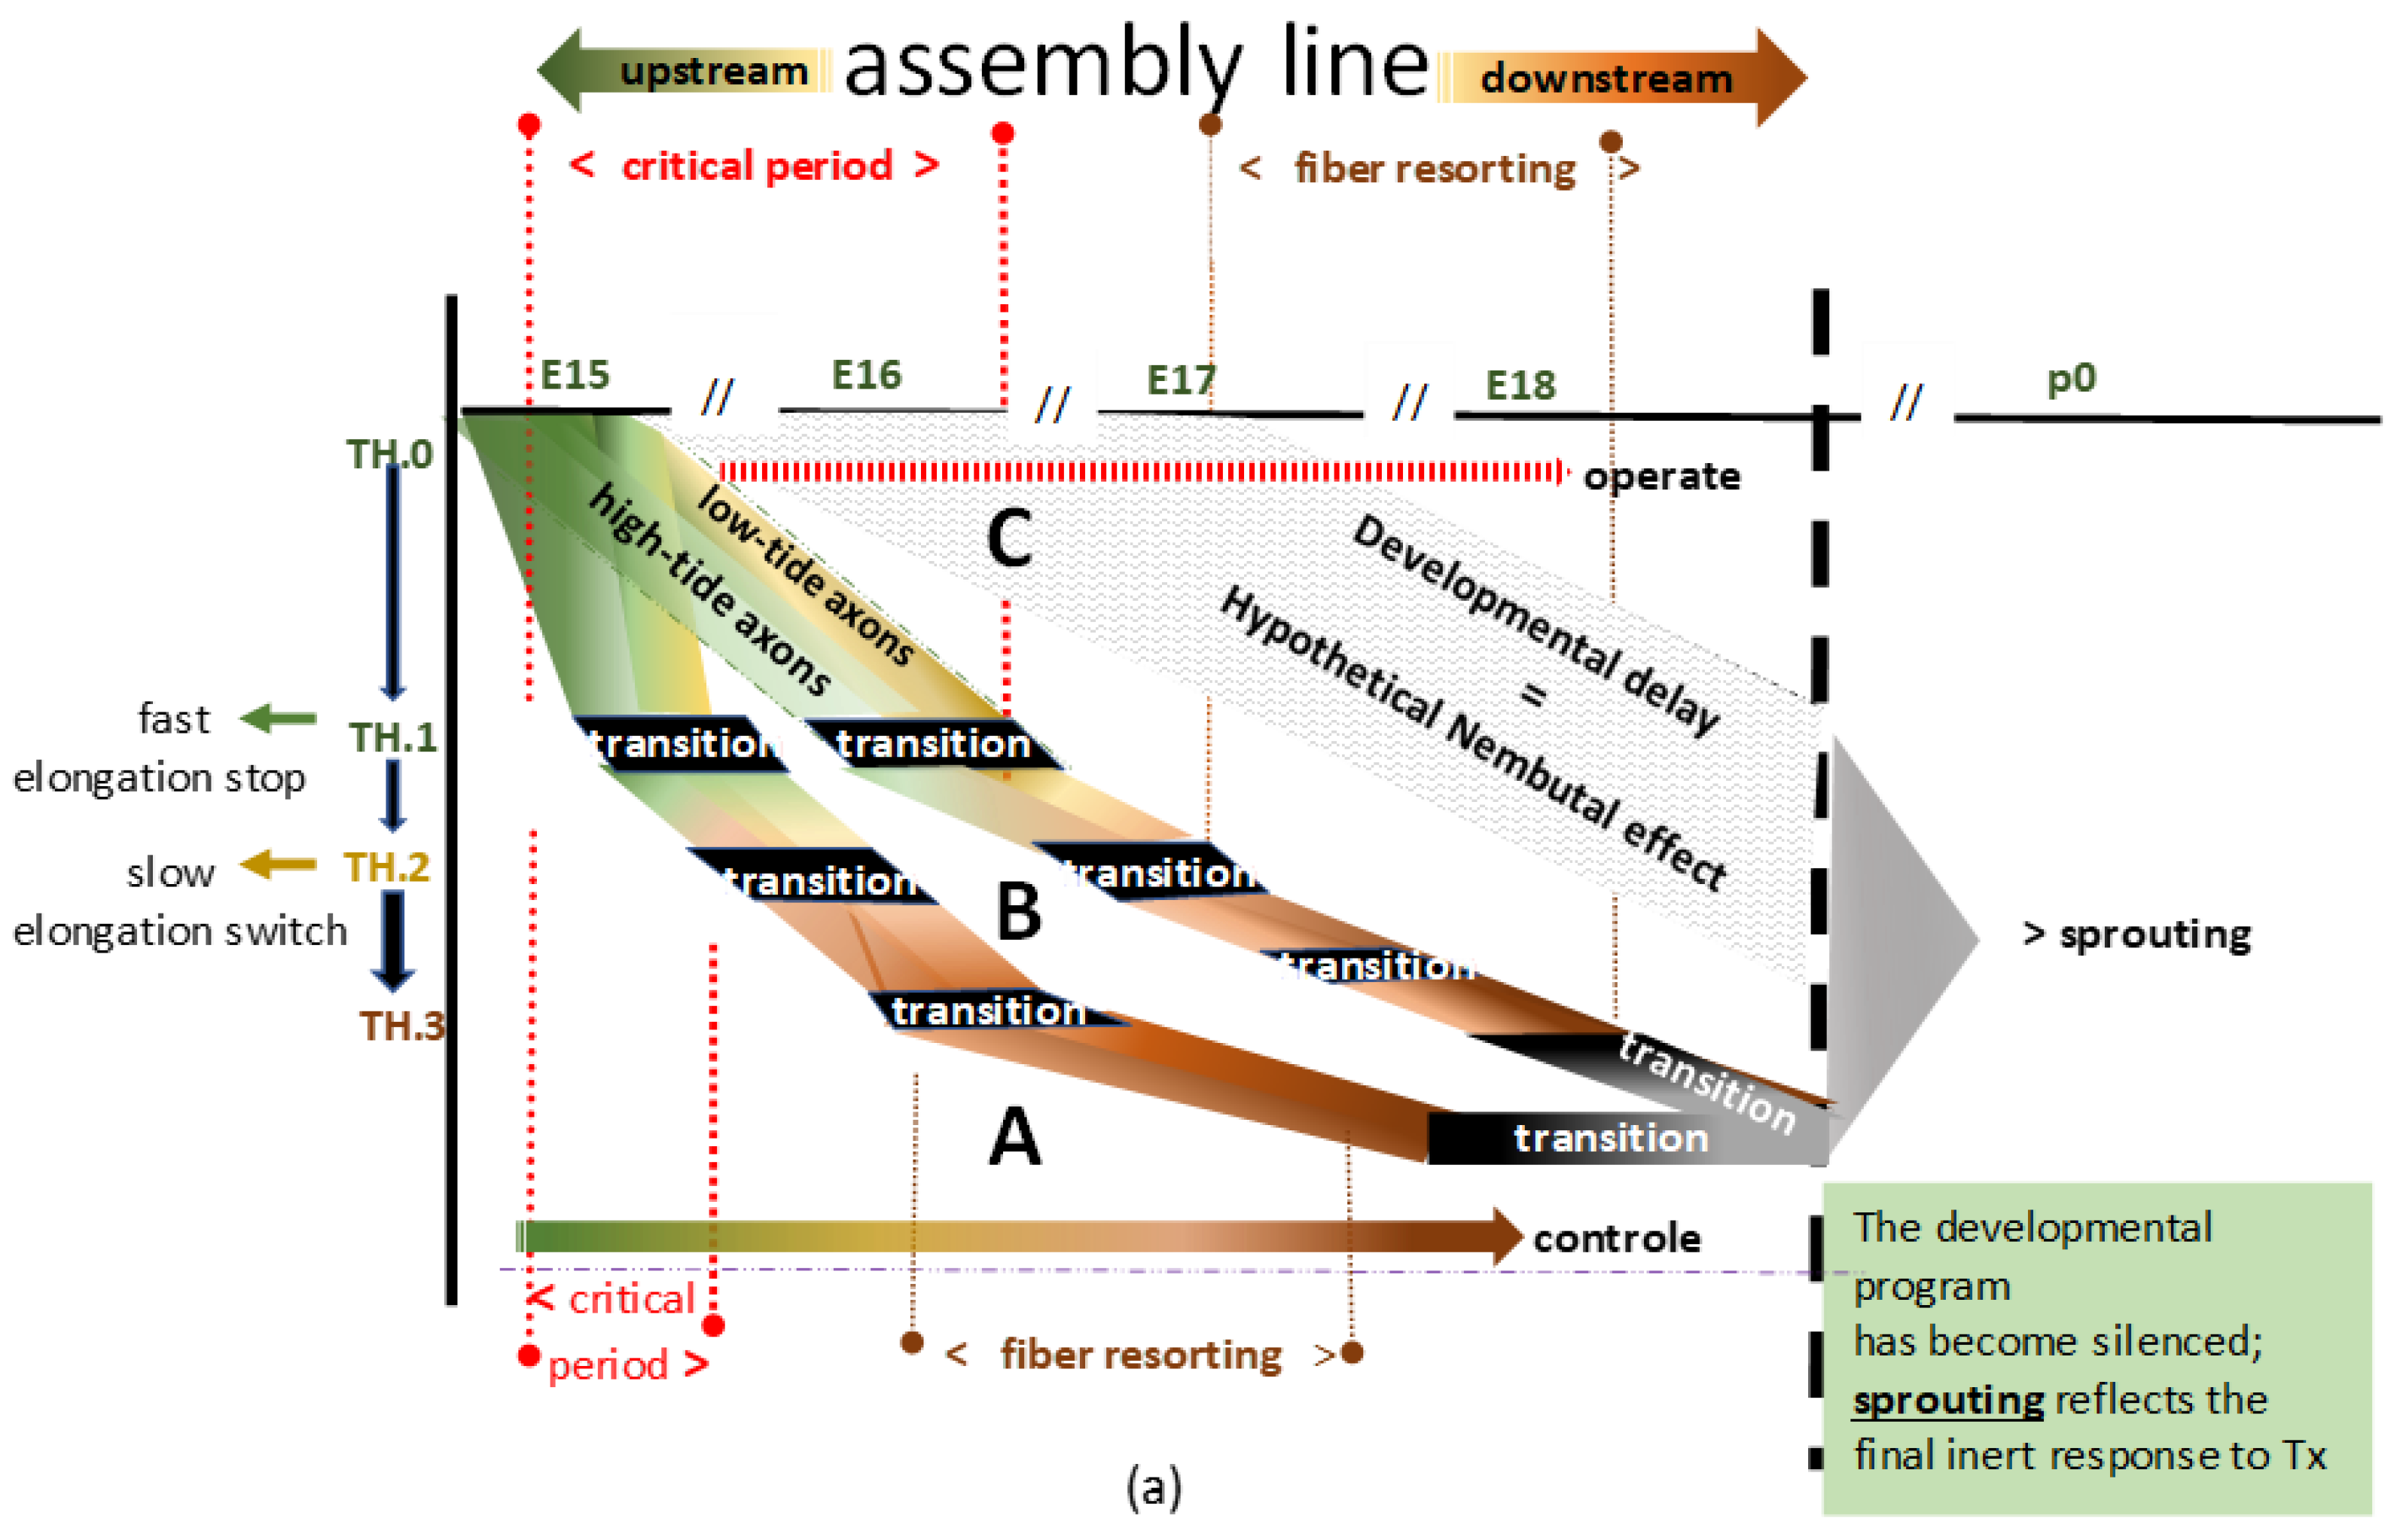
a) Two flowcharts (A and B) depict a blueprint of the TH-stationed assembly lines, imaginable for the long primary afferent system at high- and low-tide development. The black boxes represent the conceptual assembly line’s transition hubs (THs). For convenience’s sake, ‘transition’ denotes the intricate transitioning into the subsequent unknown phenotype at TH.1, TH.2, and TH.3. The downstream grey box represents the final stage. The inclination of developmental speed might vary, as demonstrated by the two hypothetical examples, A and B, and the dashed area C. The variation might depend on the extent of hyposaturation determined by hypoxia, of which the depth and the length of time are unknown parameters. A shows development under natural conditions and B shows delay due to the paradigm. In C, the gray area delineates a tentative interpretation of the excessive delay due to barbiturate anesthesia. The high- and low-tide pioneering axons are green. The colors turn brown and dark brown when all TH.2- and TH.3-staged axons commence to demonstrate the downstream fiber resorting process. The A and B positions might reverse, depending on whether the paradigm’s impact causes retardation or acceleration (see
Section 4.2.4). (
b) The graphics on the left side show a series of schematic stills depicting five developmental stages down the cascade of the long primary afferent system’s assembly line (see
Figure 2b(1–5)). The colors reflect the current dominating stages of developed axons (see the legend in
Figure 1 for more details). On the right side, the line graphics show axons from individual neurons at DRG L4-L6, represented as pars pro toto. The critical period delineates the upstream period of axon elongation at spring tide (green line). Beyond this, all of the long primary afferent axons have reached their targets and continue developing down the cascade. The graphic at the bottom (see
Figure 2b(6)) shows the final stage of the two subdivisions of the long primary afferent system originating from separate neurons in three lumbar DRGs. The pioneering TH.0-staged axons target the gracile nuclei in high-tide waves at spring tide. Next, successive TH.0-staged axons in low-tide waves target Clarke’s nucleus at neap tide. The color variations reflect the stages in which the axons have transitioned thus far.
Figure 2.
(
a) Two flowcharts (A and B) depict a blueprint of the TH-stationed assembly lines, imaginable for the long primary afferent system at high- and low-tide development. The black boxes represent the conceptual assembly line’s transition hubs (THs). For convenience’s sake, ‘transition’ denotes the intricate transitioning into the subsequent unknown phenotype at TH.1, TH.2, and TH.3. The downstream grey box represents the final stage. The inclination of developmental speed might vary, as demonstrated by the two hypothetical examples, A and B, and the dashed area C. The variation might depend on the extent of hyposaturation determined by hypoxia, of which the depth and the length of time are unknown parameters. A shows development under natural conditions and B shows delay due to the paradigm. In C, the gray area delineates a tentative interpretation of the excessive delay due to barbiturate anesthesia. The high- and low-tide pioneering axons are green. The colors turn brown and dark brown when all TH.2- and TH.3-staged axons commence to demonstrate the downstream fiber resorting process. The A and B positions might reverse, depending on whether the paradigm’s impact causes retardation or acceleration (see
Section 4.2.4). (
b) The graphics on the left side show a series of schematic stills depicting five developmental stages down the cascade of the long primary afferent system’s assembly line (see
Figure 2b(1–5)). The colors reflect the current dominating stages of developed axons (see the legend in
Figure 1 for more details). On the right side, the line graphics show axons from individual neurons at DRG L4-L6, represented as pars pro toto. The critical period delineates the upstream period of axon elongation at spring tide (green line). Beyond this, all of the long primary afferent axons have reached their targets and continue developing down the cascade. The graphic at the bottom (see
Figure 2b(6)) shows the final stage of the two subdivisions of the long primary afferent system originating from separate neurons in three lumbar DRGs. The pioneering TH.0-staged axons target the gracile nuclei in high-tide waves at spring tide. Next, successive TH.0-staged axons in low-tide waves target Clarke’s nucleus at neap tide. The color variations reflect the stages in which the axons have transitioned thus far.
![Anatomia 02 00032 g002a]()
![Anatomia 02 00032 g002b]()
Figure 3.
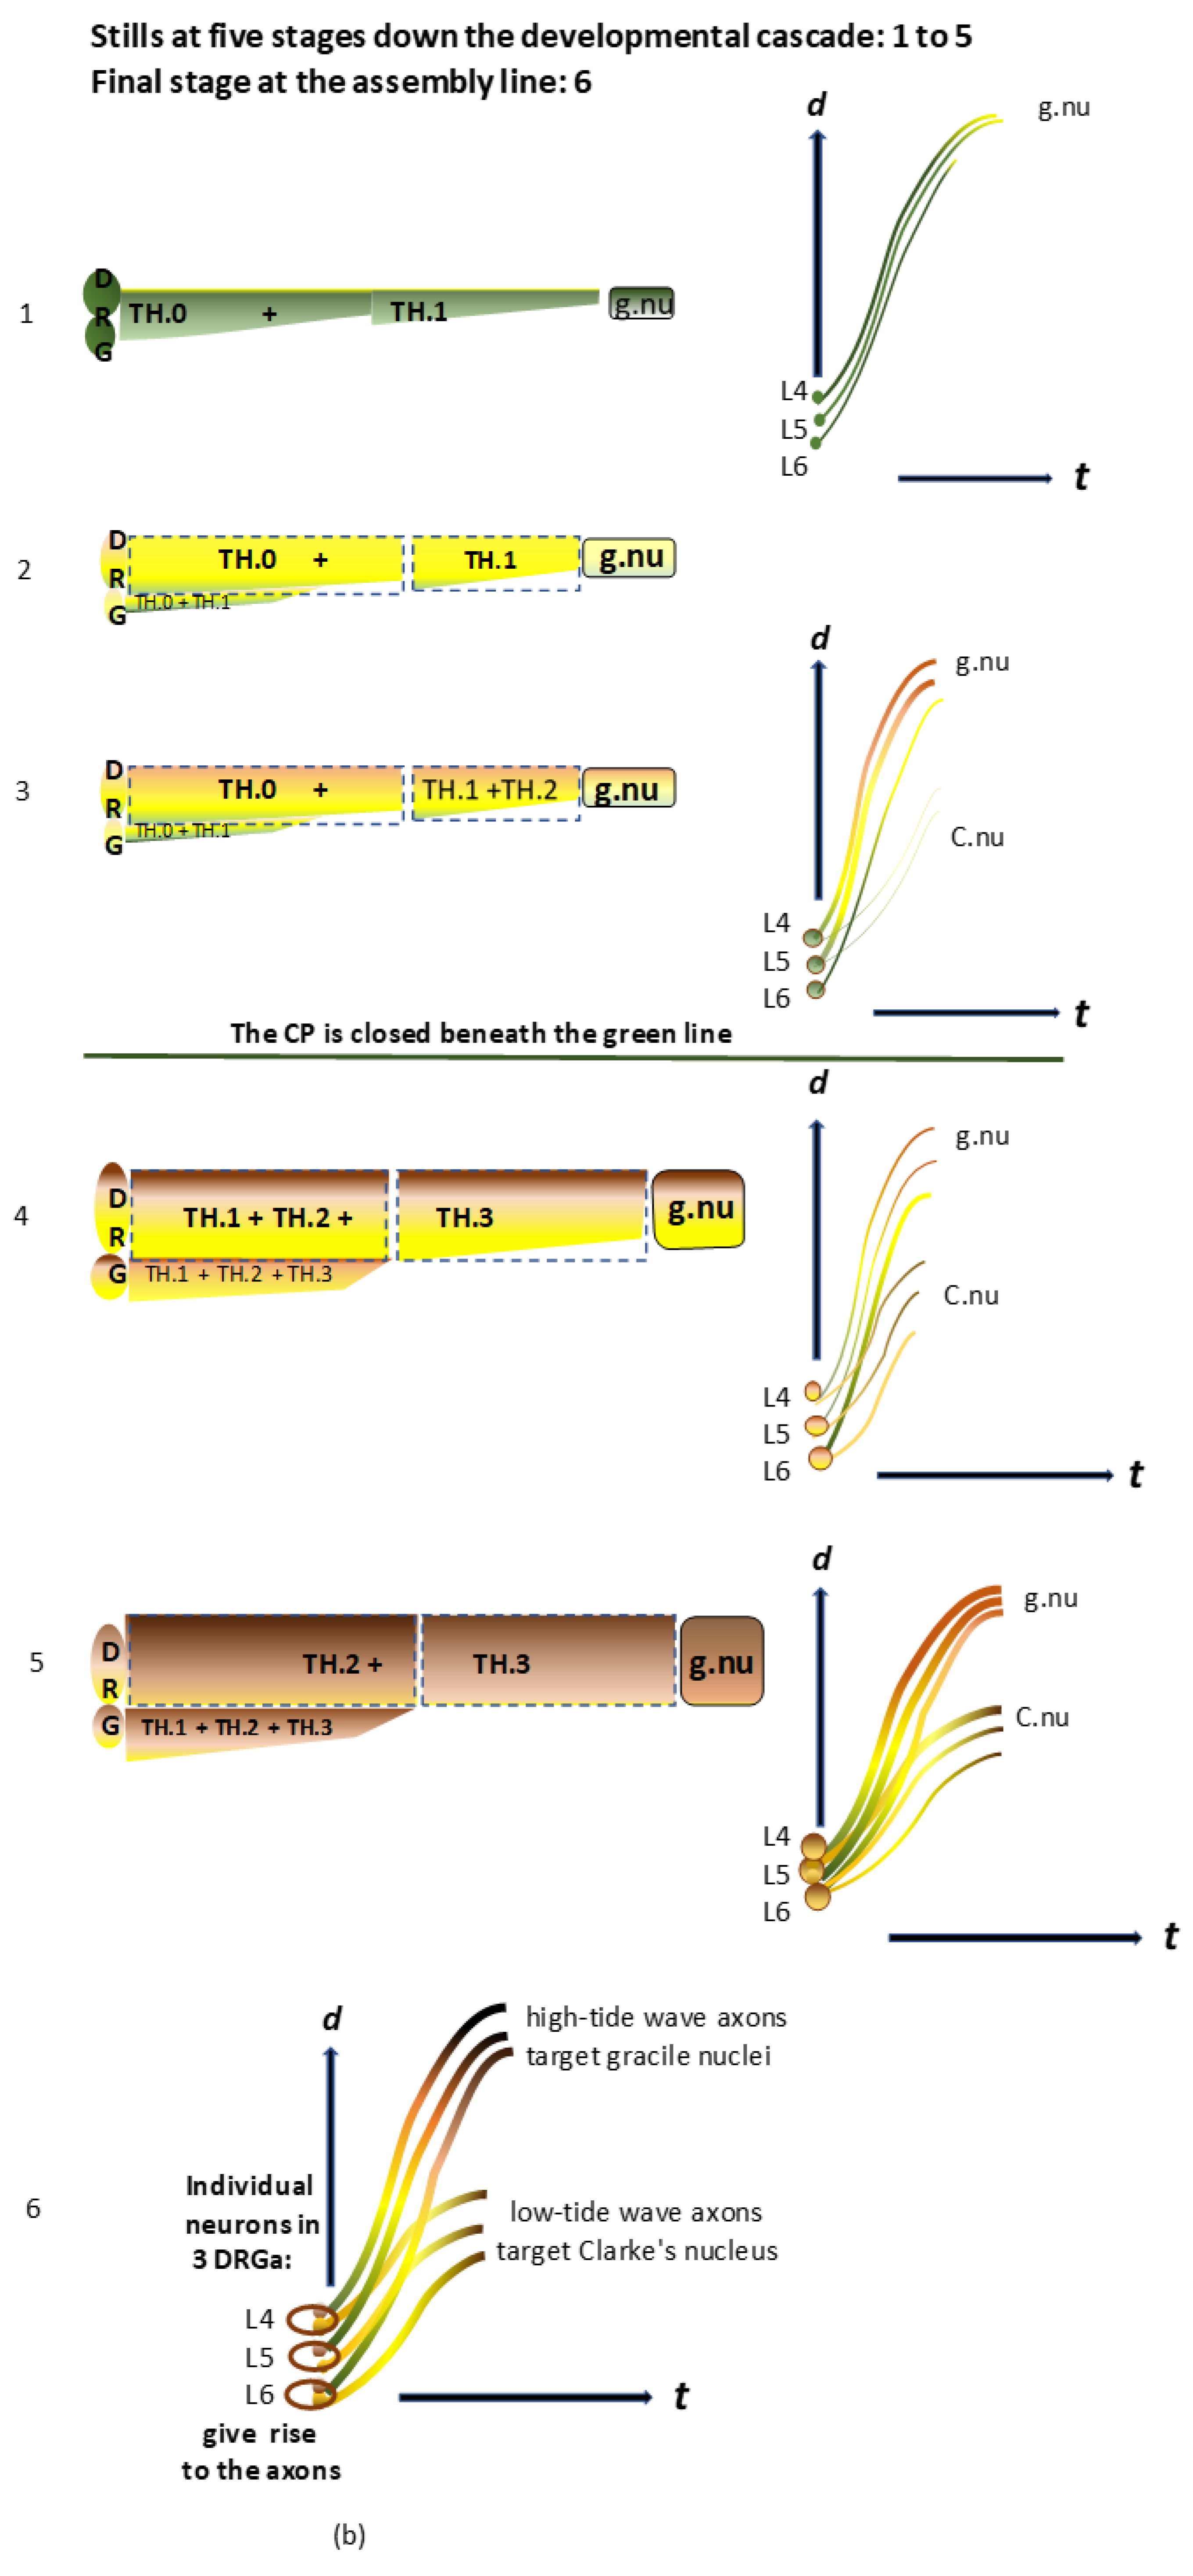
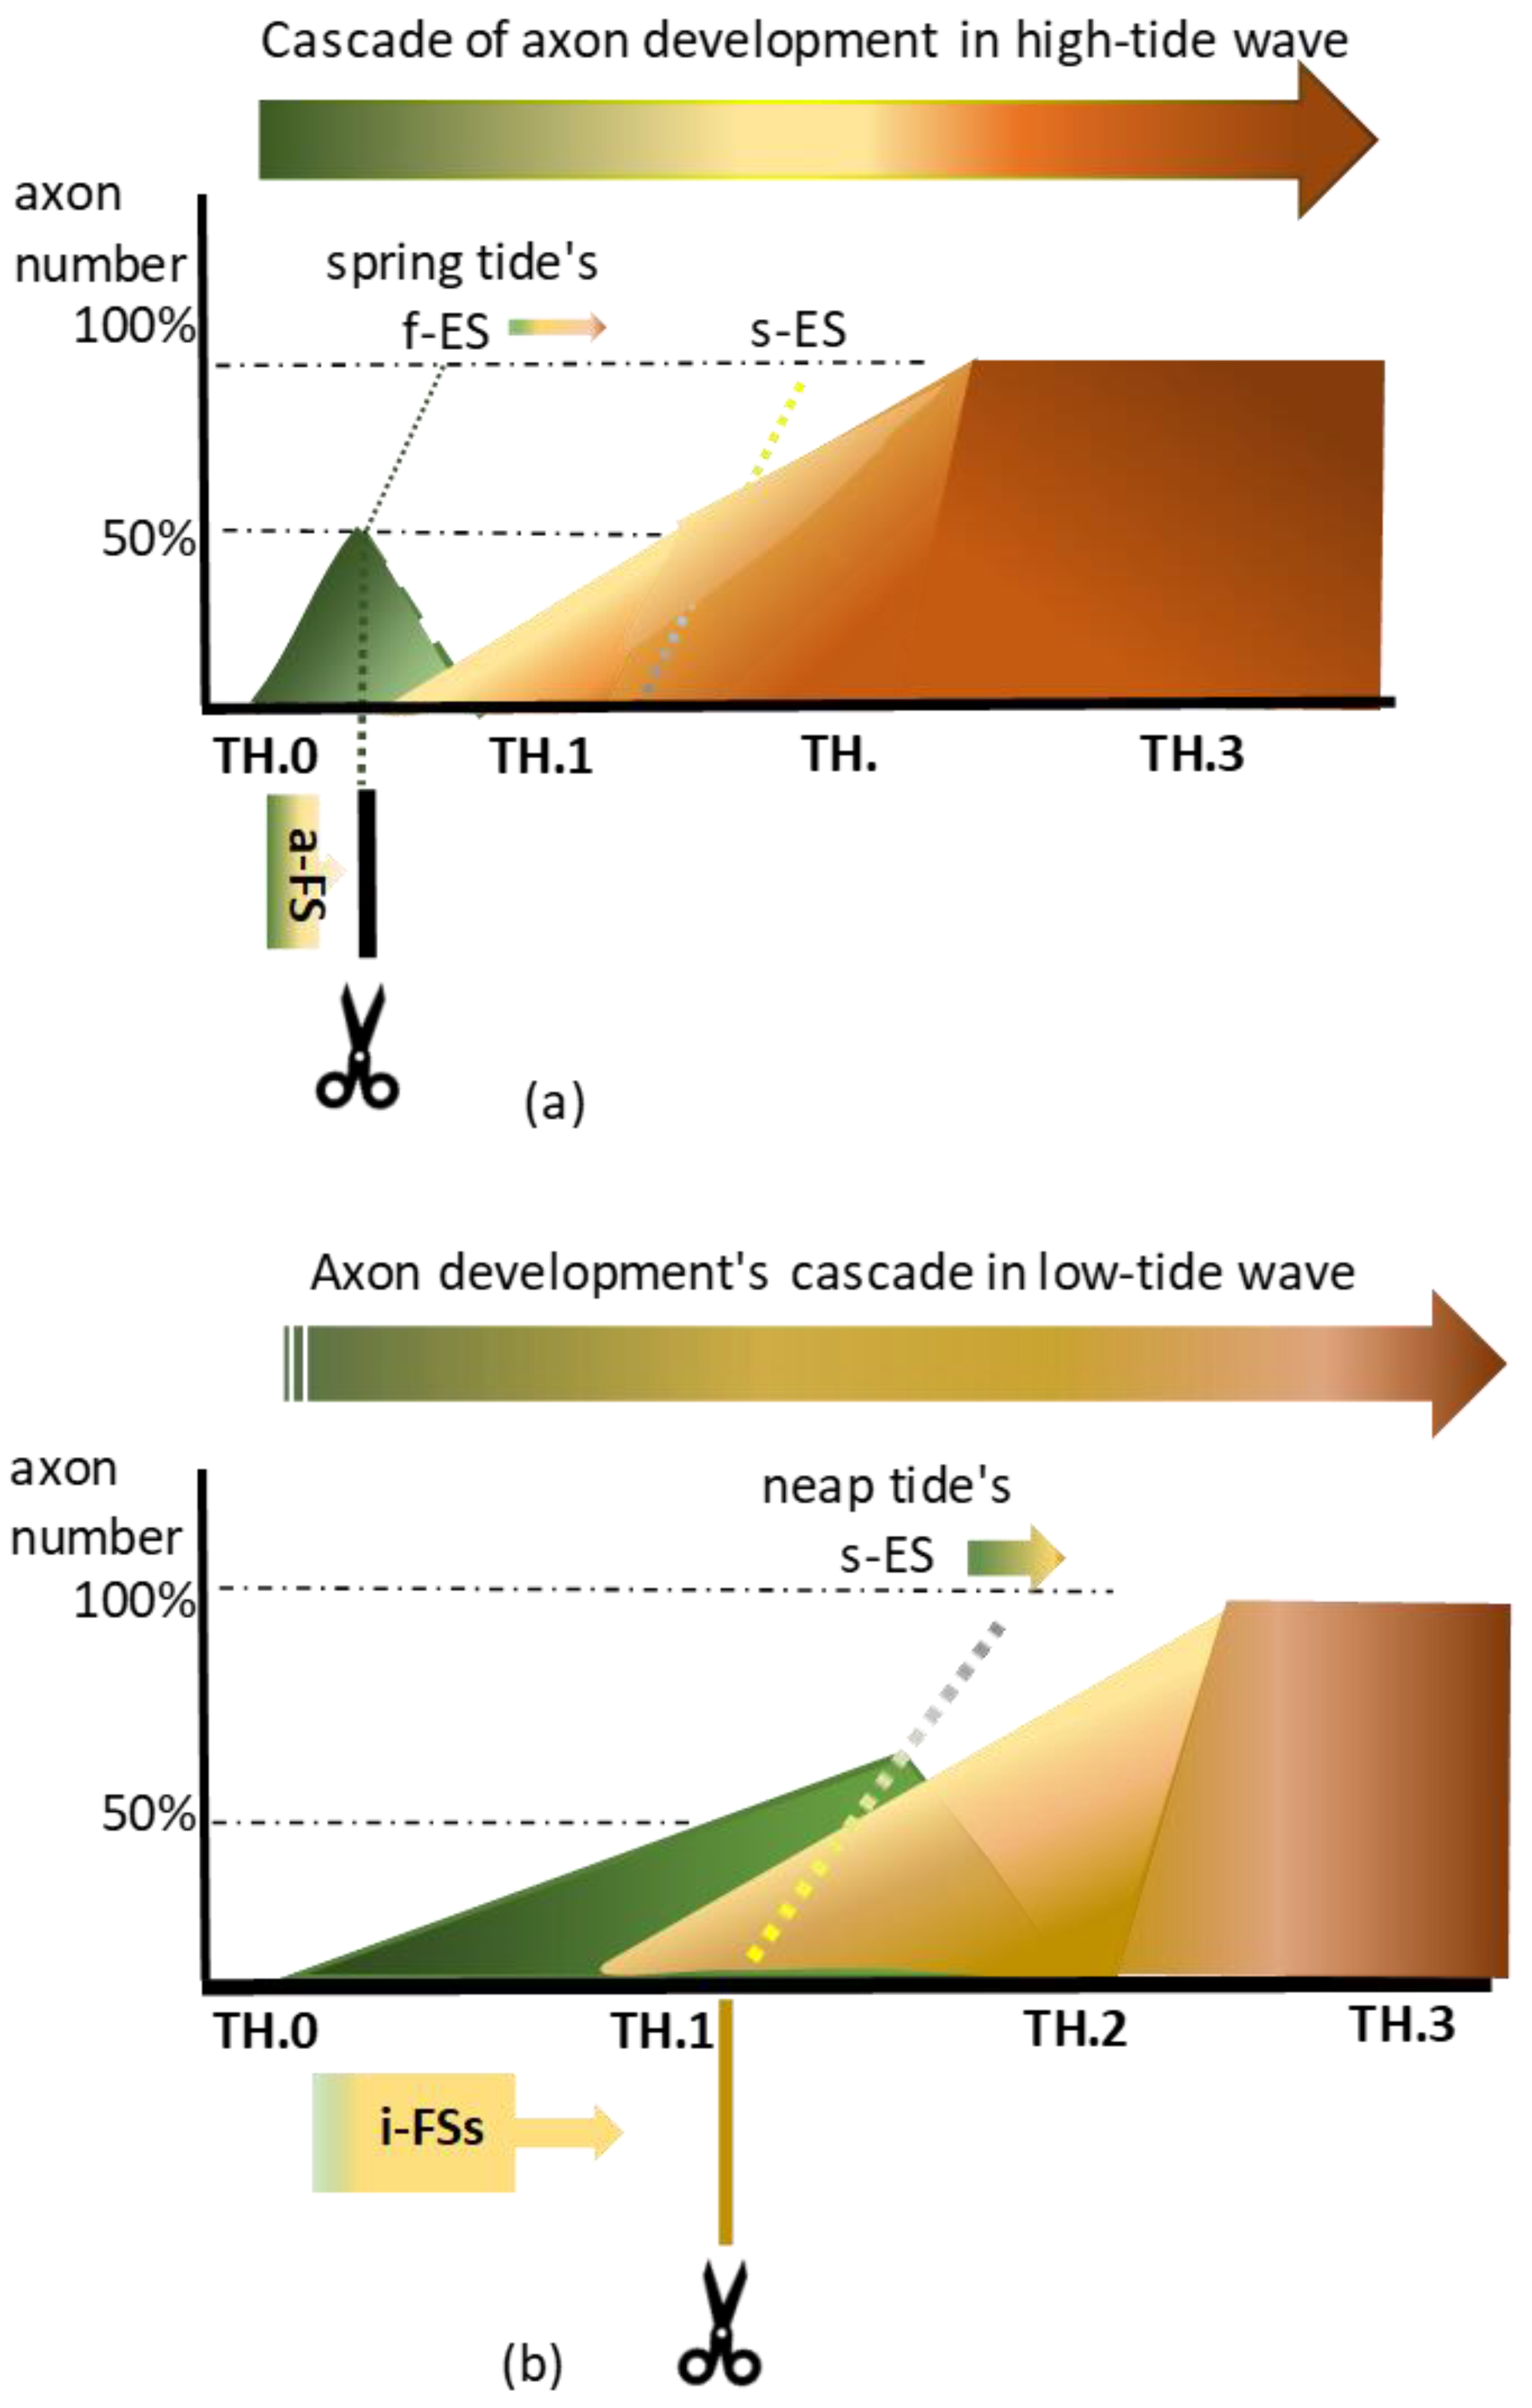
(a): Rostral Txs of the fast-developing high-tide waves might yield less than 50% of axons cut while targeting the gracile nuclei. At spring tide, the hypothetical fast elongation stop (f-ES) might have accounted for the swiftness of the process, which shortens the timelapse of the pioneering high-tide axons arriving at the medulla. The upstream abrupt front stop (a-FS) rendered by a Tx at a rostral level mimicked this hypothetical phenomenon. At upstream M0, a Tx might have yielded less than 50% of cut pioneering axons when the TH.0 stage took a short time. After cutting, the a-FS abutted the caudal margin of the lesion site. The tracer, visible up to the fiber tip, underpinned the axon repair, favoring the axon’s vitality. (b): Caudal Txs of low-tide axons caused numerous i-FSs, which may reflect a slow elongation tempo facing the s-ES. At neap tide, the chance of cutting more TH.0 staged axons may be greater than at spring tide. The cut low-tide axons created features of multilevel individual front stops (i-FSs). They mimicked the hypothetical slow elongation switch (s-ES) phenomenon at the medulla. After that, all pioneering axons might have begun accommodating their elongation speed to the slow spinal cord’s growth before forming collaterals into gracile and Clarke’s nuclei. At this slower process, a caudal Tx might have yielded over 50% of long primary afferent axons from both subdivisions.
Figure 3.
(a): Rostral Txs of the fast-developing high-tide waves might yield less than 50% of axons cut while targeting the gracile nuclei. At spring tide, the hypothetical fast elongation stop (f-ES) might have accounted for the swiftness of the process, which shortens the timelapse of the pioneering high-tide axons arriving at the medulla. The upstream abrupt front stop (a-FS) rendered by a Tx at a rostral level mimicked this hypothetical phenomenon. At upstream M0, a Tx might have yielded less than 50% of cut pioneering axons when the TH.0 stage took a short time. After cutting, the a-FS abutted the caudal margin of the lesion site. The tracer, visible up to the fiber tip, underpinned the axon repair, favoring the axon’s vitality. (b): Caudal Txs of low-tide axons caused numerous i-FSs, which may reflect a slow elongation tempo facing the s-ES. At neap tide, the chance of cutting more TH.0 staged axons may be greater than at spring tide. The cut low-tide axons created features of multilevel individual front stops (i-FSs). They mimicked the hypothetical slow elongation switch (s-ES) phenomenon at the medulla. After that, all pioneering axons might have begun accommodating their elongation speed to the slow spinal cord’s growth before forming collaterals into gracile and Clarke’s nuclei. At this slower process, a caudal Tx might have yielded over 50% of long primary afferent axons from both subdivisions.
![Anatomia 02 00032 g003]()
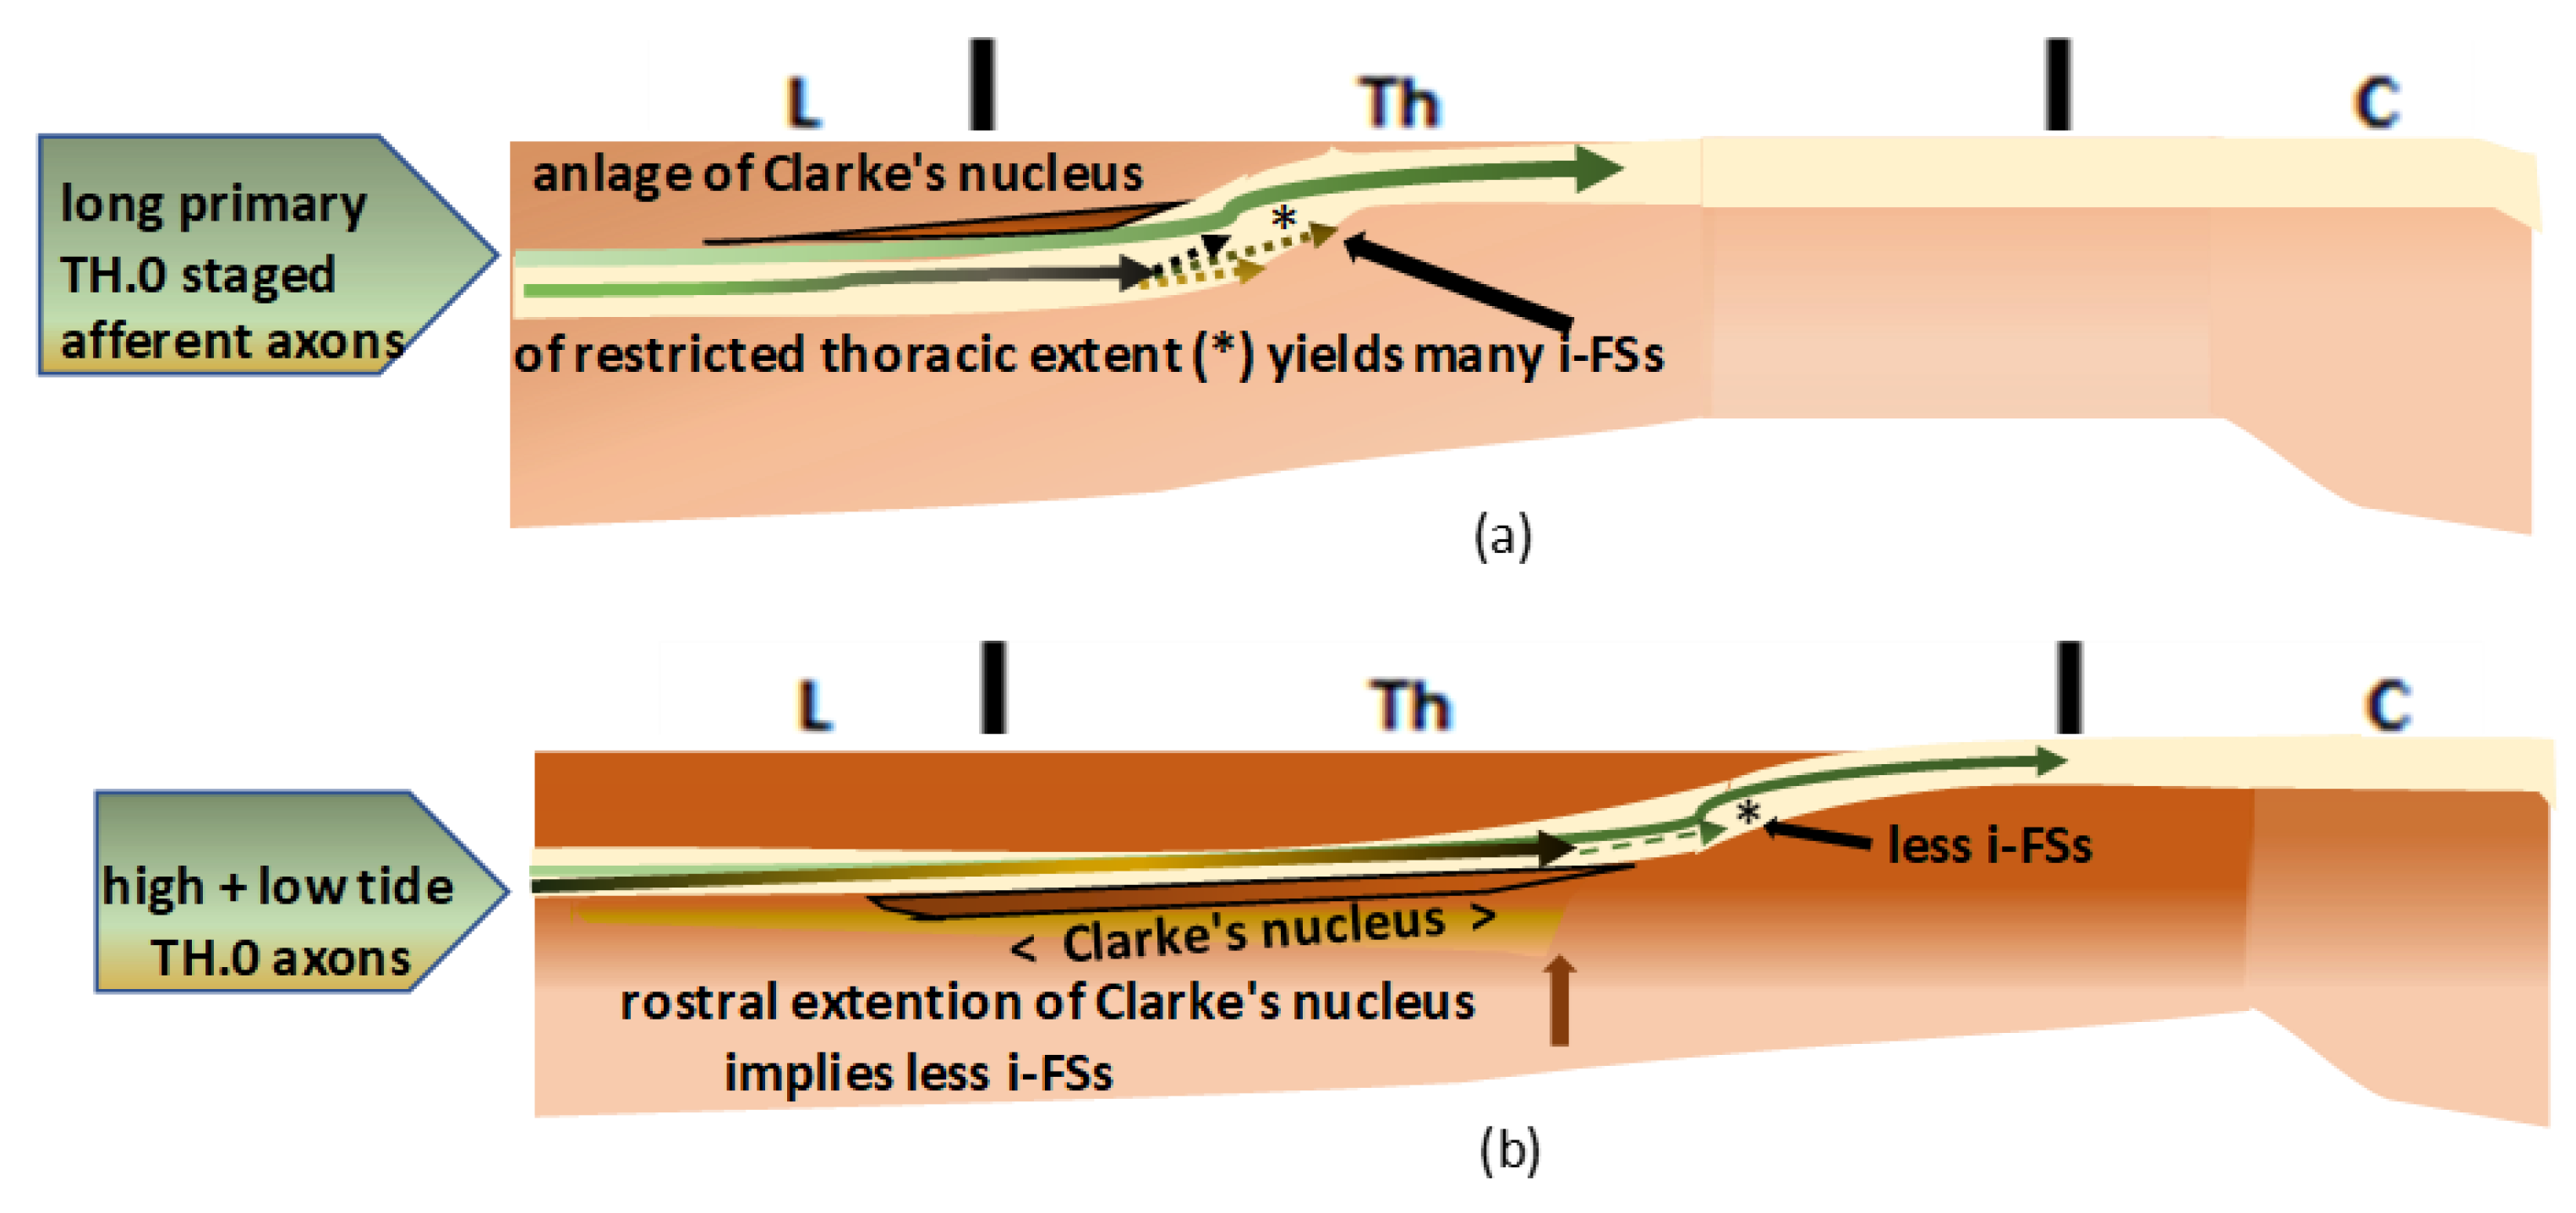
Figure 4.
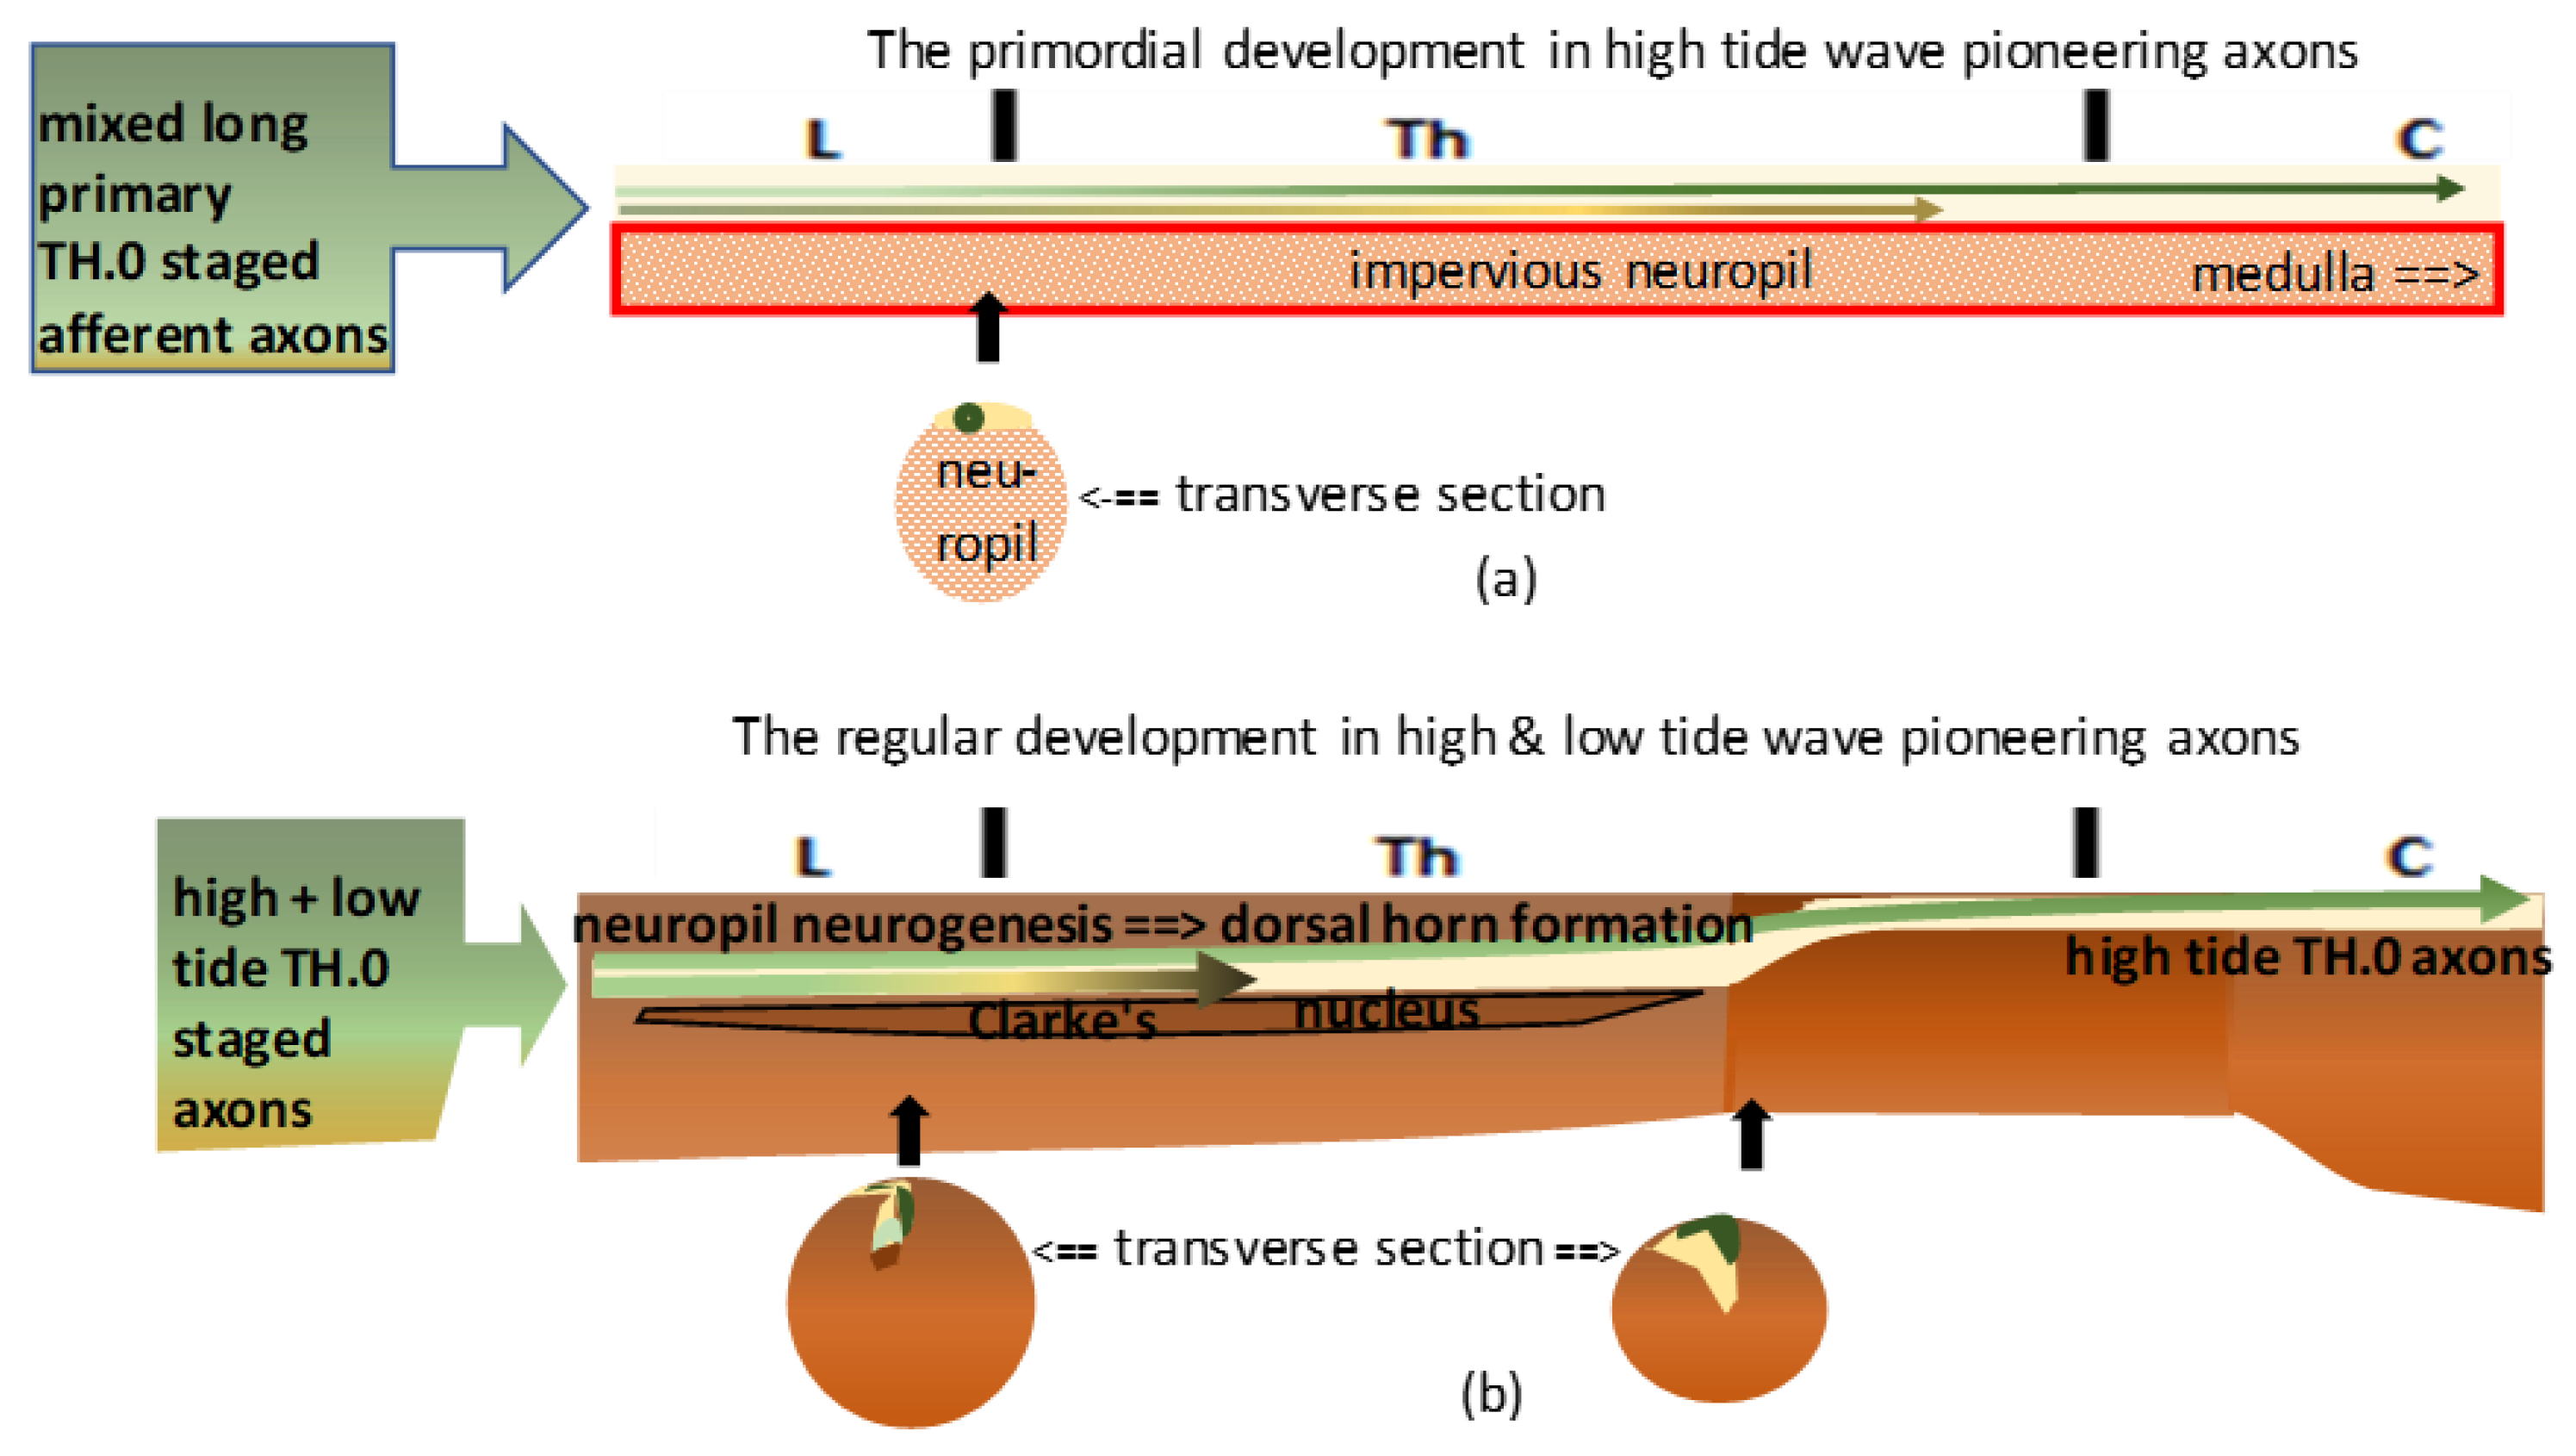
(a): The graphic shows the primordial assemblage. The most upstream TH.0-staged pioneering long primary afferent axons were the first identifiable high-tide axons to cover the immature neuropil dorsally (dark green line). The low-tide axons (light green line) might have reached upper thoracic levels, intermingling with high-tide axons before Clarke’s nucleus manifested its anlage. (b): The graphic shows the natural temporospatial assemblage in duly ripened neuropil. Dorsal horn (DH) formation might have pushed down the high-tide axons and the low-tide axons connected with Clarke’s nucleus. DH overgrowth delineated Clarke’s nucleus in its rostral extent, which might have varied in length. Beyond the uppermost level, the TH.0-staged axons remained at the initial dorsal location, leveled with the gracile nucleus at the medulla.
Figure 4.
(a): The graphic shows the primordial assemblage. The most upstream TH.0-staged pioneering long primary afferent axons were the first identifiable high-tide axons to cover the immature neuropil dorsally (dark green line). The low-tide axons (light green line) might have reached upper thoracic levels, intermingling with high-tide axons before Clarke’s nucleus manifested its anlage. (b): The graphic shows the natural temporospatial assemblage in duly ripened neuropil. Dorsal horn (DH) formation might have pushed down the high-tide axons and the low-tide axons connected with Clarke’s nucleus. DH overgrowth delineated Clarke’s nucleus in its rostral extent, which might have varied in length. Beyond the uppermost level, the TH.0-staged axons remained at the initial dorsal location, leveled with the gracile nucleus at the medulla.
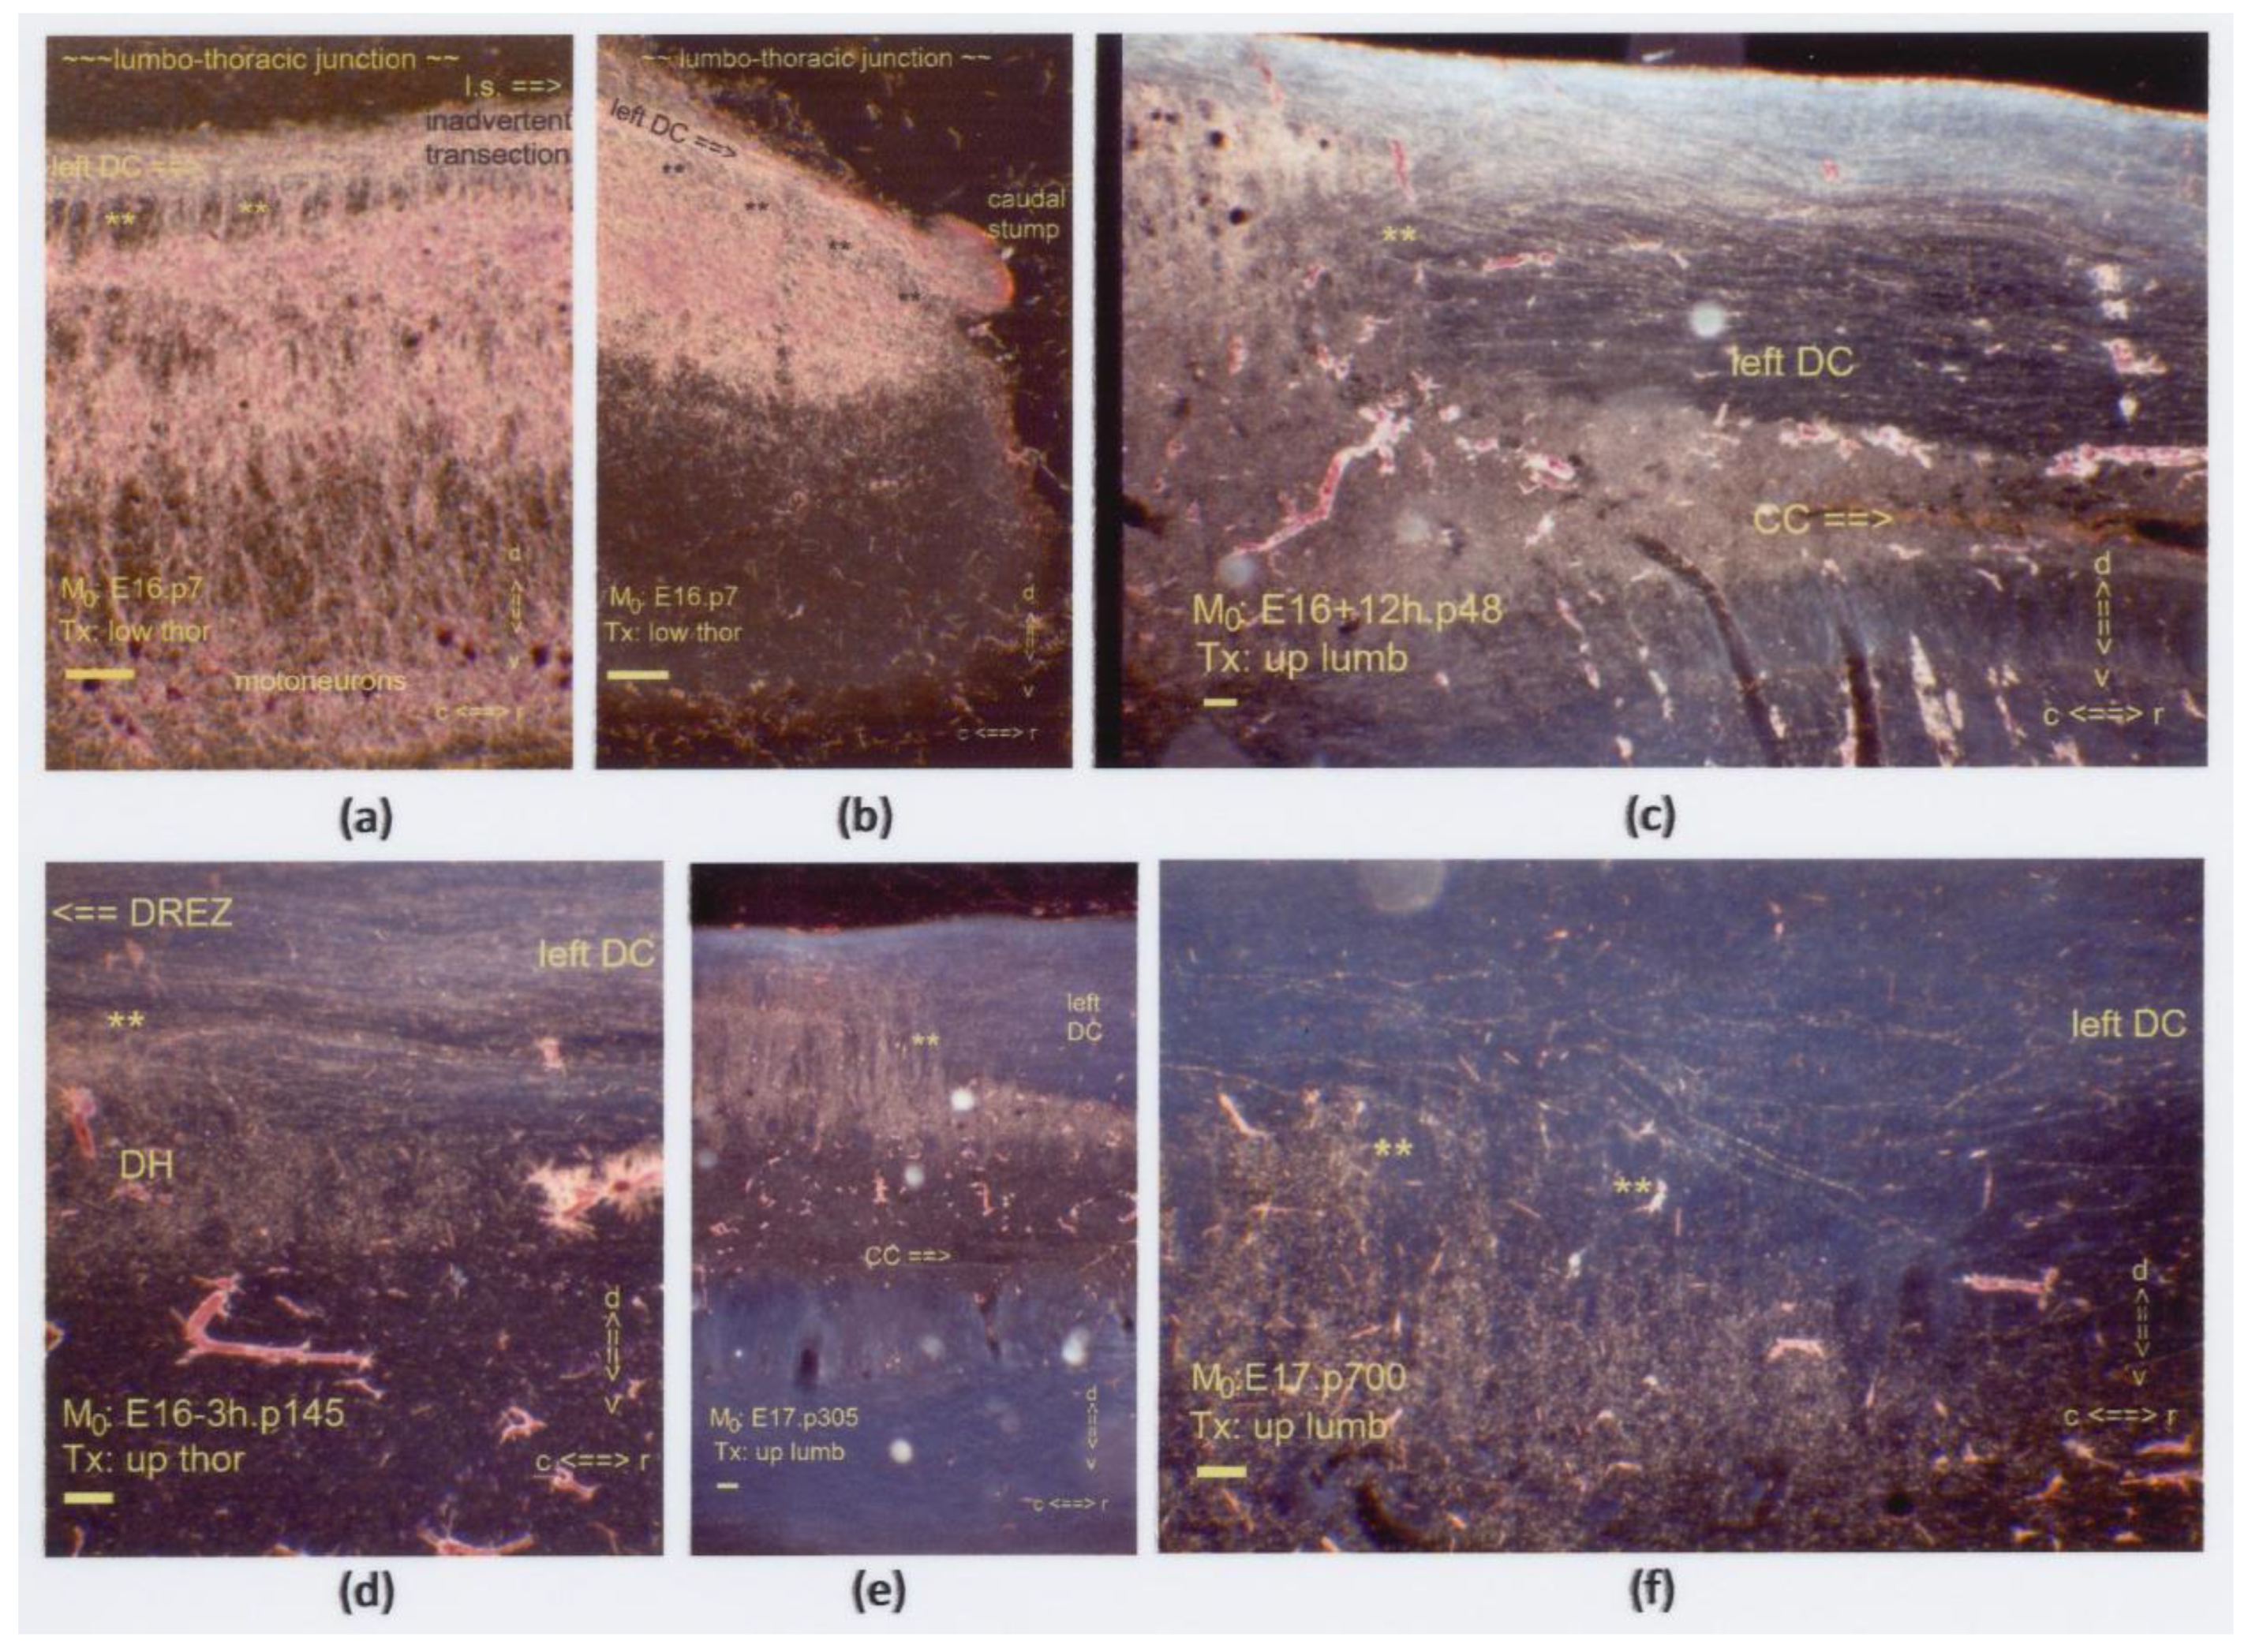
Figure 5.
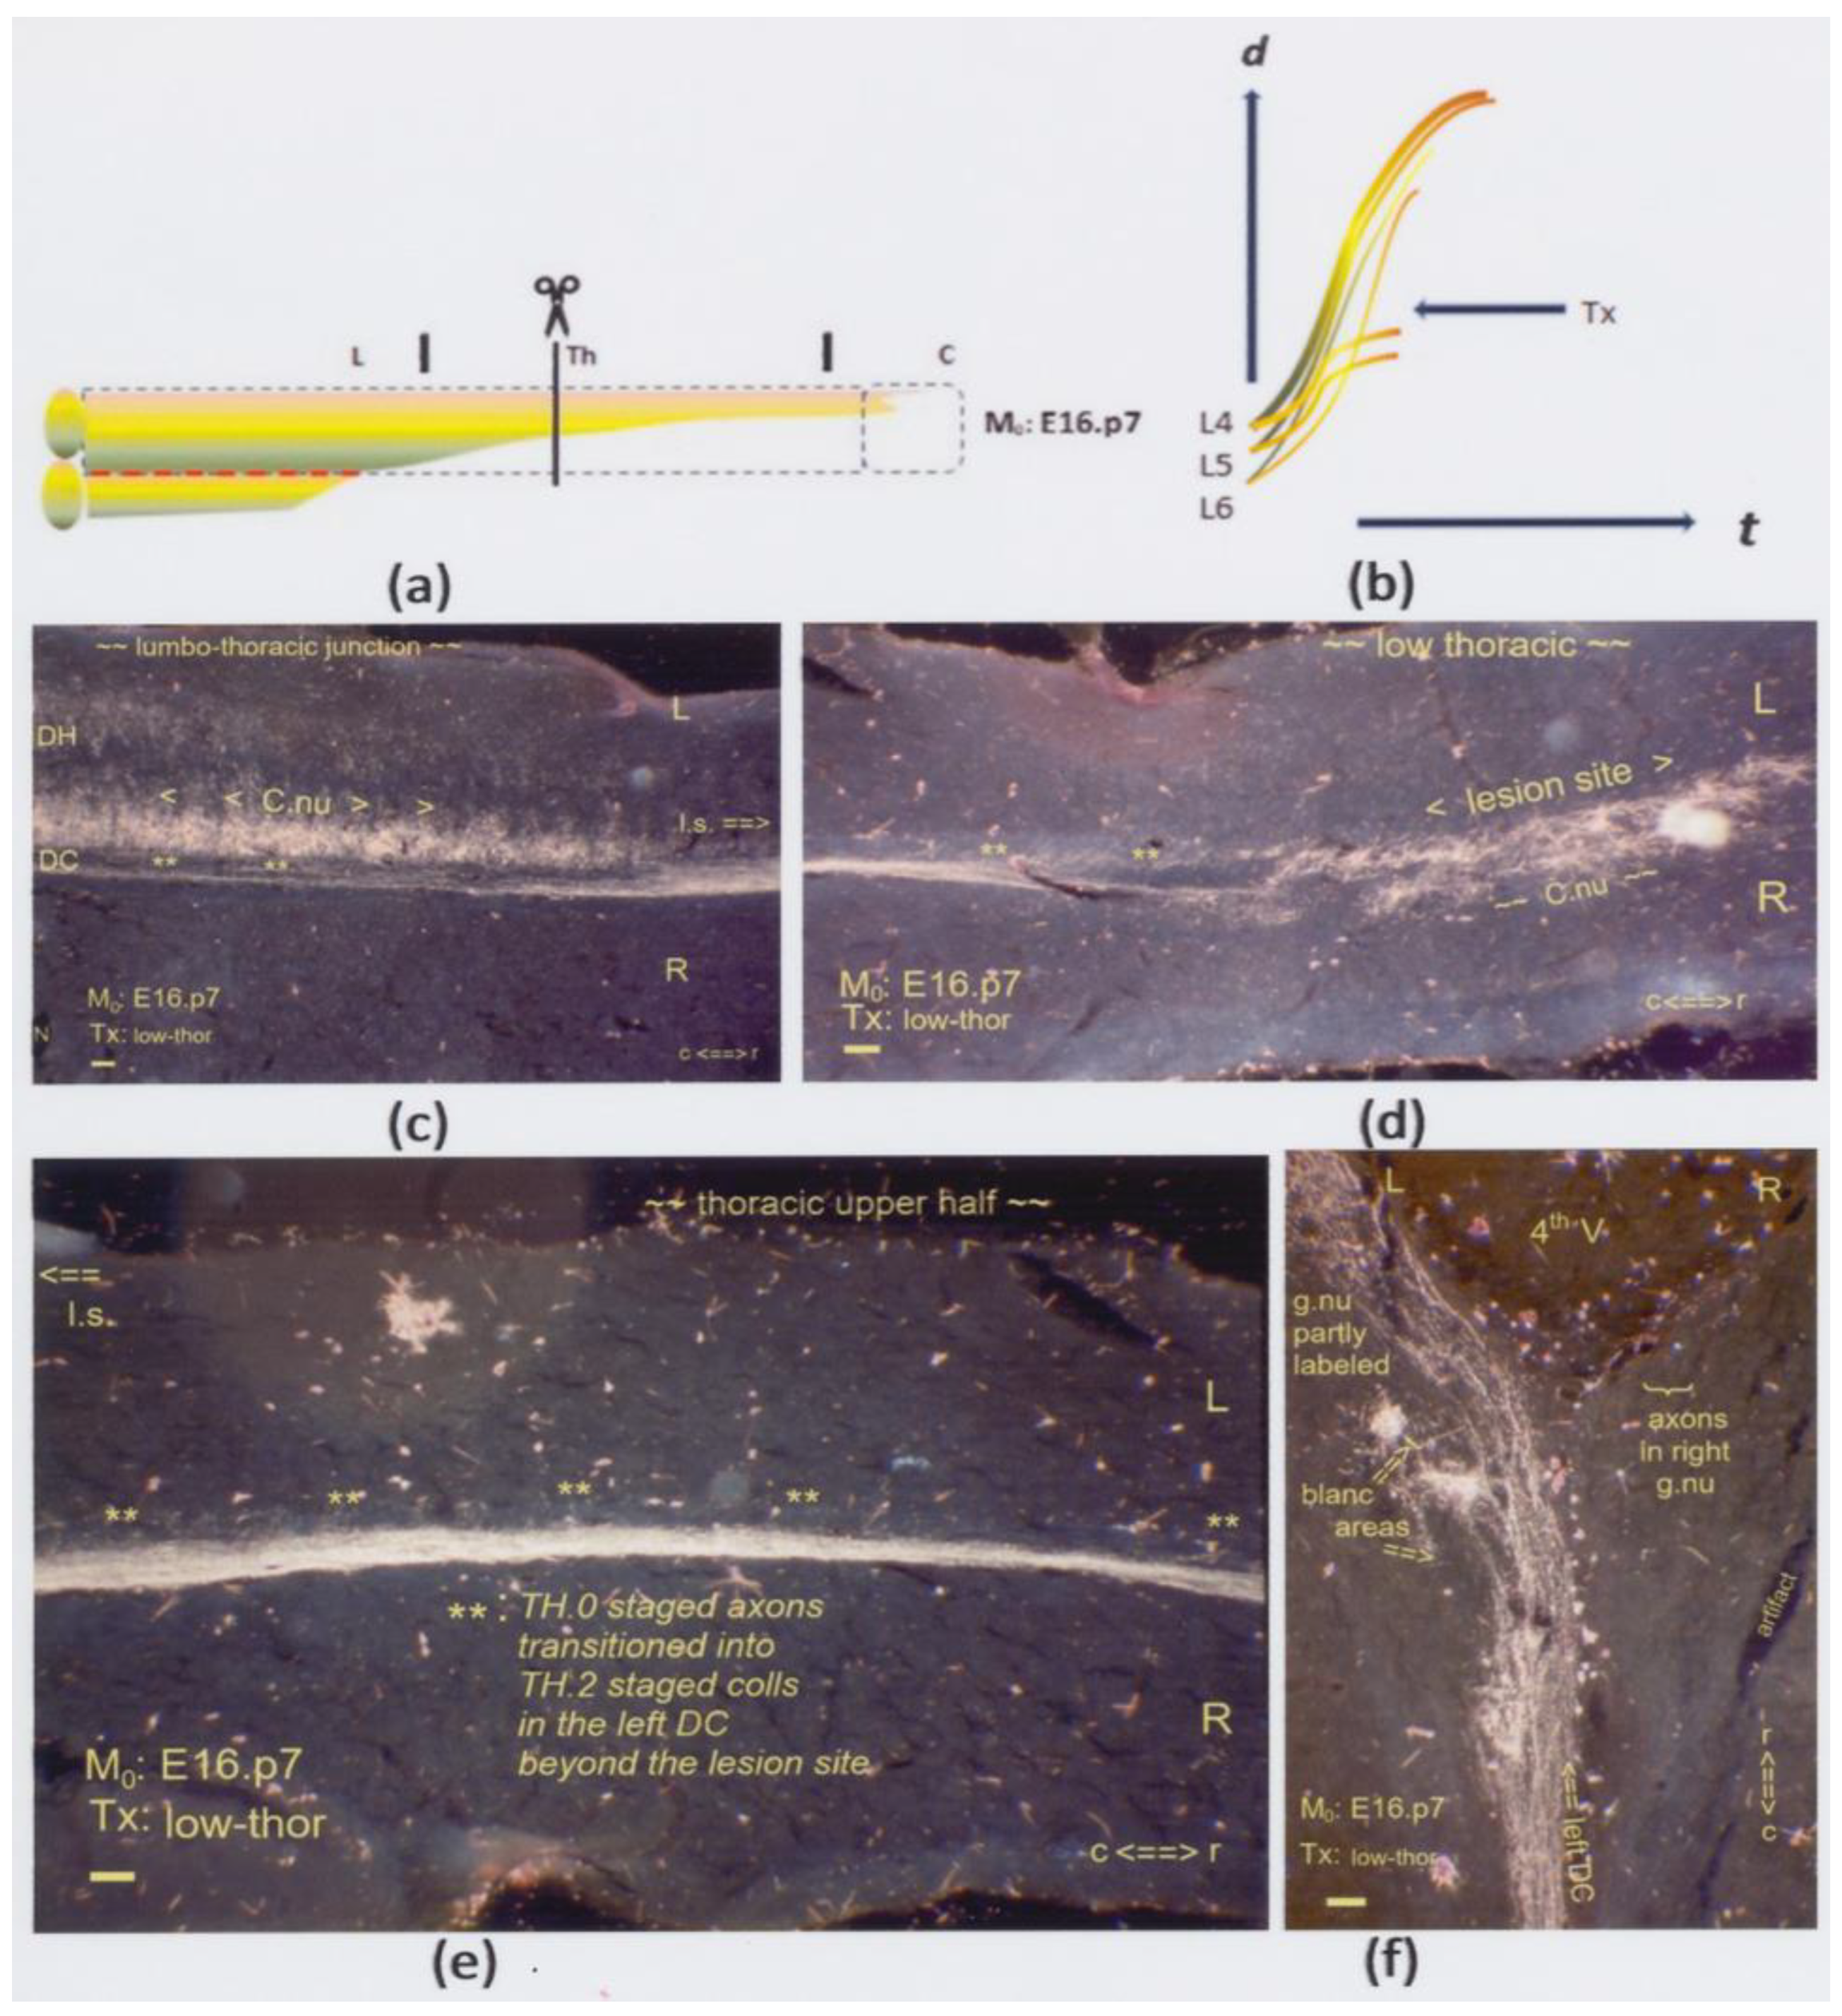
(a,b) The graphics show a low thoracic Tx at M0: E16.p7. The interrupted red line indicates the possible inaccessibility of the neuropil, affecting the development of Clarke’s nucleus. Shown here are horizontal sections. (c) At the lumbo-thoracic junction’s level and halfway through the dorsal horn (DH), the left dorsal column (DC) contains the long primary afferents labeled with antegrade transported HRP. Some label enhancement of Clarke’s nucleus might be due to retrograde degeneration in cut TH.3-staged fibers of the long and intermediate subdivisions. The fibers radiated in straight and oblique TH.2-staged long colls (tandem asterisk: **). (d) The Tx damaged the anlage of Clarke’s nucleus with an impact on its cytoarchitecture at either side of the midline. TH.2-staged colls (**) targeted the local neuropil. The bilateral features of the Tx indicated a twofold dynamic feature: any TH.3-staged cut axon growing into the lesion site might as well have crossed the midline. (e) Unharmed downstream pioneering TH.0-staged axons transitioned into TH.2 colls (**) rostrally beyond the lesion site at upper thoracic levels. (f) Fully developed TH.2-staged colls labeled parts of the left gracile nucleus. Spotty areas remained blank. The Tx revealed that upstream-staged axons bypassed the lesion, while cut axons might explain the blank spots. All scale bars: 100 μm.
Figure 5.
(a,b) The graphics show a low thoracic Tx at M0: E16.p7. The interrupted red line indicates the possible inaccessibility of the neuropil, affecting the development of Clarke’s nucleus. Shown here are horizontal sections. (c) At the lumbo-thoracic junction’s level and halfway through the dorsal horn (DH), the left dorsal column (DC) contains the long primary afferents labeled with antegrade transported HRP. Some label enhancement of Clarke’s nucleus might be due to retrograde degeneration in cut TH.3-staged fibers of the long and intermediate subdivisions. The fibers radiated in straight and oblique TH.2-staged long colls (tandem asterisk: **). (d) The Tx damaged the anlage of Clarke’s nucleus with an impact on its cytoarchitecture at either side of the midline. TH.2-staged colls (**) targeted the local neuropil. The bilateral features of the Tx indicated a twofold dynamic feature: any TH.3-staged cut axon growing into the lesion site might as well have crossed the midline. (e) Unharmed downstream pioneering TH.0-staged axons transitioned into TH.2 colls (**) rostrally beyond the lesion site at upper thoracic levels. (f) Fully developed TH.2-staged colls labeled parts of the left gracile nucleus. Spotty areas remained blank. The Tx revealed that upstream-staged axons bypassed the lesion, while cut axons might explain the blank spots. All scale bars: 100 μm.
![Anatomia 02 00032 g005]()
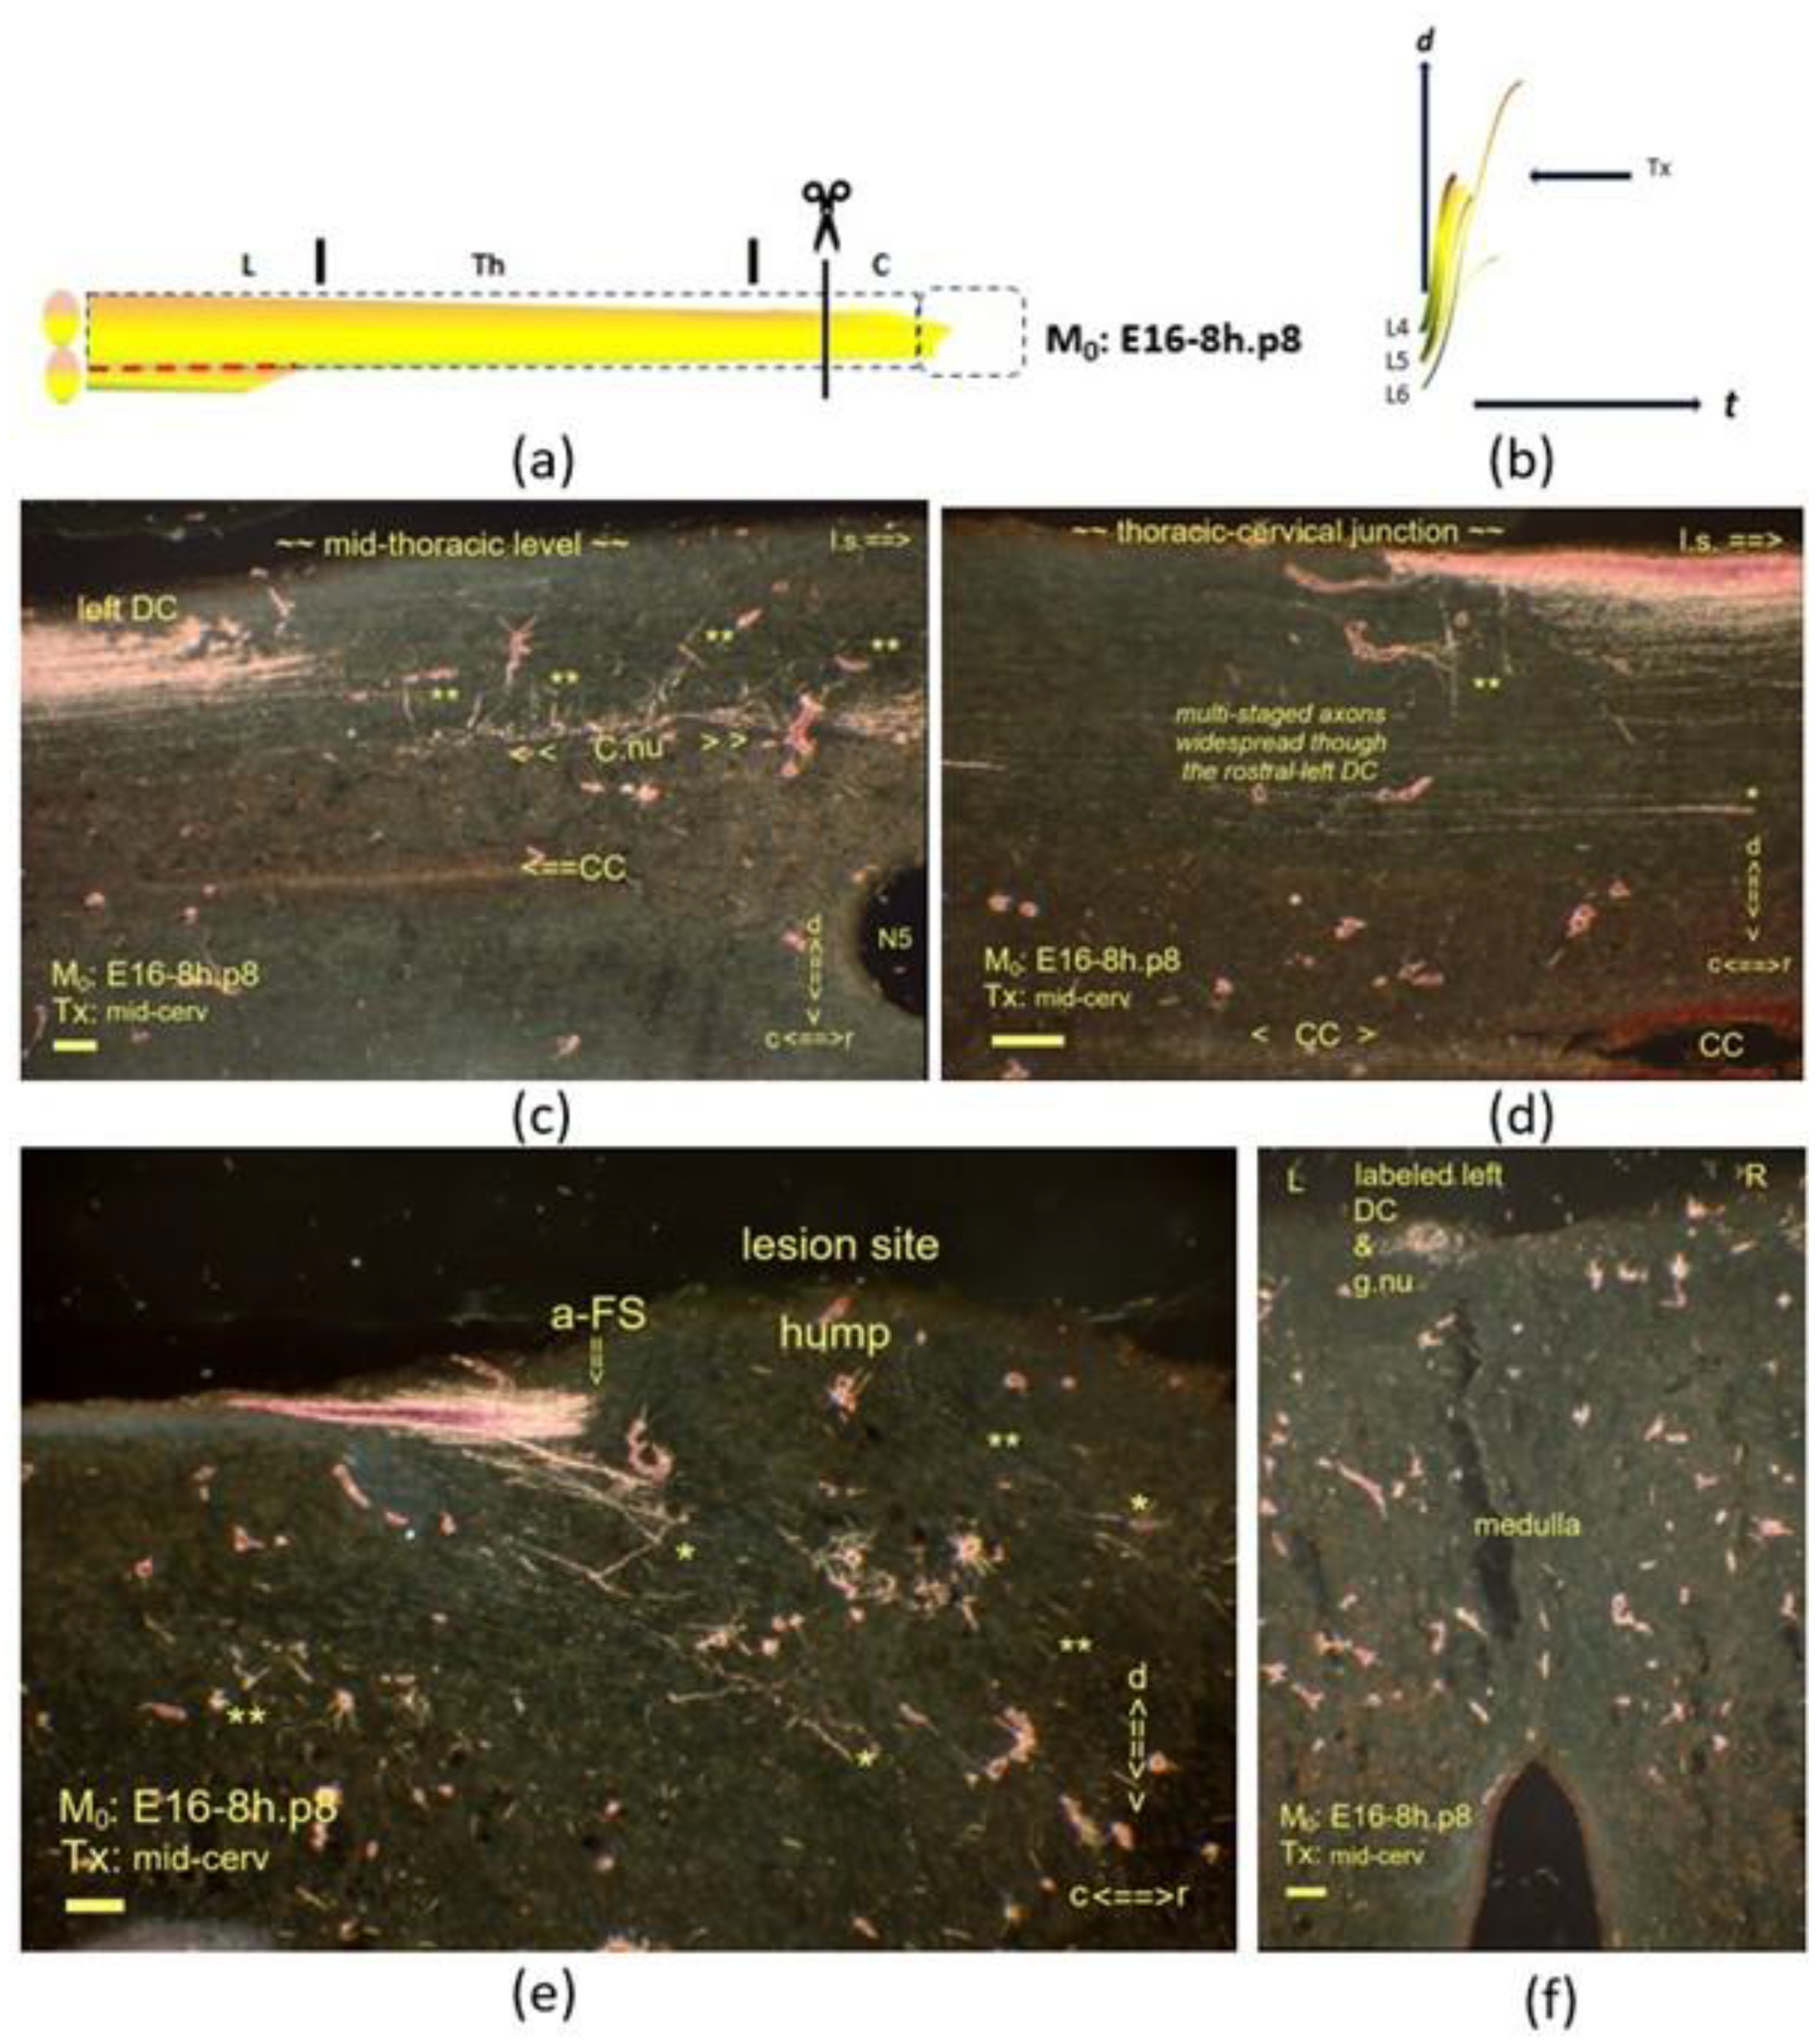
Figure 7.
(
a,
b) The graphics show a mid-cervical Tx at M
0: E16-8h.p8. The interrupted red line is explained in the caption of
Figure 5. Sagittal sections are displayed, and a horizontal one is shown in Figure (
f). (
c) Mid-sagittally, the compacted label shows multistage axons in a bundle. Given the CC is centered almost in the middle, the anlage of Clarke’s nucleus was hypotrophic and located dystopically halfway through the DH. The tandem asterisk (**) marks the TH.2-staged long colls and oblique colls. (
d) One asterisk (*) marks the TH.1-staged i-FS caudally from the lesion site. The few colls (**) document a dystopic level at the thoracic–cervical junction. The widespread multistage long primary afferents throughout the depth of the DC question whether the DC harbored high-tide axons exclusively at this dystopic rostral level. (
e) The fiber stack of TH.1-staged axons exhibited an abrupt front stop (a-FS), mimicking the hypothetical fast elongation stop (f-ES) phenomenon at the medulla. The lesion site featured multistage axons. Some had crossed the lesion site, considering the labeled gracile nucleus. (
f) Those fibers had transitioned into the TH.2-staged colls and penetrated the left gracile nucleus. All scale bars: 100 μm.
![Anatomia 02 00032 g007]()
Figure 8.
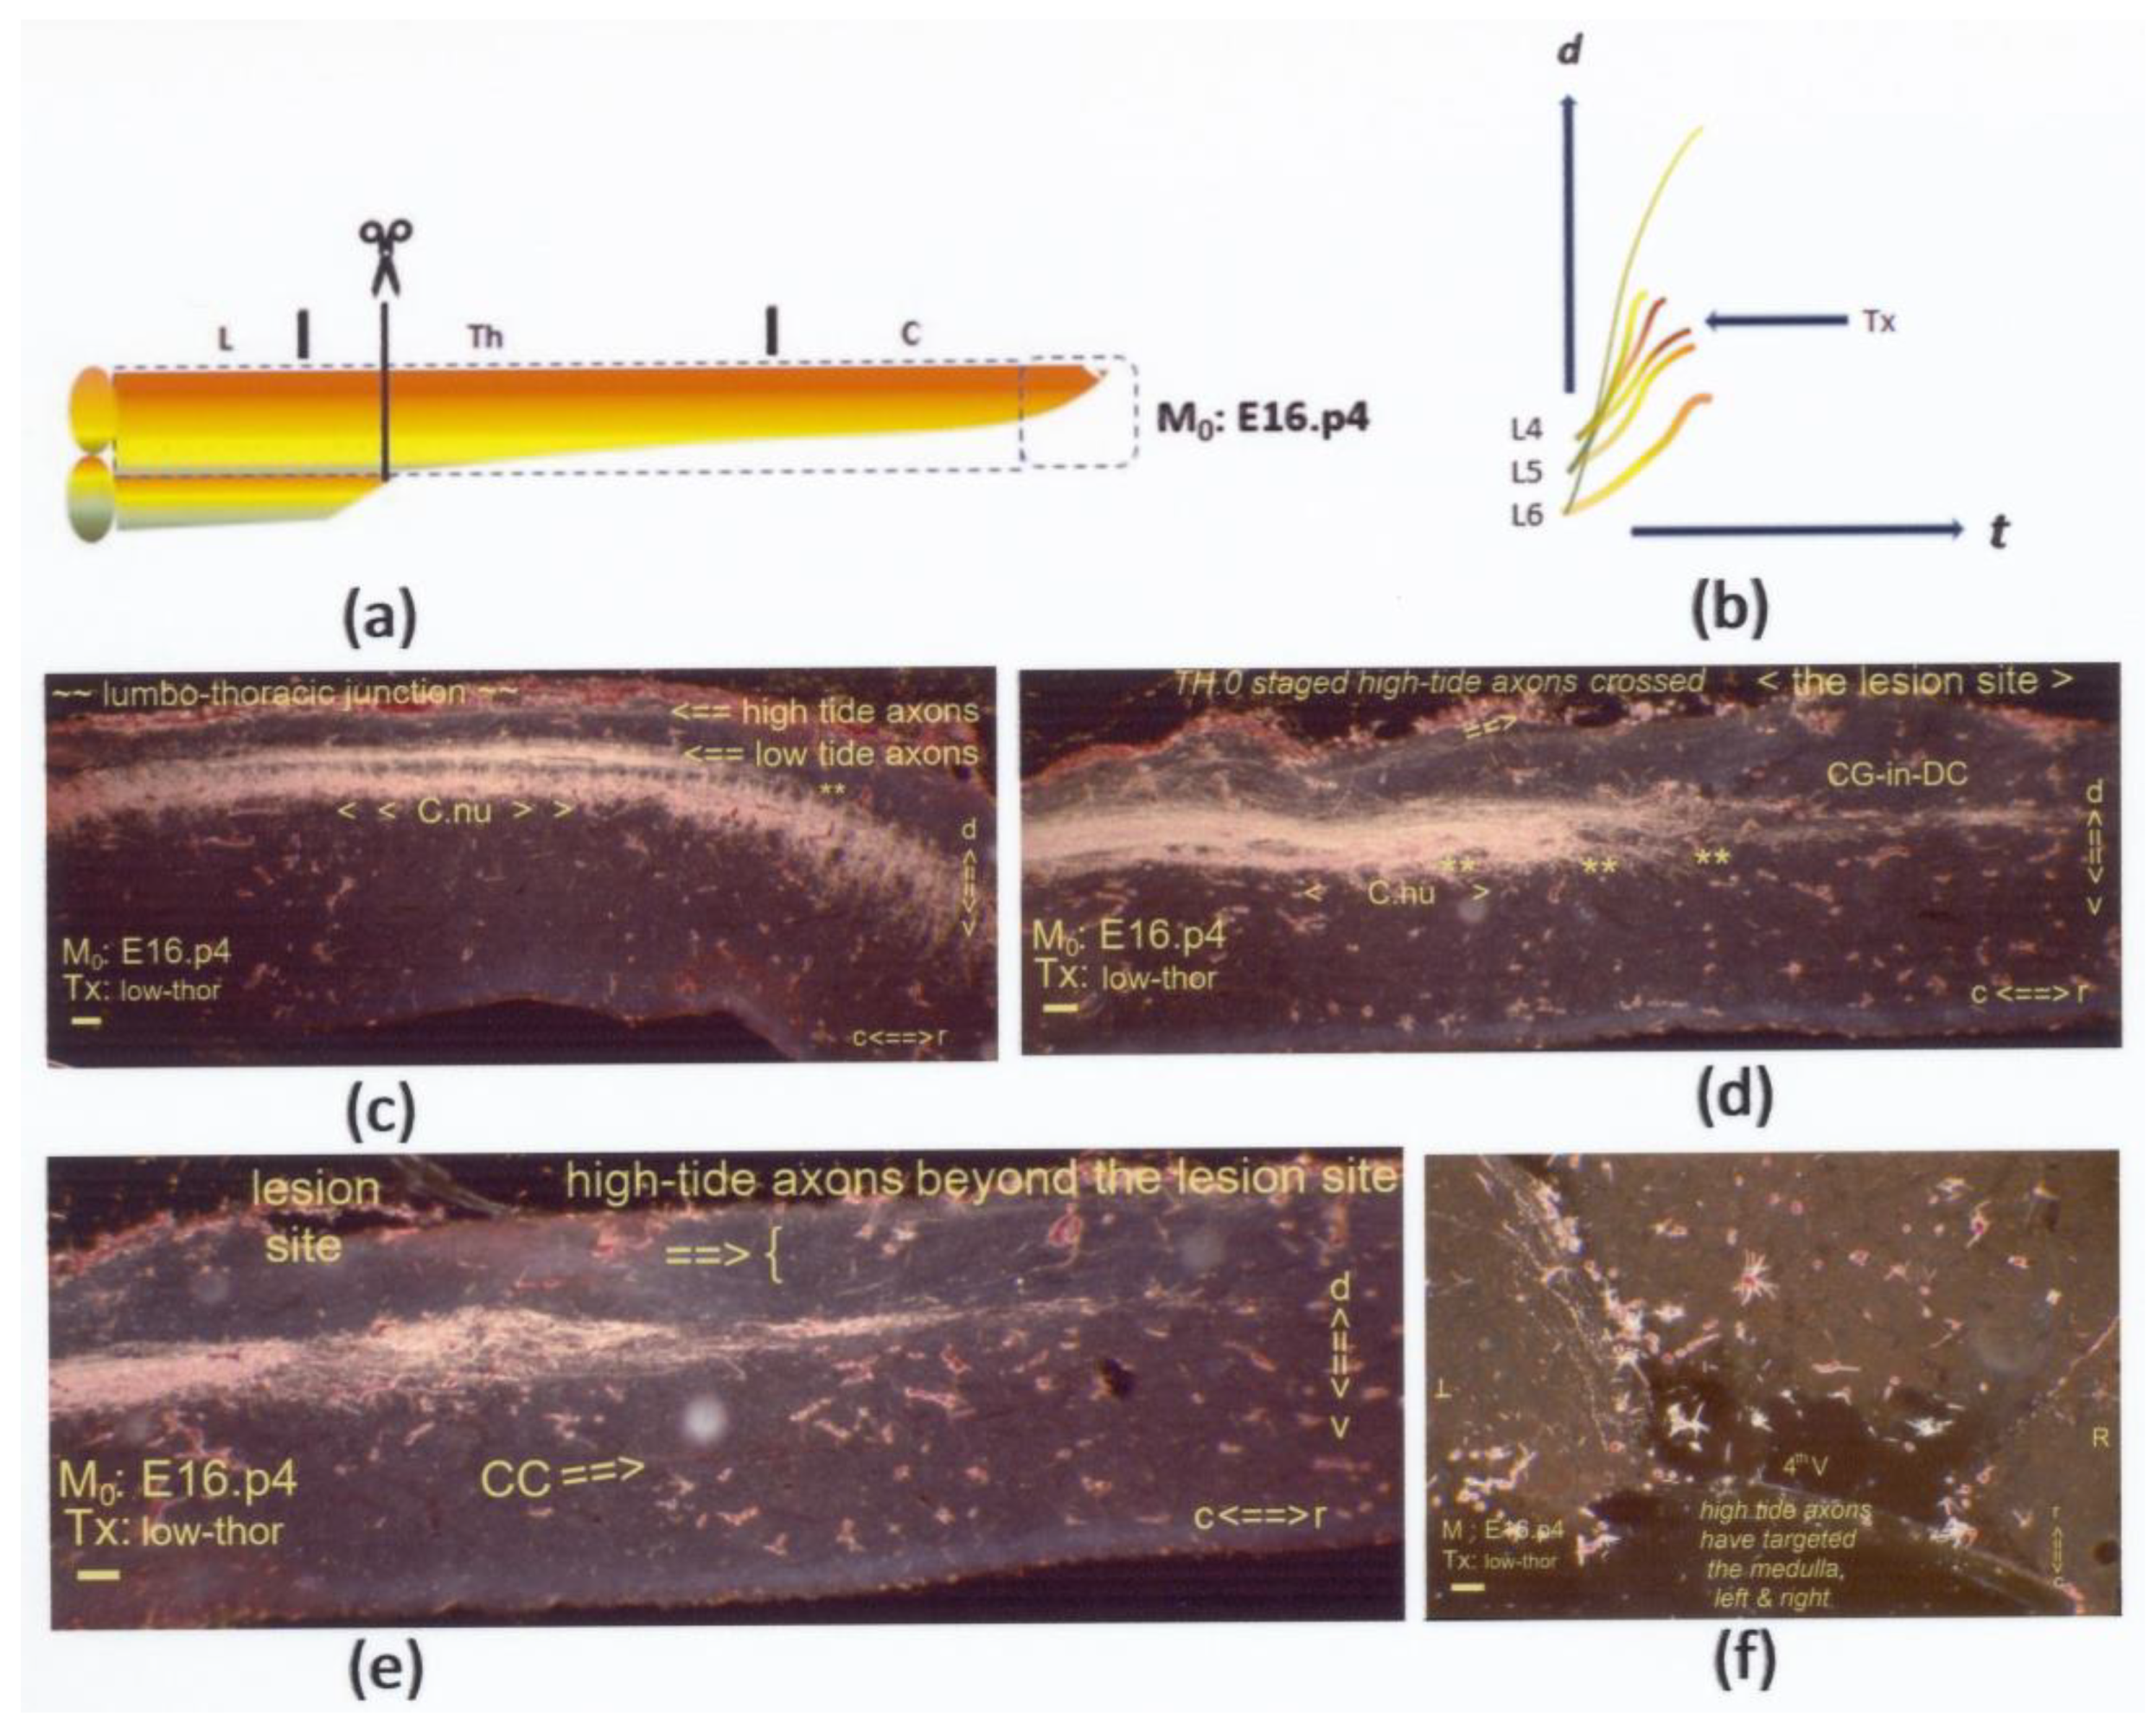
(a,b) The graphics show a low thoracic Tx at M0: E16.p4. Sagittal sections are on display, except for (f), which is horizontal. (c) At the lumbo–thoracic junction, Clarke’s nucleus featured quite an intense labeling pattern despite its probably dystopic, overly dorsal location. Considering the label in the gracile nucleus, the subpial axons are identified as the final high-tide pioneering axons at spring tide. (d) Most likely, the same high-tide fibers followed this subpial trajectory, distinct from the ventral dominant fiber bundle harboring multistage axons. They terminated in the local neuropil at the lesion site marked by the CG-in-DC feature. Potentially, cut TH.2- and TH.3-staged high- and low-tide axons might have accounted for the hyperintense label that featured enhancement just caudal from the lesion site. The tandem asterisk (**) indicates colls (c,d). (e) A 40 µ shift to the midline at the lesion site depicts the upstream axons, which crossed the lesion site. The three slides indicate a tendency for circumferential growth of the DH, relating to a ventral migration of Clarke’s nucleus. (f) At spring tide, these few fibers in the DC managed to target the medulla. All scale bars: 100 μm.
Figure 8.
(a,b) The graphics show a low thoracic Tx at M0: E16.p4. Sagittal sections are on display, except for (f), which is horizontal. (c) At the lumbo–thoracic junction, Clarke’s nucleus featured quite an intense labeling pattern despite its probably dystopic, overly dorsal location. Considering the label in the gracile nucleus, the subpial axons are identified as the final high-tide pioneering axons at spring tide. (d) Most likely, the same high-tide fibers followed this subpial trajectory, distinct from the ventral dominant fiber bundle harboring multistage axons. They terminated in the local neuropil at the lesion site marked by the CG-in-DC feature. Potentially, cut TH.2- and TH.3-staged high- and low-tide axons might have accounted for the hyperintense label that featured enhancement just caudal from the lesion site. The tandem asterisk (**) indicates colls (c,d). (e) A 40 µ shift to the midline at the lesion site depicts the upstream axons, which crossed the lesion site. The three slides indicate a tendency for circumferential growth of the DH, relating to a ventral migration of Clarke’s nucleus. (f) At spring tide, these few fibers in the DC managed to target the medulla. All scale bars: 100 μm.
![Anatomia 02 00032 g008]()
Figure 9.
(
a,
b) The graphics show an upper thoracic Tx at M
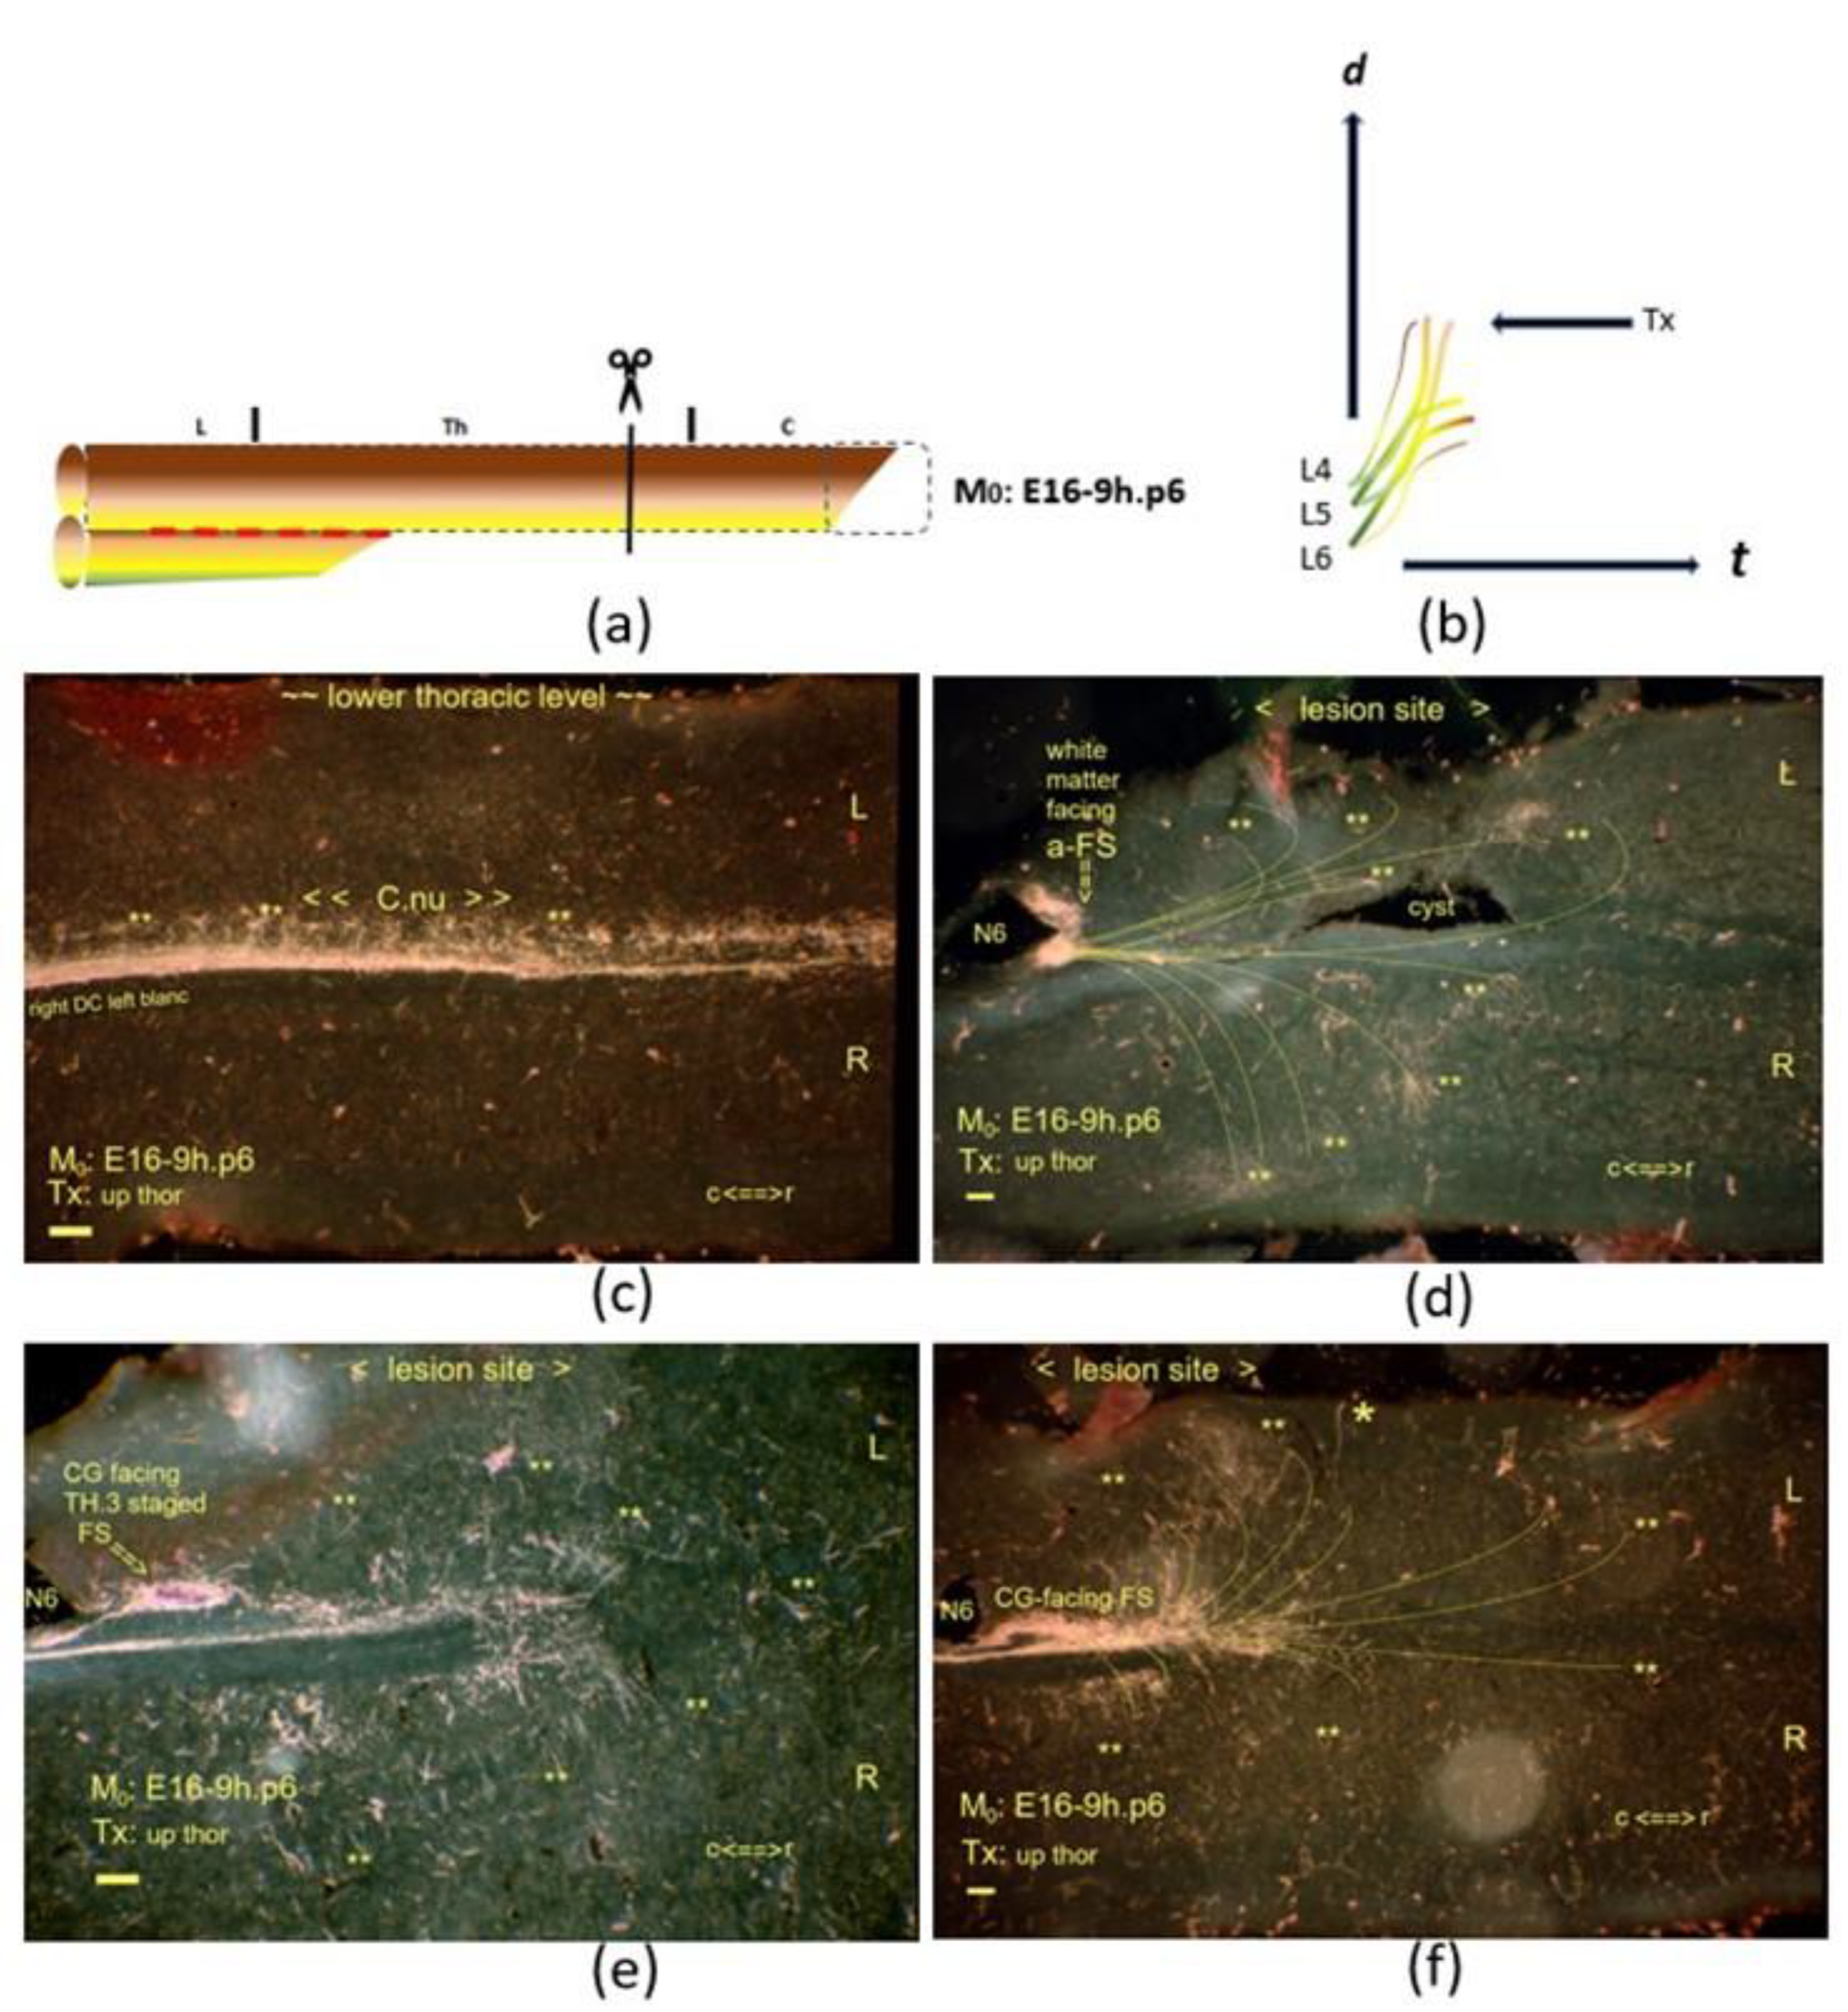
0: E16-9h.p6. The interrupted red line indicates the neuropil’s inaccessibility, affecting the development of Clarke’s nucleus. On display are horizontal sections. (
c) At a one-hour upstream M
0, Clarke’s nucleus featured advanced ripening compared to the nucleus in the E16-8h.p8 neonate displayed in
Figure 7c. (
d) The lesion site involved multistage fibers with an a-FS caudal from the traumatic cyst. TH.2-staged colls (**) traversed the neuropil on either side of the lesion site. The N6 iron fix pin has split the a-FS. (
e) The small CG-facing FS, just rostral to the pinhole, was another downstream stage indicating a drift down the cascade. The TH.3-staged axons were close to the a-FS axons, which abutted the caudal border of the lesion site, marked with the N6 fix pin. (
f) Beyond this level, the axons exhibited dynamic features of many TH.2-staged colls penetrated deep into the neuropil (
d–
f). The gracile nucleus devoid of the label also confirmed the developmental progress compared to the former p8 neonate. All scale bars: 100 μm.
Figure 9.
(
a,
b) The graphics show an upper thoracic Tx at M
0: E16-9h.p6. The interrupted red line indicates the neuropil’s inaccessibility, affecting the development of Clarke’s nucleus. On display are horizontal sections. (
c) At a one-hour upstream M
0, Clarke’s nucleus featured advanced ripening compared to the nucleus in the E16-8h.p8 neonate displayed in
Figure 7c. (
d) The lesion site involved multistage fibers with an a-FS caudal from the traumatic cyst. TH.2-staged colls (**) traversed the neuropil on either side of the lesion site. The N6 iron fix pin has split the a-FS. (
e) The small CG-facing FS, just rostral to the pinhole, was another downstream stage indicating a drift down the cascade. The TH.3-staged axons were close to the a-FS axons, which abutted the caudal border of the lesion site, marked with the N6 fix pin. (
f) Beyond this level, the axons exhibited dynamic features of many TH.2-staged colls penetrated deep into the neuropil (
d–
f). The gracile nucleus devoid of the label also confirmed the developmental progress compared to the former p8 neonate. All scale bars: 100 μm.
![Anatomia 02 00032 g009]()
Figure 10.
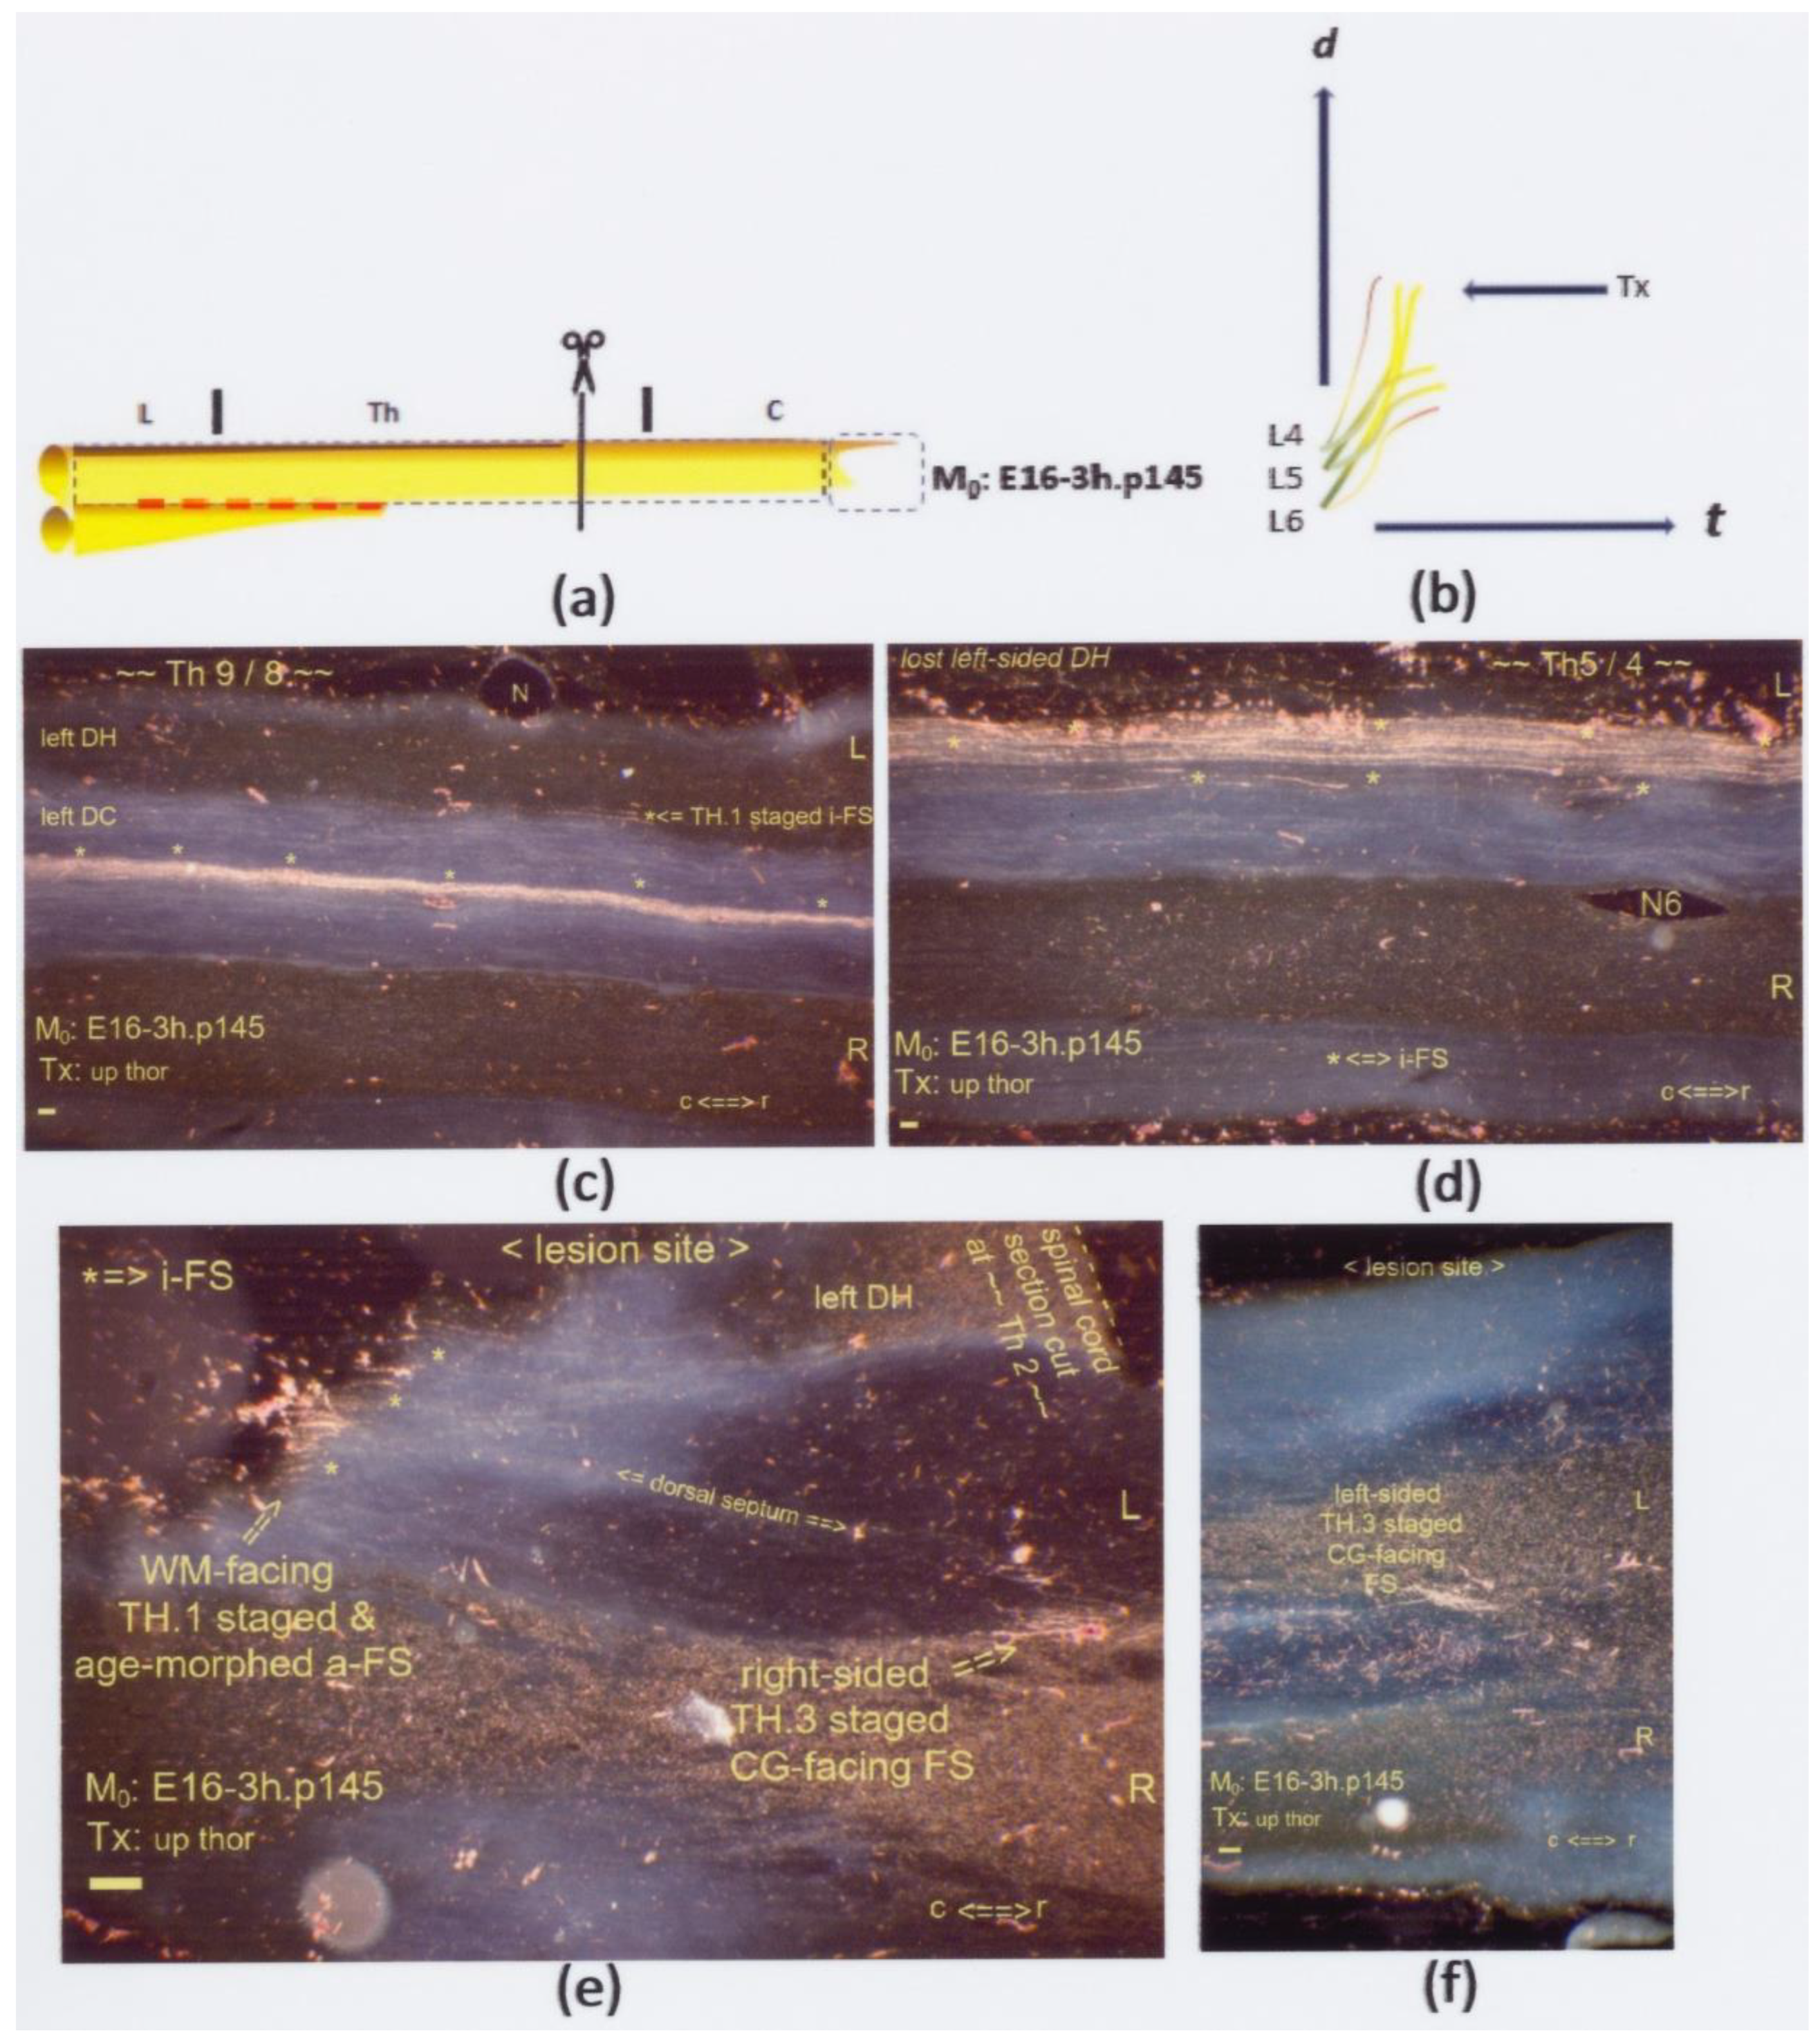
(a,b) The graphics show an upper thoracic Tx at M0: E16-3h.p145. The interrupted red line indicates a possible state of dissociated neuropil. On display are horizontal sections. (c,d) Numerous multilevel i-FSs (marked: *) were captured mid-sagittally at levels caudal from the lesion site. Their visibility was due to age morphing. (e) Also, i-FSs were visible, constituting an age-morphed WM-facing a-FS marked with three single asterisks (*) in a row across the DCs. The Tx created multistage axons. This lesion site entailed two central gray-facing FSs. The TH.3-staged axons terminated at bilateral fringes. This FOV depicts one FS at the contra-lateral side, confirming a Tx. (f) Halfway down the left DC, the ventral location shows another tiny CG-facing FS. All scale bars: 100 μm.
Figure 10.
(a,b) The graphics show an upper thoracic Tx at M0: E16-3h.p145. The interrupted red line indicates a possible state of dissociated neuropil. On display are horizontal sections. (c,d) Numerous multilevel i-FSs (marked: *) were captured mid-sagittally at levels caudal from the lesion site. Their visibility was due to age morphing. (e) Also, i-FSs were visible, constituting an age-morphed WM-facing a-FS marked with three single asterisks (*) in a row across the DCs. The Tx created multistage axons. This lesion site entailed two central gray-facing FSs. The TH.3-staged axons terminated at bilateral fringes. This FOV depicts one FS at the contra-lateral side, confirming a Tx. (f) Halfway down the left DC, the ventral location shows another tiny CG-facing FS. All scale bars: 100 μm.
Figure 11.
(
a,
b) The graphics show a mid-thoracic Tx at M
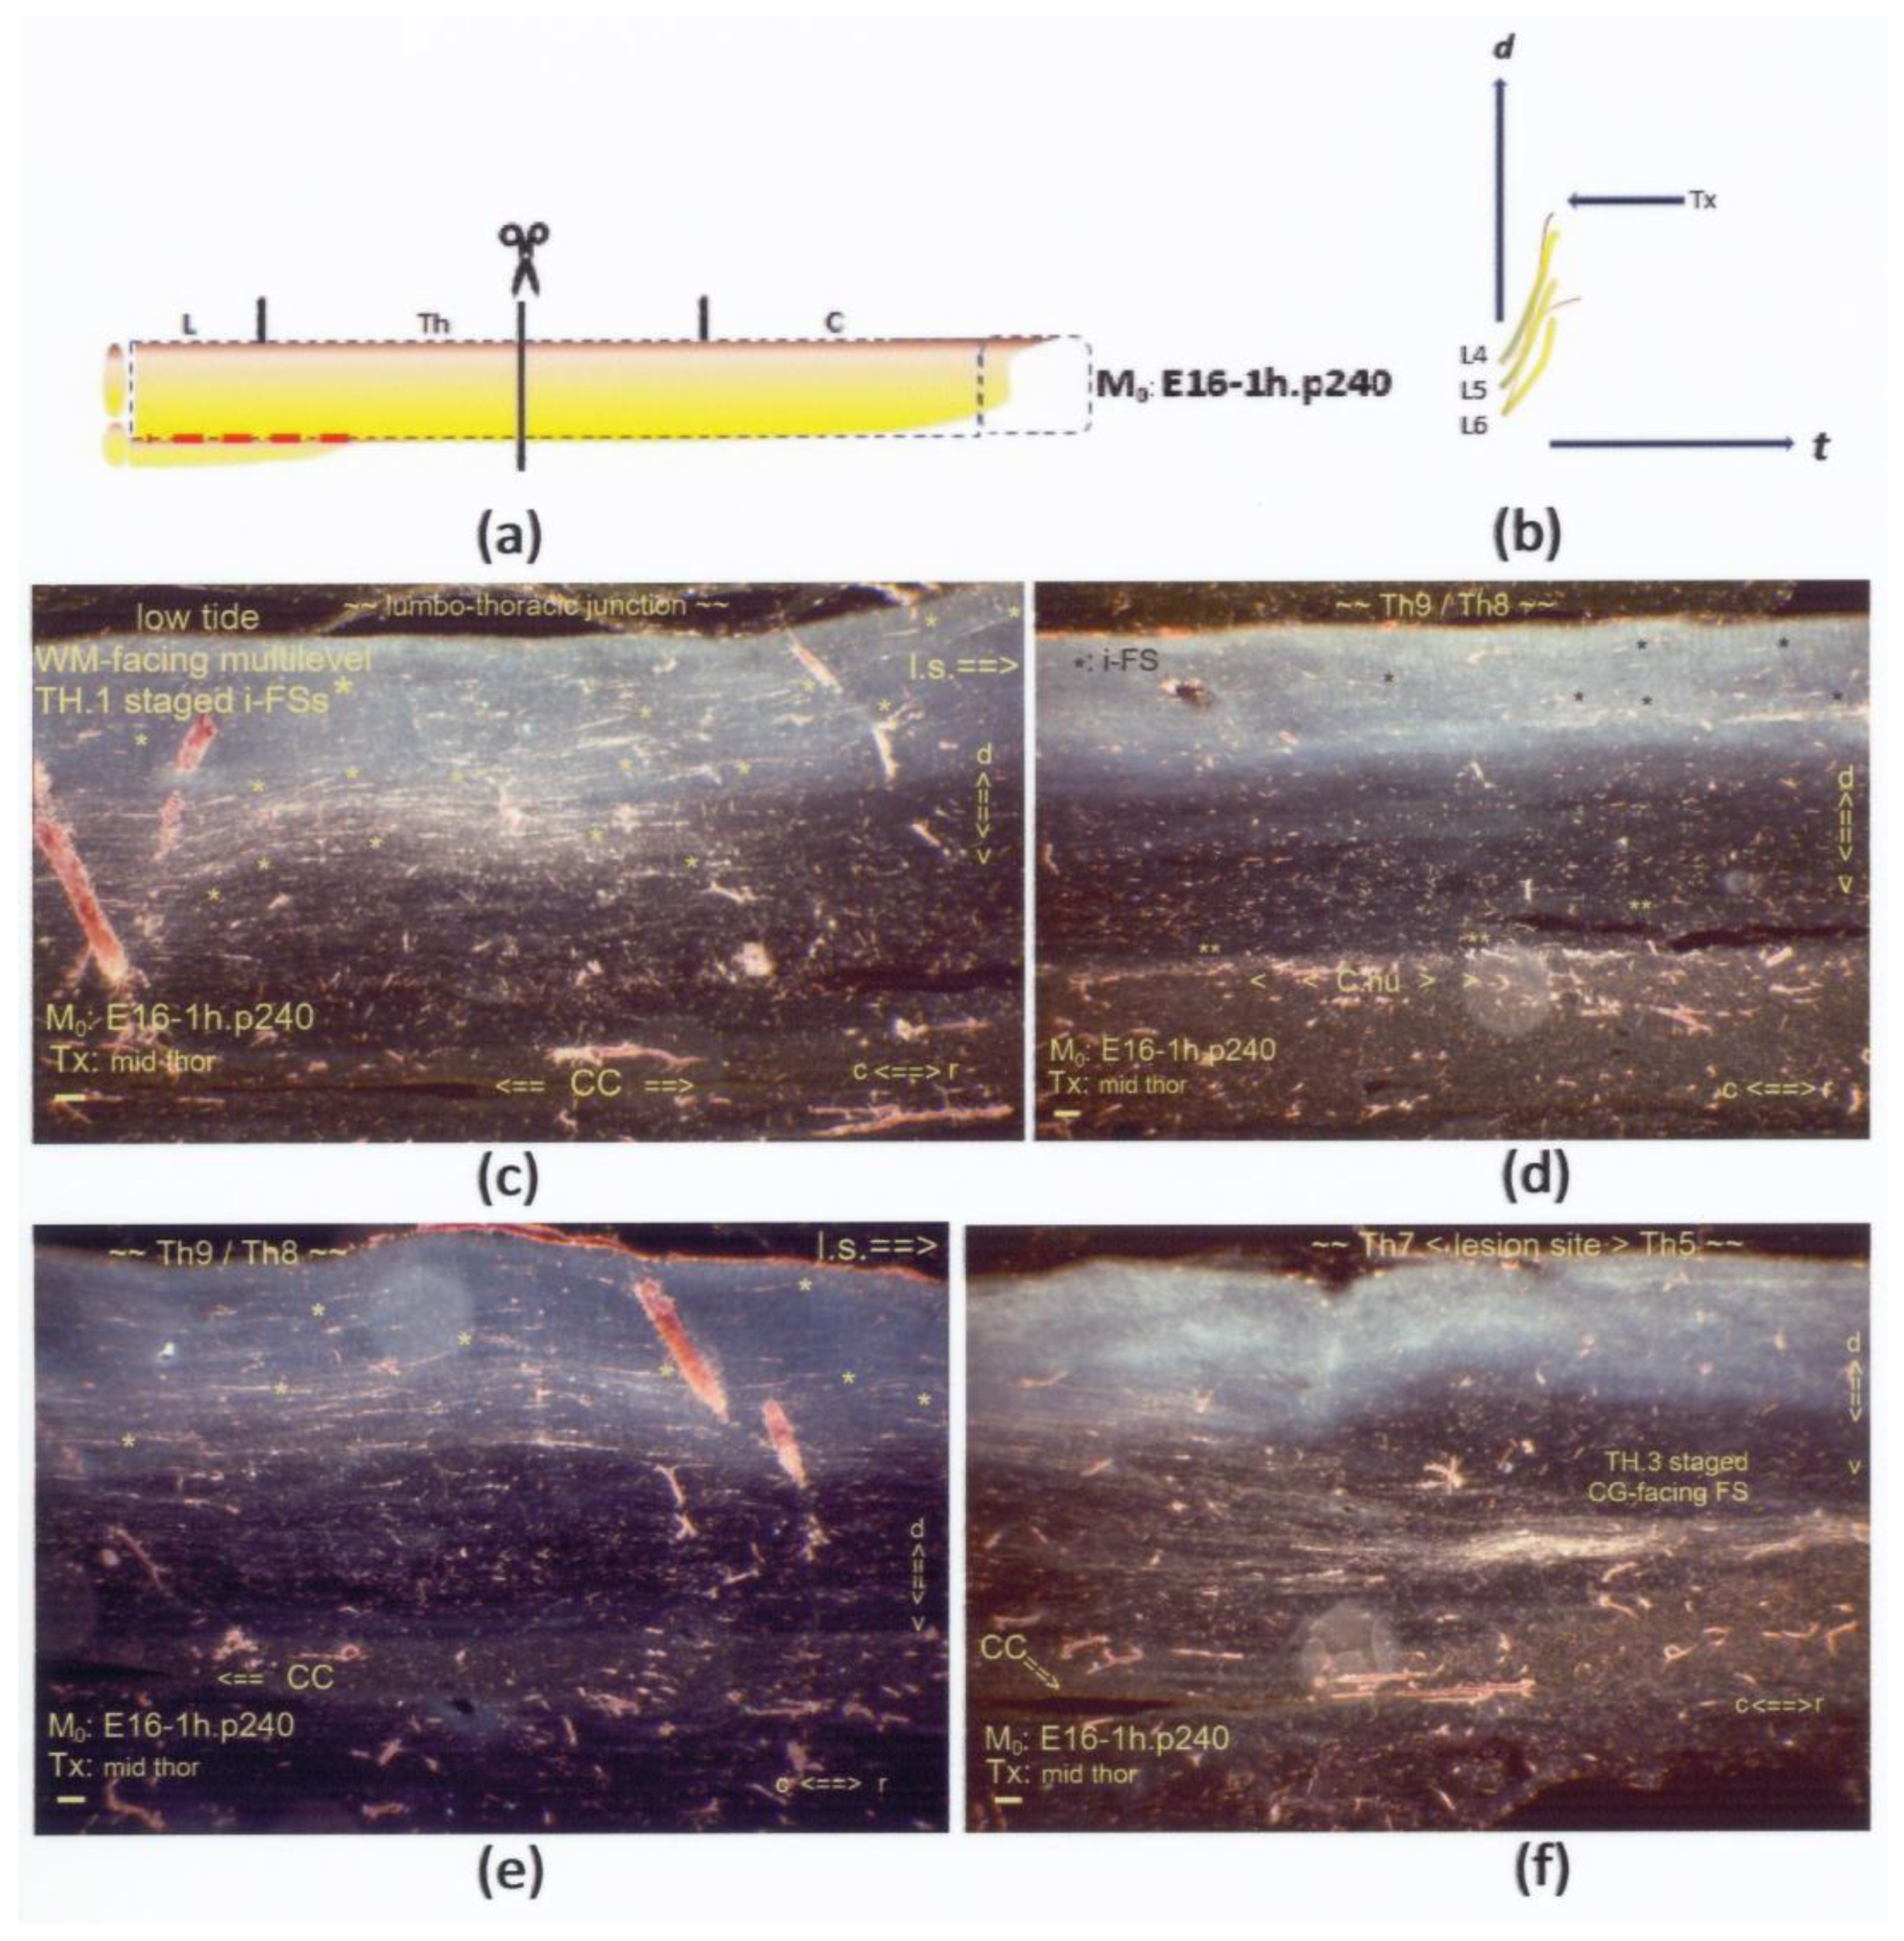
0: E16-1h.p240. The interrupted red line indicates the neuropil’s inaccessibility (v.s.). On display are sagittal sections. (
c,
d) Two slides, the first and the last of a series of four consecutive FOVs from the same mid-sagittal section, display the left DC at and near the midline. (
c) Numerous mid-sagittal i-FSs (marked: *) had spread DC-wide at the lumbo–thoracic junction. The fibers turned from ventral to dorsal trajectories, acknowledged as mutual pathways for high- and low-tide pioneering fibers. Numerous i-FSs were identified as low-tide axons cut at their neap tides. (
d) The tentative low-tide colls (marked: **) featured a delicate label at the fringe, suggesting a hypotrophic Clarke’s nucleus. The underdevelopment of Clarke’s nucleus might relate to the inaccessible neuropil due to delayed ripening, addressed in
Section 4.2.3. (
e) Still, more mid-sagittal i-FSs (marked: *) were scattered through the dorsal half of the DC. (
f) A CG-facing FS identified the caudal border of the lesion site at a level of a few thoracic segments rostral to (
e). The midline was nearby, given the CC. Compared to the tiny FSs in the p145 case, this FS might have harbored more high-tide TH.3-staged axons. The increment complied with the gradual downward shift, corresponding with the difference between the conception-bound M
0s. All scale bars: 100 μm.
Figure 11.
(
a,
b) The graphics show a mid-thoracic Tx at M
0: E16-1h.p240. The interrupted red line indicates the neuropil’s inaccessibility (v.s.). On display are sagittal sections. (
c,
d) Two slides, the first and the last of a series of four consecutive FOVs from the same mid-sagittal section, display the left DC at and near the midline. (
c) Numerous mid-sagittal i-FSs (marked: *) had spread DC-wide at the lumbo–thoracic junction. The fibers turned from ventral to dorsal trajectories, acknowledged as mutual pathways for high- and low-tide pioneering fibers. Numerous i-FSs were identified as low-tide axons cut at their neap tides. (
d) The tentative low-tide colls (marked: **) featured a delicate label at the fringe, suggesting a hypotrophic Clarke’s nucleus. The underdevelopment of Clarke’s nucleus might relate to the inaccessible neuropil due to delayed ripening, addressed in
Section 4.2.3. (
e) Still, more mid-sagittal i-FSs (marked: *) were scattered through the dorsal half of the DC. (
f) A CG-facing FS identified the caudal border of the lesion site at a level of a few thoracic segments rostral to (
e). The midline was nearby, given the CC. Compared to the tiny FSs in the p145 case, this FS might have harbored more high-tide TH.3-staged axons. The increment complied with the gradual downward shift, corresponding with the difference between the conception-bound M
0s. All scale bars: 100 μm.
![Anatomia 02 00032 g011]()
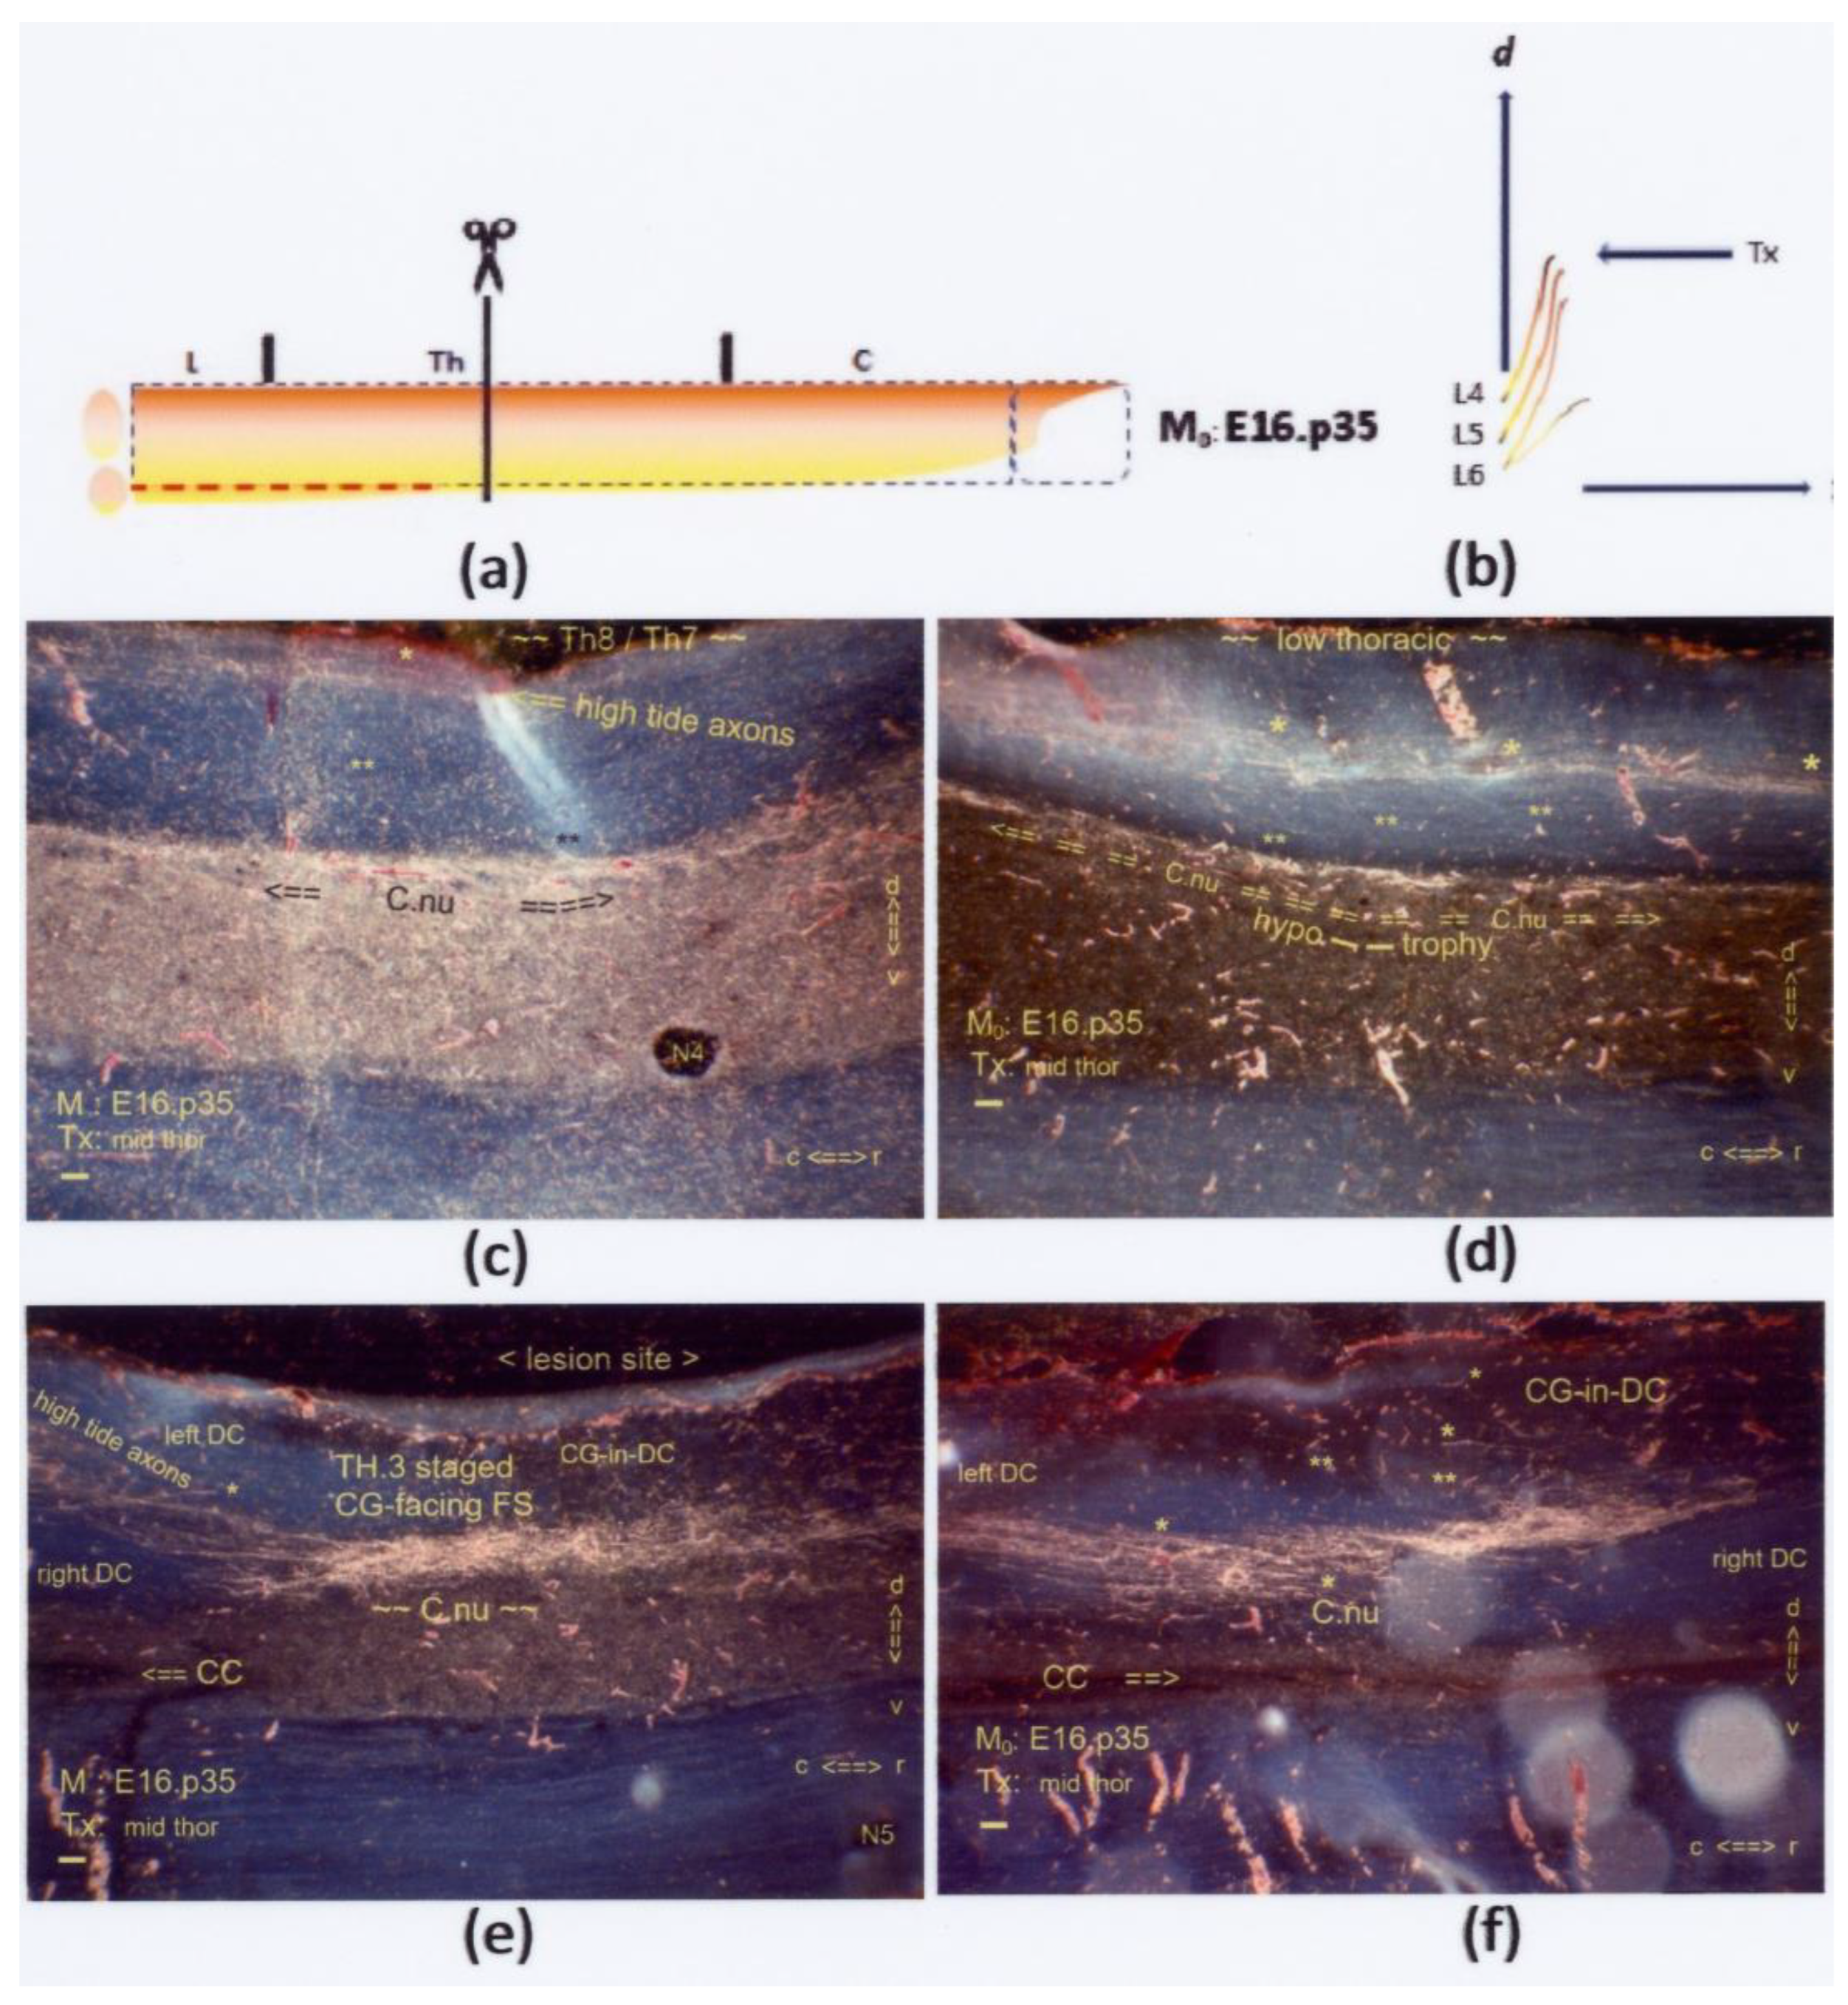
Figure 12.
(
a,
b) The graphics show a mid-thoracic Tx at M
0: E16.p35. The interrupted red line indicates the neuropil’s inaccessibility, related to a hypotrophic state of Clarke’s nucleus. On display are sagittal sections. (
c,
d) Subpially and halfway down the DC, high-tide fibers elongated across the low thoracic DC. A few i-FSs (marked: *) were discernible. A few low-tide colls (marked: **) targeted a hypotrophic Clarke’s nucleus at a dystopic, overly dorsal location. The configuration, morphed by age, might be comparable to the neonatal configurations of the primordial Clarke’s nucleus in
Figure 7c and Figure 14c. (
e,
f) Halfway through the DH, the CG-facing FS contained multistage axons, e.g., TH.1-, TH.2-, and TH.3-staged high- and low-tide axons. The few i-FSs and colls are marked * and **, respectively. Retrograde degeneration of cut TH.3-staged axons at the fringe might also have contributed to the label’s enhancement. This Tx-rendered axon confluence might have encompassed Clarke’s nucleus’s disrupted anlage. All scale bars: 100 μm.
![Anatomia 02 00032 g012]()
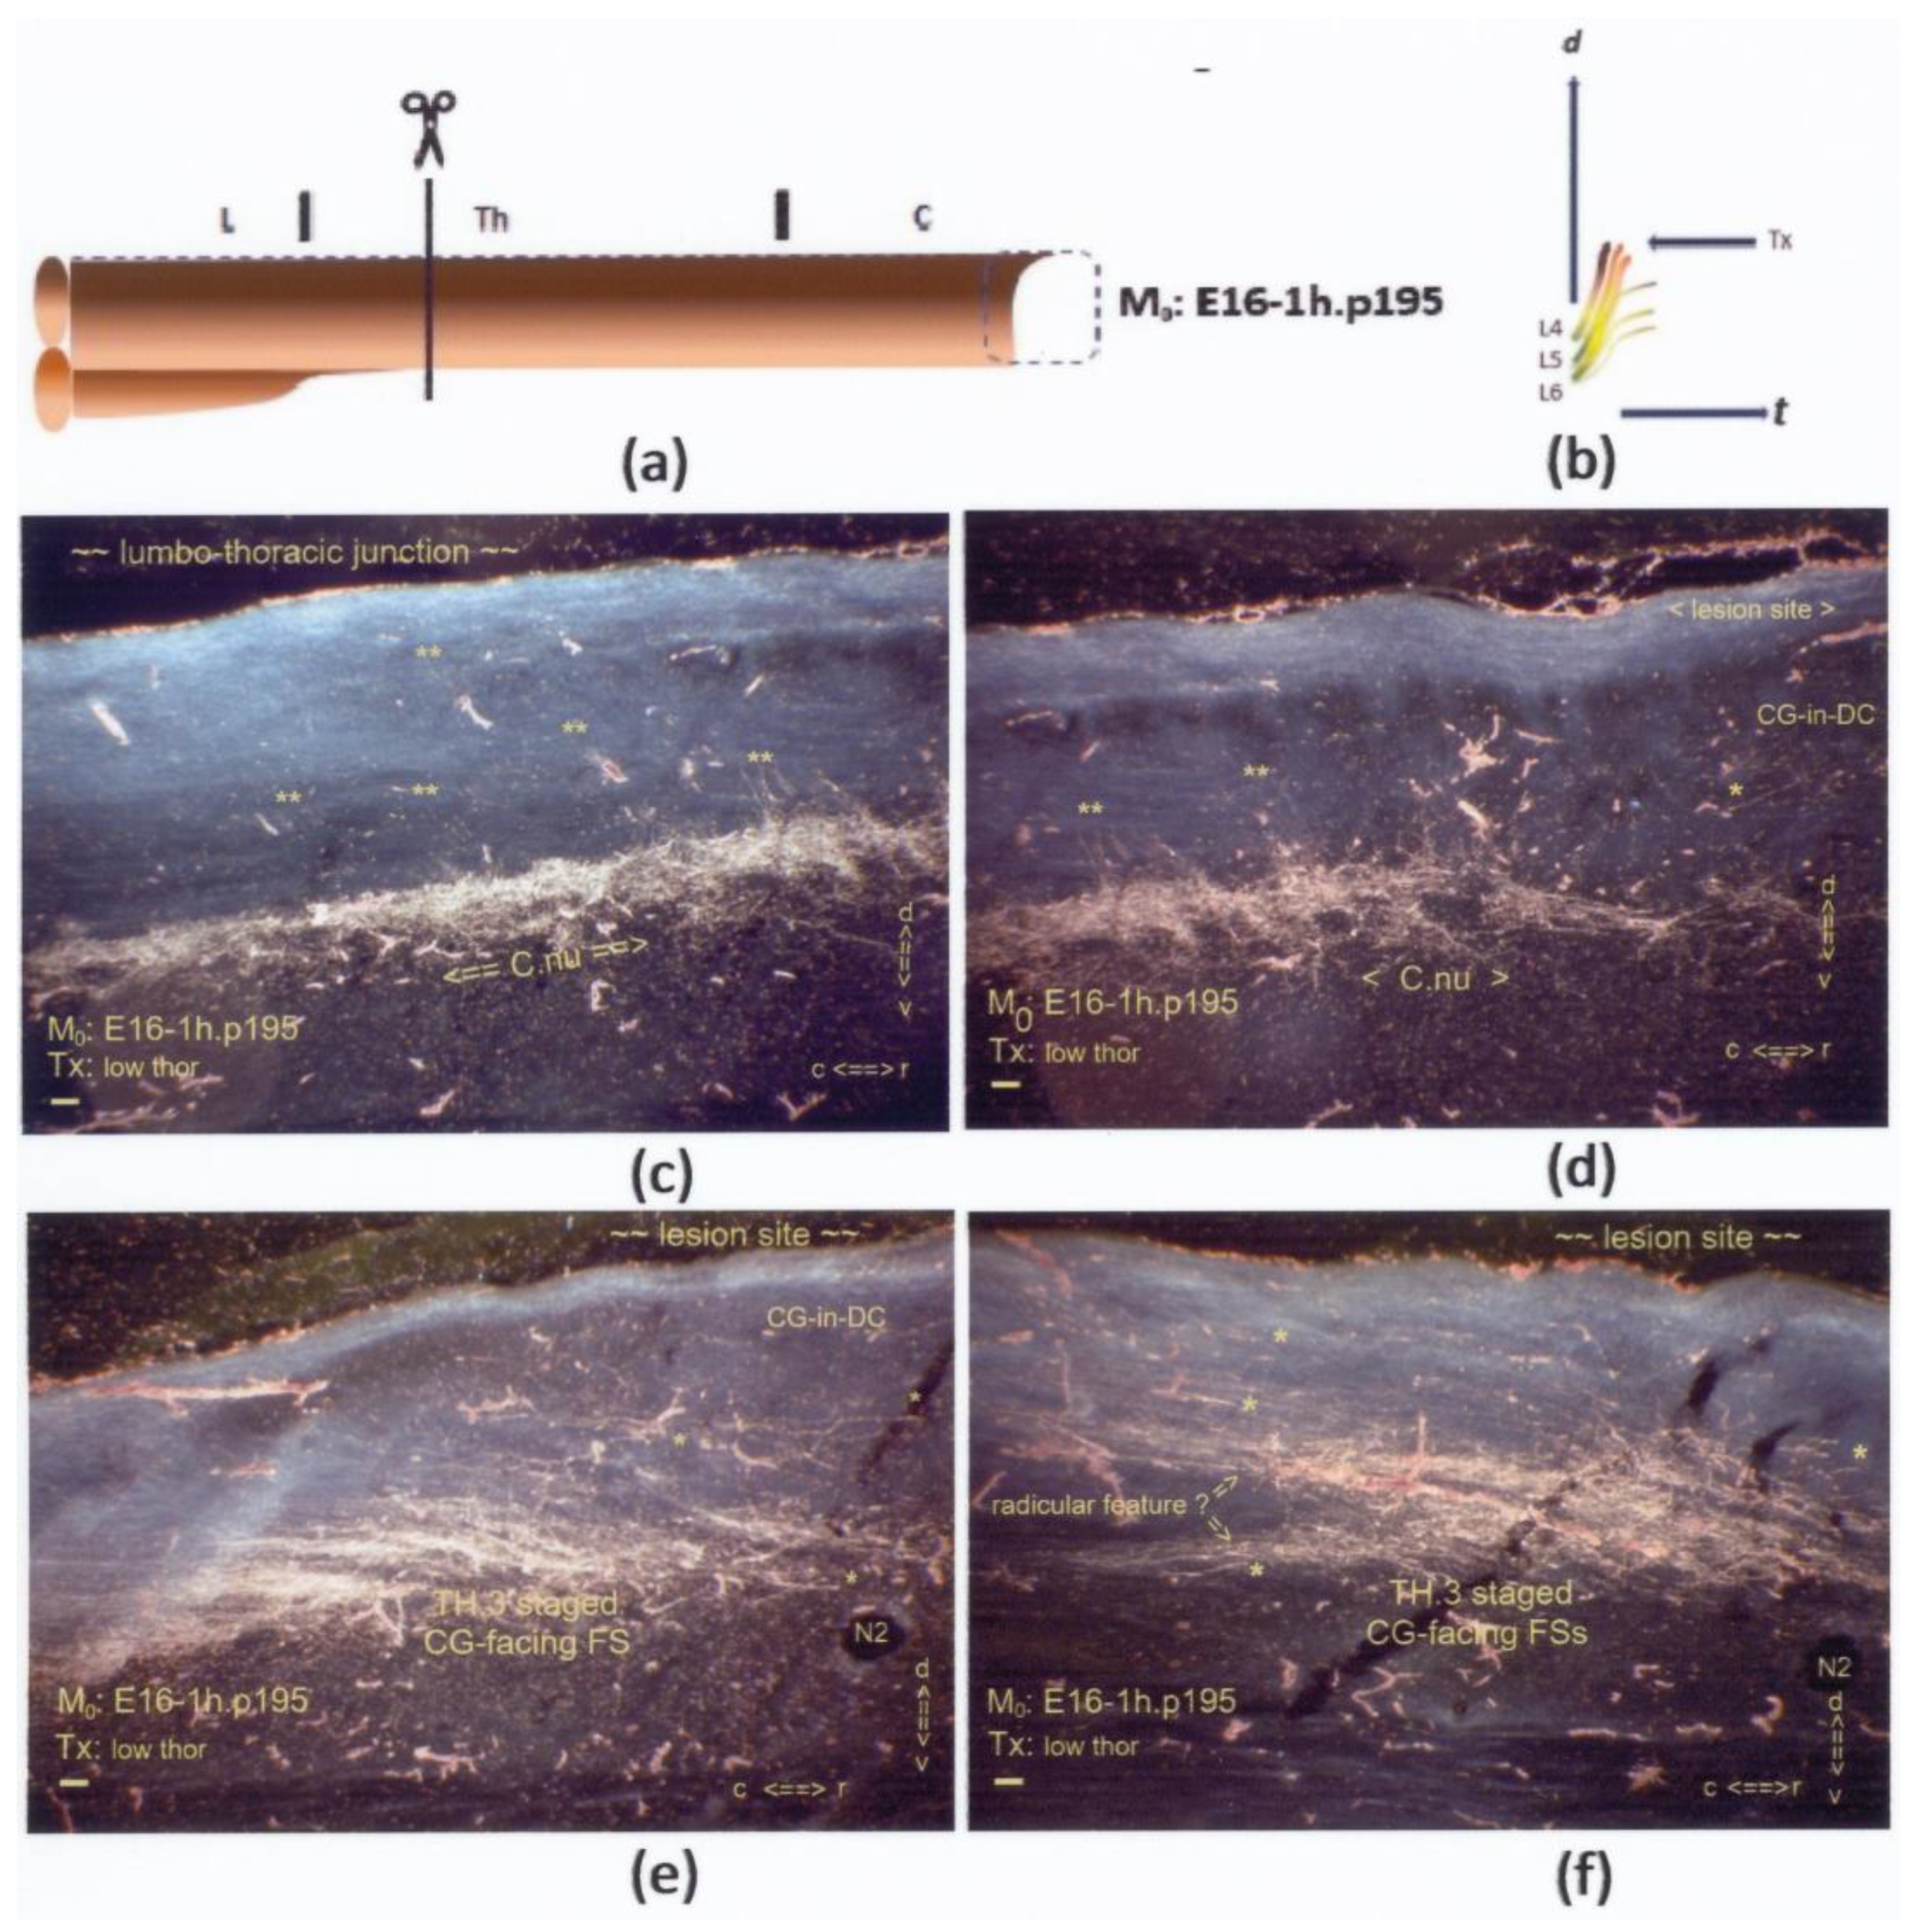
Figure 13.
(a,b) The graphics show a low thoracic Tx at M0: E16-1h.p195. On display are sagittal sections. (c,d) The first two consecutive slides show long oblique colls (marked: **) across the DC-WM, targeting a rather mature state of Clarke’s nucleus at the lumbo–thoracic junction. (e,f) These two slides exhibit the caudal level adjacent to the lesion site at one FOV rostrally to the latter pair of slides. A few i-FSs (marked: *) are discernable. All slides depict left-sided sections. The TH.3-staged axons joined an extensive CG-facing FS on top of Clarke’s nucleus. With the combination of all high-tide and many low-tide cut axons, the enhancement was a matter of course. All scale bars: 100 μm.
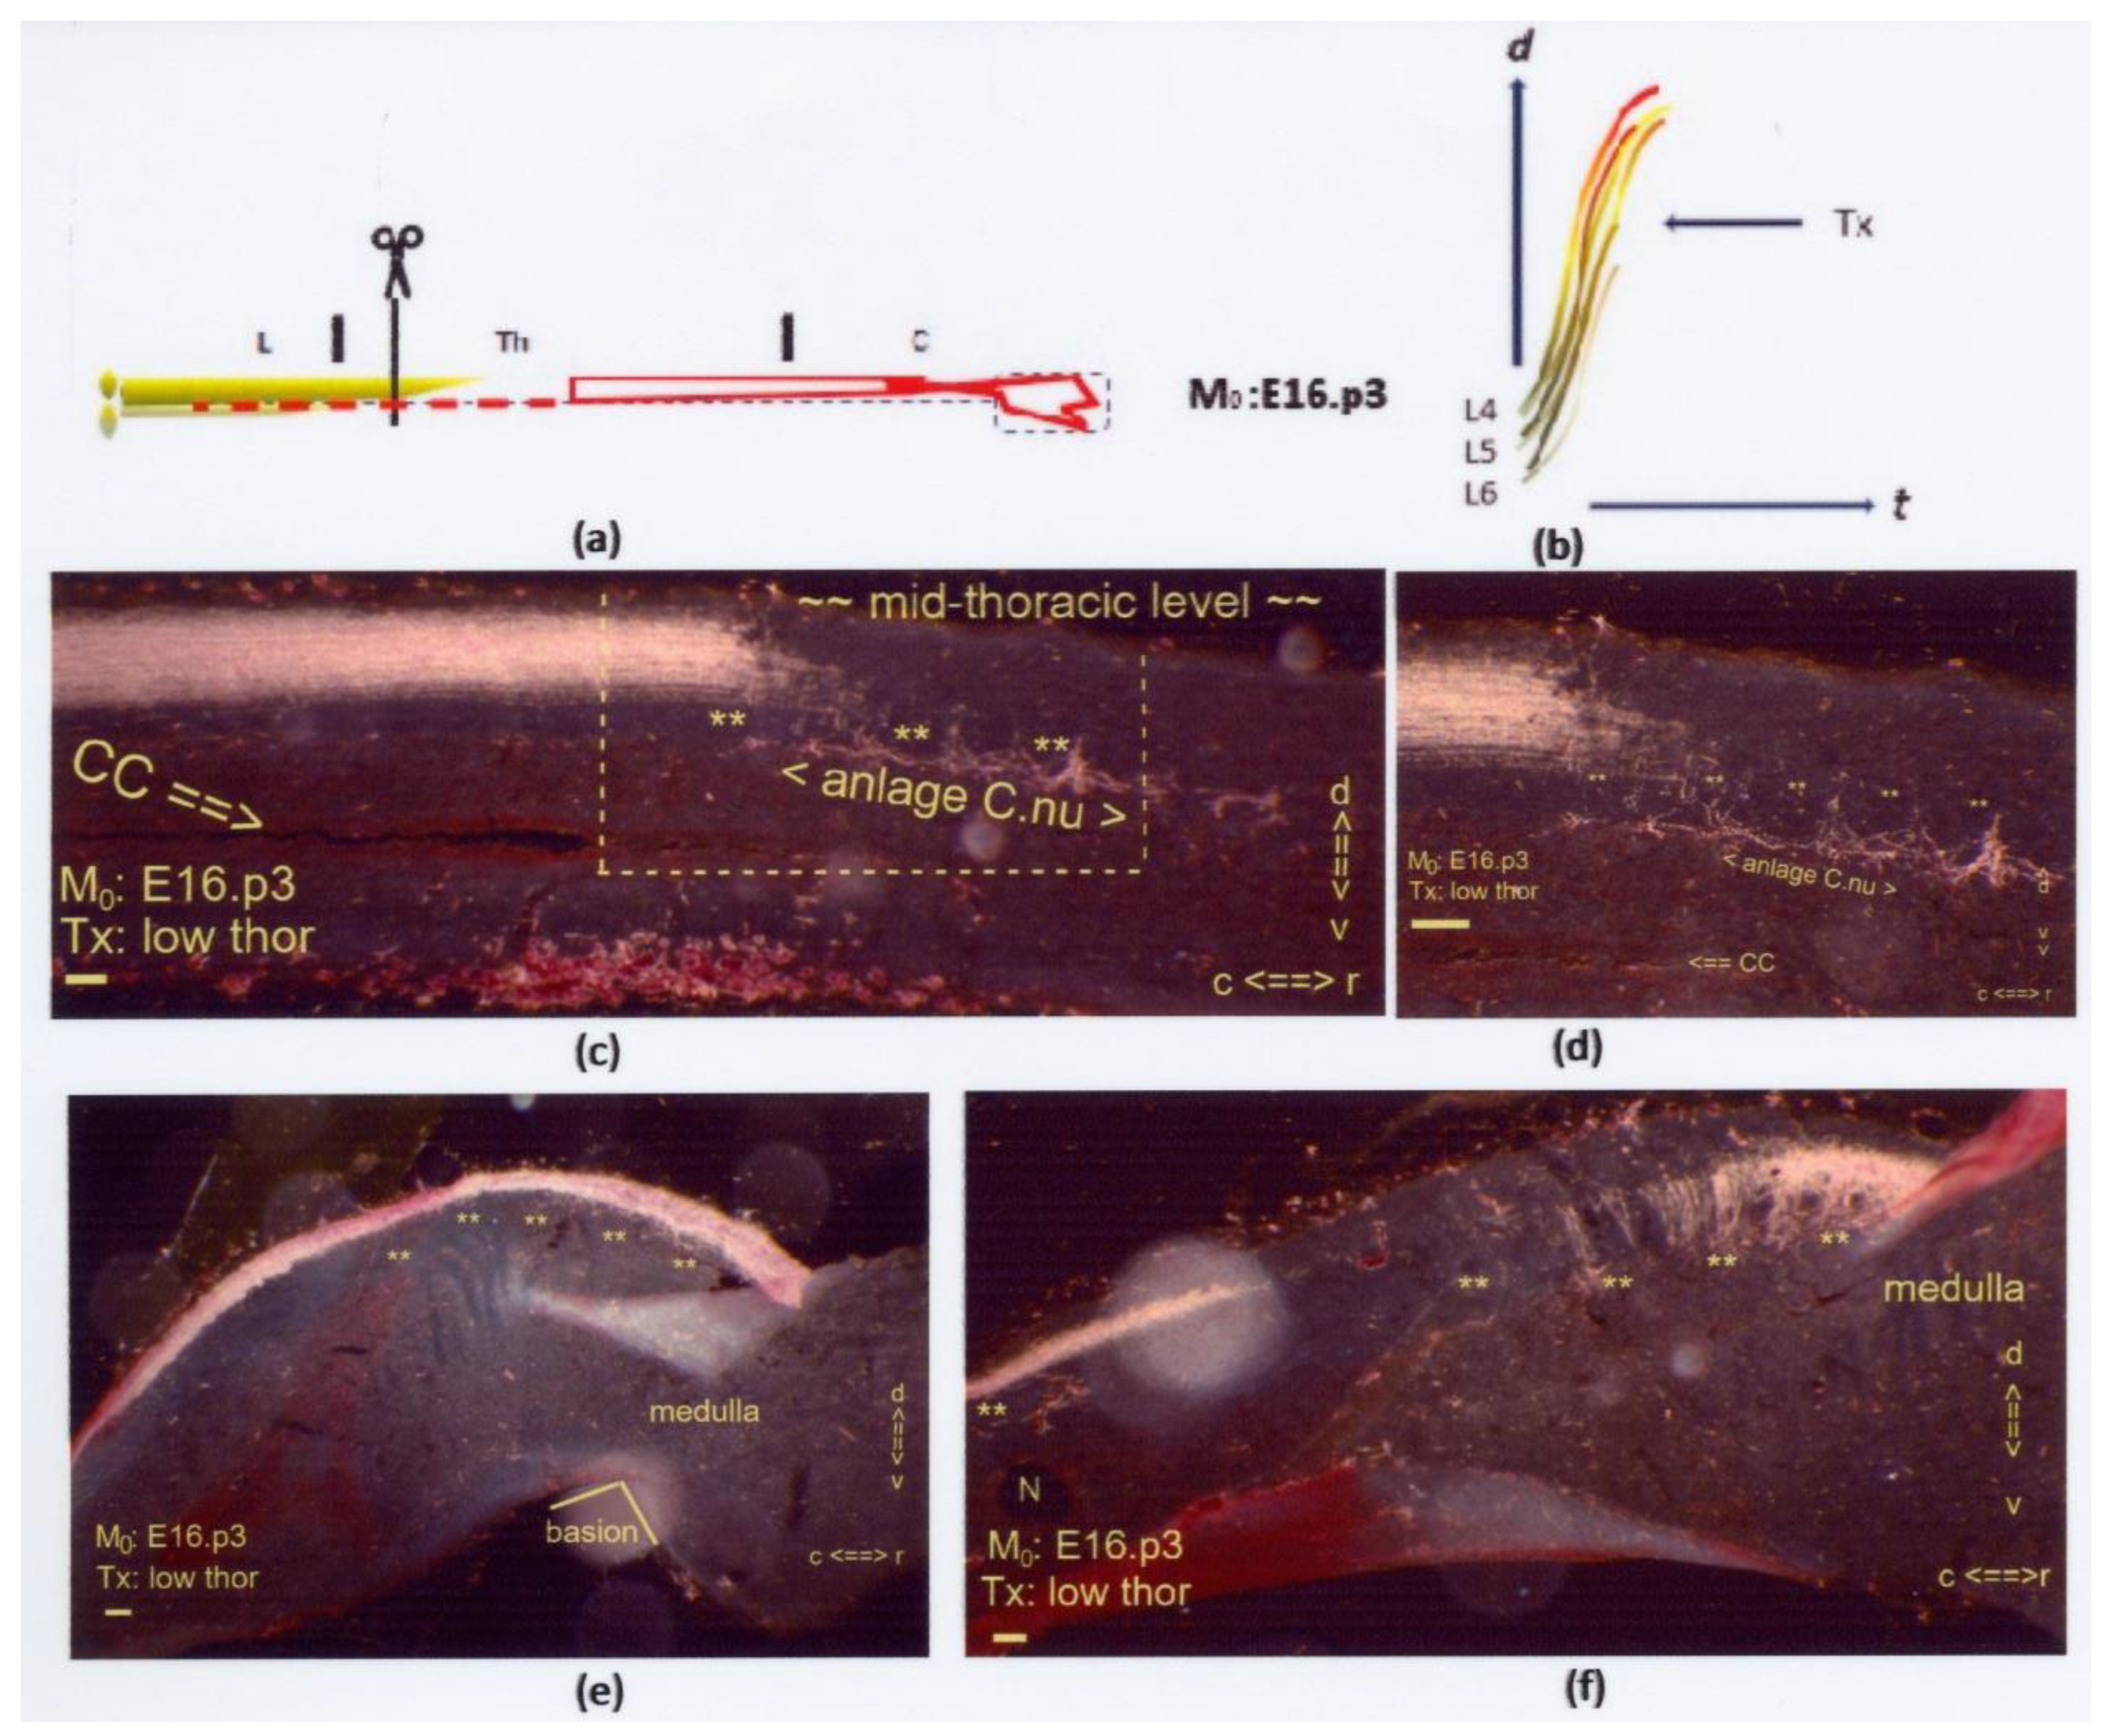
Figure 14.
(
a,
b) The two graphics show a low thoracic Tx at M
0: E16.p3. The interrupted red line indicates the few low-tide axons targeting Clarke’s nucleus next to a possible increased number of long primary afferents in the rostral DC (uninterrupted red line). On display are sagittal sections. The Tx caused an indiscernible lesion site. (
c,
d) The dystopic anlage of Clarke’s nucleus featured hypotrophy at the mid-thoracic level with colls (marked: **). The boxed area duplicates at higher magnification in
Figure 14d. (
e) Dystopic long colls in DC-WM (marked: **) were visible in the cervical region near the medulla. (
f) Multilevel long colls (marked: **) crossed the depth of the DC and penetrated the neuropil caudal from the medulla. The configuration was at variance with the position and level of the gracile nucleus located at the dorsal medullary surface. Hypothetically, the long colls might be considered target-bound low-tide axons. All scale bars: 100 μm.
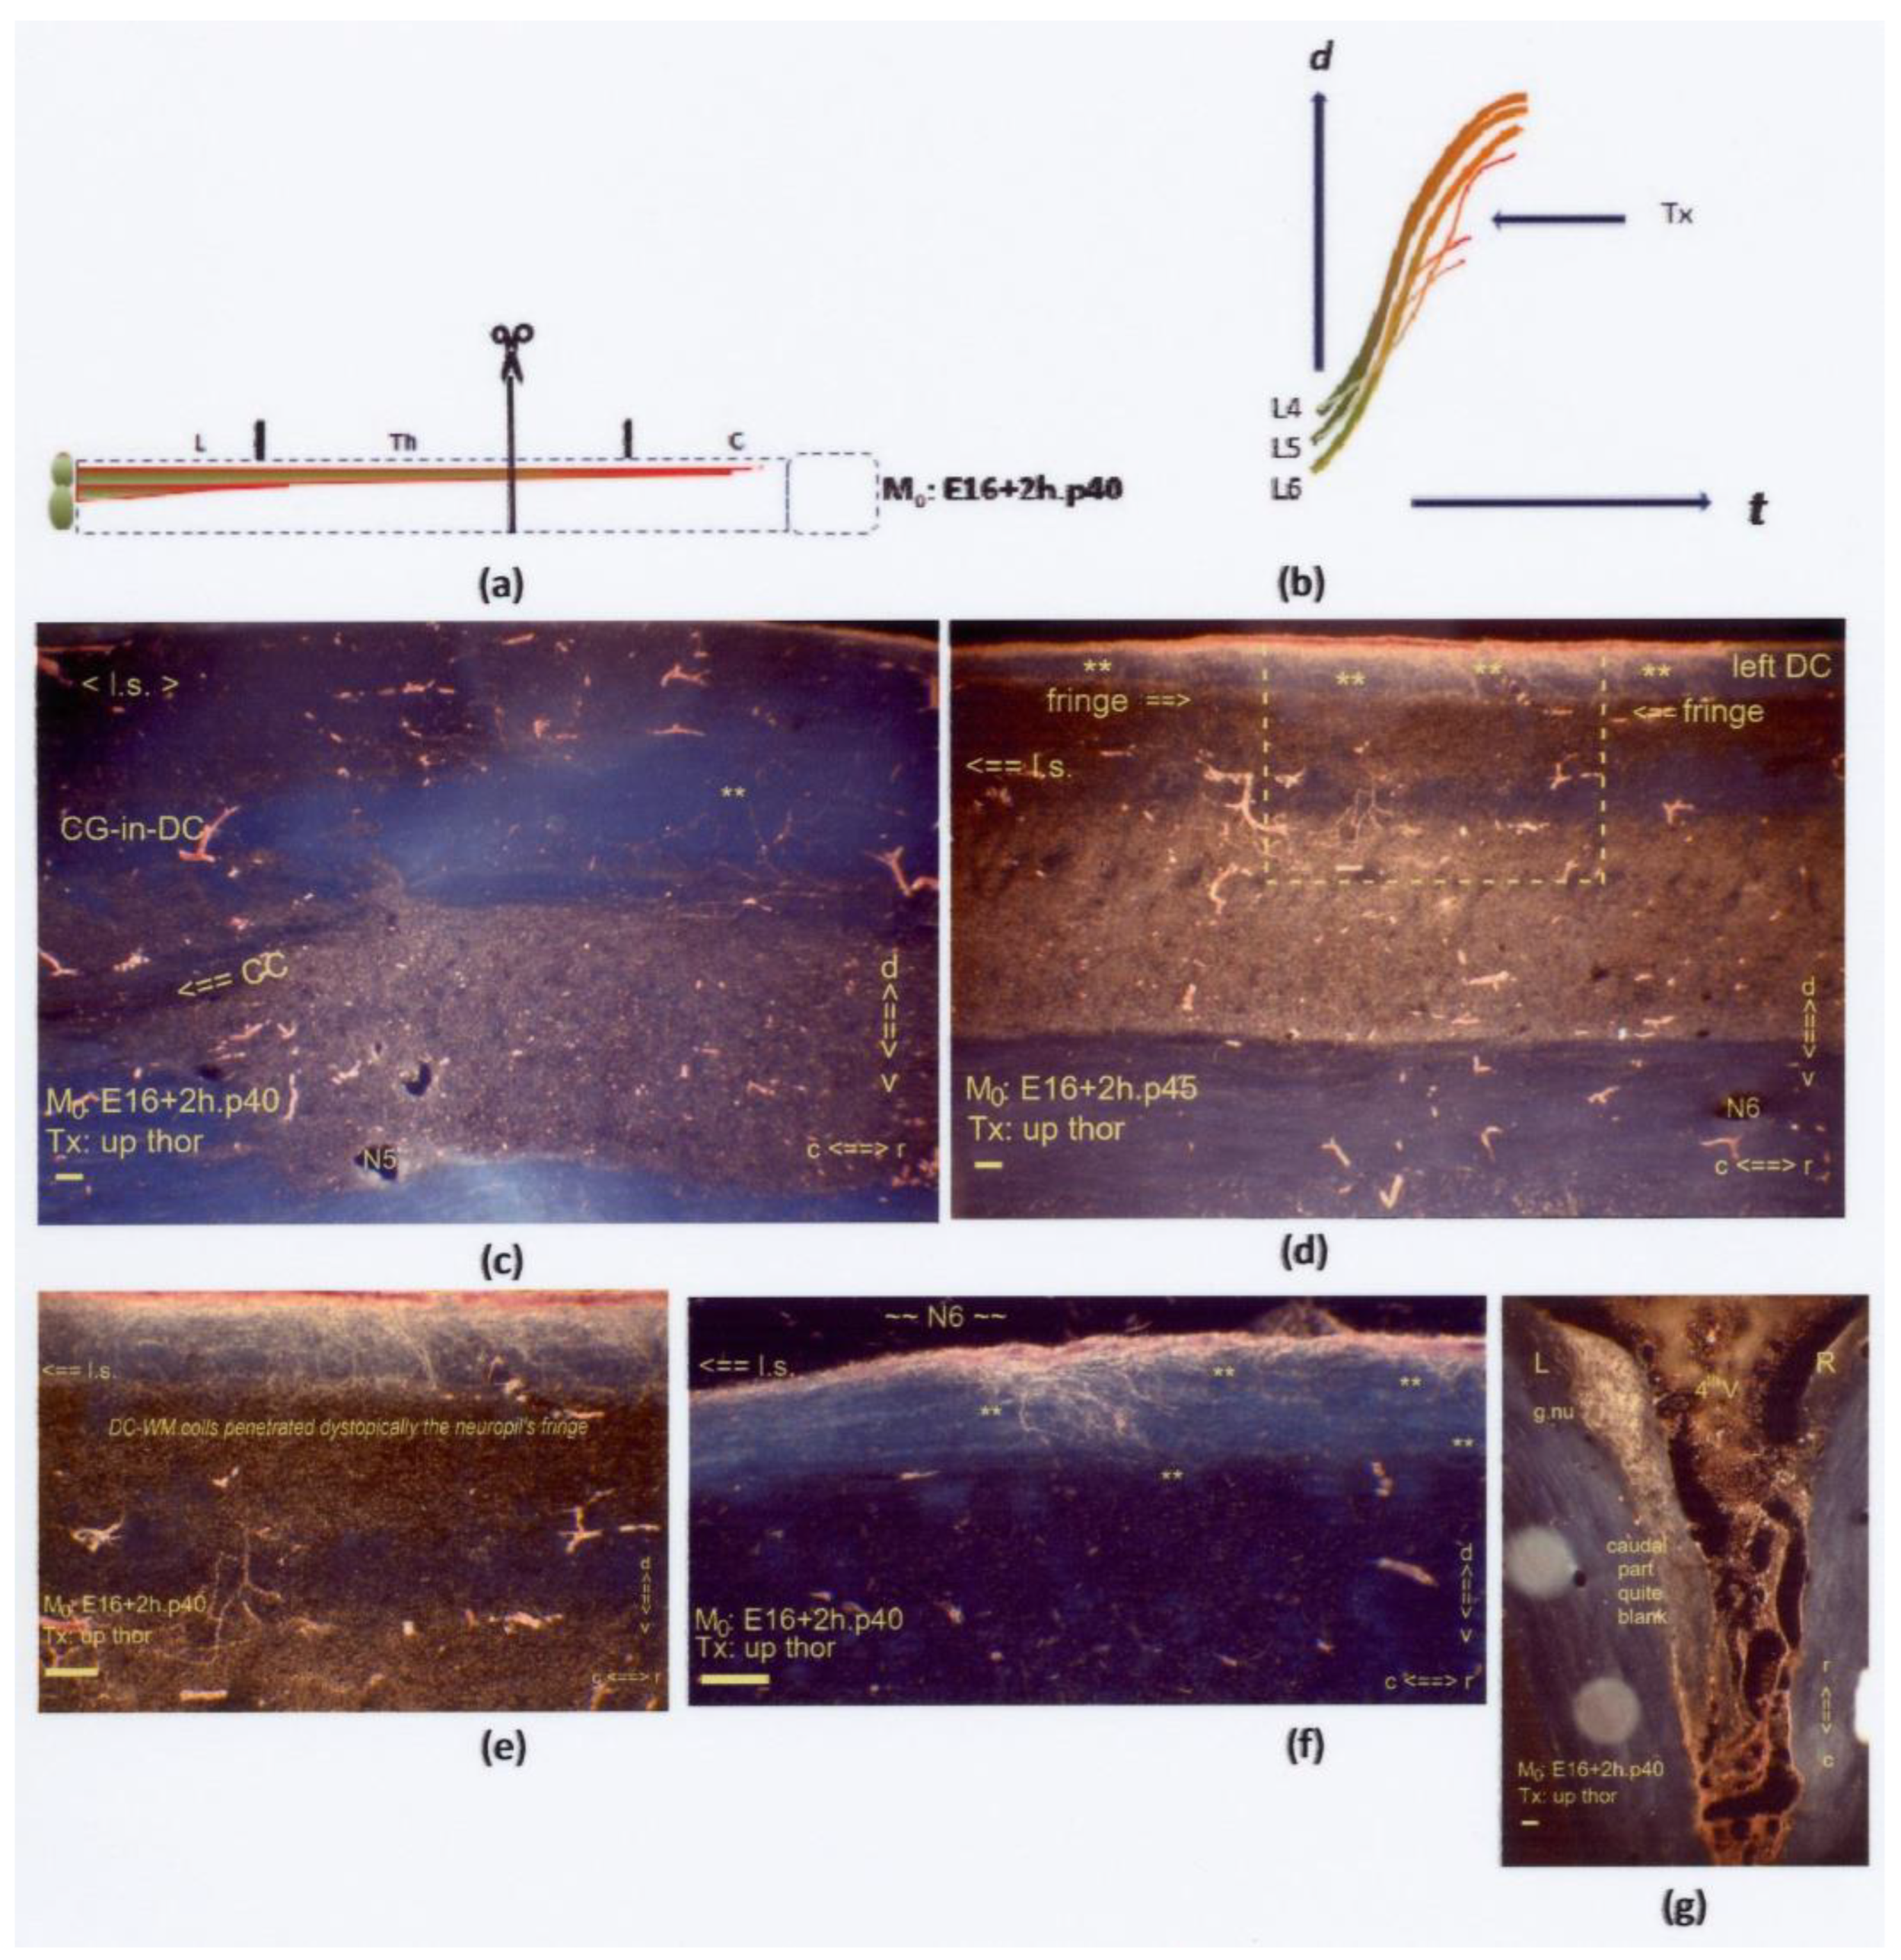
Figure 15.
(a,b) The two graphics show an upper thoracic Tx at M0: E16+2h.p40. The uninterrupted red line delineates the almost inaccessible neuropil. Sagittal sections are displayed, except for (g), which is horizontal. (d,e) Rostrally to the lesion site in (c), DC-WM colls (marked: **) had developed and penetrated the ventral fringe scantily. The development of these axons was dystopic regarding the upper thoracic levels. (d) The dystopic colls (marked: **) are located beyond the lesion site (l.s.). The boxed area is duplicated at higher magnification in (e). (f) Some colls (marked: **) wandered aimlessly within the DC-WM at an upper thoracic level rostral to the lesion site (l.s.). (g) After the Tx, high-tide TH.0-staged axons pioneered the DC and transitioned into the colls, which labeled the rostral part of the left gracile nucleus. The caudal half of the nucleus remained almost blank. All scale bars: 100 μm.
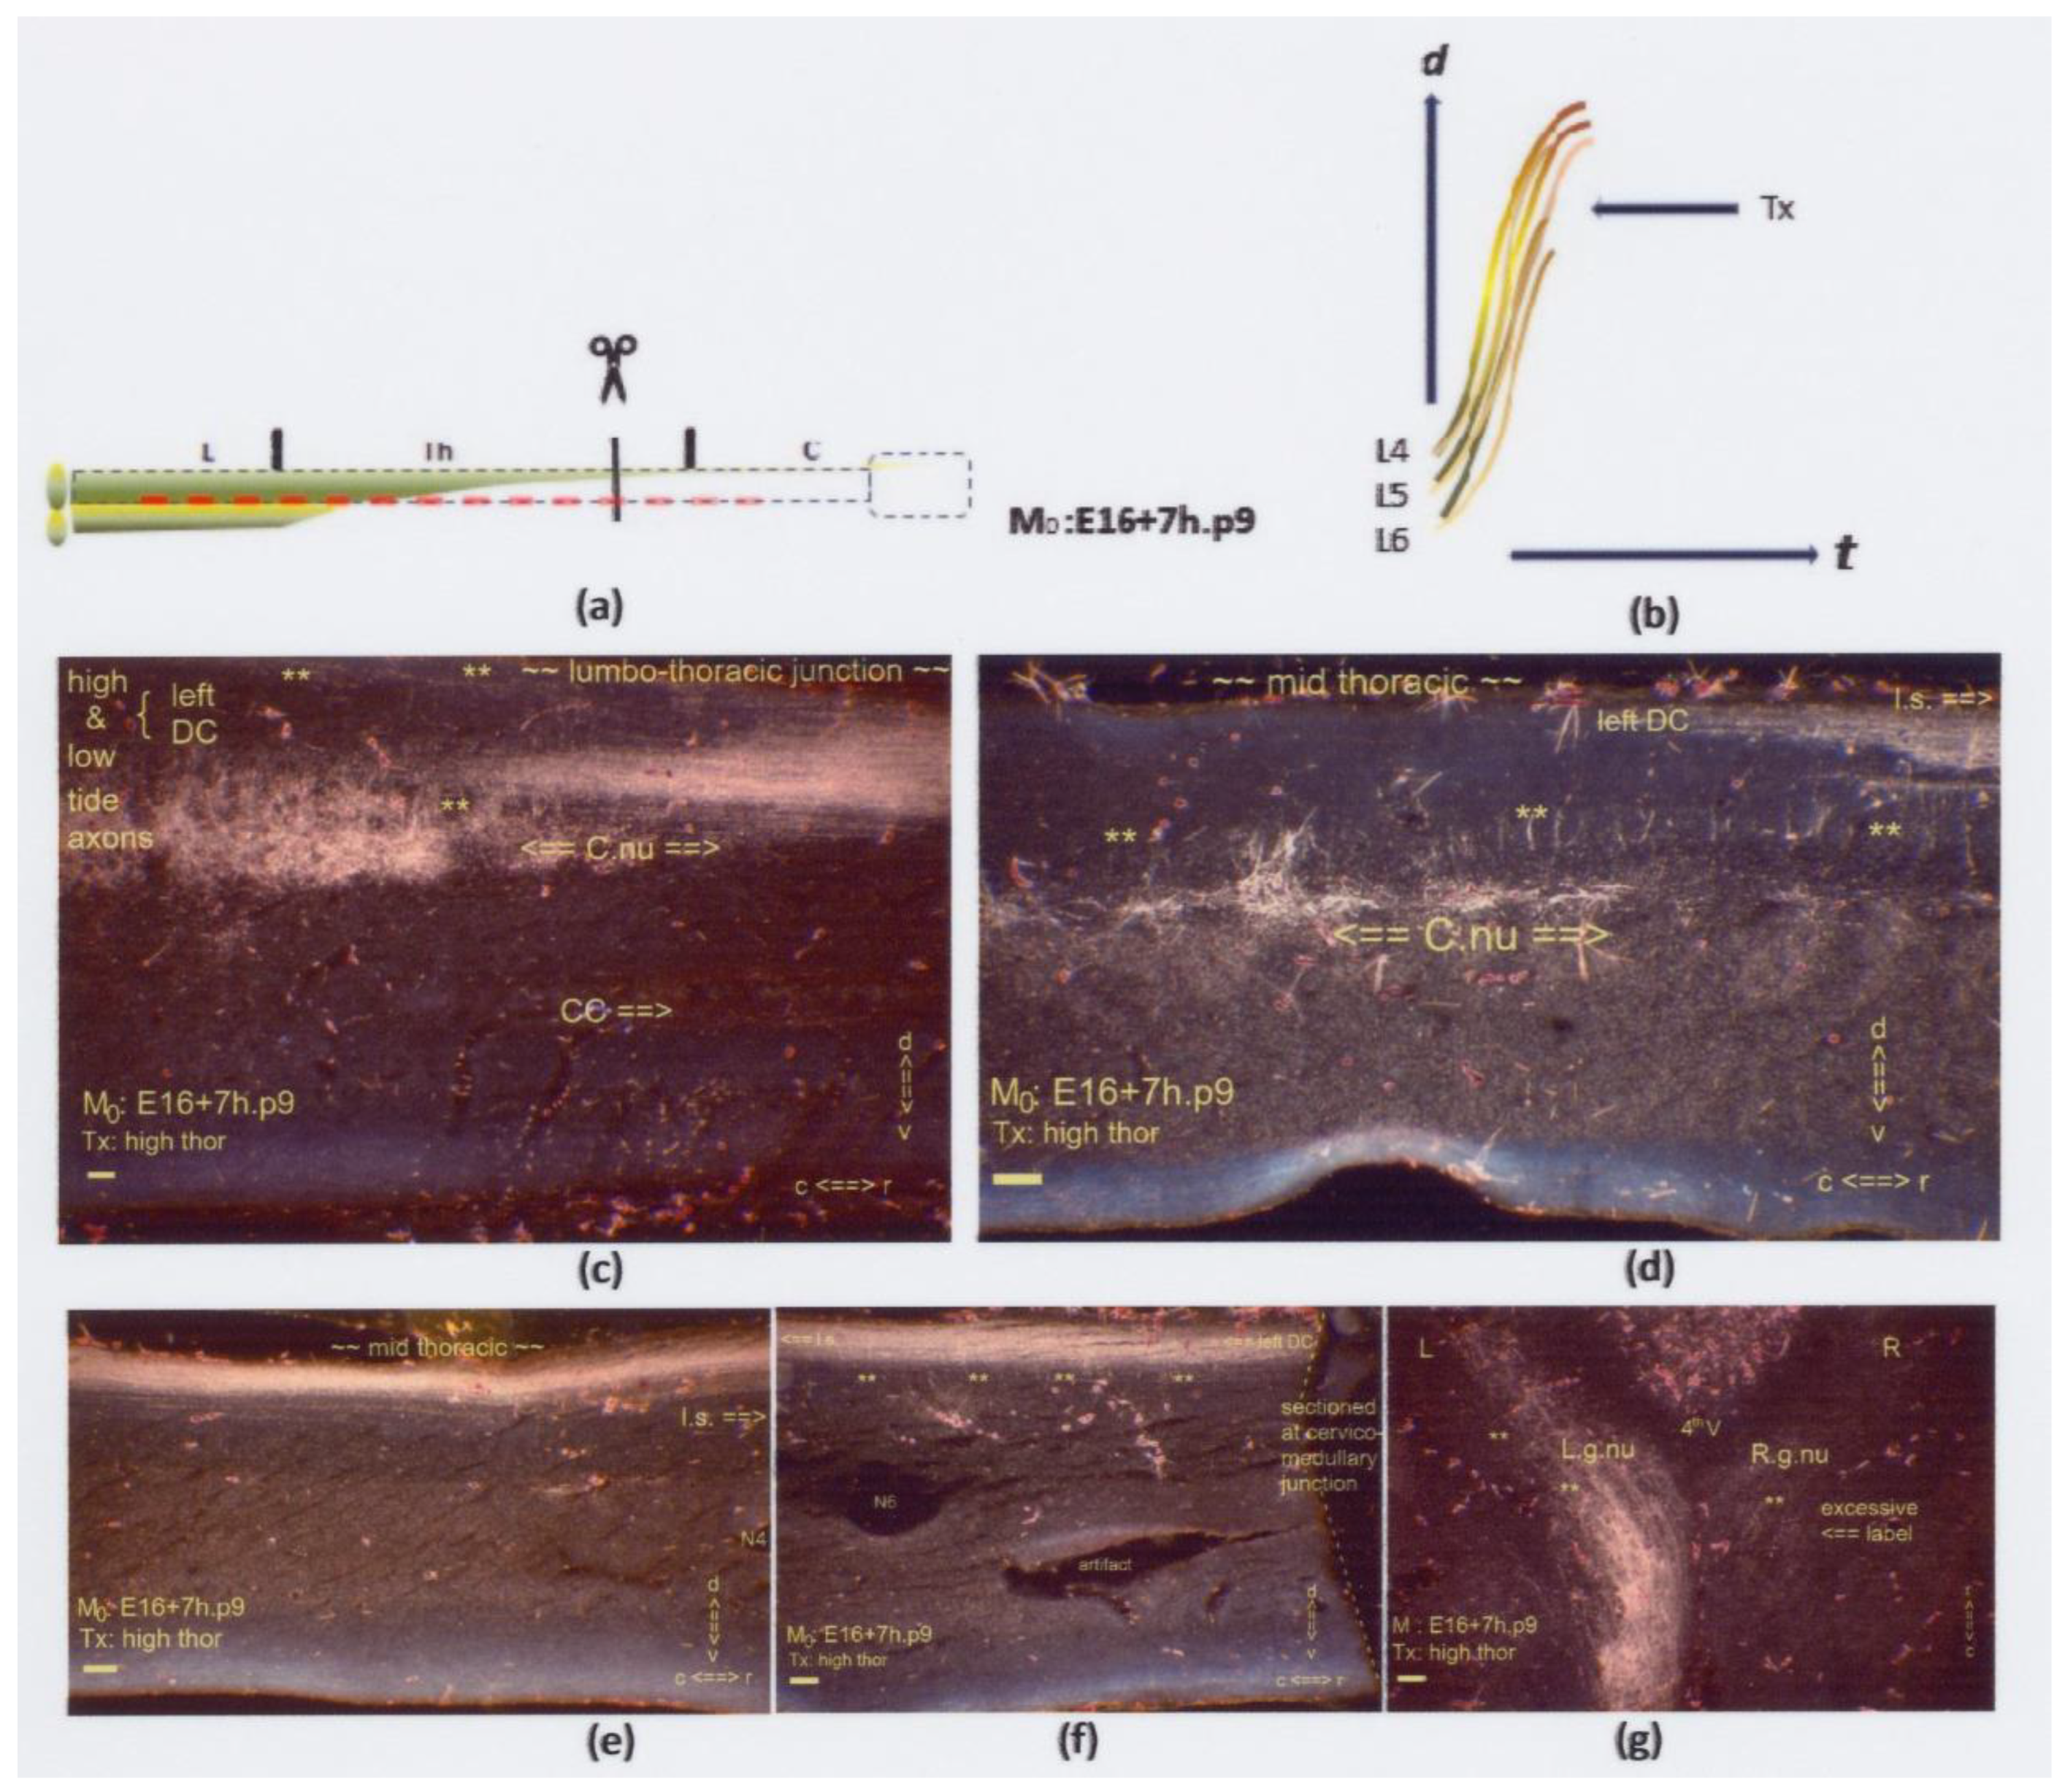
Figure 16.
(a,b) The two graphics show an upper thoracic Tx at M0: E16+7h.p9. The interrupted red line indicates hampered penetration of the caudal neuropil. Sagittal sections are displayed, except for (g), which is horizontal. (c–f) Four slides encompass the spinal cord from the caudal to its thoracic extent. Numerous Th.2-staged colls (marked: **) are at the upper thoracic spinal cord. The lesion site was undetectable. (c) The intermediate gray showed multilevel labeled colls at a location distanced from the CC. (d) The rostral anlage of Clarke’s nucleus was located too dorsally. (e) The high- and low-tide axons might have joined the uniform bundle in the DC. (f) The multilevel colls near the thoracic–cervical junction might contain tentatively dystopic low-tide axons. (g) The gracile nuclei were labeled abundantly by the colls (marked: **), like the lumbar neuropil in Figure (c). The richness of the label on the right side illustrates that the left-sided axons might have contributed to the labeling of the right gracile nucleus, confirming a fetal Tx, though undetected. The features justified classifying a neuropil’s primordial state, illustrated graphically in Figure 18a. All scale bars: 100 μm.
![Anatomia 02 00032 g016]()
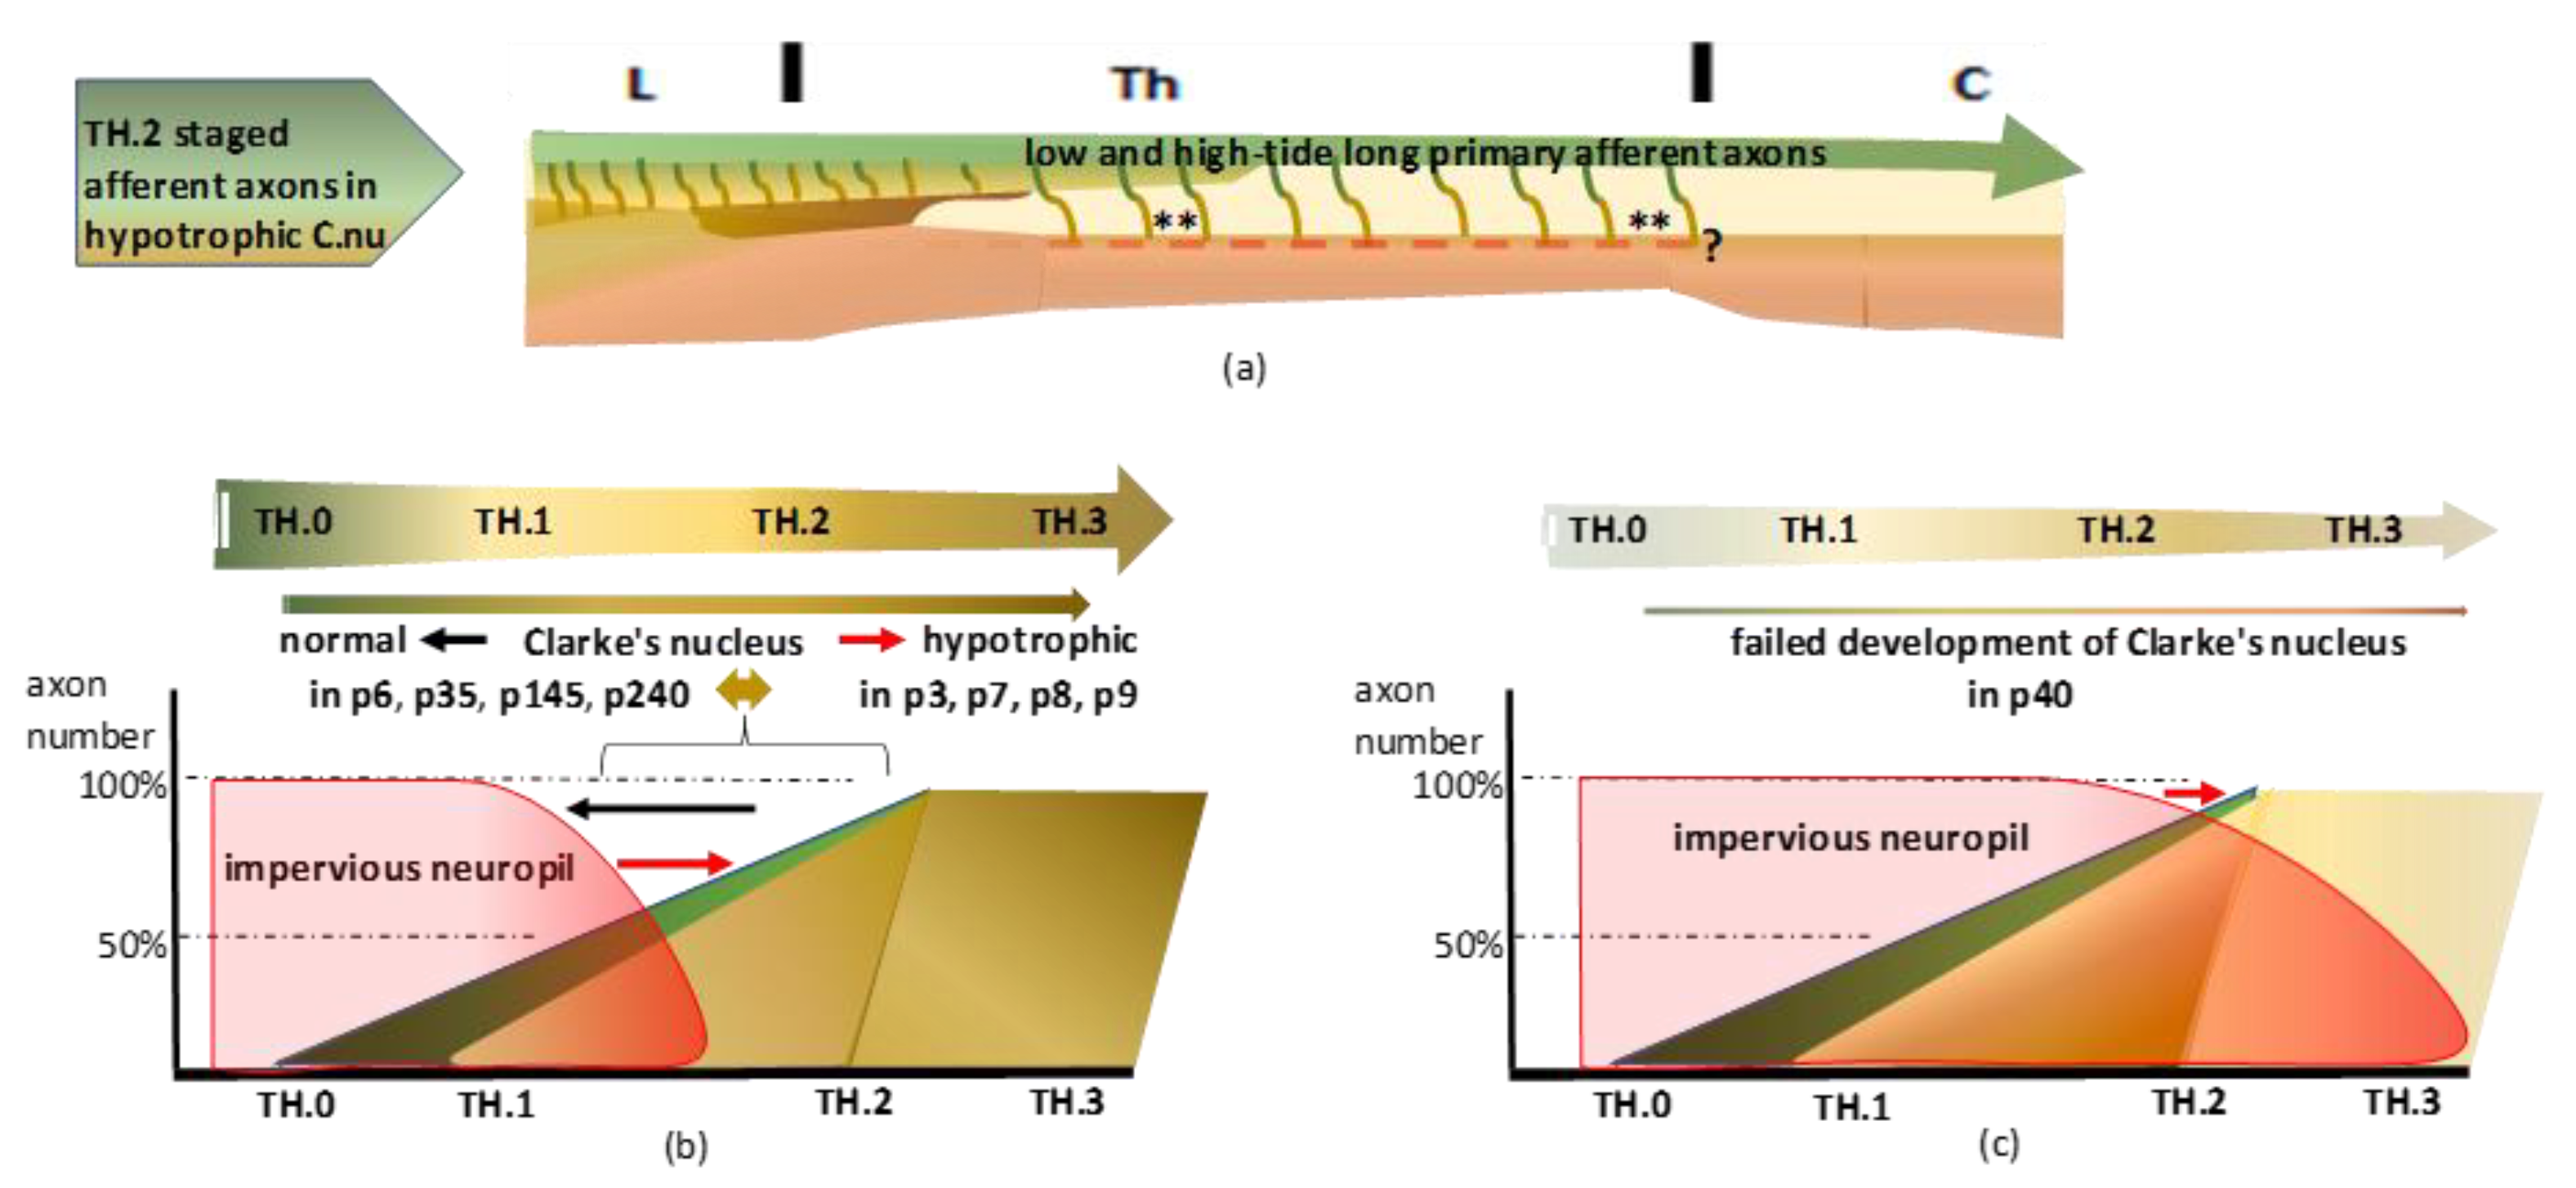
Figure 18.
(
a) The primordial state revealed a common course of high- and low-tide axons yielding numerous DC-WM colls (marked: **) in the upper thoracic spinal cord. After recovery from fetal hypoxia during the microsurgical procedure, the afferent axons might have started or continued pioneering the DC. The interruption might have retarded the neuropil’s ripening, shortening the accessibility period. The hypotrophic Clarke’s nucleus, due to the linked high–low-tide wave axon shift, yielded the upstream DC-WM harboring target-bound long colls. The long colls are shown in
Figure 5c–e,
Figure 7c,d,
Figure 9c–f,
Figure 13c,d,
Figure 14c–f,
Figure 15c–f, and
Figure 16d,f. The red-colored interrupted line indicates the impact of impervious neuropil, yielding similar signs of the primordial state in
Figure 5,
Figure 7,
Figure 9,
Figure 10,
Figure 11,
Figure 12,
Figure 14,
Figure 15,
Figure 16. Concurrently, DC-WM long colls were present at dystopic upper thoracic levels. Their functionality is questioned (marked: ?). (
b) The dissociation of the in neuropil embedded Clarke’s nucleus yielded a primordial state. Variable hyposaturation might have determined Clarke’s nucleus hypotrophy, reflecting the developmental conditions of the long primary afferent system. The listed eight cases are ordered from normal maturity to the hypotrophic state. The seemingly retarded neuropil ripening paralleled the restricted access of low-tide axons and illustrated the primordial state of Clarke’s nucleus. The hypotrophic Clarke’s nucleus is visible in the adult cases p35 and p240. (
c) Severe retardation prevented the long primary afferent axons from penetrating the neuropil. Almost blank neuropil confirms a total absence of Clarke’s nucleus, shown in the p40 case. The uninterrupted red line in
Figure 15a indicates that the inaccessibility might be a lasting feature. Considering the reverse of retardation, accelerated afferent axon development might present with similar features (see
Section 4.2.4).
![Anatomia 02 00032 g018]()
Figure 19.
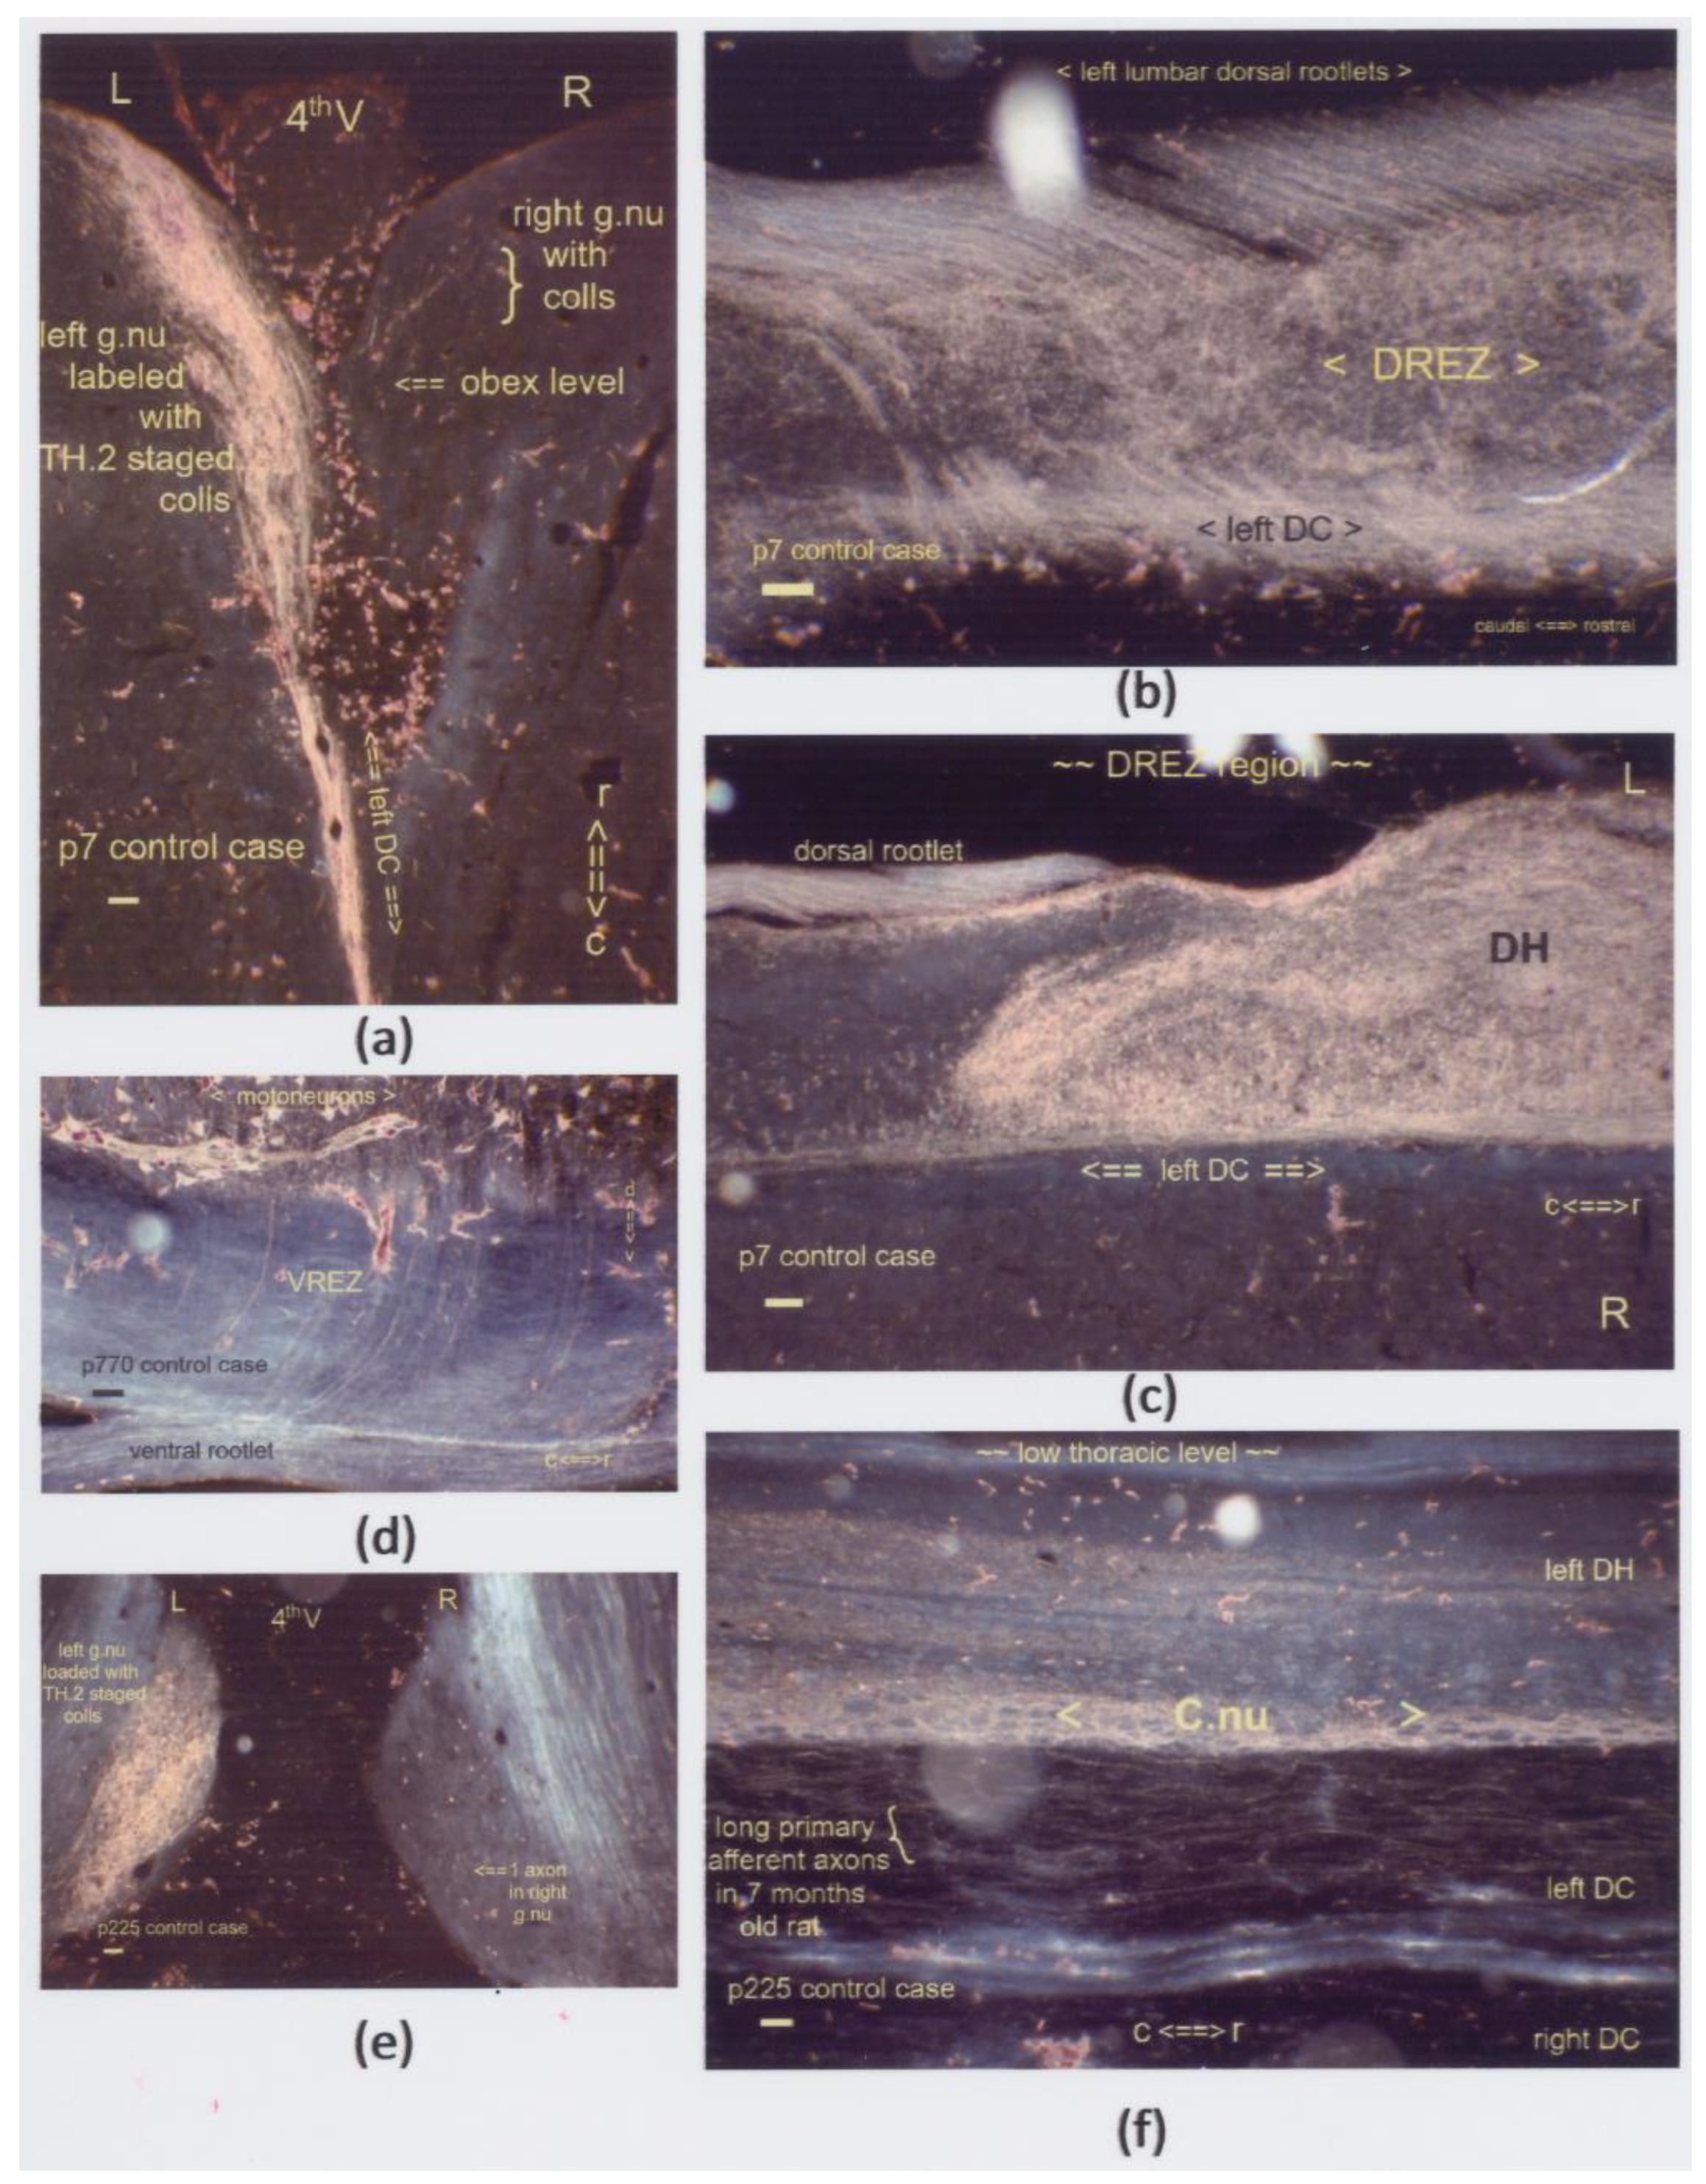
(a–f) Sagittal sections display boosted label in the DH’s central gray. These lumbar segments depict the levels just rostrally to the DREZ in five cases, which survived from one week to almost two years. (a,b) The p7 neonate exhibits the impact of an inadvertently oversized Tx at a low thoracic level with an additional lesion, i.e., a p2 transection of the left sciatic nerve. The label was present excessively throughout the central gray, delivered by antegrade and retrograde transport of DRG and motoneurons. The HRP was applied to the central stump of the left sciatic nerve and traced via the L4–L6 dorsal and ventral roots. This spinal cord’s caudal stump showcased label enhancement after preconditioning with a spinal cord and sciatic nerve transection. (c–f) The Tx sites were located at a few segments rostrally, except for the thoracic level in Figure (d). The enhanced label from colls (marked: **) remained a noticeable feature for almost two years in the caudal DH down to the intermediate gray. All scale bars: 100 μm.
Figure 19.
(a–f) Sagittal sections display boosted label in the DH’s central gray. These lumbar segments depict the levels just rostrally to the DREZ in five cases, which survived from one week to almost two years. (a,b) The p7 neonate exhibits the impact of an inadvertently oversized Tx at a low thoracic level with an additional lesion, i.e., a p2 transection of the left sciatic nerve. The label was present excessively throughout the central gray, delivered by antegrade and retrograde transport of DRG and motoneurons. The HRP was applied to the central stump of the left sciatic nerve and traced via the L4–L6 dorsal and ventral roots. This spinal cord’s caudal stump showcased label enhancement after preconditioning with a spinal cord and sciatic nerve transection. (c–f) The Tx sites were located at a few segments rostrally, except for the thoracic level in Figure (d). The enhanced label from colls (marked: **) remained a noticeable feature for almost two years in the caudal DH down to the intermediate gray. All scale bars: 100 μm.
![Anatomia 02 00032 g019]()
Table 1.
(a) tallies 27 cases processed successfully after HRP tracing. Column 1 entails fully processed experiments, denoted by a threefold letter-and-number combination, showing the serial number first and the follow-up period third. The Tx day (M
0) relates to the conception day noted in the middle, specified by the hour in a few. Column 2 colors the success ratios in red (count of Txs: fetus count = the litter size). Fewer than expected dead neonates resulted from stillborn and cannibalism. Column 3 lists eleven cases displayed in Figures 6–16 and 19. Column 4 lists thirteen cases with uncovered features of upstream development. Cases with dissociated neuropil are listed in column 5. (b) tallies 18 cases eligible for tracing procedures offering minor data due to technical flaws and mishaps. We skipped five cases with a DREZ lesion. the left sciatic nerve had been transected at the caudal rim of the m.gluteus on p2 as an intended preconditioning lesion. Assessment of hypoxic preconditioning in the CNS dates from ten years ago (see
Section 3.2.4 and
Section 4.2.4).
| 1 | 2 | 3 | 4 | 5 | 1 | 2 | 3 | 4 | 5 |
|---|
| Case | litter-ratio | Figures | upstream | dissociated | Case | litter-ratio | Figures | upstream | dissociated |
| | (Tx:n = p0) | | features | neuropil | | (Tx:n = p0) | | features | neuropil |
| C39.E18.E20 | N/A | | | | C44.Sx.p4 | N/A | | | |
| D20.D17.E18 | N/A | | | | D14.D5.E21 | N/A | | | |
| D15.E17.E20 | N/A | | | | P1.p48 | (2:15 = 14 + 1 †) | | | |
| N45.E17.p8 | (1:4 = 4) | | | | P20.p600 | (2:9 = 8) | | | |
| N46.E18.p10 | (2:15 = 15) | | | | R9.S6.p44 | (4:11 = 11) | | | |
| T8.E17.p180 | (2:15 = 15) | | | | R9.s4.p44 | (4:11 = 11) | | | |
| T16.E17.p40 | (2:15 = 13) | | | | T9.2.p225 | (3:15 = 12) | | | |
| T20.E17.p700 | (1:9 = 7) | Figure 19f | X | X | T12.p7 | (2:15 = 15) | | | |
| T23.E16.p360 | (1:6 = 6) | | | | T13.p7 | (2:14 = 12) | Figure 19a,b | X | X¹ |
| T45.E16.p7 | (1:4 = 4) | Figure 6 | | | T15.p305 | (3:16 = 14) | Figure 19e | X | X |
| T46.E16.p3 | (1:13 = 12 + 1 †) | Figure 14 | X | X | T34.p100 | (1:8 = 8) | | | |
| T47.E16.p4 | (1:2 = 2) | Figure 8 | X | | T42.p240 | (1:9 = 9) | | | |
| T60.E16+12h.p135 | (1:10 = 10) | | | | T62.p17 | (2:11 = 11) | | | |
| T77.E16.p35 | (1:12 = 12) | Figure 12 | X | | T65.p48 | (1:10 = 10) | Figure 19c | X | X |
| T78.E16+2h.p40 | (1:8 = 7) | Figure 15 | X | X | T68.p370 | (1:11 = 11) | | | |
| V2.E16-1h.p240 | (2:14 = 13) | Figure 11 | X | | V1.p600 | (1:10 = 9) | | | |
| V3.E16-1h.p195 | (1:13 = 12 + 1 †) | Figure 13 | X | | W6.p32 | (2:14 = 14) | | | |
| V31.E16-3h.p145 | (1:13 = 13) | Figures 10 and 19d | X | X | W17.p64 | (1:14 = 14) | | | |
| V38.E16-3h.p210 | (1:15 = 15) | | | | | | | | |
| V51.E16-4h.p2 | (1:9 = 9) | | X | | | | | | |
| V63.E16-2h.p1.5 | (1:11 = 11) | | | | | | | | |
| V67.E16+7h.p9 | (1:7 = 7) | Figure 16 | X | X | | | | | |
| V72.E16+8h.p1.5 | (1:14 = 14) | | X | | | | | | |
| W2.E16-8h.p8 | (2:10 = 10) | Figure 7 | X | | | | | | |
| W2.E16-5h.p42 | (2:10 = 10) | | | | | | | | |
| W14.E16-8h.p14 | (2:15 = 15) | | | | | | | | |
| W20.E16-9h.p6 | (2:11 = 9) | Figure 9 | X | | | | | | |
| (a) | (b) |


