

Nature and Regularities of the Orthorhombic α″-Phase Formation in Binary Titanium Alloys
M.N. Mikheev Institute of Metal Physics, Ural Branch, Russian Academy of Sciences, Yekaterinburg 620108, Russia
Alloys 2023, 2(3), 148-156; https://doi.org/10.3390/alloys2030011
Submission received: 22 March 2023
/
Revised: 22 May 2023
/
Accepted: 3 July 2023
/
Published: 11 July 2023
Abstract
:A systematic study of the phase composition of quenched binary titanium alloys with d-metals of groups 5–11 from periods four to six was carried out using the methods of X-ray diffraction analysis. It was found that the formation of the orthorhombic α″-phase depends on the position of the alloying metal in the periodic table. The formation of the α″-phase occurs only in the systems Ti-V, Ti-Nb, Ti-Mo, Ti-Ru, Ti-Ta, Ti-W, Ti-Re, Ti-Os and Ti-Ir, and in other systems, it does not occur. It was found that the critical parameter for the formation of the α″-phase is the difference in the size of titanium atoms and those of the alloying metal {(rTi − rMe)/rTi 100%}. The formation of the α″-phase occurs only in systems where this value is lower than 9 at.%.
1. Introduction
The formation of the orthorhombic α″-phase in titanium alloys is a fundamental problem due to its significant influence on the mechanical properties. The formation of the orthorhombic α″-phase in titanium alloys was initially identified in [1] based on the splitting of certain diffraction lines of the α′-phase in the X-ray diffraction patterns of the quenched Ti-8 mass.% Mo alloy. Currently, it is known that this phase forms in many binary titanium alloys with various d-metals, as well as in ternary and multicomponent alloys containing these components [2,3,4,5,6,7,8,9]. The existence of the orthorhombic α″-phase in zirconium alloys was established much later [10,11,12,13]. Several studies have proposed different hypotheses regarding the nature of the α″-phase in titanium alloys and the conditions of its formation [2,14,15]. The viewpoints presented in these works are contradictory and do not provide a clear understanding of the nature of the formation of the orthorhombic α″-phase and the changes in its main characteristics depending on the type and content of the alloying metal.
Recently, there have been a large number of studies devoted to various aspects of multicomponent titanium alloys [16,17,18,19]. In some of them, the formation of the α″-phase was observed. However, the simultaneous presence of different d-metals in an alloy makes it difficult to assess the role of each metal in the formation of the α″-phase. Solving this problem requires studying the phase composition only in binary titanium alloys with all d-metals. At present, such data are not available in the literature.
Therefore, the aim of this study was to systematically investigate the phase composition and the conditions influencing the formation of the orthorhombic α″-phase and its extent in quenched binary titanium alloys with d-metals from groups 4–11 from periods four to six.
2. Materials and Experiments
A series of binary titanium alloys containing different amounts of V, Cr, Mn, Fe, Co, Ni, Cu, Nb, Mo, Ru, Rh, Pd, Ta, W, Re, Os, Ir and Pt were prepared for the study. The alloys were prepared from iodide Ti (99.96 wt.%), V (99.7 wt.%), Cr (99.95 wt.%), Mn (98.53 wt.%), Fe (99.84 wt.%), Co (99.98 wt.%), Ni (99.99 wt.%), Cu (99.99 wt.%), Nb (99.6 wt.%), Mo (99.9 wt.%), Ru (99.9 wt.%), Rh (99.9 wt.%), Pd (99.91 wt.%), Ta (99.5 wt.%), W (99.95 wt.%), Re (99.9 wt.%), Os (99.99 wt.%), Ir (99.9 wt.%) and Pt (99.9 wt.%). All the alloys were melted in a furnace with a tungsten non-expendable anode in a helium atmosphere. The specimens were homogenized in the β-phase region for 3 h under vacuum conditions of 1 × 10⁻³ Pa and then quenched in iced water. The phase composition of the quenched alloys was investigated by X-ray diffractometry using Cu Kα radiation and a graphite crystal monochromator. X-ray imaging was performed by continuous scanning with a diagram tape. The speed of rotation of the sample was 0.5° degrees per minute.
The limits of the investigated concentrations in each system were chosen so that 100% formation of metastable β-phase occurred in the alloys after quenching. Depending on the type of the alloying metal, these limits changed from 3–4 at.% in the Ti-Re, Ti-Os, Ti-Ru and Ti-Ir alloys to 35–40 at.% in the Ti-Nb and Ti-Ta alloys. Therefore, the differences in the compositions of the alloys studied were different: the minimum for most alloys was −0.25 at.%, and the maximum for the Ti-Ta system was −5 at.%.
3. Results and Discussion
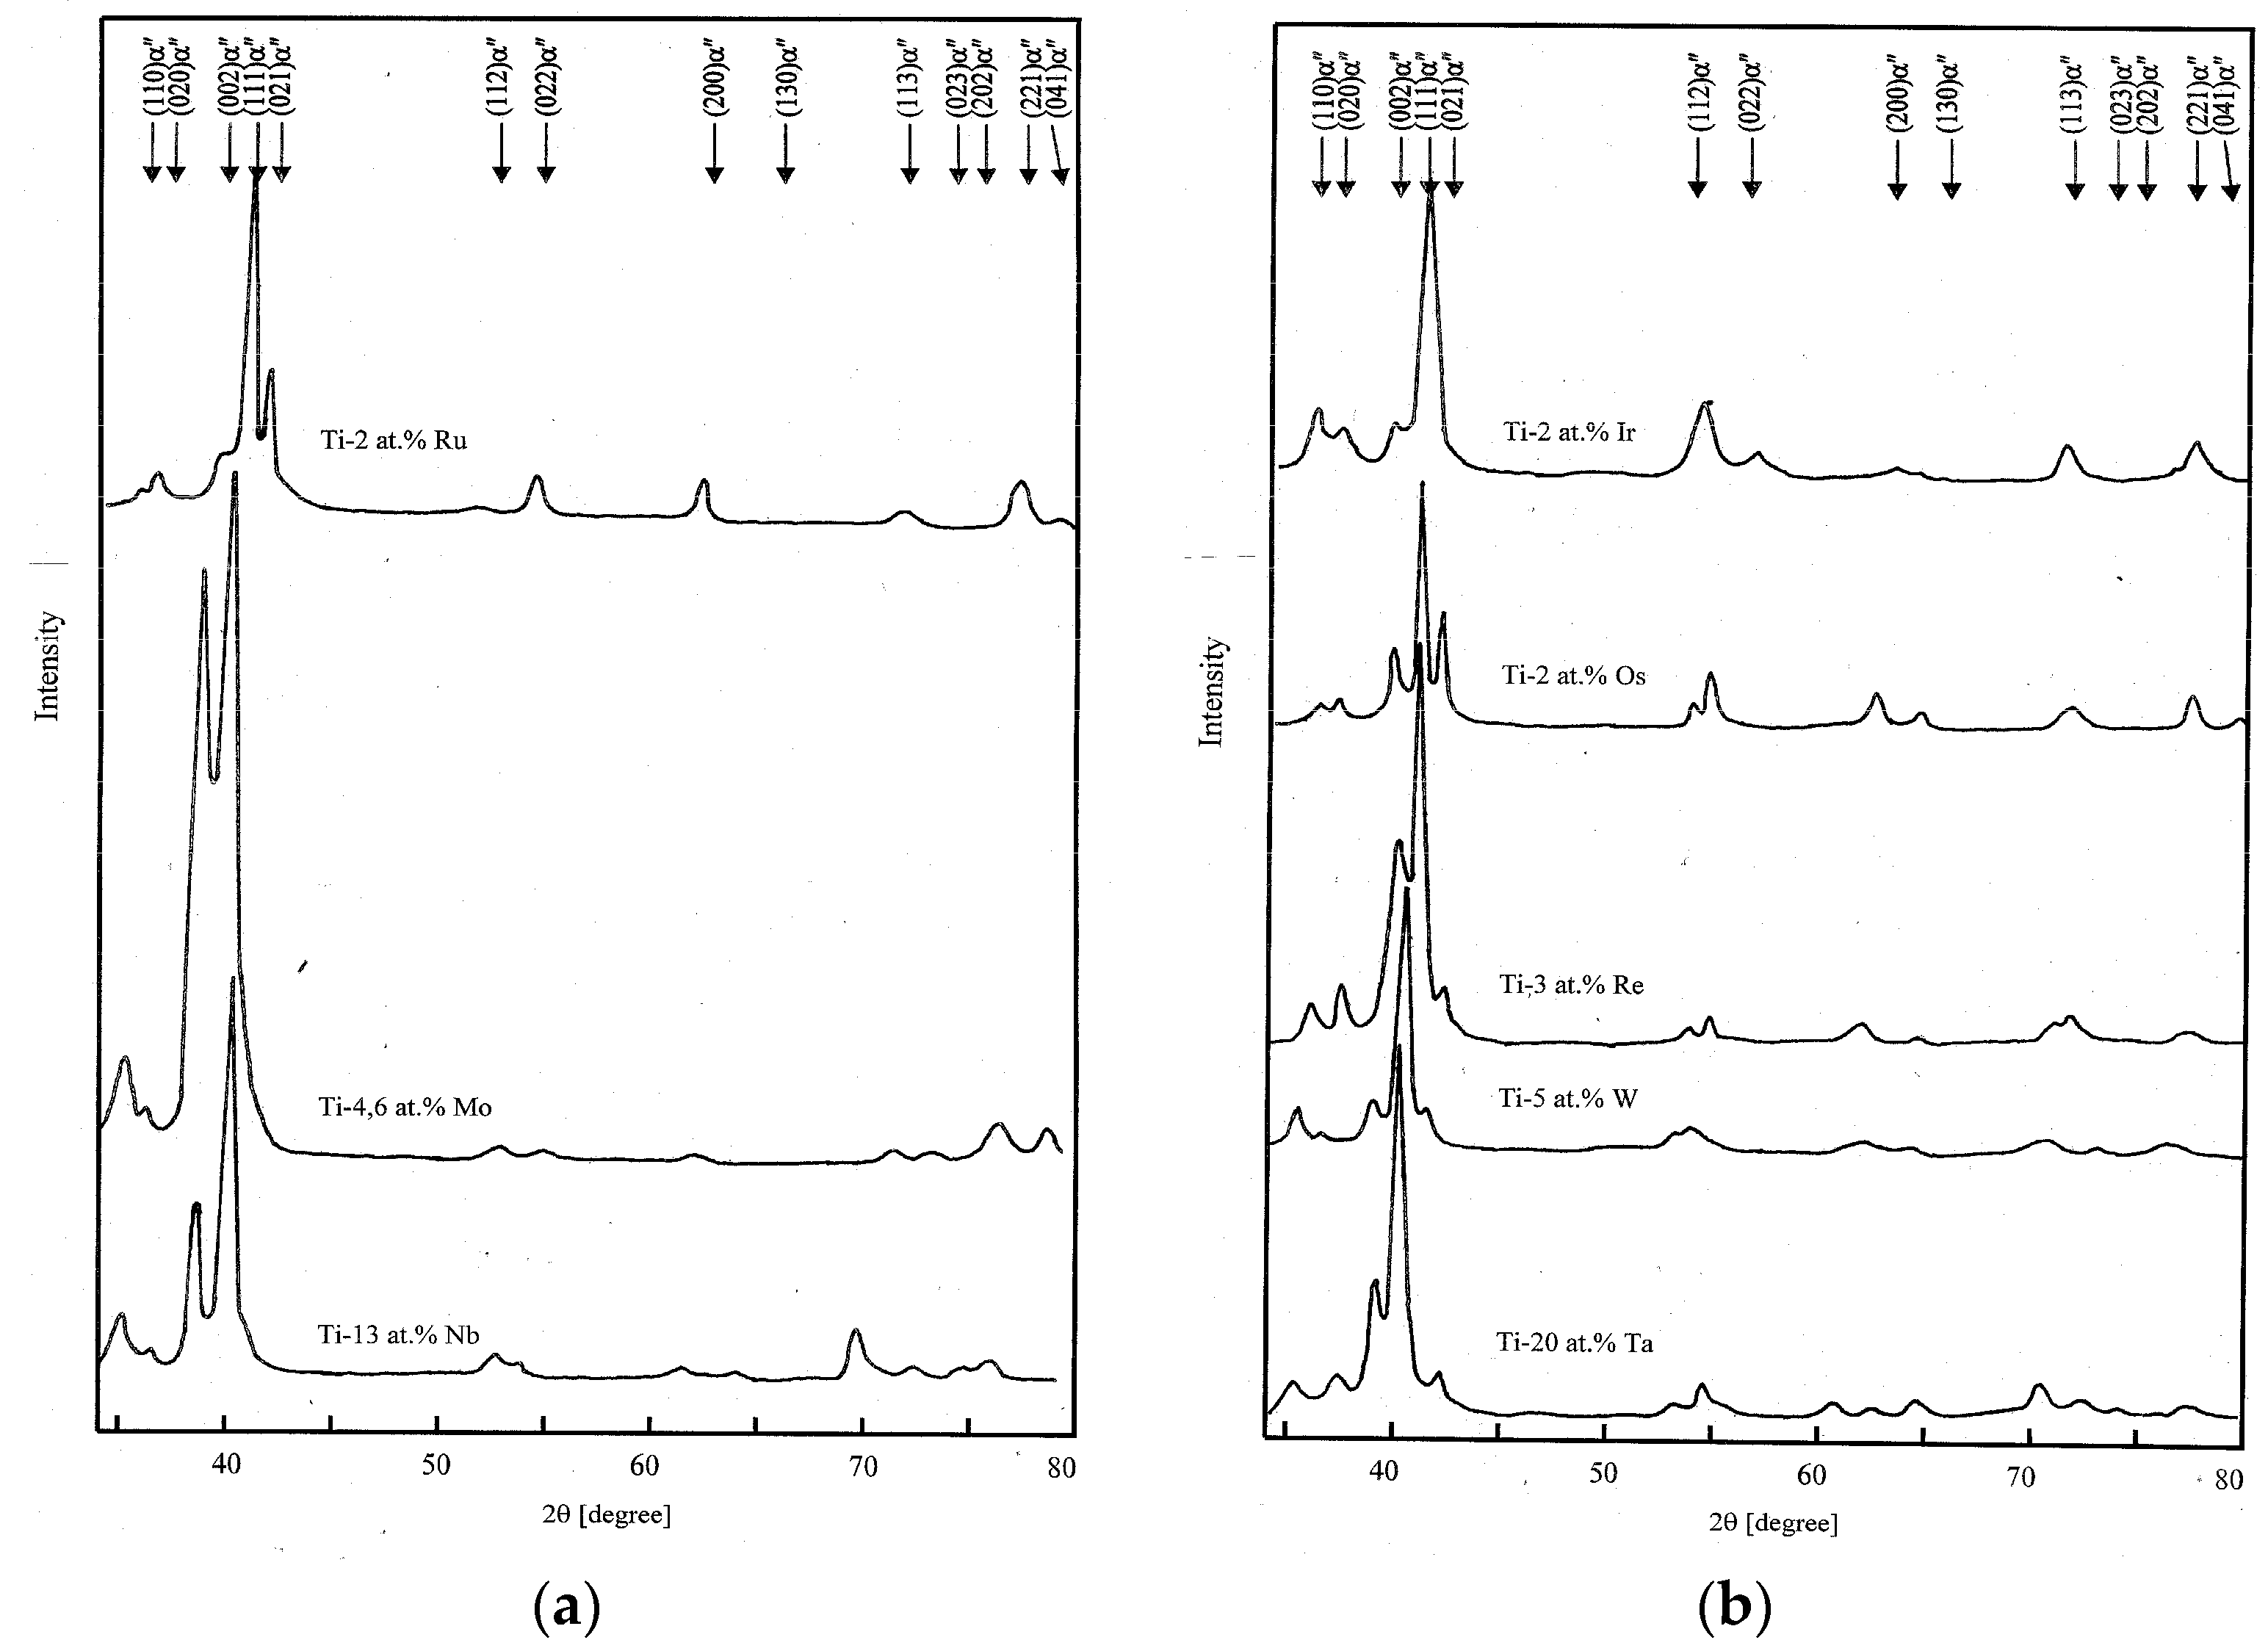
Figure 1 shows typical diffractograms of quenched binary titanium alloys with the minimum concentration of the alloying element at which the presence of the orthorhombic α″-phase after quenching could be observed. In agreement with the literature data, the presence of the α″-phase was established in the quenched Ti-Nb, Ti-Mo, Ti-Ta, Ti-W, Ti-Re and Ti-Ru alloys. Additionally, its formation in the quenched alloys of titanium with iridium and osmium was also found. In alloys with other d-metals, the presence of the α″-phase after quenching was not detected.
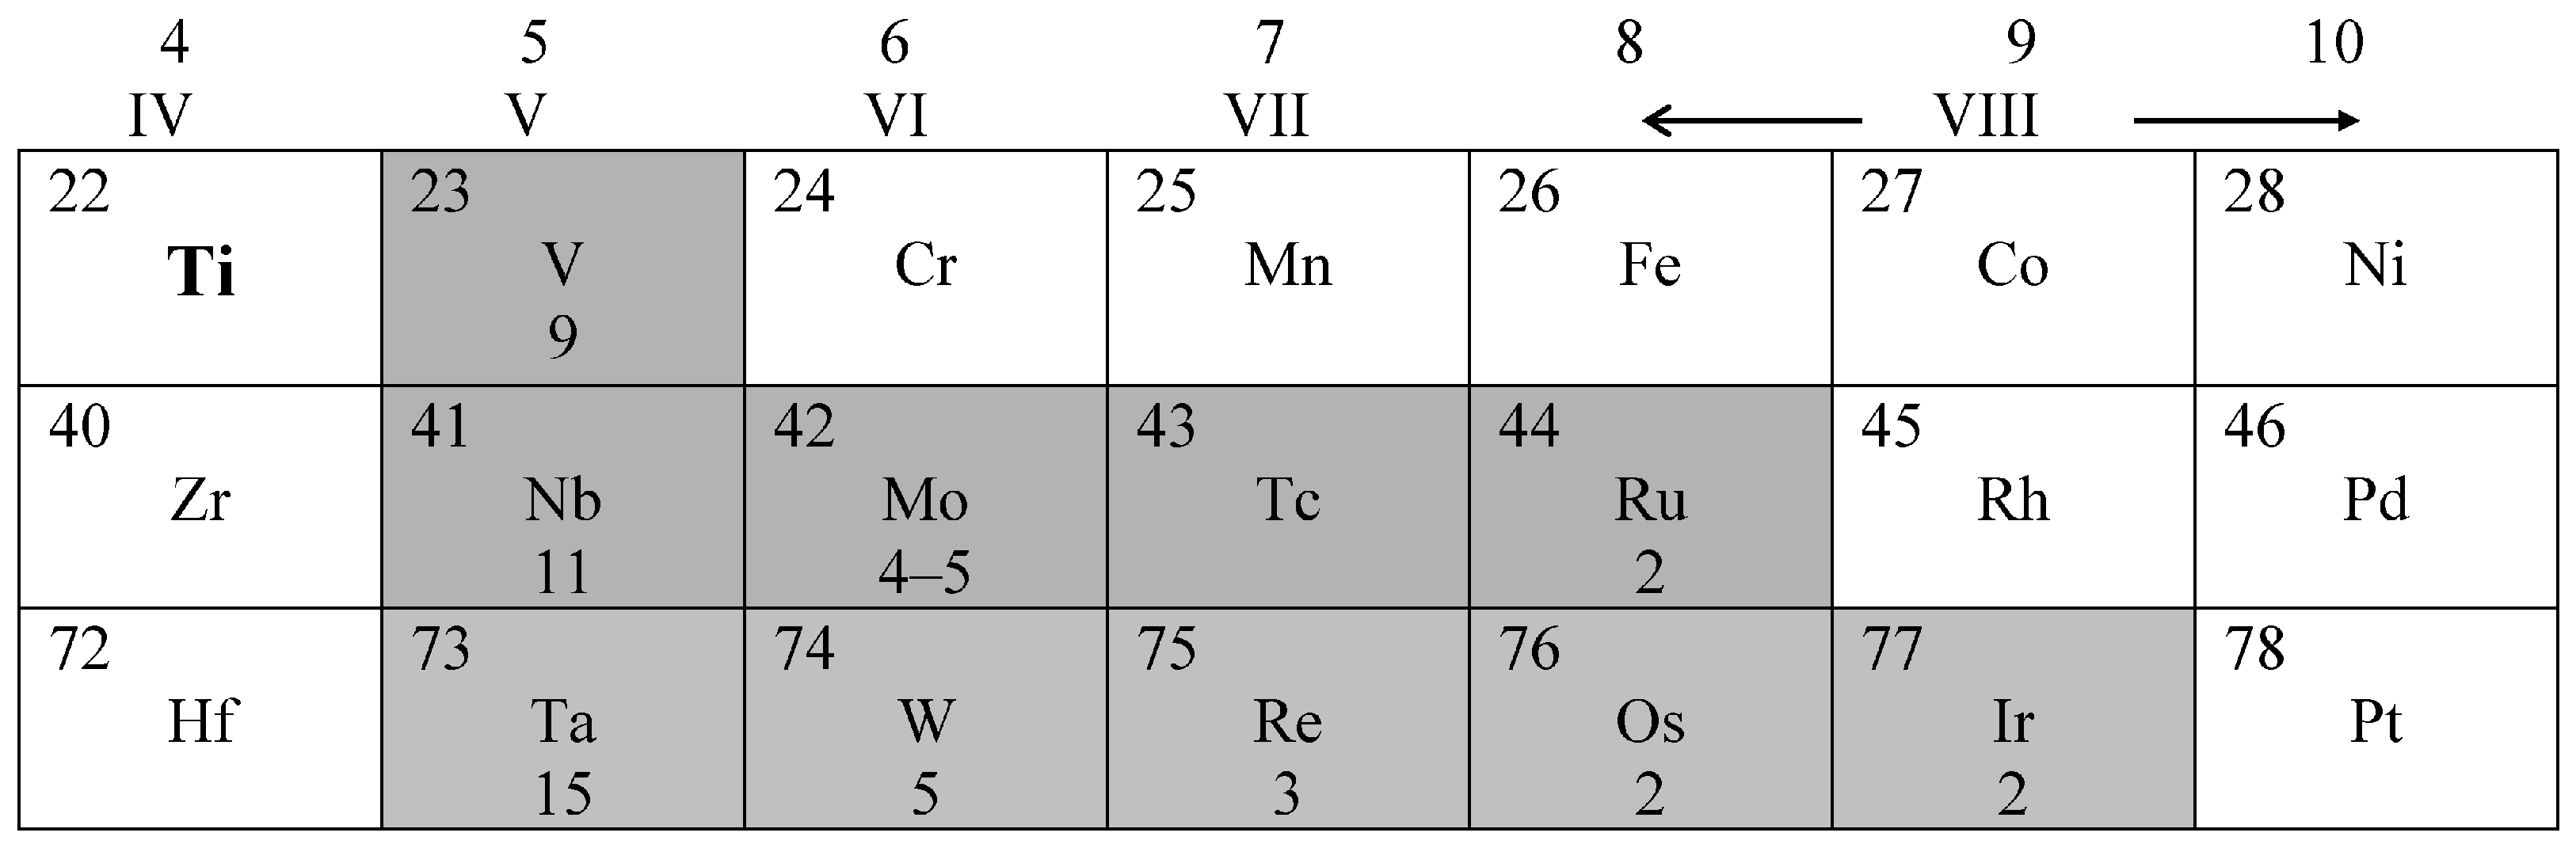
It follows from the X-ray data obtained that the formation of the α″-phase in binary titanium alloys does not occur with all d-metals. Figure 2 shows a part of the periodic table demonstrating the d-metals in which the formation of the α″-phase occurs. Also, it shows the values for the minimum concentrations of the alloying components at which the α″-phase can be observed in the quenched titanium alloys.
These data show that the occurrence of the α″-phase in the quenched binary titanium alloys and the concentration limits of its formation are naturally related to the position of the alloying metal in the periodic table. For the d-metals from the fourth period of the periodic table, the α″-phase is formed only in the Ti-V system. In alloys with the metals from period five, the formation of the α″-phase can be observed in the systems Ti-Nb, Ti-Mo and Ti-Ru. The metals from the sixth period demonstrate the largest number of systems (Ti-Ta, Ti-W, Ti-Re, Ti-Os and Ti-Ir) in which the formation of the α″-phase occurs. Although we did not study the structure and phase composition of the Ti-Tc system, we can assume that, based on the observed pattern of occurrence of the orthorhombic α″-phase in binary alloys of titanium with d-metals, it should also be present in the Ti-Tc system.
Thus, the orthorhombic α″-phase is formed during quenching in all alloys with alloying metals located in the periodic table approximately below the diagonal from chromium to platinum; in contrast, it is not formed in alloys with alloying metals above this diagonal. It should also be noted that the formation of the α″-phase does not occur in alloys of the Ti-Zr system [20].
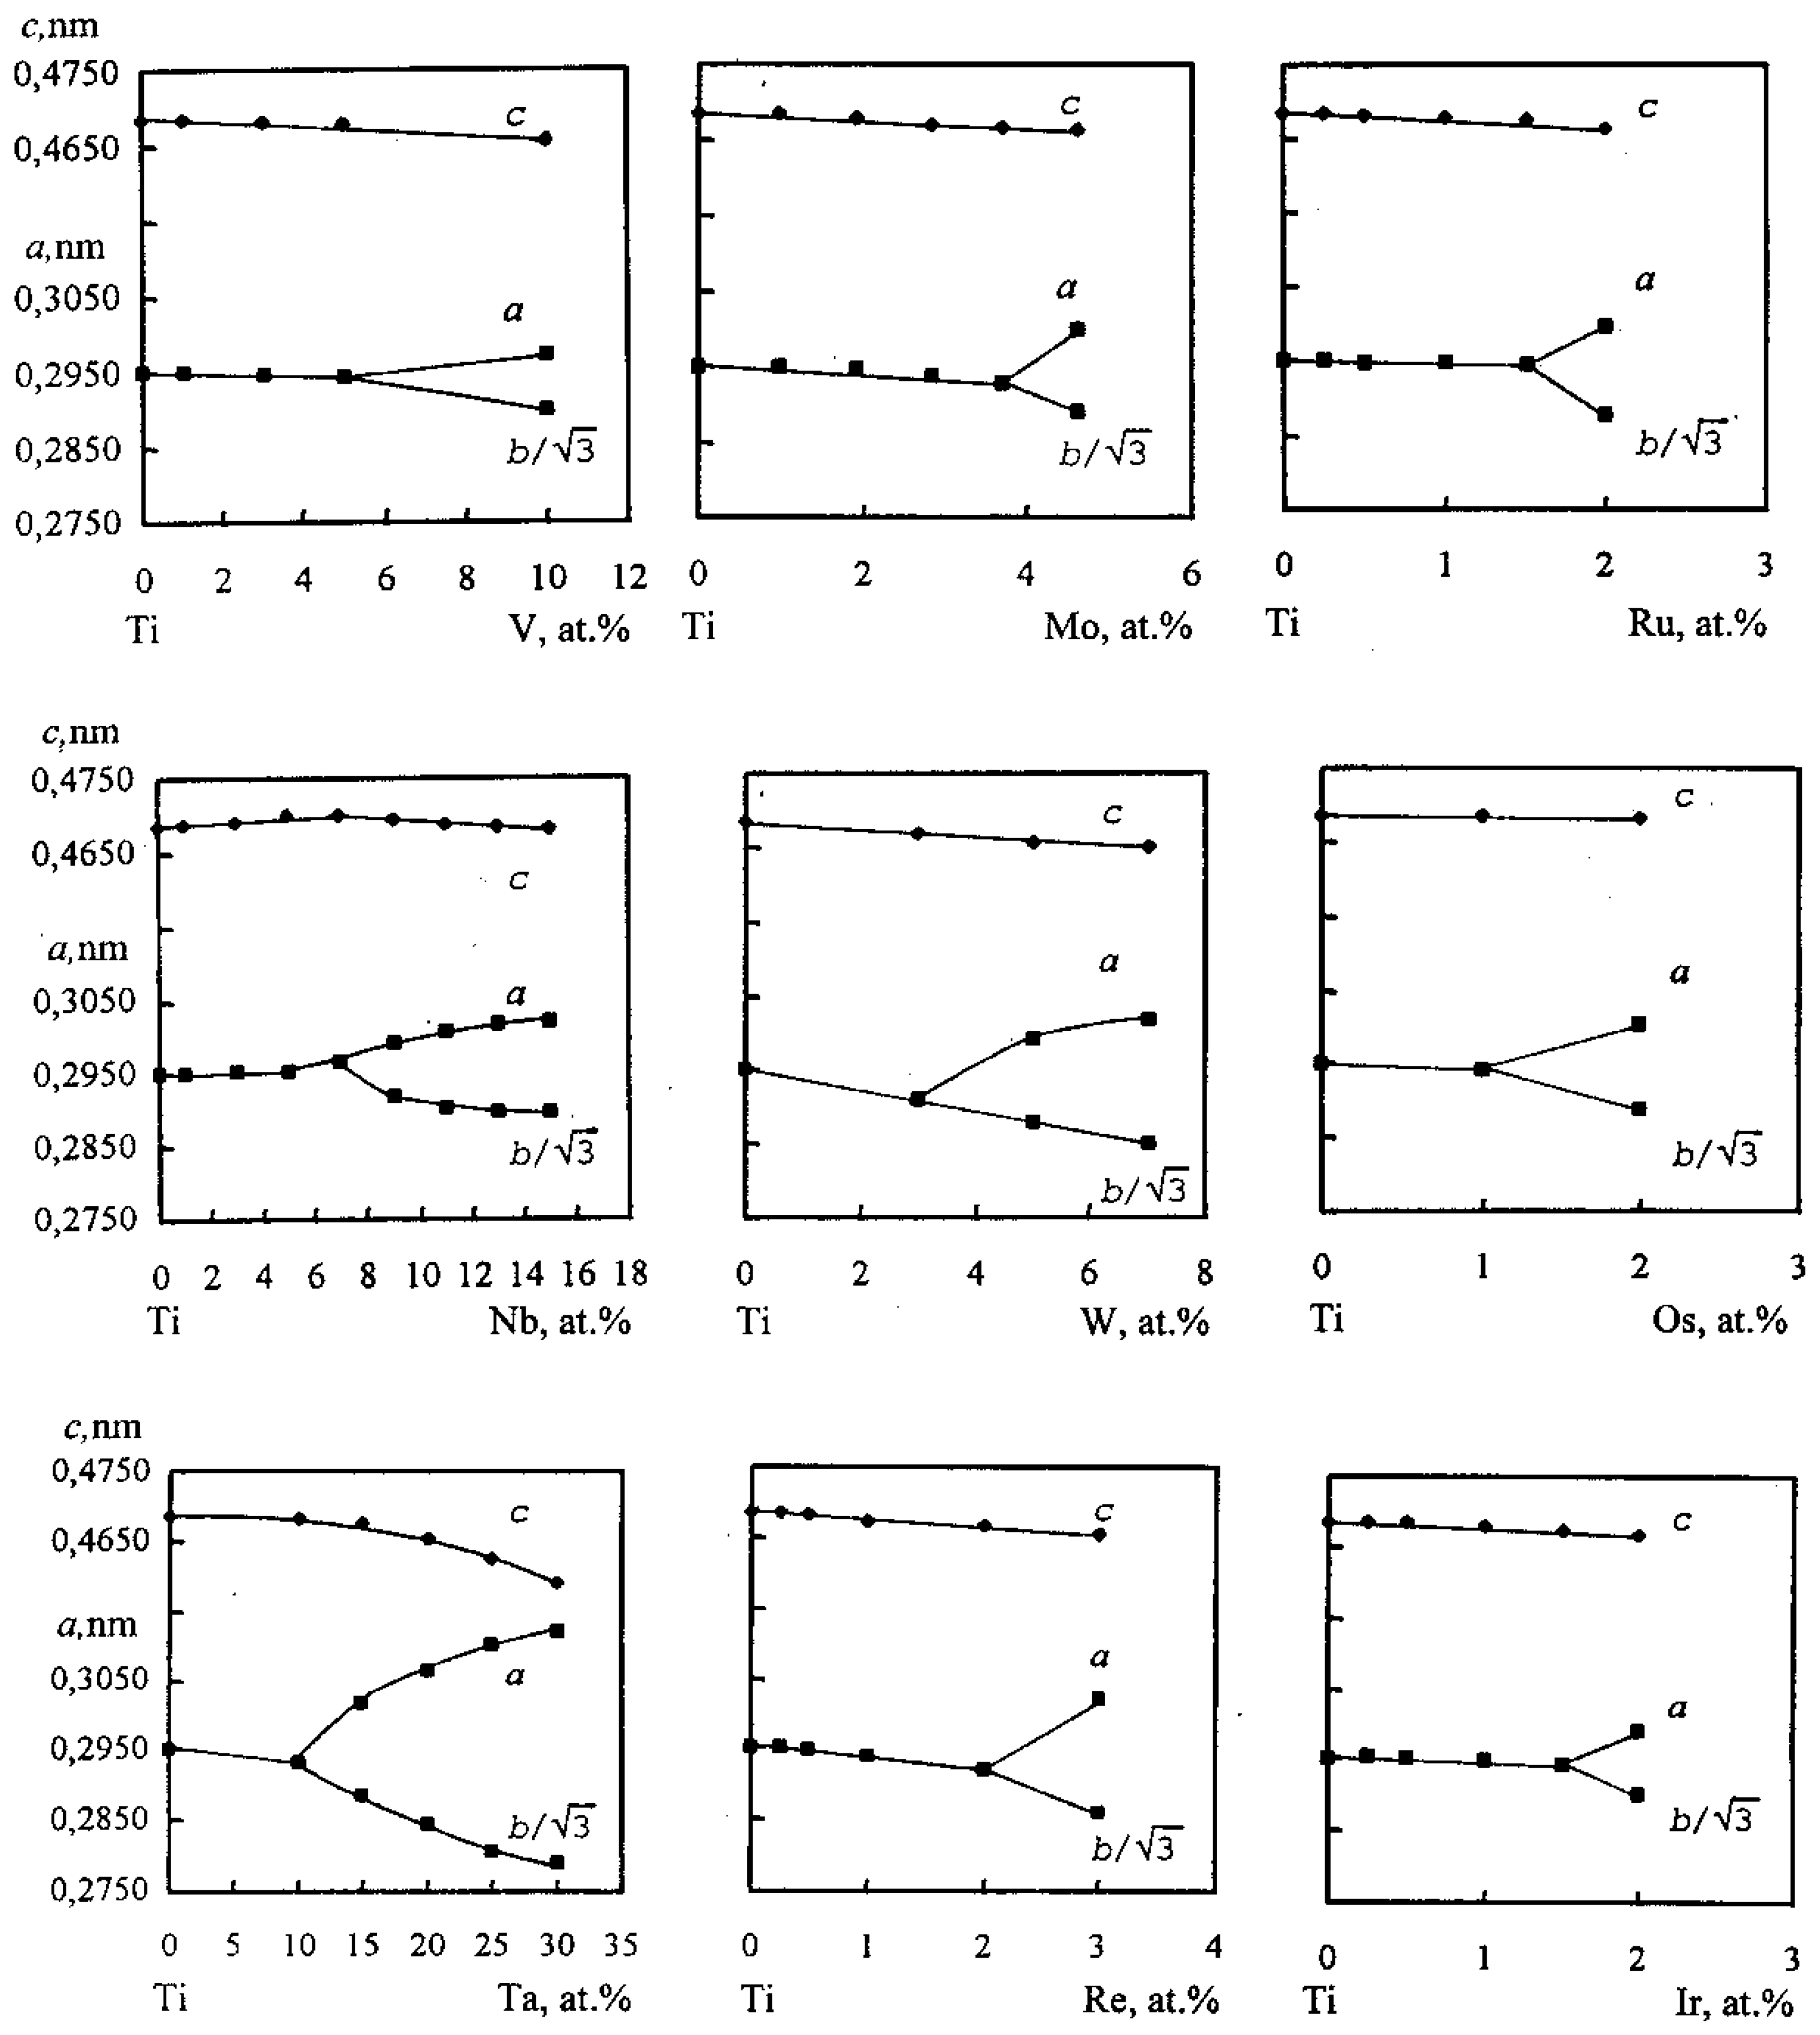
Figure 3 shows the curves for the change in the lattice parameters of the α′(α″) phase depending on the concentration of the alloying metal in binary alloys of titanium with different d-metals. The figure shows that the concentration boundary of the beginning of formation of the α″-phase, the extent of the area of its existence and the maximum degree of rhombicity achieved in each system correlate well with the position of the alloying metal in the periodic table. The concentration boundary of the beginning of the formation of the α″-phase monotonously increases with increasing period number, from 5 at.% in the Ti-V system to 10 at.% in the Ti-Ta system. In addition, from the data obtained, it follows that the concentration boundary of the beginning of the formation of the α″-phase monotonously decreases in each period with the increasing group number of the alloying metal. For example, for d-metals of period five, it decreases from 7 at.% in Ti-Nb alloy to 1.5 at.% in Ti-Ru alloy. A similar situation is observed for the d-metals of the sixth period. The maximum value of the alloying element concentration at which the α″-phase is detected is 15 at.% in the Ti-Ta system. However, in the alloys with osmium and iridium, this value is equal to only 2 at.%.
The graphs in Figure 4 show that the parameters a and c of the α′-phase decrease with the increasing concentration of the alloying component. During the transition to alloys with the structure of the α″-phase, the parameters b/ and c continue to decrease, but the parameter aα″ begins to increase. It follows from the above graphs that the extent of the area of existence of the α″-phase and the degree of rhombicity achieved are naturally related to the position of the alloying metal in the periodic table. The maximum difference between the parameters a and b/ and the maximum area of existence was observed for the system Ti-Ta and the minimum for the system Ti-V.
4. Discussion
Analysis of the experimental data shows that the formation of the orthorhombic α″-phase unambiguously correlates with the position of the alloying d-metal in the periodic table. It was found that the critical parameter for the formation of the α″-phase is the difference in the sizes of the titanium atoms and those of the alloying metal {(rTi − rMe)/rTi 100%}. The formation of the α″-phase occurs only in systems where this value is less than 9 at.%.
Therefore, the main issue of the discussion is to clarify the reason for the formation or absence of the α″-phase, as well as the reason for its unequal extent in different systems.
In the conventional sense, the orthorhombic α″-phase is not some new phase because its physical nature remains the same as that of the hexagonal α′-phase. Therefore, all the physical properties of the alloys change continuously during transition from one structure to another. The temperature of the beginning of the martensitic transformation Ms is described by the same curve, and the presence of the α′-phase and the α″-phase cannot be detected simultaneously in the same alloy. All the differences observed when the phase composition in the structure of titanium alloys changes can be explained only by the different degree of distortion of the martensite formed during quenching.
It is well-known that the formation of phases in different alloys is influenced by the dimensional mismatch of the atoms of the constituent components. This difference is conveniently expressed in the form of the volume factor ε = (rTi − rMe)/rTi 100%, where rTi is the radius of the titanium atom and rMe is the radius of the alloying metal atom. Table 1 shows the calculated values for this factor for titanium alloys with different d-metals.
Analysis of this factor shows that the formation of the α″-phase in binary titanium alloys with transition metals of groups 5–11 does not occur when the dimension factor ε becomes greater than approximately 9%. For Ti-Rh, Ti-Pd and Ti-Pt alloys, this volume mismatch is lower than the above criterion. The reason for the absence of the α″-phase in these alloys is discussed below.
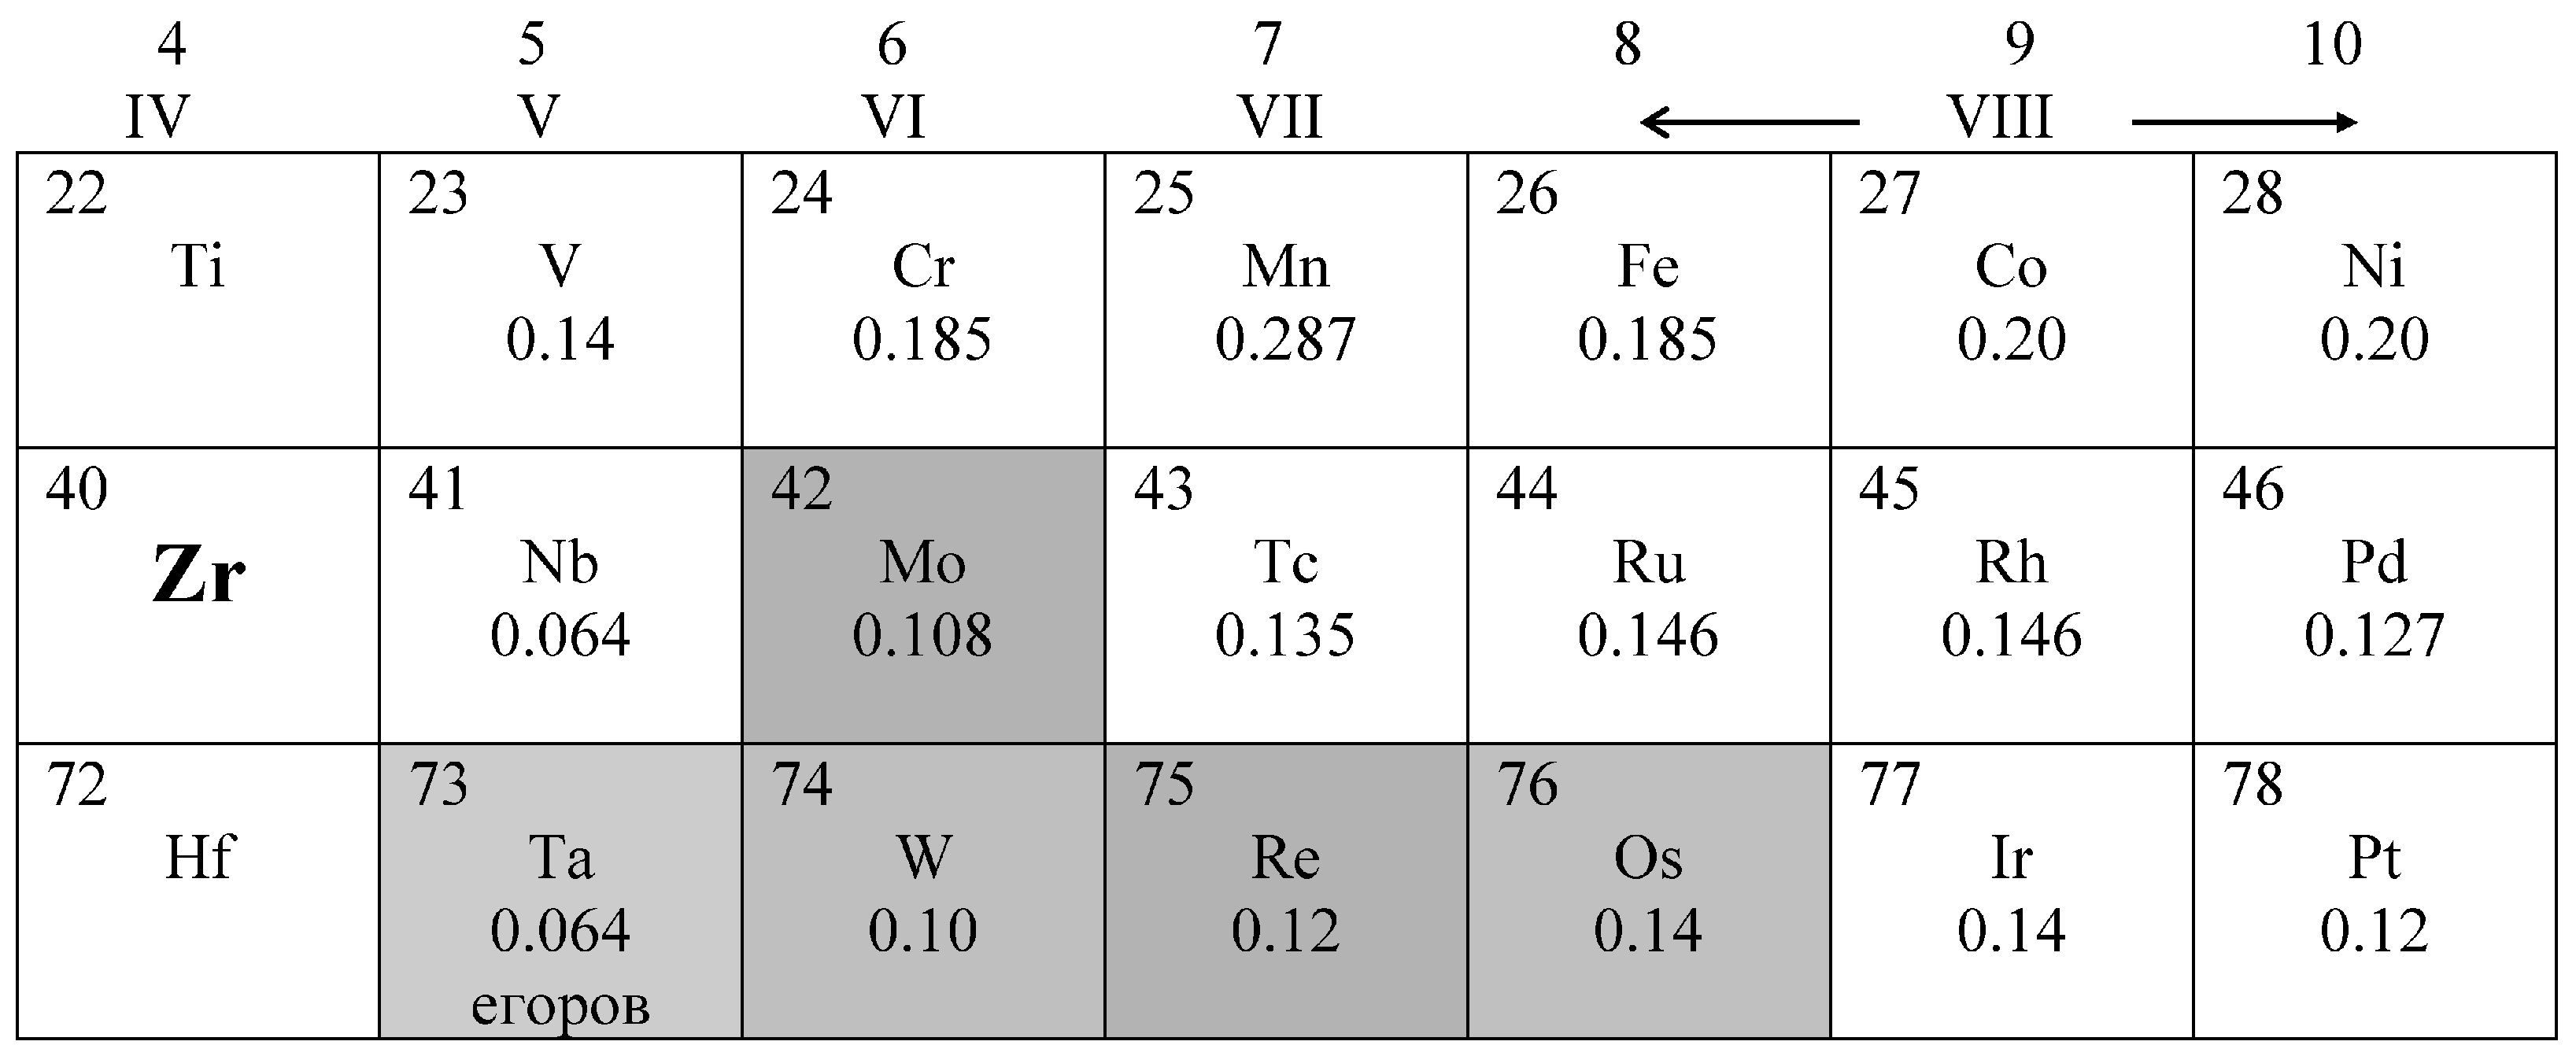
Close analogs of titanium alloys are zirconium alloys. In [10,11,12,13], the α″-phase was found in the Zr-Ta, Zr-W, Zr-Mo, Zr-Re and Zr-Os alloys. Figure 4 shows that the formation of the α″-phase in zirconium alloys does not occur when the volume mismatch ε is greater than or equal to 14 at.%. Thus, the formation of the α″-phase in binary titanium alloys stops when the volume factor ε becomes greater than 9%, and in the case of zirconium alloys, when it reaches 14%.
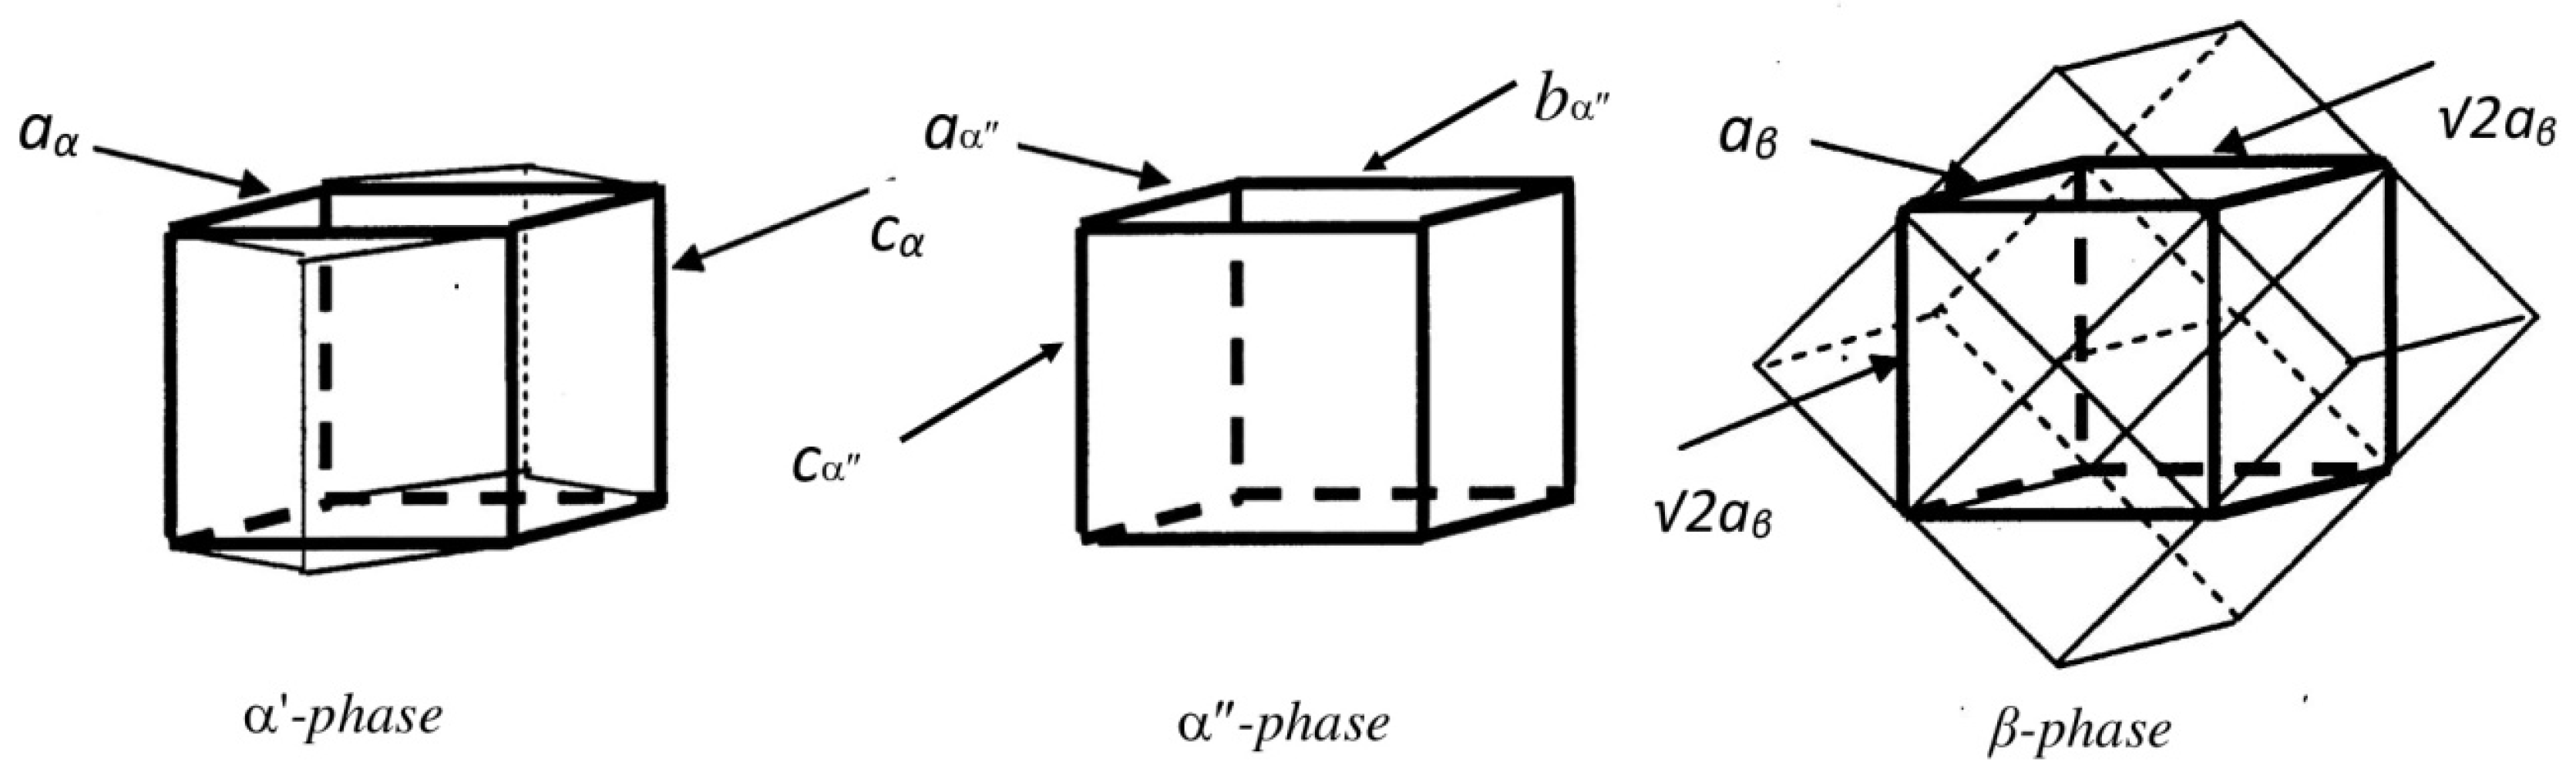
The second characteristic of the orthorhombic α″-phase in titanium alloys is represented by the varying extent of its existence and the different degrees of rhombicity reached. As transition from the α′-phase to the α″-phase happens continuously, it can be assumed that formation of the orthorhombic α″-phase is the intermediate stage during the transition of the hcp lattice of the α′ phase into the bbc lattice of the β-phase. As a result of such reorganization, the parameters a and c of hcp of the α′ phase gradually approach the parameters of aβ of the β-phase. In other words, emergence of the α″-phase reflects only the various intermediate stages of distortion of a crystal lattice of the α′-phase.
The scheme given in Figure 5 shows that the allocated volume of hcp of the crystal lattice of the α′ phase goes through the α″-phase into an equivalent volume of the β-phase. During such a transformation, the parameters of the α′ phase transform into the corresponding parameters of the α″-phase and β-phase as follows:
a (α′) → a (α″) → aβ
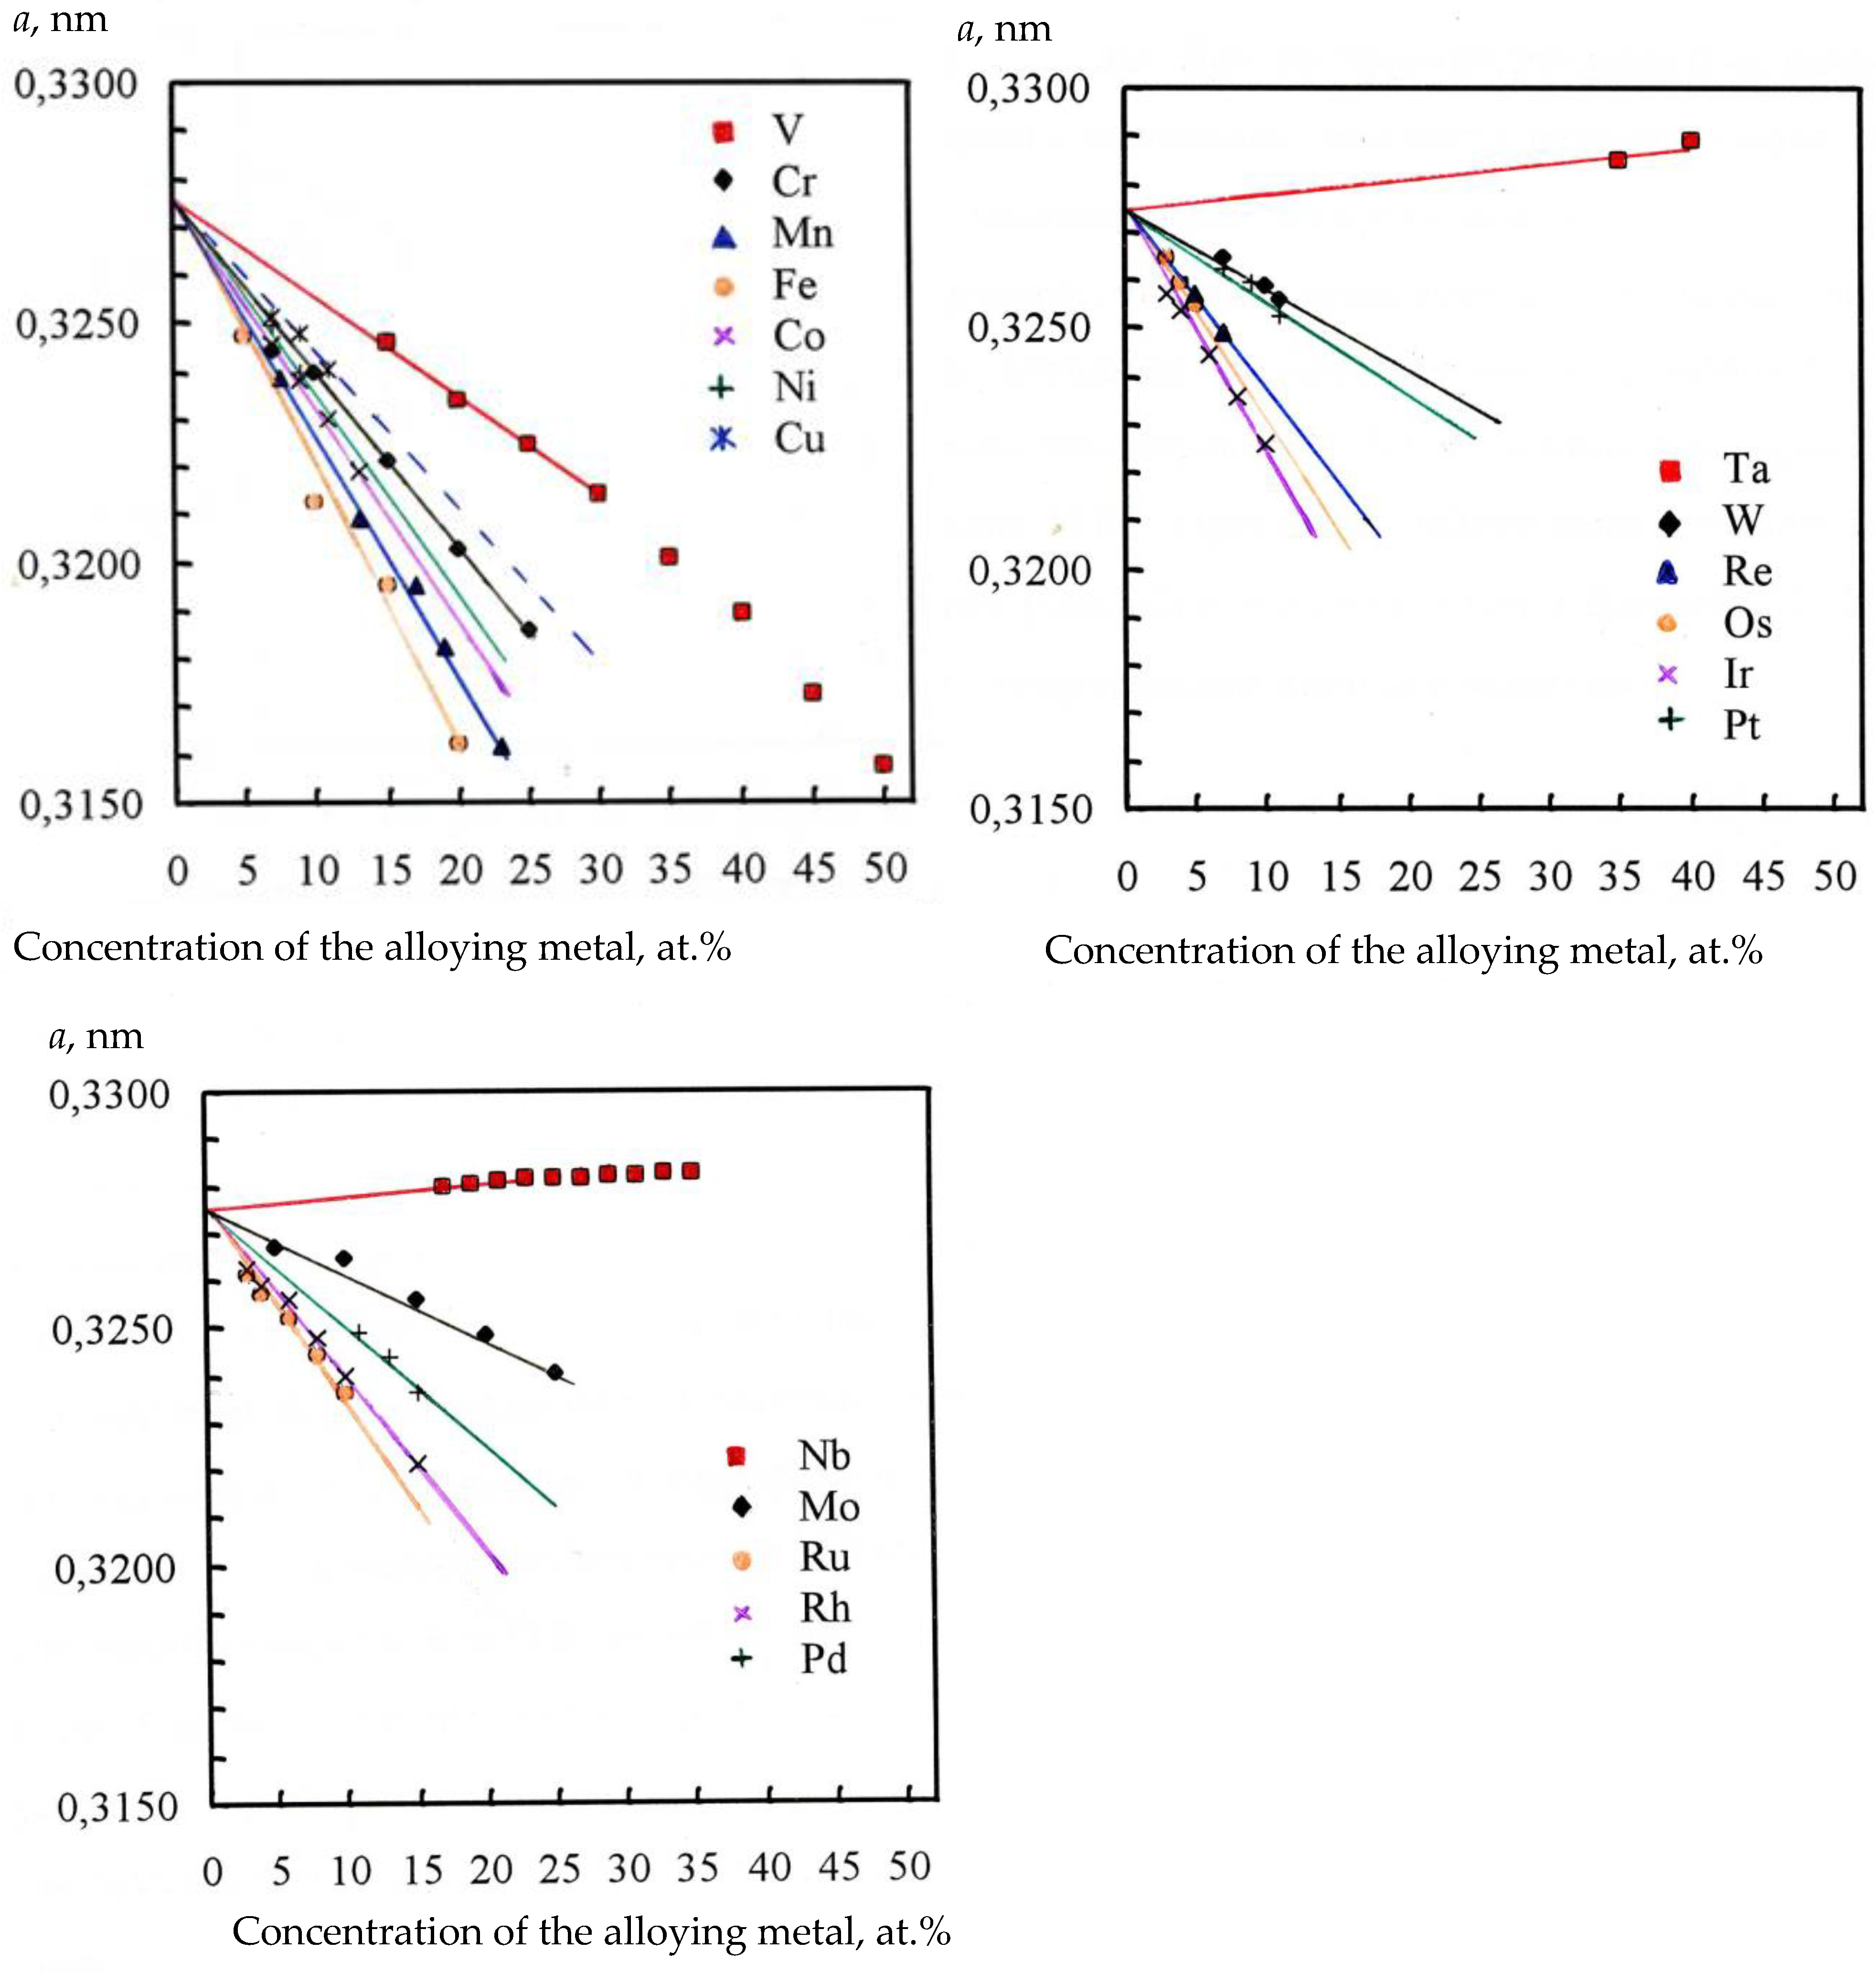
Figure 6 shows the dependencies of the lattice parameter of the β-phase on the concentration of alloying elements for titanium alloys with d-metals of the fourth, fifth and sixth periods. It can be seen that the obtained dependencies are described by the straight lines. All straight lines cross the ordinates axis at point a = 0.3275 nm. With the exception of the Ti–Nb and Ti–Ta alloys, the lattice parameter of the β-phase in all alloys regularly decreases with the increase in the alloying metal concentration. In contrast, the lattice parameter of the β-phase in the Ti–Nb and Ti–Ta alloys increases little with increasing alloying metal concentration. In Figure 6, the variation in the slope of the straight lines, describing the change in the lattice parameter of the β-phase as a function of the alloying metal concentration, can be observed. For alloying metals of each period, the slope of the straight lines increases with the increasing number of the alloying metal group.
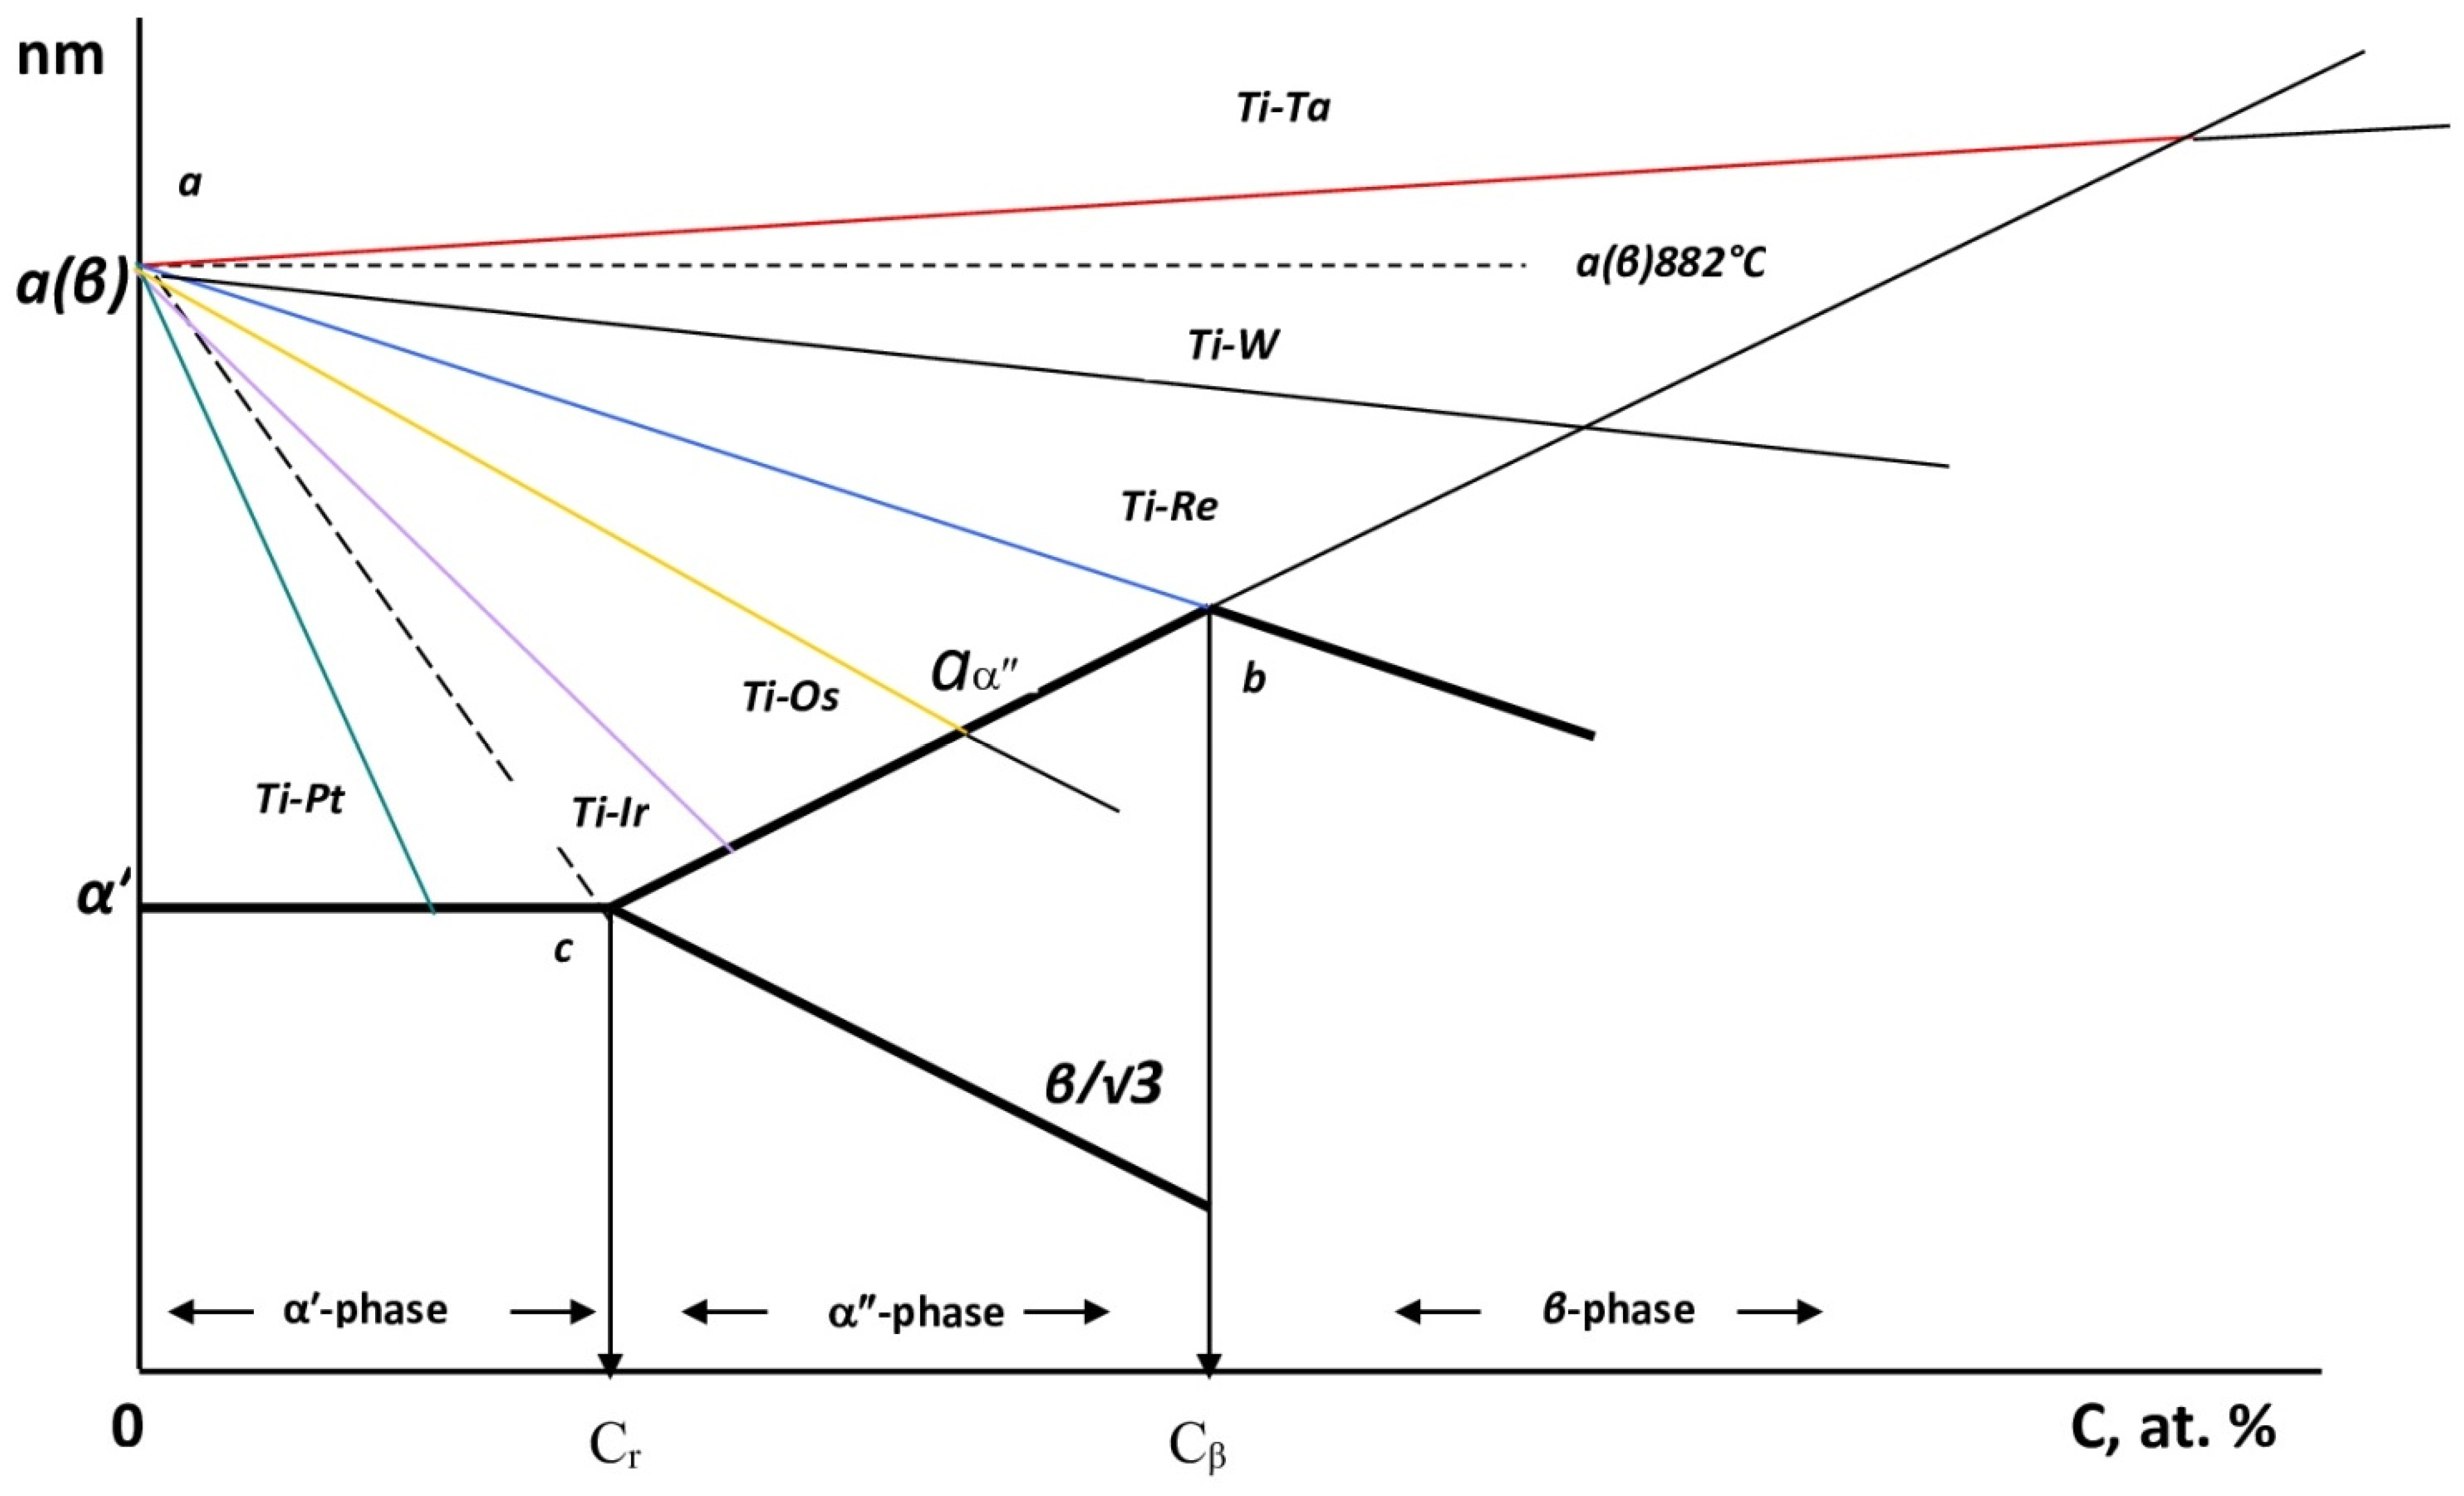
Figure 7 schematically shows the change in the α″-phase and the β-phase parameters with an increase in the content of alloying metals in the alloy. The aα″ parameter linearly increases with increasing alloying metal content, and b/ continuously decreases. The transition to the bbc structure ends when the aα″ parameter of the α″-phase becomes equal to the aβ parameter of the β-phase. In Figure 7, this corresponds to the intersection of the line of parameter aα″ of the α″-phase (c-b) and the line of parameter aβ of the β-phase (a-b). When the content of the alloying metal is greater than cβ, the metastable β-phase is stabilized.
Figure 7 also shows that the extent of the α″-phase region is determined by the beginning of the transition from the α′-phase to the β-phase, and the maximum degree of rhombicity is determined by the divergence of line aα″ and b/ at the concentration of cβ. According to our data, the extent of the α″-phase region and the maximum degree of its rhombicity are not same in different titanium alloys (Figure 3). The reason lies in the fact that the lines, which describe the change in the lattice parameter β-phase depending on the content of the alloying metal in different alloys, have different slopes (Figure 6). Therefore, if, for example, the line ab in Figure 7 refers to the Ti-Re alloys, the lines reflecting changes in aβ for alloys with alloying metals of higher groups of the sixth period (Ti-Os, Ti-Ir) will be steeper and will cross the line cb at lower metal concentrations in the alloy. The consequence of this will be a decrease in both the concentration interval of the α″-phase formation and the value of the maximum achievable degree of rhombicity.
With a content for the alloying component less than 9 at.% (coordinate Cr in Figure 7), the formation of the α″-phase becomes unnecessary. Therefore, for all systems for which the slope of the line of parameter aβ of the β-phase is greater than the slope of the line ac, the formation of α″-phase will not occur.
Thus, the results obtained show that the formation of the α″-phase does not occur when the difference in the atomic sizes of titanium and the alloying metals is greater than 9%. The extent of the α″-phase region depends on the rate of change of the parameter aβ resulting from the d-metal content in the alloy. In other words, this means that the area of the α″-phase is greater in alloys where the lattice parameter aβ of the β-phase changes only slightly with the change in the alloying metal content.
According to the criterion given in this paper, the formation of the α″-phase should be observed in quenched Ti-Pd and Ti-Pt alloys. Perhaps it is formed in these alloys, but the interval of its existence is very small. Therefore, we were unable to detect it because the composition interval with the neighboring alloys studied was large.
5. Summary
A systematic study of the formation conditions of the orthorhombic α″-phase in binary titanium alloys with d-metals of groups 5–11 was conducted. It was found that the formation of the α″-phase depends on the position of the alloying metal in the periodic table. It was established that it is a distorted phase formed in the process of rearrangement of the α-phase with an hcp structure into the β-phase with a bcc structure. The criterion for its formation relates to the difference in the atomic sizes of titanium and the alloying metal, and it is formed only in systems where the value {(rTi − rMe)/rTi 100%} is lower than 9 at.%. It was shown that the transition of alloys with the structure of the α″-phase to alloys with the structure of the β-phase ends when the parameter line aα″ of the α″-phase becomes equal to the parameter aβ of the β-phase.
The extent of the α″-phase region and the degree of its rhombicity depend on the rate of change in the lattice parameter of the β-phase when the d-metal content in the alloy changes. The maximum values for these parameters are achieved in systems where the lattice constant of the β-phase changes most weakly with increasing d-metal content in the alloy.
Funding
The research was carried out as part of the state assignment of the Ministry of Science and Higher Education of the Russian Federation (theme “Pressure”, No. 122021000032-5). The research was carried out using the equipment at the ”Testing Center of Nanotechnology and Advanced Materials“ Collaborative Access Center of the IMP UB RAS.
Data Availability Statement
Not Applicable.
Conflicts of Interest
The author declares no conflict of interest.
References
- Bagaryatskii, Y.A.; Nosova, G.I.; Tagunova, T.V. Laws of formation of metastable phases in titanium alloys. Dokl. Akad. Nauk SSSR 1958, 122, 593–596. [Google Scholar]
- Nosova, G.I. Phase Transformations in Titanium Alloys. Metallurgia 1964, 69, 181. [Google Scholar]
- Collings, E.W. The Physical Metallurgy of Titanium Alloys; ASM: Metals Park, OH, USA, 1984. [Google Scholar]
- Zwicker, U. Titan und Titanlegierungen; Springer: Berlin/Heidelberg, Germany, 1974. [Google Scholar]
- Bywater, K.A.; Christian, J.W. Martensitic transformations in titanium-tantalum alloys. Philos. Mag. A 1972, 25, 1249–1273. [Google Scholar] [CrossRef]
- Davis, R.; Flower, H.M.; West, D.R. Martensitic Transformations in Ti-Mo alloys. Mater. Sci. 1979, 4, 712–722. [Google Scholar] [CrossRef]
- Brawn, A.R.; Jepson, K.S. Metallurgie physique et caractéristiques mécaniques des alliages Ti-Nb. Mem. Scient. Rev. Metall. 1966, 63, 575–584. [Google Scholar]
- Dobromyslov, A.V.; Elkin, V.A. β → α″ and β → ω transformations in Ti-Os alloys. Metall. Mater. Trans. A 1999, 30, 231–233. [Google Scholar] [CrossRef]
- Dobromyslov, A.V.; Dolgikh, G.V.; Dutkevich, Y.; Trenogina, T.L. Phase and structural transformations in Ti-Ta alloys. Phys. Met. Metallogr. 2009, 107, 502–510. [Google Scholar] [CrossRef]
- Dobromyslov, A.V.; Taluts, N.I. The formation of α″-phase in Zr-Mo alloy. Phys. Met. Metallog. 1993, 76, 132–140. [Google Scholar]
- Dobromyslov, A.V.; Taluts, N.I.; Egorov, A.P. Formation of orthorombic α″-phase in alloys of the Zr-Ta system. Phys. Met. Metallog. 1996, 82, 85–88. [Google Scholar]
- Dobromyslov, A.V.; Taluts, N.I. The formation of α″-phase in Zr-Re alloys. Scr. Mater. 1996, 35, 573–577. [Google Scholar] [CrossRef]
- Taluts, N.I.; Dobromyslov, A.V. Structural and phase transformations in quenched and aged Zr–Os alloys. J. Alloys Comp. 2000, 298, 181–189. [Google Scholar] [CrossRef]
- Il’in, A.A. Mechanism and Kinetics of Phase and Structural Transformations in Titanium Alloys; Nauka: Moscow, Russia, 1994. [Google Scholar]
- Mei, W.; Sun, J.; Wen, Y. Martensitic transformation from β to α′ and α″ phases in Ti–V alloys: A first-principles study. J. Mater. Res. 2017, 32, 3183–3190. [Google Scholar] [CrossRef]
- Wang, B.L.; Zheng, Y.F.; Zhao, L.C. Effects of Sn content on the microstructure, phase constitution and shape memory effect of Ti–Nb–Sn alloys. Mater. Sci. Eng. A 2008, 486, 146–151. [Google Scholar] [CrossRef]
- Wu, Q.; Ping, D.H.; Yamabe-Mitarai, Y.; Kitashima, T.; Li, G.P.; Yang, R. Microstructural characterization on martensitic α″–phase in Ti–Nb–Pd alloys. J. Alloys Compd. 2013, 577, S423–S426. [Google Scholar] [CrossRef]
- Yang, Y.; Li, G.P.; Cheng, G.M.; Wang, H.; Zhang, M.; Xu, F.; Yang, K. Stress-introduced α″ martensite and twinning in a multifunctional titanium alloy. Scr. Mater. 2008, 58, 9–12. [Google Scholar] [CrossRef]
- Wang, X.D.; Lou, H.B.; St, K.; Bednarcik, J.; Franz, H.; Jiang, J.Z. Tensile behavior of orthorhombic α″-titanium alloy studied by in situ X-ray diffraction. Mater. Sci. Eng. A 2010, 527, 6596–6600. [Google Scholar] [CrossRef] [Green Version]
- Dobromyslov, A.V.; Taluts, N.I. Structure of zirconium and its alloys. Phys. Met. Metallog. 1995, 79, 3–27. [Google Scholar]
- Banerjee, S.; Krishnan, R. Martensitic transformation in Zr–Ti alloys. Met. Trans. 1973, 4, 1811–1819. [Google Scholar] [CrossRef]
- Dobromyslov, A.V.; Taluts, N.I. Investigation of the α-phase structure in quenched and aged Zr-Ti alloys. Phys. Met. Metallog. 1987, 63, 127–132. [Google Scholar]
- Khlebnikova, Y.V.; Rodionov, D.P.; Egorova, L.Y.; Suaridze, T.R. Crystallographic features of the α-phase structure in hafnium and hafnium–titanium alloys. Tech. Phys. 2018, 63, 1771–1783. [Google Scholar] [CrossRef]
Figure 1.
X-ray diffraction patterns of different binary titanium-based alloys showing the α″-phase peaks: (a) alloys with d-metals from period five of the periodic table, (b) alloys with d-metals from period six of the periodic table.
Figure 1.
X-ray diffraction patterns of different binary titanium-based alloys showing the α″-phase peaks: (a) alloys with d-metals from period five of the periodic table, (b) alloys with d-metals from period six of the periodic table.

Figure 2.
Part of the periodic table with d-metals. The darkened areas show the positions of the d-metals with which the α″-phase is formed in binary titanium alloys.
Figure 2.
Part of the periodic table with d-metals. The darkened areas show the positions of the d-metals with which the α″-phase is formed in binary titanium alloys.

Figure 3.
Dependence of the lattice parameters in the α′- and α″-phases on the concentration of alloying metal in the alloy. The upper curve shows a change in parameter c in the α′-phase and the α″-phase, the lower curve shows a change in parameter a in the α′-phase and parameters a and b/ in the α″-phase.

Figure 4.
Part of the periodic table with d-metals. The darkened areas show the positions of the d-metals with which the α″-phase is formed in binary zirconium alloys.
Figure 4.
Part of the periodic table with d-metals. The darkened areas show the positions of the d-metals with which the α″-phase is formed in binary zirconium alloys.

Figure 5.
The schematic of the α′ → α″ → β lattice phase transformation.

Figure 6.
Dependence of the lattice parameter of the β-phase on the concentration of alloying elements at a temperature of 0 °C.
Figure 6.
Dependence of the lattice parameter of the β-phase on the concentration of alloying elements at a temperature of 0 °C.

Figure 7.
A schematic diagram explaining the extent of the α″-phase and its formation or absence in binary titanium alloys with sixth-period d-metals. Cr is the beginning of the rearrangement of the crystal lattice of the α′-phase into the crystal lattice of the α″-phase. Cβ is the content of the alloying metal at which the equivalent volume of the α″-phase becomes equal to the equivalent volume of the β phase in the Ti-Re alloy. When this concentration is reached, the formation of the β-phase is 100%. Point b is the intersection of the straight line describing the change in the β-phase parameter a for the Ti-Re system and the virtual curve describing the change in the α″-phase parameter aα″ in all binary titanium alloys with d-metals of the sixth period. When Cβ is reached in the quenched Ti-Re alloys, only the β phase is formed.


Table 1.
Effect of size mismatch of atoms on the formation of orthorhombic α″-phase in binary titanium alloys.
Table 1.
Effect of size mismatch of atoms on the formation of orthorhombic α″-phase in binary titanium alloys.
| Ti | V | Cr | Mn | Fe | Co | Ni |
|---|---|---|---|---|---|---|
| 7.4 | 12.93 α′-phase | 12.93 α′-phase | 14.29 α′-phase | 14.97 α′-phase | 14.97 α′-phase | |
| Zr | Nb | Mo | Tc | Ru | Rh | Pd |
| [21,22] α-phase | 0 α″-phase | 4.76 α″-phase | 7.62 α″-phase | 8.84 α″-phase | 8.84 α′-phase | 6.8 α′-phase |
| Hf [23] | Ta | W | Re | Os | Ir | Pt |
| 6.8 α-phase | 0 α″-phase | 4.76 α″-phase | 6.12 α″-phase | 8.16 α″-phase | 8.16 α″-phase | 6.12 α′-phase |
Disclaimer/Publisher’s Note: The statements, opinions and data contained in all publications are solely those of the individual author(s) and contributor(s) and not of MDPI and/or the editor(s). MDPI and/or the editor(s) disclaim responsibility for any injury to people or property resulting from any ideas, methods, instructions or products referred to in the content. |
© 2023 by the author. Licensee MDPI, Basel, Switzerland. This article is an open access article distributed under the terms and conditions of the Creative Commons Attribution (CC BY) license (https://creativecommons.org/licenses/by/4.0/).
Share and Cite
MDPI and ACS Style
Dobromyslov, A.V. Nature and Regularities of the Orthorhombic α″-Phase Formation in Binary Titanium Alloys. Alloys 2023, 2, 148-156. https://doi.org/10.3390/alloys2030011
AMA Style
Dobromyslov AV. Nature and Regularities of the Orthorhombic α″-Phase Formation in Binary Titanium Alloys. Alloys. 2023; 2(3):148-156. https://doi.org/10.3390/alloys2030011
Chicago/Turabian StyleDobromyslov, Arkadiy V. 2023. "Nature and Regularities of the Orthorhombic α″-Phase Formation in Binary Titanium Alloys" Alloys 2, no. 3: 148-156. https://doi.org/10.3390/alloys2030011