Article

Fatty Acid Composition of Sesame (Sesamum indicum L.) Seeds in Relation to Yield and Soil Chemical Properties on Continuously Monocropped Upland Fields Converted from Paddy Fields

1
United Graduate School of Agricultural Sciences, Tottori University, 4-101 Koyama Minami, Tottori 680-8553, Japan
2
National Institute of Crop Science, National Agriculture and Food Research Organization (NARO), 2-1-2 Kannondai, Tsukuba, Ibaraki 305-8518, Japan
3
Faculty of Life and Environmental Sciences, Shimane University, Matsue, Shimane 690-8504, Japan
4
Faculty of Agriculture, Tottori University, 4-101 Koyama Minami, Tottori 680-8553, Japan
*
Authors to whom correspondence should be addressed.
Agronomy 2019, 9(12), 801; https://doi.org/10.3390/agronomy9120801
Submission received: 4 November 2019 / Revised: 22 November 2019 / Accepted: 22 November 2019 / Published: 24 November 2019

Abstract

:
We evaluated the fatty acid compositions in relation to yield and soil nutrients from four fields A, B, C, and D with continuous monocropping histories of 0–3 years, respectively, in Japan from 2015 to 2016. Results showed that, in both evaluation years, seed yield did not significantly differ among the fields although field A produced the highest mean seed yield and 1000-seed weight. Between fields A and C, 1000-seed weight showed significant differences. The contents of seed-saturated fatty acids lauric and myristic decreased in only fields C and D whereas oleic, linoleic, and linolenic acids increased in field D. Only field A produced the highest contents of lauric and myristic acids whereas field D produced the highest contents of linoleic and linolenic acids. The soil total N and exchangeable K contents tended to decrease as exchangeable Mg content significantly increased on the fields with long duration of cropping, fields C and D. Principal component analysis revealed significant positive correlations between soil exchangeable K, and total N contents with 1000-seed weight and lauric acid, as exchangeable Mg content was related with oleic, linoleic, and linolenic acids. Therefore, the high oleic, linoleic, and linolenic acids from field D were mainly attributed to high soil exchangeable Mg content, whereas the high 1000-seed weight, lauric acid and myristic acid were due to the high soil exchangeable K content in field A. Overall, the fatty acid composition quality on the long-duration continuously monocropped fields could show high economic value at the expense of yield under this management practice in continuous monocropping.

1. Introduction

Sesame (Sesamum indicum L.) is one of the oldest oilseeds cultivated throughout the world for its edible oil and use as food [1]. The seeds contain several minerals, lignans, high oil, saturated and unsaturated fatty acids, which contribute to nutritional and health benefits when included in diet. The fatty acid composition in sesame seeds consists of abundant unsaturated fatty acids: oleic (35.9–42.3%) and linoleic (41.5–47.9%) acids from 80% of total fatty acids; less than 20% are saturated fatty acids, mainly palmitic (7.9–12%) and stearic acids (4.8–6.1%) [2]. The high abundance of essential fatty acids such as linoleic that cannot be synthesized in the human body makes sesame seeds paramount in the human diet. For instance, the fatty acids in sesame oil prevent cardiovascular diseases, cancer, brain and liver damage, and hypertension [3,4].
Despite the importance of sesame seeds, the production of sesame in Japan had been on a negligible scale although it is gradually increasing, especially on abandoned paddy fields [5,6]. However, we previously reported yield decline of sesame on upland fields converted from paddy fields under intensive continuous monocropping as a result of changes in soil nutrient availability [7]. We reported decrease in available N and unbalanced exchangeable cations in which high quantities of Ca and Mg affected uptake of K. These changes or imbalances in soil nutrient status under continuous monocropping of sesame could affect sesame seed composition. Furthermore, cultivation factors such as type and concentration of fertilizer, climatic conditions, or soil type may also influence the chemical composition of crops [8]. Hence, the fertilizer application and changes in soil nutrient availability under continuous monocropping could play important roles in determining fatty acid composition as well as yield.
Soil macronutrients such as N, P, K, Ca, and Mg play important roles in plant growth and development including controlling seed quality. For instance, nitrogen (N) is generally required for synthesis of fat, which requires both N and carbon skeletons during seed development [9]. Recent research indicated that adequate soil N increased linoleic acid and linolenic concentrations in sesame seeds [10,11]. Other macronutrients, such as adequate soil P and K have been reported to increase oleic and linolenic acids, respectively, which are important unsaturated fatty acids. Furthermore, saturated fatty acids, such as lauric and palmitic acids, and oleic acid were reported to slightly increase in response to adequate soil K since K plays a role in fatty acid and lipid metabolism [12]. In addition to N, P and K, Mg is also a major plant nutrient in oil synthesis in oilseed crops [13]. Therefore, maintaining adequate supplies of these macronutrients in the soil would improve crop productivity and quality.
Several studies indicate yield decreases in continuous monocropping which is attributed to changes in nutrient status that also affect seed oil composition [14,15,16]. For instance, soybean yield decreased in continuous monocropping attributed to the imbalance in chemical and physical properties and consequently low seed quality [15,16]. In addition to low mineral quality, Bellaloui et al. [15] reported decrease in the oleic acid (C18:1) content whereas linoleic (C18:2) acid increased in continuous monocropping. Furthermore, a higher linoleic acid in continuous monocropping of canola compared to that in rotation was reported [17]. Yield decline of rapeseed has been reported in the fifth year of continuous monocropping, whereas fatty acid composition was greatly improved through increasing oleic, linoleic, and linolenic acids under different input technologies [18]. The detrimental effect of continuous monocropping may not reflect a decrease in seed quality depending on the management practices adopted.
Although sesame yield decline under continuous monocropping on upland fields converted from paddy fields has been reported [7], there is a lack of information on the fatty acid compositions of sesame seeds produced under such conditions. Moreover, one of the key factors that determine the quality of sesame seed is the fatty acid composition. Hence, it is important to understand how the fatty acid content is influenced in continuous monocropping of sesame as seed yield is negatively influenced.
The objective of this study was to evaluate the composition of the fatty acid in sesame seeds produced from four continuously monocropped fields while comparing seed fatty acid contents with sesame yield.

2. Materials and Methods

2.1. Location and Site Description

A field experiment was conducted on an upland field converted from an abandoned paddy field during summer in 2015 and 2016 at Tottori, Japan (35°29′15″ N, 134°07′47″ E). Four different adjacent fields A, B, C, and D with sesame cropping histories of 0–3 continuous monocropping years, respectively, were set up (Figure 1).
Briefly, prior to the start of this experiment, fields B, C, and D had been under continuous monocropping of sesame; field B had previously been cropped with sesame for one season (1 year), field C had been cropped for two consecutive seasons (2 years), and field D had been cropped for three consecutive seasons (3 years). Field A was a freshly established sesame field added at the start of the experiment in 2015. In this study, sesame was cultivated on these four fields, A, B, C, and D, for two consecutive years, 2015 and 2016, therein referred to as continuously monocropped sesame fields. The same agronomic practices of sesame were followed throughout the previous years of sesame cultivation before the start of this experiment. The soil chemical properties of the four continuously monocropped fields before start of the experiment in 2015 were analysed and are shown in Table 1.
The meteorological data of the experimental site in 2015 and 2016 included the mean monthly temperature, monthly rainfall, average seasonal temperature, and rainfall as shown in Table 2. During the two consecutive years, compared with year 2015, year 2016 showed markedly higher temperature and rainfall.

2.2. Field Experiment and Experimental Design

The experimental fields A, B, C, and D were ploughed to fine tilth and received nitrogen–phosphorous–potassium–dolomite basal fertilizer application as 70 kg ha−1 N, 105 kg ha−1 P2O5, 70 kg ha−1 K2O, and 1000 kg ha−1 dolomite (total alkali 53%, CaO 39.1%, and MgO 10%) as the recommended agronomic practice of sesame in the region. The N–P–K fertilizer was supplied in the form of cyclo-diurea (CDU) compound fertilizer (15%:15%:15%) and triple superphosphate for phosphorous (34%). This basal inorganic fertilizer together with dolomite was applied in every sowing season even before start of this experiment. The cultivation was carried out on raised ridges 75 cm wide separated by 40 cm onto which double rows of sesame at spacing of 45 cm × 15 cm were planted (115,942 plants ha−1). Each ridge was covered with black plastic mulch to reduce weeds and to maintain soil moisture. Five sesame seeds were sown per hole and later thinned to one plant after one month (first thinning was done after 2 weeks from sowing). In 2015, sesame was sown on 1 July 2015 and harvested on 28 September 2015 (89 days after sowing), while in 2016, sowing was done on 7 July 2016 and harvesting was on the 27 September 2016 (83 days after sowing).

2.3. Determination of Seed Yield and 1000-Seed Weight

At harvest time, 10 randomly selected plants from each plot in three replications were cut and capsules were tied in vinyl bags and allowed to dry in the greenhouse after which threshing was done and weight of the seeds were determined for yield analysis together with the weight of 1000 seeds.

2.4. Determination of Fatty Acids Compositions in Sesame Seeds

Total fatty acids and each fatty acid content were determined by using a total fat determination unit (Model B-815/B-820 Buchi, Flawil, Switzerland) [19]. Briefly, 6.0 g of sesame seeds harvested from 10 plants per replicates from each continuous monocropping field was milled in a blender in three replicates; 2.5 g of milled samples was added into the solvent vessel (glass boiling container). Then, 45 mL of n-butanol and 7 granules of potassium hydroxide (for saponification) were added, 0.26 g of tridecanoic acid C13 was added as internal standard, and one spatula of ascorbic acid (about 0.2 g) was added to prevent oxidation in the extraction vessel. Extraction and simultaneous saponification of the samples were carried out on extraction unit (Buchi, Flawil, Switzerland) at boiling temperature for 30 min. Then, 40 mL of sodium dihydrogen formic acid mixture was added to convert the potassium salts and fatty acids into free fatty acids, and the mixture was stirred for 3 min. The vessels were later removed from extraction unit and allowed to cool, resulting into a two-phase system with an organic phase containing fatty acids in the upper phase/layer which was separated; 3 mL of the top layer (upper phase) was transferred using a micropipette into a 3-mL vial. The total fatty acid content and composition were then determined by gas chromatography (Model B-820, Buchi, Flawil, Switzerland) using hydrogen carrier gas at a pressure of 225 kPa and mixture gas pressure of 48 kPa with injection temperature of 220 °C and FID detector (flame ionization detector) temperature 260 °C. The initial oven temperature was 130 °C, which was increased at a rate of 6.5 °C min−1 to the final steady temperature of 260 °C, which was held for 4 min before the run was terminated.

2.5. Soil Sampling and Analysis

Immediately after harvesting in each year, soil samples were taken at depths of 0–15 cm, air dried, sieved through a 2-mm screen, and stored for analysis. Soil samples were analysed for total N using dry combustion by CN-Corder (Macro corder JM 1000CN, J-Science Co., Ltd., Kyoto, Japan) and CN ratio was calculated from total N and total C obtained; exchangeable cations K, Ca, and Mg were calculated by atomic absorption spectrophotometer (Model Z-2300, Hitachi Co., Tokyo, Japan) after extraction of soils using 1 N ammonium acetate. Soil available P was determined using 0.002 N sulphuric acid in a mixture of ammonium sulphate as described by Truog [20]. The P concentration was measured by ammonium molybdate-ascorbic acid method on an absorption spectrophotometer at 710 nm (Model U-5100, Hitachi Co., Tokyo, Japan).

2.6. Data Analysis

All experiments were conducted in a completely randomized blocked design replicated three times. Data were analysed using one-way analysis of variance (ANOVA) using SPSS 22.0 (SPSS for windows Inc., Chicago, IL, USA) to evaluate the measured parameters affected by the different fields. Multiple comparison was performed using Tukey’s test at p < 0.05. Data are presented as mean ± standard error. When considering the differences between the cropping years, a two-way analysis of variance was used with the different years and fields as two fixed factors. Linear regression analysis was utilized to investigate the relationship between selected fatty acids such as oleic, linolenic, and lauric acid and 1000-seed weight with selected soil nutrients. In addition, principal component analysis (PCA) was performed to clarify the overall variability with respect to correlations among seed yield, 1000-seed weight, fatty acid contents, and soil chemical properties in the different fields that were treated as categorical data for both 2015 and 2016 cropping.

3. Results

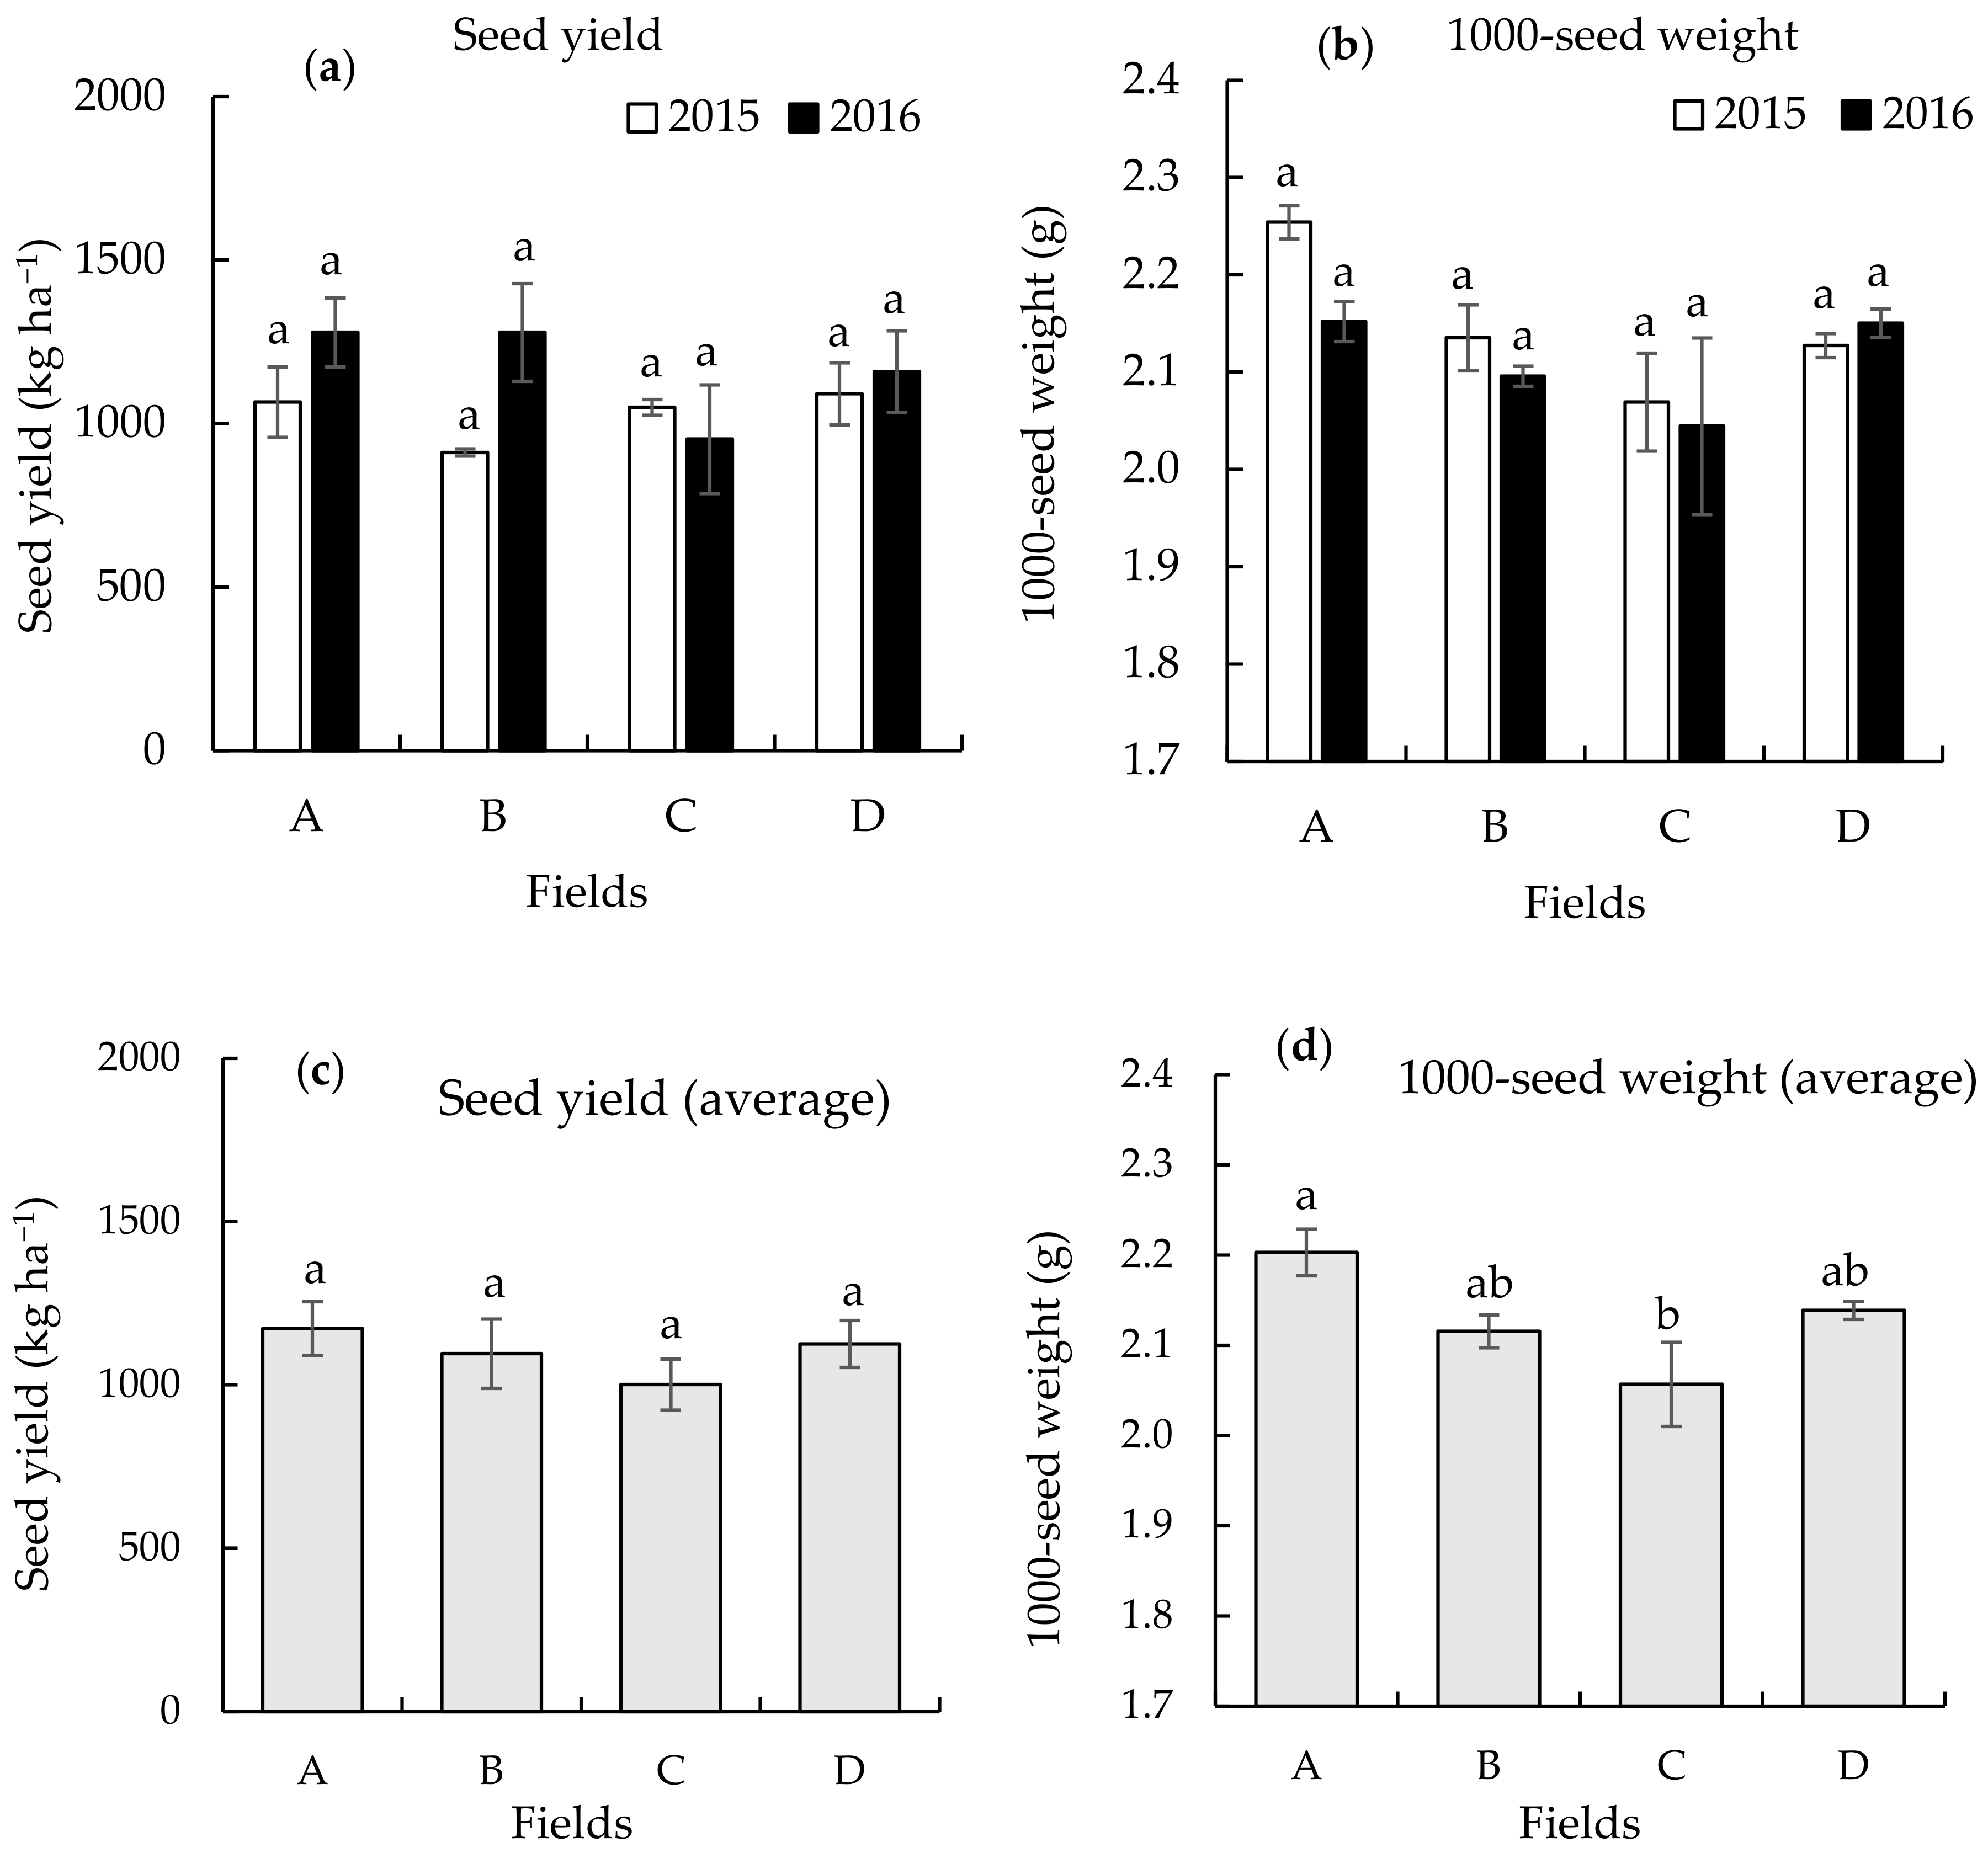
3.1. Seed Yield and 1000-Seed Weight on the Different Continuously Monocropped Fields in 2015 and 2016

Analysis of variance showed that the fields and years had no significant effects on the seed yield and no significant interaction between fields and years (Figure 2).
In 2015, the seed yield was in the range of 912 ± 11.1–1091 ± 95.0 kg ha−1, with the lowest seed yield in field B although no significant difference among the four continuously monocropped fields was observed (Figure 2a). The 1000-seed weight was in the range of 2.07 ± 0.05–2.2 5 ± 0.02 g; however, a significant difference (p < 0.05) was found only between fields A and C (Figure 2b).
In 2016, the seed yield and 1000-seed weight showed no significant differences among the four continuously monocropped fields. However, both the seed yield and 1000-seed weight were lower in field C by 25.5% and 5.12%, respectively, compared to field A. The seed yield was in the range of 953 ± 165.8–1279 ± 105.6 kg ha−1, with the lowest seed yield in field B, whereas the 1000-seed weight was in the range of 2.04–2.15 g, with the lowest in field C, according to Figure 3.
Averaged over 2015 and 2016, field C produced the lowest seed yield and 1000-seed weight, with mean values of 1001 ± 78.0 kg ha−1 and 2.06 ± 0.05 g, respectively, although no significant difference was observed between the different years and no significant interactions were observed between fields and years (Figure 2c,d). Overall, field A produced the highest mean seed yield of 1172 ± 82.5 kg ha−1 accompanied by the highest 1000-seed weight of 2.20 ± 0.03 g. In addition, the 1000-seed weight showed significant differences (p < 0.05) between fields A and C.

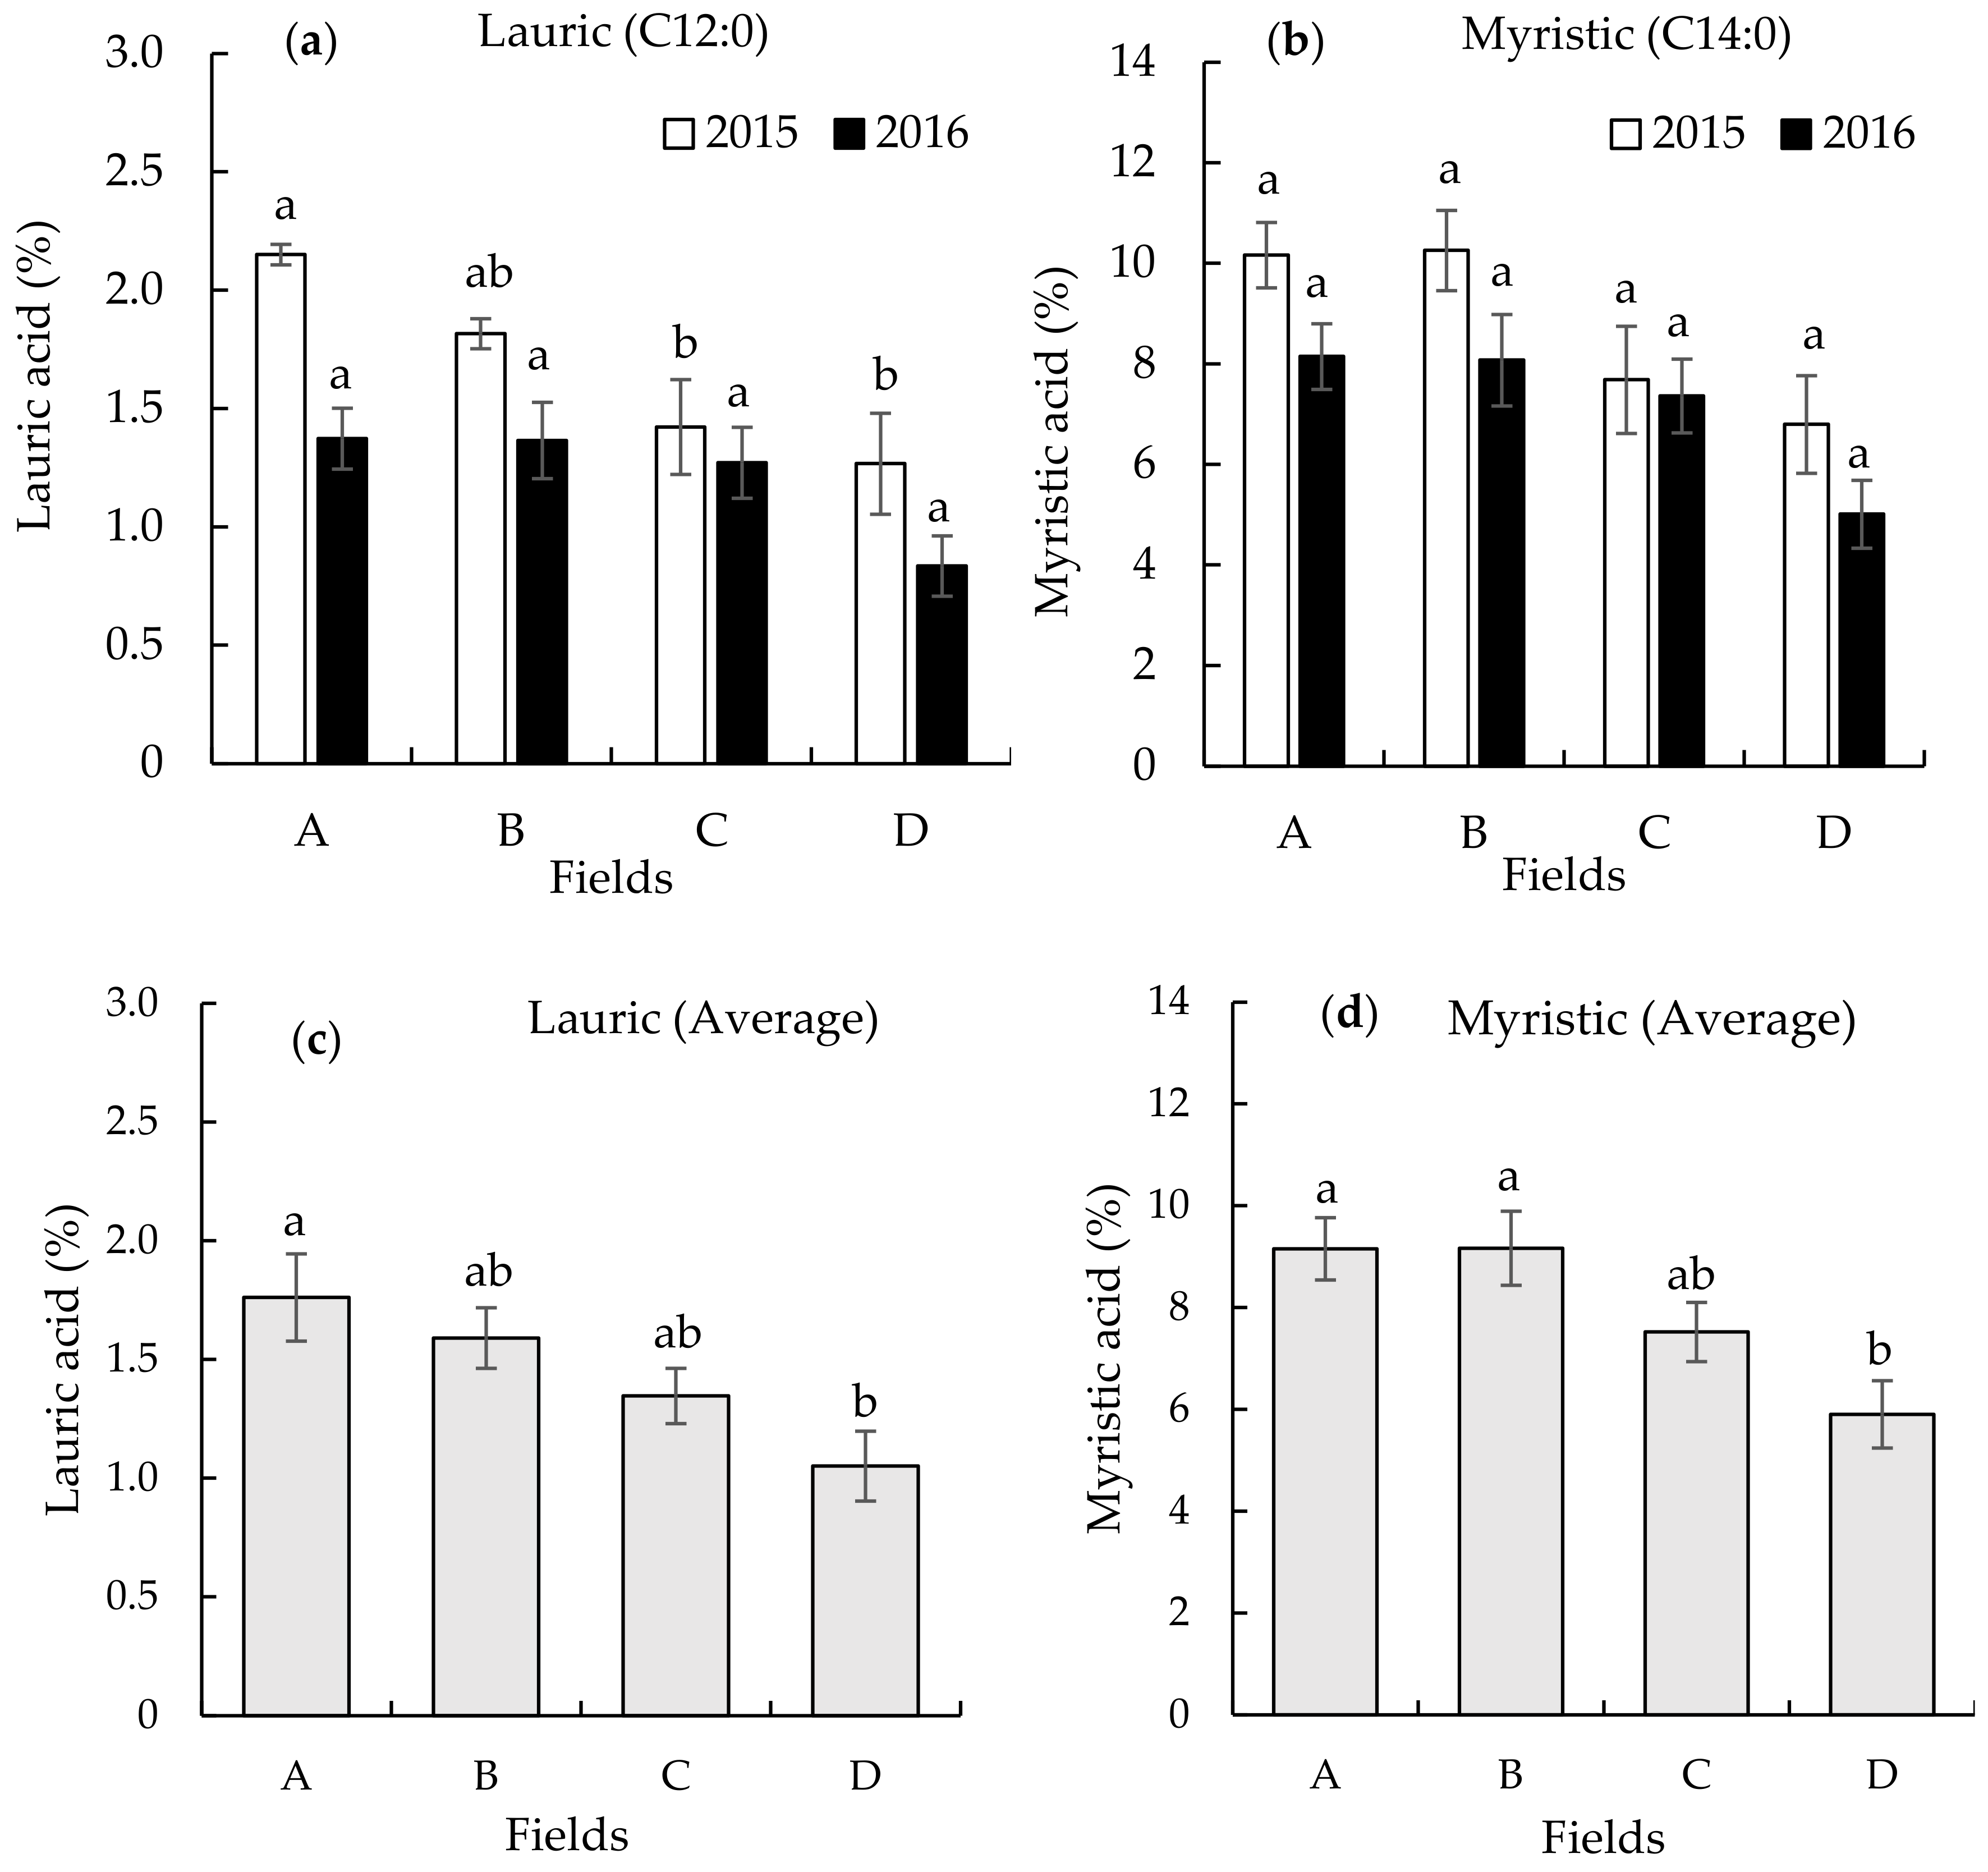
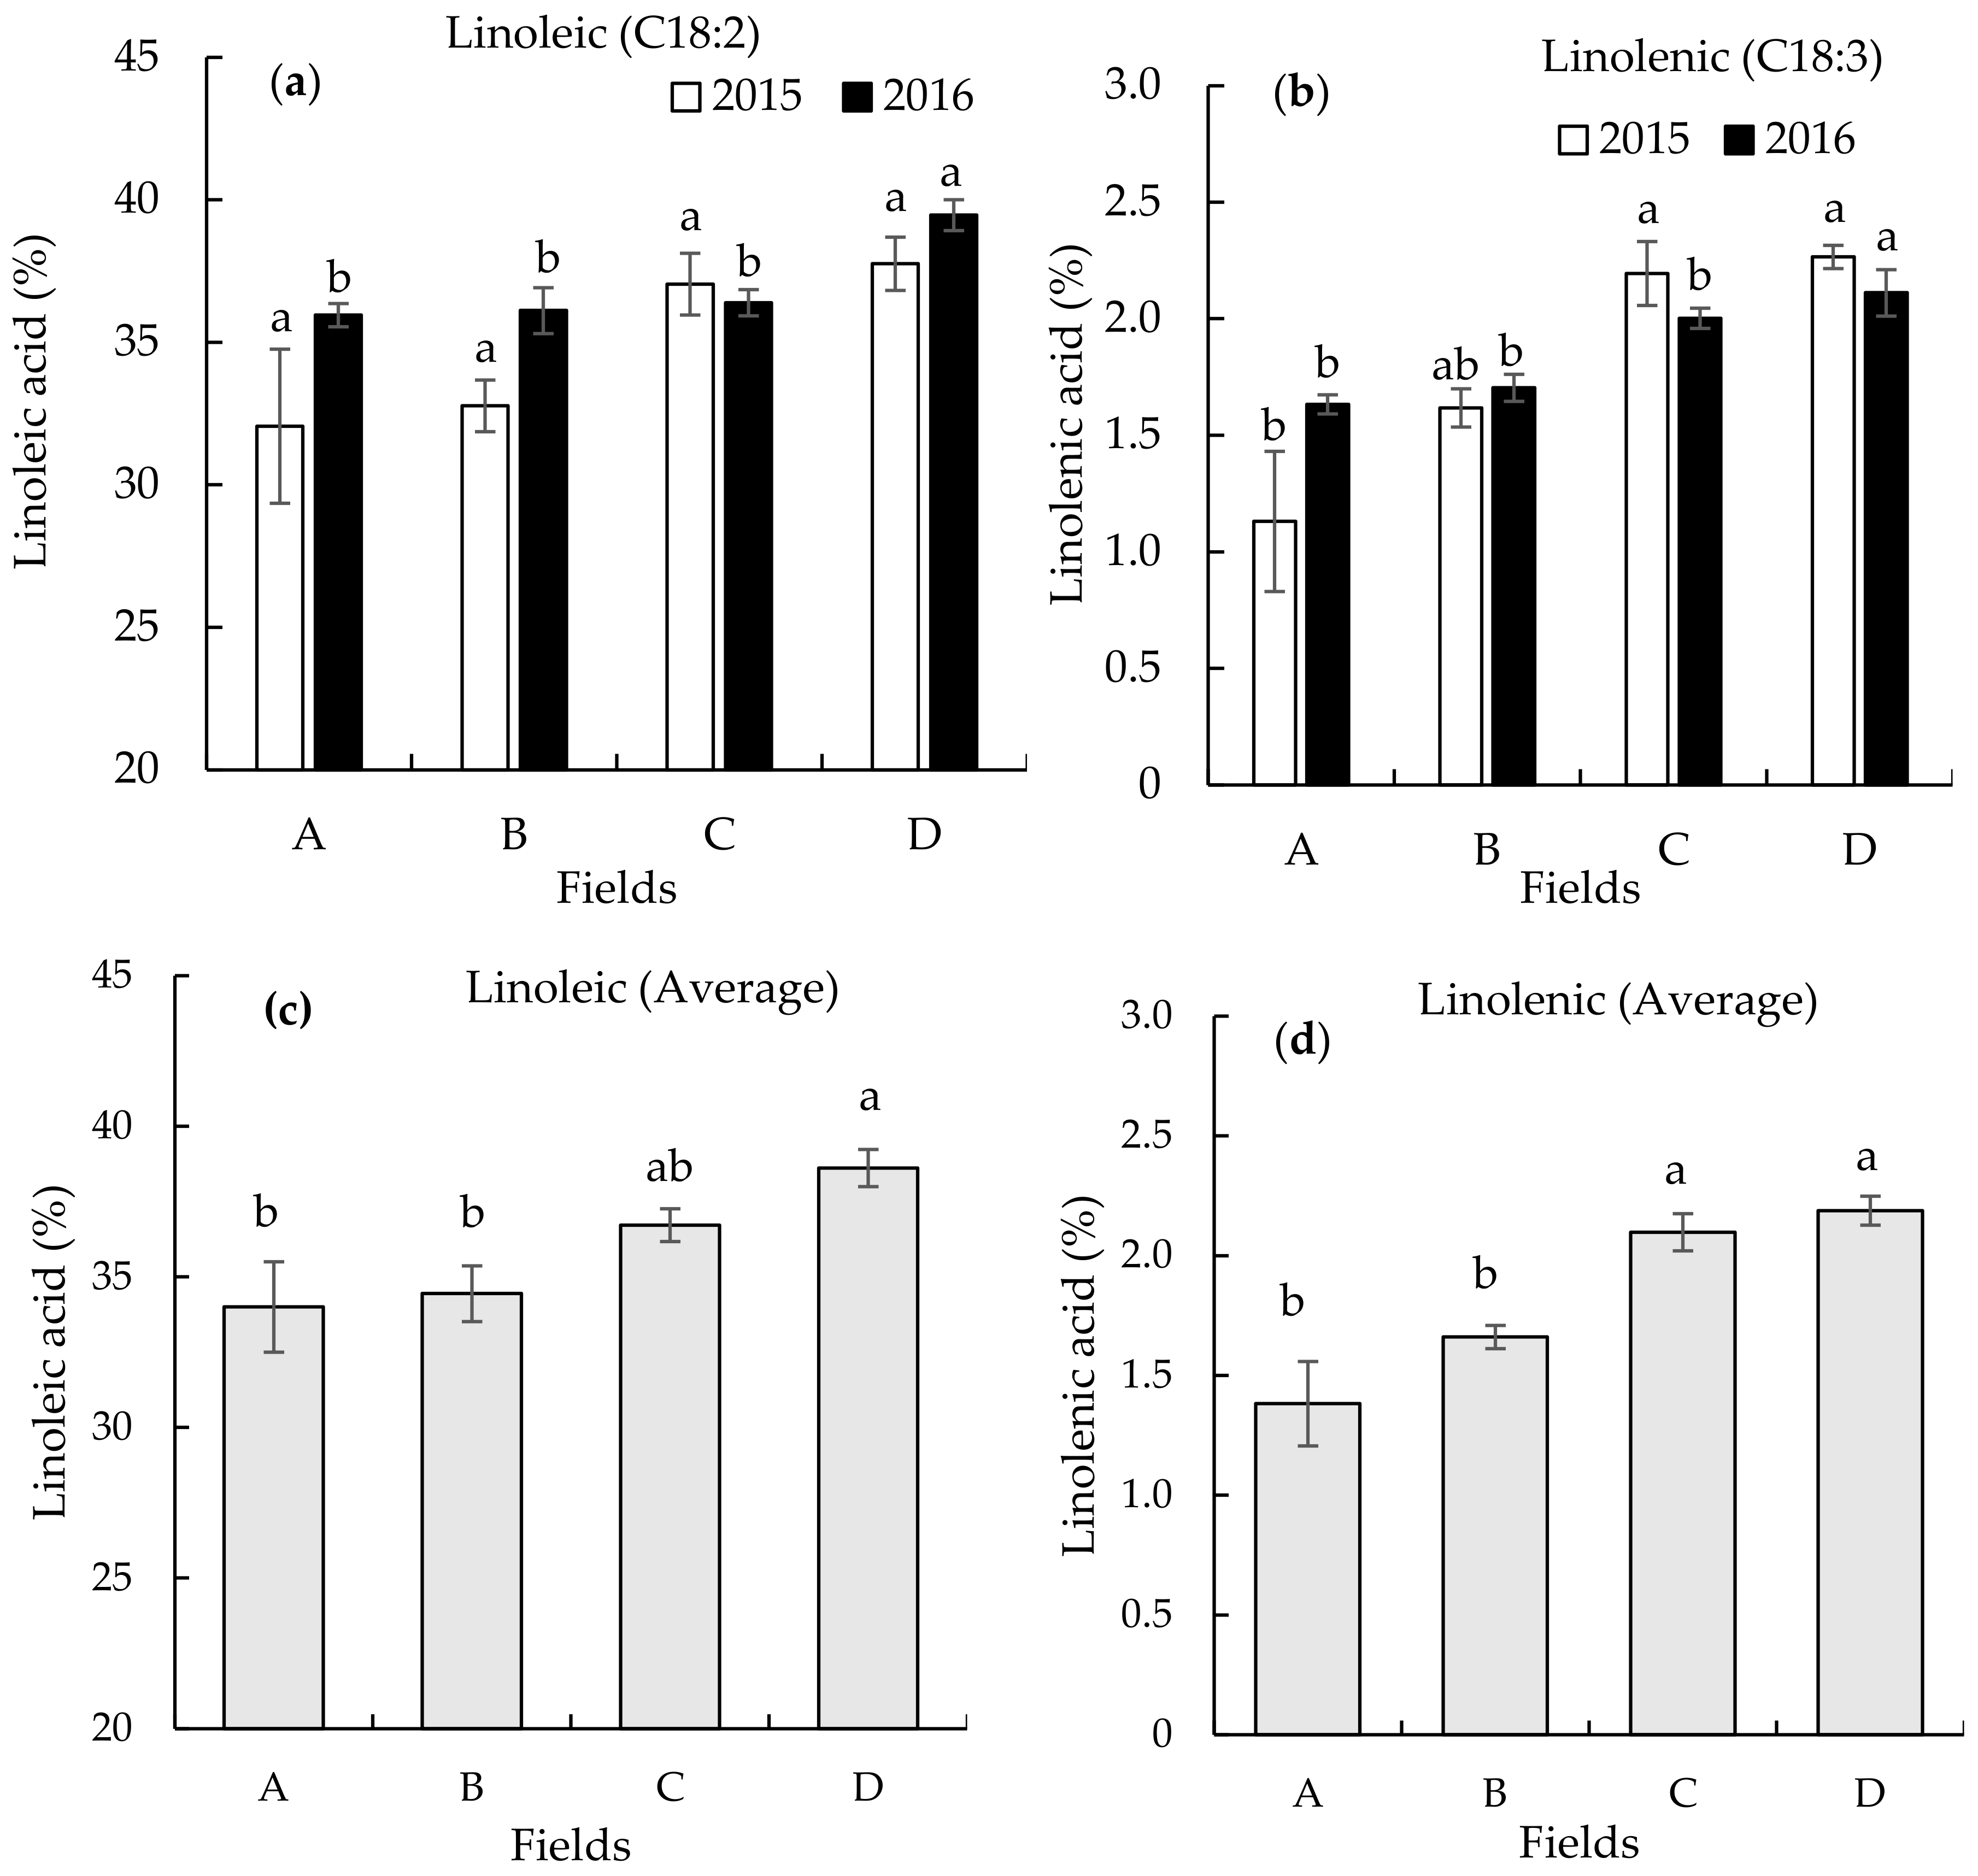
3.2. Seed Fatty Acid Composition on the Different Continuously Monocropped Fields in 2015 and 2016

The total fatty acid (TFA); saturated fatty acids (SFA); monounsaturated fatty acids (MUFA); polyunsaturated fatty acids (PUFA); and individual fatty acids capric (C10:0), lauric (C12:0), myristic (C14:0), palmitic (C16:0), oleic (C18:1), linoleic (C18:2), and linolenic (C18:3) acids were analysed in the sesame seeds from the continuously monocropped fields and are shown in Table 3 and in Figure 3 and Figure 4.
Results showed that there were no significant differences in the contents of TFA, MUFA, PUFA, capric, palmitic, and oleic acids in 2015 (Table 3). In 2015, SFA was significantly higher in field B (11.4 ± 0.67%) compared to field D (8.08 ± 0.63%), indicating a negative influence of continuous monocropping on the saturated fatty acid contents of the sesame seeds. In 2016, only PUFA showed significant (p < 0.05) differences among the fields; the highest PUFA content was in field D (21.3 ± 0.31%) and was significantly different from field B (19.2 ± 0.13%). Results also showed that neither field nor the field × year effect was significant on the contents of TFA, SFA, MUFA, PUFA, capric, palmitic, and oleic. However, the effect of year was significant on MUFA and palmitic and oleic acids, revealing higher contents of MUFA and oleic acids in 2016 compared to 2015.
In 2015, the content of lauric acid was significantly higher in field A (2.15 ± 0.04%) compared to fields C (1.42 ± 0.20%) and D (1.27 ± 0.21%) (Figure 3a) whereas myristic acid content did not differ significantly among the fields (Figure 3d). Analysis of variance showed that the year had significant effects on the contents of lauric and myristic acids of the sesame seeds. The contents of lauric and myristic acids were significantly lower in 2016 compared to 2015. On the other hand, the effect of field was significant on the contents of lauric and myristic acids without significant year and field interaction. Averaged over 2015 and 2016, field A produced the highest contents of lauric and myristic acids in sesame seeds compared with field D with mean values of 1.76 ± 0.18% and 9.15 ± 0.61%, respectively (Figure 3c,d).
In 2015, there was no significant differences in linoleic acid contents among the fields (Figure 4a). In 2016, linoleic acid showed a significant difference among the fields with the highest linoleic acid content detected in field D (39.5 5 ± 0.54%). In 2015, the content of linolenic acid was significantly lower in field A (from 1.13 ± 0.30%) compared to field D (2.26 ± 0.05%), indicating that continuous monocropping improved the content of linolenic acid (Figure 4b). In 2016, the linolenic acid content was significantly higher in field D (2.11 ± 0.10%) compared to field A (1.63 ± 0.04%) without significant differences among the fields A, B, and C.
Analysis of variance showed that the year had significant effects on the contents of linoleic acids of sesame seeds. The contents of linoleic acids were significantly higher in 2016 than 2015. The effect of field was significant on the contents of linoleic and linolenic acids without year and field interaction. Averaged over 2015 and 2016, field D produced the highest contents of linoleic and linolenic acids in the sesame seeds compared to fields A and B, with mean values of 38.6 ± 0.61% and 2.19 ± 0.06%, respectively (Figure 4c,d).

3.3. Soil Chemical Properties on the Different Continuously Monocropped Fields in 2015 and 2016

Analysis of variance showed that the year and field had significant effects on all the measured soil chemical properties except exchangeable Mg, which was not influenced by the field effect (Table 4). However, exchangeable Mg, including EC, TN, and C/N ratio showed significant interactions between years and fields.
In 2015, soil pH, C/N ratio, and exchangeable Ca was significantly higher in field D compared to fields A and B. The soil pH was higher by 0.88 units, whereas the C/N was higher by 1.37 and exchangeable Ca was higher by 519.8 mg kg−1 in field D compared to field A. Conversely, the soil EC, TN, available P, and exchangeable K were higher by 0.08 units, 0.45 g kg−1, 22.9 mg kg−1, and 181.5 mg kg−1, respectively, in field D compared to field A. However, the soil EC, P, and K did not show significant difference among the fields A, B, and C, whereas significant differences in TN were observed between field B and C. In 2016, soil pH, C/N, and exchangeable Ca and Mg were significantly higher in field D by 0.64 units, 0.48, 925.8 mg kg−1, and 101.6 mg kg−1, respectively, compared to field A. There were no significant differences in pH, C/N, and Mg between fields B, C, and D and between B and C for exchangeable Ca. Conversely, soil EC was lower by 0.03 units in field B compared to A; no significant differences were observed in the soil EC between B, C, and D and between A and D. The available P and exchangeable K were significantly lower in field D by 36.1 and 228.9 mg kg−1, respectively, compared to field A.
Results also showed that soil EC was significantly lower in 2016 in fields A, B, and C compared to 2015 whereas TN, P, and K values were lower in 2016 than in 2015 in all fields. On the other hand, the exchangeable Ca and Mg were significantly higher in field D in 2016 compared to 2015.

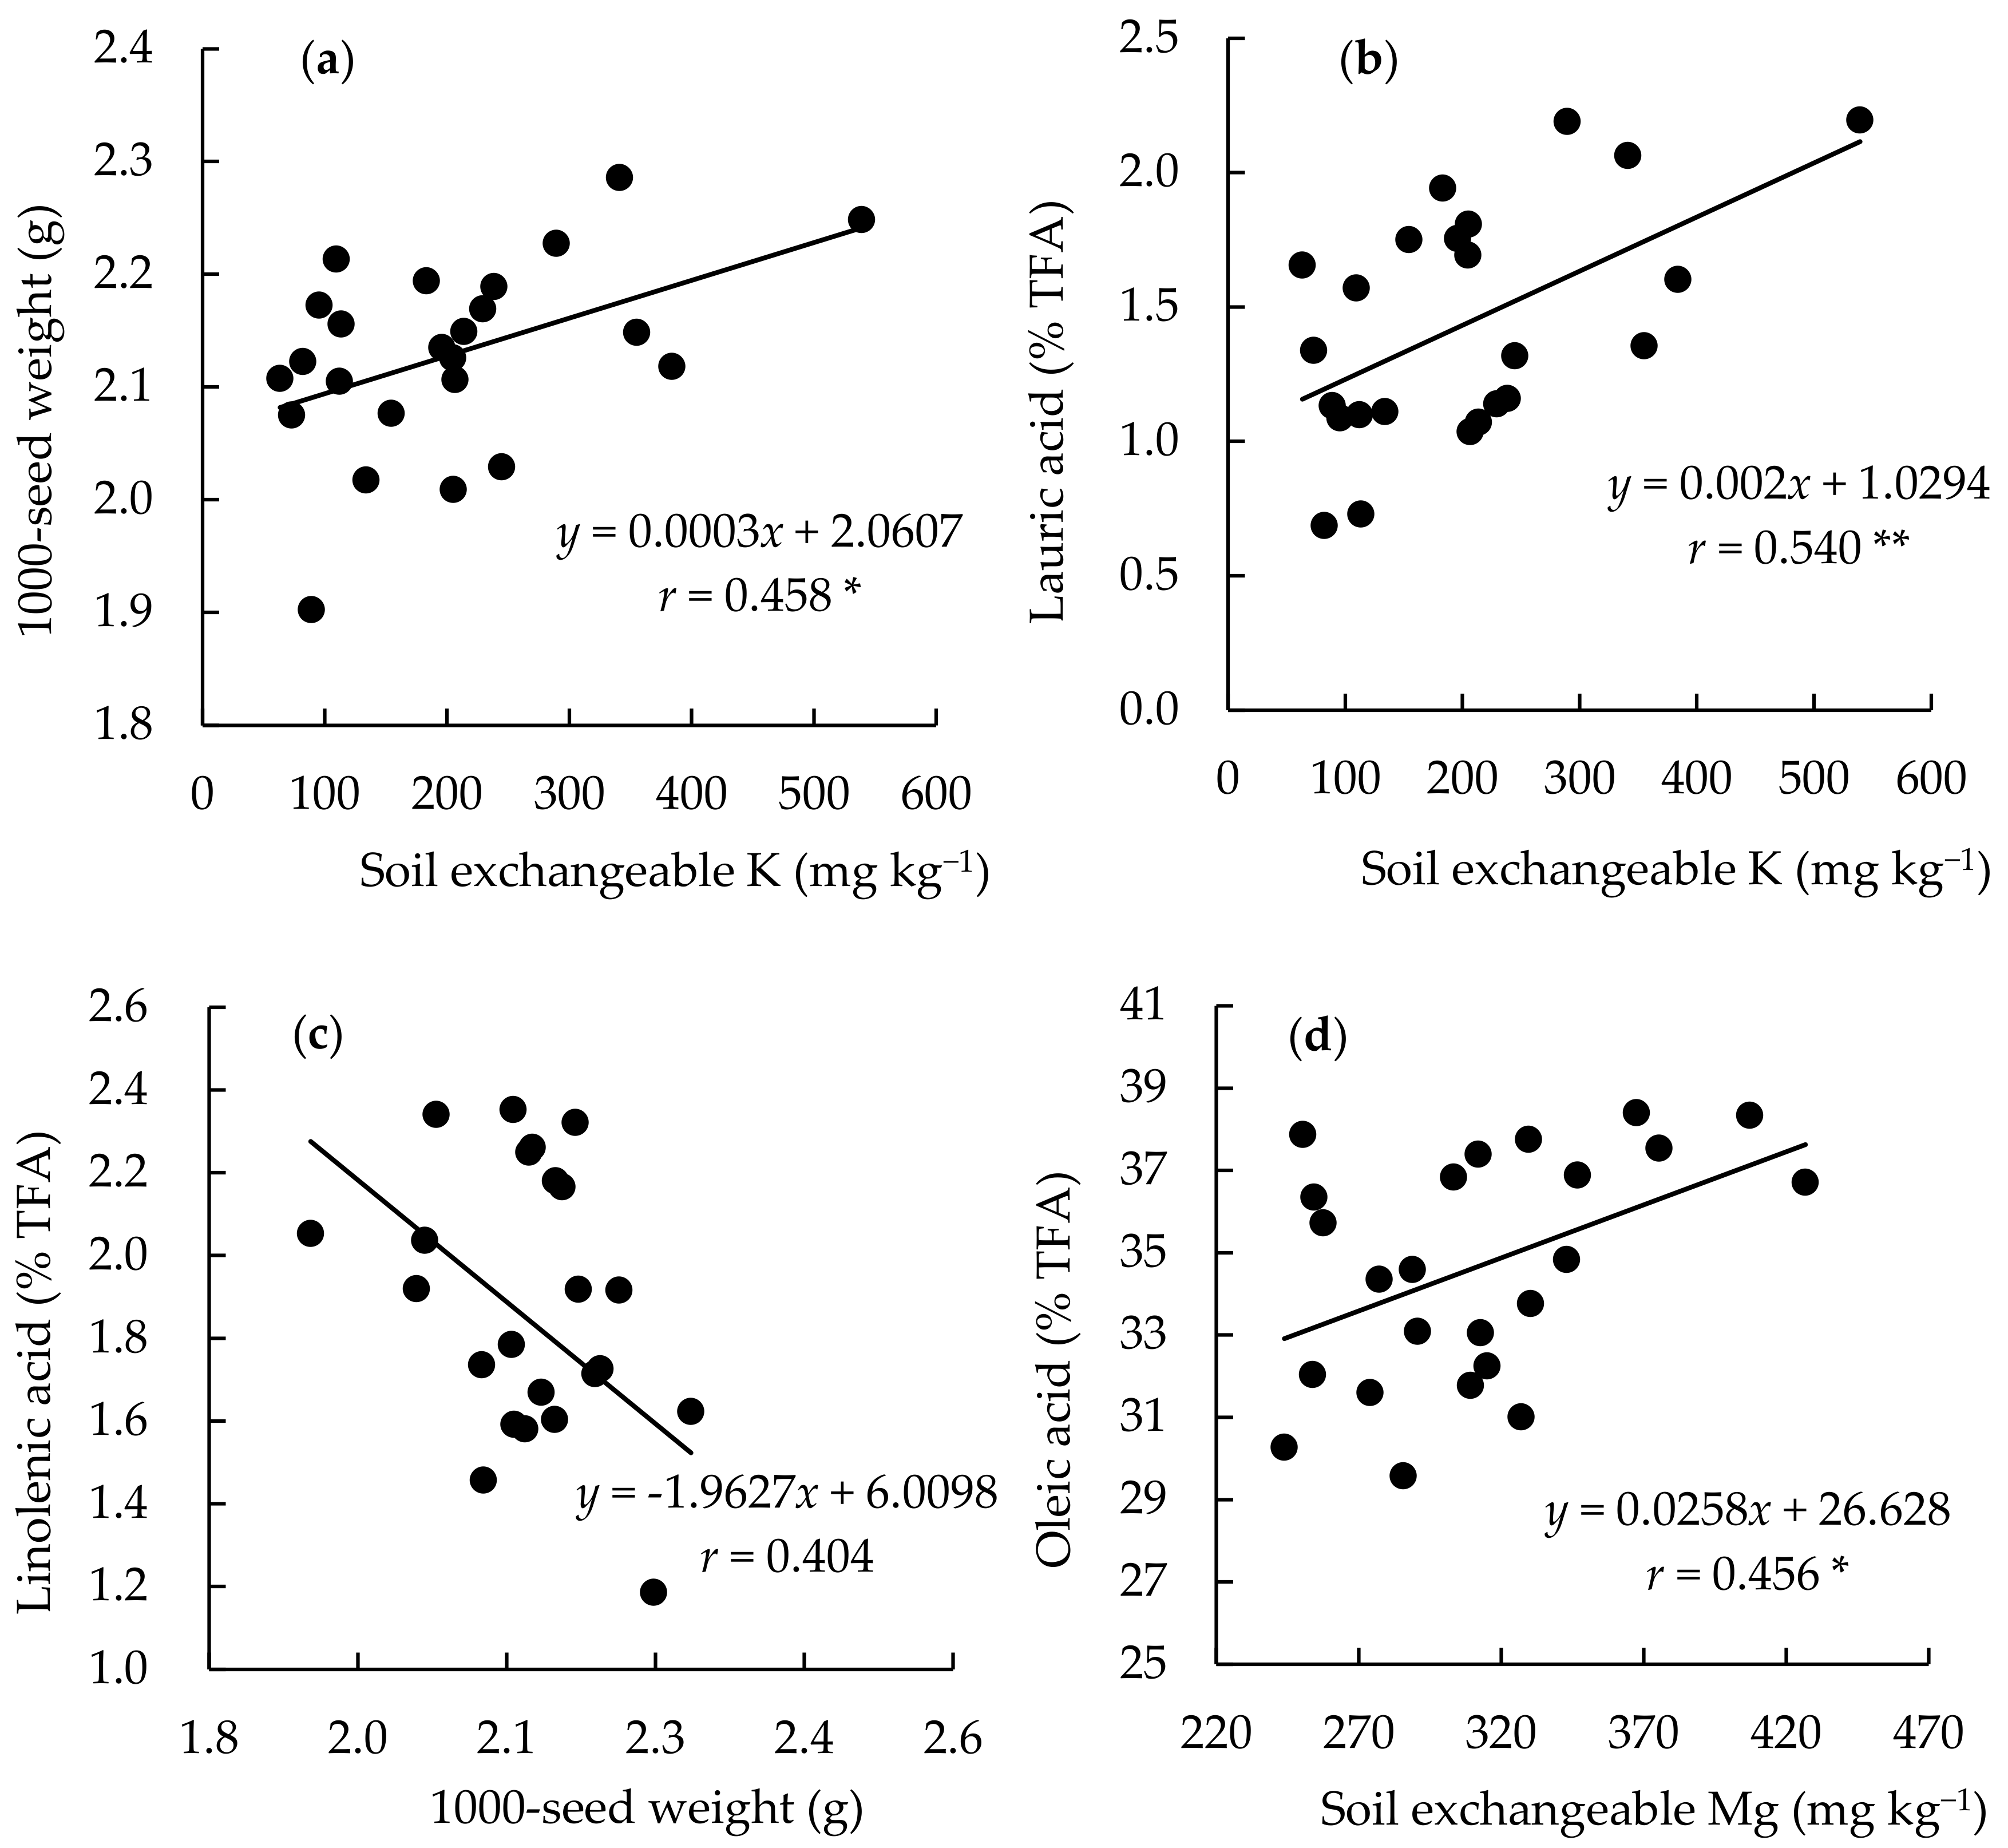
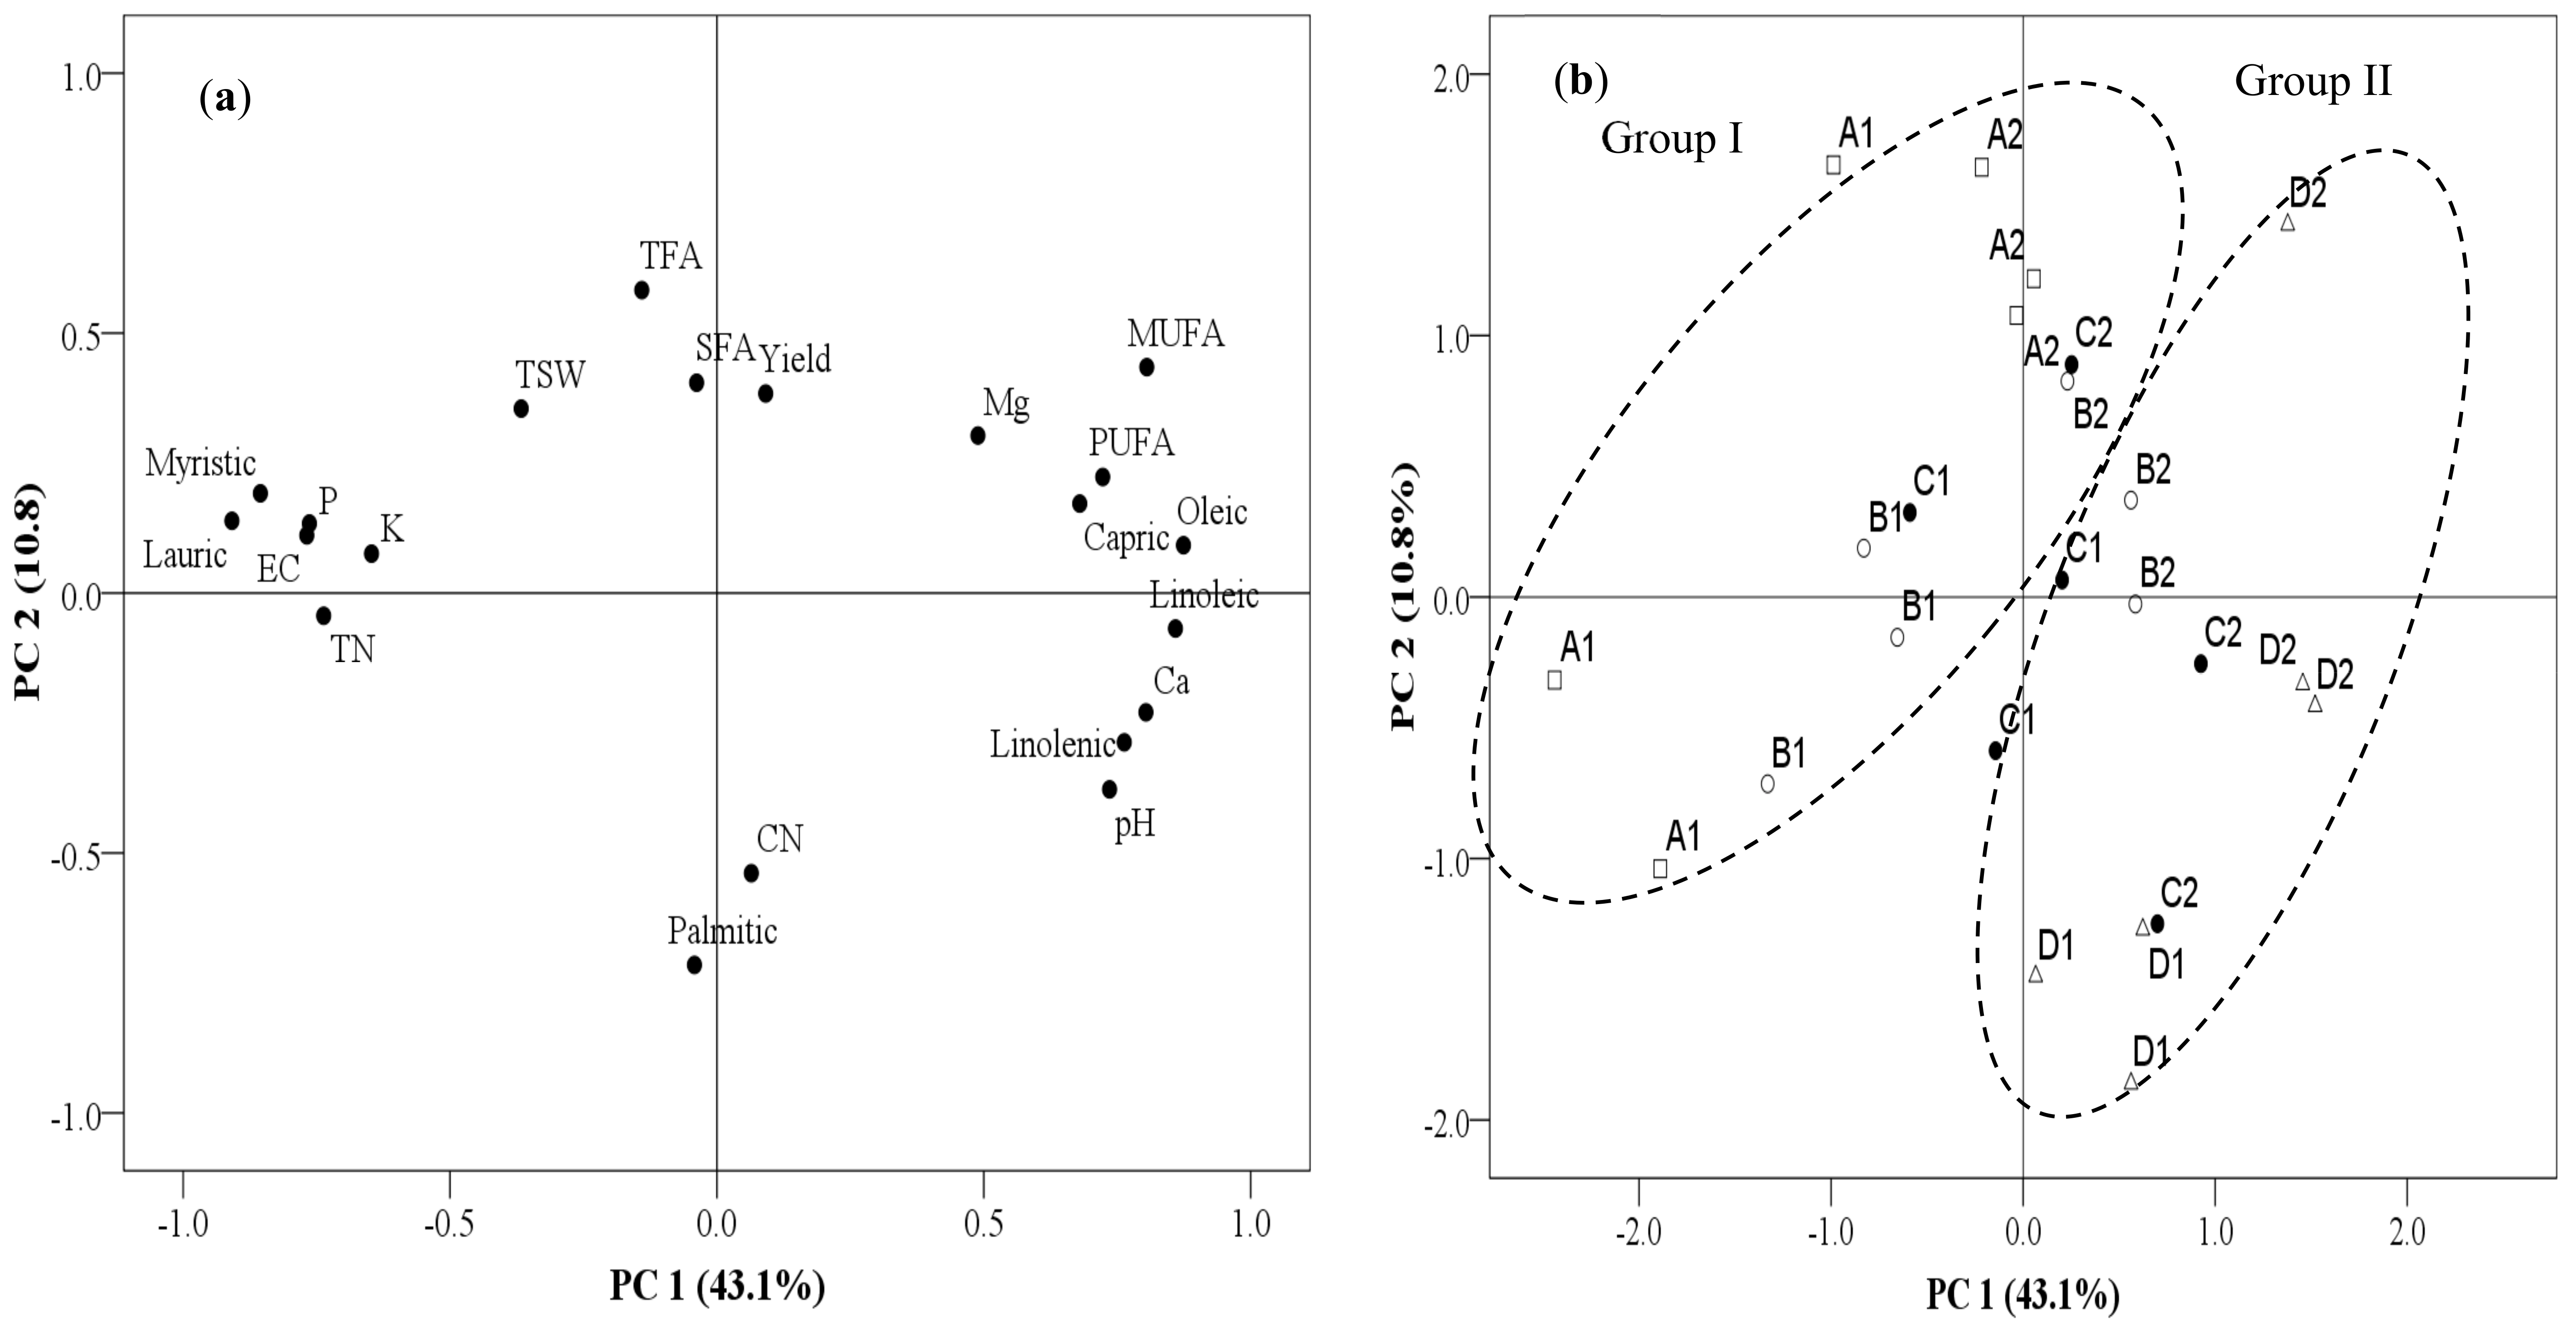
3.4. Relationship between Yield, Fatty Acid, and Soil Chemical Parameters among the Continuously Monocropped Fields

The correlation analyses conducted between selected parameters are shown in Figure 5. The correlation analyses indicated a significant positive linear regression (r = 0.458, p < 0.05) between the soil exchangeable K and 1000-seed weight (Figure 5a). In addition, there was a significant positive correlation between the lauric acid content and soil exchangeable K with a linear regression (r = 0.540, p < 0.01), as shown in Figure 5b. Furthermore, a significant positive correlation (r = 0.456, p < 0.05) between the oleic content and soil exchangeable Mg in the average data of two years among the different continuously monocropped fields was observed (Figure 5c). On the other hand, a negative correlation (r = −0.404, p = 0.05), as shown in Figure 5d between linolenic acid and 1000-seed weight, was observed.
In addition to the correlation analysis, principal component analysis (PCA) was performed to visualize the relationship between variables and continuous monocropping fields. A summary of the total variation of seed yield, 1000-seed weight, fatty acid composition, and soil chemical properties analysed is presented by the first two factors of the PCA data, which explains 53.9% of the total variance (Figure 6a). The first principal component (PC 1) is attributed to 43.1% of the total variance and shows a high positive correlation mainly with oleic, linoleic, PUFA, linolenic, and soil exchangeable Mg content and a high negative correlation with lauric acid, myristic acid, and soil exchangeable K contents. The second factor (PC 2) obtained by the PCA analysis accounts for 10.8% of the total variance among the continuous monocropping fields and is positively correlated with TFA, SFA, and yield whereas is negatively correlated with the C/N ratio and palmitic acid content. The score plot of the PCA (Figure 6b) shows a relatively good separation of two clusters: group (I) from fields A and B and group (II) from fields C and D. Group (I) showed high values for contents of lauric acid, myristic acid, soil exchangeable K, and 1000-seed weight (TSW), whereas group (II) showed high values for contents of oleic acid, linoleic acid, linolenic acid, MUFA, PUFA, and soil exchangeable Mg in both years 2015 and 2016.

4. Discussion

In this study, the1000-seed weight gradually decreased from fields A to C, suggesting negative effects of continuous monocropping on sesame (Figure 2d). The decrease in 1000-seed weight signifies that yield decline is consistent with Kelly et al. [21], who found that yield decline of soybean under continuous monocropping is attributed to low seed weight. The decrease in 1000-seed weight and, consequently, yield of sesame has previously been attributed to decrease in N availability and to decrease in the uptake of K [7]. Our study showed markedly lower TN and exchangeable K in all continuously monocropped fields in 2016 when compared with those in 2015. The decrease in the soil total nitrogen (TN) in continuous monocropping is consistent with early findings that show low total N, indicating the loss of soil quality [22,23,24]. Our previous study showed that, as the total N decreased in the long duration of continuous monocropping, the available forms of N and NH4+-N was significantly decreased, affecting uptake of N in sesame plants that partly decreased 1000-seed weight [7]. Apart from decrease in N and K, several factors such as soil borne diseases, allelopathy, and autotoxicity from root exudate or decomposing residues interact together under field conditions to cause yield declines under continuous cropping [25,26].
Results showed that the increase in the exchangeable Ca content from dolomite increased soil pH, which could have a negative effect on K availability through upsetting soil cation ratios. For instance, the soil Ca/K ratio significantly increased from 3.31 in field A to 10.4 in field B, 9.54 in field C, and 12.5 in field D, indicating low exchangeable K in the soils since increase in one cation results in deficiency of another [13]. Furthermore, K deficiency in sesame occurs in soils with high Ca and Mg, which have imbalance of Mg/K and Ca/K ratios, which often results in yield decline reflected by low seed weight [27]. Other decreases in K availability could be attributed to annual removal of crop because sesame requires high amounts of potassium for growth and the seed usually accumulates high amounts of K as part of mineral nutrient [28]. Uptake of K by crops is usually high, resulting in decline in available K, which is high in soils with low reserves of K under continuous monocropping [29].
Our study also showed that continuous monocropping could alter sesame seed quality. The contents of lauric and myristic acids were low on fields with longer duration of continuous monocropping as the contents of oleic, linoleic, and linolenic acids were improved (Table 3, Figure 3 and Figure 4). The low contents of saturated fatty acids (SFA) including lauric and myristic acids on the different continuous monocropping field could be due to differences in the soil nutrient status such as low levels of exchangeable K. The low soil exchangeable K levels could have decreased lauric and myristic acids because these acids mainly exist in the form of potassium laurate and potassium myristate that are referred to as potassium fatty soaps with antibacterial and antifungal activities [30,31,32]. For instance, in 2016, lauric acid significantly decreased to 1.37% from 2.15% in 2015 for field A. The decrease in soil exchangeable K also accounted for low saturated fatty acids content in sesame especially in fields C and D. It has been reported that increasing potassium (K) fertilization increased saturated fatty acids such as palmitic, stearic, and myristic acids in black cumin [12]. K in sesame is also associated with the role of carbohydrate, protein, and oil synthesis of plants [33]. Moreover, there was significant positive correlation between the lauric acid content and soil exchangeable K with a positive linear regression showing a good prediction in the lauric acid as soil exchangeable K decreased under continuously monocropped fields (Table 4 and Figure 5). Furthermore, the high 1000-seed weights correlate with high lauric acid content in the sesame seeds for shorter duration of continuous monocropping as observed in fields A and B. It has been reported that high 1000-seed weight has a high positive correlation with lauric acids in Cuphea lutea seeds [34]. With increase in the duration of continuous monocropping, the 1000-seed weight decreased. This implies that seed yield also decreased, leading to fewer seeds harvested with low lauric acid content but with higher content of oleic, linoleic, and linolenic acids.
The higher contents of oleic, linoleic, and linolenic acids including MUFA and PUFA from fields C and D suggested continuous monocropping improved fatty acid quality of sesame. Bellaloui et al. [15] also reported similar increase in linoleic acid content in continuous monocropping of soybean. The increase in oleic, linolenic, and linoleic acids showed that the fatty acid quality of sesame seeds produced on these continuously monocropped fields is high, especially in fields C and D, although the yields were low. The results of fatty oleic, linoleic, and linolenic acids were on average in the ranges of 33.7–36.3%, 34.0–38.6%, and 1.38–2.19%, respectively. The oleic acids and linoleic acid contents were the two most dominant fatty acids in the sesame seeds that are consistent with the contents reported by other researchers [35,36,37]. The higher contents of oleic, linoleic, and linolenic acids from fields C and D could be a result of high soil exchangeable Mg contents from annual fertilizer application, including large quantity of dolomite, which was readily available for sesame plants. Although not in sesame, it was found that the fatty acid composition, especially oleic acid in olive plants, significantly increased due to foliar application of magnesium and potassium sulphate [38]. Similarly, the application of magnesium sulphate containing 16% MgO and 13% S has also been reported to increase sesame oil content [39]. However, large quantities of soil Mg could result in significant yield reduction not due to Mg toxicity but due to imbalances in soil cations Ca, K, and Mg, inducing deficiencies of K [7,40]. Overall, magnesium is considered as one of the nutrients very important in oil crops because magnesium (Mg2+) ion regulates fatty acid synthesis and adequate Mg2+ concentrations are needed for maximum rate of fatty acid synthesis in plant tissues [41,42]. In addition, magnesium plays a role in photosynthesis through controlling enzyme activities involved in photosynthetic carbon metabolism and Mg2+ is also a structural component of the chlorophyll involved in phloem loading of assimilates [43]. In this study, there was significant positive correlation between the oleic acid content and soil exchangeable Mg content among the different continuously monocropped fields (Figure 5d). A negative correlation between linolenic acid and 1000-seed weight was observed, indicating an inverse relationship between the quantity and quality of sesame seed oil produced in this system of continuous monocropping (Figure 5c). These correlations confirmed that Mg played a significant role in improving the quality of the fatty composition of the sesame seed.
On the other hand, the high values of saturated fatty acids, especially lauric and myristic acids in the short duration of continuous monocropping of fields A and B, could be partly explained by the high N–P–K levels in the soil. Fertilizer management influences fatty acid composition since it directly affects soil nutrients [11,44,45]. In our study, soil total N was the highest in the short duration continuously monocropped fields A and B but had high saturated fatty acid contents, suggesting that adequate N partly increased synthesis of saturated fatty acids. Zheljazkov et al. [46] reported that N could influence the composition of total saturated fatty acids through increasing individual saturated fatty acids. Several studies showed that oilseed crops respond well to N–P–K fertilizers in terms of yield and quality [47,48,49]. Therefore, inadequate soil N–P–K amounts as observed in fields C and D compared to A could limit not only yield (1000-seed weight) but also oil synthesis, consequently affecting the saturated fatty acid quality [48].
Usually, N is involved in protein synthesis, but occasionally, a high uptake of N promotes protein synthesis (crude protein) while carbohydrates synthesis (related to oil content) is decreased, negatively affecting the content of oil and fats [50]. An earlier study reported that a high crude protein content at high N uptake but reduced oil content of sesame was observed, suggesting that protein synthesis and storage were favoured over oil synthesis [28]. Therefore, it could be speculated that, as the total N decreased in fields C and D, indicating their poor N uptake, such a phenomenon of high protein synthesis did not occur but rather more carbohydrates were synthesized accompanied by high Mg content, which plays a role in fat synthesis. It is known that the fatty acid synthesis pathway usually occurs in the chloroplasts of green tissues, especially the leaves of plants during photosynthesis from the product acetyl CoA [32,51]. During photosynthesis, phosphoenolpyruvate is the major substrate involved in the lipid biosynthesis pathway; however, both protein and lipid synthesis utilize the same substrate (phosphoenolpyruvate); therefore, the increase in total oil content or fat content could imply a significant decrease in total crude protein content of seeds due to the competition for the carbon source [52], which could be confirmed by our previous study that showed the seed crude protein content decreased under continuous monocropping of sesame on upland fields converted from paddy fields [53]. Therefore, under this system of continuous monocropping, decreasing in total N and protein content could have beneficial effects on quality of fatty acids in the presence of adequate Mg.
This study also showed that the fatty acid contents of 2016 were higher than that in the 2015 samples (Table 3, Figure 3 and Figure 4). The fatty acid compositions were seemingly affected by the seasonal temperature and rainfall. In 2016, the total seasonal temperature and rainfall were 24.25 °C and 165.25 mm whereas the total seasonal temperature and rainfall in 2015 were 23.15 °C and 132.25 mm, indicating increase in both temperature and rainfall in 2016 (Table 2). Usually, high temperatures can increase seed fatty acid contents such as palmitic acid (saturated fatty acid) and oleic which could explain the high oleic acid content in 2016 [54,55]. This is partly because the synthesis of fatty acid is regulated by enzymes such as oleate desaturase of which the activity is dependent on temperature [56,57]. In addition, the variation between 2015 and 2016 in all fields could have been due to differences in the water availability that affected seed composition. The growing season of 2016 had nearly twice as much rainfall in September besides more rainfall in August than in 2015 during the development of sesame capsules, and this could have contributed to the increased fatty acids compositions, both saturated and unsaturated, especially in oleic and linoleic content [58].
Our study demonstrated that, as yield may adversely be affected in continuous monocropping, the fatty acid quality could be improved, as indicated by the principal component analysis (PCA) in Figure 6. The PCA showed co-relationships among oleic, linoleic, linolenic, PUFA, MUFA, and soil exchangeable Mg, which confirmed that continuous monocropping significantly improved contents of these fatty acids due to the high soil Mg content in fields B and C. There is also co-relationship among myristic acid and lauric acid with soil exchangeable K content and 1000-seed weight which further confirmed that lauric and myristic acids were high in fields A and B with short duration of continuous monocropping due to high potassium in the soil, including soil N. The high 1000-seed weight observed in fields A and B is also confirmed by the PCA and showed that seed weight correlated with potassium in the soil. With continuous monocropping of sesame, the declining levels of potassium have a negative effect on seed yield, lauric acid, and myristic acid while the increase in the magnesium levels increases the oleic, linoleic, linolenic, overall mono-unsaturated and poly-unsaturated fatty acids. Although, there was a tendency of yield to decrease, the overall fatty acid quality was enhanced, indicating that management practices could influence the quality of sesame seeds produced in continuous monocropping system. The sesame seeds produced under this continuous monocropping, especially on fields C and D, are highly suitable for human consumption to improve health because the unsaturated fatty acids in sesame seeds which include linoleic and oleic acids are mainly responsible for the oil quality [59]. Therefore, our study suggests that, under continuous monocropping, it is likely that both linoleic and oleic acid will increase when sufficient magnesium is supplied in the continuous monocropping system, leading to this significant positive correlations between the two fatty acids.

5. Conclusions

In this study, the continuously monocropped fields differed in the yield and fatty acid compositions based on the differences in soil nutrient status. Continuous monocropping decreased 1000-seed weight of sesame, as observed in in fields C and D accompanied with high oleic, linoleic, and linolenic acids, whereas the lauric and myristic acids were high in the short duration of continuous monocropping. Correlation analysis suggested that soil Mg content was the most important factor that influenced oleic, linoleic, and linolenic acid content whereas soil K content influenced myristic and lauric acid contents under continuous monocropping. This study suggested that the fatty acid quality produced on long duration of continuous monocropping years could be of high economic value despite the adverse effect on yield reflected by the low seed weight. Future research should focus on increasing the yield of sesame in continuous monocropping while maintaining the high quality fatty acid composition on the upland fields converted from paddy fields.

Author Contributions

C.W., N.O., D.B., M.K. and E.N. conceived and designed the experiment; C.W., D.B., D.S., and T.H. performed the experiments; C.W. and D.B. analyzed the data; T.M., S.Y., and E.N. supervised the research; C.W. wrote the paper; and E.N. revised the final draft manuscript.

Funding

This research received no external funding.

Acknowledgments

We are grateful for the support from the Ministry of Education, Culture, Sports, Science, and Technology (MEXT) of Japan under the Japanese Government MEXT scholarship of the first author.

Conflicts of Interest

The authors declare no conflict of interest.

References

  1. Ashri, A. Sesame. In Oil Crops of the World; Robbelen, G., Downey, R.K., Ashri, A., Eds.; McGraw–Hill: New York, NY, USA, 1989; pp. 375–387. [Google Scholar]
  2. Hwang, L.S. Sesame oil. In Bailey’s Industrial Oil and Fat Products, 6th ed.; Shahidi, F., Ed.; John Wiley and Sons Inc.: New York, NY, USA, 2005; pp. 538–577. ISBN 047167849X. [Google Scholar]
  3. Kaur, N.; Chugh, V.; Gupta, A.K. Essential fatty acids as functional components of foods—A review. J. Food Sci. Technol. 2014, 51, 2289–2303. [Google Scholar] [CrossRef] [PubMed]
  4. Goksu Erol, A.Y.; Bulbul, A.; Avci, G.; Ozdemir, M.; Akkaya, O. The Protective Effects of Omega-3 Fatty Acids and Sesame Oil on Cyclosporine—A Induced Liver Apoptosis. J. Acad. Res. Med. 2011, 1, 8–11. [Google Scholar] [CrossRef]
  5. Wacal, C.; Ogata, N.; Basalirwa, D.; Handa, T.; Sasagawa, D.; Acidri, R.; Ishigaki, T.; Kato, M.; Masunaga, T.; Yamamoto, S.; et al. Growth, seed yield, mineral nutrients and soil properties of sesame (Sesamum indicum L.) as influenced by biochar addition on upland field converted from paddy. Agronomy 2019, 9, 55. [Google Scholar] [CrossRef]
  6. Yasumoto, S.; Katsuta, M. Breeding a high-lignan-content sesame cultivar in the prospect of promoting metabolic functionality. Jpn. Agric. Res. Q. 2006, 40, 123–129. [Google Scholar] [CrossRef]
  7. Wacal, C.; Ogata, N.; Basalirwa, D.; Sasagawa, D.; Ishigaki, T.; Handa, T.; Kato, M.; Tenywa, M.M.; Masunaga, T.; Yamamoto, S.; et al. Imbalanced Soil Chemical Properties and Mineral Nutrition in Relation to Growth and Yield Decline of Sesame on Different Continuously Cropped Upland Fields Converted Paddy. Agronomy 2019, 9, 184. [Google Scholar] [CrossRef]
  8. Jørgensen, H.; Bach Knudsen, K.E.; Lauridsen, C. Influence of different cultivation methods on carbohydrate and lipid compositions and digestibility of energy of fruits and vegetables. J. Sci. Food Agric. 2012, 92, 2876–2882. [Google Scholar] [CrossRef]
  9. Patil, B.N.; Lakkineni, K.C.; Bhargava, S.C. Seed yield and yield contributing characters as influenced by N supply in rapeseed-mustared. J. Agron. Crop Sci. 1996, 177, 197–205. [Google Scholar] [CrossRef]
  10. Ali, S.; Jan, A.; Zhikuan, J.; Sohail, A.; Tie, C.; Ting, W.; Peng, Z. Growth and Fatty Acid Composition of Sesame ( Sesamum indicum L.) Genotypes as Influence by Planting Dates and Nitrogen Fertilization in Semiarid Region of Northwest, Pakistan 1. Russ. Agric. Sci. 2016, 42, 224–229. [Google Scholar] [CrossRef]
  11. Bellaloui, N.; Abbas, H.K.; Ebelhar, M.W.; Mengistu, A.; Mulvaney, M.J.; Accinelli, C.; Shier, W.T. Effect of Increased Nitrogen Application Rates and Environment on Protein, Oil, Fatty Acids, and Minerals in Sesame (Sesamum indicum) Seed Grown under Mississippi Delta Conditions. Food Nutr. Sci. 2018, 9, 1112–1135. [Google Scholar] [CrossRef]
  12. Aytac, Z.; Gulmezoglu, N.; Saglam, T.; Kulan, E.G.; Selengil, U.; Hosgun, H.L. Changes in N, K, and Fatty Acid Composition of Black Cumin Seeds Affected by Nitrogen Doses under Supplemental Potassium Application. J. Chem. 2017, 7, 3162062. [Google Scholar] [CrossRef]
  13. Hodges, S.C. Soil Fertility Basics; Soil Science Extension; North Carolina State University: Raleigh, NC, USA, 2010; pp. 1–75. [Google Scholar]
  14. Riedell, W.E.; Pikul, J.L.; Jaradat, A.A.; Schumacher, T.E. Crop Rotation and Nitrogen Input Effects on Soil Fertility, Maize Mineral Nutrition, Yield, and Seed Composition. Agron. J. 2009, 10, 870–879. [Google Scholar] [CrossRef]
  15. Bellaloui, N.; Bruns, H.A.; Gillen, A.M.; Abbas, H.K.; Zablotowicz, R.M.; Mengistu, A.; Paris, R.L. Soybean seed protein, oil, fatty acids, and mineral composition as influenced by soybean-corn rotation. Agric. Sci. 2010, 1, 102–109. [Google Scholar] [CrossRef]
  16. Crookston, R.K.; Kurle, J.E.; Copeland, P.J.; Ford, J.H.; Lueschen, W.E. Rotational Cropping Sequence Affects Yield of Corn and Soybean. Agron. J. 1991, 83, 108. [Google Scholar] [CrossRef]
  17. Harker, K.N.; O’Donovan, J.T.; Blackshaw, R.E.; Hall, L.M.; Willenborg, C.J.; Kutcher, H.R.; Gan, Y.; Lafond, G.P.; May, W.E.; Grant, C.A.; et al. Effect of agronomic inputs and crop rotation on biodiesel quality and fatty acid profiles of direct-seeded canola. Can. J. Plant Sci. 2013, 93, 577–588. [Google Scholar] [CrossRef]
  18. Stepien, A.; Wojtkowiak, K.; Pietrzak-Fiecko, R. Nutrient content, fat yield and fatty acid profile of winter rapeseed (Brassica napus L.) grown under different agricultural production systems. Chil. J. Agric. Res. 2017, 77, 266–272. [Google Scholar] [CrossRef]
  19. Hoffmann, A.; Bobinger, S.; Feifel, S.; Kurowski, C. Simple, Fast and Reliable Determination of Fat in Food According to the Caviezel Method Using Turnkey Fat Determination System; Gerstel: Linthicum, MD, USA, 2009. [Google Scholar]
  20. Truog, E. The determination of the readily available phosphorous of soils. Agron. J. 1930, 22, 874–882. [Google Scholar] [CrossRef]
  21. Kelley, K.W.; Long, J.H., Jr.; Todd, T.C. Long-term crop rotations affect soybean yield, seed weight, and soil chemical properties. Field Crops Res. 2003, 83, 41–50. [Google Scholar] [CrossRef]
  22. Zhong, S.; Mo, Y.; Guo, G.; Zeng, H.; Jin, Z. Effect of Continuous Cropping on Soil Chemical Properties and Crop Yield in Banana Plantation. J. Agric. Sci. Technol. 2014, 16, 239–250. [Google Scholar]
  23. Reeves, D.W. The role of soil organic matter in maintaining soil quality in continuous cropping systems. Soil Tillage Res. 1997, 43, 131–167. [Google Scholar] [CrossRef]
  24. Wyngaard, N.; Echeverria, H.E.; Sainz Rozas, H.R.; Divito, G.A. Fertilization and tillage effects on soil properties and maize yield in a Southern Pampas Argiudoll. Soil Tillage Res. 2012, 119, 22–30. [Google Scholar] [CrossRef]
  25. Huang, L.; Song, L.; Xia, X. Plant-Soil Feedbacks and Soil Sickness: From Mechanisms to Application in Agriculture. J. Chem. Ecol. 2013, 39, 232–242. [Google Scholar] [CrossRef] [PubMed]
  26. Bennett, A.J.; Bending, G.D.; Chandler, D.; Hilton, S.; Mills, P. Meeting the demand for crop production: The challenge of yield decline in crops grown in short rotations. Biol. Rev. 2012, 87, 52–71. [Google Scholar] [CrossRef] [PubMed]
  27. Kumar, P.; Sharma, M.K. Nutrient Deficiencies of Field Crops: Guide to Diagnosis and Management; CAB International: Wallingford, UK, 2013; p. 243. [Google Scholar]
  28. Mitchell, G.A.; Bingham, F.T.; Yermanos, D.M. Growth, mineral composition and seed characteristics of sesame as affected by nitrogen, phosphorus and potassium nutrition. Soil Sci. Am. Proc. 1974, 38, 925–931. [Google Scholar] [CrossRef]
  29. Panda, R.; Patra, S.K. Depletion and Contribution Pattern of Available Potassium in Indian Coastal Soils under Intensive Cropping and Fertilization. Int. J. Pure Appl. Biosci. 2017, 5, 1144–1152. [Google Scholar] [CrossRef]
  30. Tanaka, A.; Era, M.; Kawahara, T.; Kanyama, T.; Morita, H.; Co, S.S. Antimicrobial Activity of Fatty Acid Salts Against Microbial in Koji-Muro. MATEC Web Conf. 2016, 3002, 1–6. [Google Scholar] [CrossRef]
  31. McBain, J.W.; Sierichs, W.C. The solubility of sodium and potassium soaps and the phase diagrams of aqueous potassium soaps. J. Am. Oil Chem. Soc. 1948, 25, 221–225. [Google Scholar] [CrossRef]
  32. Aid, F. Plant Lipid Metabolism [Online First]. IntechOpen 2019. [Google Scholar] [CrossRef]
  33. Jadav, D.P.; Padamani, D.R.; Polara, K.B.; Parmar, K.B.; Babaria, N.B. Effect of different level of sulphur and potassium on growth, yield and yield attributes of sesame (Sesamum indicum L.). Asian J. Soil Sci. 2010, 5, 106–108. [Google Scholar]
  34. Thompson, A.E.; Dierig, D.A.; Knapp, S.J.; Kleiman, R. Variation in fatty acid content and seed weight in some lauric acid rich cuphea species. J. Am. Oil Chem. Soc. 1990, 67, 611–617. [Google Scholar] [CrossRef]
  35. Biglar, M. Profiling of major fatty acids in different raw and roasted sesame seeds cultivars. Afr. J. Biotechnol. 2012, 11, 6619–6623. [Google Scholar]
  36. Kurt, C. Variation in oil content and fatty acid composition of sesame accessions from different origins. Grasas Aceites 2018, 69, 1–9. [Google Scholar] [CrossRef]
  37. Were, B.A.; Onkware, A.O.; Gudu, S.; Welander, M.; Carlsson, A.S. Seed oil content and fatty acid composition in East African sesame (Sesamum indicum L.) accessions evaluated over 3 years. Field Crop. Res. 2006, 97, 254–260. [Google Scholar] [CrossRef]
  38. Mahmoud, T.S.M.; Mohamed, E.S.A.; El-Sharony, T.F. Influence of foliar application with potassium and magnesium on growth, yield and oil quality of “Koroneiki’’ olive trees. Am. J. Food Technol. 2017, 12, 209–220. [Google Scholar] [CrossRef]
  39. Mondal, S. Efficiency of Sulphur source on sesame (Sesamum indicum L.) in red and lateritic soil of West Bengal. Int. J. Plant An. Envrion. Sci. 2016, 6, 65–70. [Google Scholar]
  40. Gerendás, J.; Führs, H. The significance of magnesium for crop quality. Plant Soil. 2013, 368, 101–128. [Google Scholar] [CrossRef] [Green Version]
  41. Gupta, R.; Singh, R. Fatty acid synthesis in leucoplasts isolated from developing seeds of Brassica campestris. J. Plant Biochem. Biotechnol. 1996, 5, 127–130. [Google Scholar] [CrossRef]
  42. Singh, R. Carbon and energy sources for fatty acid biosynthesis in non-photosynthetic plastids of higher plants. Proc. Indian Natl. Sci. Acad. B 1998, 64, 335–354. [Google Scholar]
  43. Cakmak, I.; Kirkby, E.A. Role of magnesium in carbon partitioning and alleviating photooxidative damage. Physiol. Plant. 2008, 133, 692–704. [Google Scholar] [CrossRef]
  44. Ali, A.; Ullah, S. Effect of nitrogen on achene protein, oil, fatty acid profile, and yield of sunflower hybrids. Chil. J. Agric. Res. 2012, 72, 564–567. [Google Scholar] [CrossRef] [Green Version]
  45. Shoja, T.; Majidian, M.; Rabiee, M. Effects of zinc, boron and sulfur on grain yield, activity of some antioxidant enzymes and fatty acid composition of rapeseed (Brassica napus L.). Acta Agric. Slov. 2018, 111, 73–84. [Google Scholar] [CrossRef] [Green Version]
  46. Zheljazkov, V.D.; Vick, B.A.; Baldwin, B.S.; Buehring, N.; Astatkie, T.; Johnson, B. Oil Content and Saturated Fatty Acids in Sun flower as a Function of Planting Date, Nitrogen Rate, and Hybrid. Agron. J. 2009, 101, 1003–1011. [Google Scholar] [CrossRef] [Green Version]
  47. Bahrani, A.; Pourreza, J. Effect of alternate furrow irrigation and potassium fertilizer on seed yield, water use efficiency and fatty acids of rapeseed. Idesia (Arica) 2016, 34, 35–41. [Google Scholar] [CrossRef]
  48. Kaptan, M.A.; Koca, Y.O.; Canavar, Ö. Effect of N-P-K fertilization on mineral content and fatty acid compounds of corn seed. Adnan Menderes Üniversitesi Ziraat Fakültesi Derg. 2017, 14, 19–22. [Google Scholar] [CrossRef]
  49. Suzer, S. Effects of plant nutrition on canola (Brassica napus L.) growth. Trak. Univ. J. Nat. Sci. 2015, 16, 87–90. [Google Scholar]
  50. Rathke, G.W.; Christen, O.; Diepenbrock, W. Effects of nitrogen source and rate on productivity and quality of winter oilseed rape (Brassica napus L.) grown in different crop rotations. Filed Crop. Res. 2005, 94, 103–113. [Google Scholar] [CrossRef]
  51. Podkowinski, J.; Jelenska, J.; Sirikhachornkit, A.; Zuther, E.; Haselkorn, R.; Gornicki, P. Expression of Cytosolic and Plastid Acetyl-Coenzyme Carboxylase Genes in Young Wheat Plantsl[w]. Plant Physiol. 2003, 131, 763–772. [Google Scholar] [CrossRef] [Green Version]
  52. Xu, Z.; Li, J.; Guo, X.; Jin, S.; Zhang, X. Metabolic engineering of cottonseed oil biosynthesis pathway via RNA interference. Sci. Rep. 2016, 6, 1–14. [Google Scholar] [CrossRef]
  53. Wacal, C.; Ogata, N.; Sasagawa, D.; Handa, T.; Basalirwa, D.; Acidri, R.; Ishigaki, T.; Yamamoto, S.; Nishihara, E. Seed yield, crude protein and mineral nutrient contents of sesame during a two-year continuous cropping on upland field converted from a paddy. Filed Crop. Res. 2019, 240, 125–133. [Google Scholar] [CrossRef]
  54. Ngure, J.W.; Cheng, C.; Yang, S.; Lou, Q.; Li, J.; Qian, C.; Chen, J.; Chen, J. Cultivar and seasonal effects on seed oil content and fatty acid composition of cucumber as a potential industrial crop. J. Am. Soc. Hort. Sci. 2015, 140, 362–373. [Google Scholar] [CrossRef] [Green Version]
  55. Izquierdo, N.G.; Aguirrezábal, L.A.N.; Andrade, F.H.; Geroudet, C.; Valentinuz, O.; Pereyra Iraola, M. Intercepted solar radiation affects oil fatty acid composition in crop species. Filed Crop. Res. 2009, 114, 66–74. [Google Scholar] [CrossRef]
  56. Garcés, R.; Sarmiento, C.; Mancha, M. Temperature regulation of oleate desaturase in sunflower (Helianthus annuus L.) seeds. Planta 1992, 186, 461–465. [Google Scholar] [CrossRef] [PubMed]
  57. Kabbaj, A.; Vervoort, V.; Abbot, A.; Tersac, M.; Berville, A. Expression of stearate oleate and linoleate desaturase genes in sunflower with normal and high oleic acid contents. Helia 1996, 19, 1–7. [Google Scholar]
  58. Alpaslan, M.; Boydak, E.; Hayta, M.; Gerçek, S.; Simsek, M. Effect of row space and irrigation on seed composition of Turkish sesame (Sesamum indicum L.). J. Am. Oil Chem. Soc. 2001, 78, 933–935. [Google Scholar] [CrossRef]
  59. Uzun, B.; Arslan, C.; Furat, S. Variation in fatty acid compositions, oil content and oil yield in a germplasm collection of sesame (Sesamum indicum L.). J. Am. Oil Chem. Soc. 2008, 85, 1135–1142. [Google Scholar] [CrossRef]
Figure 1. The four continuously monocropped sesame fields in 2015 and 2016.
Agronomy 09 00801 g001
Figure 2. Seed yield (a) and 1000-seed weight (b) of sesame seeds from the four continuously monocropped fields A, B, C, and D during 2015 and 2016 and linoleic acid (c) and linolenic acid (d) contents averaged across years (2015 and 2016): Means with different letters are significantly different at p < 0.05 Tukey’s test. Data points represent mean ± standard error; n = 3 for graphs (a) and (b) whereas n = 6 for graphs (c) and (d).
Agronomy 09 00801 g002
Figure 3. Lauric acid (a) and myristic acid (b) contents of sesame seeds from the four continuously monocropped fields A, B, C, and D during 2015 and 2016 and lauric acid (c) and myristic acid (d) contents averaged across years (2015 and 2016): Means with different letters are significantly different at p < 0.05 at Tukey’s test. Data points represent mean ± standard error; n = 3 for graphs (a) and (b) whereas n = 6 for graphs (c) and (d).
Agronomy 09 00801 g003
Figure 4. Linoleic acid (a) and linolenic acid (b) contents of sesame seeds from the four continuously monocropped fields A, B, C, and D during 2015 and 2016 and linoleic acid (c) and linolenic acid (d) contents averaged across years (2015 and 2016): Means with different letters are significantly different at p < 0.05 at Tukey’s test. Data points represent mean ± standard error; n = 3 for graphs (a) and (b) whereas n = 6 for graphs (c) and (d).
Agronomy 09 00801 g004
Figure 5. Relationship and model of (a) the 1000-seed weight and soil exchangeable K, (b) lauric acid and soil exchangeable K, (c) linolenic acid and 1000-seed weight, and (d) oleic acid and soil exchangeable Mg.
Agronomy 09 00801 g005
Figure 6. The principal component analysis of fatty acid composition, yield, 1000-seed weight, and soil chemical properties from continuous monocropping fields A, B, C, and D: (a) The overall projection of the variables and (b) the overall projection of the continuous monocropping fields on the factor plane. TSW (thousand seed weight) = 1000-seed weight; 1 = year 2015; 2 = year 2016.
Agronomy 09 00801 g006
Table 1. Soil analysis of the four continuously monocropped fields prior to experiment in 2015.
Exchangeable Cations
FieldpH
(H2O)
EC
(dS m−1)
TN
(g kg−1)
C/N ratioP
(mg kg−1)
K
(mg kg−1)
Ca
(mg kg−1)
Mg
(mg kg−1)
A5.390.052.329.6629.0248918108
B5.440.042.948.1168.41121220297
C5.730.042.907.8476.21131632307
D6.010.042.867.7446.41011904353
EC = electrical conductivity; TN = total nitrogen; C/N = total carbon to total nitrogen ratio; P = available phosphorous; K = exchangeable potassium; Ca = exchangeable calcium; Mg = exchangeable magnesium. Data on soil was based on soil samples from depths of 0–15 cm.
Table 2. Mean temperature and rainfall at the experimental site in 2015 and 2016 during the cultivation period from June to September.
YearDaily/MonthlyJuneJulyAugustSeptemberAverage Seasonal
2015Mean daily temperature °C2125.025.621.023.2
Mean monthly rainfall (mm)132102.5123.0171.5132.3
2016Mean daily temperature °C2225.726.422.924.3
Mean monthly rainfall (mm)13569.5126.5330.0165.3
Table 3. Seed fatty acid composition of sesame seeds from the four continuously monocropped fields A, B, C, and D during 2015 and 2016.
SFAMUFAPUFACapric (C10:0)Palmitic (C16:0)Oleic (C18:1)
YearFieldsTFA (%)% Weight of Total Fatty Acid (TFA)
2015A51.4 ± 3.51 a10.7 ± 0.62 ab16.2 ± 1.34 a17.5 ± 2.19 a0.29 ± 0.04 a6.84 ± 0.31 a30.8 ± 0.64 a
B54.7 ± 0.77 a11.4 ± 0.67 a17.6 ± 0.33 a19.0 ± 0.33 a0.34 ± 0.08 a7.50 ± 0.30 a31.9 ± 0.83 a
C52.7 ± 0.95 a9.20 ± 0.76 ab17.6 ± 0.27 a20.6 ± 0.32 a0.43 ± 0.03 a6.94 ± 0.15 a33.0 ± 0.79 a
D50.5 ± 0.71 a8.08 ± 0.63 b17.8 ± 0.43 a20.2 ± 0.22 a0.45 ± 0.01 a7.24 ± 0.16 a34.7 ± 1.34 a
ANOVA (p-values) ns*nsnsnsnsns
2016A53.1 ± 0.72 a9.19 ± 0.43 a19.5 ± 0.20 a19.9 ± 0.13 ab0.44 ± 0.01 a6.55 ± 0.13 a36.5 ± 0.89 a
B51.1 ± 1.01 a8.82 ± 0.62 a18.8 ± 0.11 a19.2 ± 0.13 b0.41 ± 0.01 a6.58 ± 0.12 a36.4 ± 0.90 a
C51.5 ± 1.31 a8.79 ± 0.44 a18.9 ± 0.43 a19.8 ± 0.58 ab0.42 ± 0.01 a6.86 ± 0.15 a36.2 ± 1.23 a
D51.4 ± 0.59 a13.2 ± 6.25 a19.8 ± 0.26 a21.3 ± 0.31 a0.42 ± 0.03 a7.10 ± 0.17 a37.8 ± 0.55 a
ANOVA (p-values) nsnsns*nsnsns
AverageA52.2 ± 1.65 a9.92 ± 0.47 a17.9 ± 0.96 a18.7 ± 1.12 a0.36 ± 0.04 a6.69 ± 0.16 a33.7 ± 1.37 a
B52.9 ± 0.98 a10.1 ± 0.71 a18.2 ± 0.32 a19.1 ± 0.17 a0.38 ± 0.04 a7.04 ± 0.25 a34.1 ± 1.16 a
C52.1 ± 0.77 a9.00 ± 0.40 a18.3 ± 0.37 a20.2 ± 0.34 a0.42 ± 0.01 a6.90 ± 0.10 a34.6 ± 0.98 a
D51.0 ± 0.45 a10.7 ± 3.04 a18.8 ± 0.50 a20.7 ± 0.31 a0.43 ± 0.01 a7.17 ± 0.11 a36.3 ± 0.95 a
Source of variation
Year nsns***nsns****
Field nsnsnsnsnsnsns
Year × Field nsnsnsnsnsnsns
TFA = total fatty acid; SFA = saturated fatty acids; MUFA = monounsaturated fatty acids; PUFA = polyunsaturated fatty acids. Different letters within each column are significantly different at p < 0.05 at Tukey’s test. *** Significant at p < 0.001; * significant at p < 0.05; ns, nonsignificant. Data for 2015 and 2016 represent mean ± standard error, n = 3 whereas data for average represent mean ± standard error, n = 6.
Table 4. Soil chemical properties from the four continuously monocropped fields A, B, C, and D after harvesting during 2015 and 2016.
Exchangeable Cations
YearFieldspH
(H2O)
EC
(dS m−1)
TN
g kg−1
C/N RatioP
(mg kg−1)
K
(mg kg−1)
Ca
(mg kg−1)
Mg
(mg kg−1)
2015A5.26 ± 0.06 c 0.15 ± 0.00 a 2.56 ± 0.00 a10.5 ± 0.21 b58.4 ± 4.43 a389.9 ± 76.1 a1191.8 ± 12.6 b 307.3 ± 12.0 a
B5.39 ± 0.04 bc 0.10 ± 0.01 b 2.46 ± 0.02 b 10.3 ± 0.24 b43.5 ± 2.78 b177.9 ± 12.3 b1182.6 ± 82.5 b 283.2 ± 20.9 a
C5.66 ± 0.06 b 0.11 ± 0.01 ab 2.62 ± 0.02 a 9.59 ± 0.23 b 47.6 ± 2.32 ab 226.4 ± 11.5 ab 1492.4 ± 42.6 a 288.0 ± 12.4 a
D6.14 ± 0.07 a 0.07 ± 0.00 b 2.11 ± 0.02 c 11.9 ± 0.21 a35.5 ± 1.76 b208.4 ± 2.76 b1711.7 ± 49.6 a 255.2 ± 1.17 a
ANOVA (p-values) *****************ns
2016A5.46 ± 0.05 b 0.10 ± 0.00 a 2.12 ± 0.07 a 9.81 ± 0.03 b 53.3 ± 3.94 a325.9 ± 44.5 a1174.3 ± 84.5 c298.9 ± 26.8 b
B5.64 ± 0.20 ab 0.07 ± 0.01 b 1.98 ± 0.03 a 10.3 ± 0.06 a24.2 ± 2.78 b 82.9 ± 14.9 b1518.2 ± 119 bc 321.7 ±17.2 ab
C5.80 ± 0.07 ab 0.06 ± 0.01 b 2.13 ± 0.06 a 10.1 ± 0.09 ab 29.7 ± 4.97 b110.9 ± 13.0 b1726.7 ± 83.2 ab 339.2 ±18.9 ab
D6.10 ± 0.06 a 0.07 ± 0.00 ab 2.00 ± 0.02 a 10.3 ± 0.12 a17.2 ± 2.87 b 97.0 ± 9.10 b2100.1 ± 36.4 a400.4 ± 17.4 a
ANOVA (p-values) ***ns************
AverageA5.36 ± 0.06 c0.12 ± 0.01 a2.34 ± 0.10 a10.2 ± 0.19 b55.8 ± 2.88 a357.9 ± 41.9 a1183.1 ± 38.4 c303.1 ± 13.3 a
B5.51 ± 0.11 bc0.09 ± 0.01 ab2.22 ± 0.11 a10.3 ± 0.11 ab33.8 ± 4.67 a130.4 ± 22.9 b1350.4 ± 99.0 bc302.5 ± 14.9 a
C5.73 ± 0.05 b0.09 ± 0.01 ab2.37 ± 0.11 a9.85 ± 0.16 b38.7 ± 4.70 a168.7 ± 27.0 b1609.5 ± 67.0 ab313.6 ± 15.3 a
D6.12 ± 0.04 a0.08 ±0.00 b2.06 ± 0.03 a11.1 ± 0.38 a26.3 ± 4.36 a152.7 ± 25.3 b1905.9 ± 91.1 a327.8 ± 33.4 a
Source of variation
Year *******************
Field *******************ns
Year × Field ns*******nsnsns**
EC = electrical conductivity; TN = total nitrogen; C/N = total carbon to total nitrogen ratio; P = available phosphorous; K = exchangeable potassium; Ca = exchangeable calcium; Mg = exchangeable magnesium. Data on soil was based on soil samples from depths of 0–15 cm. Different lowercase letters within each column are significantly different among fields in each year at p < 0.05 Tukey’s test. *** Significant at p < 0.001; ** significant at p < 0.01; * significant at p < 0.05; ns, nonsignificant. Data for 2015 and 2016 represent mean ± standard error, n = 3 whereas data for average represent mean ± standard error, n = 6.

