Article

Interplanting of Corn (Zea mays L.) Shifts Nitrogen Utilization by Promoting Rhizosphere Microbial Nitrogen Nitrification

1
College of Agronomy, Henan Agricultural University, Zhengzhou 450046, China
2
Henan Province Agro-Ecosystem Field Observation and Research Station, Zhumadian 463900, China
3
National Key Laboratory of Wheat and Maize Crops Science, Zhengzhou 450046, China
*
Authors to whom correspondence should be addressed.
These authors contributed equally to this work.
Agronomy 2024, 14(3), 586; https://doi.org/10.3390/agronomy14030586
Submission received: 6 February 2024 / Revised: 8 March 2024 / Accepted: 13 March 2024 / Published: 14 March 2024
(This article belongs to the Special Issue Integration of Agronomic Practices for Sustainable Crop Production)

Abstract

:
Interplanting is an efficient method of improving nutrient utilization. However, the impact of intraspecific interplanting on rhizosphere microbial nitrogen cycling needs to be studied further. In this study, two corn cultivars were selected as the materials: Zhengdan958 (ZD958, high nitrogen use efficiency) and Denghai3622 (DH3622, low nitrogen use efficiency). Three planting patterns (interplanting, ZD958 monocropping, and DH3622 monocropping) were set up to study the effects of interplanting on crop growth and rhizosphere microbial nitrogen cycle function under two nitrogen levels: low nitrogen (140 kg N ha−1) and normal nitrogen (280 kg N ha−1). The results showed that the grain yield and nitrogen content in interplanting were significantly increased due to an enhanced leaf area index and root dry weight. The nitrogen accumulation and nitrogen use efficiency were enhanced by 8.14% and 19.38% in interplanting, which resulted in reductions in NH4+ and NO3 content in the rhizosphere. Interplanting enhanced rhizosphere nitrogen cycling processes; nitrification, denitrification, and nitrate reduction were increased. This study demonstrated that interplanting promotes corn nitrogen acquisition from the soil and indirectly regulates rhizosphere microbial function. These findings imply that the intraspecific interplanting of crops with appropriate functional traits is a promising approach to establishing diversified, productive, and efficient resource utilization ecosystems.

1. Introduction

Corn is a globally cultivated crop and the largest grain crop in China, with a yield of 277 million tons [1]. A high yield of corn requires a large amount of nitrogen, so a nitrogen supply is essential for its growth and development [2]. Farmers have often used excessive N expecting a high yield [3], but it has been counterproductive. Over-fertilization results in a low N use efficiency and low economic benefits. It also exacerbates nitrogen leaching and volatilization, and causes a range of environmental problems, such as soil acidification and the eutrophication of water bodies [4,5]. Meanwhile, corresponding shifts in soil microbial properties have been widely reported, including the depletion of soil microbial biomass, alterations in species composition, and decreases in diversity [6,7]. Moreover, N fertilizer overuse greatly influences the soil N cycling process by regulating the abundance of N cycle-related microbes and genes [8]. A worldwide meta-analysis showed that soil microbial biomass was reduced by an average of 15% with nitrogen application, and the abundance of bacteria and fungi further declined with longer fertilization periods and higher N application rates [9]. Research found that microbial activity would decline when the nitrogen application exceeded 180 kg ha−1 [10]. Therefore, it is necessary to improve the efficiency of nitrogen fertilizer use to ensure environmental health and food security.
Intercropping is the cultivation of two or more crops simultaneously on the same field [11]. Previous research showed that intercropping could improve nutrient and water use efficiency, maintain soil fertility, and reduce fertilizer demand. This allowed the production of crops to reach its full potential and achieved a high and stable yield [12]. Meanwhile, intercropping could increase soil microbial diversity through root exudates and nutrient absorption, which dilute the quantity of harmful bacteria [13,14]. The impact of intercropping on soil microorganisms has been reported in recent years. In a sugarcane and soybean intercropping system, intercropping changed the structure of the soil microbial community, which increased microbial diversity [15]. The same results were also found in intercropping between melon and cowpea, wheat and soybean, and potato and legume plants [16,17,18]. Variations in the microbial community inevitably give rise to variations in microbial function. In a legume intercropping system, soil nitrogen fixation function was promoted by increasing the abundance of nitrogen-fixing bacteria, such as Bradyrhizobium and Skermanella [19,20]. Intercropping could also reduce the relative abundance of denitrifying bacteria (Proteobacteria) by decreasing soil nitrate residues, achieving a suppression of N2O emissions [15,21].
Interplanting, i.e., planting multiple varieties of one crop in the same field, is one special type of intercropping [22]. It can enrich the intraspecific and genetic diversity of crops in a field, which is particularly suitable for intensive production and could reduce biotic stressors such as disease, weeds, and insects [23]. The interplanting of corn with different traits enhanced disease resistance to leaf spot and leaf rust through intraspecific complementation [24,25]. The occurrence of rice blast also reduced in rice interplanting populations [26]. Meanwhile, interplanting could mitigate the damage caused by abiotic stressors (high temperatures, drought) [27]. For example, the interplanting of corn increased lodging resistance by 82.4% [28]. The duration of anthesis and the pollination of the population were also prolonged in an interplanting system, and the population fertilization rate was significantly improved at the silking stage under continuous rain and high temperature [29,30]. Interplanting also made full use of spatiotemporal niche complementarity and intraspecific diversity, staggering the maximum demand period of plants for light [23]. In an interplanting system of corn of different phenotypes (regarding, for example, plant height and leaf angle), the population’s light utilization was increased due to enhanced ventilation and light transmission and improvements in the intercepted photosynthetically active radiation [31]. However, little is known about the interactions between the root and soil microbial communities in interplanting systems.
Previous studies have focused on the microbial community structure in intercropping systems of different crops [15,16,17,18,19,20]. Furthermore, most studies focused on interplanting with the same crop species have been limited to disease resistance and cross-fertilization. In this study, we paid special attention to the effect of interplanting with different traits on plant nitrogen accumulation, the rhizosphere nitrogen cycle pathway, and their relationships. Field experiments were conducted to test the following hypotheses: (1) the interplanting of corn promotes plant growth and grain yield and enhances the leaf area index; (2) interplanting affects plant nitrogen utilization; and (3) interplanting increases rhizosphere microbial nitrogen cycle function by promoting crop growth.

2. Materials and Methods

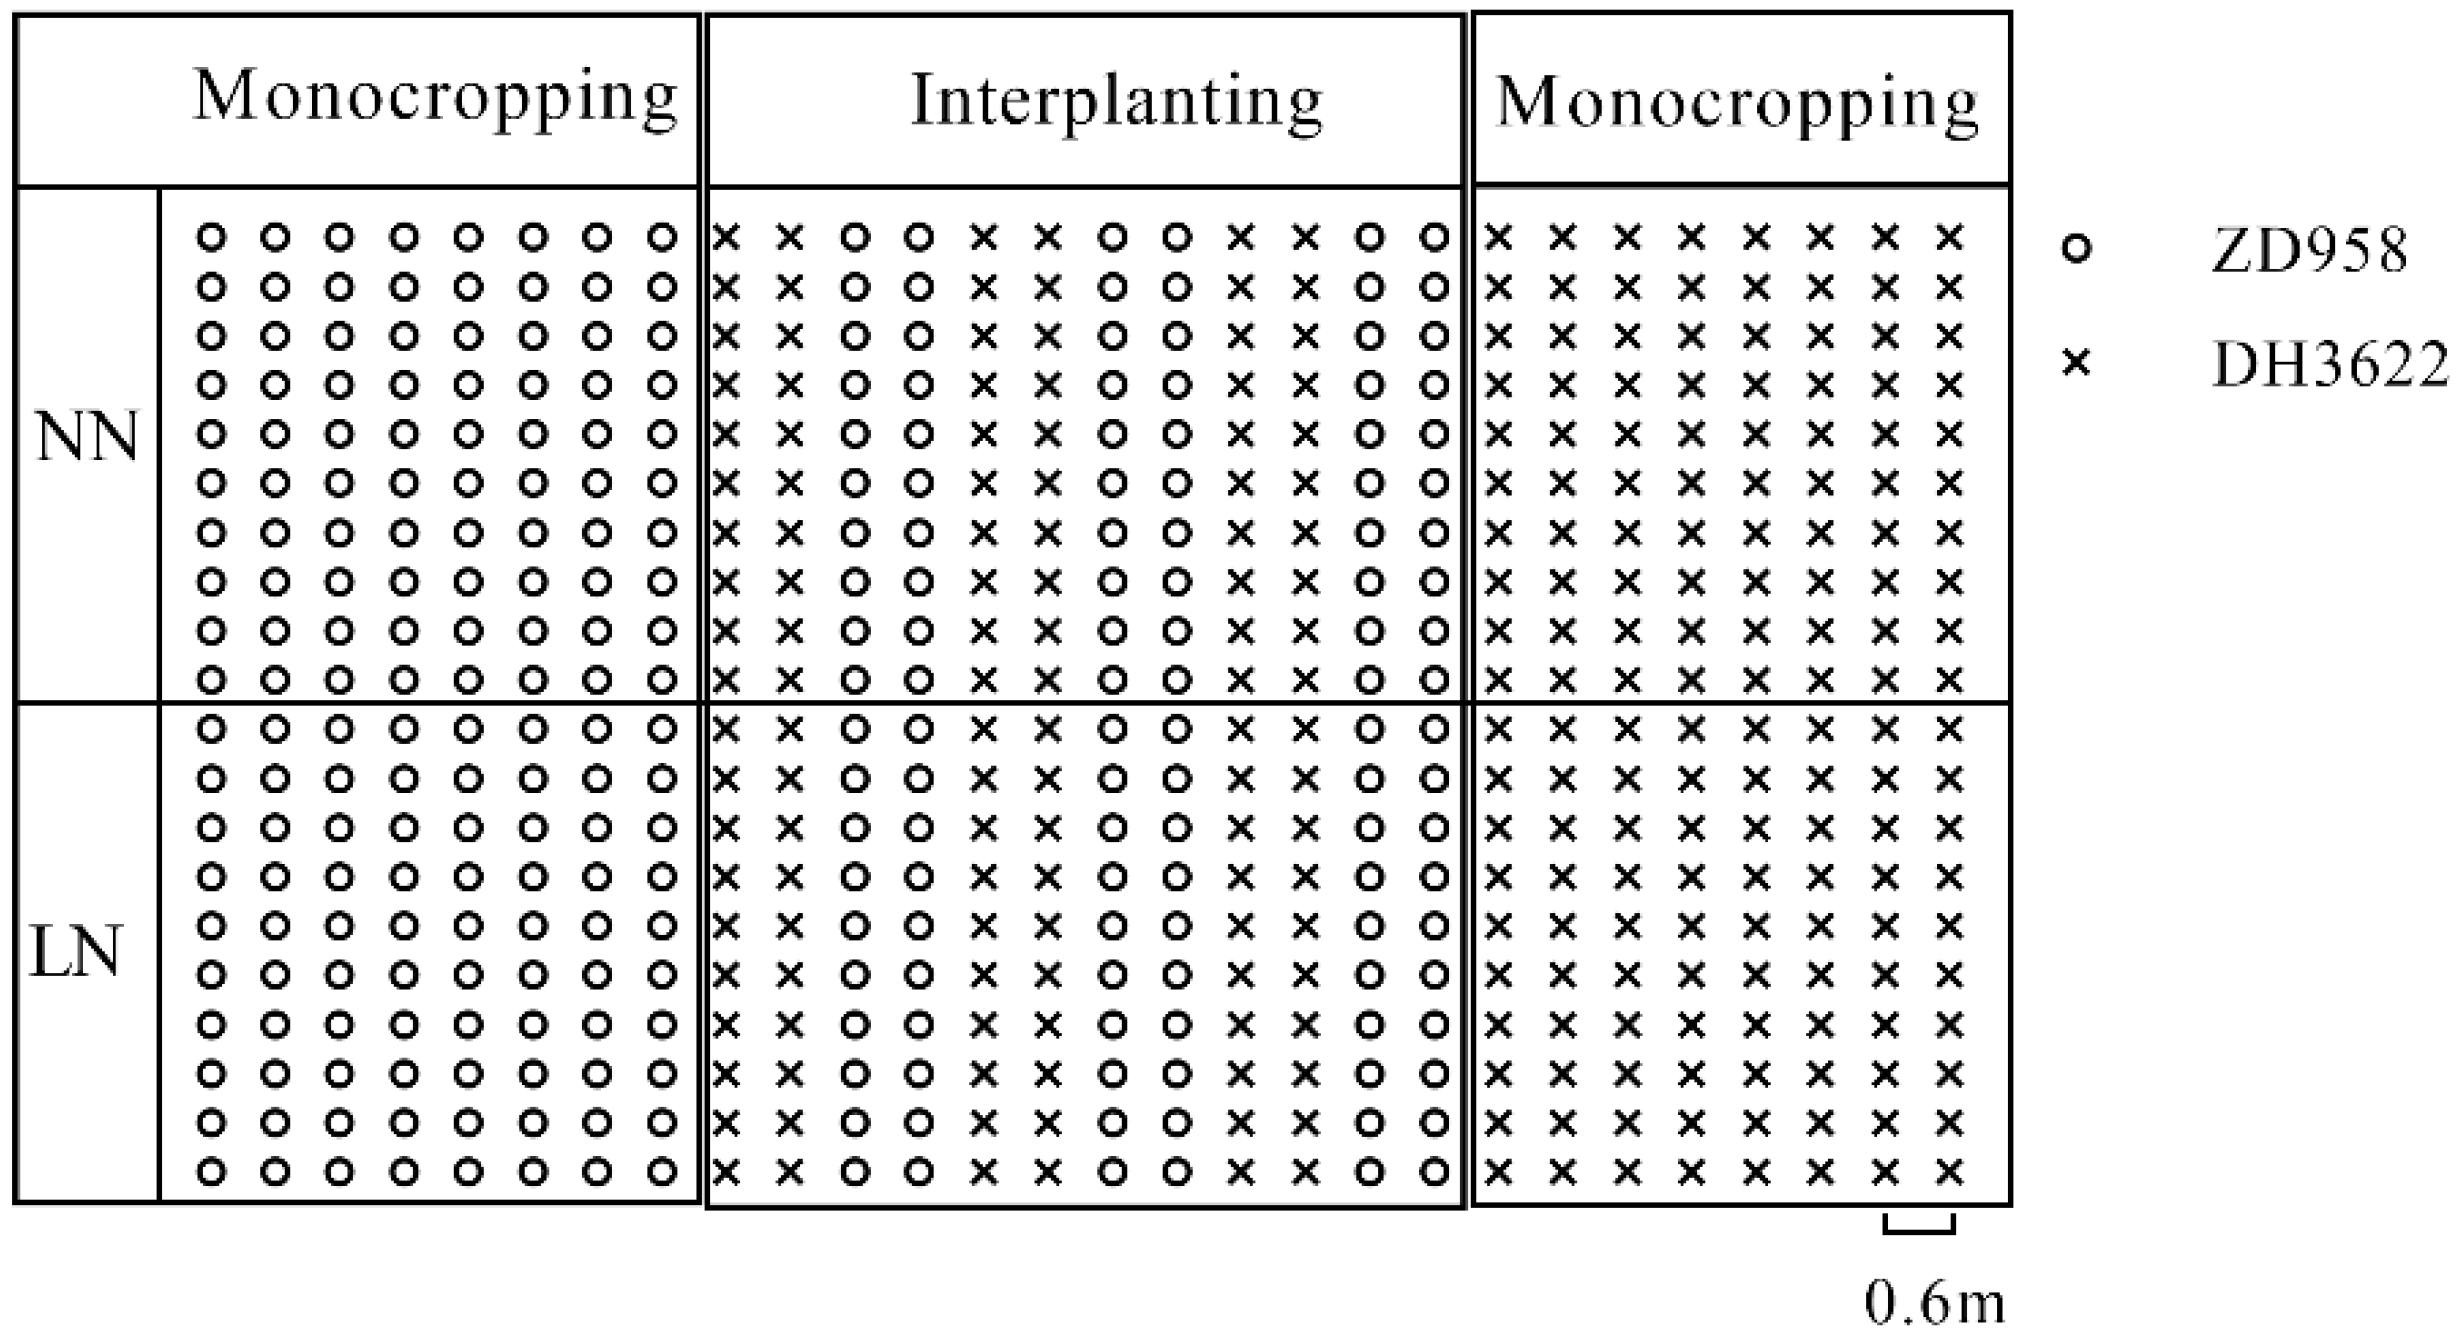
2.1. Experiment Design and Crop Management

The field experiment was conducted during the summers of 2021 and 2022 at Henan Agricultural University experimental station (33°19′48″ N, 114°01′01″ E) in Xiping county, Henan Province, China. The mean annual temperature and rainfall are 15.8 °C and 910 mm. The soil is lime concretion black soil, with an organic matter content of 13.65 g kg−1, a total N content of 1.25 g kg−1, an alkaline hydrolytic nitrogen (N) content of 25.57 mg kg−1, an Olsen phosphorus (P) content of 18.13 mg kg−1 and a NH4OAc extractable potassium (K) content of 124.91 mg kg−1 at 0–20 cm soil layer.
Based on previous experimental results, two corn cultivars were selected as the materials: Zhengdan 958 (ZD 958, high nitrogen efficiency) and Denghai 3622 (DH 3622, low nitrogen efficiency) [32]. Two-year field experiments were arranged as a two-factor randomized block design with three replications. The experiment was composed of three planting patterns (ZD 958 and DH 3622 interplanting, ZD 958 monocropping, and DH 3622 monocropping) and two levels of N application (140 and 280 kg N ha−1), denoted as LN (low nitrogen) and NN (normal nitrogen). This resulted in 6 treatments with 18 plots in total, covering a monocropping plot area of 480 m2 and an interplanting plot area of 720 m2. The seeds were sown on 15 June 2021 and 10 June 2022, respectively. In the field experiment, the monocrop corns were planted in 8-row plots and the interplanting corns were planted in 12-row plots (2 cultivars planted alternately in 2 rows) with 0.60 m inter-row spacing and 0.25 m in-row spacing to obtain a plant population of 67,500 plants ha−1 (Figure 1).
The soil tillage adopted no-tillage in the maize season. Calcium superphosphate, potassium chloride, and urea were incorporated as basal fertilization (broadcast fertilization) at 10 cm depth during sowing at rates of 90 kg P ha−1, 90 kg K ha−1, and 70 and 140 kg N ha−1. Other urea (70 and 140 kg N ha−1) was implemented at the sixth leaf stage (V6) of corn in the LN and NN treatments. Crop irrigation and pest control followed the local best management practices.

2.2. Plant Measurements

According to the definition of leaf area index, three plants were selected from each plot to measure the maximum leaf length (L) and leaf width (W) at the sixth leaf stage (V6), the twelfth leaf stage (V12), the silking stage (R1), the blister stage (R2), and the mature stage (R6). Leaf area per plant was calculated by multiplying a weighting factor equal to 0.75 [33].
Leaf area index (LAI) (1) was calculated as follows:
LAI = LA   ×   LAU / U
where LA is leaf area per plant, LAU is number per unit land area, and U is unit land area.
Root weight was evaluated by collecting soil samples at the R1 stage in the field. Three adjacent plants were harvested, and their roots were dug vertically from the soil using a sharp-edged iron core from 0 to 60 cm. These was divided into six layers with a thickness of 10 cm for each layer, and each layer was separated into 6 small pieces with size of 20 cm length × 10 cm width × 10 cm thickness. The soil was then washed with flowing water. Subsequently, the roots were dried at 70 °C for 72 h and then weighted.
To determine the dry matter weight and nitrogen concentration, four plants from each plot at the R1 and R6 stages were randomly selected, cut at soil level, dried at 70 °C for 72 h, and then weighed. The N concentration of the samples was determined using a flow injection auto-analyzer (AA3, SEAL Analytical, Norderstedt, Germany) after digestion of samples with H2SO4-H2O2, and the indicators below were calculated [8].
Dry matter accumulation post anthesis (DMA, g plant−1) (2), nitrogen accumulation post anthesis (NA, mg plant−1) (3), and nitrogen use efficiency (NUE, %) (4) were calculated as follows:
DMA = DMW mat     DMW sil
NA = NC mat       NC sil
NUE = ( NC mat     NCB mat ) / Na
where DMWmat is dry matter weight at maturity, DMWsil is dry matter weight at silking, NCmat is nitrogen content at maturity, NCsil is nitrogen content at silking, NCBmat is nitrogen content in blank treatment at maturity, and Na is nitrogen application (140 and 280 kg N ha−1).
Grain yield was determined at the R6 stage, where 30 ears were harvested to determine corn yield from three rows in the center of each plot.

2.3. Soil Chemical Analysis

Rhizosphere soil was collected for the analysis of soil chemical properties and macrogenomes at the R1 stage in 2022. Three plants from each plot were grouped into one replicate, and each treatment was replicated 3 times from 3 plots. After root residues and grits were removed, the mixed soil sample was sieved (<2 mm) and divided into three parts. For the first part of the samples, around 10 g of fresh soil was sealed in 15 mL tubes and stored in liquid nitrogen for determination of the relative abundance of soil microorganisms. The second part of the samples was used to measure net potential nitrogen mineralization and nitrification [34]. The third part was used for soil chemical analyses. Soil samples were preprocessed using a combined H2SO4-H2O2 digestion method. Olsen phosphorus and extractable potassium were extracted using 0.5 M NaHCO3 and 1 M NH4Ac solution. NH4+ and NO3 were extracted using 2 M KCl solution. Total nitrogen, NH4+ and NO3 were detected with a continuous flow analyzer (AA3, SEAL Analytical, Norderstedt, Germany). Total phosphorus and Olsen phosphorus were measured with the molybdenum–antimony colorimetry method using a spectrophotometer (Thermo-Fisher Evolution 350, Waltham, IL, USA). Total potassium and extractable potassium were determined using a flame photometer (Cole-parmer FF-200D-I, Vernon Hills, UK).

2.4. Macrogenomes of Rhizosphere Soil Microorganisms

Total genomic DNA was extracted from the rhizosphere soil samples using the E.Z.N.A.® Soil DNA Kit (Omega Bio-tek, Norcross, GA, USA) according to the manufacturer’s instructions. The concentration and purity of the extracted DNA were determined with TBS-380 (Turner Biosystems, Sunnyvale, CA, USA) and NanoDrop2000 (Thermo Scientific, Wilmington, DE, USA), respectively. DNA extract quality was tested on 1% agarose gel. The DNA extract was fragmented to an average size of about 400 bp using Covaris M220 (Gene Company Limited, Shanghai, China) for paired-end library construction. A paired-end library was constructed using NEXTflexTM Rapid DNA-Seq (Bioo Scientific, Austin, TX, USA). Adapters containing the full complement of sequencing primer hybridization sites were ligated to the blunt end of the fragments. Paired-end sequencing was performed on Illumina NovaSeq/HiSeq Xten (Illumina Inc., San Diego, CA, USA) at Majorbio Bio-Pharm Technology Co., Ltd. (Shanghai, China) using NovaSeq Reagent Kits/HiSeq X Reagent Kits according to the manufacturer’s instructions (www.illumina.com, accessed on 3 September 2022). The raw reads from metagenome sequencing were used to generate clean reads by removing adaptor sequences, trimming and removing low-quality reads (reads with N bases, a minimum length threshold of 50 bp, and a minimum quality threshold of 20) using fastp on the free online Majorbio Cloud Platform (cloud.majorbio.com, accessed on 29 September 2022). These high-quality reads were then assembled to contigs using MEGAHIT (parameters: kmer min = 47; kmer max = 97; step = 10) (https://github.com/voutcn/megahit, accessed on 5 October 2022, version 1.1.2), which makes use of succinct de Bruijn graphs. Contigs with a length of, or over, 300 bp were selected as the final assembling result. Open reading frames (ORFs) in contigs were identified using MetaGene. The predicted ORFs with lengths of, or over, 100 bp were retrieved and translated into amino acid sequences using the NCBI translation table. A non-redundant gene catalog was constructed using CD-HIT with 90% sequence identity and 90% coverage. After quality control, the reads were mapped to the non-redundant gene catalog with 95% identity using SOAPaligner, and gene abundance in each sample was evaluated. Representative sequences of the non-redundant gene catalog were annotated based on the NCBI NR database using blastp as implemented in DIAMOND v0.9.19 with an e-value cutoff of 1 × 10⁻⁵ using Diamond for taxonomic annotations. The KEGG annotation was conducted using Diamond against the Kyoto Encyclopedia of Genes and Genomes database with an e-value cutoff of 1 × 10⁻⁵.

2.5. Statistical Analyses

The Wilcoxon rank-sum test was used to analyze the effect of planting patterns on the relative abundance of pathway level 2 in KEGG at the 5% level. The Bray–Curtis distance based on the module relative abundance of nitrogen cycle in KEGG was calculated to represent the variation in functional compositional among these samples. An analysis of similarities (ANOSIM) using Bray–Curtis was conducted to test the similarities and differences in the microbial functional gene composition prior to the β-diversity analysis. Principal coordinate analysis (PCOA) was used to visualize the relative differences between the samples [35]. Two-way ANOVA was used to analyze the effects of planting patterns and nitrogen levels on the modulation of the nitrogen cycle in KEGG, and the effects of the difference in planting pattern at the same nitrogen level were analyzed using the Tukey test at p < 0.05. Functional annotation was carried out by comparing the sequences of non-redundant gene catalog with the Kyoto Encyclopedia of Genes and Genomes (KEGG) database on BLASTP (e-value < 1 × 10⁻⁵).
Other data were analyzed statistically using SPSS 20.0 [36]. The effects of nitrogen levels, planting patterns, cultivars, and their interactions were analyzed using three-way ANOVA. The statistical analysis of planting patterns and cultivars was carried out using two-way ANOVA. The statistical analysis of planting patterns at the same nitrogen level was carried out using the Tukey test at p < 0.05. All figures were plotted using Origin 2023 [37]. The structural equation model was analyzed using IBM SPSS Amos 28 [36].

3. Results

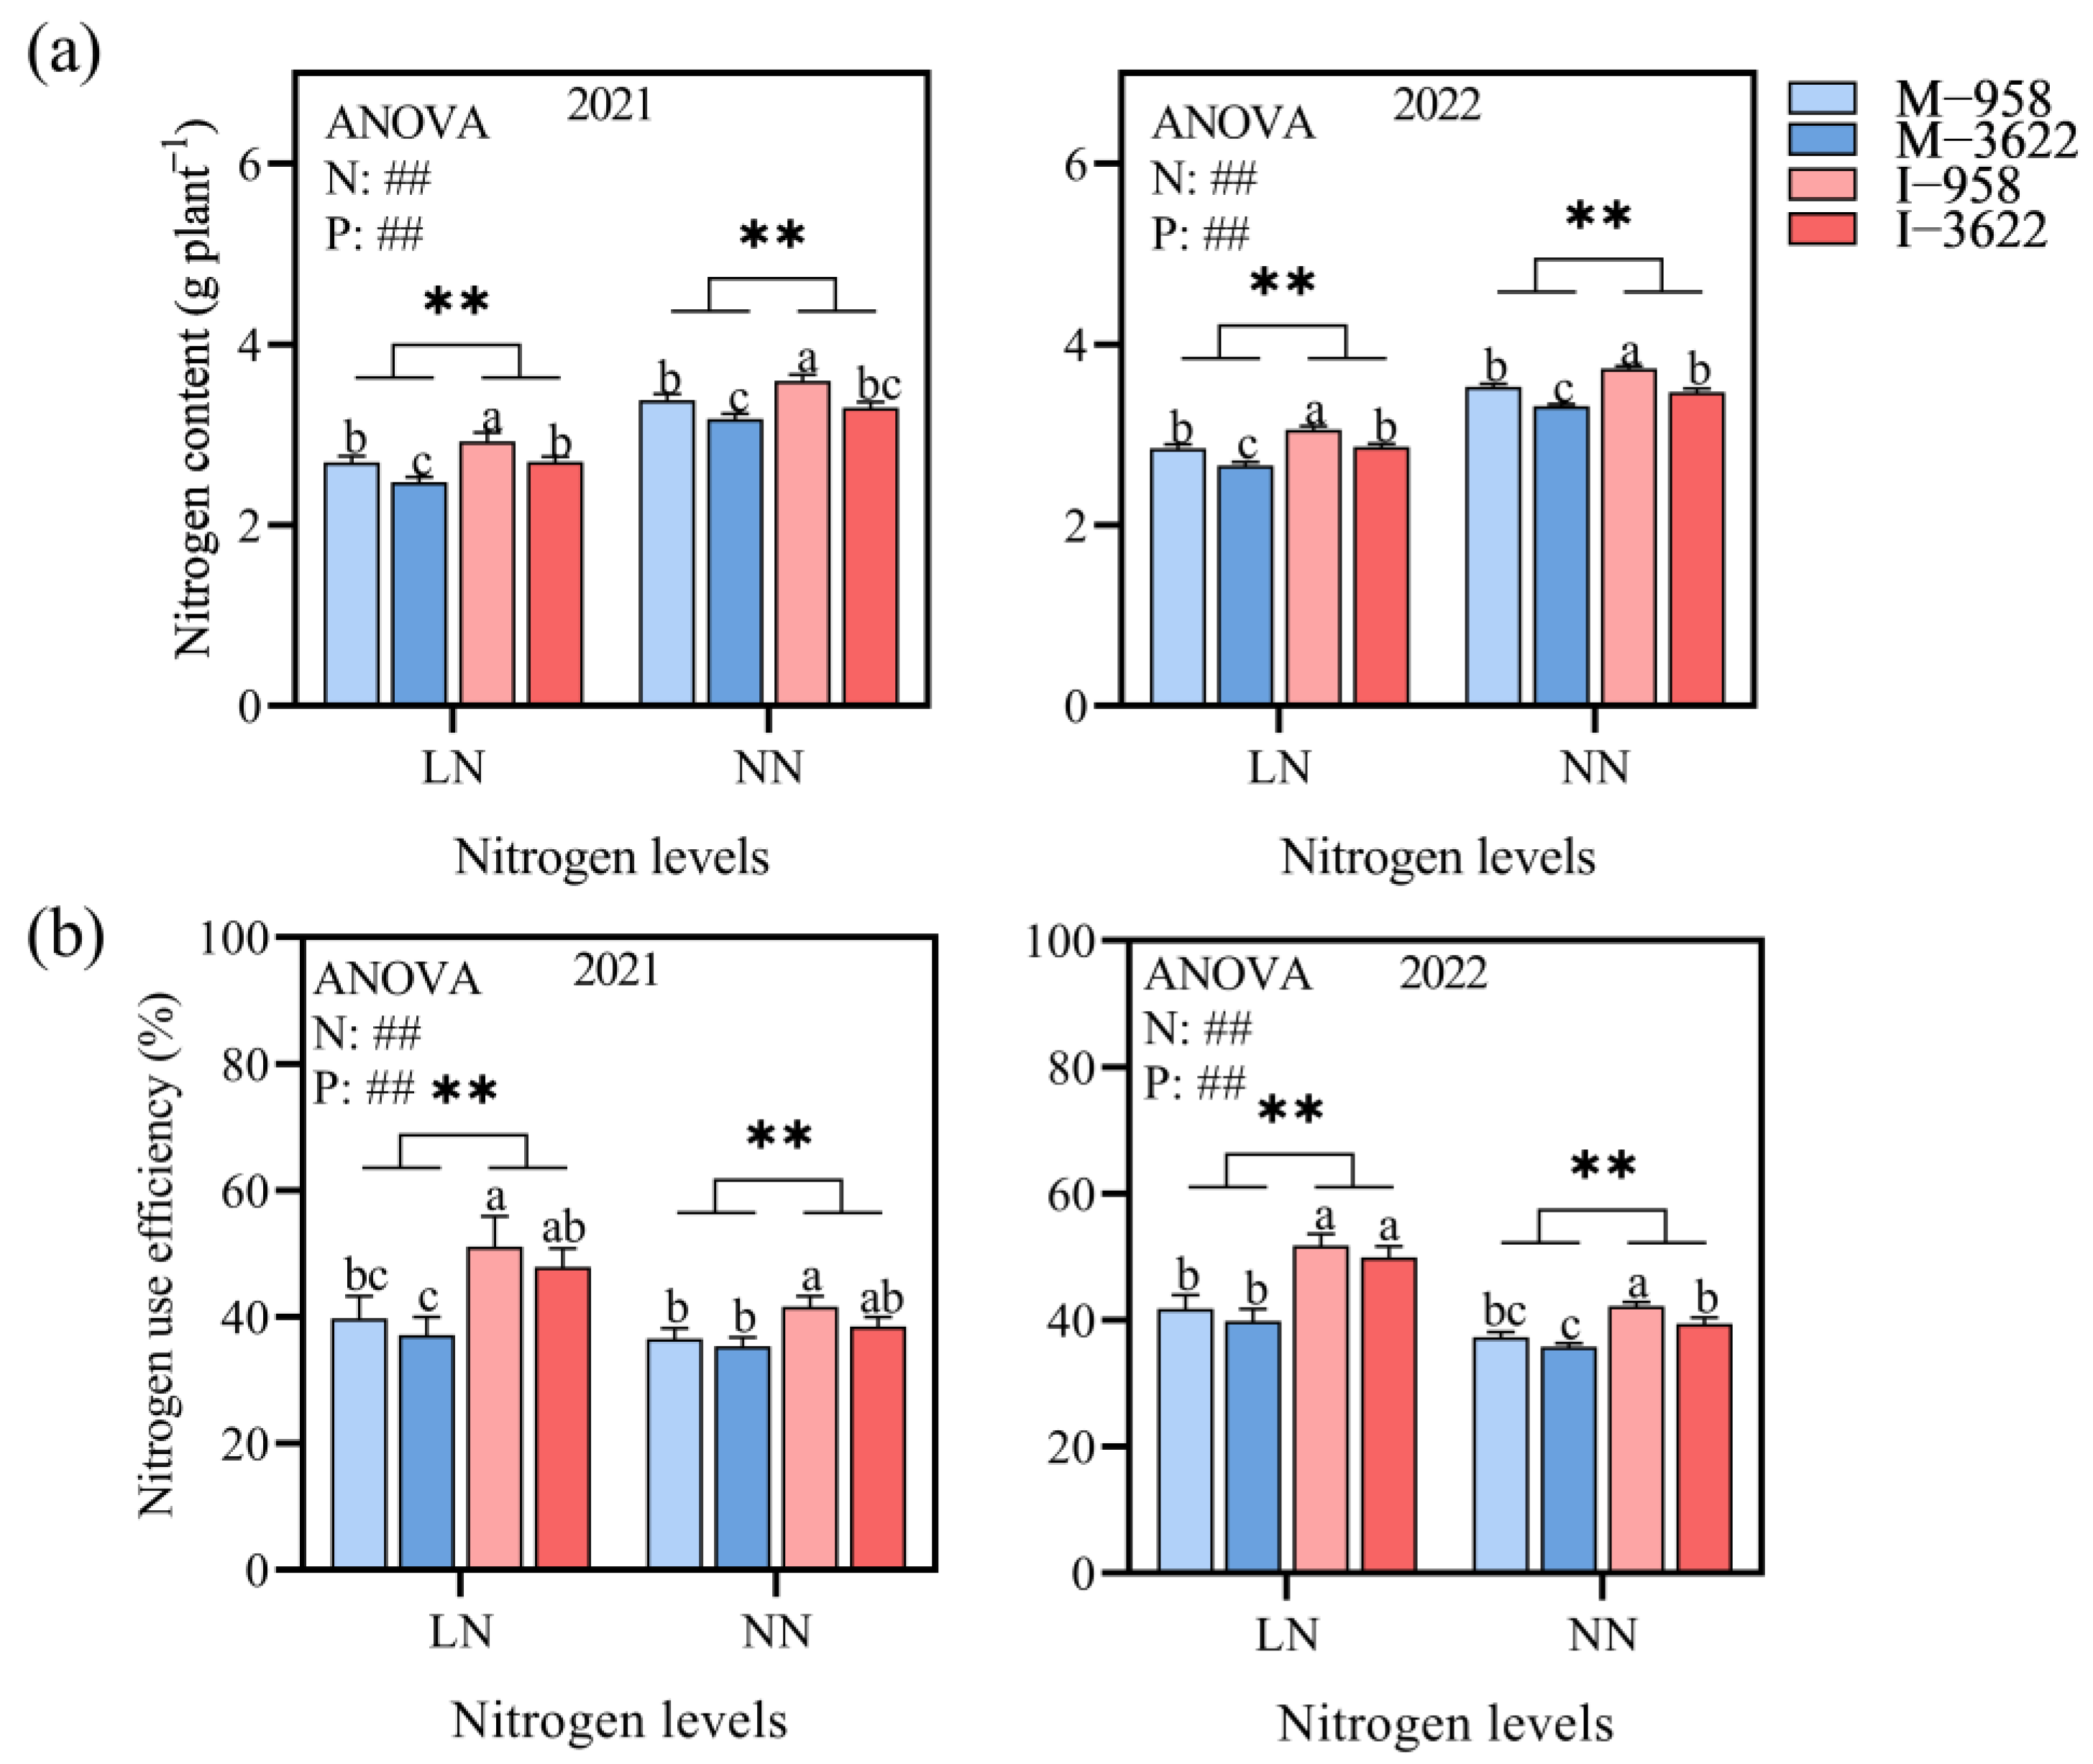
3.1. Nitrogen Utilization of Corn

Interplanting had a positive effect on the corn nitrogen content (NC) (Figure 2a), nitrogen use efficiency (NUE) (Figure 2b), and nitrogen accumulation post anthesis (NA) (Figure S1). Compared to monocropping, NC, NUE, and NA were significantly increased by 6.51%, 19.38%, and 8.14% in the interplanting system. The extent of their increase was higher under LN treatment than NN treatment. For example, NC and NUE increased by 8.19% and 26.60% in interplanting under LN treatment, but increased by 5.17% and 11.51% under NN treatment. Although N input caused a pronounced increase in NC (from 2.78 g plant−1 under LN treatment to 3.44 g plant−1 under NN treatment) and NA, NUE decreased (from 44.89% under LN treatment to 38.33% under NN treatment).

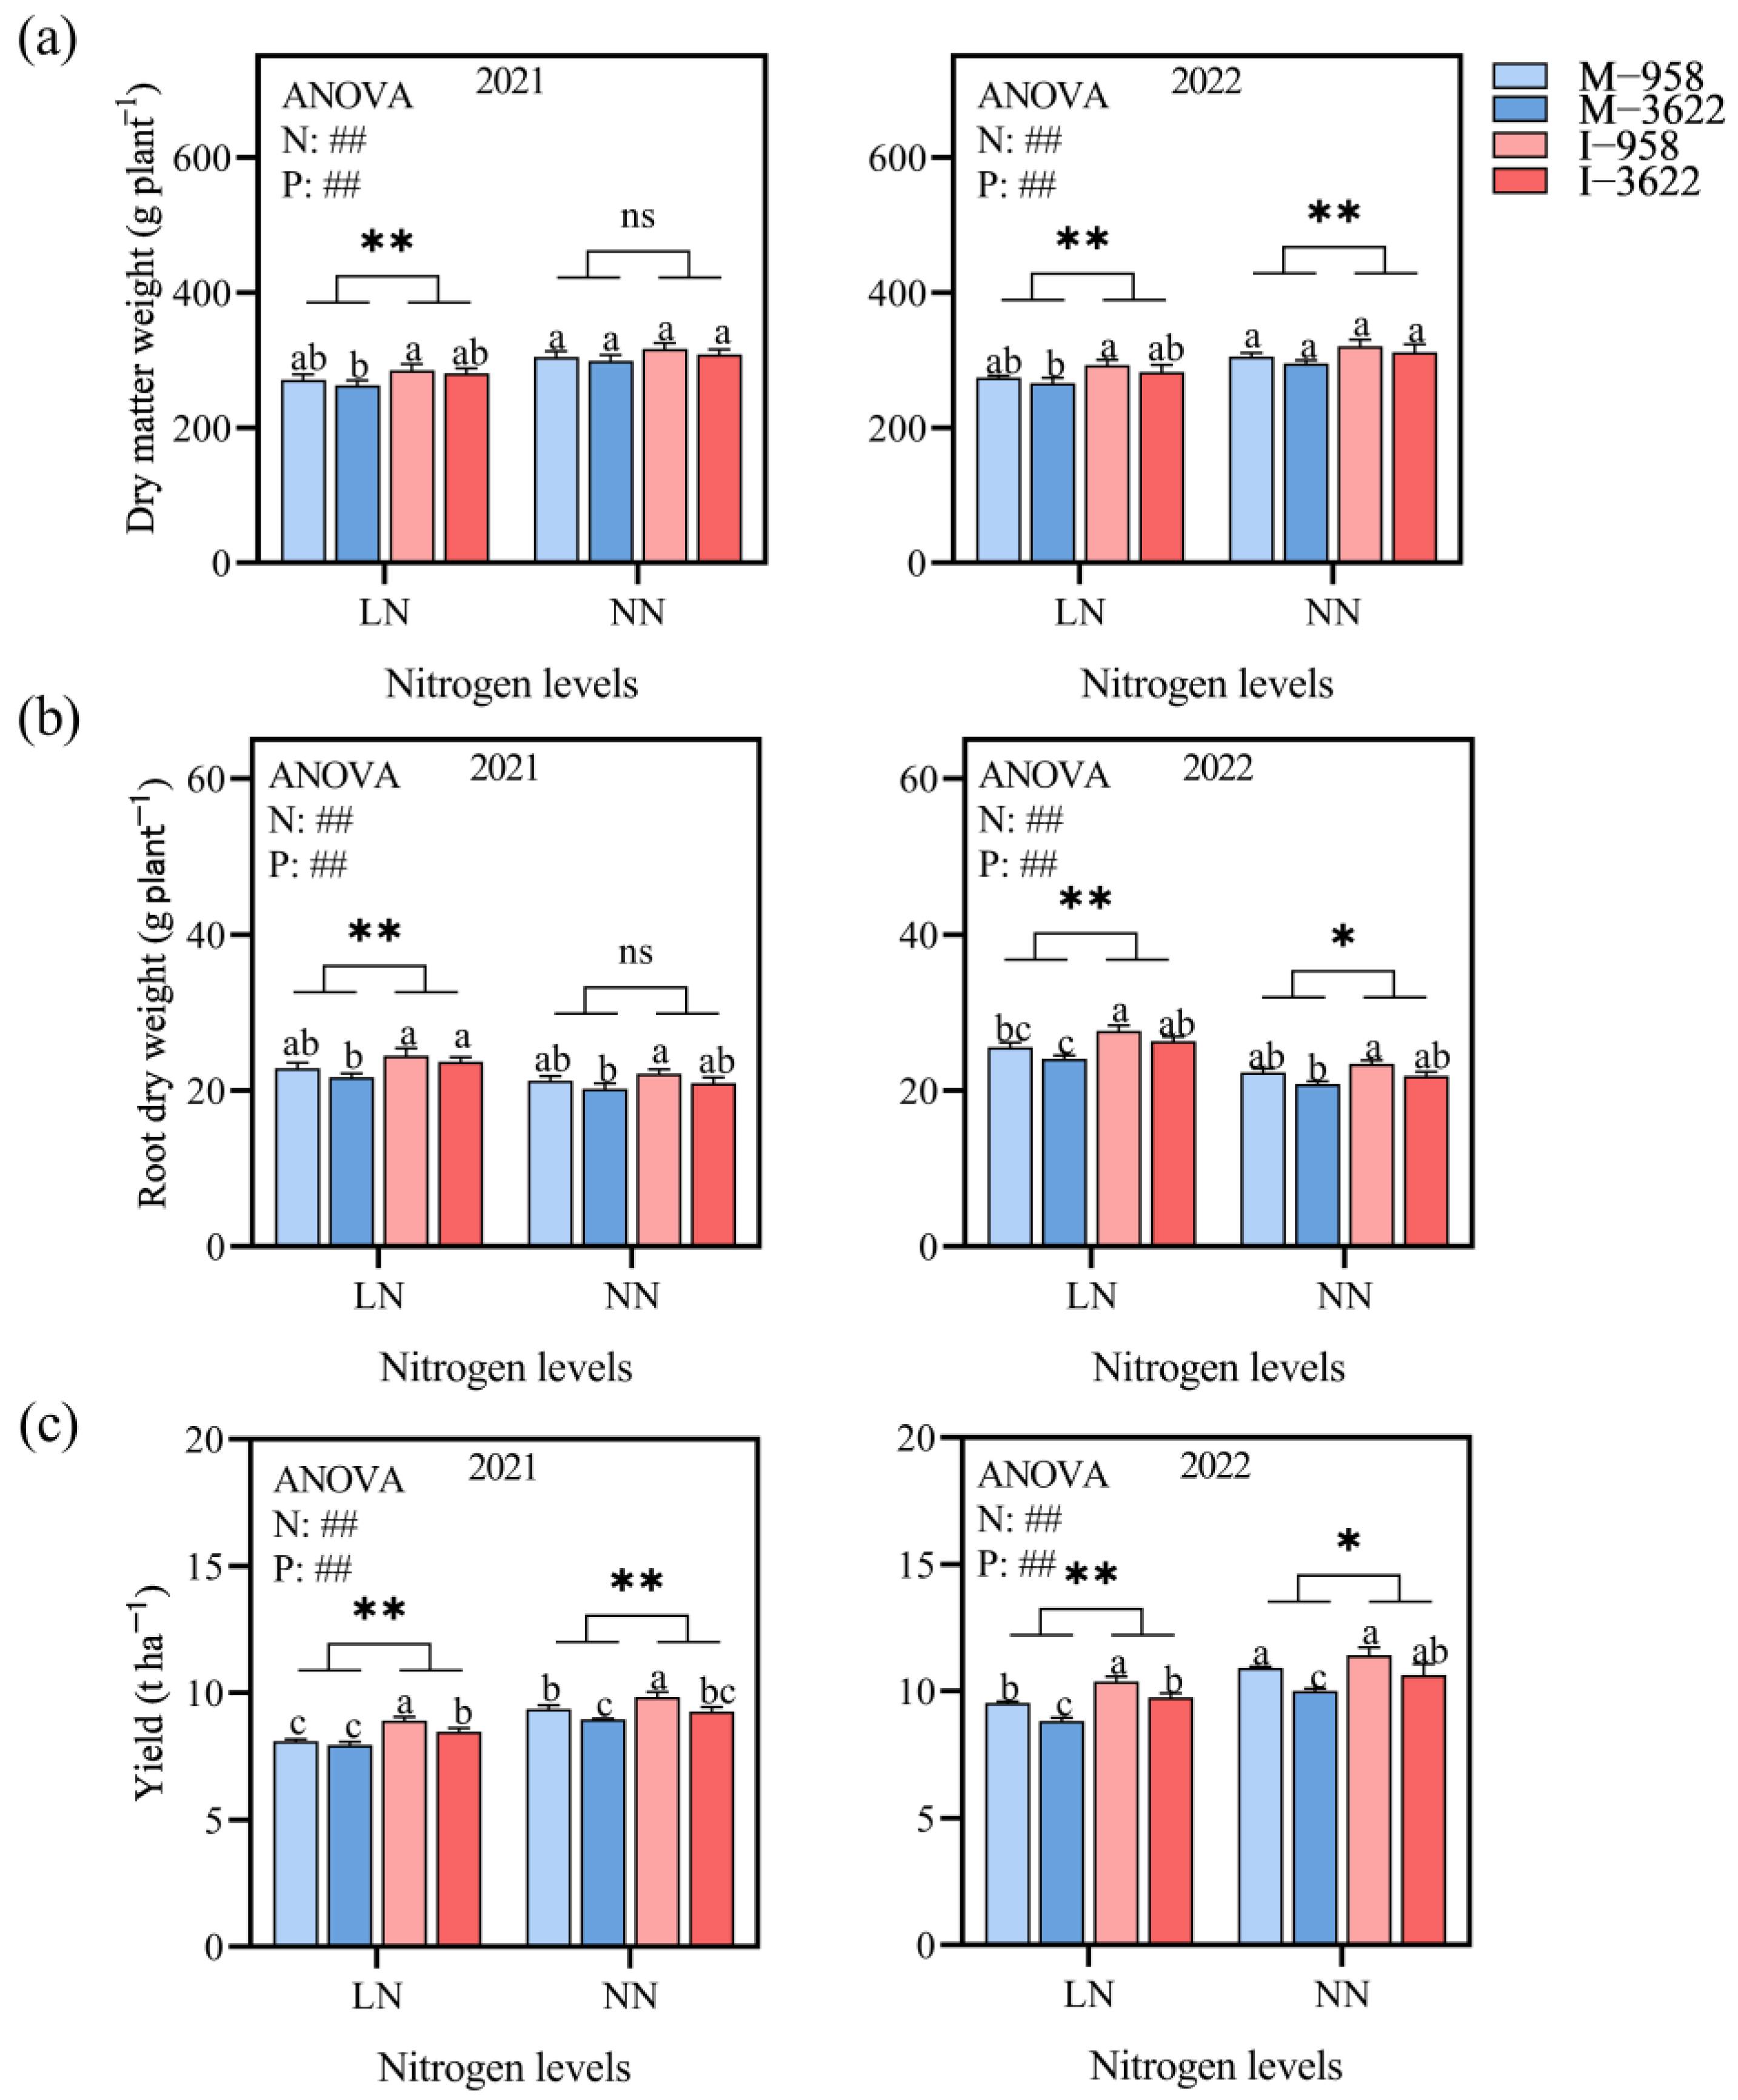
3.2. Crop Growth in Interplanting

Interplanting promoted corn root and shoot growth. Compared to monocropping, the leaf area index (LAI) (Figure S3), dry matter weight (DMW) (Figure 3a), root dry weight (RDW) (Figure 3b) and dry matter accumulation post anthesis (DMA) (Figure S2) were increased by 4.50%, 5.23%, 6.50%, and 5.22% in interplanting, which resulted in an average increase in grain yield (GY) of 6.81% (Figure 3c). Grain yield was increased significantly with nitrogen application (from 8.98 t ha−1 under the LN treatment to 10.04 t ha−1 under NN treatment), but root dry weight was decreased (from 24.55 g plant−1 under LN treatment to 21.63 g plant−1 under NN treatment). However, the positive effect of interplanting was weakened with nitrogen application. Compared to monocropping, the grain yield was significantly increased by 9.07% under LN treatment and by 4.83% under NN treatment in interplanting.

3.3. Soil Nutrient and Net Potential Mineralization

Interplanting and nitrogen application significantly promoted the consumption of NH4+ and NO3 in soil (Table 1). Meanwhile, net potential nitrification and ammonification were also influenced by interplanting (Figure S4). Compared to monocropping, the net potential nitrification rate was increased by 23.57% in interplanting, while the net potential ammonification rate was decreased by 15.02%. Nitrogen application caused an obvious increase in net potential nitrification. The net potential nitrification rate was increased from 0.15 (mg N soil−1 d−1) under LN treatment to 0.27 (mg N soil−1 d−1) under NN treatment, while the net potential ammonification rate was decreased from −0.05 (mg N soil−1 d−1) under LN treatment to −0.07 (mg N soil−1 d−1) under NN treatment (Figure S4).

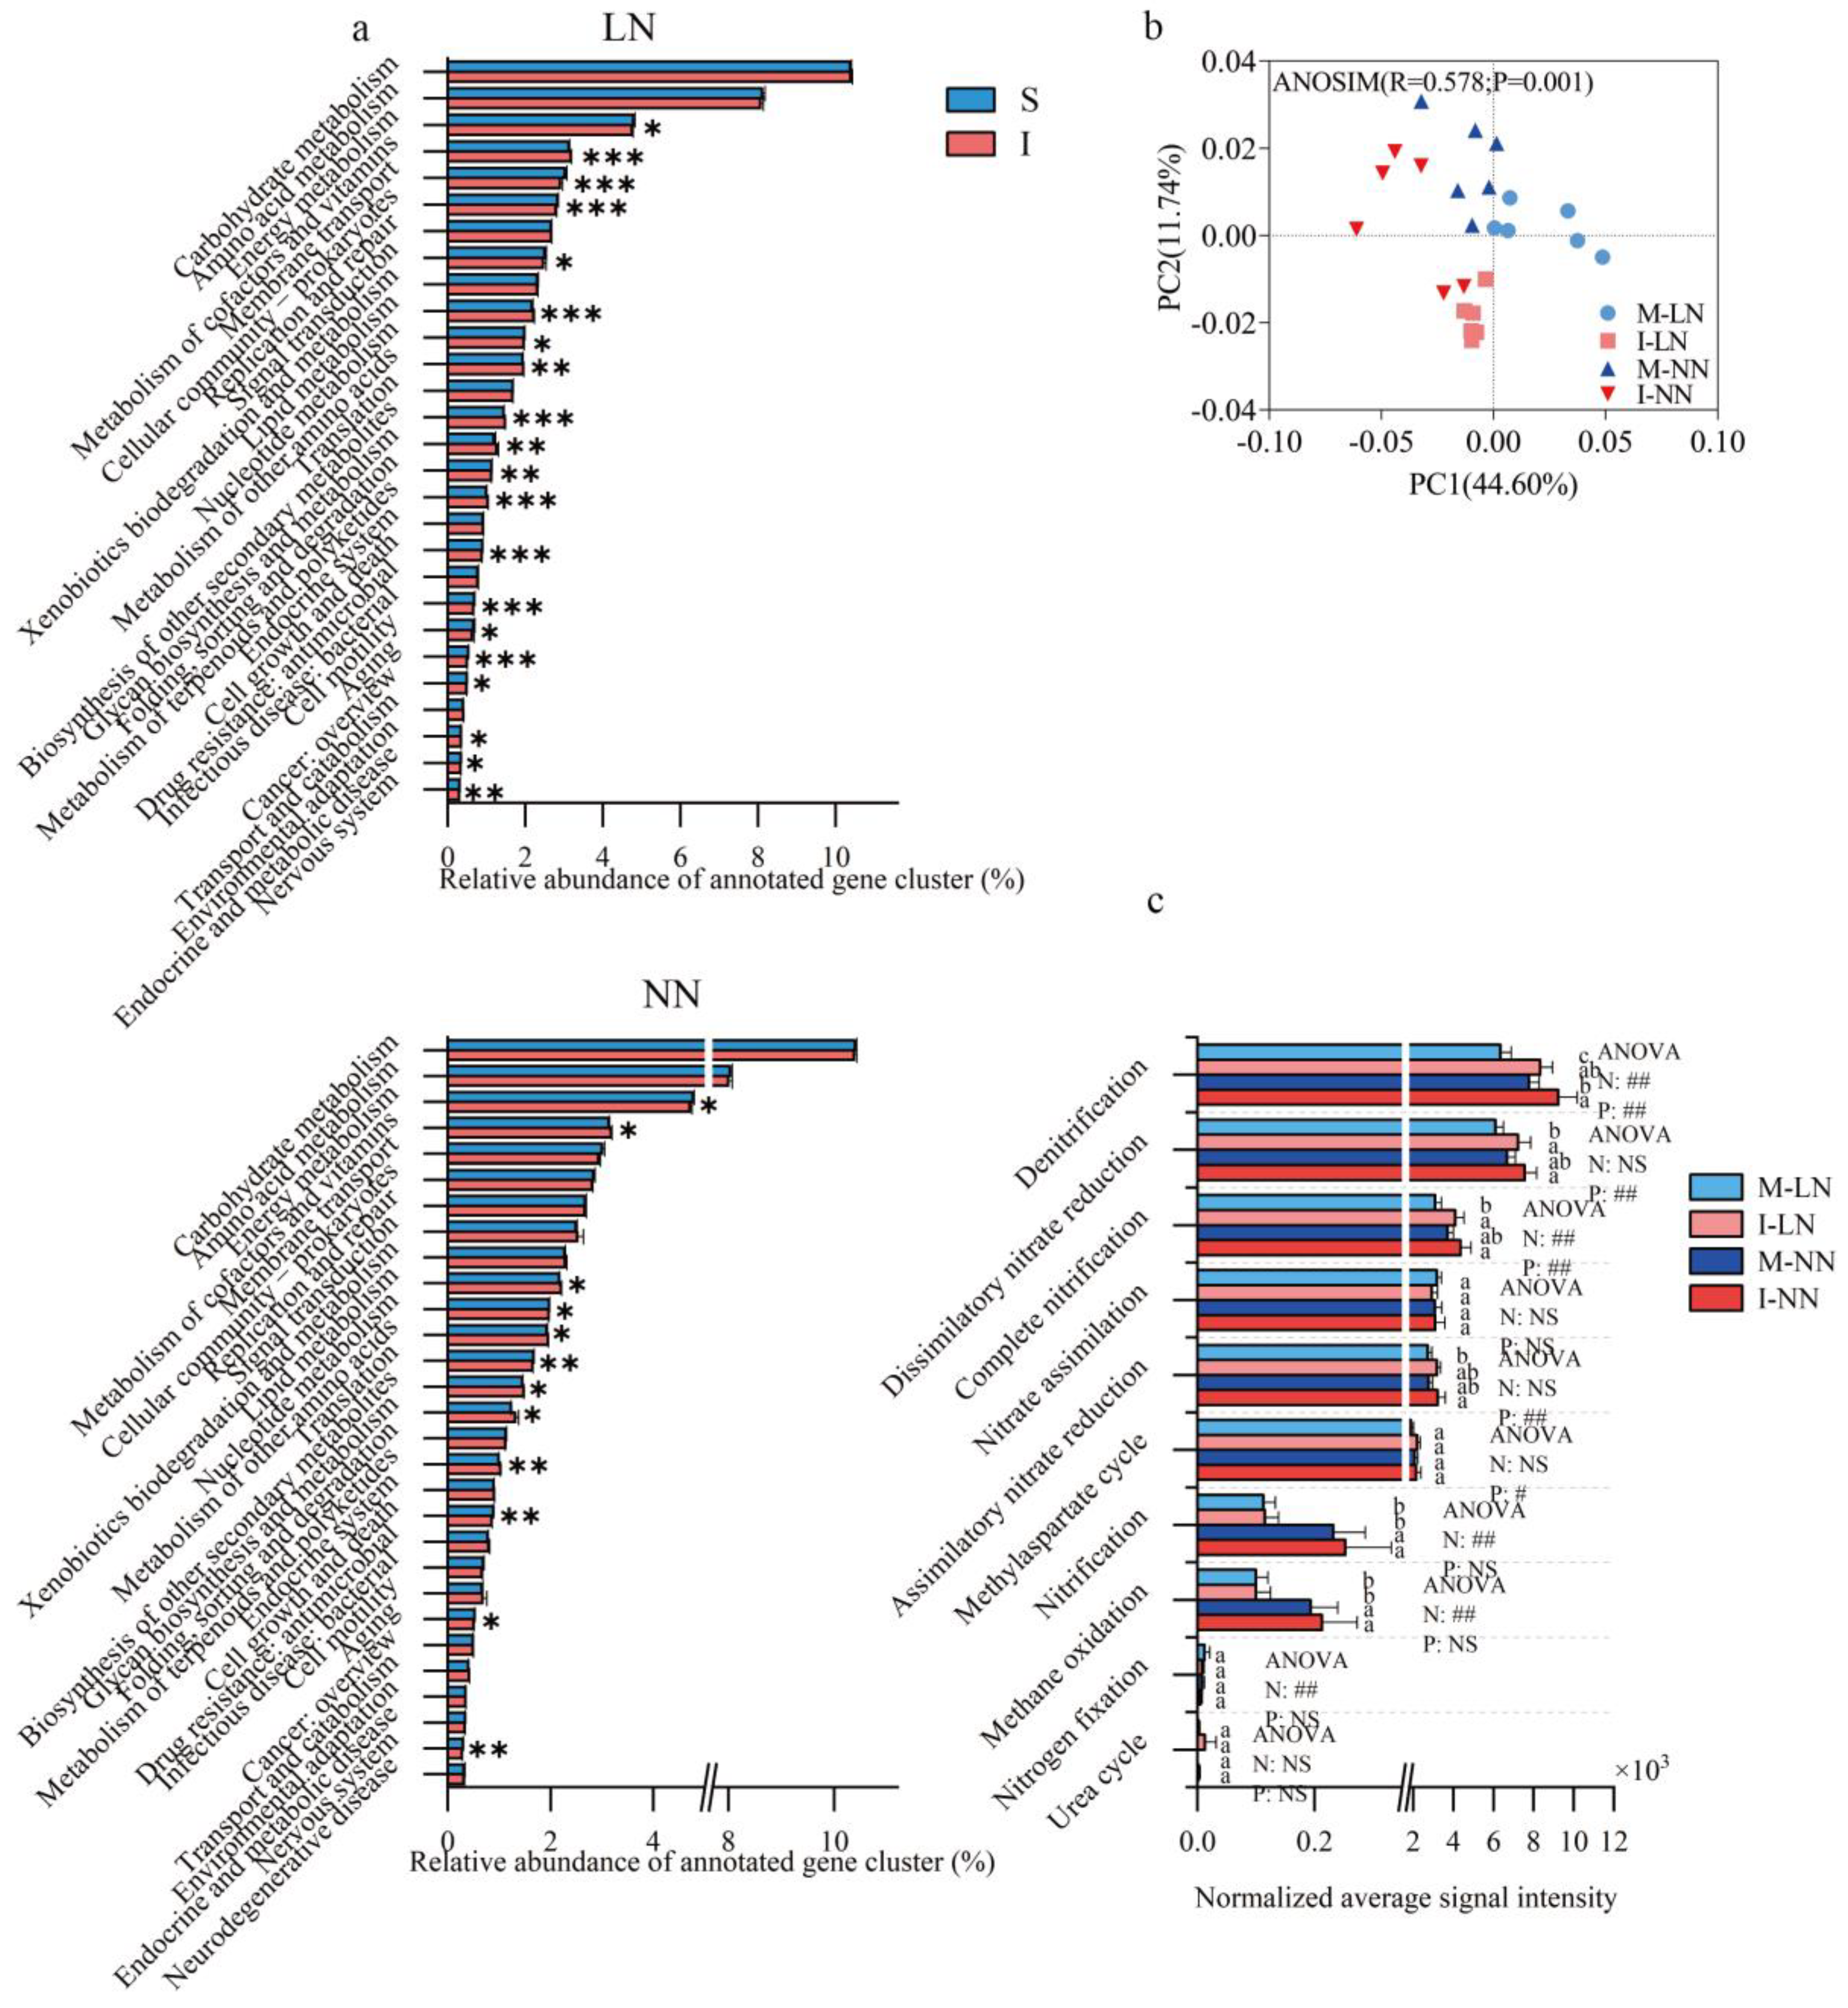
3.4. Soil Microbial Function of Nitrogen Cycle Pathway

Interplanting had different effects on soil microbial function under LN and NN treatments (Figure 4a). PCOA analysis showed that interplanting and nitrogen application significantly changed the module in the nitrogen cycling pathway of soil microorganisms according to ANOSIM (R = 0.578; p = 0.001) (Figure 4b). Information from KEGG was extracted and also verified the effect of the planting pattern and nitrogen application on the module in the nitrogen cycle pathway. It showed that the signal intensity of the denitrification module increased under two N treatments, while the signal intensities of the dissimilatory nitrate reduction and complete nitrification modules were only increased in LN treatment. The signal intensities of the nitrification, complete nitrification, and methane oxidation modules were enhanced significantly with nitrogen application, while with nitrogen, the signal intensity of the fixation module decreased (Figure 4c).

3.5. Relative Abundance of Genes in Nitrogen Cycle Pathway

Interplanting did have a significant influence on the relative abundance of most nitrogen cycle genes (Figure 5). The amoA, hao and nxrB genes were involved in the nitrification process. In interplanting, the relative abundance of nxrB (especially for sequences related to Actinobacteria phyla) was clearly increased under LN and NN treatments. The relative abundance of amoA (especially for sequences related to Nitrospirae phyla) only increased under NN treatment, which corresponded to an increase in the net nitrification rate (Figure S4). It had negligible effects on the relative abundance of hao in interplanting. The nirK, nirS, norB, and nosZ genes were involved in the denitrification process (Figure 5). The relative abundance of nirK (especially for sequences related to Proteobacteria phyla) was increased from 1507.33 in monocropping to 1932.17 in interplanting. Meanwhile, the relative abundance of norB and nosZ was similar to that of nirK. In the assimilatory nitrate reduction module, the relative abundance of narB (especially for sequences related to Bacteroidetes phyla) and nirA (especially for sequences related to Actinobacteria, Proteobacteria, and Acidobacteria phyla) were increased in interplanting (Figure 5). In the dissimilatory nitrate reduction module, the relative abundance of narG (especially for sequences related to Actinobacteria phyla) was increased in interplanting, while the relative abundance of nrfA (especially for sequences related to Proteobacteria, Candidatus, and Rokubacteria phyla) was decreased. Moreover, there was a stronger influence on the relative abundance of narG and nrfA under LN treatment. In addition, the nifH gene was sporadically detected in soil samples with a decreasing relative abundance, corresponding to the nitrogen fixation rate reducing under NN treatment (Figure S4).

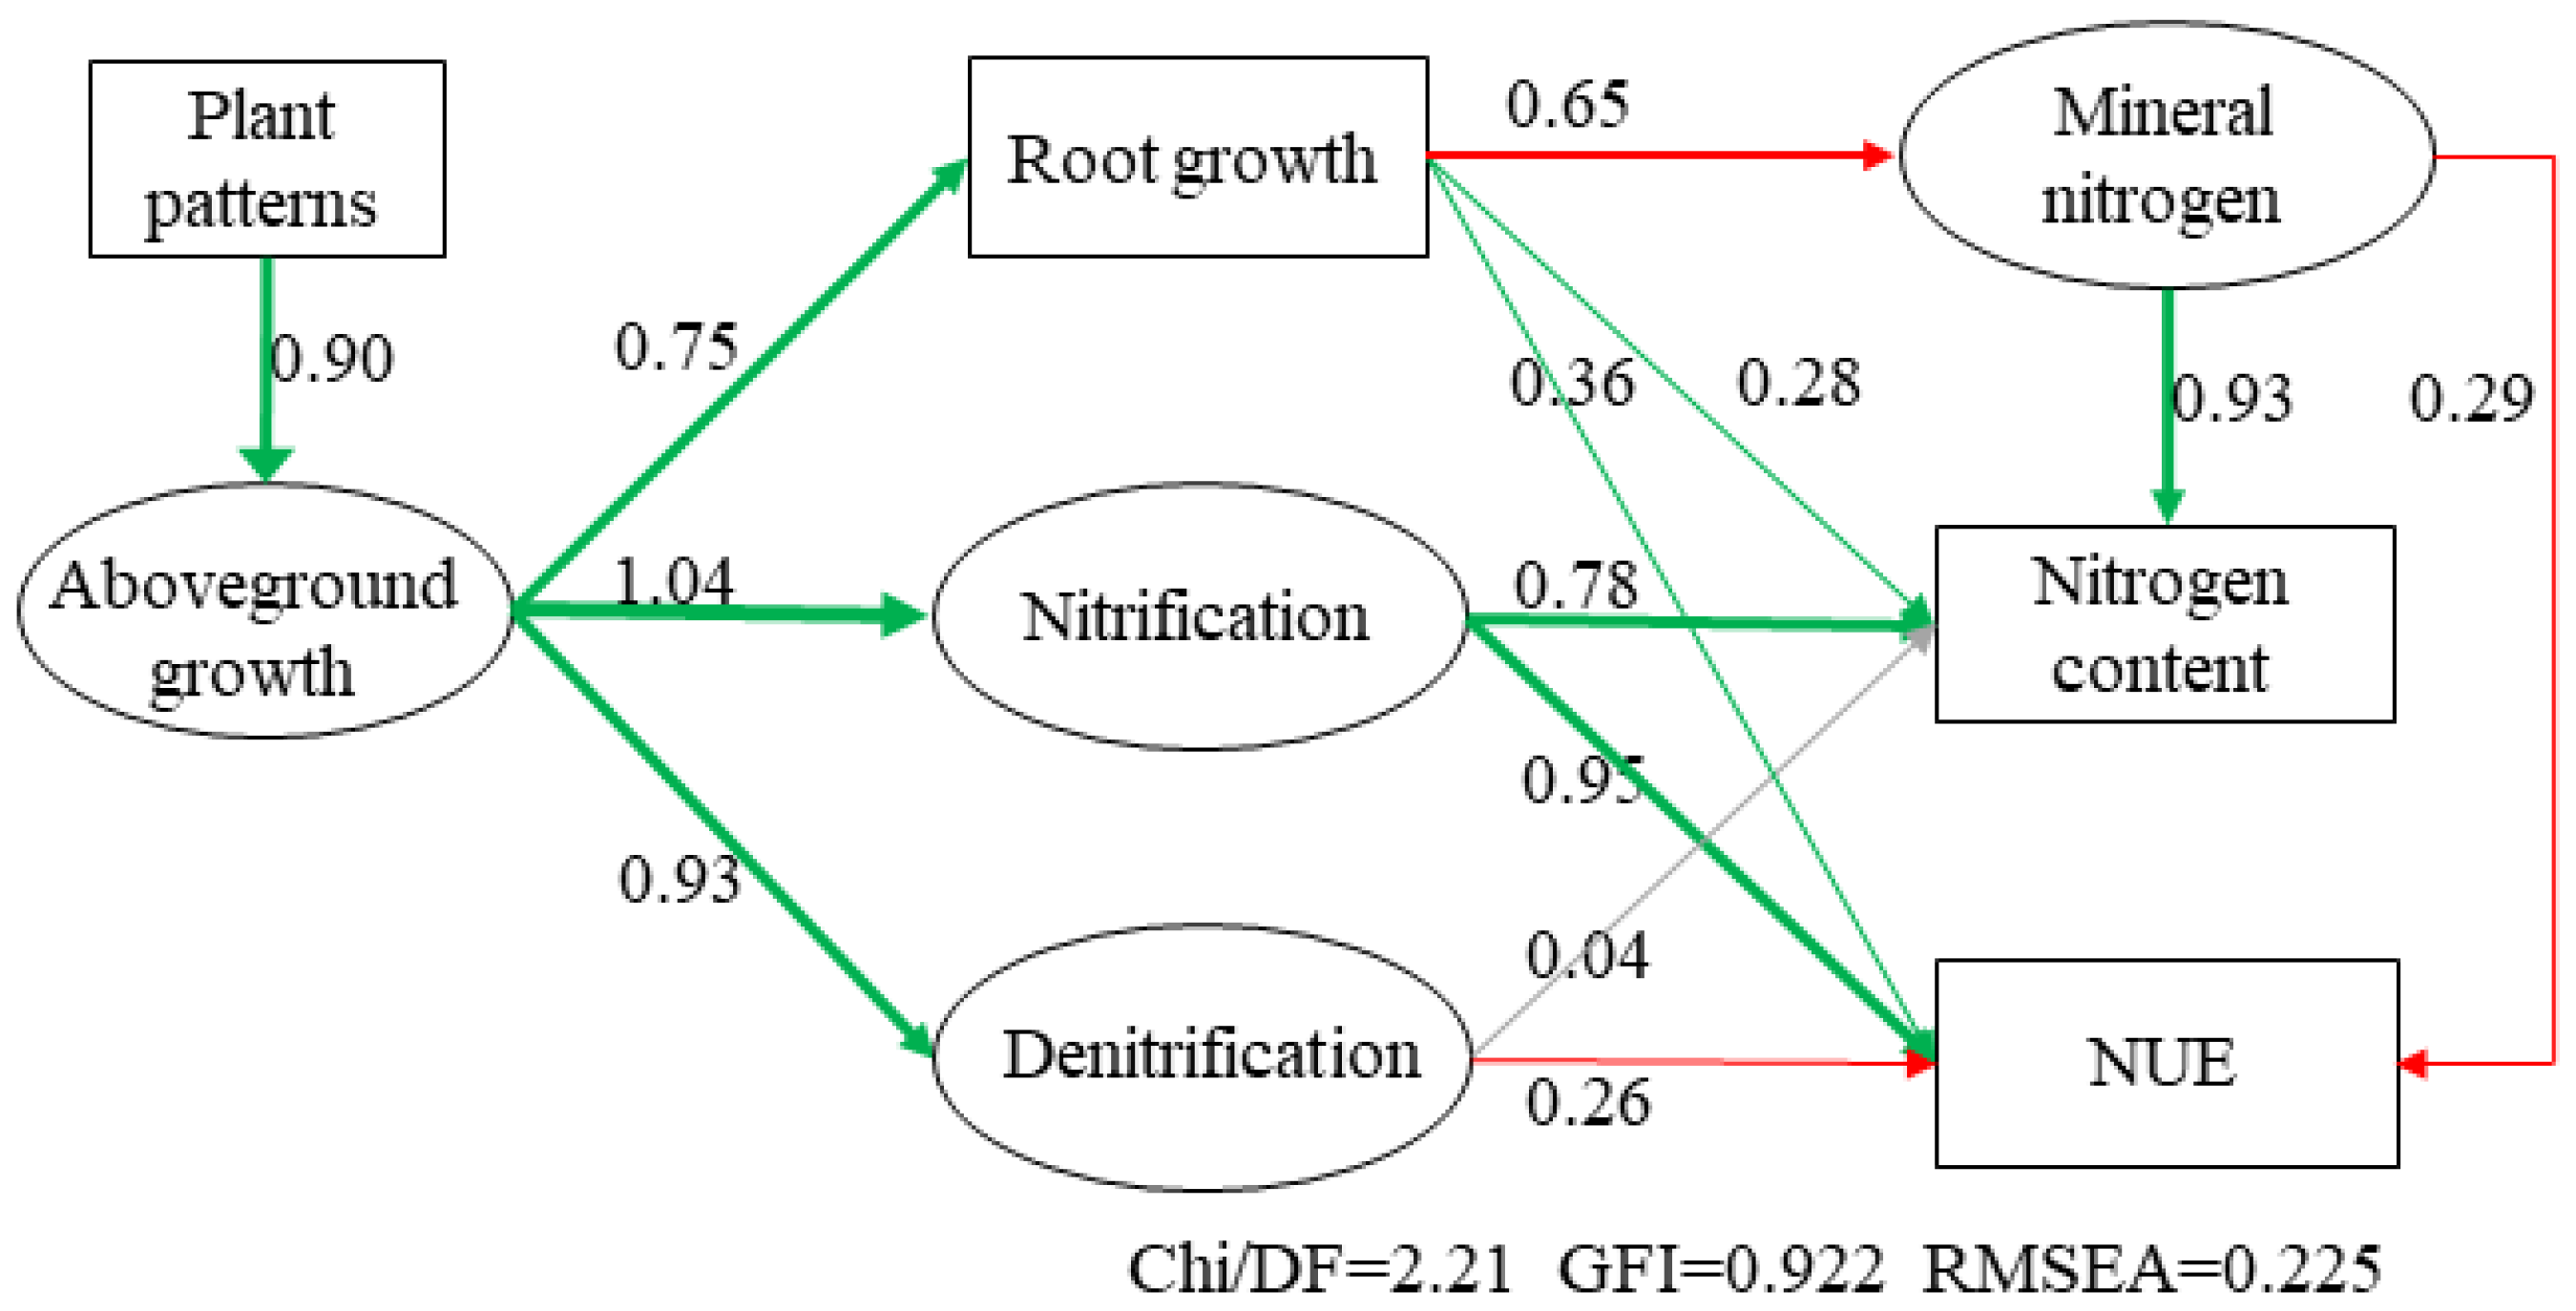
3.6. Relationships between Plant Nitrogen Content, Microbial Nitrogen Cycling, and NUE

Interplanting significantly improved aboveground growth, resulting in enhanced root growth, nitrification, and denitrification. Root growth was negatively related to the mineral nitrogen content. The plant nitrogen content was positively affected by the mineral nitrogen content and nitrification. NUE was positively affected by nitrification (Figure 6).

4. Discussion

4.1. Interplanting Promoted Plant Growth and Nitrogen Utilization

Compared with the monocropping system, the use of an appropriate intercropping population can fully utilize species diversity [38] and give rise to the effects of spatiotemporal niche complementarity and interspecific promotion on the growth of different crops [39]. In this study, we found that there were also complementary effects on nitrogen utilization resulting from the interplanting of cultivars with different nitrogen use efficiencies, which improved corn growth and grain yield. Previous studies confirmed that the interplanting of corn cultivars could optimize the canopy structure and increase the light use efficiency, leaf area index, and biomass, indicating that interplanting increased plant growth and the photosynthetic products allocated to roots [40,41]. Meanwhile, the root morphological characters of plants had the ability to self-regulate according to adjacent plants and attained an optimal distribution in the roots [42]. In this study, the root biomass was increased in ZD958 and DH3622 interplanting (Figure 3b), which is consistent with our previous studies on improving root biomass through the trait-based interplanting of two corn cultivars [43]. However, some results also suggested that legume and corn intercropping reduced the root biomass of corn [44]. The functional mechanism of root growth was inconsistent between intercropping and interplanting. In a corn and legume intercropping system, the mechanism was that nitrogen deficiency was alleviated through legume rhizobium biological nitrogen fixation under low-nutrient soil, and nitrogen absorption and the utilization of adjacent gramineous crops were promoted [45,46]. However, in corn interplanting, competitive root growth likely led to increased root biomass, which promoted the elongation and vertical distribution of roots in deep soil for acquiring nutrients. The same was also confirmed in a study on the interplanting of two corn cultivars with different root angles [43]. Meanwhile, this study also showed that root biomass in the interplanting system was inhibited with excessive nitrogen application, but it was promoted under low nitrogen application (Figure 3b). This is consistent with the negative relationship identified between root biomass and nitrogen application when the nitrogen was saturated in the soil [47].

4.2. Interplanting Enhanced Nitrogen Accumulation and Nitrogen Cycling Function in Rhizosphere

Similarly to plant growth promotion, interplanting increased plant nitrogen accumulation and reduced the content of NO3 and NH4+ in the rhizosphere (Table 1). This was consistent with the reduced mineral nitrogen content found in maize intercropped with soybeans [48]. When maize was intercropped with soybeans, the two crops competed differently for NO3 and NH4+ due to their different root systems. The highly competitive ability of maize leads to a lower rhizosphere mineral nitrogen content in soybeans, thus stimulating nitrogen fixation in this crop [49]. Meanwhile, interplanting decreased the NO3/NH4+ ratio in the present study. This indicated that a greater number of protons were secreted into the rhizosphere, leading to rhizosphere acidification. This result is consistent with the intercropping of maize with legumes [49]. Changes in other root exudates would further alter rhizosphere microbes.
In general, certain functional genes of soil microorganisms are composed of different species, and their relative abundance is determined through the dynamics of numerous species in soil microbial communities [50,51]. Excessive N application has been shown to cause soil degradation, such as soil aggregate destruction and acidification, which directly reduces soil microbial diversity [3,52]. Therefore, nitrogen application can significantly affect the abundance of microorganisms related to nitrogen cycling [8]. Our results show that Nitrospirae is the main nitrifying bacteria in soil. It directly affected the abundance of the amoA and hao genes through nitrification (Figure 5), which was consistent with previous results [53]. A higher nitrogen content in soil will accelerate the rate of the N cycle. During the nitrification and denitrification process, the relative abundances of amoA, hao, nxrB, nirK, norB, and nosZ were increased with nitrogen application (Figure 5). Ammonium and nitrate were shown to be the main factors affecting the nitrification and denitrification process [51], which is consistent with our results. Our study indicated that the soil N cycle was closely related to nitrogen application (Figure 5). Nitrogen application promoted plant growth, which strengthened the interaction between the roots and soil microorganisms [4]. Changes in these functional microbes may cause nitrogen loss. Research has shown that nitrogen application has significantly increased the abundance of amoA, nirK and nirS [54]. Excessive nitrogen application reduced the abundance of the nifH gene and increased the relative abundance of Proteobacteria, which was closely related to the denitrification module [8]. Our results showed that Nitrospirae and Proteobacteria were increased under NN treatment, which increased the gene abundance of amoA and hao in the nitrification module. Additionally, increased Proteobacteria were dominant in denitrification (Figure 5).
Microorganisms demonstrate an extremely sensitive response to environmental changes, so microbial functions are altered with changes in crop types, soil textures, planting patterns, or other environmental factors [55]. Our research testified that interplanting had a significant impact on soil microbial functions and increased the relative abundance of genes in the nitrification, denitrification, and nitrate/nitrite reduction pathways (Figure 4), indicating more aggressive soil nitrogen cycling. Interactions between the roots and rhizosphere may induce nitrogen-involved microbes and promote the nitrogen cycle [56,57]. The increased abundance of nitrogen cycle functional genes contributed to lower mineral nitrogen losses and a lower rhizosphere mineral content in maize and soybean strip intercropping [48,58]. The enhanced nitrate/nitrite reduction also decreased nitrate nitrogen and further increased nitrogen retention [59].

5. Conclusions

Interplanting between high-nitrogen-use-efficiency and low-nitrogen-use-efficiency cultivars improved shoot and root growth and increased yield, nitrogen accumulation, and nitrogen use efficiency. Interplanting accelerated the consumption of soil nitrogen components, shifted microorganism N cycle function, and enhanced nitrification. Intraspecific intercropping with complementary root or rhizosphere functional traits needs to be further studied. This will allow its common mechanisms to be explored, allowing for improvements in nutrient utilization, stress resistance, grain yield, and climate change adaptation.

Supplementary Materials

The following supporting information can be downloaded at: https://www.mdpi.com/article/10.3390/agronomy14030586/s1, Figure S1: Nitrogen accumulation of two corn cultivars under different nitrogen levels (N) and planting pattern (P) in 2021 and 2022. Based on one-way ANOVA, different lower-case letters indicated a significant difference of two planting patterns and two corn cultivars under same N level. Based on two-way ANOVA considering the factors of “planting pattern” (2 levels) and “cultivar” (2 levels), **, p < 0.01; *, p < 0.05; and ns, p > 0.05 indicated differences between interplanting (I) and monocropping (M) under same N level. Based on three-way ANOVA considering the factors of “N application” (2 levels) “planting pattern” (2 levels) and “cultivar” (2 levels), ##, p < 0.01; #, p < 0.05; and NS, p > 0.05 indicated their effects; Figure S2: Dry matter accumulation of two corn cultivars under different nitrogen levels (N) and planting pattern (P) in 2021 and 2022. Based on one-way ANOVA, different lower-case letters indicated a significant difference of two planting patterns and two corn cultivars under same N level. Based on two-way ANOVA considering the factors of “planting pattern” (2 levels) and “cultivar” (2 levels), **, p < 0.01; *, p < 0.05; and ns, p > 0.05 indicated differences between interplanting (I) and monocropping (M) under same N level. Based on three-way ANOVA considering the factors of “N application” (2 levels) “planting pattern” (2 levels) and “cultivar” (2 levels), ##, p < 0.01; #, p < 0.05; and NS, p > 0.05 indicated their effects; Figure S3: Leaf area index of two corn cultivars under different nitrogen levels (N) and planting pattern (P) in 2021 and 2022. Based on three-way ANOVA considering the factors of “N application” (2 levels) “planting pattern” (2 levels) and “cultivar” (2 levels), ##, p < 0.01; #, p < 0.05; and NS, p > 0.05 indicated their effects. Interplanting (I) and monocropping (M); Figure S4: Net potential mineralization rate (a), net potential nitrification rate (b), net potential ammonification rate (c) and N2O flux (d) of two corn cultivars under different nitrogen levels (N) and planting pattern (P) in 2022. Based on three-way ANOVA considering the factors of “N application” (2 levels) “planting pattern” (2 levels) and “cultivar” (2 levels), ##, p < 0.01; #, p < 0.05; and NS, p > 0.05 indicated their effects. Interplanting, (I); monocropping, (M); Figure S5: Dry matter weight at maturity and nitrogen content at maturity of two corn cultivars with blank treatment in 2021 and 2022.

Author Contributions

Conceptualization, Q.W.; Software, H.S. and R.S.; Formal analysis, X.J.; Investigation, Z.M., H.S., M.L., J.H., X.L. (Xinmei Li), L.S., X.L. (Xiaoyong Li), H.G., Y.L. and Z.F.; Writing—original draft, Z.M.; Writing—review & editing, X.J.; Supervision, R.S., R.L., Q.L. and Q.W.; Funding acquisition, Q.W. All authors have read and agreed to the published version of the manuscript.

Funding

This research was funded by National Key Research and Development Program of China (2022YFD2300802-7), Henan Province Agro-ecosystem Field Observation and Research Station (30602535), Henan Natural Science Foundation (222300420180), and the China Postdoctoral Science Foundation (2021M690928).

Data Availability Statement

No new data were created or analyzed in this study. Data sharing is not applicable to this article.

Conflicts of Interest

The authors declare that they have no known competing financial interests or personal relationships that could have appeared to influence the work reported in this paper.

References

  1. National Bureau of Statistics. China Statistical Yearbook—2022. 2022. Available online: http://www.stats.gov.cn/ (accessed on 6 September 2023).
  2. Malhi, S.S.; Lemke, R.; Wang, Z.H.; Chhabra, B.S. Tillage, nitrogen and crop residue effects on crop yield, nutrient uptake, soil quality, and greenhouse gas emissions. Soil Tillage Res. 2006, 90, 171–183. [Google Scholar] [CrossRef]
  3. Wang, S.; Huang, X.L.; Zhang, Y.; Yin, C.B.; Richel, A. The effect of corn straw return on corn production in Northeast China: An integrated regional evaluation with meta-analysis and system dynamics. Resour. Conserv. Recycl. 2021, 167, 105402. [Google Scholar] [CrossRef]
  4. Bai, Y.C.; Chang, Y.Y.; Hussain, M.; Lu, B.; Zhang, J.P.; Song, X.B.; Lei, X.S.; Pei, D. Soil chemical and microbiological properties are changed by long term chemical fertilizers that limit ecosystem functioning. Microorganisms 2020, 8, 694. [Google Scholar] [CrossRef] [PubMed]
  5. Yao, Z.; Zhang, W.S.; Chen, Y.X.; Zhang, W.; Liu, D.Y.; Gao, X.P.; Chen, X.P. Nitrogen leaching and grey water footprint affected by nitrogen fertilization rate in maize production: A case study of southwest China. J. Sci. Food Agric. 2021, 101, 6064–6073. [Google Scholar] [CrossRef]
  6. Zhou, J.; Guan, D.W.; Zhou, B.K.; Zhao, B.S.; Ma, M.C.; Qin, J.; Jiang, X.; Chen, S.F.; Cao, F.M.; Shen, D.L.; et al. Influence of 34-years of fertilization on bacterial communities in an intensively cultivated black soil in northeast China. Soil Biol. Biochem. 2015, 90, 42–51. [Google Scholar] [CrossRef]
  7. Hu, X.J.; Liu, J.J.; Wei, D.; Zhu, P.; Cui, X.A.; Zhou, B.K.; Chen, X.L.; Jin, J.; Liu, X.B.; Wang, G.H. Effects of over 30-year of different fertilization regimes on fungal community compositions in the black soils of northeast China. Agric. Ecosyst. Environ. 2017, 248, 113–122. [Google Scholar] [CrossRef]
  8. Chen, L.; Li, K.K.; Shi, W.J.; Wang, X.L.; Wang, E.T.; Liu, J.F.; Sui, X.H.; Mi, G.H.; Tian, C.F.; Chen, W.X. Negative impacts of excessive nitrogen fertilization on the abundance and diversity of diazotrophs in black soil under maize monocropping. Geoderma 2021, 393, 114999. [Google Scholar] [CrossRef]
  9. Treseder, K.K. Nitrogen additions and microbial biomass: A meta-analysis of ecosystem studies. Ecol. Lett. 2008, 11, 1111–1120. [Google Scholar] [CrossRef]
  10. Zhong, Y.Q.W.; Yan, W.M.; Shangguan, Z.P. Impact of long-term N additions upon coupling between soil microbial community structure and activity, and nutrient-use efficiencies. Soil Biol. Biochem. 2015, 91, 151–159. [Google Scholar] [CrossRef]
  11. Martin, F.S.; Noordwijk, M.V. Is native timber tree intercropping an economically feasible alternative for smallholder farmers in the philippines? Aust. J. Agric. Resour. Econ. 2011, 55, 257–272. [Google Scholar] [CrossRef]
  12. Beedy, T.L.; Snapp, S.S.; Akinnifesi, F.K.; Sileshi, G.W. Impact of Gliricidia sepium intercropping on soil organic matter fractions in a maize-based cropping system. Agric. Ecosyst. Environ. 2010, 138, 139–146. [Google Scholar] [CrossRef]
  13. Dang, K.; Gong, X.W.; Zhao, G.; Wang, H.L.; Ivanistau, A.; Feng, B.L. Intercropping alters the soil microbial diversity and community to facilitate nitrogen assimilation: A potential mechanism for increasing proso millet grain yield. Front. Microbiol. 2020, 11, 601054. [Google Scholar] [CrossRef] [PubMed]
  14. Wang, H.; Liu, S.; Zhang, X.; Mao, Q.G.; Li, X.Z.; You, Y.M.; Wang, J.X.; Zheng, M.H.; Zhang, W.; Lu, X.K.; et al. Nitrogen addition reduces soil bacterial richness, while phosphorus addition alters community composition in an old-growth N-rich tropical forest in southern China. Soil Biol. Biochem. 2018, 127, 22–30. [Google Scholar] [CrossRef]
  15. Yu, L.L.; Luo, S.S.; Gou, Y.G.; Xu, X.; Wang, J.W. Structure of rhizospheric microbial community and N cycling functional gene shifts with reduced N input in sugarcane-soybean intercropping in South China. Agric. Ecosyst. Environ. 2021, 314, 107413. [Google Scholar] [CrossRef]
  16. Cuartero, J.; Pascual, J.A.; Vivo, J.M.; Özbolat, O.; Sánchez-Navarro, V.; Egea-Cortines, M.; Zornoza, R.; Mena, M.M.; Garcia, E.; Ros, M. A first-year melon/cowpea intercropping system improves soil nutrients and changes the soil microbial community. Agric. Ecosyst. Environ. 2022, 328, 107856. [Google Scholar] [CrossRef]
  17. Bargaz, A.; Noyce, G.L.; Fulthorpe, R.; Carlsson, G.; Furze, J.R.; Jensen, E.S.; Dhiba, D.; Isaac, M.E. Species interactions enhance root allocation, microbial diversity and P acquisition in intercropped wheat and soybean under P deficiency. Appl. Soil Ecol. 2017, 120, 179–188. [Google Scholar] [CrossRef]
  18. Nyawade, S.O.; Karanja, N.N.; Gachene, C.K.K.; Gitari, H.I.; Schulte-Geldermann, E.; Parker, M.L. Short-term dynamics of soil organic matter fractions and microbial activity in smallholder potato-legume intercropping systems. Appl. Soil Ecol. 2019, 142, 123–135. [Google Scholar] [CrossRef]
  19. Yang, Y.D.; Feng, X.M.; Hu, Y.G.; Zeng, Z.H. The diazotrophic community in oat rhizosphere: Effects of legume intercropping and crop growth stage. Front. Agric. Sci. Eng. 2019, 6, 162–171. [Google Scholar] [CrossRef]
  20. Zhao, F.Y.; Sun, Z.X.; Feng, L.S.; Zhang, Y.Y.; Feng, C.; Bai, W.; Zheng, J.M.; Zhang, Z.; Yang, N.; Cai, Q.; et al. Biological N fixation but not mineral N fertilization enhances the accumulation of N in peanut soil in maize/peanut intercropping system. J. Agric. Food Res. 2022, 10, 100365. [Google Scholar] [CrossRef]
  21. Yang, L.; Luo, Y.; Lu, B.L.; Zhou, G.P.; Chang, D.N.; Gao, S.J.; Zhang, J.D.; Che, Z.X.; Cao, W.D. Long-term maize and pea intercropping improved subsoil carbon storage while reduced greenhouse gas emissions. Agric. Ecosyst. Environ. 2023, 349, 108444. [Google Scholar] [CrossRef]
  22. Chen, W.Z.; Kang, Z.M.; Yang, Y.N.; Li, Y.S.; Qiu, R.L.; Qin, J.H.; Li, H.S. Interplanting of rice cultivars with high and low Cd accumulation can achieve the goal of “repairing while producing” in Cd-contaminated soil. Sci. Total Environ. 2022, 851, 158229. [Google Scholar] [CrossRef]
  23. Reiss, E.R.; Drinkwater, L.E. Cultivar mixtures: A meta-analysis of the effect of intraspecific diversity on crop yield. Ecol. Appl. 2018, 28, 62–77. [Google Scholar] [CrossRef]
  24. Li, C.H.; Su, X.H.; Sun, D.L. Ecological and physiological effects of intercropping compound populations with different genotypes of maize. Acta Ecol. Sin. 2002, 22, 2096–2103. Available online: https://www.ecologica.cn/stxb/article/abstract/021212 (accessed on 19 September 2023). (In Chinese).
  25. Duan, P.F.; Zhao, D. Study on ecological effects of intercropping different genotypes of maize on disease resistance and stable yield. J. Maize Sci. 2017, 25, 107–112. Available online: http://www.ymkx.com.cn/jms/article/abstract/20170617 (accessed on 23 September 2023). (In Chinese).
  26. Zhu, Y.Y.; Chen, H.; Fan, J.H.; Wang, Y.Y.; Li, Y.; Chen, J.B.; Fan, J.X.; Yang, S.S.; Hu, L.P.; Leung, H.; et al. Genetic diversity and disease control in rice. Nature 2000, 406, 718–722. [Google Scholar] [CrossRef] [PubMed]
  27. Grettenberger, I.M.; Tooker, J.F. Moving beyond resistance management toward an expanded role for seed mixtures in agriculture. Agric. Ecosyst. Environ. 2015, 208, 29–36. [Google Scholar] [CrossRef]
  28. Ma, J.F.; Ma, Y.; Wei, X.T.; Feng, L.S.; Chen, H.; Hong, D.F.; Tang, Z.H.; Zhang, X.S. Quality performance of two genotypic maize intercropping populations after wind disaster lodging. Shandong Agric. Sci. 2015, 47, 36–38. (In Chinese) [Google Scholar] [CrossRef]
  29. Li, H.P.; Liu, K.; Li, Z.B.; Zhang, M.B.; Zhang, Y.E.; Li, S.Y.; Wang, X.L.; Zhou, J.L.; Zhao, Y.L.; Liu, T.X.; et al. Mixing trait-based corn (Zea mays L.) cultivars increases yield through pollination synchronization and increased cross-fertilization. Crop J. 2023, 11, 291–300. [Google Scholar] [CrossRef]
  30. Tao, J.J.; Wang, H.B.; Zhu, Z.Y.; Tan, J.F.; Wang, Y.L. Effect of Different genotype summer maize intercropping on yield and nitrogen absorption and utilization. Acta Agric. Boreali-Sin. 2016, 31, 185–191. (In Chinese). Available online: http://www.hbnxb.net/CN/10.7668/hbnxb.2016.06.029 (accessed on 15 September 2023).
  31. Liu, T.X.; Li, C.H.; Ma, X.M.; Zhao, X.; Liu, S.Y. Effects of intercropping different genotypes of maize on leaf senescence, grain yield, and quality. Chin. J. Plant Ecol. 2008, 32, 914–921. (In Chinese) [Google Scholar] [CrossRef]
  32. Li, X.L.; Guo, L.G.; Zhou, B.Y.; Tang, X.M.; Chen, C.C.; Zhang, L.; Zhang, S.Y.; Li, C.F.; Xiao, K.; Dong, W.X.; et al. Characterization of low-N responses in maize (Zea mays L.) cultivars with contrasting nitrogen use efficiency in the north China plain. J. Integr. Agric. 2019, 18, 2141–2152. [Google Scholar] [CrossRef]
  33. Gao, J.; Lei, M.; Yang, L.J.; Wang, P.; Tao, H.B.; Huang, S.B. Reduced row spacing improved yield by optimizing root distribution in maize. Eur. J. Agron. 2021, 127, 126291. [Google Scholar] [CrossRef]
  34. Roley, S.S.; Duncan, D.S.; Liang, D.; Garoutte, A.; Jackson, R.D.; Tiedje, J.M.; Robertson, G.P. Associative nitrogen fixation (ANF) in switchgrass (Panicum virgatum) across a nitrogen input gradient. PLoS ONE 2018, 13, e0197320. [Google Scholar] [CrossRef] [PubMed]
  35. Zuur, A.F.; Ieno, E.N.; Smith, G.M. Principal coordinate analysis and non-metric multidimensional scaling. In Analysing Ecological Data; Springer: New York, NY, USA, 2007; pp. 259–264. [Google Scholar]
  36. Field, A. Discovering Statistics Using IBM SPSS Statistic; Sage Publications Limited: London, UK, 2024. [Google Scholar]
  37. OriginPro, Version 2023; OriginLab Corporation: Northampton, MA, USA. Available online: https://www.originlab.com (accessed on 10 September 2023).
  38. Li, C.J.; Hoffland, E.; Kuyper, T.W.; Yu, Y.; Zhang, C.C.; Li, H.G.; Zhang, F.S.; Werf, V.D.W. Syndromes of production in intercropping impact yield gains. Nat. Plants 2020, 6, 653–660. [Google Scholar] [CrossRef] [PubMed]
  39. Zhou, T.; Wang, L.; Sun, X.; Wang, X.C.; Pu, T.; Yang, H.; Rengel, Z.; Liu, W.G.; Yang, W.Y. Improved post-silking light interception increases yield and P-use efficiency of maize in maize/soybean relay strip intercropping. Field Crops Res. 2021, 262, 108054. [Google Scholar] [CrossRef]
  40. Shi, Z.S.; Zhu, M.; Li, F.H.; Wang, Z.B. Research on yield-increasing of different kinds of maize. J. Maize Sci. 2008, 16, 107–109. (In Chinese). Available online: http://www.ymkx.com.cn/jms/article/abstract/08020107 (accessed on 21 September 2023).
  41. Hou, S.; Ren, H.; Fan, F.L.; Zhao, M.; Zhou, W.B.; Zhou, B.Y.; Li, C.F. The effects of plant density and nitrogen fertilization on maize yield and soil microbial communities in the black soil region of Northeast China. Geoderma 2023, 430, 116325. [Google Scholar] [CrossRef]
  42. Craine, J.M. Competition for Nutrients and Optimal Root Allocation. Plant Soil 2006, 285, 171–185. [Google Scholar] [CrossRef]
  43. Chen, Y.B.; Dong, P.F.; Jia, X.C.; Miao, Z.Y.; Wang, J.J.; Wang, Q.; Yang, Q.; Zhao, W.L. Effects of intercropping on root distribution, nutrient accumulation and yield of maize with different root architecture. J. Nucl. Agric. 2023, 37, 594–605. (In Chinese) [Google Scholar]
  44. Huang, Y.; Wu, Q.; Deng, M.Y.; He, X.Q.; Jin, Y.; Wang, J.; Luo, K.; Xie, X.; Wang, T.; Yong, T.W. Effects of root interaction on root growth, leaf photosynthetic characteristics and biomass of maize under two intercropping systems of maize and legumes. J. Sichuan Agric. Univ. 2020, 38, 513–519. (In Chinese) [Google Scholar] [CrossRef]
  45. Yu, R.P.; Yang, H.; Xing, Y.; Zhang, W.P.; Lambers, H.; Li, L. Belowground processes and sustainability in agroecosystems with intercropping. Plant Soil 2022, 476, 263–288. [Google Scholar] [CrossRef]
  46. Wang, G.H.; Sheng, L.C.; Zhao, D.; Sheng, J.D.; Wang, X.R.; Liao, H. Allocation of nitrogen and carbon is regulated by nodulation and mycorrhizal networks in soybean/maize intercropping system. Front. Plant Sci. 2016, 7, 1901. [Google Scholar] [CrossRef] [PubMed]
  47. Sinclair, T.R.; Vadez, V. Physiological traits for crop yield improvement in low N and P environments. Food Secur. Nutr.-Stress. Environ. Exploit. Plants’ Genet. Capab. 2002, 245, 9–23. [Google Scholar] [CrossRef]
  48. Yu, L.; Tang, Y.; Wang, Z.; Gou, Y.; Wang, J. Nitrogen-cycling genes and rhizosphere microbial community with reduced nitrogen application in maize/soybean strip intercropping. Nutr. Cycl. Agroecosystems 2019, 113, 35–49. [Google Scholar] [CrossRef]
  49. Wang, X.; Gao, Y.; Zhang, H.; Shao, Z.; Sun, B.; Gao, Q. Enhancement of rhizosphere citric acid and decrease of NO3/NH4+ ratio by root interactions facilitate N fixation and transfer. Plant Soil 2020, 447, 169–182. [Google Scholar] [CrossRef]
  50. Tang, Y.Q.; Zhang, X.Y.; Li, D.D.; Wang, H.M.; Chen, F.S.; Fu, X.L.; Fang, X.M.; Sun, X.M.; Yu, G.R. Impacts of nitrogen and phosphorus additions on the abundance and community structure of ammonia oxidizers and denitrifying bacteria in Chinese fir plantations. Soil Biol. Biochem. 2016, 103, 284–293. [Google Scholar] [CrossRef]
  51. Shi, Y.L.; Liu, X.R.; Zhang, Q.W. Effects of combined biochar and organic fertilizer on nitrous oxide fluxes and the related nitrifier and denitrifier communities in a saline-alkali soil. Sci. Total Environ. 2019, 686, 199–211. [Google Scholar] [CrossRef]
  52. Kumar, V.V. Plant Growth-Promoting Microorganisms: Interaction with Plants and Soil; Springer International Publishing: Cham, Switzerland, 2016; Volume 1, pp. 1–16. [Google Scholar] [CrossRef]
  53. Liu, J.J.; Yu, Z.H.; Yao, Q.; Sui, Y.Y.; Shi, Y.; Chu, H.Y.; Tang, C.X.; Franks, A.E.; Jin, J.; Liu, X.B.; et al. Ammonia-oxidizing archaea show more distinct biogeographic distribution patterns than ammonia-oxidizing bacteria across the black soil zone of northeast China. Front. Microbiol. 2018, 9, 171. [Google Scholar] [CrossRef]
  54. Ouyang, Y.; Evans, S.E.; Friesen, M.L.; Tiemann, L.K. Effect of nitrogen fertilization on the abundance of nitrogen cycling genes in agricultural soils: A meta-analysis of field studies. Soil Biol. Biochem. 2018, 127, 71–78. [Google Scholar] [CrossRef]
  55. Sun, R.B.; Wang, F.H.; Hu, C.S.; Liu, B.B. Metagenomics reveals taxon-specific responses of the nitrogen-cycling microbial community to long-term nitrogen fertilization. Soil Biol. Biochem. 2021, 156, 108214. [Google Scholar] [CrossRef]
  56. Li, B.; Li, Y.Y.; Wu, H.M.; Zhang, F.F.; Li, C.J.; Li, X.X.; Lambers, H.; Li, L. Root exudates drive interspecific facilitation by enhancing nodulation and N2 fixation. Proc. Nat. Acad. Sci. USA 2016, 113, 6496–6501. [Google Scholar] [CrossRef] [PubMed]
  57. Brooker, R.W.; Bennett, A.E.; Cong, W.; Daniell, T.J.; George, T.S.; Hallett, P.D.; Hawes, C.; Iannetta, P.M.; Jones, H.G.; Karley, A.J.; et al. Improving intercropping: A synthesis of research in agronomy, plant physiology and ecology. New Phytol. 2015, 206, 107–117. [Google Scholar] [CrossRef]
  58. Tang, Y.L.; Yu, L.L.; Guan, A.M.; Zhou, X.Y.; Wang, Z.G.; Guo, Y.G.; Wang, J.W. Soil mineral nitrogen residual and yield-scaled soil N2O emissions lowered by reducing nitrogen application and intercropping with soybean for sweet maize production in southern China. J. Integr. Agric. 2017, 16, 2586–2596. [Google Scholar] [CrossRef]
  59. Pan, H.; Qin, Y.; Wang, Y.; Liu, S.; Yu, B.; Song, Y.; Wang, X.; Zhu, G. Dissimilatory nitrate/nitrite reduction to ammonium (DNRA) pathway dominates nitrate reduction processes in rhizosphere and non-rhizosphere of four fertilized farmland soil. Environ. Res. 2020, 186, 109612. [Google Scholar] [CrossRef] [PubMed]
Figure 1. Diagram of low-N-efficiency corn (DH 3622) interplanted with high-N-efficiency corn (ZD 958) under LN and NN conditions in the field.
Agronomy 14 00586 g001
Figure 2. Nitrogen content at maturity (a) and nitrogen use efficiency (b) of two corn cultivars under different nitrogen levels (N) and planting patterns (P) in 2021 and 2022. Based on one-way ANOVA, different lower-case letters indicate a significant difference between the two planting patterns and the two corn cultivars under the same N level. Based on two-way ANOVA, considering the factors of “planting pattern” (2 levels) and “cultivar” (2 levels), **, p < 0.01 indicate significant differences between planting patterns (I) and monocropping (M) under the same N level. Based on three-way ANOVA, considering the factors of “N application” (2 levels) “planting pattern” (2 levels), and “cultivar” (2 levels), ##, p < 0.01 indicate their effects.
Agronomy 14 00586 g002
Figure 3. Dry matter weight at maturity (a), root dry weight at R1 stage (b) and grain yield (c) of two corn cultivars under different nitrogen levels (N) and planting patterns (P) in 2021 and 2022. Based on one-way ANOVA, different lower-case letters indicate significant differences between the two planting patterns and the two corn cultivars under the same N level. Based on two-way ANOVA, considering the factors of “planting pattern” (2 levels) and “cultivar” (2 levels), **, p < 0.01; *, p < 0.05; and ns, p > 0.05 indicate differences between interplanting (I) and monocropping (M) under the same N level. Based on three-way ANOVA, considering the factors of “N application” (2 levels), “planting pattern” (2 levels), and “cultivar” (2 levels), ##, p < 0.01 indicate their effects.
Agronomy 14 00586 g003
Figure 4. Soil microbial function in KEGG level 2 (a), principal coordinate analysis (b) and modules of nitrogen cycle pathway (c) of two corn cultivars under different nitrogen levels (N) and planting patterns (P) in 2022. Based on one-way ANOVA, different lower-case letters indicate a significant difference between the two planting patterns and the two corn cultivars under the same N levels. Based on Wilcoxon rank-sum test, considering the factors of “planting pattern” (2 levels), ***, p < 0.001; **, p < 0.01; *, p < 0.05 indicate differences between interplanting (I) and monocropping (M) under the same N levels. Based on three-way ANOVA, considering the factors of “N application” (2 levels), “planting pattern” (2 levels), and “cultivar” (2 levels), ##, p < 0.01; #, p < 0.05; and NS, p > 0.05 indicate their effects.
Agronomy 14 00586 g004
Figure 5. The taxonomic distribution (phylum level) of functional genes in the nitrogen cycle pathway of two corn cultivars under different nitrogen levels (N) and planting patterns (P) in 2022. Monocropping (M); interplanting (I).
Agronomy 14 00586 g005
Figure 6. Structural equation model (SEM) represents the effect of planting pattern and N application on plant growth and soil N content. The green line indicates a positive effect and a significant coefficient. And the gray line path indicates an insignificant coefficient. The red line indicates a negative effect. The width of the line indicates the strength of the normalized path coefficients. The data on the line represent the standardized total effects. Aboveground growth (leaf area index, dry matter wight at maturity, and dry matter accumulation post anthesis); root growth (root dry weight); nitrogen content at maturity; NUE (nitrogen use efficiency); mineral nitrogen (nitrate and ammonia nitrogen content); nitrification (amoA, hao, and nxrB); denitrification (nirK, nirS, norB, and nosZ).
Agronomy 14 00586 g006
Table 1. Rhizosphere soil nutrients of two corn cultivars under different nitrogen levels (N) and planting patterns (P) in 2022.
NitrogenPlantingSMCNH4+NO3APAKTNTPTK
LevelPattern(%)(mg·kg−1)(mg·kg−1)(mg·kg−1)(mg·kg−1)(g·kg−1)(g·kg−1)(g·kg−1)
LNM21.25 ± 0.11 b5.75 ± 0.08 a9.4 ± 0.08 a26.1 ± 0.48 a196.37 ± 2.76 a1.29 ± 0.01 a0.76 ± 0.04 a4.41 ± 0.19 a
I22.25 ± 0.50 a5.53 ± 0.08 b8.94 ± 0.21 b25.73 ± 0.39 a190.67 ± 2.54 a1.32 ± 0.04 a0.74 ± 0.03 a4.22 ± 0.11 a
NNM19.67 ± 0.33 b8.41 ± 0.08 a17.44 ± 0.39 a24.86 ± 0.6 a191.88 ± 3.57 a1.34 ± 0.01 a0.73 ± 0.02 a4.4 ± 0.12 a
I23.13 ± 0.24 a8.28 ± 0.09 a15.4 ± 0.24 b24.71 ± 0.48 a189.31 ± 3.06 a1.34 ± 0.01 a0.71 ± 0.03 a4.37 ± 0.13 a
ANOVA
Nns******ns*nsns
P******nsnsnsnsns
N × P**ns**nsnsnsnsns
Based on two-way ANOVA, considering factors of “planting pattern” (2 levels) and “cultivar” (2 levels), different letters indicate significant differences between interplanting (I) and monocropping (M) under the same N level. Based on three-way ANOVA, considering the factors of “N application” (2 levels), “planting pattern” (2 levels), and “cultivar” (2 levels), **, p < 0.01; *, p < 0.05; and ns, p > 0.05 indicate their effects. Soil moisture content (SMC).
Disclaimer/Publisher’s Note: The statements, opinions and data contained in all publications are solely those of the individual author(s) and contributor(s) and not of MDPI and/or the editor(s). MDPI and/or the editor(s) disclaim responsibility for any injury to people or property resulting from any ideas, methods, instructions or products referred to in the content.

