
A Method of Constructing Models for Estimating Proportions of Citrus Fruit Size Grade Using Polynomial Regression
1
Department of Engineering, Graduate School of Engineering, Kochi University of Technology, Kami 782-8502, Japan
2
Kochi Agricultural Research Center Fruit Tree Experiment Station, Kochi 780-8064, Japan
*
Author to whom correspondence should be addressed.
Agronomy 2024, 14(1), 174; https://doi.org/10.3390/agronomy14010174
Submission received: 23 November 2023
/
Revised: 9 January 2024
/
Accepted: 11 January 2024
/
Published: 12 January 2024
(This article belongs to the Section Horticultural and Floricultural Crops)
Abstract
:Estimating the fruit size is an important factor because it directly influences size-specific yield estimation, which would be useful for pricing in the market. In this paper, it was considered a method of constructing models for estimating the proportion of fruit size grades of citrus using polynomial regression. In order to construct models, curvilinear regressions were performed, utilizing the fruit diameters of a kind of citrus (Citrus junos Sieb. ex Tanaka) in the harvest. The constructed models were validated by comparison with another model, which was constructed using a combination of four datasets obtained from three orchards differing in the number of fruit sets. The estimation model’s accuracy (EMA, defined as the sum of the absolute difference between the actual and estimated proportions of each grade) was used for the evaluation of constructed models. The EMAs of 14 models applied to 28 validation data were ranging from 2.0% to 6.1%. In all validations, the proportions of fruit size grade were insignificant at a 5% level by Pearson’s chi-square test. Additionally, a comparison of EMAs differing in the number of trees by the constructed models showed that most were within EMA ≤ 10.0% in the case calculated by 10 trees. Validation of five farmers’ orchards indicated that the EMA of two was within 10.0%, and the EMA of three was at 11.3 to 12.5%. These results revealed that the constructed models could be applied to orchards for differing numbers of fruit sets. The acceptable accuracy was derived by at least over 10 trees investigated at one time.
1. Introduction
Accurate estimates of citrus fruit yield before harvest are crucial for farmers and buyers, as they are necessary for devising effective marketing plans and securing temporary workers needed during harvest. In this process, estimating the fruit size is a pivotal factor because it directly influences yield estimation, working in conjunction with the total number of fruit sets. Since the fruit is packed in boxes based on size grades for shipment, packers also require advanced information about the fruit size to efficiently manage packaging and logistics.
Efforts to estimate the number of fruits and yield, particularly fruit weight, have been a persistent focus of research for several decades [1,2,3,4]. However, there are not so many studies focused on estimating fruit size. That is because fruit trees often bear several hundred or more fruits per tree, and large-scale sampling and detailed measurements are difficult in actual orchards. Recently, various methods utilizing machine vision have been developed for estimating individual fruit size in apples [5,6], mangoes [7], vegetables [8], and so on. However, even with these methods, estimating all fruit sizes remains a challenge, underscoring the necessity for effective sampling strategies. Apolo-Apolo et al. [9] demonstrated methods using UAV images to assess the size of citrus fruits. The report is a valuable study because of comprehensive fruit size estimations by machine vision. However, their study revealed discrepancies between estimated and actual values in the distribution of fruit size. This disparity was attributed to their inability to estimate fruits concealed by leaves and branches, restricting their assessment to a partial surface area of the canopy. As a study of size estimation without using machine vision in citrus, there have been reports of a model to predict the ‘Washington Navel’ orange fruit diameter at harvest from five to six months before harvest using a cubic smoothing spline analysis [10]. However, growth parameters must be investigated before conducting surveys. Implementing this approach is difficult for small-scale farmers where limited labor resources are available for precise measurement of fruit growth parameters. This model is also used for estimating individual fruit and is not a method for estimating fruit size per tree or orchard. In apple and kiwifruit, studies have been published on weight distributions applicable to size prediction [11,12]. However, some citrus fruit shipments are based on the fruit diameter. As an example of a sampling strategy, there is a sampling protocol, which was developed for use in size estimation models [13,14,15], and multilevel systematic sampling, which was used to estimate fruit numbers for entire orchards of apple, grape, and kiwifruit [16]. However, considering the recent advancements in machine vision technology, developing sampling strategies adapted for its application and creating comprehensive methods for estimating fruit sizes have become increasingly paramount. It is worthwhile to consider an alternative approach to estimating the fruit size of citrus, assuming the use of machine vision.
Therefore, emphasis was placed on estimating the proportions of fruit size grades. Obtaining information on the proportion of fruit size grades from a tree is more important than accurately estimating the size of individual fruits for efficient data acquisition in a limited resource. In this study, as an initial step towards establishing a method for pre-harvest prediction from small samples, a method was developed to estimate the proportion of fruit size grades using the mean fruit diameter of trees measured immediately after harvest. The accuracy and versatility of the estimation models developed by this method were assessed in eight orchards over three years.
2. Materials and Methods
2.1. Material, Experimental Site, and Methods of Constructing Datasets
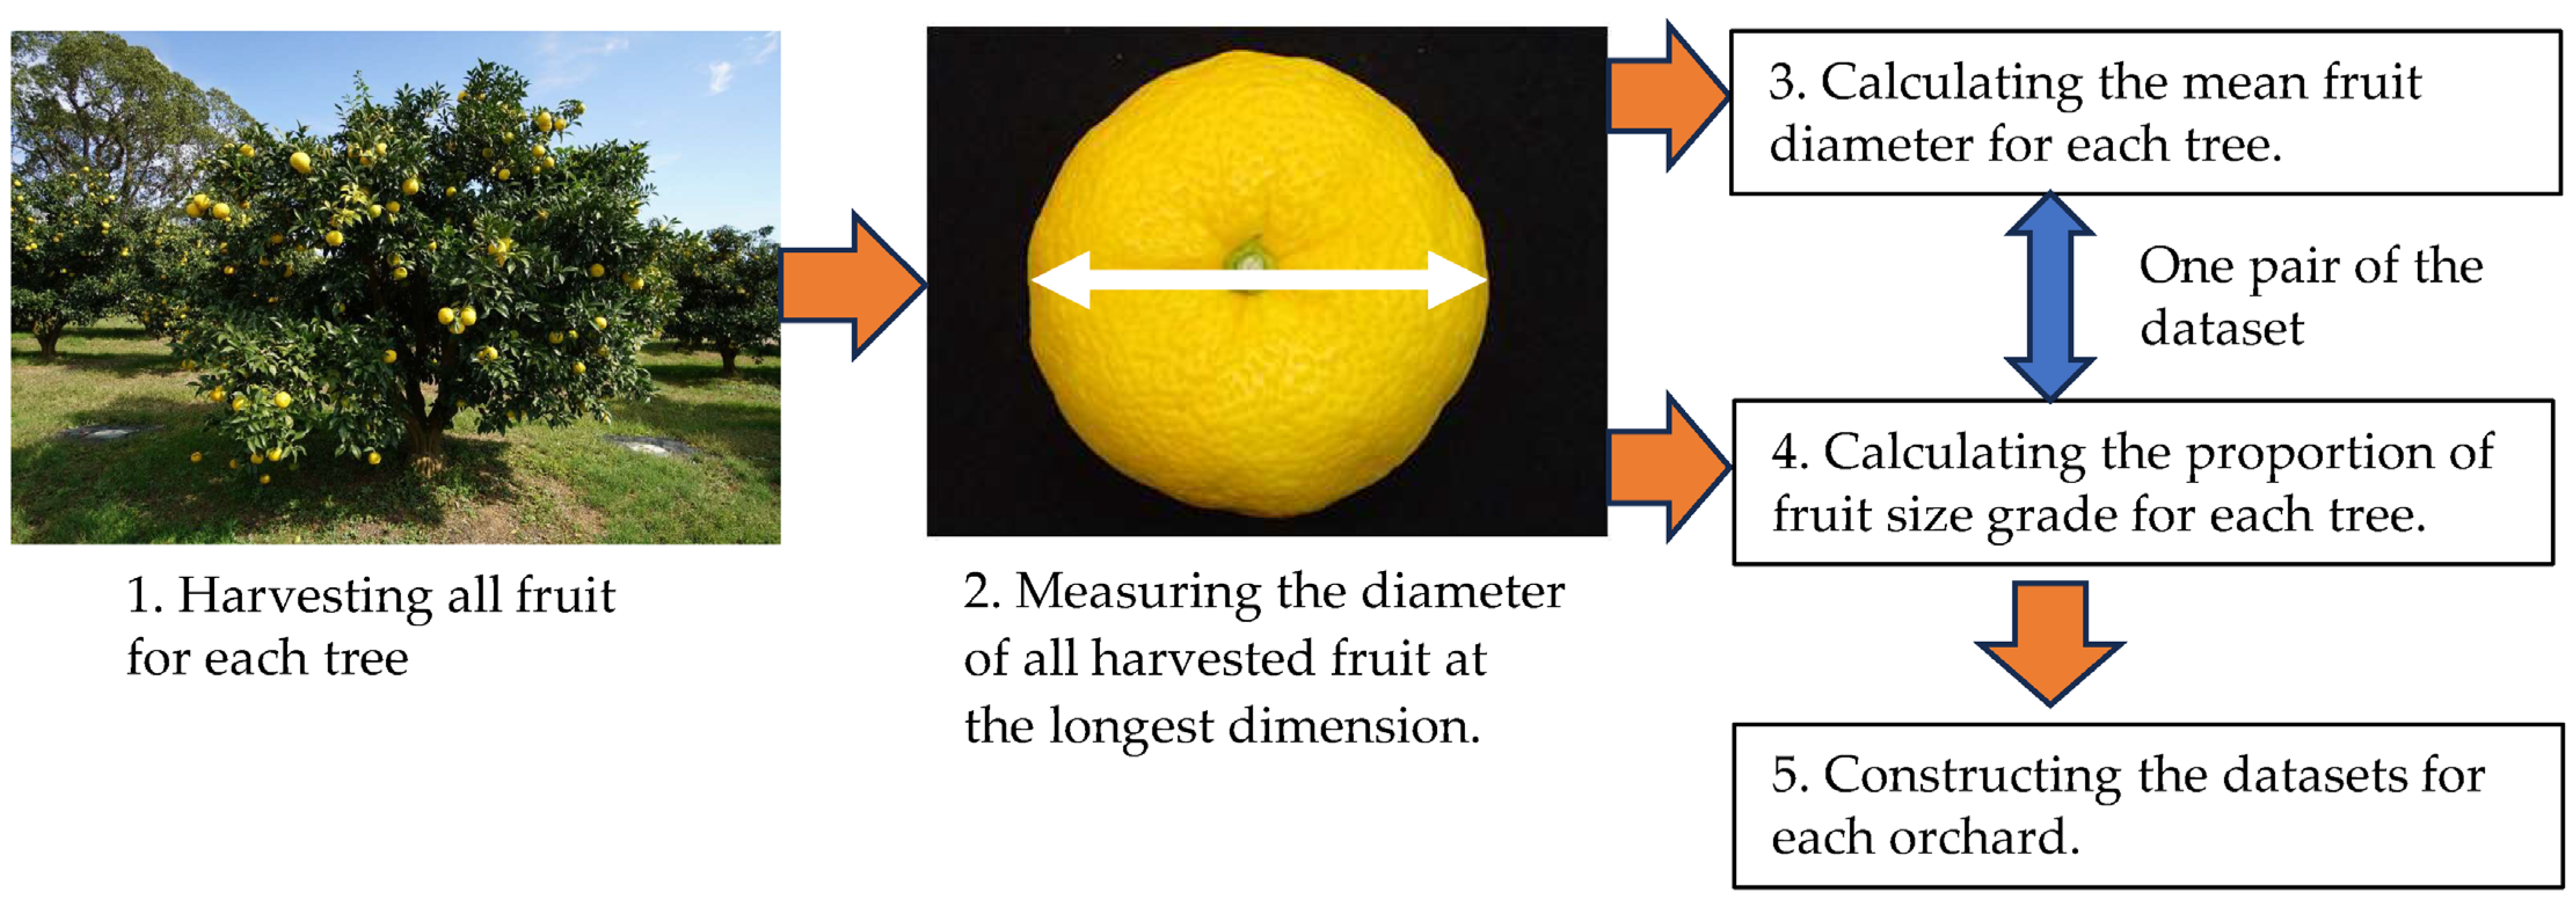
The present study was conducted using a kind of citrus (Citrus junos Sieb. ex Tanaka, also known as yuzu) on trifoliate orange rootstocks in three orchards (Orchards 1–3) at the Kochi Agricultural Research Center Fruit Tree Experiment Station in Kochi City and five farmer’s orchards (Orchards 4–8) in Kami City, Japan (Figure 1). Citrus junos is the commonly cultivated citrus cultivar in East Asia [17,18,19]. The fruit has an attractive fragrance and strong acidity. In Japan, the juice has traditionally been used as a substitute for vinegar and seasonings instead of eating fresh fruit. Kami City is one of the significant Citrus junos cultivation areas in Japan. Table 1 presents the overview of the experimental orchards, and Figure 2 shows the location of the experimental orchards. In Orchards 1–3, all trees of each orchard were investigated to construct and validate models. In Orchards 4–8, ten trees were randomly selected and investigated, excluding weakened trees due to disease based on the result of Section 3.3. Fruit thinning was not performed in all orchards. All fruit was harvested per tree in November, and the diameter of each fruit was measured at the longest dimension using a digital caliper. The mean fruit diameter and the proportion of fruit size grade were calculated for each tree, and datasets paired between these values for each tree were constructed in each orchard (Figure 3). Fruit size grade is a standard defined by Japan Agricultural Co-operatives (JA Kochi, Kochi City, Japan) (Table 2). Orchards 1–3 were used to construct and validate models, and Orchards 4–8 were used to validate models.
2.2. Construction of Models
Based on the datasets of Orchard 1 in 2020, curvilinear regressions were conducted to construct models for estimating the proportion of fruit size grades at harvest. Although the difference in diameter interval between each grade (S, L, 2L, and 3L) was 10.0–11.0 mm, the interval between the M size grade was approximately half (5.0 mm) compared to that of other grades. Therefore, four models were constructed to correspond to the differences in the diameter intervals between M size and other fruit size grades. The following adjustments were made to construct each model.
To construct models to estimate the proportions of the S, L, 2L, and 3L grades, adjustments were made to align the proportions of each fruit size grade around a mean fruit diameter of 80.0 mm. If the number of datasets (number of trees) had been larger, the models could have been constructed by regression analysis for each size grade, but due to the limited number of datasets, the model was adjusted to a specific grade. The model was adjusted to 2L size grade in this study and constructed. These adjustments involved adding or subtracting the difference between the median of the 2L size grade interval (80.0 mm) and the median of each grade interval from the respective mean fruit diameter. The proportion of each size grade was considered the proportion of the 2L size grade. Separate curvilinear regressions were conducted for the datasets below and above 80.0 mm, with the mean fruit diameter as an independent variable and the proportion of 2L size grade as a dependent variable. The analysis excluded 0% of the data and apparent outliers.
To construct models to estimate the proportions of M size grades, adjustments were made to align the proportions of each fruit size grade around a mean fruit diameter of 62.5 mm. These adjustments involved adding or subtracting the difference between the median of the M size grade interval (62.5 mm) and the median of each grade interval divided into two parts from the respective mean fruit diameters. The proportion of each size grade was considered the proportion of the M size grade. Separate curvilinear regressions were conducted for the datasets below and above 62.5 mm, with the mean fruit diameters as an independent variable and the proportions of M size grade as a dependent variable. The analysis excluded 0% of the data and apparent outliers.
2.3. Evaluation of Models
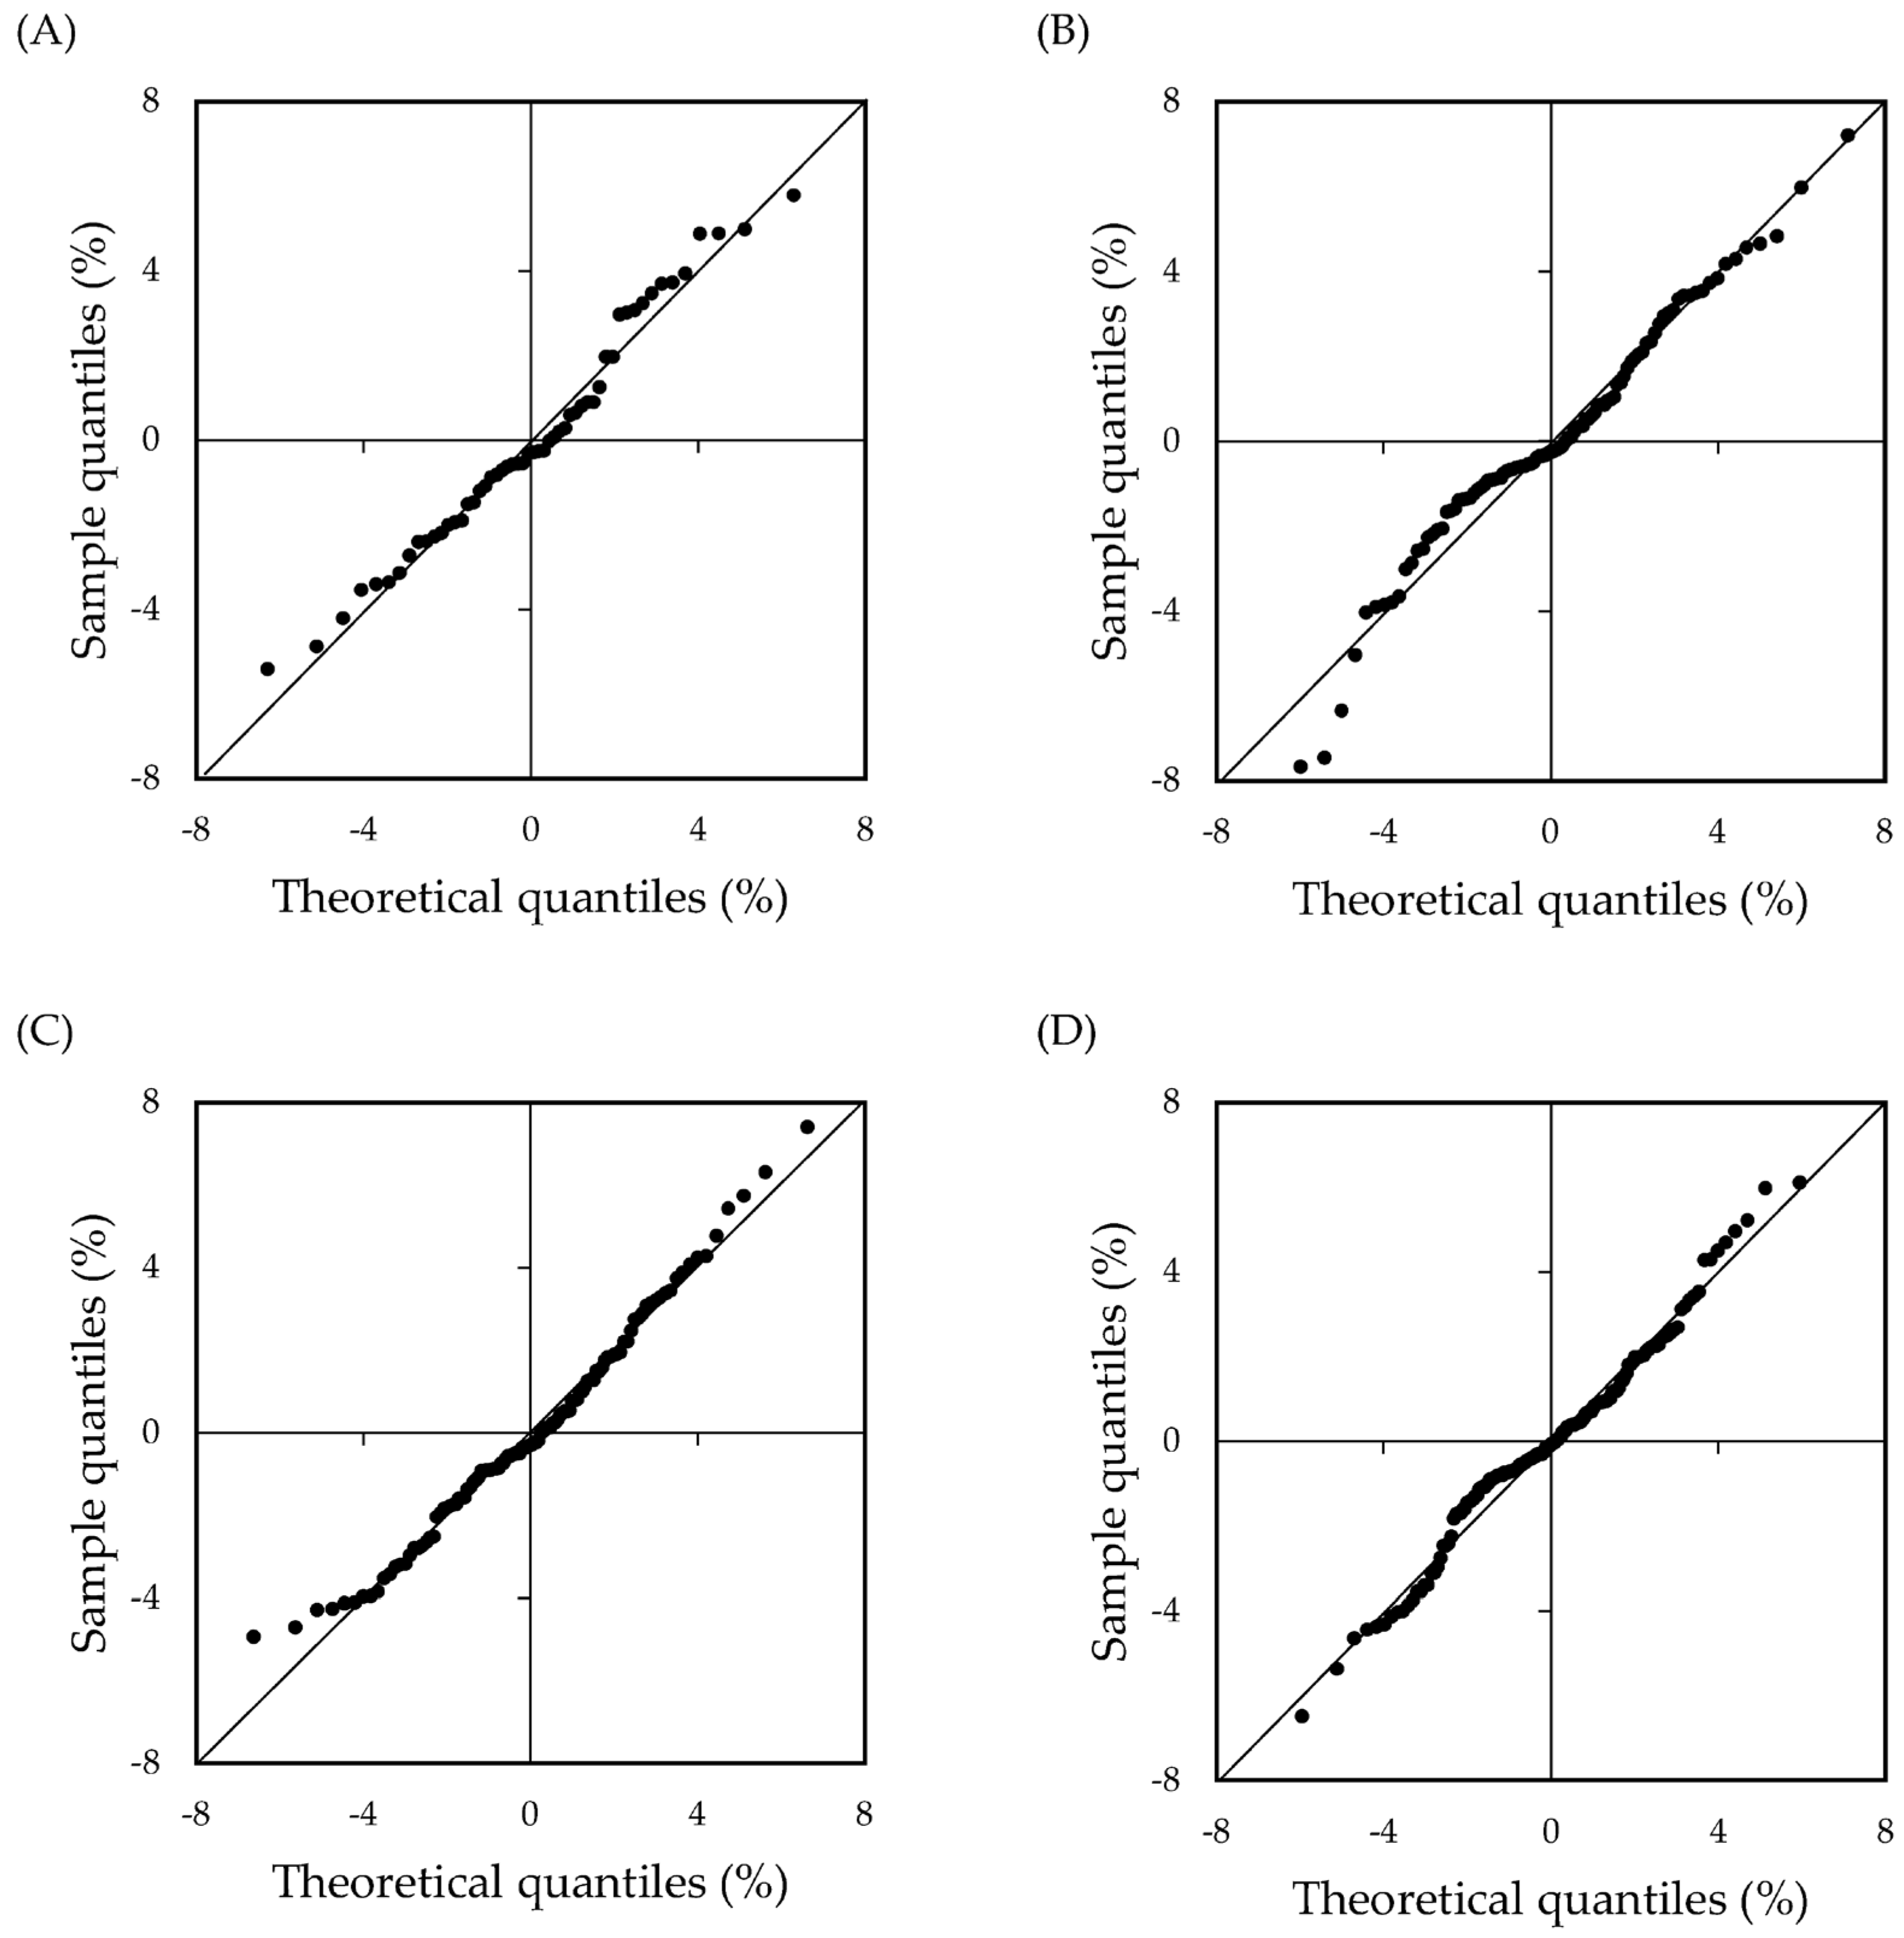
The evaluation of the constructed estimation models (Table 3) was conducted by adjusted R-squared (R2) and Akaike’s information criterion (AIC). R2 is an index used to evaluate the goodness of fit of a model, and AIC is used to compare the predictive performances of different models. In this study, both R2 and AIC were used to determine the best model. Additionally, F-tests and Shapiro–Wilk tests were conducted to verify the normality of the models. Q-Q and residual plots were created to verify the assumptions of the regression models. All statistical analyses were performed using BellCurve for Excel, version 4.05 (Social Survey Research Information Co., Ltd., Tokyo, Japan).
2.4. Validation of Models
The validation was performed using the four datasets obtained from Orchards 1–3 to assess the generalization capability of the constructed estimation models in Section 2.2. Four datasets were used to construct 14 models by selecting one, two, and three datasets separately. The construction methods of the estimation models were the same as in Section 2.2. Twenty-eight validations were conducted using the remaining datasets. The estimation model’s accuracy (EMA) and Pearson’s chi-square test were used to assess each orchard. The EMA was calculated using the following equation:
where N_act and N_est represent the actual and estimated proportions of each grade, respectively.
EMA = Σ | N_act − N_est |
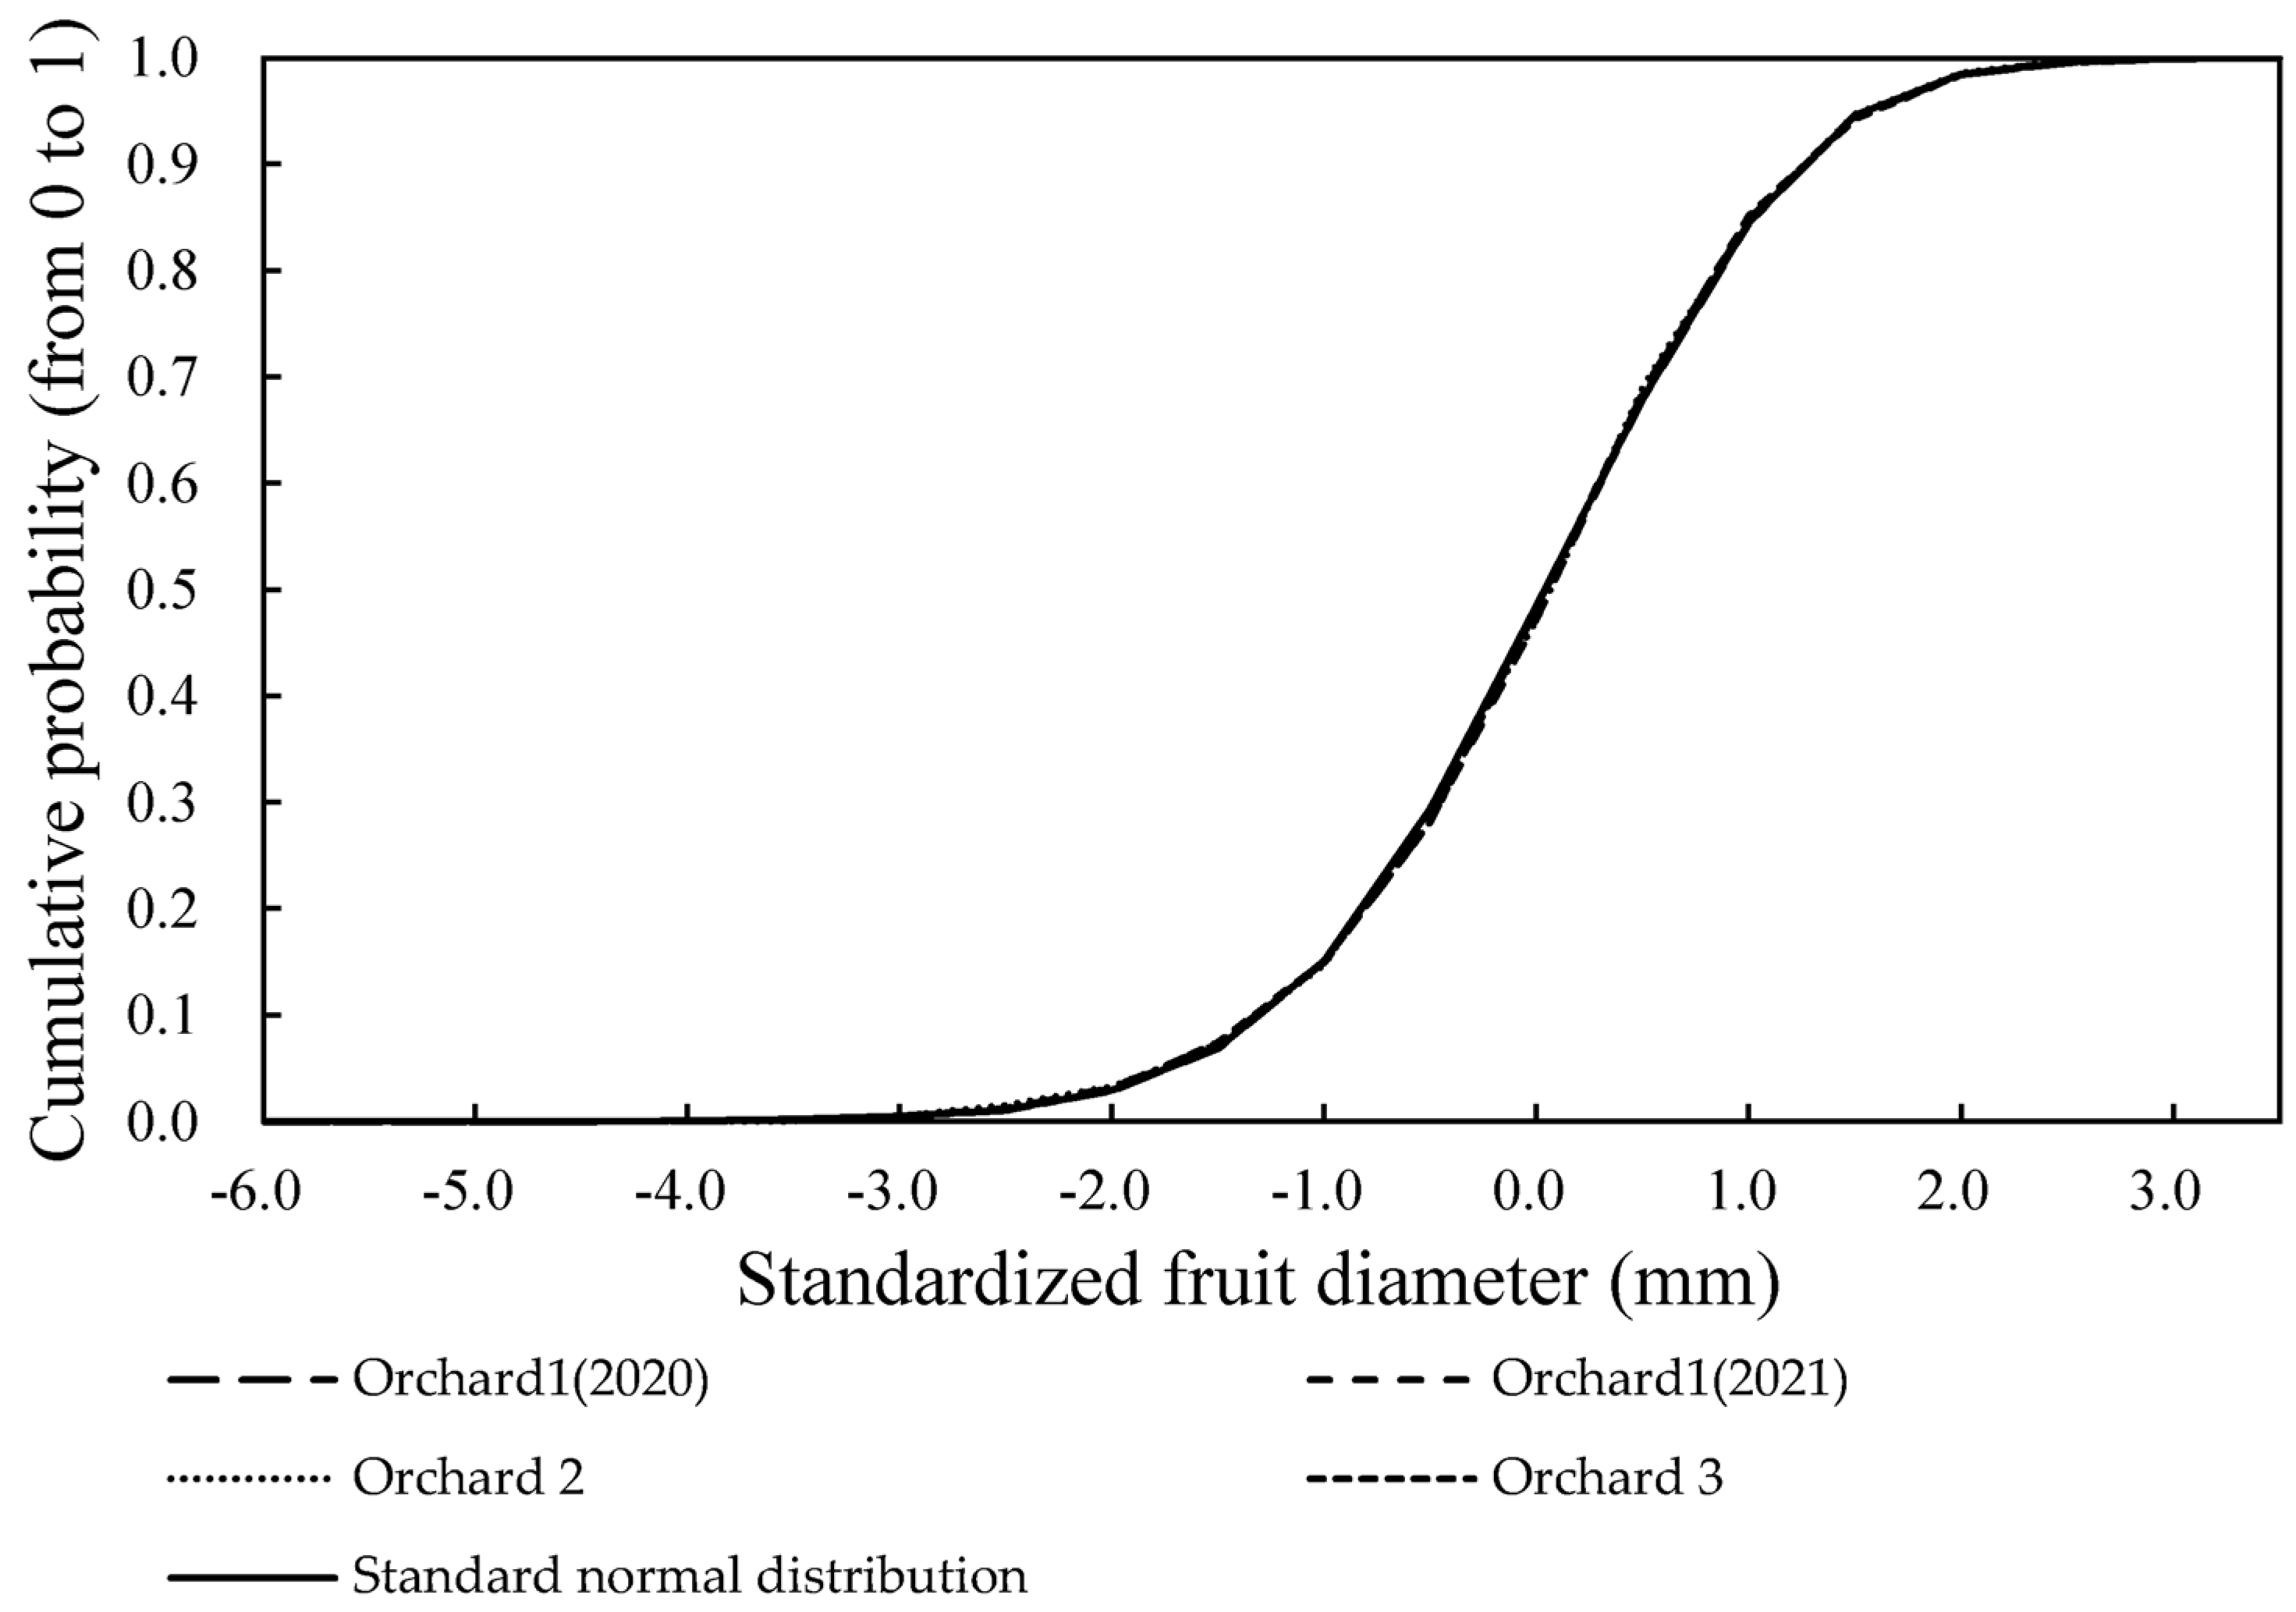
It is difficult to simultaneously evaluate the accuracy of the five fruit size grades. Particularly, differences between higher proportions of grades (M, L, and 2L grades) and lower proportions of grades (S and 3L grades) are significant. Mean absolute error is the mean of the absolute difference between the actual and estimated values; however, it was considered difficult to check the influence of size grades with large errors if the values were mean in this study. Therefore, the EMA, which is the sum of the absolute difference between the actual and estimated values, was adopted. Moreover, in order to compare the variation in fruit diameter between each orchard, each orchard’s empirical cumulative distribution function was generated and compared with the datasets of Orchard 1 in 2020 and with the standardized normal distribution.
2.5. Validation of the Number of Trees
The accuracy of the constructed estimation models in Section 2.2. was validated with different numbers of trees using three datasets obtained from Orchards 1, 2, and 3 in 2021, 2021, and 2022, respectively. Five and ten trees per orchard were selected randomly, and the process was repeated 100 times. Firstly, the mean fruit diameter of the individual trees was fed into the constructed estimation models (Table 3), and each estimated proportion was calculated. The estimated proportions were multiplied by the number of fruits harvested from the individual trees to calculate the estimated number of fruits for each grade. The estimated proportions for each orchard were recalculated by summing the estimated numbers of fruits from the selected trees. The actual proportions were recalculated using the same method. Finally, the EMA was used to assess each orchard.
2.6. Validation of Models in Farmer’s Orchards
The accuracy of the constructed estimation models in Section 2.2. was validated using five datasets obtained from Orchards 4–8 of five farmers in 2023, respectively. The estimated and actual proportions for each orchard were calculated using the same method in Section 2.5. The EMA and Pearson’s chi-square test were used to assess each orchard.
3. Results
3.1. Construction and Evaluation of Models
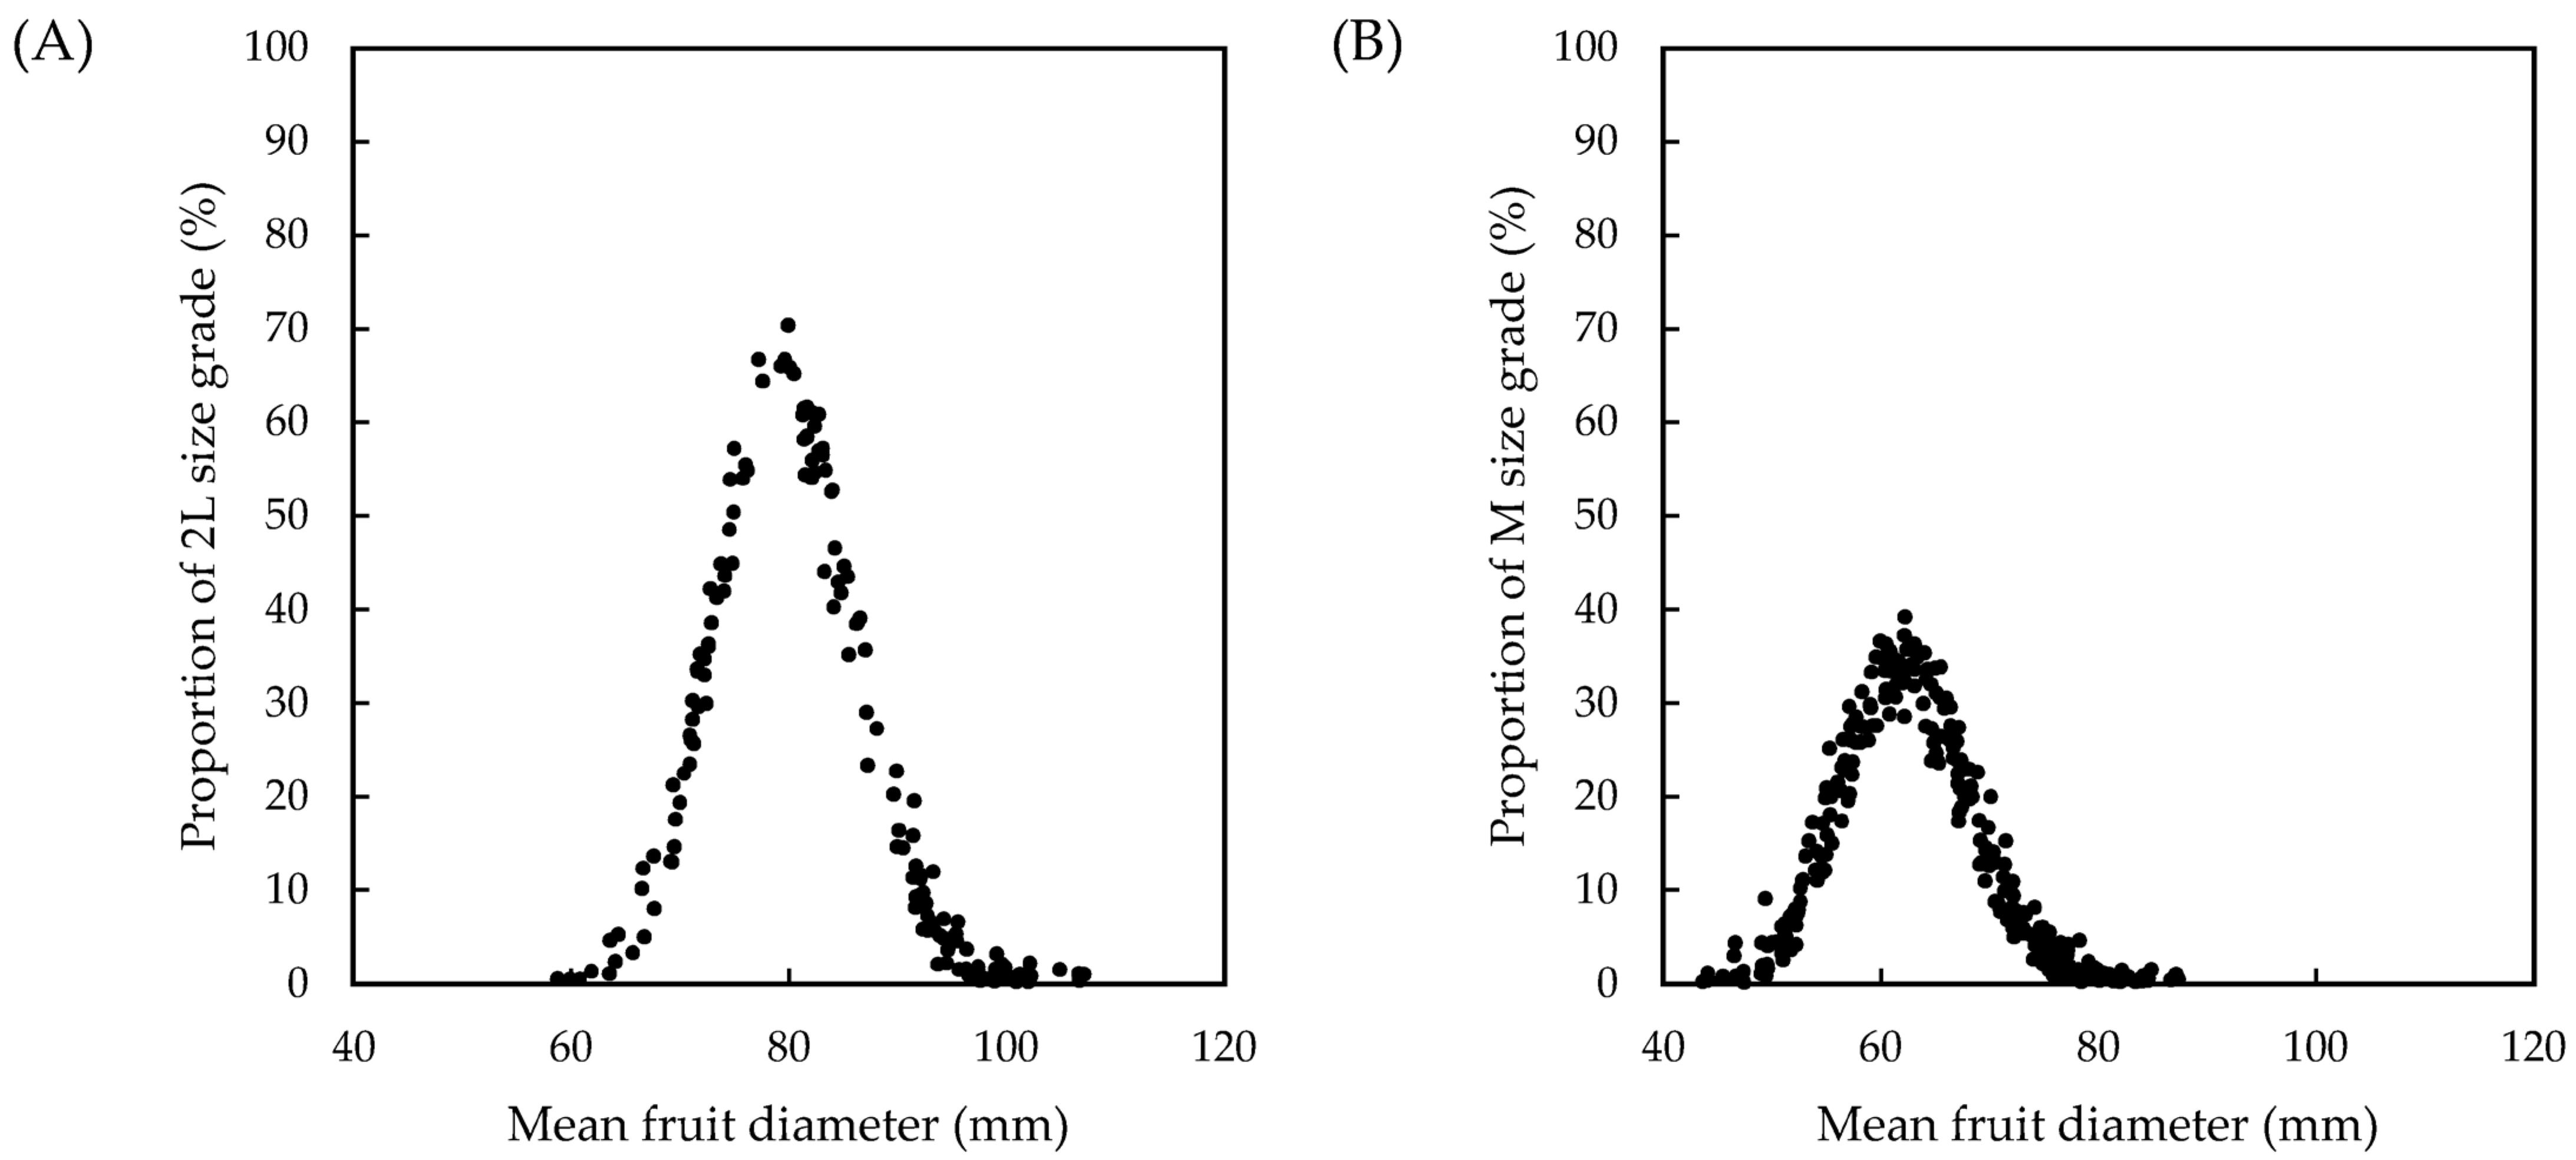
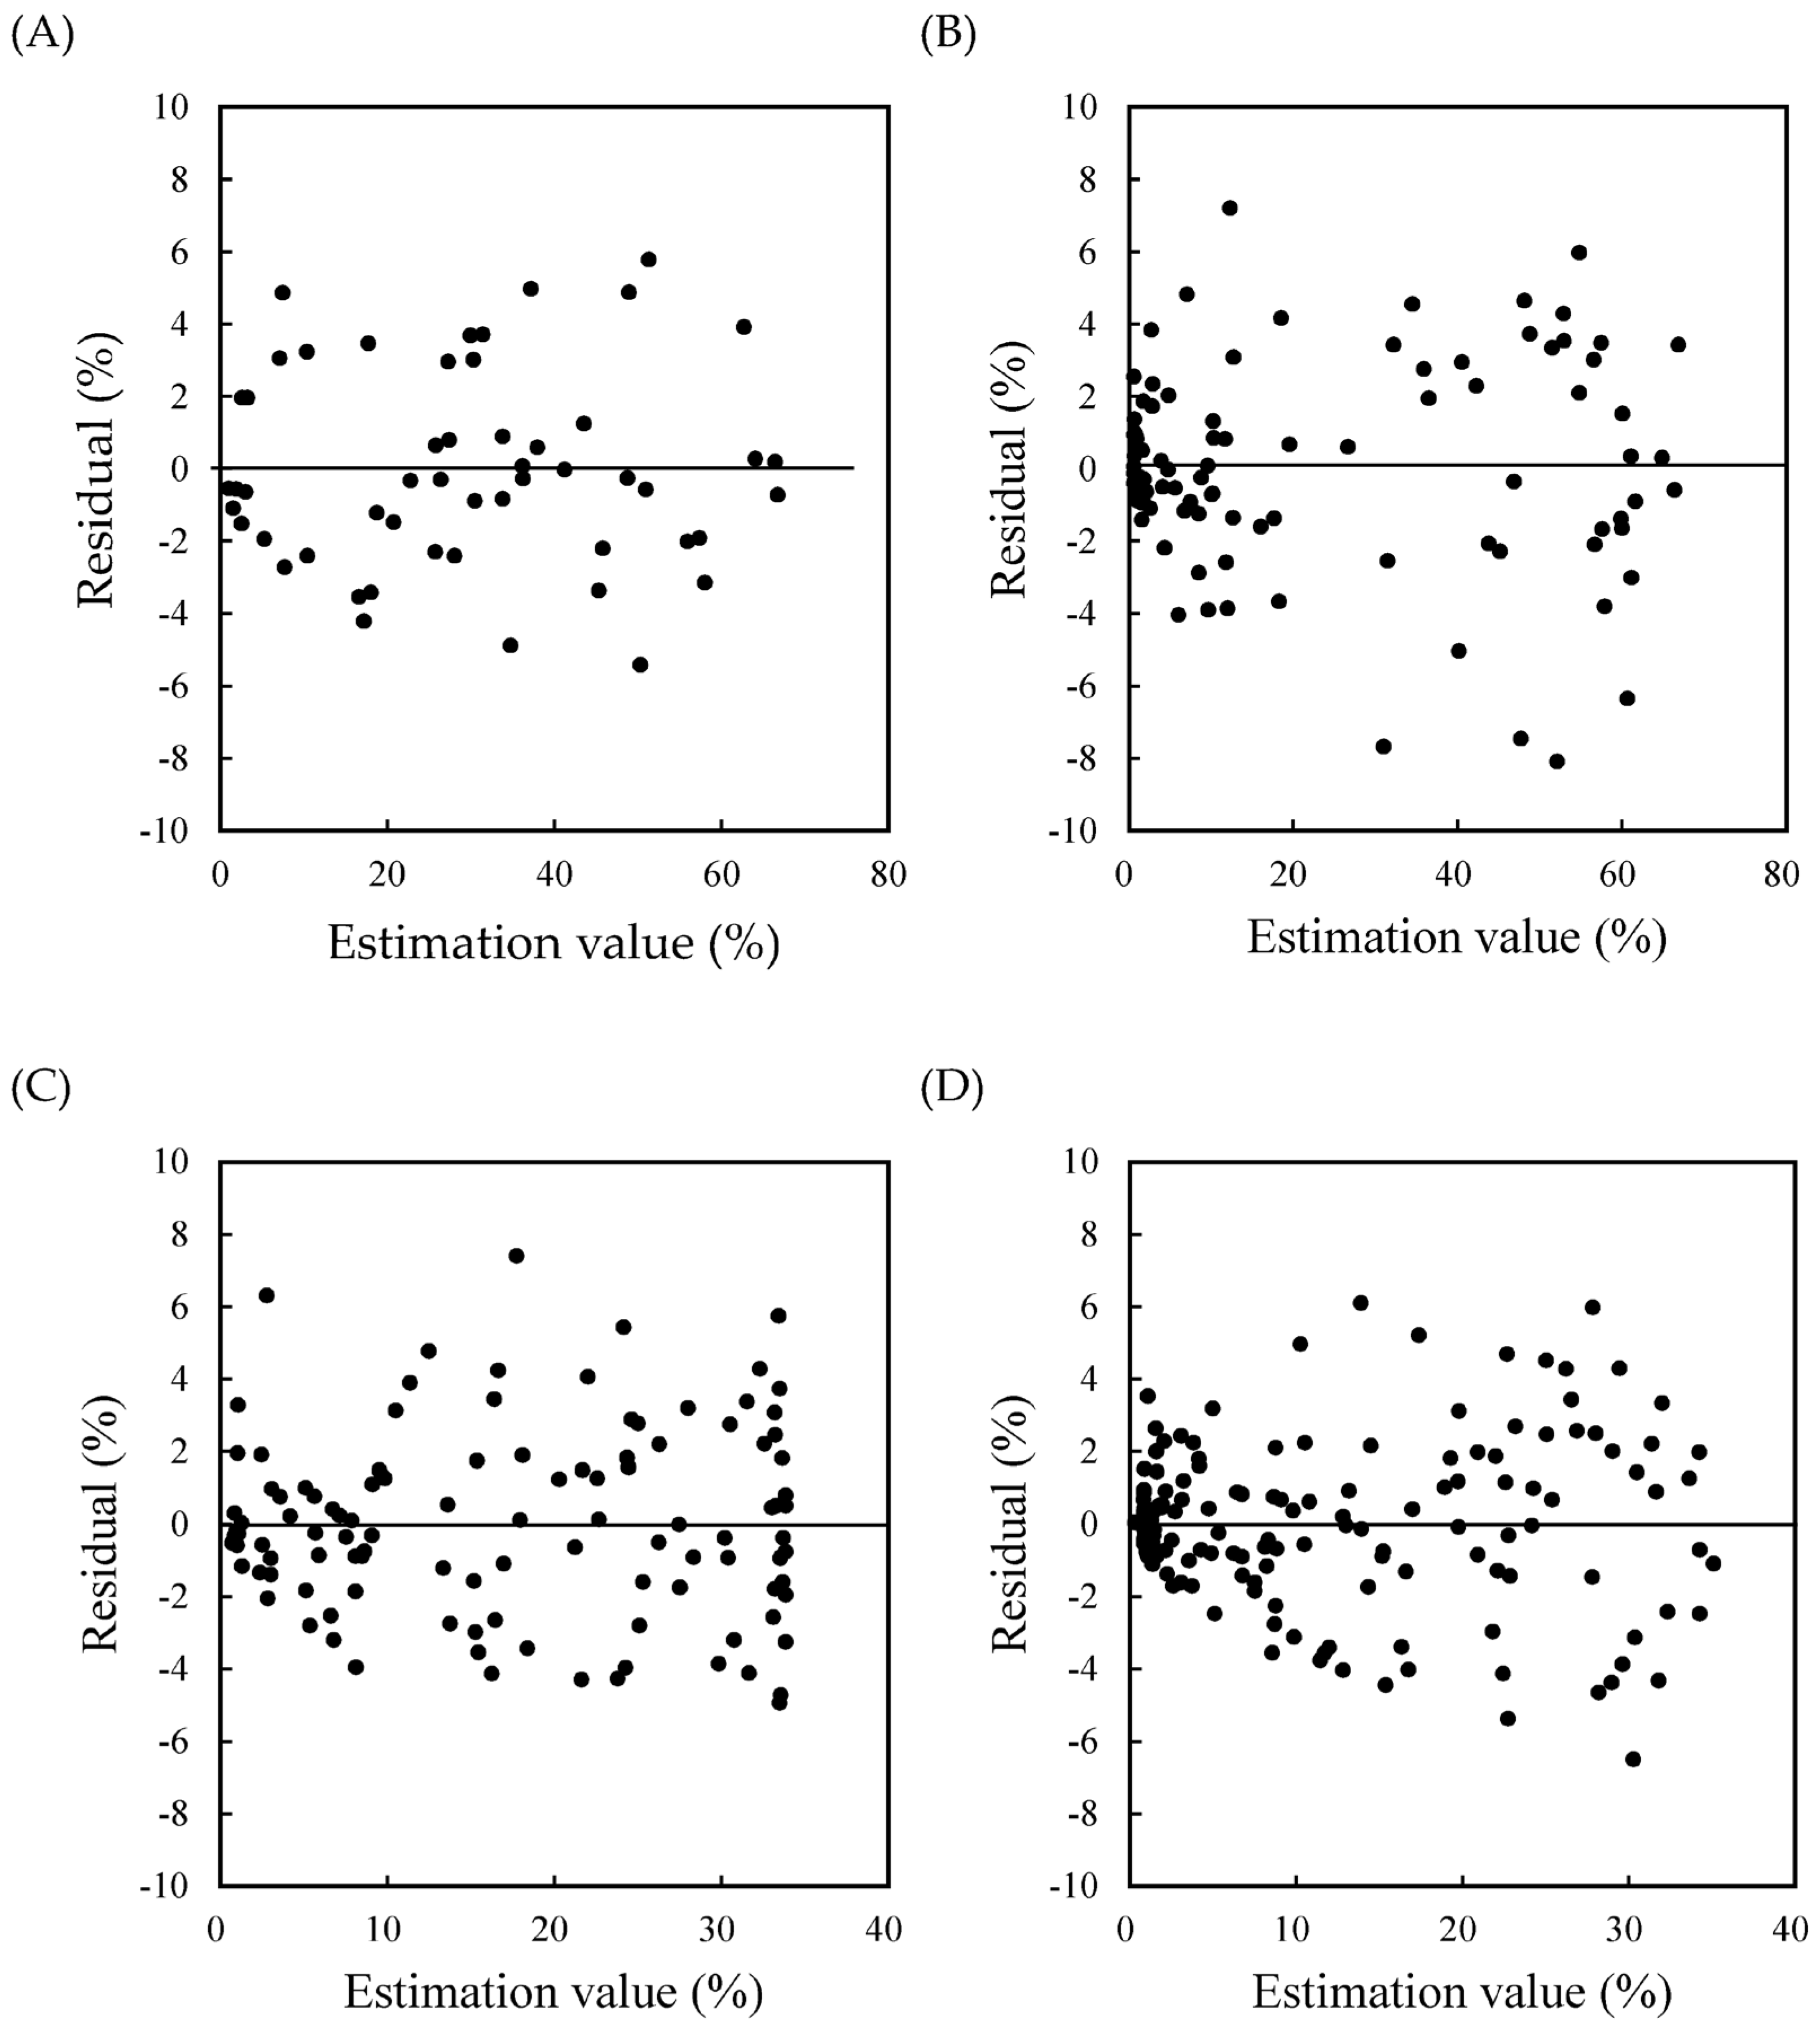
The relationship between the mean fruit diameter and the proportion of the 2L size grade exhibited an asymmetric peak distribution around a fruit diameter of 80.0 mm (Figure 4A). The proportion of the 2L size grade at the peak was approximately 70%. When curvilinear regression was performed on the data below and above 80.0 mm, the quartic and quintic function equations yielded the highest adjusted R-square (R2) values (below: R2 = 0.98, above: R2 = 0.99) and the quartic function equations had the lowest Akaike’s information criterion (AIC) values (below: AIC = 270.36, above: AIC = 502.38) (Table 4). An F-test was performed on the quartic function equations, and both equations were significant at the 5% level (Table 4). Normality was also checked using the Shapiro–Wilk test and a normal Q-Q plot. The equation above 80.0 mm was insignificant at the 5% significance level (Table 4). However, the normal Q-Q plots showed no significant distribution tendencies (Figure 5A,B). Residual plots based on prediction and residuals also showed no consistent trends (Figure 6A,B).
Similarly, the relationship between mean fruit diameter and the proportion of M size grade exhibited an asymmetric peak distribution around a fruit diameter of 62.5 mm (Figure 4B). The proportion of M size grade at the peak was approximately 40%. When curvilinear regression was performed on the data below and above 62.5 mm, quartic and quintic function equations had the highest R2 values (below: R2 = 0.96, above: R2 = 0.96), and quartic function equations below 62.5 mm and quintic function equations above 62.5 mm had the lowest AIC values (below: AIC = 546.23, above: AIC = 732.99) (Table 4). However, the difference in the AIC between the quartic and quintic function equations was smaller than that between the cubic and quartic function equations. An F-test was performed on the quartic function equations, and both equations were significant at the 5% level (Table 4). Normality was also checked using the Shapiro–Wilk test and a normal Q-Q plot. The equation above 62.5 mm was insignificant at the 5% significance level (Table 4). However, the normal Q-Q plots showed no significant distribution tendencies (Figure 5C,D). Residual plots based on prediction and residuals also showed no consistent trends (Figure 6C,D).
3.2. Validation of Models
To assess the model’s applicability in different orchards, it was tested on four datasets obtained from varying years (Orchard 1, 2020 and 2021) and different orchards (Orchards 2 and 3). The EMAs from those 14 models applied to 28 validation datasets varied between 2.0% to 6.1%. However, Orchard 2 and Orchard 3 showed more discrepancies in EMA values, with maximums and minimums of 4.0% and 6.1% and 2.2% and 5.5%, respectively, compared to the two datasets from Orchard 1. In all validations, the proportions of fruit size grade were insignificant at a 5% level by Pearson’s chi-square test (Table 5). Additionally, the empirical cumulative distribution function resembled a standard normal distribution across all the orchards (Figure 7).
3.3. Validation of the Number of Trees
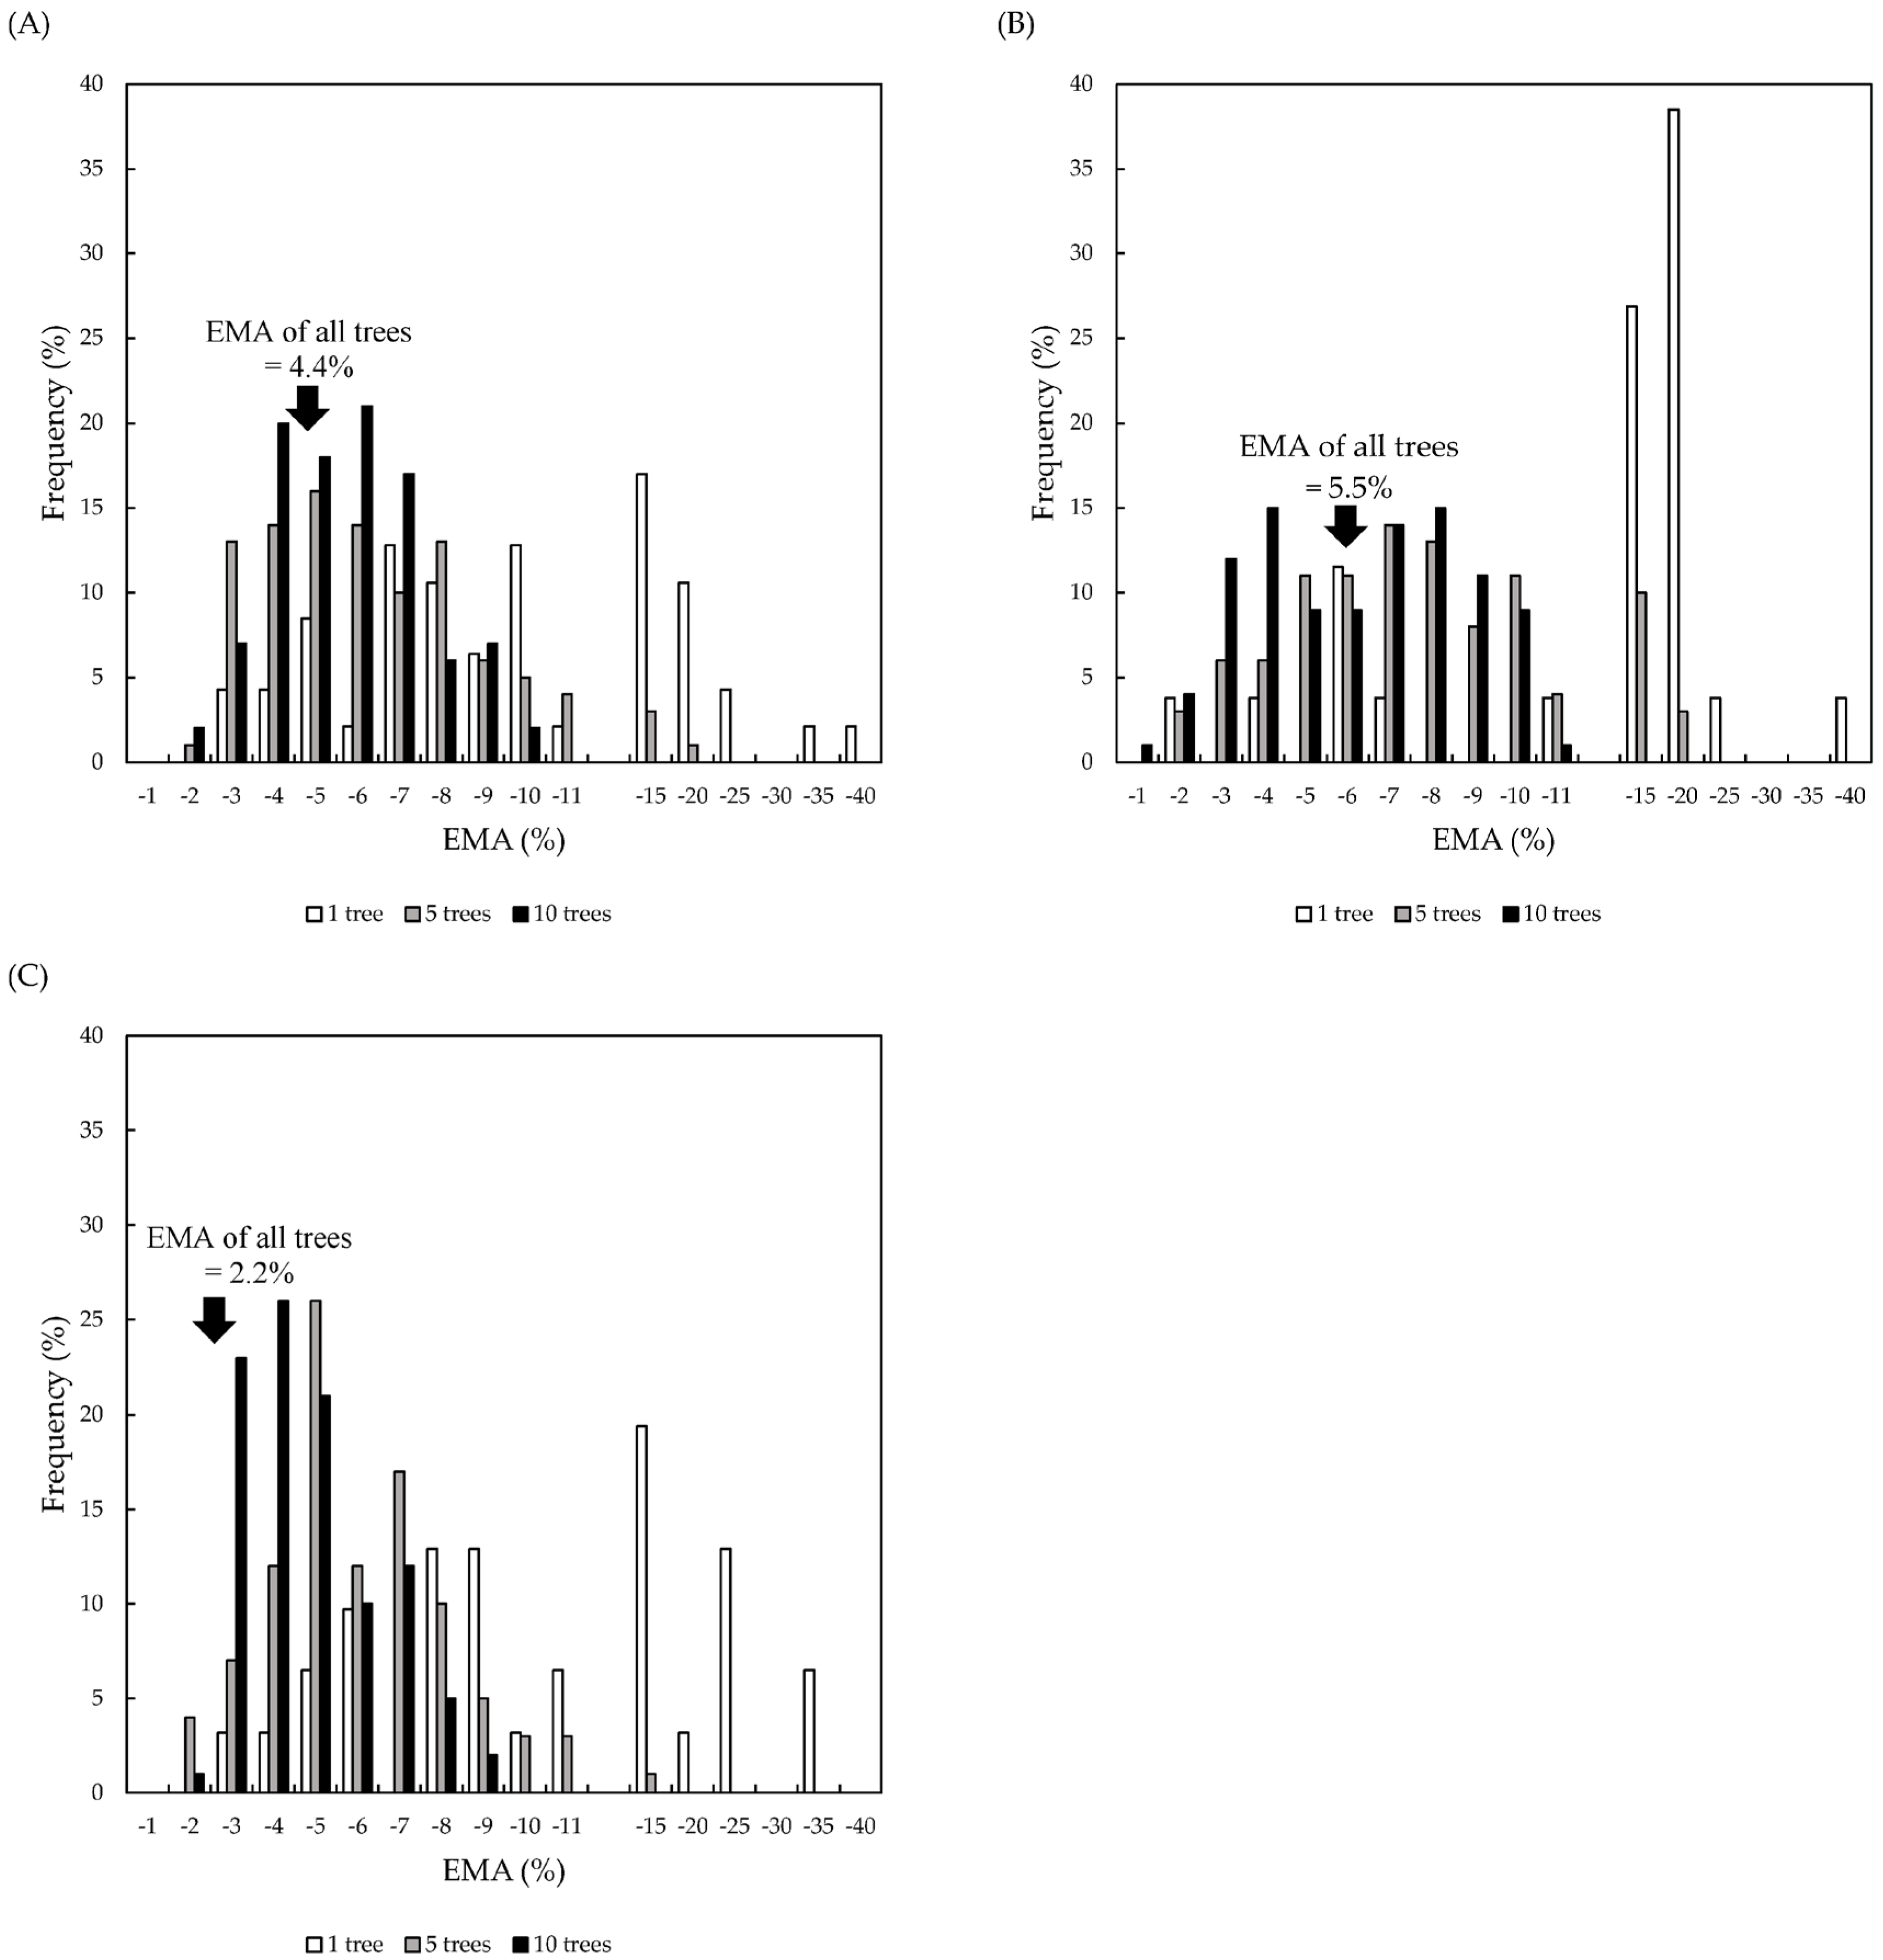
The EMA calculated over all trees in each orchard (47, 26, and 31 trees in Orchards 1, 2, and 3, respectively) were 4.4%, 5.5%, and 2.2% in Orchards 1, 2, and 3, respectively, which were all within EMA ≤ 10.0%. When the EMA was calculated using a tree, it was within EMA ≤ 10.0% for 61.7%, 23.1%, and 51.7% of the trees in Orchards 1, 2, and 3, respectively. When calculated for the five trees, the percentages within EMA ≤ 10.0% increased to 92.0%, 83.0%, and 96.0% in Orchards 1, 2, and 3, respectively. When calculated over 10 trees, most combinations were within EMA ≤ 10.0%, that is, 100%, 96.0%, and 100% in Orchards 1, 2, and 3, respectively (Figure 8).
3.4. Validation of Models in Farmer’s Orchards
The EMA calculated in Orchards 4 and 6 were lower at 4.5% and 7.5%. By contrast, the EMA calculated in Orchards 5, 7, and 8 were higher at 11.3%, 11.3%, and 12.5%, respectively. All orchards were insignificant at a 5% level by Pearson’s chi-square test (Table 6). In Orchards 5 and 8, actual values of L size grade were more than 60.0%, and the differences between the estimated and actual values were higher than in other orchards (Table 7, Table 8, Table 9, Table 10 and Table 11).
4. Discussion
In this study, emphasis was placed on estimating the proportion of fruit size grades. Previous studies have often focused on individual fruit measurements via machine vision or direct methods [15,20,21]. For example, in the study of ‘Washington Navel’ oranges [10], an individual fruit size prediction model was developed using cubic smoothing splines based on data measuring fruit diameter at fortnightly intervals until harvest, and the final proportion of fruit size grades was also estimated using the model. However, these estimates relied on the distribution derived from the size grading of 50 fruits per tree across 10 trees. This method requires an amount of measurement effort. In this study, our approach aimed at utilizing a single descriptive statistic, mean fruit diameter, which is relatively easy to measure. This choice was made due to its potential applicability even for small-scale farmers without requiring substantial cost measurement.
The method involved constructing models for estimating the proportion of fruit size grades using polynomial regression. To validate the reliability of the models, a series of assumptions were considered, including the requirements for linear regression analysis using the least squares method. The assumptions for linear regression analysis using the least squares method require that (a) independence, (b) normality, (c) homoscedasticity, and (d) linearity be satisfied [22]. Of these, (a), (b), and (c) are related to the residuals. According to Aishah Ahad et al. [23] and Ghasemi and Zahediasl [24], the Shapiro–Wilk test [25] is a good test for verifying normality. The results of Table 4 indicate that the two equations were rejected at the 5% significance level. However, none of the normal Q-Q plots showed significant distribution tendencies (Figure 5). Therefore, assumption (b) was satisfied. All residual plots supported the assumptions (a) of independence and (c) of homoscedasticity, indicating that the distributions did not exhibit a constant trend (Figure 6). Therefore, it was determined that four quartic equations with the highest R2 and lowest AIC and that satisfied the assumptions of the regression analysis were chosen as the estimation models.
It should be noted with caution that the models did not account for variations in fruit diameter within individual trees because the proposed models aimed at the prediction in each orchard. Moreover, good estimation models need to be constructed with datasets obtained from multiple places in multiple years, whereas the estimation models were constructed with datasets obtained from one orchard in one year (Orchard 1, 2020). Zhang et al. [11] highlighted that variations in apple fruit weight not only impact the estimates of mean fruit weight but also the estimations of the number of fruits in each size grade. Also, Marini et al. [14] discussed that understanding the within-tree variation of fruit is vital to estimating the fruit size or fruit size distribution for a tree. Considering the strong biennial-bearing character of citrus cultivars and its potential impact on fruit size variations, further analysis was required to ensure the models’ predictability under fluctuating fruit-set conditions. The results showed no remarkable difference in estimation accuracy between constructing the estimation models on datasets with various numbers of fruit sets (Table 5). Additionally, the empirical cumulative distribution function resembled a standard normal distribution across all the orchards (Figure 7). According to a study by Judd and McAneney [26], water stress was found to affect the mean fruit weight (μ) of kiwifruits but not the distribution’s shape. This suggests that the estimation models are applicable to orchards with different fruit sets. Therefore, it was decided to use the estimation model constructed on the dataset of Orchard 1 in 2020 for later validation.
Regarding the validation of the number of trees, the result suggested increased stability in estimating the proportion of fruit size grades as the number of sampled trees increased (Figure 8). Studies focusing on Navel oranges [10] and apples [15] also reported achieving high accuracy by aggregating data from more than 10 trees. This gradual convergence of estimations toward a consistent value with larger tree samples reaffirms the importance of sufficient sampling for robust and stable estimations at the orchard level. On the other hand, the selection of five or ten trees in this study was based on simple random sampling. As a method for selecting trees that are representative of the orchard, it may be possible to apply multilevel systematic sampling [16] and ranked set sampling [27], which estimates the total number of fruits and fruit load, for example, or random median sampling, which precisely estimates the population [28]. In particular, multilevel systematic sampling enables accurate estimation of a number of fruits quickly. It is necessary to construct the sampling methods necessary for estimating the proportion of fruit size grade at an orchard level with reference to these sampling methods.
During the validation of models in the farmer’s orchard, distinct trends were observed across various orchards (Table 6). Observation of orchards showed that trees in Orchards 5 and 8 had fewer leaves than the other orchards, and the trees were well exposed to light in the canopy’s interior. Verreynne et al. [29]. reported larger fruit sizes on the top and outer area than the inside fruit fruits in three citrus cultivars, satsuma mandarin, clementine, and ‘Fairchild’ tangelo. Similarly, Suzuki et al. [30] noted inferior fruit sizes at the bottom of satsuma mandarin trees compared to those in the middle and at the top, linked to variations in micro-meteorological conditions such as light intensity and air temperature within the tree canopy. The results in Orchards 5 and 8 may be attributed to more uniform fruit size among the fruit trees by uniform light conditions and air temperature inside and outside the canopy. For a more accurate estimation of fruit size in such trees, accounting for variations resulting from canopy differences may be necessary. In contrast, the differences in S and M size grades in Orchard 7 were higher than in other orchards (Table 10). The fruit was smaller than the fruit in the other orchards, and there was more out-of-specification fruit than in other orchards. It was considered that the results were due to the weakening of the tree caused by wet damage. However, it is noteworthy that even in orchards such as Orchards 5, 7, and 8, the EMA was about 10%. It was suggested that the constructed estimation models may apply to various situations.
Overall, the proposed method is able to construct the prediction model of fruit yield per size grade in each orchard without additional measurement costs. The proposed construction method does not use the specific characteristics of Citrus junos, so it is applicable to other citrus orchards. For the future perspective, there is a need for refined methodologies that account for canopy variations and environmental stressors for more accurate estimations across diverse orchard conditions. Also, the method in this study will be more applicable when combined with accurate measuring techniques of the total number of fruits and true mean fruit diameter per tree.
5. Conclusions
In order to construct the prediction model of citrus fruit yield in each size, the method that uses the mean fruit diameter, which is applicable to small-scale farmers, was proposed. The technology for estimating the number of fruit sets from image data, such as that obtained from UAV or field rover, is progressively advancing, indicating promising prospects for its application [31,32]. However, to ascertain the true mean fruit diameter, further refinement of techniques for estimating individual fruit sizes and their associated sampling strategies is necessary. Furthermore, while this study focused on the data of Citrus junos, different citrus cultivars have distinct fruit size grading standards, making direct application of the developed model unfeasible. Nevertheless, considering that many citrus cultivars share certain standardized criteria, it is conceivable that model development tailored to specific citrus cultivars can be facilitated using the model construction method employed in this research.
Author Contributions
Conceptualization, Y.T. and S.Y.; methodology, Y.T.; validation, Y.T.; formal analysis, Y.T.; investigation, Y.T.; resources, Y.T.; data curation, Y.T.; writing—original draft preparation, Y.T.; writing—review and editing, Y.T. and S.Y.; visualization, Y.T.; supervision, S.Y.; project administration, S.Y.; funding acquisition, Y.T. All authors have read and agreed to the published version of the manuscript.
Funding
This study was supported by Cabinet Office grant in aid, the Advanced Next-Generation Greenhouse Horticulture by IoP (Internet of Plants), Japan.
Data Availability Statement
The original contributions presented in the study are included in the article, further inquiries can be directed to the corresponding author.
Acknowledgments
We acknowledge the valuable contributions of the staff at the Kochi Agricultural Research Center Fruit Tree Experiment Station.
Conflicts of Interest
The funders had no role in the study design; collection, analyses, or interpretation of data; writing of the manuscript; or decision to publish the results.
References
- Stout, R.G. Estimating Citrus Production by Use of Frame Count Survey. J. Farm Econ. 1962, 44, 1037–1049. [Google Scholar] [CrossRef]
- United States Department of Agriculture. Evaluation of Procedures for Estimating Citrus Fruit Yield. Available online: https://www.nass.usda.gov/Education_and_Outreach/Reports,_Presentations_and_Conferences/Yield_Reports/Evaluation%20of%20Procedures%20for%20Estimating%20Citrus%20Fruit%20Yield.pdf (accessed on 5 January 2024).
- United States Department of Agriculture. Sampling for Objective Yields of Apples and Peaches. Available online: https://www.nass.usda.gov/Education_and_Outreach/Reports,_Presentations_and_Conferences/Yield_Reports/Sampling%20for%20Objective%20Yields%20of%20Apples%20and%20Oranges.pdf (accessed on 5 January 2024).
- Jessen, R.J. Determining the Fruit Count on a Tree by Randomized Branch Sampling. Biometrics 1955, 11, 99–109. [Google Scholar] [CrossRef]
- Gené-Mola, J.; Sanz-Cortiella, R.; Rosell-Polo, J.R.; Escolà, A.; Gregorio, E. In-field apple size estimation using photogrammetry-derived 3D point clouds: Comparison of 4 different methods considering fruit occlusions. Comput. Electron. Agric. 2021, 188, 106343. [Google Scholar] [CrossRef]
- Lu, S.; Chen, W.; Zhang, X.; Karkee, M. Canopy-attention-YOLOv4-based immature/mature apple fruit detection on dense-foliage tree architectures for early crop load estimation. Comput. Electron. Agric. 2022, 193, 106696. [Google Scholar] [CrossRef]
- Neupane, C.; Koirala, A.; Walsh, K.B. In-orchard sizing of mango fruit: 1. Comparison of machine vision based methods for on-the-go estimation. Horticulturae 2022, 8, 1223. [Google Scholar] [CrossRef]
- Zheng, B.; Sun, G.; Meng, Z.; Nan, R. Vegetable size measurement based on stereo camera and keypoints detection. Sensors 2022, 22, 1617. [Google Scholar] [CrossRef] [PubMed]
- Apolo-Apolo, O.E.; Martínez-Guanter, J.; Egea, G.; Raja, P.; Pérez-Ruiz, M. Deep Learning Techniques for Estimation of the Yield and Size of Citrus Fruits Using a UAV. Eur. J. Agron. 2020, 115, 126030. [Google Scholar] [CrossRef]
- Khurshid, T.; Braysher, B. Early Fruit Size Prediction Model Using Cubic Smoothing Splines for “Washington Navel” (Citrus sinensis L. Osbeck) Oranges in Australia. Int. J. Fruit Sci. 2009, 9, 394–408. [Google Scholar] [CrossRef]
- Zhang, J.; Thiele, G.F.; Rowe, R.N. Gala Apple Fruit Size Distribution. N. Z. J. Crop Hortic. Sci. 1995, 23, 85–88. [Google Scholar] [CrossRef]
- McAneney, K.J.; Richardson, A.C.; Green, A.E. Kiwifruit Fruit Size Distributions. N. Z. J. Crop Hortic. Sci. 1989, 17, 297–299. [Google Scholar] [CrossRef]
- Marini, R.P.; Schupp, J.R.; Baugher, T.A.; Crassweller, R. Relationships between Fruit Weight and Diameter at 60 Days after Bloom and at Harvest for Three Apple Cultivars. HortScience 2019, 54, 86–91. [Google Scholar] [CrossRef]
- Marini, R.P.; Schupp, J.R.; Baugher, T.A.; Crassweller, R. Sampling Apple Trees to Accurately Estimate Mean Fruit Weight and Fruit Size Distribution. HortScience 2019, 54, 1017–1022. [Google Scholar] [CrossRef]
- Marini, R.P.; Schupp, J.R.; Baugher, T.A.; Crassweller, R. Estimating Apple Fruit Size Distribution from Early-Season Fruit Diameter Measurements. HortScience 2019, 54, 1947–1954. [Google Scholar] [CrossRef]
- Wulfsohn, D.; Aravena Zamora, F.; Potin, T.C.; Zamora, L.I.; García-Fiñana, M. Multilevel Systematic Sampling to Estimate Total Fruit Number for Yield Forecasts. Precis. Agric. 2012, 13, 256–275. [Google Scholar] [CrossRef]
- Webber, H.J. The Citrus Industry: History, World Distribution, Botany, and Varieties, 2nd ed.; University of California Press: Berkeley, CA, USA, 1967; pp. 389–390. [Google Scholar]
- Iwamasa, M. Citrus Cultivars in Japan. HortScience 1988, 23, 687–690. [Google Scholar] [CrossRef]
- Lan-Phi, N.T.; Shimamura, T.; Ukeda, H.; Sawamura, M. Chemical and aroma profiles of yuzu (Citrus junos) peel oils of different cultivars. Food Chem. 2009, 115, 1042–1047. [Google Scholar] [CrossRef]
- Hall, A.J.; McPherson, H.G.; Crawford, R.A.; Seager, N.G. Using early-season measurements to estimate fruit volume at harvest in kiwifruit. N. Z. J. Crop Hortic. Sci. 1996, 24, 379–391. [Google Scholar] [CrossRef]
- Amaral, M.H.; Walsh, K.B. In-Orchard sizing of mango fruit: 2. Forward estimation of size at harvest. Horticulturae 2023, 9, 54. [Google Scholar] [CrossRef]
- Khushbu, K.; Suniti, Y. Linear Regression Analysis Study. J. Pract. Cardiovasc. Sci. 2018, 4, 33–36. [Google Scholar] [CrossRef]
- Aishah Ahad, N.; Sin Yin, T.; Rahman Othman, A.; Rohani Yaacob, C. Sensitivity of Normality Tests to Non-Normal Data (Kepekaan Ujian Kenormalan Terhadap Data Tidak Normal). Sains Malays. 2011, 40, 637–641. [Google Scholar]
- Ghasemi, A.; Zahediasl, S. Normality Tests for Statistical Analysis: A Guide for Non-Statisticians. Int. J. Endocrinol. Metab. 2012, 10, 486–489. [Google Scholar] [CrossRef] [PubMed]
- Shapiro, S.S.; Wilk, M.B. An Analysis of Variance Test for Normality (Complete Samples). Biometrika 1965, 52, 591–611. [Google Scholar] [CrossRef]
- Judd, M.J.; Mcaneney, K.J. Advances in Irrigation; Academic Press: London, UK, 1987; Volume 4, pp. 307–330. [Google Scholar] [CrossRef]
- Uribeetxebarria, A.; Martínez-Casasnovas, J.A.; Tisseyre, B.; Guillaume, S.; Escolà, A.; Rosell-Polo, J.R.; Arnó, J. Assessing ranked set sampling and ancillary data to improve fruit load estimates in peach orchards. Comput. Electron. Agric. 2019, 164, 104931. [Google Scholar] [CrossRef]
- Yamamura, K.; Wada, T.; Urano, S. Random Median Sampling to Enhance the Precision of Population Estimates. Popul. Ecol. 2007, 49, 357–363. [Google Scholar] [CrossRef]
- Verreynne, J.S.; Rabe, E.; Theron, K.I. Effect of bearing position on fruit quality of mandarin types. S. Afr. J. Plant Soil 2004, 21, 1–7. [Google Scholar] [CrossRef]
- Suzuki, T.; Okamoto, S.; Seki, T. Effects of Micro-meteorological Elements and Positions in the Tree Crown on the Development of Shoots, Leaves and Fruits of Satsuma Mandarin. J. Jpn. Soc. Hortic. Sci. 1973, 42, 201–209. [Google Scholar] [CrossRef]
- Vijayakumar, V.; Ampatzidis, Y.; Costa, L. Tree-Level Citrus Yield Prediction Utilizing Ground and Aerial Machine Vision and Machine Learning. Smart Agric. Technol. 2023, 3, 100077. [Google Scholar] [CrossRef]
- Zhang, W.; Wang, J.; Liu, Y.; Chen, K.; Li, H.; Duan, Y.; Wu, W.; Shi, Y.; Guo, W. Deep-Learning-Based in-Field Citrus Fruit Detection and Tracking. Hortic. Res. 2022, 9, uhac003. [Google Scholar] [CrossRef]
Figure 1.
The fruits of Citrus junos Sieb. ex Tanaka.

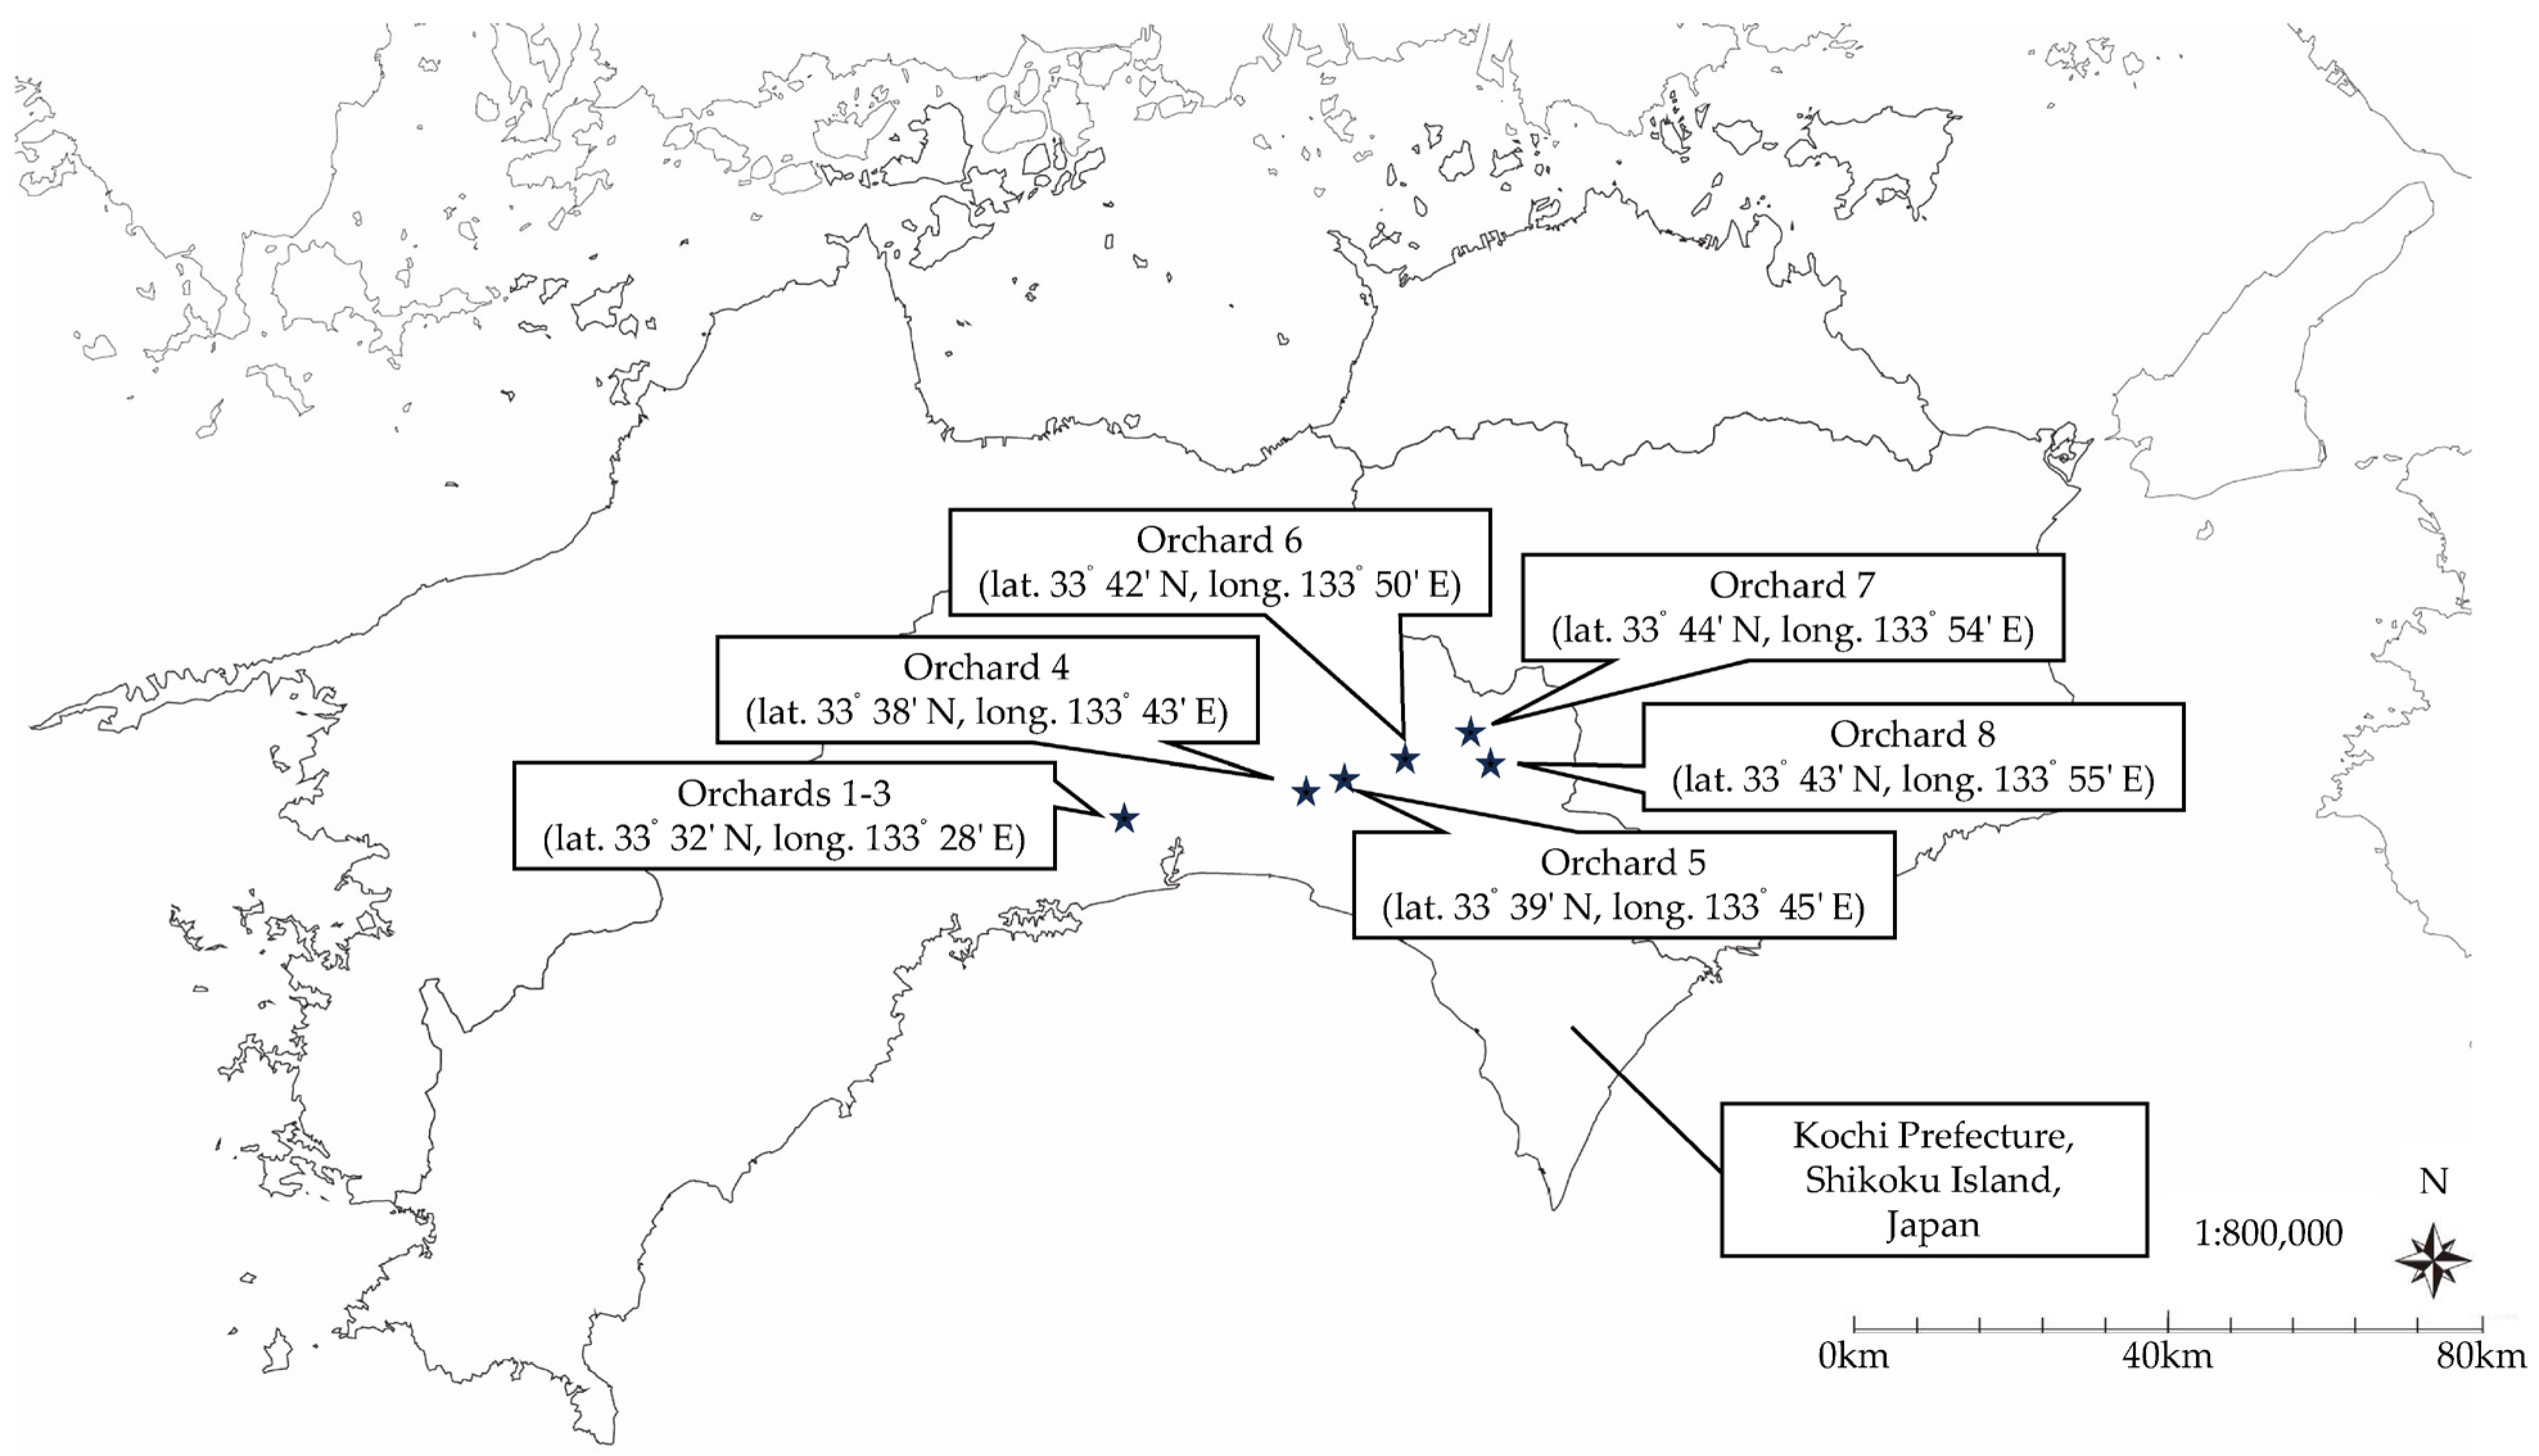
Figure 2.
The location of the experimental orchards. This study was conducted in three orchards (Orchards 1–3) at the Kochi Agricultural Research Center Fruit Tree Experiment Station in Kochi City and five farmer’s orchards (Orchards 4–8) in Kami City, Japan.
Figure 2.
The location of the experimental orchards. This study was conducted in three orchards (Orchards 1–3) at the Kochi Agricultural Research Center Fruit Tree Experiment Station in Kochi City and five farmer’s orchards (Orchards 4–8) in Kami City, Japan.

Figure 3.
The overview of the construction of datasets.

Figure 4.
The relationship between mean fruit diameter and proportion of 2L size (A) and M size (B) grade, excluding 0% of data and apparent outliers.
Figure 4.
The relationship between mean fruit diameter and proportion of 2L size (A) and M size (B) grade, excluding 0% of data and apparent outliers.

Figure 5.
Normal Q-Q plots using residuals to check the normality of models for estimating the proportion of fruit size grade. (A–D) The normal Q-Q plot on the residual of the model for estimating the proportion of 2L size grade (below 80.0 mm), 2L size grade (above 80.0 mm), M size grade (below 62.5 mm), and M size grade (above 62.5 mm), respectively.

Figure 6.
Residual plots using estimation values and residuals to check the normality of models for estimating the proportion of fruit size grade. (A–D) The residual plot of the model for estimating the proportion of 2L size grade (below 80.0 mm), 2L size grade (above 80.0 mm), M size grade (below 62.5 mm), and M size grade (above 62.5 mm), respectively.

Figure 7.
The comparison of the empirical cumulative distribution function for standardized fruit diameter among individual trees in the experimental orchards and standard normal distribution.
Figure 7.
The comparison of the empirical cumulative distribution function for standardized fruit diameter among individual trees in the experimental orchards and standard normal distribution.

Figure 8.
Histograms of estimation model’s accuracy (EMA) by number of trees analyzed. (A) Histogram of Orchard 1. (B) Histogram of Orchard 2. (C) Histogram of Orchard 3.
Figure 8.
Histograms of estimation model’s accuracy (EMA) by number of trees analyzed. (A) Histogram of Orchard 1. (B) Histogram of Orchard 2. (C) Histogram of Orchard 3.


Table 1.
The overview of the experimental orchards.
| Orchard Number | Research Year | Age of Trees | Number of Trees | Number of Fruits Set per Tree | |
|---|---|---|---|---|---|
| Average | Standard Deviation | ||||
| 1 | 2020 | 21–25 | 42 | 266.2 | 174.1 |
| 1 | 2021 | 22–26 | 47 | 452.5 | 193.1 |
| 2 | 2021 | 11–12 | 26 | 121.8 | 68.5 |
| 3 | 2022 | 20–21 | 31 | 129.5 | 70.0 |
| 4 | 2023 | 15 | 10 | 195.1 | 62.8 |
| 5 | 2023 | 10 | 10 | 119.5 | 15.7 |
| 6 | 2023 | 15 | 10 | 130.8 | 30.3 |
| 7 | 2023 | 9 | 10 | 303.3 | 63.6 |
| 8 | 2023 | Over 40 | 10 | 116.2 | 20.2 |
Table 2.
The fruit size grade determined by measuring the diameter of each fruit at harvest. The grade is a standard defined by Japan Agricultural Co-operatives (JA Kochi, Kochi City, Japan).
Table 2.
The fruit size grade determined by measuring the diameter of each fruit at harvest. The grade is a standard defined by Japan Agricultural Co-operatives (JA Kochi, Kochi City, Japan).
| Fruit Size Grade | S | M | L | 2L | 3L |
|---|---|---|---|---|---|
| Fruit diameter (mm) | 50.0–60.0 | 60.0–65.0 | 65.0–75.0 | 75.0–85.0 | 85.0–96.0 |
Table 3.
Models for estimating the proportion of fruit size grade at harvest determined by curvilinear regression with the mean fruit diameters as an independent variable and the proportions of fruit size grade as a dependent variable, excluding 0% of the data and obvious outliers.
Table 3.
Models for estimating the proportion of fruit size grade at harvest determined by curvilinear regression with the mean fruit diameters as an independent variable and the proportions of fruit size grade as a dependent variable, excluding 0% of the data and obvious outliers.
| Estimating the Proportion of Fruit Size Grade | Mean Fruit Diameter (mm) 1 | Model for Estimating the Proportion of Fruit Size Grade at Harvest |
|---|---|---|
| S, L, 2L, and 3L size grade 2,3 | Below 80.0 mm | 2415.2277 × A − 54.3715 × A2 + 0.5407 × A3 − 0.0020 × A4 − 40,023.9322 |
| Above 80.0 mm | 2014.4102 × A − 32.9240 × A2 + 0.2369 × A3 − 0.0006 × A4 − 45,699.0329 | |
| M size grade 2,3 | Below 62.5 mm | 720.3828 × A − 21.7491 × A2 + 0.2892 × A3 − 0.0014 × A4 − 8879.1156 |
| Above 62.5 mm | 796.6586 × A − 16.3870 × A2 + 0.1480 × A3 − 0.0005 × A4 − 14,303.4363 |
1 Each model was selected based on the mean fruit diameter. 2 For A, the mean fruit diameter was entered (mm). A value of A −10.5 mm was entered for estimating the proportion of 3L size grade, A for estimating the proportion of M and 2L size grades, A mm +10.0 mm for estimating the proportion of L size grade, and A +25.0 mm for estimating S size grade. We note that −10.5 mm means the difference between 90.5 mm, the median of the 3L size grade interval, and 80.0 mm, the median of the 2L size grade interval. Similarly, +10.0 mm means the difference between 70.0 mm, the median of the L size grade interval, and 80.0 mm, the median of the 2L size grade interval. Also, +25.0 mm means the difference between 55.0 mm, the median of the S size grade intervals, and 80.0 mm, the median of the 2L size grade interval. These processes are necessary because the adjustment to build this model was adapted to the 2L size grade. 3 This is 0% if the predicted proportion is negative.
Table 4.
The adjusted R-square (R2) and Akaike’s information criterion (AIC) of regression equations obtained by performing a curvilinear regression with the mean fruit diameter as an independent variable and the proportion of 2L size and M size grades as a dependent variable. Test statistics were obtained by F-test and Shapiro–Wilk test for each quartic function.
| Estimating the Proportion of Fruit Size Grade | Mean Fruit Diameter (mm) | Number of Data | Evaluation Index 1 | Function | Quartic Function | ||||
|---|---|---|---|---|---|---|---|---|---|
| Quadratic | Cubic | Quartic | Quintic | F Value 2 | W Value 2 | ||||
| 2L size grade | Below 80.0 mm | 54 | R2 | 0.96 | 0.97 | 0.98 | 0.98 | 610.62 ** | 0.974 NS |
| AIC | 312.02 | 288.65 | 270.36 | 272.32 | |||||
| Above 80.0 mm | 101 | R2 | 0.98 | 0.98 | 0.99 | 0.99 | 1626.64 ** | 0.970 * | |
| AIC | 531.38 | 533.20 | 502.38 | 503.87 | |||||
| M size grade | Below 62.5 mm | 114 | R2 | 0.92 | 0.95 | 0.96 | 0.96 | 718.50 ** | 0.984 NS |
| AIC | 604.98 | 556.17 | 546.23 | 546.25 | |||||
| Above 62.5 mm | 166 | R2 | 0.96 | 0.96 | 0.96 | 0.96 | 1159.15 ** | 0.980 * | |
| AIC | 759.65 | 760.73 | 738.87 | 732.99 | |||||
1 R2 shows the adjusted R-square, and AIC is an abbreviation for Akaike’s information criterion. 2 NS, *, ** non-significant or significant at p ≤ 0.05 or 0.01 by F-test and Shapiro–Wilk test, respectively.
Table 5.
The combinations of validations to assess the generalization capability of the constructed estimation models. Four datasets were used to construct 14 models by selecting one, two, and three datasets separately. Twenty-eight validations were conducted using the remaining datasets. The estimation model’s accuracy (EMA) and Pearson’s chi-square test were used to assess each orchard.
| Models | EMA 1 | p Value 2 | ||||||
|---|---|---|---|---|---|---|---|---|
| Orchard 1 (2020) | Orchard 1 (2021) | Orchard 2 | Orchard 3 | Orchard 1 (2020) | Orchard 1 (2021) | Orchard 2 | Orchard 3 | |
| Orchard 1 (2020) | 4.4% | 5.5% | 2.2% | 0.989 NS | 0.983 NS | 0.980 NS | ||
| Orchard 1 (2021) | 2.9% | 4.0% | 5.5% | 0.998 NS | 0.974 NS | 0.912 NS | ||
| Orchard 2 | 2.0% | 4.6% | 2.5% | 0.999 NS | 0.986 NS | 0.975 NS | ||
| Orchard 3 | 3.0% | 4.7% | 6.1% | 0.981 NS | 0.904 NS | 0.935 NS | ||
| Orchard 1 (2020) + Orchard 1 (2021) | 4.4% | 4.2% | 0.983 NS | 0.947 NS | ||||
| Orchard 1 (2021) + Orchard 2 | 2.7% | 4.8% | 0.998 NS | 0.930 NS | ||||
| Orchard 2 + Orchard 3 | 2.5% | 4.5% | 0.995 NS | 0.970 NS | ||||
| Orchard 1 (2020) + Orchard 2 | 4.3% | 2.2% | 0.989 NS | 0.979 NS | ||||
| Orchard 1 (2021) + Orchard 3 | 2.8% | 4.6% | 0.997 NS | 0.979 NS | ||||
| Orchard 1 (2020) + Orchard 3 | 4.3% | 5.4% | 0.980 NS | 0.982 NS | ||||
| Orchard 1 (2020) + Orchard 1 (2021) + Orchard 2 | 3.9% | 0.952 NS | ||||||
| Orchard 1 (2020) + Orchard 1 (2021) + Orchard 3 | 4.7% | 0.984 NS | ||||||
| Orchard 1 (2020) + Orchard 2 + Orchard 3 | 4.3% | 0.984 NS | ||||||
| Orchard 1 (2021) + Orchard 2 + Orchard 3 | 2.7% | 0.998 NS | ||||||
| Minimum | 2.0% | 4.3% | 4.0% | 2.2% | 0.981 | 0.904 | 0.935 | 0.912 |
| Maximum | 3.0% | 4.7% | 6.1% | 5.5% | 0.999 | 0.989 | 0.984 | 0.980 |
1 EMA is an abbreviation for estimation model’s accuracy. 2 NS, non-significant or significant at p ≤ 0.01 by Pearson’s chi-square test.
Table 6.
The validation to assess the constructed estimation models of five farmer’s orchards. The EMA and Pearson’s chi-square test were used to assess each orchard.
Table 6.
The validation to assess the constructed estimation models of five farmer’s orchards. The EMA and Pearson’s chi-square test were used to assess each orchard.
| Orchard Number | EMA 1 | p Value 2 | |
|---|---|---|---|
| Orchard 4 | 4.5% | 0.977 | NS |
| Orchard 5 | 11.3% | 0.788 | NS |
| Orchard 6 | 7.5% | 0.848 | NS |
| Orchard 7 | 11.3% | 0.330 | NS |
| Orchard 8 | 12.5% | 0.684 | NS |
1 EMA is an abbreviation for estimation model’s accuracy. 2 NS, non-significant or significant at p ≤ 0.01 by Pearson’s chi-square test.
Table 7.
The estimated and actual value of fruit size grade in Orchard 4.
| Fruit Size Grade | S | M | L | 2L | 3L | Total 1 | |
|---|---|---|---|---|---|---|---|
| Estimated value | Number of fruits | 25 | 60 | 709 | 1038 | 119 | 1951 |
| Proportions | 1.3% | 3.1% | 36.4% | 53.2% | 6.1% | ||
| Actual value | Number of fruits | 22 | 53 | 701 | 1081 | 92 | 1951 |
| Proportions | 1.1% | 2.7% | 35.9% | 55.4% | 4.7% | ||
| Differences 2 | Number of fruits | 3 | 7 | 8 | −43 | 27 | 0 |
| Proportions | 0.1% | 0.3% | 0.4% | −2.2% | 1.4% | ||
1 Since the actual values excluded the standards of out-of-specification, the sum of each size grade did not equal the total number. 2 Estimated value minus actual value.
Table 8.
The estimated and actual value of fruit size grade in Orchard 5.
| Fruit Size Grade | S | M | L | 2L | 3L | Total 1 | |
|---|---|---|---|---|---|---|---|
| Estimated value | Number of fruits | 51 | 173 | 734 | 231 | 6 | 1195 |
| Proportions | 4.3% | 14.5% | 61.4% | 19.3% | 0.5% | ||
| Actual value | Number of fruits | 42 | 161 | 801 | 189 | 1 | 1195 |
| Proportions | 3.5% | 13.5% | 67.0% | 15.8% | 0.1% | ||
| Differences 2 | Number of fruits | 9 | 12 | −67 | 42 | 5 | 0 |
| Proportions | 0.8% | 1.0% | −5.6% | 3.5% | 0.4% | ||
1 Since the actual values excluded the standards of out-of-specification, the sum of each size grade did not equal the total number. 2 Estimated value minus actual value.
Table 9.
The estimated and actual value of fruit size grade in Orchard 6.
| Fruit Size Grade | S | M | L | 2L | 3L | Total 1 | |
|---|---|---|---|---|---|---|---|
| Estimated value | Number of fruits | 30 | 145 | 776 | 341 | 16 | 1308 |
| Proportions | 2.3% | 11.1% | 59.3% | 26.1% | 1.2% | ||
| Actual value | Number of fruits | 47 | 167 | 732 | 350 | 10 | 1308 |
| Proportions | 3.6% | 12.8% | 56.0% | 26.8% | 0.8% | ||
| Differences 2 | Number of fruits | −17 | −22 | 44 | −9 | 6 | 0 |
| Proportions | −1.3% | −1.7% | 3.4% | −0.7% | 0.5% | ||
1 Since the actual values excluded the standards of out-of-specification, the sum of each size grade did not equal the total number. 2 Estimated value minus actual value.
Table 10.
The estimated and actual value of fruit size grade in Orchard 7.
| Fruit Size Grade | S | M | L | 2L | 3L | Total 1 | |
|---|---|---|---|---|---|---|---|
| Estimated value | Number of fruits | 764 | 882 | 1266 | 121 | 0 | 3033 |
| Proportions | 25.2% | 29.1% | 41.7% | 4.0% | 0.0% | ||
| Actual value | Number of fruits | 657 | 995 | 1296 | 27 | 0 | 3033 |
| Proportions | 21.7% | 32.8% | 42.7% | 0.9% | 0.0% | ||
| Differences 2 | Number of fruits | 107 | −113 | −30 | 94 | 0 | 0 |
| Proportions | 3.5% | −3.7% | −1.0% | 3.1% | 0.0% | ||
1 Since the actual values excluded the standards of out-of-specification, the sum of each size grade did not equal the total number. 2 Estimated value minus actual value.
Table 11.
The estimated and actual value of fruit size grade in Orchard 8.
| Fruit Size Grade | S | M | L | 2L | 3L | Total 1 | |
|---|---|---|---|---|---|---|---|
| Estimated value | Number of fruits | 45 | 141 | 648 | 314 | 15 | 1162 |
| Proportions | 3.9% | 12.1% | 55.8% | 27.0% | 1.3% | ||
| Actual value | Number of fruits | 31 | 136 | 721 | 270 | 4 | 1162 |
| Proportions | 2.7% | 11.7% | 62.0% | 23.2% | 0.3% | ||
| Differences 2 | Number of fruits | 14 | 5 | −73 | 44 | 11 | 0 |
| Proportions | 1.2% | 0.4% | −6.3% | 3.7% | 0.9% | ||
1 Since the actual values excluded the standards of out-of-specification, the sum of each size grade did not equal the total number. 2 Estimated value minus actual value.
Disclaimer/Publisher’s Note: The statements, opinions and data contained in all publications are solely those of the individual author(s) and contributor(s) and not of MDPI and/or the editor(s). MDPI and/or the editor(s) disclaim responsibility for any injury to people or property resulting from any ideas, methods, instructions or products referred to in the content. |
© 2024 by the authors. Licensee MDPI, Basel, Switzerland. This article is an open access article distributed under the terms and conditions of the Creative Commons Attribution (CC BY) license (https://creativecommons.org/licenses/by/4.0/).
Share and Cite
MDPI and ACS Style
Tanimoto, Y.; Yoshida, S. A Method of Constructing Models for Estimating Proportions of Citrus Fruit Size Grade Using Polynomial Regression. Agronomy 2024, 14, 174. https://doi.org/10.3390/agronomy14010174
AMA Style
Tanimoto Y, Yoshida S. A Method of Constructing Models for Estimating Proportions of Citrus Fruit Size Grade Using Polynomial Regression. Agronomy. 2024; 14(1):174. https://doi.org/10.3390/agronomy14010174
Chicago/Turabian StyleTanimoto, Yuu, and Shinichi Yoshida. 2024. "A Method of Constructing Models for Estimating Proportions of Citrus Fruit Size Grade Using Polynomial Regression" Agronomy 14, no. 1: 174. https://doi.org/10.3390/agronomy14010174
Note that from the first issue of 2016, this journal uses article numbers instead of page numbers. See further details here.