

Marker-Trait Associations of Agronomic Traits in Barley (Hordeum vulgare L.) under Semi-Arid Conditions
1
Higher School of Agriculture of El Kef, Boulifa Campus, El Kef 7119, Tunisia
2
Field crops Laboratory, INRAT, University of Carthage, Tunis 1004, Tunisia
3
Pôle Régional de Recherche Développement Agricoles du Nord-Ouest semi-aride à El Kef,
\linebreak Institution de la Recherche et de l’Enseignement Supérieur Agricoles (IRESA), Tunis 1002, Tunisia
*
Author to whom correspondence should be addressed.
Agronomy 2023, 13(11), 2804; https://doi.org/10.3390/agronomy13112804
Submission received: 1 April 2023
/
Revised: 19 April 2023
/
Accepted: 23 April 2023
/
Published: 13 November 2023
(This article belongs to the Special Issue Genetic and Genomic Studies of Important Traits in Cereal Crops)
Abstract
:Heading date, plant height, and spike-related phenotypes are key traits that affect the yield potential and adaptation of barley to Mediterranean environments. These traits are controlled by a complex network of genes as well as environmental effects. Marker-trait associations (MTAs) were performed using a set of 361 barley genotypes, evaluated phenotypically for three years under semi-arid conditions. In total, 24 MTAs were detected using the recently developed GWAS method (BLINK) at –log p ≥ 5. These included one MTA with awn length (Awl) on chromosome 2H; twelve MTAs with heading date (HD) distributed over all chromosomes except 4H; three MTAs with grains per spike (GPS) on chromosomes 1H, 2H, and 6H; six MTAs were detected for plant height (PH) on 2H (2), 3H, 4H, 6H, and 7H; and two MTAs with spike length (SL) on 3H and 7H. The results showed novel and known associations between specific SNP markers and heading date, plant height, and spike-related traits, suggesting that these markers can be used in breeding programs to improve these traits in barley. This study provides valuable information for breeders and geneticists working to develop new barley varieties that are better adapted to semi-arid climates and have improved yield and quality characteristics.
1. Introduction
Barley (Hordeum vulgare L.) is a cereal grain that is widely cultivated around the world. It is the fourth most important cereal crop after rice, wheat, and corn. Barley is a diploid species with a genome size of approximately 5.1 Gb [1], which is larger than that of rice. As the world’s population is expected to reach 9.7 billion in 2050, the total global food demand is projected to grow by between 35% and 56% from 2010 to 2050. When considering the impact of climate change, the figures for total food demand change slightly to a range of 30% to 62% [2]. However, abiotic stress, particularly drought, poses a significant challenge to achieving this target. Terminal heat stress during grain filling is a major constraint for barley production in Tunisia. To mitigate this problem, breeding efforts have focused on developing early heading cultivars with reduced plant stature, such as dwarf barley, which can escape the high temperatures during grain filling [3,4].
Understanding the genetic factors that influence agronomic characteristics is a significant scientific challenge in enhancing crop improvement. Many of the traits that are crucial for crop yield are complex and are affected by both genetic and environmental factors [3].
As genome sequence data becomes more readily accessible and technology for identifying and analyzing genetic markers improves, the use of linkage disequilibrium (LD) in genome-wide association studies (GWAS) has become more popular in crops, particularly in wheat [5,6,7], barley [8,9], and rice [10,11], for determining the genetic factors that contribute to complex trait variation. In barley, association mapping studies have been used for fast identification and scoring of genetic markers for a wide range of agronomic traits, including heading date [12,13,14], plant height [15,16,17] and spike-related traits [18,19]. The heading date determines the time of flowering and grain filling, which is a crucial factor in yield formation. Early heading enables the crop to escape harsh weather conditions, pests, and diseases, while late heading can lead to yield losses due to unfavorable environmental conditions. Heading date is regulated by various environmental and genetic factors, including photoperiod, vernalization, and developmental stage. One of the central regulators of heading date in barley is the Ppd-H1 gene, which promotes flowering under long days [20], while the Ppd-H2 gene is responsible for acceleration of flowering in response to short photoperiods [21]. HvCO1 is one of the barley homologs of the Arabidopsis CONSTANS gene and acts in parallel to Ppd-H1 to promote flowering [22]. Overexpression of HvCO1 up-regulates HvFT1 (an ortholog of the Arabidopsis FLOWERING LOCUS T gene) and accelerates heading. HvCEN/eps2 [23] is another paralog of HvFT1 that has a large effect on time to flowering, particularly in Mediterranean regions. The vernalization pathway is regulated by a different set of genes. Vrn-H1 [24] is closely related to the Arabidopsis gene APETALA1 and regulates the transition to the reproductive stage [25]. Allelic variation at Vrn-H2 [26] arises from the presence or deletion of a cluster of three genes (ZCCT-H), which are characterized by a putative zinc finger and a CCT-domain. Vrn-H2 is considered to play the role of repressor of flowering time by inhibiting expression of Vrn-H3 [27]. Vrn-H3 was shown to correspond to HvFT1, the ortholog of the Arabidopsis FT gene [21,28]. This gene plays a central role in promoting flowering as an integrator of the vernalization and photoperiod pathways in barley.
The decrease in the height of plants has been a crucial factor in enhancing crop productivity. The effectiveness of a breeding initiative depends on the identification of genes that cause semi-dwarfism. The semi-dwarfing sdw1/denso gene is among the most significant genes regulating plant height in barley and has been integrated into various high-yield modern cultivars [29,30]. This gene is located on chromosome 3H and linked to SNP (11_10754) [31]. Barley spike traits are also determined by the presence of awns. Awned varieties of barley produce higher yields compared to awnless varieties, especially in warm and dry conditions [32]. The awns inside the spike play a crucial role in photosynthetic activity [33]. Previous studies have identified QTLs for awn length located on 3H [34], 6H [35], and 7H [36].
The aim of this study was to identify the marker-trait associations of single nucleotide polymorphism (SNP) markers with heading date, plant height, and spike-related traits using 361 barley accessions evaluated for three years under a semi-arid climate in Tunisia. Therefore, improving these traits through breeding programs can lead to increased barley yield, making it an essential consideration for barley farmers and researchers.
2. Materials and Methods
2.1. Plant Materials and Phenotyping
A collection of 361 barley genotypes, including 16 Tunisian old landraces and exotic accessions (from North Africa, the Middle East, and Ethiopia) derived from the U.S. National Plant Germplasm System (NPGS), were used in this study, including two-rowed (27%) and six-rowed (73%) row types with spring, winter, and facultative growth habits. During three cropping seasons: 2017/2018 (E1), 2019/2020 (E2), and 2021/2022 (E3), field trials were conducted in El Kef, Tunisia, characterized by a semi-arid climate with an average annual rainfall of 380 mm. The experiment was arranged in a randomized complete block design (RSBD). Each accession was planted in two replicate plots, each comprising two 2.5 m long rows planted with 65 seeds with an inter-row spacing of 25 cm. The traits considered in this study are as follows: heading date (HD): recorded as the number of days when 50% of the ears in a plot emerged; plant height (PH): measured in cm from soil surface to tip of the spike (excluding awns); spike length (SL): measured in cm from the base of the spike to the tip of the terminal spikelet; awn length (Awl): the length of the awn in the central spikelets; and number of grains per spike (GPS).
2.2. Statistical Analysis
Descriptive statistics, analysis of variance, and heritability were checked using the variability package in R software. Phenotypic correlations matrix between traits were analyzed using the ggpair function from the GGally package in R (an extension package to ggplot2) [37]. The effects of genotype, replication, location (environment), and genotype by location interaction were tested via analysis of variance (ANOVA) using the anova_joint function of the metan package [38]. The estimate of the response variable for the ith genotype in the jth environment using the additive main effect and multiplicative interaction (AMMI) model, is given as follows:
where λk is the singular value for the kth interaction principal component axis (IPCA); aik is the ith element of the kth eigenvector; and tjk is the jth element of the kth eigenvector. A residual ρij remains, if not all p IPCA are used, where p ≤ min (g−1; e−1).
yij = μ + αi + τj + ∑k = 1pλkaiktjk + ρij + εij
2.3. Phylogenetic Tree, Kinship, and Principal Component Analysis (PCA)
The population structure was estimated using the similarity matrix (kinship matrix) and the principal component analysis (PCA). Both analyses were constructed using the GAPIT package [39].
2.4. Association Mapping (AM)
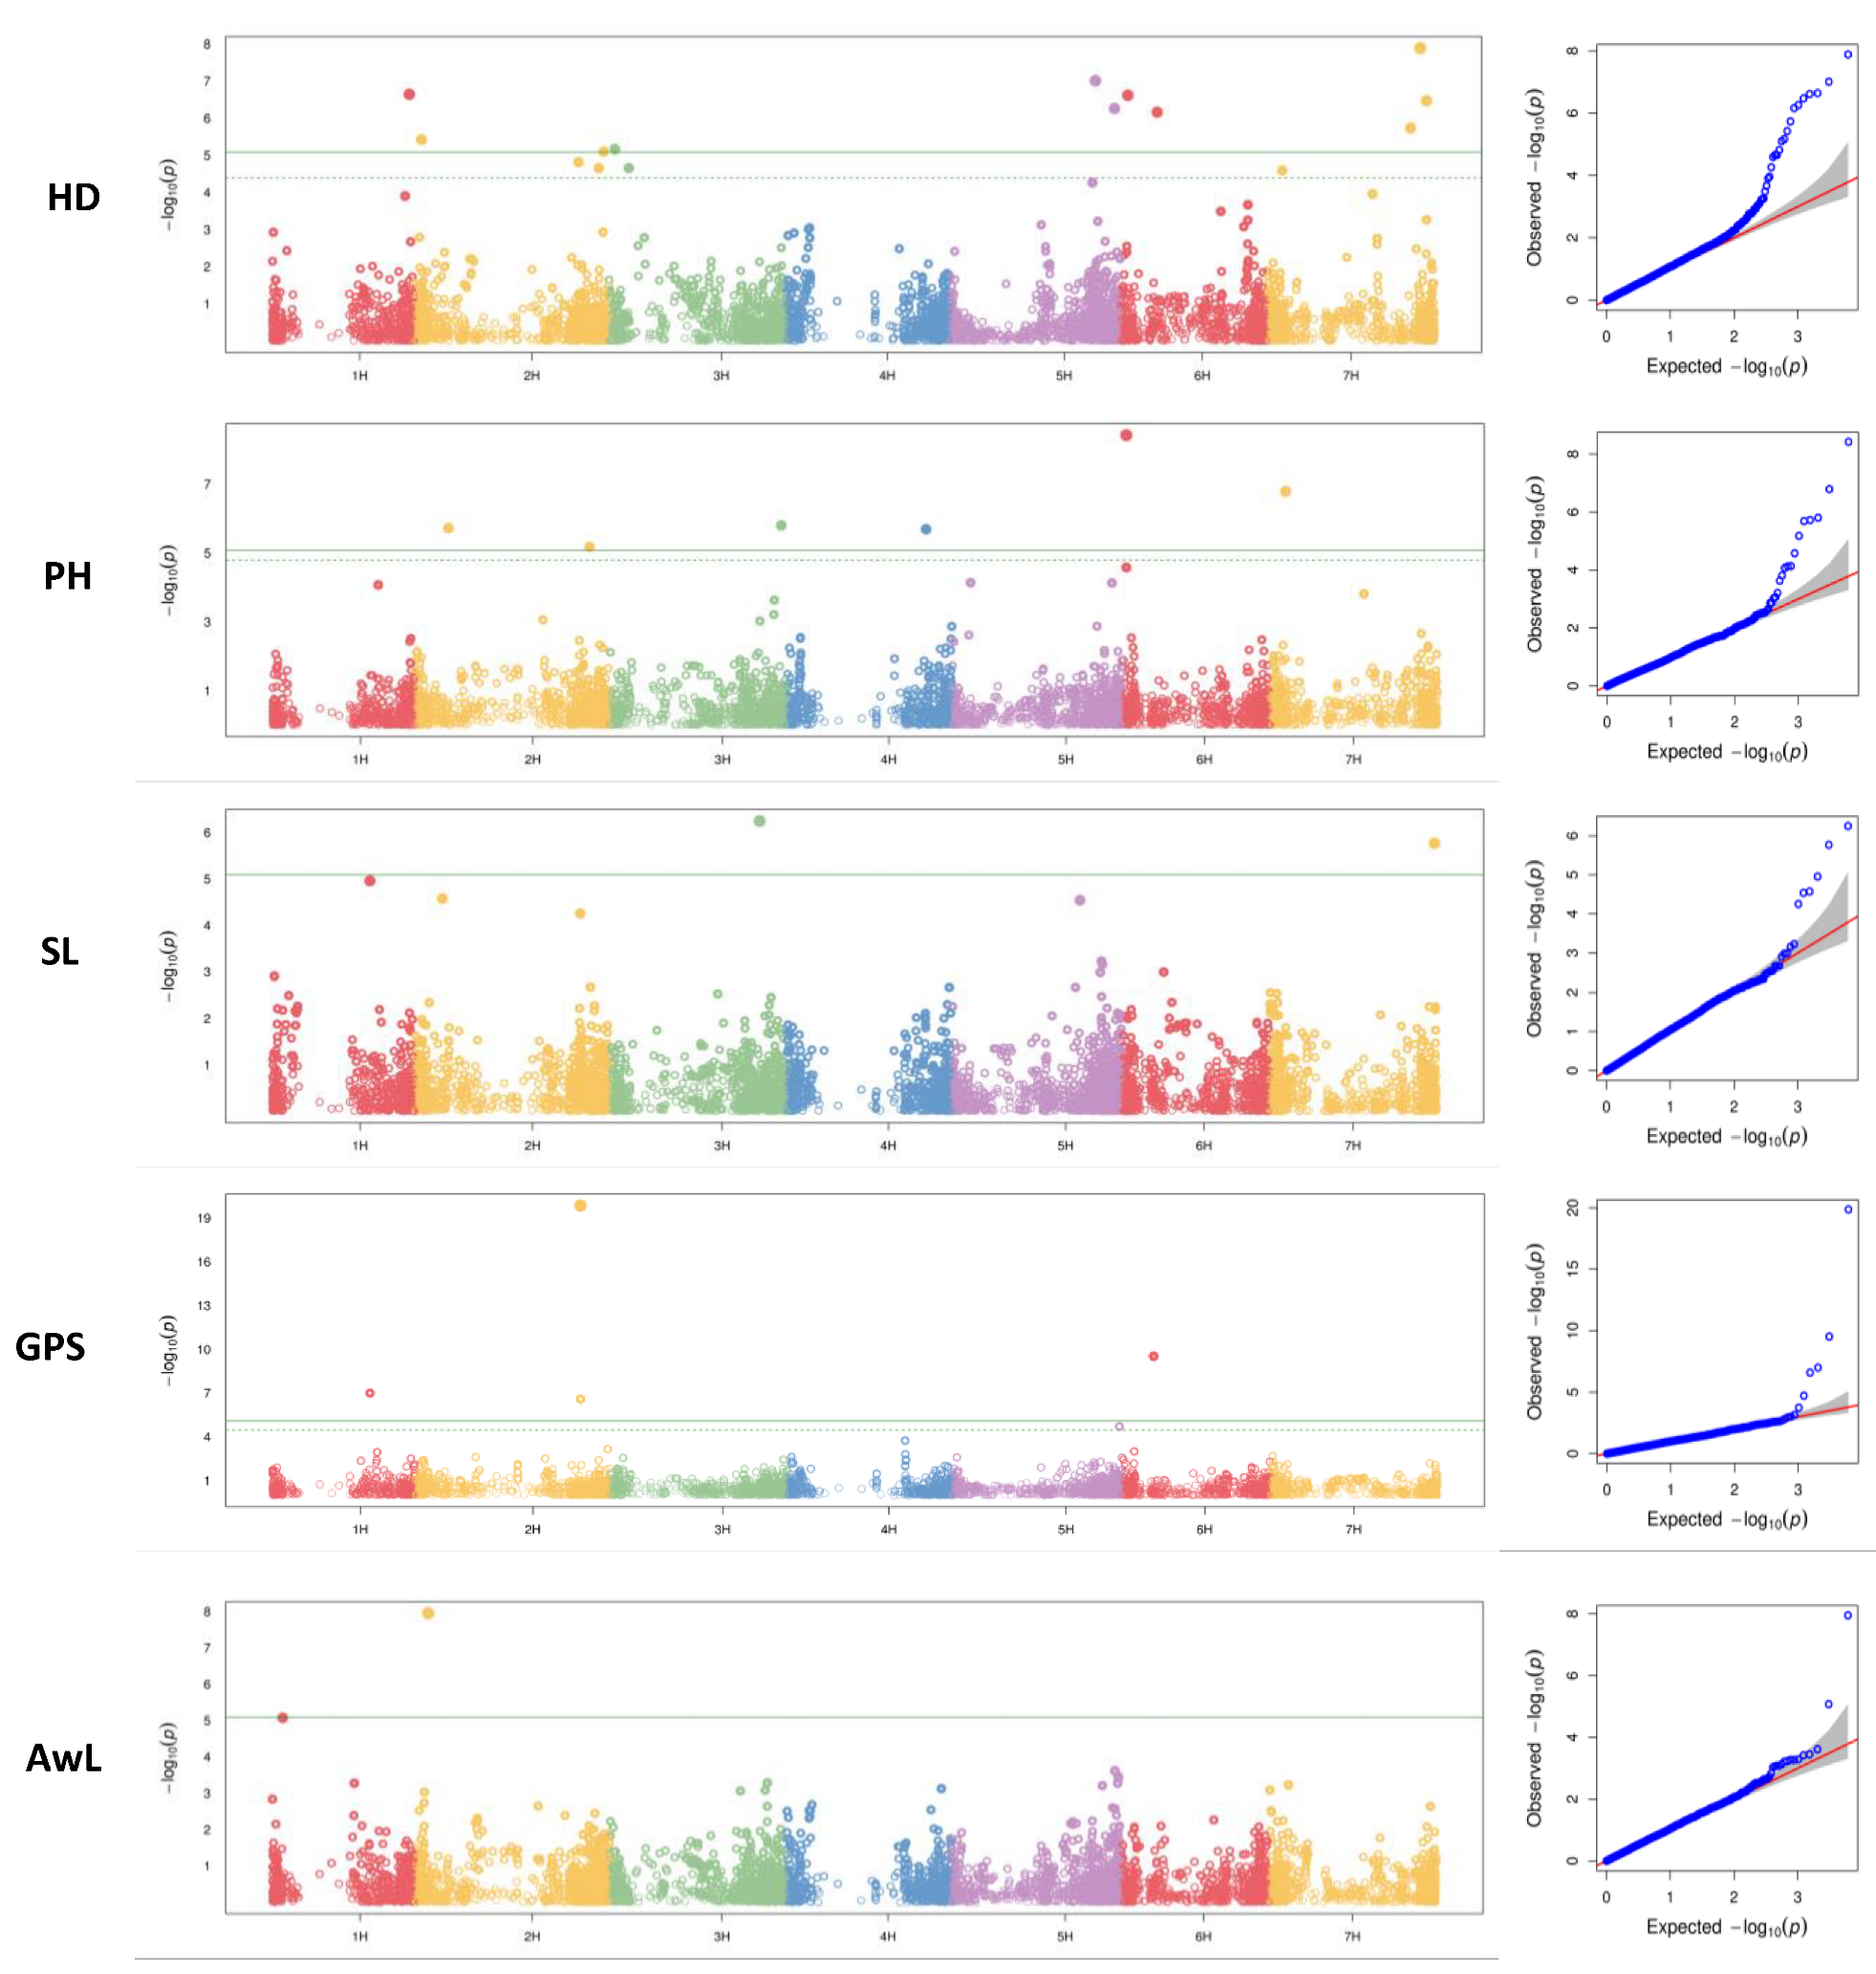
The genotyping data of barley accessions were from the sequencing experiment, BarleyNB_9K (Platform: Infinium 9K) including 6913 SNP markers, obtained from the T3/barley database. Markers with a minor allele frequency (MAF) of less than 5% were removed, resulting in 6118 SNPs used for genome-wide association studies (GWAS). GWAS were conducted using Bayesian-information and linkage-disequilibrium iteratively nested keyway (BLINK), a statistical method implemented in the GAPIT3 R package [40]. The kinship model (K) and the first three principal components (PCs) derived from GAPIT were considered for the association mapping. Manhattan plots were created to display the distribution of SNPs across the chromosome. The significance levels used in the GWAS analysis on these plots are represented by both Bonferroni and FDR thresholds (p = 0.01) and (p ≤ 0.05), respectively.
3. Results
3.1. Descriptive Statistics
The research took place in El Kef, Tunisia, which experienced a low and inconsistent distribution of rainfall during three cropping seasons: 2017/2018, 2020/2021, and 2021/2022. Due to this irregular temperature and rainfall pattern, particularly during the grain filling stage, each year was considered as a distinct environment. Combined descriptive statistics over three years are summarized in Table 1. A wide range of variation was observed for most of the studied phenotypic traits. Phenotypic variances (σ2p) of all studied traits were greater than those of genotypic variances (σ2g). All traits had a PCV coefficient that was higher than the GCV coefficient, but the values were similar to each other, indicating that there is a small range of genetic variation and little impact from environmental factors. The estimated heritability for different traits ranged between 67% and more than 96%. In PH, the broad sense heritability was medium (67%) and genetic advance was moderate (13.8%), indicating the existence of both additive and non-additive gene effects. SL and Awl showed a high heritability of 80% and 78%, respectively, but a very low genetic advance ranging from 3.1% and 4.1%, respectively, suggesting the non-additive gene effect of these traits. High heritability (92%–96%) accompanied by moderate to high genetic advance (16.5%–46%) in the case of HD and GPS would suggest the existence of additive gene actions.
3.2. Analysis of Variance Using AMMI Model
The ANOVA analysis combined with the AMMI model for the 361 barley accessions evaluated over three years showed highly significant (p < 0.001) differences among environments, genotypes, and GE interactions for all traits (Table 2). The G:E interaction was divided into two interaction principal component axes (IPCA). For all traits, IPCA1 explained more than 57% of the total G:E interaction sums of squares percentage, except for plant height, for which it explained 51%. The total variation explained by the main effects of genotypes ranged from 29.3% for PH to 92.3% for GPS. Environment had the most important effect on plant height, accounting for 50.1% of the total treatment variation.
3.3. Population Structure Analysis
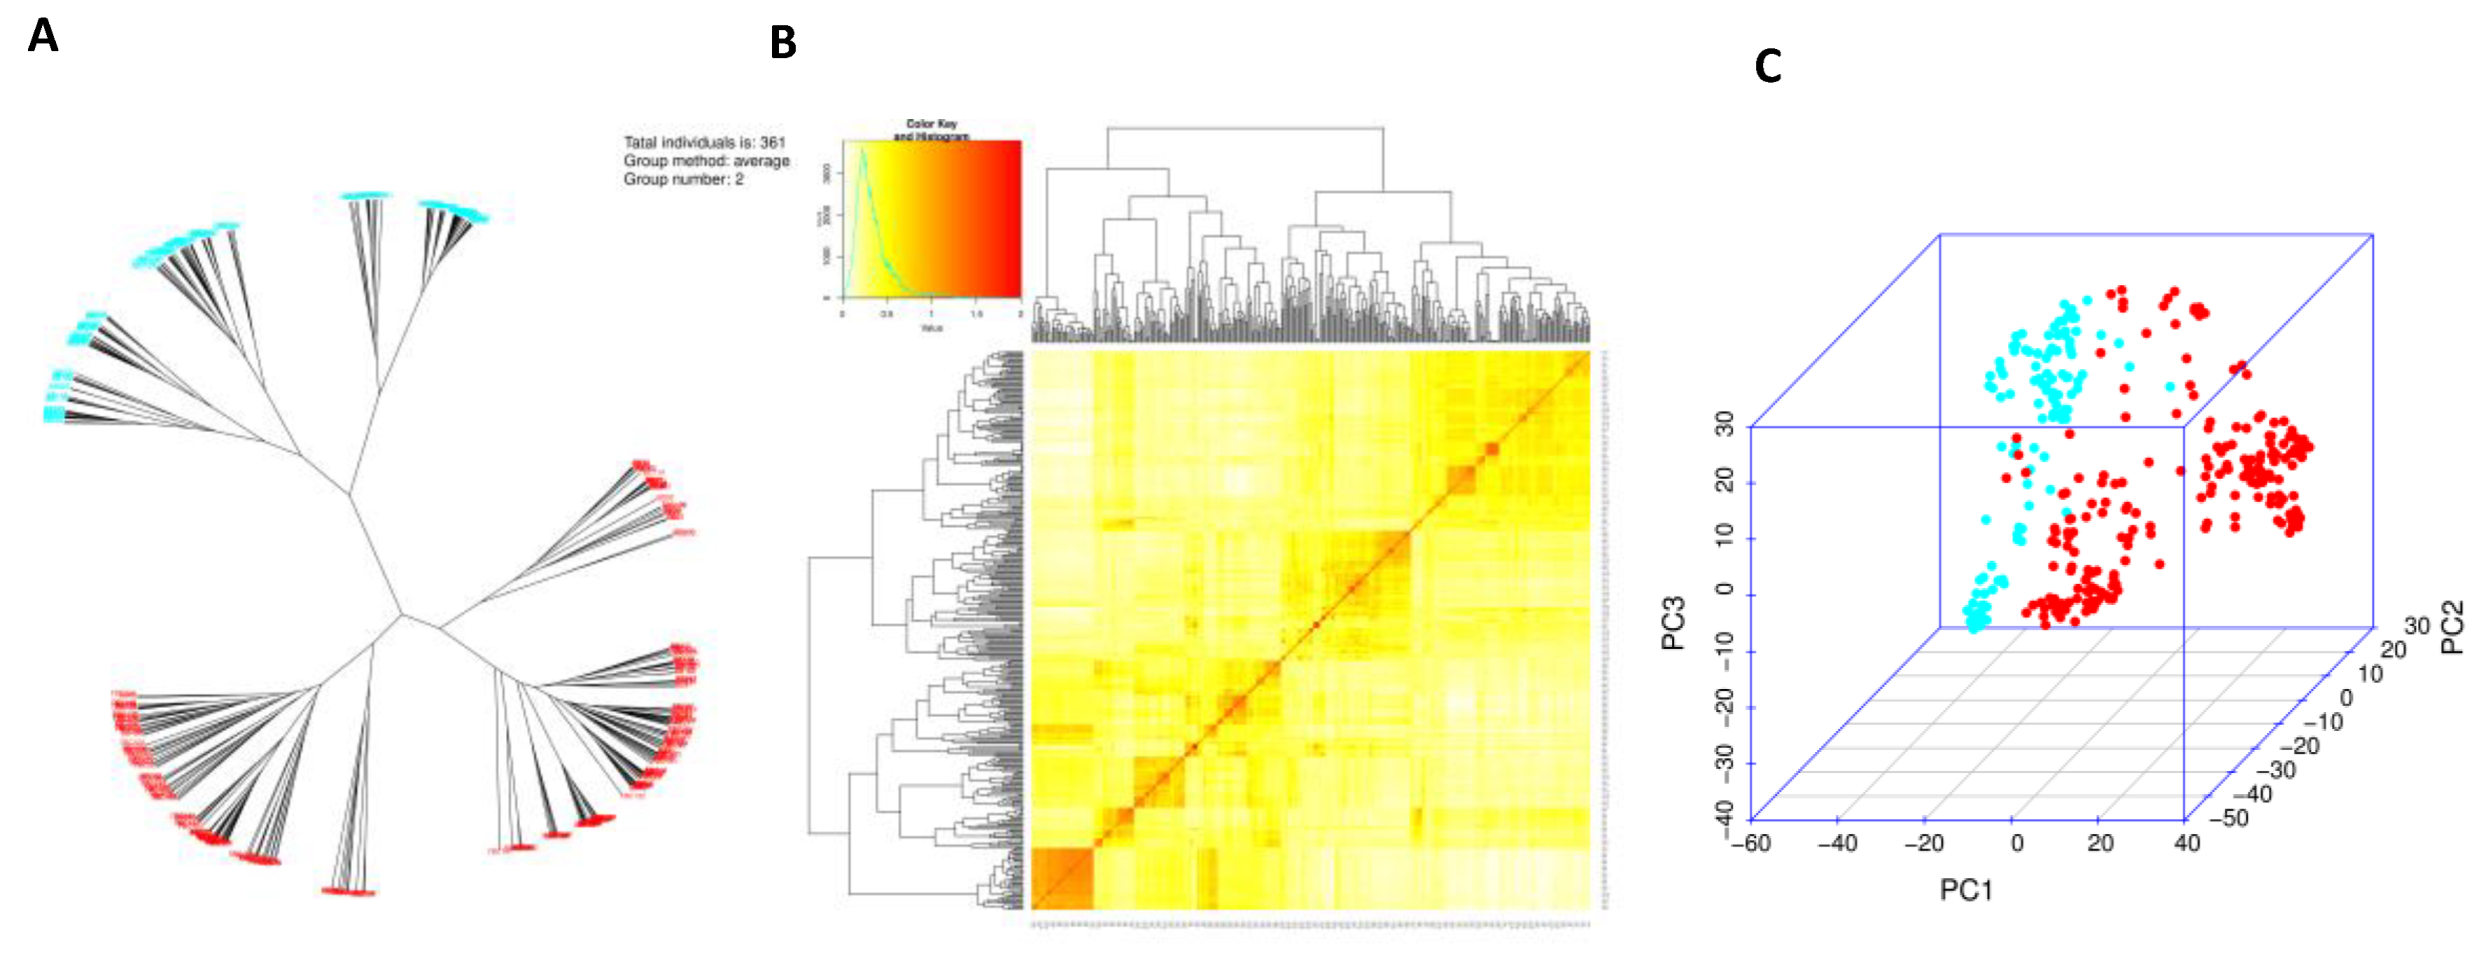
Based on SNP marker data, a phylogenetic tree was constructed using 361 barley accessions. Two subpopulations associated with row type could be clearly segregated (Figure 1A). The relationship between accessions is shown in the heat map of the kinship matrix (K-matrix) (Figure 1B). The kinship matrix, which is based on SNP markers, can also be referred to as co-ancestry or half-relatedness. This matrix helps to illustrate the coefficients of co-ancestry among individuals, with a stronger red color indicating a higher degree of relatedness. Principal components analysis (PCA) is the most commonly utilized approach to address population structure in genetic association studies conducted on unrelated individuals [41]. The projection of genotypes against the first two PCs shows a clearly structured population according to row-type phenotype (2 row and 6 row) (Figure 1C).
3.4. GWAS Analysis for Markers Trait Association
A set of 6118 mapped SNP markers were used for GWAS, which were evenly distributed over all seven chromosomes. The number of markers varied among chromosomes, with a minimum of 600 SNPs on chromosome 1H and a maximum of 1221 SNPs on chromosome 5H. The highest number of loci detected were on 2H (6) and 7H (6), and the lowest was found on 4H (1). The expected and observed p-values were displayed using a Q-Q plot matched for all traits, then diverged to indicate a positive association. Thus, the association analysis is reliable and not likely to produce false negatives (Figure 2). Marker trait association (MTA) analysis using 361 barley accessions identified 23 markers associated with the five studied traits studied over three years (Figure 2, Table 3). For HD, 11 MTA were identified on all chromosomes except chromosome 4H, with an effect ranging from −1.5 to 1.64 days. For PH, six associated markers were located on chromosomes 2H, 3H, 4H, 6H, and 7H. Only one marker located on chromosome 4H showed a positive effect on plant height, and increased height by 1.48 cm. Only one SNP, located on the short arm of chromosome 2H, was found to be associated with the variation in awn length with a negative effect. Three significant markers on chromosomes 1H, 2H, and 6H were detected for GPS. Those located on 1H and 6H reduced the grain number by 4.65 and 3.48 grains, respectively. However, SNPs located on 2H increased seed number by 8.55. Two significant SNP markers were located on 3H and 7H, controlling SL with a positive effect.
4. Discussion
4.1. Genetic Variation of the Studied Traits
The analysis of variance for each trait showed the existence of significant effects of the genotypes over the environment, indicating important genetic variability and differences among barley accessions evaluated under semi-arid conditions (Table 1). PCV and GCV values ranged from 6.6% to 43.2% and 6.3% to 42.6%, respectively. The lowest values were estimated for the heading date, and the highest was attributed to GPS. ECV variance was quite high for SL and low for other traits, suggesting that environmental effects may bring favorable changes in the expression of SL. These observations are in accordance with earlier results from [42,43]. Heritability values were medium to high, ranging from 0.67 for PH to 0.96 for GPS. Traits with a very high heritability indicate a low effect of environment on the phenotypic expression and the effectiveness of selection based on their phenotypic selection [43].
Assessing the genotypic responses in various environments is crucial for identifying suitable genotypes and evaluating environments that can enhance breeding and cultivar development [44,45,46]. The variance analysis conducted in this study revealed significant differences (p ≤ 0.001) between genotypes, test environments, and the impact of genotype–environment interaction. Analysis of variance for studied traits revealed that the genotypic effect was considerably more important than that of the environment, ranging from 60% to 90.3%, except for plant height, for which the environmental effect was much stronger (50.1%), suggesting that PH is modulated by a combination of genetic and non-genetic factors [47].
4.2. Marker Trait Association of the Studied Traits
Genome-wide association analysis has become a highly effective method for studying quantitative traits. It has the potential to offer more detailed mapping of QTLs compared to bi-parental studies [48]. In the current study, GWAS analysis was conducted using a panel of diverse barley accessions for several traits.
4.2.1. Heading Date
Heading date is an important trait that determines the crop’s ability to mature before the onset of unfavorable conditions such as heat stress, water stress, or disease [49]. This is particularly critical in regions with changing climates, as earlier flowering may help crops to avoid environmental stress and increase yields. In this study, 11 MTAs were associated with HD and distributed over all chromosomes except chromosome 4. The SNP (11_21140) on the long arm of chromosome 1H coincides with the position of the earliness per se gene eam8/eps1. In barley, the eam8 mutation causes an early-flowering-day phenotype with rapid flowering under both short days (SDs) and long days (LDs) [50]. The QTL on the short arm of chromosome 2H (12_30872) could correspond to the Ppd-H1 gene. Under LDs, the Ppd-H1 dominant allele causes early heading and is prevalent in Mediterranean conditions [20]. In this study, this gene caused a delay in the heading date, suggesting a mutation in the conserved CCT domain or the sixth exon of the Ppd-H1 gene [20,51]. In the long arm of chromosome 2H, 1 SNP (SCRI_RS_174077) exceeded the Bonferroni level. This region was previously identified in several studies as a region that included the HvAP2 gene [52,53,54], conferring a late heading date and co-segregating with the Flt-2L gene in wheat [55]. The detected locus in 3HS in this study is approximately 20 cM from the known heading date genes HvFT2 [56] and HvGI [57]. However, this region co-located with an associated SNP marker (SCRI_RS_189757) during the time from tipping to heading [58].
Another significant region is co-localized with the positions of the Vrn-H1 and HvPHYC genes on 5H. Both loci have a negative effect, causing an early heading date. It is known that deletion in the first exon of Vrn-H1 is associated with spring growth in barley [59]. Barley accessions carrying spring alleles of the Vrn-H1 gene showed early heading under drought conditions [60]. HvPHYC, a gene in barley that is similar to the PHYTOCHROME C locus, plays a key role in determining early flowering and regulates the process under long-day conditions (Nishida et al., 2013). Through its interactions with other genes such as Vrn-H1, sdw1, and Ppd-H1, HvPHYC can trigger early heading specifically in response to long daylight hours (Pankin et al., 2014).
On chromosome 6H, two associations were found. A locus on chromosome 6H is co-located with the flowering gene (HvNAM-1) [61]. The other locus is close to the putative heading and flowering genes: HvCO7 [17,62], HvCYP734A7 [17], HvCO5 [63], HvCry1a [64], and HvCry2 [65].
On the long arm of chromosome 7H, three MTAs were identified. Two SNPs (12_30026, SCRI_RS_204483) were associated with a delay in the heading date, and one (SCRI_RS_222863) had an early heading date. This region harbors several candidate genes, including HvCO6 and HvCMF7. In the short arm of 7H, one SNP has passed the FDR cutoff and is located near the vrn-H3 gene. According to our results, this locus promotes early heading, which coincides with previous research suggesting the central role of vrn-H3 in the flowering pathways, leading to the transition from vegetative to reproductive state under long-day conditions [28,66].
4.2.2. Plant Height
Six MTAs were identified as showing a negative effect on plant height, except the SNP (11_10639) located on 4H, which increases plant height. The genomic region on the short arm of 2H is co-localized distal to the HvCEN gene. The wild alleles of the HvCEN locus were found to reduce the phenotypic value of plant height [67]. The locus on the long arm of 2H (SCRI_RS_135355) coincides exactly with the position of HvAPO2/BFL. This locus was found, in previous studies, to control plant height [67]. BFL has been involved in phase duration and tillering by reducing the tiller number by one in barley [17,58]. On 3HL, one locus reduces plant height by 1.32 cm. This region harbors the uzu gene, the first dwarfing gene reporting an important mutation related to the brassinosteroid receptor [68], and also the site sdw1/denso gene controlling dwarfism by a mutation in the HvGA20ox2 gene [69]. On 4H, the candidate gene of the SNP (11_10639) locus is HORVU.MOREX.r3.4HG0394090. This locus was found 660 kb away from the location of HORVU.MOREX.r3.4HG0394170, the ortholog of OsDWARF4 in rice, and known as the HvD4 gene in barley [17]. The locus on 6HS was reported as a novel QTL lacking known candidate genes. On 7H, one locus showed a decrease in plant height, including HvMAX2 and Hv soluble starch synthase 1 (HvSS1).
4.2.3. Spike-Related Traits
Only one locus, located on 2HS, was identified for awn length, corresponding to the position of the previously identified AL2.1 QTL [70]. The GrainGenes database (https://wheat.pw.usda.gov accessed on 1 Jan 2022) lists the candidate genes in this region as HORVU.MOREX.r3.2HG0114290, which codes for a xylose isomerase, and HORVU.MOREX.r3.2HG0114320. Three SNP associations were identified for the GPS trait on 1H, 2H, and 6H. On 1H, the identified locus corresponds to the gene Vrs3, which encodes a histone demethylase that controls lateral spikelet development in barley [71,72]. On 2H, another locus controlling the development and fertility of lateral spikelets is called Vrs1 [73]. The SNP (SCRI_RS_170058) on 6H coincides with the position of the candidate gene HORVU.MOREX.r3.6HG0569710. For spike length, the putative candidate gene for the 3H locus is HORVU.MOREX.r3.3HG0297290, which encodes a protein kinase. The detected SNP on 7H is close to the HORVU.MOREX.r3.7HG0749940 gene, also known as HvBRD2/HvDIM, which is believed to affect plant height and tillering [17].
5. Conclusions
The results of GWAS analysis in barley under a semi-arid climate revealed important genetic markers associated with yield, adaptation, and important agronomic traits such as heading date and plant height. The identification of these markers provides a valuable resource for breeding programs aimed at developing new barley varieties that are better adapted to semi-arid conditions and have improved yield and quality characteristics. The use of these markers in breeding programs can accelerate the development of new varieties, reduce the cost of breeding, and ultimately contribute to sustainable agricultural production in semi-arid regions. In this study, several important loci were identified, especially for heading date and plant height. In barley breeding, the development of reduced plant height varieties with short growing cycles has been a significant objective. This has led to the production of cultivars that are suitable for high-density planting and are more resistant to lodging. These traits are particularly important during the grain-filling stage, when the plant requires adequate photosynthesis and nutrient uptake for optimal yield. However, heat stress can limit photosynthesis and reduce grain yield during this stage, making it challenging for growers to achieve high yields. To mitigate this, we will focus on developing varieties with enhanced heat tolerance and early heading, enabling the crop to flower and set seed before the onset of high temperatures. Through the development of such varieties, barley growers can increase their yields and produce more resilient crops in the face of changing climate conditions.
Author Contributions
Project coordination and phenotypic assessment and statistical analysis of data: S.M. Reviewing and editing the manuscript: M.B.Y. All authors have read and agreed to the published version of the manuscript.
Funding
This study was supported by a research grant from The Institution of Agricultural Research and Higher Education, Tunisia (IRESA) in the frame of the Agricultural Research in the Mediterranean Network (ARIMNET II) research program.
Data Availability Statement
The datasets used and analyzed during the current study can be found in the field crops laboratory, INRAT and available from the corresponding author on request.
Acknowledgments
We thank the Technical Support Section of the INRAT research station for the field management and soil preparation.
Conflicts of Interest
The authors declare no conflict of interest.
References
- Mayer, K.F.; Waugh, R.; Langridge, P.; Close, T.J.; Wise, R.P.; Graner, A.; Matsumoto, T.; Sato, K.; Schulman, A.; Muehlbauer, G.J.; et al. A Physical, Genetic and Functional Sequence Assembly of the Barley Genome. Nature 2012, 491, 711–716. [Google Scholar] [PubMed]
- Van Dijk, M.; Morley, T.; Rau, M.L.; Saghai, Y. A Meta-Analysis of Projected Global Food Demand and Population at Risk of Hunger for the Period 2010–2050. Nat. Food 2021, 2, 494–501. [Google Scholar] [CrossRef]
- Salem, M. Genotype by Environment Interactions for Yield-Related Traits in Tunisian Barley (Hordeum vulgare L.) Accessions under a Semiarid Climate. Acta Agrobot. 2020, 73, 7344. [Google Scholar] [CrossRef]
- Yang, C.Y.; Fraga, H.; van Ieperen, W.; Trindade, H.; Santos, J.A. Effects of Climate Change and Adaptation Options on Winter Wheat Yield under Rainfed Mediterranean Conditions in Southern Portugal. Clim. Chang. 2019, 154, 159–178. [Google Scholar] [CrossRef]
- Yu, H.T.; Hao, Y.C.; Li, M.Y.; Dong, L.H.; Che, N.X.; Wang, L.J.; Song, S.; Liu, Y.A.; Kong, L.R.; Shi, S.B. Genetic Architecture and Candidate Gene Identification for Grain Size in Bread Wheat by Gwas. Front. Plant Sci. 2022, 13, 4816. [Google Scholar] [CrossRef] [PubMed]
- Dharmateja, P.; Yadav, R.; Kumar, M.; Babu, P.; Jain, N.; Mandal, P.K.; Pandey, R.; Shrivastava, M.; Gaikwad, K.B.; Bainsla, N.K.; et al. Genome-Wide Association Studies Reveal Putative Qtls for Physiological Traits under Contrasting Phosphorous Conditions in Wheat (Triticum aestivum L.). Front. Genet. 2022, 13, 267. [Google Scholar] [CrossRef]
- Marzougui, S.; Kharrat, M.; Ben Younes, M. Marker-Trait Associations of Yield Related Traits in Bread Wheat (Triticum aestivum L.) under a Semi-Arid Climate. Czech J. Genet. Plant Breed. 2019, 55, 138–145. [Google Scholar] [CrossRef]
- Li, J.; Yao, X.H.; Yao, Y.H.; An, L.K.; Feng, Z.Y.; Wu, K.L. Genome-Wide Association Mapping of Hulless Barely Phenotypes in Drought Environment. Front. Plant Sci. 2022, 13, 924892. [Google Scholar] [CrossRef]
- Czembor, J.H.; Czembor, E. Genome-Wide Association Study of Agronomic Traits in European Spring Barley from Polish Gene Bank. Agronomy 2022, 12, 2135. [Google Scholar] [CrossRef]
- Aggarwal, S.K.; Malik, P.; Neelam, K.; Kumar, K.; Kaur, R.; Lore, J.S.; Singh, K. Genome-Wide Association Mapping for Identification of Sheath Blight Resistance Loci from Wild Rice Oryza Rufipogon. Euphytica 2022, 218, 144. [Google Scholar] [CrossRef]
- Islam, A.S.M.F.; Mustahsan, W.; Tabien, R.; Awika, J.M.; Septiningsih, E.M.; Thomson, M.J. Thomson. Identifying the Genetic Basis of Mineral Elements in Rice Grain Using Genome-Wide Association Mapping. Genes 2022, 13, 2330. [Google Scholar] [CrossRef] [PubMed]
- Dang, V.H.; Hill, C.B.; Zhang, X.Q.; Angessa, T.T.; Mcfawn, L.A.; Li, C.D. Multi-Locus Genome-Wide Association Studies Reveal Novel Alleles for Flowering Time under Vernalisation and Extended Photoperiod in a Barley Magic Population. Theor. Appl. Genet. 2022, 135, 3087–3102. [Google Scholar] [CrossRef] [PubMed]
- Zanke, C.; Ling, J.; Plieske, J.; Kollers, S.; Ebmeyer, E.; Korzun, V.; Argillier, O.; Stiewe, G.; Hinze, M.; Beier, S.; et al. Genetic Architecture of Main Effect Qtl for Heading Date in European Winter Wheat. Front. Plant Sci. 2014, 5, 217. [Google Scholar] [CrossRef] [PubMed]
- Li, Z.Y.; Lhundrup, N.; Guo, G.G.; Dol, K.; Chen, P.P.; Gao, L.Y.; Chemi, W.; Zhang, J.; Wang, J.K.; Nyema, T.; et al. Characterization of Genetic Diversity and Genome-Wide Association Mapping of Three Agronomic Traits in Qingke Barley (Hordeum vulgare L.) in the Qinghai-Tibet Plateau. Front. Genet. 2020, 11, 638. [Google Scholar] [CrossRef]
- Koochakpour, Z.; Solouki, M.; Fakheri, B.A.; Aghnoum, R.; Nezhad, N.M. Genome Wide Association Analysis of Plant Height, Spike and Awn Length in Barley (Hordeum vulgare L.) Exposed to Mn Stress. J. Anim. Plant Sci. 2020, 30, 384–390. [Google Scholar]
- Kumbhar, F.; Bian, J.X.; Sial, T.A.; Lahori, A.H.; Xi, C.; Nie, X.J.; Channa, S.A.; Song, W.N. Qtl Mapping of Plant Height, Spike Length, Peduncle Length and Number of Grains Per Plant in Barley (Hordeum vulgare L.) Using ‘Steptoe/Morex’ Dh Population Grown in Northwest of China. Pak. J. Bot. 2018, 50, 2205–2214. [Google Scholar]
- Alqudah, A.M.; Koppolu, R.; Wolde, G.M.; Graner, A.; Schnurbusch, T. The Genetic Architecture of Barley Plant Stature. Front. Genet. 2016, 7, 117. [Google Scholar] [CrossRef]
- Abou-Elwafa, S.F. Association Mapping for Yield and Yield-Contributing Traits in Barley under Drought Conditions with Genome-Based Ssr Markers. Comptes Rendus Biol. 2016, 339, 153–162. [Google Scholar] [CrossRef] [PubMed]
- Verma, S.; Yashveer, S.; Rehman, S.; Gyawali, S.; Kumar, Y.; Chao, S.M.; Sarker, A.; Verma, R.P.S. Genetic and Agro-Morphological Diversity in Global Barley (Hordeum vulgare L.) Collection at Icarda. Genet. Resour. Crop Evol. 2021, 68, 1315–1330. [Google Scholar] [CrossRef]
- Turner, A.; Beales, J.; Faure, S.; Dunford, R.P.; Laurie, D.A. The Pseudo-Response Regulator Ppd-H1 Provides Adaptation to Photoperiod in Barley. Science 2005, 310, 1031–1034. [Google Scholar] [CrossRef]
- Faure, S.; Higgins, J.; Turner, A.; Laurie, D.A. The Flowering Locus T-Like Gene Family in Barley (Hordeum vulgare). Genetics 2007, 176, 599–609. [Google Scholar] [CrossRef] [PubMed]
- Campoli, C.; Drosse, B.; Searle, I.; Coupland, G.; von Korff, M. Functional Characterisation of Hvco1, the Barley (Hordeum Vulgare) Flowering Time Ortholog of Constans. Plant J. 2012, 69, 868–880. [Google Scholar] [CrossRef] [PubMed]
- Comadran, J.; Kilian, B.; Russell, J.; Ramsay, L.; Stein, N.; Ganal, M.; Shaw, P.; Bayer, M.; Thomas, W.; Marshall, D.; et al. Natural Variation in a Homolog of Antirrhinum Centroradialis Contributed to Spring Growth Habit and Environmental Adaptation in Cultivated Barley. Nat. Genet. 2012, 44, 1388–1392. [Google Scholar] [CrossRef] [PubMed]
- Trevaskis, B.; Bagnall, D.J.; Ellis, M.H.; Peacock, W.J.; Dennis, E.S. Mads Box Genes Control Vernalization-Induced Flowering in Cereals. Proc. Natl. Acad. Sci. USA 2003, 100, 13099–13104. [Google Scholar] [CrossRef] [PubMed]
- Trevaskis, B.; Hemming, M.N.; Dennis, E.S.; Peacock, W.J. The Molecular Basis of Vernalization-Induced Flowering in Cereals. Trends Plant Sci. 2007, 12, 352–357. [Google Scholar] [CrossRef] [PubMed]
- Yan, L.L.; Loukoianov, A.; Blechl, A.; Tranquilli, G.; Ramakrishna, W.; SanMiguel, P.; Bennetzen, J.L.; Echenique, V.; Dubcovsky, J. The Wheat Vrn2 Gene Is a Flowering Repressor Down-Regulated by Vernalization. Science 2004, 303, 1640–1644. [Google Scholar] [CrossRef]
- Hemming, M.N.; Peacock, W.J.; Dennis, E.S.; Trevaskis, B. Low-Temperature and Daylength Cues Are Integrated to Regulate Flowering Locus T in Barley. Plant Physiol. 2008, 147, 355–366. [Google Scholar] [CrossRef]
- Yan, L.; Fu, D.; Li, C.; Blechl, A.; Tranquilli, G.; Bonafede, M.; Sanchez, A.; Valarik, M.; Yasuda, S.; Dubcovsky, J. The Wheat and Barley Vernalization Gene Vrn3 Is an Orthologue of Ft. Proc. Natl. Acad. Sci. USA 2006, 103, 19581–19586. [Google Scholar] [CrossRef]
- Kandemir, N.; Saygili, I.; Sonmezoglu, O.A.; Yildirim, A. Evaluation of Barley Semi-Dwarf Allele Sdw1.D in a near Isogenic Line. Euphytica 2022, 218, 31. [Google Scholar] [CrossRef]
- Kuczynska, A.; Surma, M.; Adamski, T.; Mikolajczak, K.; Krystkowiak, K.; Ogrodowicz, P. Effects of the Semi-Dwarfing Sdw1/Denso Gene in Barley. J. Appl. Genet. 2013, 54, 381–390. [Google Scholar] [CrossRef]
- Pasam, R.K.; Sharma, R.; Malosetti, M.; van Eeuwijk, F.A.; Haseneyer, G.; Kilian, B.; Graner, A. Genome-Wide Association Studies for Agronomical Traits in a World Wide Spring Barley Collection. BMC Plant Biol. 2012, 12, 16. [Google Scholar] [CrossRef] [PubMed]
- Rebetzke, G.J.; Bonnett, D.G.; Reynolds, M.P. Awns Reduce Grain Number to Increase Grain Size and Harvestable Yield in Irrigated and Rainfed Spring Wheat. J. Exp. Bot. 2016, 67, 2573–2586. [Google Scholar] [CrossRef] [PubMed]
- Abebe, T.; Wise, R.P.; Skadsen, R.W. Comparative Transcriptional Profiling Established the Awn as the Major Photosynthetic Organ of the Barley Spike While the Lemma and the Palea Primarily Protect the Seed. Plant Genome 2009, 2, 247–259. [Google Scholar] [CrossRef]
- Chen, G.D.; Li, H.B.; Zheng, Z.; Wei, Y.M.; Zheng, Y.L.; McIntyre, C.L.; Zhou, M.X.; Liu, C.J. Characterization of a Qtl Affecting Spike Morphology on the Long Arm of Chromosome 3h in Barley (Hordeum vulgare L.) Based on near Isogenic Lines and a Nil-Derived Population. Theor. Appl. Genet. 2012, 125, 1385–1392. [Google Scholar] [CrossRef]
- Sun, D.F.; Ren, W.B.; Sun, G.L.; Peng, J.H. Molecular Diversity and Association Mapping of Quantitative Traits in Tibetan Wild and Worldwide Originated Barley (Hordeum vulgare L.) Germplasm. Euphytica 2011, 178, 31–43. [Google Scholar] [CrossRef]
- Wang, J.M.; Yang, J.M.; McNeil, D.L.; Zhou, M.X. Identification and Molecular Mapping of a Dwarfing Gene in Barley (Hordeum vulgare L.) and Its Correlation with Other Agronomic Traits. Euphytica 2010, 175, 331–342. [Google Scholar] [CrossRef]
- Ginestet, C. Ggplot2: Elegant Graphics for Data Analysis. J. R. Stat. Soc. Ser. Stat. Soc. 2011, 174, 245–246. [Google Scholar] [CrossRef]
- Olivoto, T.; Lucio, A.D. Metan: An R Package for Multi-Environment Trial Analysis. Methods Ecol. Evol. 2020, 11, 783–789. [Google Scholar] [CrossRef]
- Wang, J.B.; Zhang, Z.W. Gapit Version 3: Boosting Power and Accuracy for Genomic Association and Prediction. Genom. Proteom. Bioinform. 2021, 19, 629–640. [Google Scholar] [CrossRef] [PubMed]
- Huang, M.; Liu, X.L.; Zhou, Y.; Summers, R.M.; Zhang, Z.W. Blink: A Package for the Next Level of Genome-Wide Association Studies with Both Individuals and Markers in the Millions. Gigascience 2019, 8, giy154. [Google Scholar] [CrossRef]
- Price, A.L.; Patterson, N.J.; Plenge, R.M.; Weinblatt, M.E.; Shadick, N.A.; Reich, D. Principal Components Analysis Corrects for Stratification in Genome-Wide Association Studies. Nat. Genet. 2006, 38, 904–909. [Google Scholar] [CrossRef]
- Muhammad, R.W.; Qayyum, A.; Liaqat, S.; Hamza, A.; Yousaf, M.M.; Ahmad, B.; Shah, J.; Hussain, M.; Ahsan, A.N.; Qurashi, S.H.; et al. Variability, Heritability and Genetic Advance for Some Yield and Yield Related Traits in Barley (Hordeum vulgare L.) Genotypes in Arid Conditions. J. Food Agric. Environ. 2012, 10, 626–629. [Google Scholar]
- Amiruzzaman, M.; Bhuiyan, M.S.A.; Uddin, M.S. Heterosis and Genetic Variability in Relation to Genetic Divergence in Barley (Hordeum vulgare L.). Bangladesh J. Bot. 2003, 32, 33–37. [Google Scholar]
- Eltaher, S.; Baenziger, P.S.; Belamkar, V.; Emara, H.A.; Nower, A.A.; Salem, K.F.M.; Alqudah, A.M.; Sallam, A. Gwas Revealed Effect of Genotype X Environment Interactions for Grain Yield of Nebraska Winter Wheat. Bmc Genom. 2021, 22, 2. [Google Scholar] [CrossRef]
- Bertero, H.D.; de la Vega, A.J.; Correa, G.; Jacobsen, S.E.; Mujica, A. Genotype and Genotype-by-Environment Interaction Effects for Grain Yield and Grain Size of Quinoa (Chenopodium Quinoa Willd.) as Revealed by Pattern Analysis of International Multi-Environment Trials. Field Crop. Res. 2004, 89, 299–318. [Google Scholar] [CrossRef]
- Eltaher, S.; Sallam, A.; Emara, H.A.; Nower, A.A.; Salem, K.F.M.; Borner, A.; Baenziger, P.S.; Mourad, A.M.I. Genome-Wide Association Mapping Revealed Snp Alleles Associated with Spike Traits in Wheat. Agronomy 2022, 12, 1469. [Google Scholar] [CrossRef]
- Bai, Y.X.; Zhao, X.H.; Yao, X.H.; Yao, Y.H.; An, L.K.; Li, X.; Wang, Y.; Gao, X.; Jia, Y.T.; Guan, L.L.; et al. Genome Wide Association Study of Plant Height and Tiller Number in Hulless Barley. PLoS ONE 2021, 16, e0260723. [Google Scholar] [CrossRef] [PubMed]
- Waugh, R.; Jannink, J.L.; Muehlbauer, G.J.; Ramsay, L. The Emergence of Whole Genome Association Scans in Barley. Curr. Opin. Plant Biol. 2009, 12, 218–222. [Google Scholar] [CrossRef] [PubMed]
- Alghabari, F.; Ihsan, M.Z. Effects of Drought Stress on Growth, Grain Filling Duration, Yield and Quality Attributes of Barley (Hordeum vulgare L.). Bangladesh J. Bot. 2018, 47, 421–428. [Google Scholar] [CrossRef]
- Borner, A.; Buck-Sorlin, G.H.; Hayes, P.M.; Malyshev, S.; Korzun, V. Molecular Mapping of Major Genes and Quantitative Trait Loci Determining Flowering Time in Response to Photoperiod in Barley. Plant Breed. 2002, 121, 129–132. [Google Scholar] [CrossRef]
- Jones, H.; Leigh, F.J.; Mackay, I.; Bower, M.A.; Smith, L.M.J.; Charles, M.P.; Jones, G.; Jones, M.K.; Brown, T.A.; Powell, W. Population-Based Resequencing Reveals That the Flowering Time Adaptation of Cultivated Barley Originated East of the Fertile Crescent. Mol. Biol. Evol. 2008, 25, 2211–2219. [Google Scholar] [CrossRef] [PubMed]
- Von Korff, M.; Leon, J.; Pillen, K. Detection of Epistatic Interactions between Exotic Alleles Introgressed from Wild Barley (H. vulgare ssp. spontaneum). Theor. Appl. Genet. 2010, 121, 1455–1464. [Google Scholar] [CrossRef] [PubMed]
- Borras-Gelonch, G.; Slafer, G.A.; Casas, A.M.; van Eeuwijk, F.; Romagosa, I. Genetic Control of Pre-Heading Phases and Other Traits Related to Development in a Double-Haploid Barley (Hordeum vulgare L.) Population. Field Crop. Res. 2010, 119, 36–47. [Google Scholar] [CrossRef]
- Eleuch, L.; Jilal, A.; Grando, S.; Ceccarelli, S.; Schmising, M.V.; Tsujimoto, H.; Hajer, A.; Daaloul, A.; Baum, M. Genetic Diversity and Association Analysis for Salinity Tolerance, Heading Date and Plant Height of Barley Germplasm Using Simple Sequence Repeat Markers. J. Integr. Plant Biol. 2008, 50, 1004–1014. [Google Scholar] [CrossRef]
- Chen, A.; Baumann, U.; Fincher, G.B.; Collins, N.C. Flt-2l, a Locus in Barley Controlling Flowering Time, Spike Density, and Plant Height. Funct. Integr. Genom. 2009, 9, 243–254. [Google Scholar] [CrossRef]
- Kikuchi, R.; Kawahigashi, H.; Ando, T.; Tonooka, T.; Handa, H. Molecular and Functional Characterization of Pebp Genes in Barley Reveal the Diversification of Their Roles in Flowering. Plant Physiol. 2009, 149, 1341–1353. [Google Scholar] [CrossRef]
- Dunford, R.P.; Griffiths, S.; Christodoulou, V.; Laurie, D.A. Characterisation of a Barley (Hordeum vulgare L.) Homologue of the Arabidopsis Flowering Time Regulator Gigantea. Theor. Appl. Genet. 2005, 110, 925–931. [Google Scholar] [CrossRef]
- Alqudah, A.M.; Sharma, R.; Pasam, R.K.; Graner, A.; Kilian, B.; Schnurbusch, T. Genetic Dissection of Photoperiod Response Based on Gwas of Pre-Anthesis Phase Duration in Spring Barley. PLoS ONE 2014, 9, e113120. [Google Scholar] [CrossRef]
- Fu, D.L.; Szucs, P.; Yan, L.L.; Helguera, M.; Skinner, J.S.; von Zitzewitz, J.; Hayes, P.M.; Dubcovsky, J. Large Deletions within the First Intron in Vrn-1 Are Associated with Spring Growth Habit in Barley and Wheat. Mol. Genet. Genom. 2005, 273, 54–65. [Google Scholar] [CrossRef] [PubMed]
- Al-Ajlouni, Z.I.; Al-Abdallat, A.M.; Al-Ghzawi, A.L.A.; Ayad, J.Y.; Abu Elenein, J.M.; Al-Quraan, N.A.; Baenziger, P.S. Impact of Pre-Anthesis Water Deficit on Yield and Yield Components in Barley (Hordeum vulgare L.) Plants Grown under Controlled Conditions. Agronomy 2016, 6, 33. [Google Scholar] [CrossRef]
- Distelfeld, A.; Korol, A.; Dubcovsky, J.; Uauy, C.; Blake, T.; Fahima, T. Colinearity between the Barley Grain Protein Content (Gpc) Qtl on Chromosome Arm 6hs and the Wheat Gpc-B1 Region. Mol. Breed. 2008, 22, 25–38. [Google Scholar] [CrossRef]
- Griffiths, S.; Dunford, R.P.; Coupland, G.; Laurie, D.A. The Evolution of Constans-Like Gene Families in Barley, Rice, and Arabidopsis. Plant Physiol. 2003, 131, 1855–1867. [Google Scholar] [CrossRef]
- Javadi, S.M.; Shobbar, Z.S.; Ebrahimi, A.; Shahbazi, M. New Insights on Key Genes Involved in Drought Stress Response of Barley: Gene Networks Reconstruction, Hub, and Promoter Analysis. J. Genet. Eng. Biotechnol. 2021, 19, 2. [Google Scholar] [CrossRef]
- Szucs, P.; Karsai, I.; von Zitzewitz, J.; Meszaros, K.; Cooper, L.L.D.; Gu, Y.Q.; Chen, T.H.H.; Hayes, P.M.; Skinner, J.S. Positional Relationships between Photoperiod Response Qtl and Photoreceptor and Vernalization Genes in Barley. Theor. Appl. Genet. 2006, 112, 1277–1285. [Google Scholar] [CrossRef]
- Abdel-Ghani, A.H.; Sharma, R.; Wabila, C.; Dhanagond, S.; Owais, S.J.; Duwayri, M.A.; Al-Dalain, S.A.; Klukas, C.; Chen, D.J.; Lubberstedt, T.; et al. Genome-Wide Association Mapping in a Diverse Spring Barley Collection Reveals the Presence of Qtl Hotspots and Candidate Genes for Root and Shoot Architecture Traits at Seedling Stage. BMC Plant Biol. 2019, 19, 216. [Google Scholar] [CrossRef]
- Turck, F.; Fornara, F.; Coupland, G. Regulation and Identity of Florigen: Flowering Locus T Moves Center Stage. Annu. Rev. Plant Biol. 2008, 59, 573–594. [Google Scholar] [CrossRef] [PubMed]
- Pham, A.T.; Maurer, A.; Pillen, K.; Brien, C.; Dowling, K.; Berger, B.; Eglinton, J.K.; March, T.J. Genome-Wide Association of Barley Plant Growth under Drought Stress Using a Nested Association Mapping Population. BMC Plant Biol. 2019, 19, 134. [Google Scholar] [CrossRef] [PubMed]
- Chono, M.; Honda, I.; Zeniya, H.; Yoneyama, K.; Saisho, D.; Takeda, K.; Takatsuto, S.; Hoshino, T.; Watanabe, Y. A Semidwarf Phenotype of Barley Uzu Results from a Nucleotide Substitution in the Gene Encoding a Putative Brassinosteroid Receptor. Plant Physiol. 2003, 133, 1209–1219. [Google Scholar] [CrossRef]
- Xu, Y.H.; Jia, Q.J.; Zhou, G.F.; Zhang, X.Q.; Angessa, T.; Broughton, S.; Yan, G.; Zhang, W.Y.; Li, C.D. Characterization of the Sdw1 Semi-Dwarf Gene in Barley. BMC Plant Biol. 2017, 17, 11. [Google Scholar] [CrossRef]
- Liller, C.B.; Walla, A.; Boer, M.P.; Hedley, P.; Macaulay, M.; Effgen, S.; von Korff, M.; van Esse, G.W.; Koornneef, M. Fine Mapping of a Major Qtl for Awn Length in Barley Using a Multiparent Mapping Population. Theor. Appl. Genet. 2017, 130, 269–281. [Google Scholar] [CrossRef] [PubMed]
- Bull, H.; Casao, M.C.; Zwirek, M.; Flavell, A.J.; Thomas, W.T.B.; Guo, W.B.; Zhang, R.X.; Rapazote-Flores, P.; Kyriakidis, S.; Russell, J.; et al. Barley Six-Rowed Spike3 Encodes a Putative Jumonji C-Type H3k9me2/Me3 Demethylase That Represses Lateral Spikelet Fertility. Nat. Commun. 2017, 8, 936. [Google Scholar] [CrossRef] [PubMed]
- Van Esse, G.W.; Walla, A.; Finke, A.; Koornneef, M.; Pecinka, A.; von Korff, M. Six-Rowed Spike3 (Vrs3) Is a Histone Demethylase That Controls Lateral Spikelet Development in Barley. Plant Physiol. 2017, 174, 2397–2408. [Google Scholar] [CrossRef] [PubMed]
- Komatsuda, T.; Pourkheirandish, M.; He, C.F.; Azhaguvel, P.; Kanamori, H.; Perovic, D.; Stein, N.; Graner, A.; Wicker, T.; Tagiri, A.; et al. Six-Rowed Barley Originated from a Mutation in a Homeodomain-Leucine Zipper I-Class Homeobox Gene. Proc. Natl. Acad. Sci. USA 2007, 104, 1424–1429. [Google Scholar] [CrossRef] [PubMed]
Figure 1.
Phylogenetic tree (A), kinship matrix (B) and principal component analysis (C) using 361 barley accessions. Clear structured population according to row type phenotype was observed. 2 rows accessions are in red dots and 6 rows in blue.
Figure 1.
Phylogenetic tree (A), kinship matrix (B) and principal component analysis (C) using 361 barley accessions. Clear structured population according to row type phenotype was observed. 2 rows accessions are in red dots and 6 rows in blue.

Figure 2.
Manhattan plots (left) and quantile–quantile plots (right) of the associated SNP markers with studied traits using BLINK method. The results showed that the BLINK method identified association signals above the Bonferroni threshold (green solid line) and FDR thresholds (green dashed line) (p = 0.01) and (p ≤ 0.05), respectively.


Table 1.
Descriptive statistics of the studied traits combined over three years.
| Traits | Mean | Min. | Max. | σ2g | σ2p | σ2e | GCV | PCV | ECV | H2 | GA |
|---|---|---|---|---|---|---|---|---|---|---|---|
| HD | 130.5 | 110 | 155 | 69 | 74.2 | 5.2 | 6.3 | 6.6 | 1.7 | 0.92 | 16.5 |
| PH | 74 | 40 | 106 | 67 | 99.8 | 32.7 | 11 | 13.4 | 7.7 | 0.67 | 13.8 |
| SL | 7.5 | 4 | 16.2 | 2.9 | 3.6 | 0.7 | 22.8 | 25.4 | 11.2 | 0.80 | 3.1 |
| GPS | 53.7 | 18 | 93 | 524 | 540 | 16.3 | 42.6 | 43.2 | 7.5 | 0.96 | 46 |
| Awl | 11.9 | 0 | 21 | 5 | 6.5 | 1.4 | 19 | 21.4 | 10 | 0.78 | 4.1 |
σ2g: genotypic; σ2p: phenotypic variance; σ2e: environmental variance; GCV: genotypic coefficient of variation; PCV: phenotypic coefficient of variation; ECV: environmental coefficient of variation; H2: broad-sense heritability; GA: genetic advance.
Table 2.
Analysis of variance for studied traits using an additive main effect and multiplicative interaction (AMMI) approach.
Table 2.
Analysis of variance for studied traits using an additive main effect and multiplicative interaction (AMMI) approach.
| Source | ENV | GEN | GEN: ENV | Residuals | Total | %IPC1 | %IPC2 | Variation Explained (%) | |||
|---|---|---|---|---|---|---|---|---|---|---|---|
| Df | 2 | 360 | 720 | 1080 | 2885 | 361 | 359 | ENV | G:E | GEN | |
| Mean Square | HD | 6019.2 *** | 212.3 *** | 11.7 *** | 0.9 | 36.8 | 59.5 | 40.5 | 12.3 | 8.6 | 78 |
| PH | 71976.6 *** | 234.0 *** | 70.8 *** | 6.2 | 117.2 | 51 | 49 | 50.1 | 17.8 | 29.3 | |
| SL | 211.4 * | 9.5 *** | 1.2 *** | 0.3 | 2.1 | 58.1 | 41.9 | 8.3 | 17 | 66.8 | |
| Awl | 757.2 * | 16.7 *** | 2.2 *** | 0.8 | 4 | 57.8 | 42.2 | 15 | 15.7 | 60 | |
| GPS | 7207.2 *** | 1586.5 *** | 35.2 *** | 6.9 | 223.1 | 60.2 | 39.8 | 2.3 | 4.1 | 92.3 | |
All genotype and genotype-by-environment interactions are significant at *** p < 0.001 and * p < 0.05.
Table 3.
List of identified SNP markers associated with evaluated traits.
| Traits | SNP | Chr | Position (bp) | P Value | Effect |
|---|---|---|---|---|---|
| Awl | 12_20326 | 2H | 54584401 | 1.11 × 10⁻⁸ | −0.77 |
| HD | 11_21140 | 1H | 539810979 | 2.27 × 10⁻⁷ | −1.5 |
| 12_30872 | 2H | 29124597 | 3.76 × 10⁻⁶ | 1.32 | |
| SCRI_RS_174077 | 2H | 746743803 | 7.92 × 10⁻⁶ | 1 | |
| SCRI_RS_159598 | 3H | 23309866 | 6.81 × 10⁻⁶ | 1.27 | |
| SCRI_RS_214153 | 5H | 572518499 | 9.79 × 10⁻⁸ | −1.11 | |
| 11_11489 | 5H | 648004337 | 5.49 × 10⁻⁷ | −1.11 | |
| SCRI_RS_209824 | 6H | 30634644 | 2.42 × 10⁻⁷ | 1.1 | |
| SCRI_RS_236959 | 6H | 146371783 | 6.88 × 10⁻⁷ | −1 | |
| SCRI_RS_169904 | 7H | 55242186 | 2.55 × 10⁻⁵ | −1.37 | |
| 12_30026 | 7H | 560756345 | 1.84 × 10⁻⁶ | 1.64 | |
| SCRI_RS_222863 | 7H | 599463445 | 1.30 × 10⁻⁸ | −1.44 | |
| SCRI_RS_204483 | 7H | 624191837 | 3.38 × 10⁻⁷ | 1.22 | |
| GPS | SCRI_RS_198546 | 1H | 383207519 | 1.00 × 10⁻⁷ | −4.65 |
| 12_30896 | 2H | 652032221 | 1.40 × 10⁻²⁰ | 8.55 | |
| SCRI_RS_170058 | 6H | 123873661 | 3.01 × 10⁻¹⁰ | −3.48 | |
| PH | SCRI_RS_142400 | 2H | 132659897 | 1.89 × 10⁻⁶ | −1.89 |
| SCRI_RS_135355 | 2H | 687098008 | 6.65 × 10⁻⁶ | −1.24 | |
| 12_30921 | 3H | 673188759 | 1.57 × 10⁻⁶ | −1.32 | |
| 11_10639 | 4H | 544748028 | 2.05 × 10⁻⁶ | 1.48 | |
| SCRI_RS_154574 | 6H | 17007008 | 3.78 × 10⁻⁹ | −1.7 | |
| SCRI_RS_168494 | 7H | 60197487 | 1.62 × 10⁻⁷ | −1.8 | |
| SL | SCRI_RS_826 | 3H | 590142670 | 5.66 × 10⁻⁷ | 0.32 |
| SCRI_RS_198005 | 7H | 647499514 | 1.70 × 10⁻⁶ | 0.43 |
Disclaimer/Publisher’s Note: The statements, opinions and data contained in all publications are solely those of the individual author(s) and contributor(s) and not of MDPI and/or the editor(s). MDPI and/or the editor(s) disclaim responsibility for any injury to people or property resulting from any ideas, methods, instructions or products referred to in the content. |
© 2023 by the authors. Licensee MDPI, Basel, Switzerland. This article is an open access article distributed under the terms and conditions of the Creative Commons Attribution (CC BY) license (https://creativecommons.org/licenses/by/4.0/).
Share and Cite
MDPI and ACS Style
Marzougui, S.; Ben Younes, M. Marker-Trait Associations of Agronomic Traits in Barley (Hordeum vulgare L.) under Semi-Arid Conditions. Agronomy 2023, 13, 2804. https://doi.org/10.3390/agronomy13112804
AMA Style
Marzougui S, Ben Younes M. Marker-Trait Associations of Agronomic Traits in Barley (Hordeum vulgare L.) under Semi-Arid Conditions. Agronomy. 2023; 13(11):2804. https://doi.org/10.3390/agronomy13112804
Chicago/Turabian StyleMarzougui, Salem, and Mongi Ben Younes. 2023. "Marker-Trait Associations of Agronomic Traits in Barley (Hordeum vulgare L.) under Semi-Arid Conditions" Agronomy 13, no. 11: 2804. https://doi.org/10.3390/agronomy13112804
Note that from the first issue of 2016, this journal uses article numbers instead of page numbers. See further details here.