1. Introduction
Agrifood systems consume about 30% of the world’s energy, having increased by 20% between 2000 and 2018 [
1]. They also account for 20% of greenhouse gas emissions [
2]. These figures are expected to continue rising as the world’s population is predicted to reach well over 9 billion by 2050 [
3]. The agrifood industry plays a major role in this consumption.
In the European Union, the agrifood industry represents more than 15% of the total turnover of the manufacturing industry, with a value of more than EUR 1.2 trillion and EUR 250,000,000 of added value [
4], and its energy consumption accounts for more than 10% of the industrial total [
5].
In some countries, the agrifood industry is the main sector of the manufacturing industry, as is the case in Spain, where it represents 23.3% of the industrial sector’s GDP [
6], with a turnover amounting to EUR 130,795.8 M, and it also employs roughly 500,000 people. As a result, the Spanish food and beverage industry was responsible for the highest industrial energy consumption in 2019, with 18.5%, more than EUR 2 billion [
7]. The sector’s high consumption of electrical energy stands out, with almost 60% of the total, exceeding 90% in some agroindustries, such as wineries.
The agroindustrial sector faces two major energy challenges. Firstly, it shows a noticeable seasonality in many sub-sectors, usually in agricultural production. Secondly, the recent increase in electricity and gas prices, aggravated by the conflict in Ukraine, has led to a significant rise in supply bills for a large number of agroindustries, limiting their viability and competitiveness.
The European Union has implemented measures aimed at decreasing prices, but the outcome did not turn out as expected. Using the data of a marketing company for high-voltage supply in Spain as a reference, the price of energy has tripled in just over a year, jumping from an average value of 0.082 EUR/kWh in May 2021 to 0.25 EUR/kWh in January 2023 between the two pricing periods [
8]. The above-mentioned conflict and Europe’s dependence on Russian gas are expected to keep prices on the rise over the coming years. Prompt adaptation to the new context will, therefore, be crucial to maintain the competitiveness of many companies.
Among the measures to improve efficiency and reduce energy bills, photovoltaic installations play a predominant role as an environmentally friendly energy source [
9,
10,
11]. According to Eurostat data, in the EU, the electrical capacity of solar photovoltaics was 700 times higher in 2019 than in 2000. In 2021, installed capacity was close to 160 GW, increasing by 41.4 GW in 2022. This significant increase is largely due to the enormous drop in the cost of panels and other components, with final prices of less than EUR 1/Wp being achieved in industrial installations. In addition, since 2021, many industries have been forced to urgently install photovoltaic systems to offset the increase in the cost of electricity.
Recent articles making significant contributions to scientific knowledge can be found in the literature. However, mostly, they focus on just one factor. The viability of photovoltaic energy has been studied in buildings associated with the agrifood industry, such as farmers’ households [
12], an industrial process [
13], a specific location [
14] or a specific type of industry, namely: wine [
15,
16,
17], dairy [
18], olive [
19,
20], animal production [
21] and fruit and vegetable production, such as apples and peaches [
22], lettuce [
23], celery [
24] or tomato [
25], among others.
The implementation of photovoltaics in agroindustries faces the problem of the wide range of existing cases, with radically different consumption patterns and noticeable seasonality in some of them. The criteria for sizing and profitability in some agroindustries cannot be extrapolated to the rest. Furthermore, the aforementioned bibliography is, to some extent, obsolete in the new energy context.
Therefore, this paper studies industries from various sub-sectors (wineries, olive mills, feed factories and fruits and vegetables plants) representative of the broad spectrum of existing industries, with radically different consumption patterns. A wide range of energy prices (past, present, and future) and radiation levels were analysed as well.
The sectors studied, although having very different energy consumption patterns, are of great economic importance. Thus, for instance, the fruit and vegetable, olive, wine and animal feed sectors in Spain had production values in 2020 of EUR 15,188 M, EUR 5510 M, EUR 5328 M and EUR 14,219 M (2019), respectively [
6,
26,
27].
Analysing such different consumption patterns and a wide range of energy prices, this paper provides a global and realistic view of the profitability and optimal sizing of photovoltaic installations in the new energy context. It is intended to answer the question of how much capacity needs to be installed to optimise profitability and savings for agribusinesses, reducing the risk of future energy price fluctuations. This research demonstrates that the adaptation to the new context requires changes in the sizing of PV systems in all the industries analysed, which is also associated with changes in the return on investment. In addition, seasonality strongly conditions the optimal size of PV installations, the return on the investment and the potential savings.
2. Materials and Methods
The selection of the industries analysed was based on the consumption records of several agroindustries from different subsectors available to the work team, thanks to previous projects and advice services. Priority was given to industries with similar annual consumption and heterogeneity of demand patterns.
The calculations were based on software developed in VBA (Visual Basic for Application) that reproduces the billing of energy companies. The tool has a solar calculation module, which quantifies the energy consumed from the grid by comparing the energy demand with the one produced by the PV system. Based on the results of the energy analysis, an economic analysis was carried out considering the lifetime of the PV system.
The study covered locations of very diverse radiation in order to be extrapolated to a large part of the world. Incident radiation under different inclinations has been calculated using EnergyPlus 8.3 software.
In order for the results to serve as a global reference and given the great instability of the current energy context, all the analyses proposed consider a wide range of average values of energy prices, from 0.05 EUR/kWh to 0.50 EUR/kWh, with an interval of 0.05.
2.1. Description of the Scenarios Analysed
The aim of the study was to provide an overview of the feasibility and profitability of photovoltaic systems in agribusinesses. To this end, the results were based on the analysis of 3,840,000 cases, the need for which is justified below. The study focused on the following aspects:
- (a)
Optimal sizing of the installation and profitability of the installation.
Two sizing criteria were analysed:
Maximise savings in energy expenditure over the installation’s useful life. Optimal sizing was considered to be the one that generates the lowest energy bill over the twenty-year lifetime of the installation, adding both the annual electricity bills and the investment and maintenance of the solar system.
Maximise the “Savings/payback” ratio. Uncertainty about possible future energy price variations may justify a more conservative sizing than achieving the maximum potential savings. The “Savings/payback” ratio might be a good reference to carry out a sizing that combines savings and profitability.
A 1% upgrade fee (close to the average yield over the last few months on 20-year bonds of countries such as Germany), a EUR 1500 investment cost per installed peak kW [
28] and 1% of the investment as annual maintenance cost were assumed. In total, 1,680,000 cases were analysed (4 agroindustries × 3 locations × 70 tilts × 10 prices × 200 peak installed power scenarios).
- (b)
Increased profitability assuming the sale of excess production.
The objective is to determine how the sale of excess electricity generated affects the sizing and profitability of the solar system. The sale of excess electricity is a complex issue to analyse, as it presents great differences and legal nuances even within the same country. Thus, for example, there may be unavailability of discharge points on the part of the distribution companies, as the grid nodes are saturated; there may be compensation limitations on the energy consumed in certain periods, etc.
Given the impossibility of dealing with the wide range of existing cases, a simplified best-case study is proposed, assuming that all surpluses can be sold, but at a variable price. Specifically, selling prices from 10% of the purchase price to full compensation of energy produced for energy consumed (100% of the purchase price). In order to make it approachable, the study was limited to an intermediate energy price of 0.25 EUR/kWh, a value close to the current situation in Spain. Hence, 1,680,000 cases were analysed (4 agroindustries × 3 locations × 70 tilts × 10 percentages of excess sales × 200 scenarios of peak installed power).
- (c)
Variations in profitability due to changes in the cost of the solar installation.
Starting from an average price of EUR 1500/kW peak installed, variations in investment cost from EUR 500/kW to EUR 2500/kW were analysed. The same panel tilts optimising the installation in the original scenarios were assumed. In total, there were 480,000 cases (4 agroindustries × 3 locations × 10 prices × 20 investment costs × 200 peak installed power scenarios).
2.2. Industries Analysed
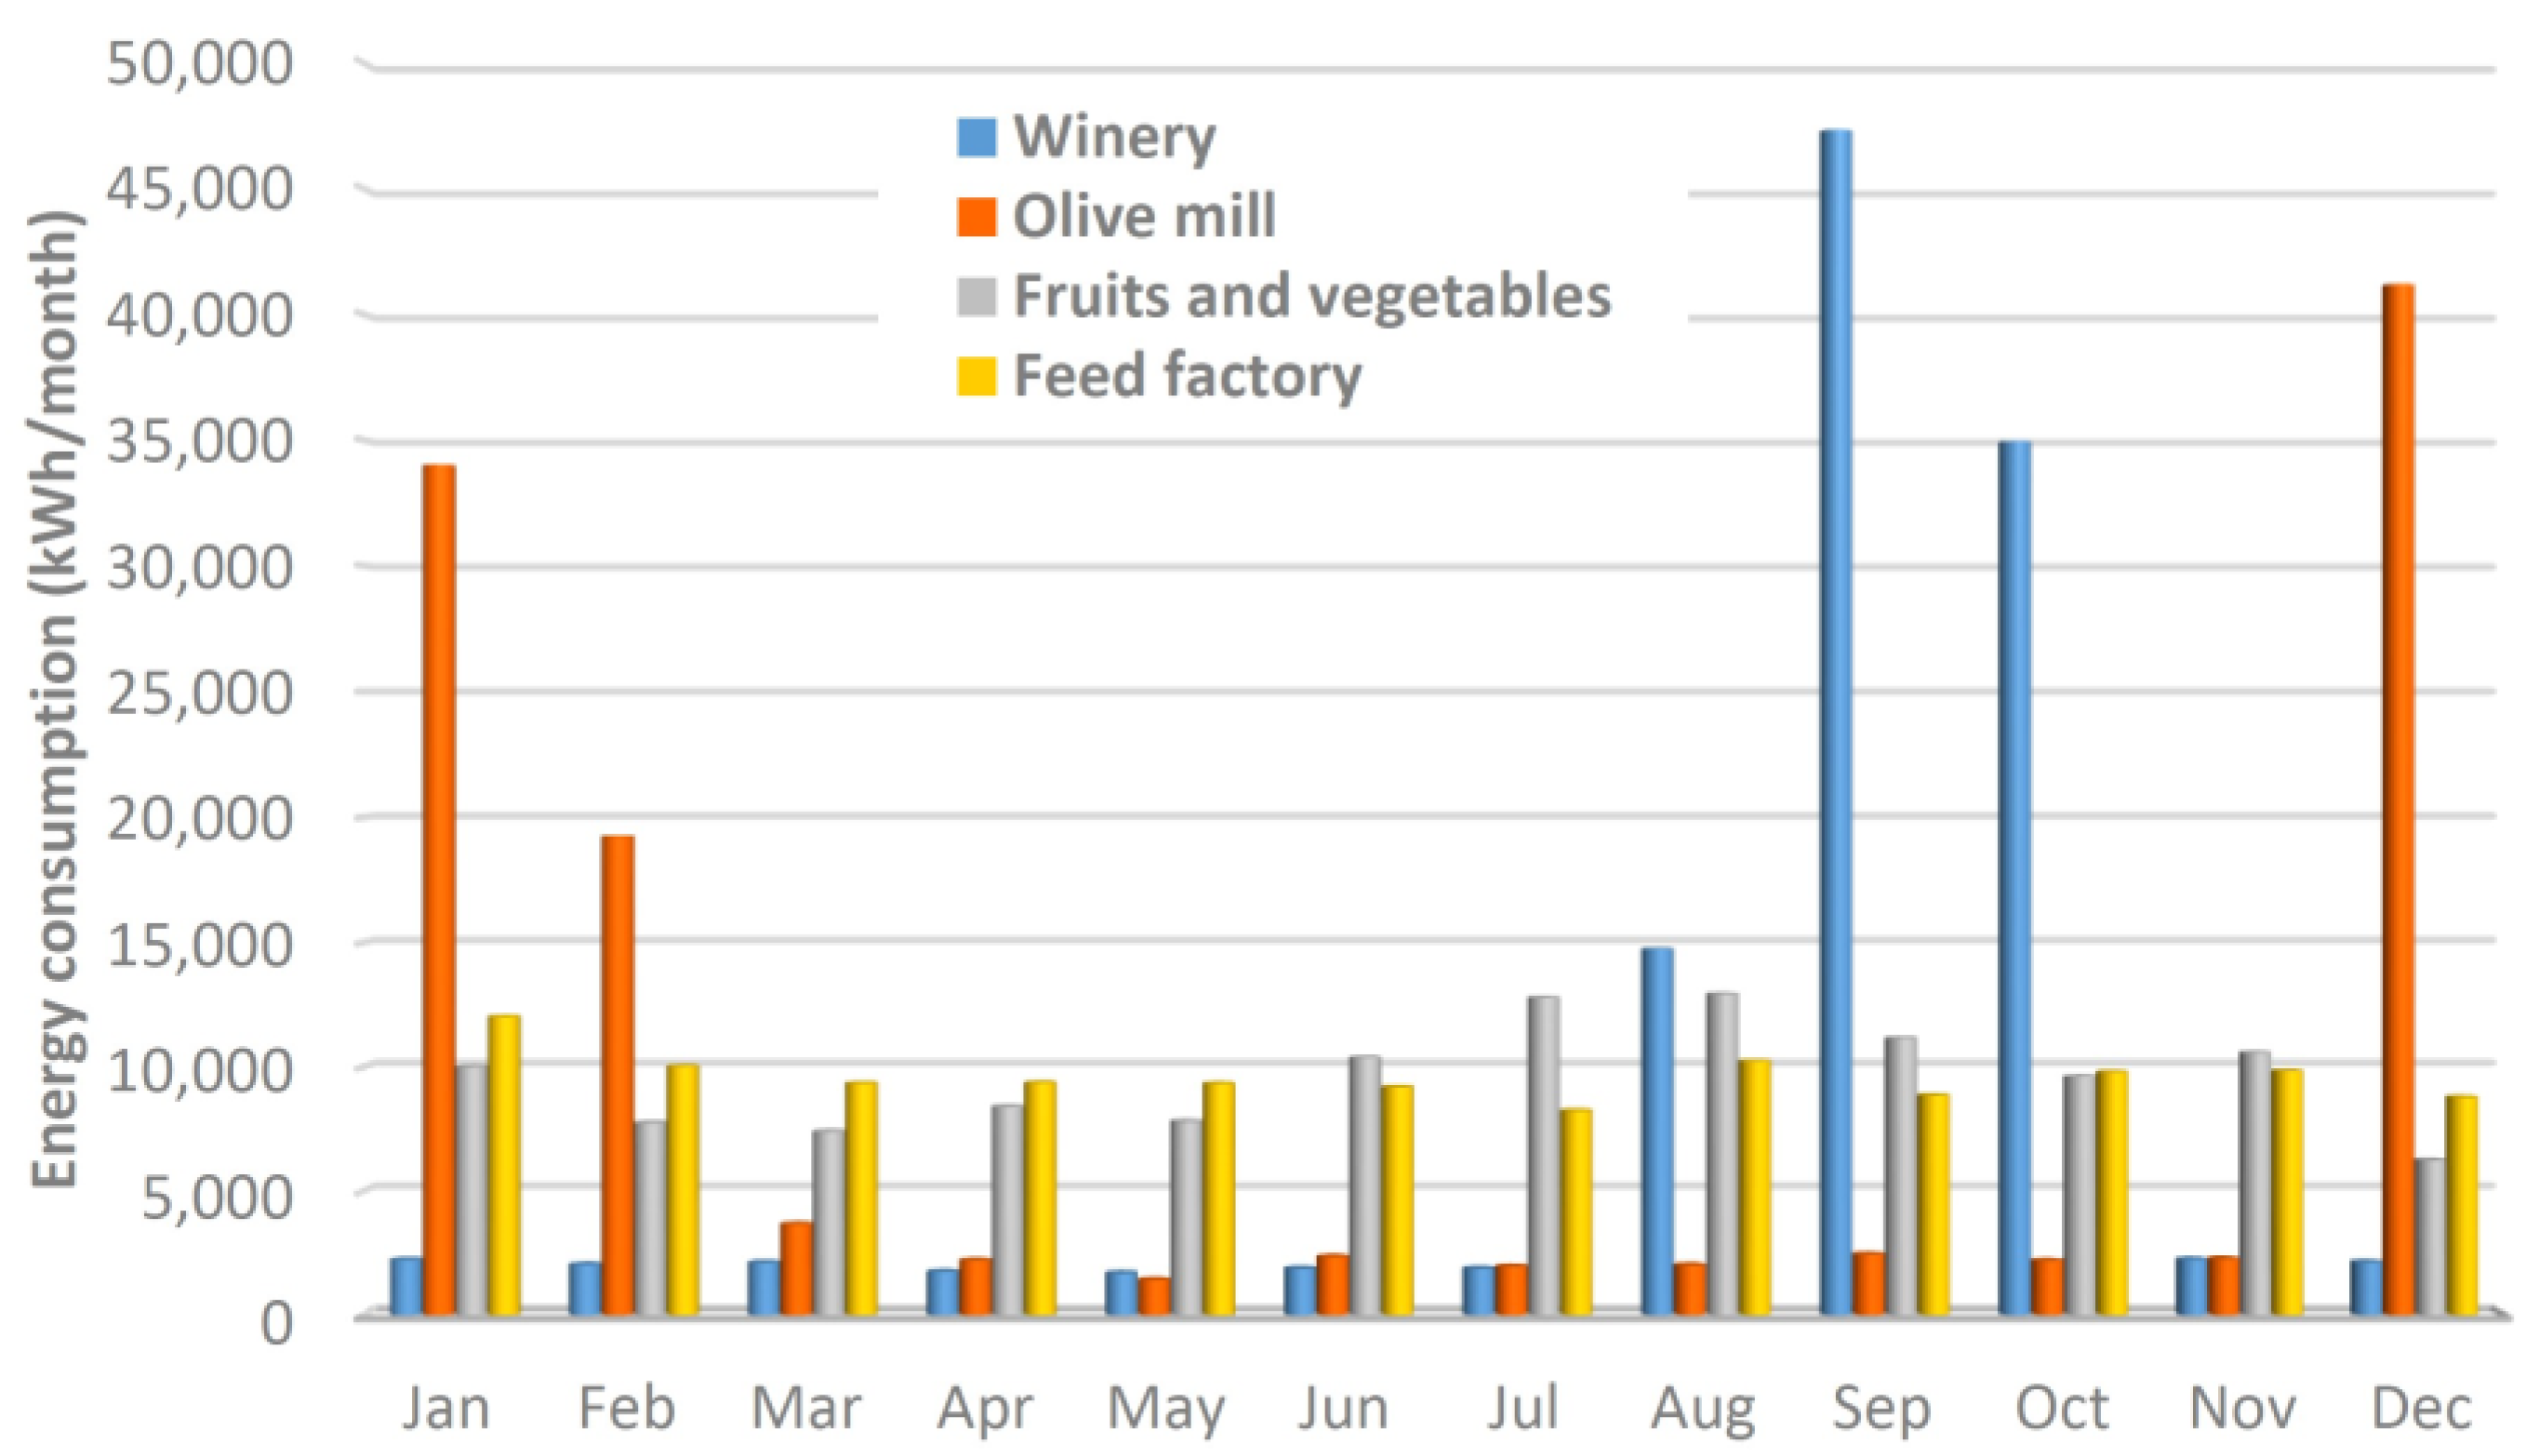
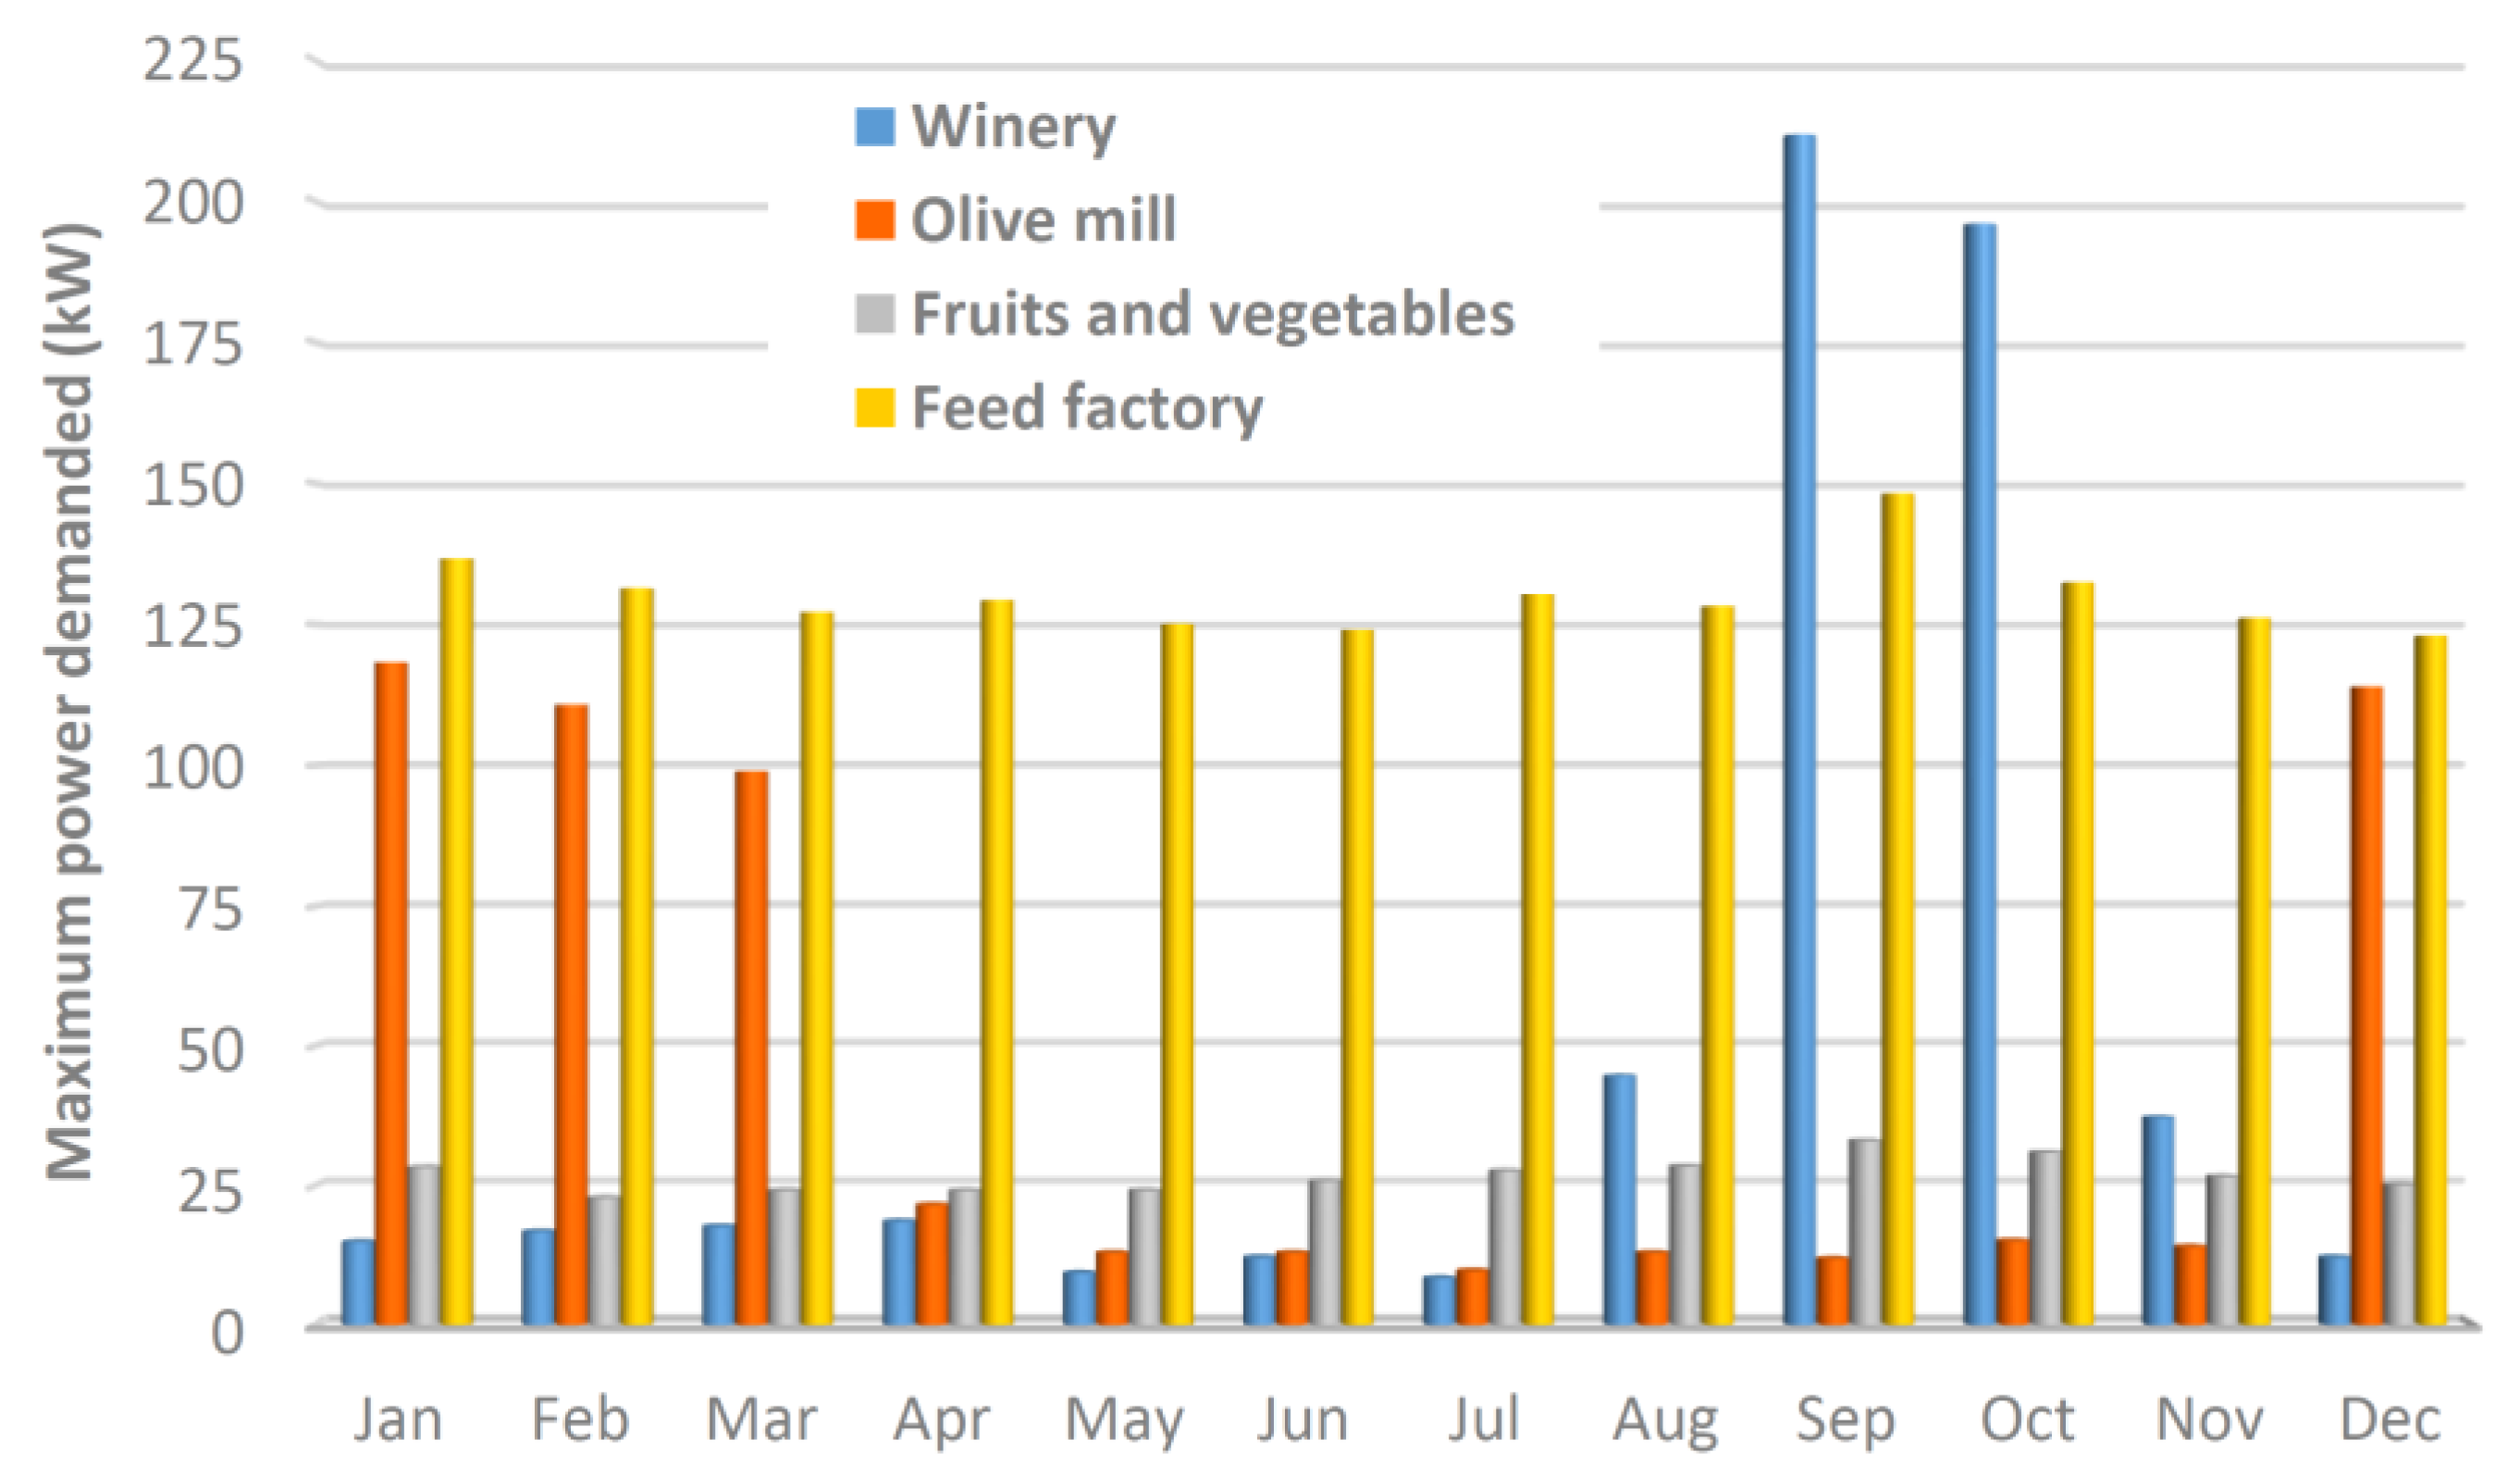
Considering the great variability and seasonality of energy demand in the sector, four real agroindustries have been selected with an annual consumption of around 115,000 kWh, but with very diverse consumption patterns, both in terms of energy consumed (
Figure 1) and power demanded (
Figure 2).
Winery: strong seasonal consumption in summer–autumn, correlating with the grape harvest. Significant peaks in energy and power demanded every day of the week during the campaign. The rest of the year, reduced consumption concentrated on working days.
Olive mill: high seasonal consumption in winter, coinciding with olive harvesting. Significant peaks in energy and power demanded every day of the week during the campaign. The rest of the year, reduced consumption concentrated on working days.
Fruits and vegetables: relatively stable consumption throughout the year, with no major power peaks. The consumption of the refrigeration equipment for the cold rooms stands out every day of the week.
Feed factory: stable consumption throughout the year, with power peaks of limited duration every working day due to the connection of process equipment. Demand is concentrated from Monday to Friday during working hours.
The consumption of these four agroindustries ranges between 106,950 kWh and 123,764 kWh. In order to have the same frame of reference, a small global correction factor was applied (between 0.929 and 1.075, depending on the industry). Each of the 35,040 quarter-hourly consumption data over the year has been multiplied by the same correction factor for each industry to have exactly the same annual consumption. Thus, the annual consumption was unified to 115,000 kWh, maintaining the distribution of consumption and power required by each industry.
The quarter-hourly consumption data have been provided by the industries and partners in previous projects such as TESLA (Transferring Energy Save Laid on Agroindustry) and SCOOPE (Saving COOPerative Energy).
2.3. Irradiance
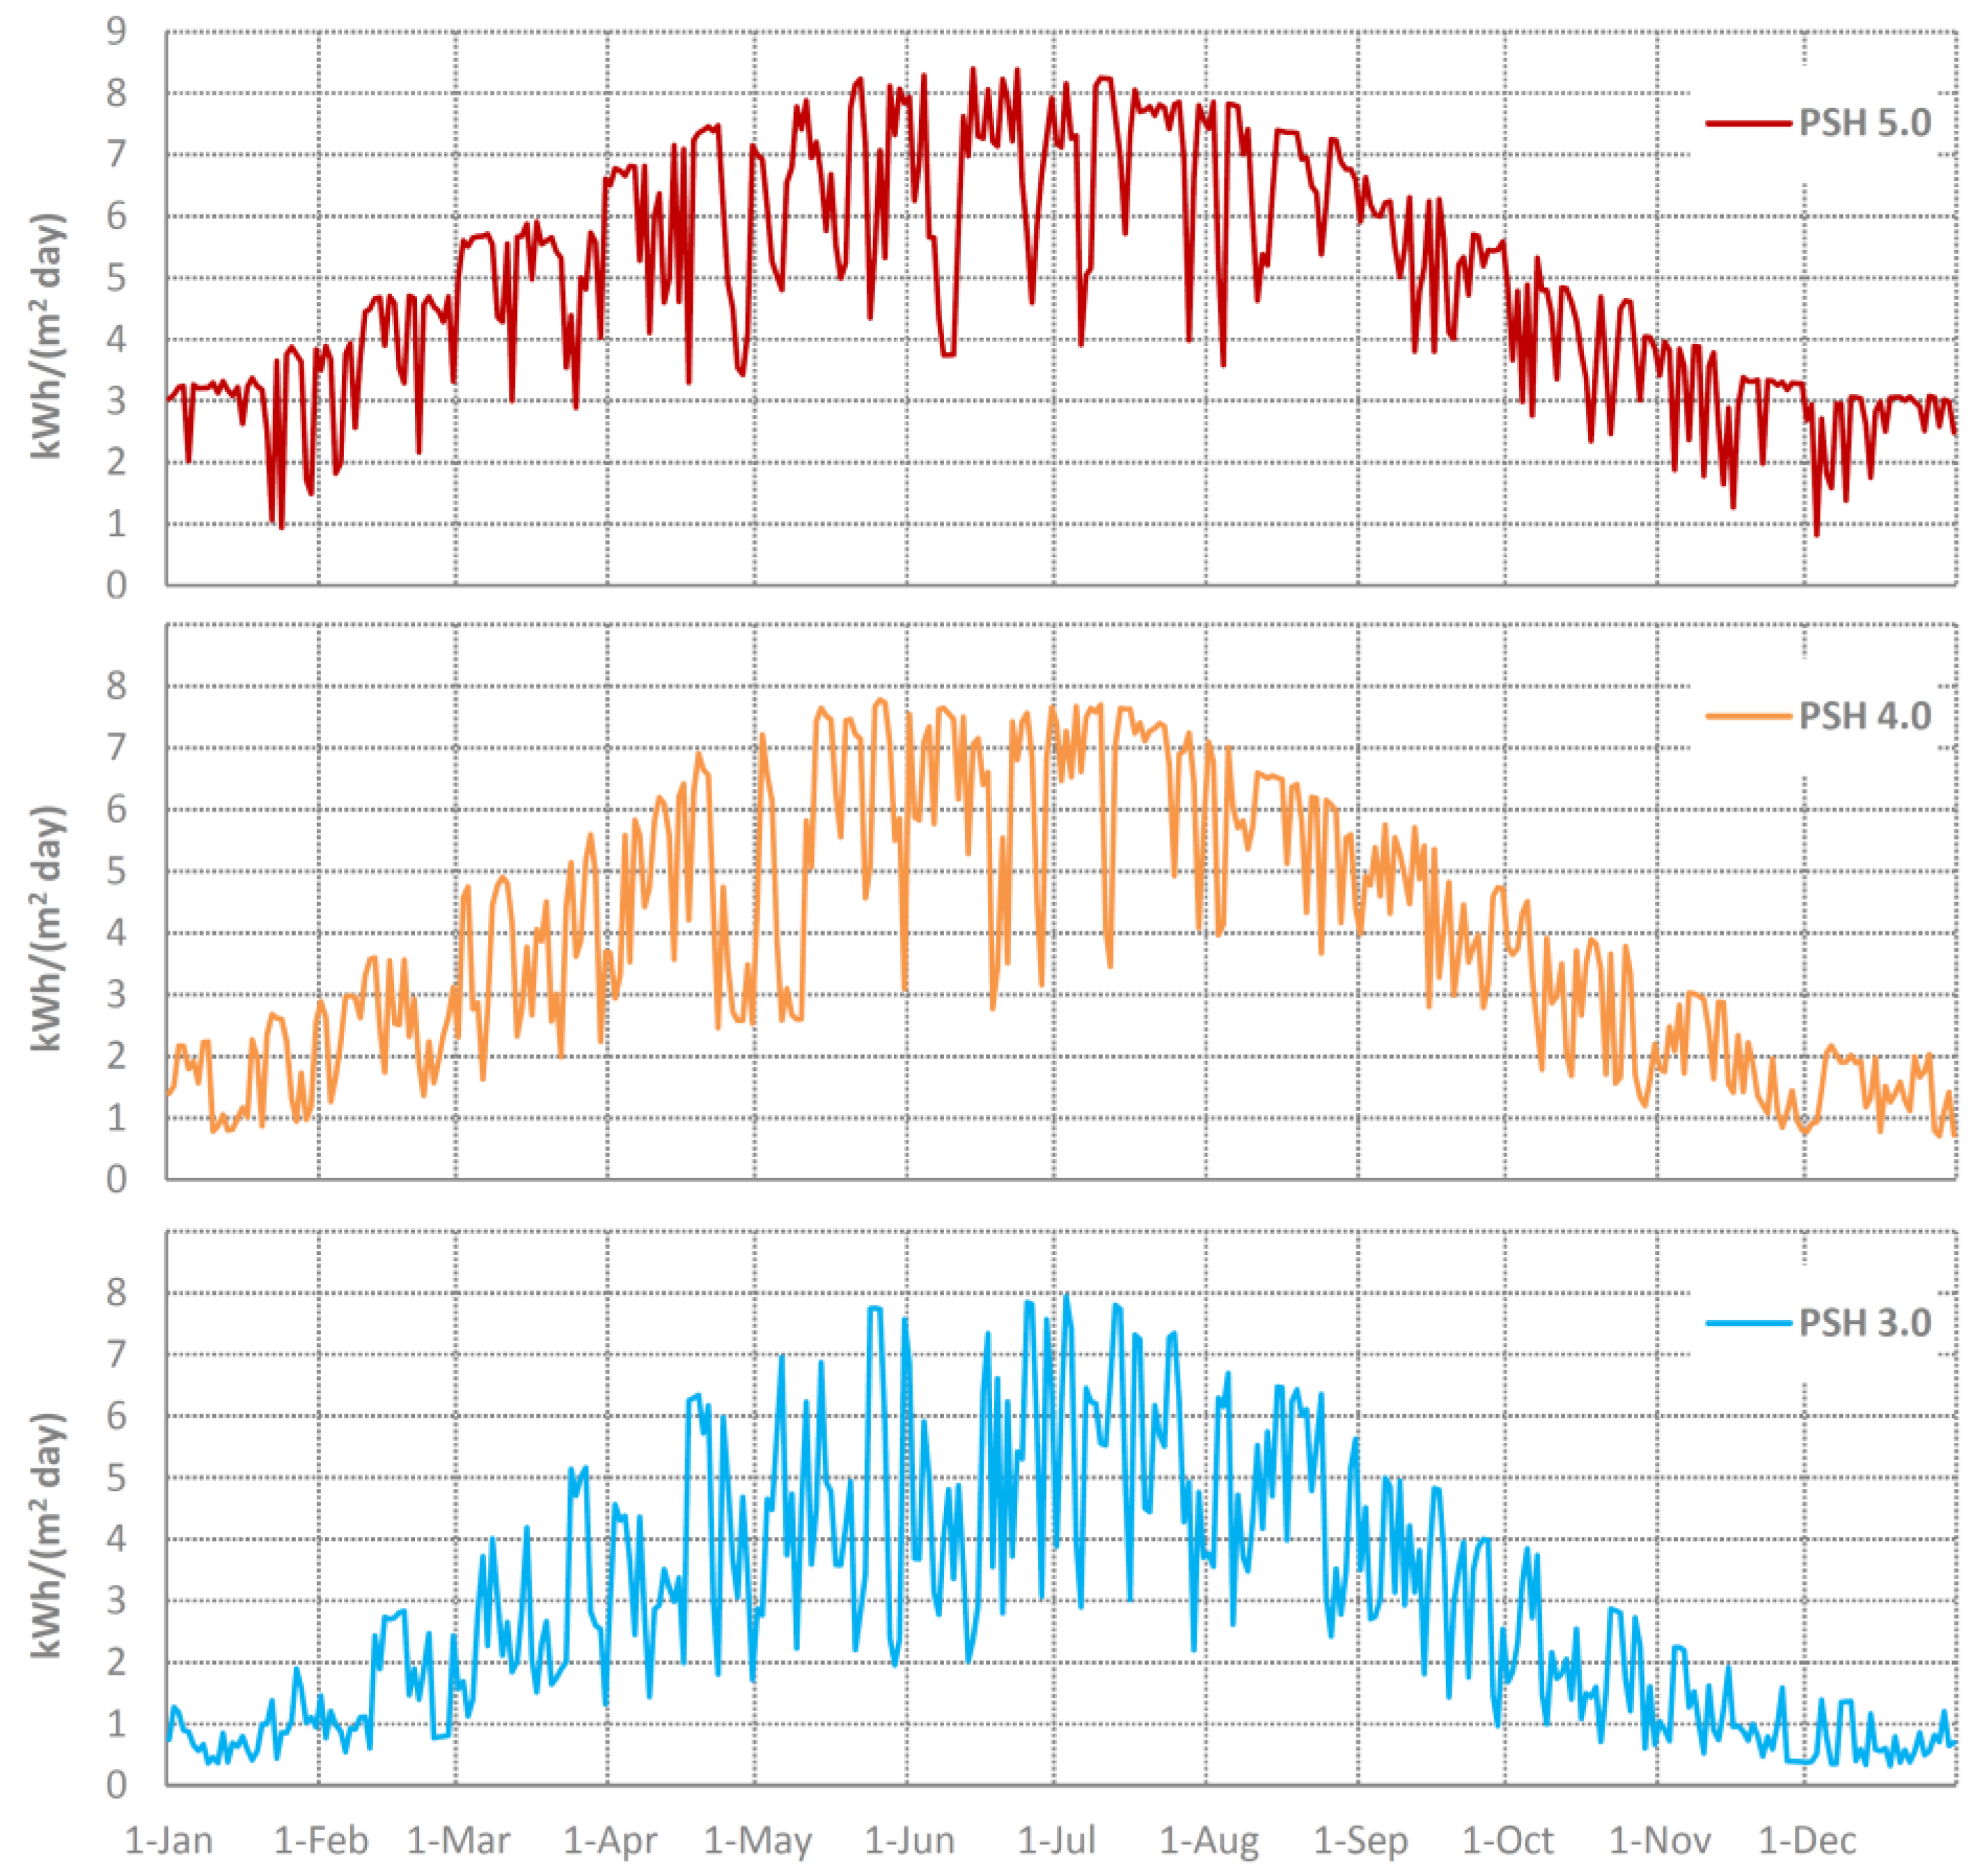
In order for the results to serve as a global reference, each scenario analysed includes 3 different radiation sub-scenarios, with annual average Peak Sun Hours (PSHs) values of 3.0, 4.0 and 5.0 in the horizontal plane. The reference data were extracted from EnergyPlus climatological files in September 2022: 3.0 PSH in Germany (DEU_Stuttgart.107380_IWEC.epw), 4.0 PSH in Italy (ITA_Rome.162420_IWEC.epw) and 5.0 PSH in the USA (USA_CA_CA_Los.Angeles.Intl.AP.722950_TMY.epw). The access date was 3 July 2023 (
Figure 3). The monthly and hourly distribution were performed according to the patterns of the cities stated in the files.
In each of the 3 sub-scenarios, incident radiation was calculated over 70 inclinations of the south-facing plane, from 10° to 80°. Specifically, quarter-hourly data of incident radiation on the inclined plane were obtained through simulations with EnergyPlus, using the aforementioned climatological files and roofs with different inclinations.
2.4. Calculation Methodology
In order to carry out a rigorous analysis of the savings generated through the use of a photovoltaic system, it is necessary to reproduce the real electricity billing system. In agroindustries, this is usually based on consumption data taken every 15 min. For this reason, the methodology is based on an analysis with a quarter-hourly interval, calculating the annual amount of the bill based on 35,040 pieces of data, reproducing the methodology used by electricity providers.
The Spanish pricing system will be used as a basis for this calculation, with a fixed term for power and a variable term for energy, VAT of 21% and an excise tax of 5.11%. Details regarding the calculation methodology and the electricity bill amount of the four agroindustries analysed can be found in a recent paper [
9].
The energy supplied by the solar system (
) at each 15 min interval (
t) was calculated by multiplying the peak power of the system (
) by the ratio of radiation on the inclined plane generated with EnergyPlus (
G) and by an overall efficiency (
) of 0.8. A constant efficiency has been assumed in order to have the same frame of reference, irrespective of the size or location of the installation.
In each interval, PV production is compared to the industry demand (
), quantifying the actual energy savings (
), the energy that will be billed supplied by the power grid (
), as well as the excess energy (
) that could be fed into the grid if the country’s regulations allow it.
In addition, in each interval, the new invoiced power supplied by the grid (
) has also been calculated by subtracting the effective power of the solar system (
) from the power demanded (
). In this way, the reduced penalties for excess power are realistically accounted for.
It was assumed that the panels would face south. In order to determine the optimal panel tilt in each sub-scenario, 70 different cases were calculated, with the irradiation data on inclined plane obtained with EnergyPlus. Optimal tilt was considered the one that generates the highest annual savings, while comparing to the production of the system with the real demand of the industry every 15 min.
The profitability of the solar installation has been measured through the discounted payback, applying a discount rate of 1%.
2.5. Calculation Software
In order to calculate and analyze the numerous scenarios proposed, a calculation tool based on VBA was developed. This application is an evolution of a previously developed one and validated to reproduce the billing of electricity companies, used as the basis for a recent publication [
9]. A solar calculation module with a quarter-hourly basis and a calculation of the total energy bill over a period of 20 years has been incorporated: investment and maintenance of the PV + annual electricity bills. The application is specifically programmed to process and compile the millions of scenarios analysed.
3. Results and Discussion
3.1. Sizing and Savings Generated
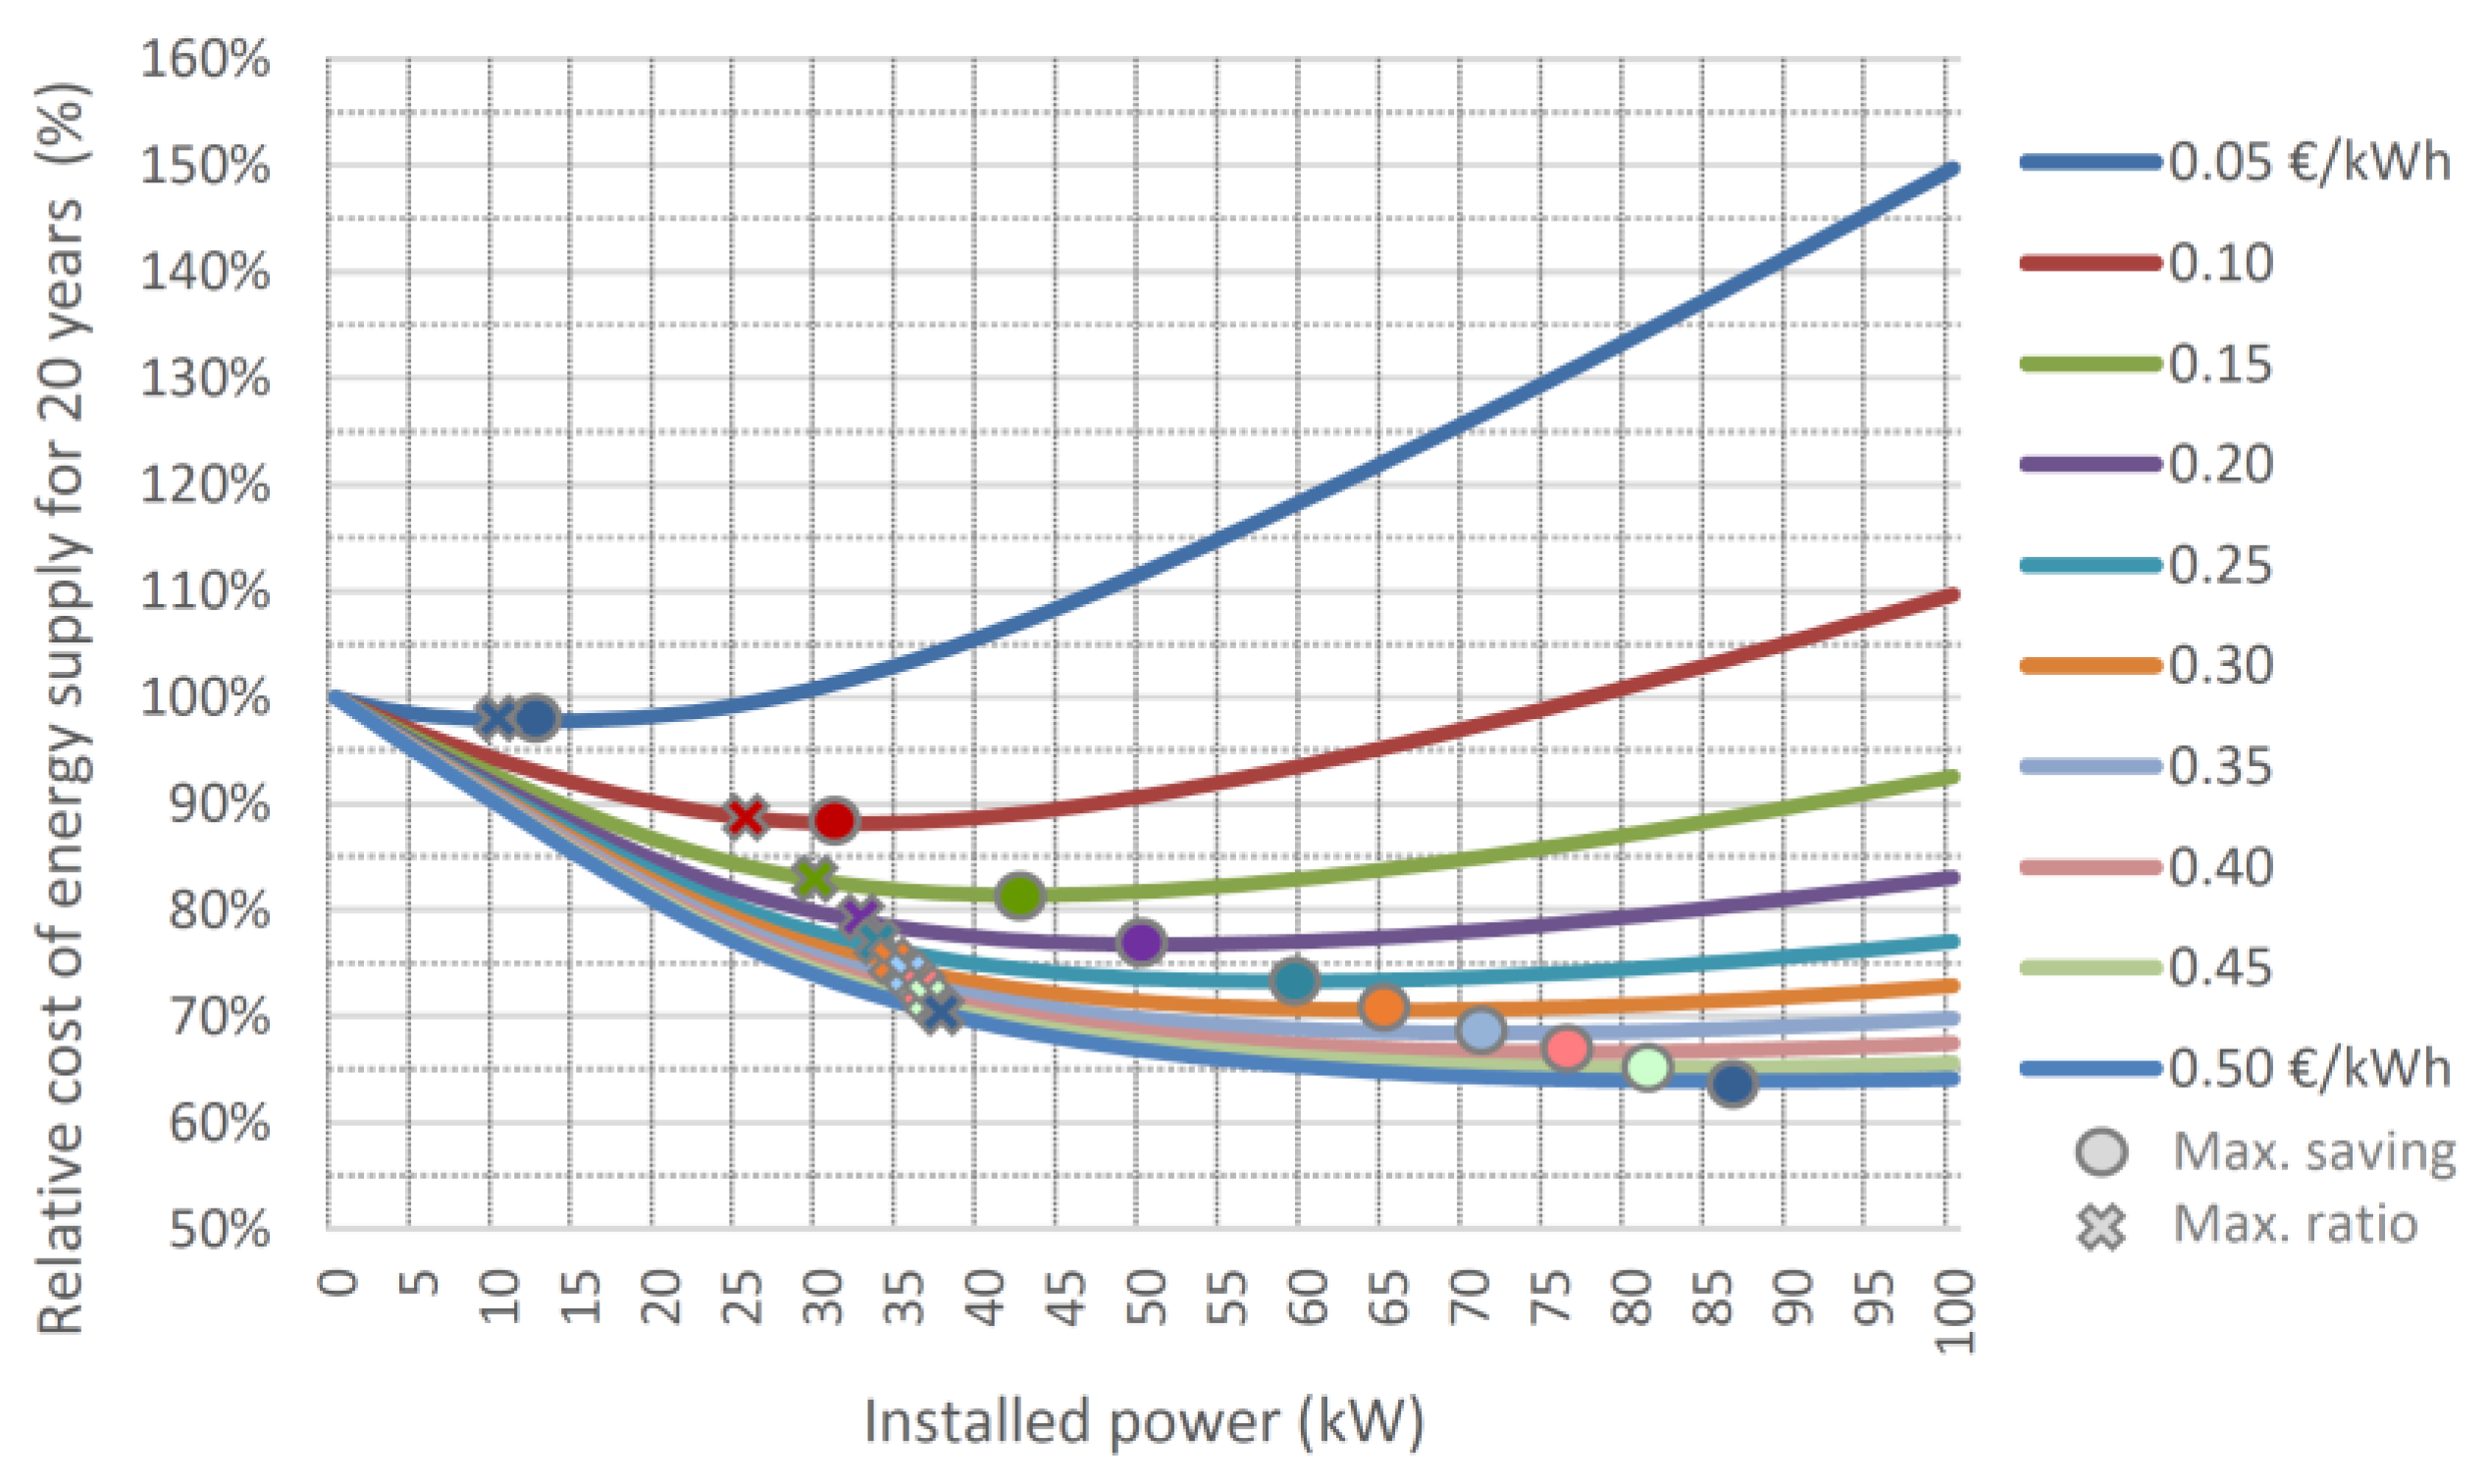
The price of energy causes considerable variations in the peak power required to minimise the cost of energy supply over a 20-year period (PV investment and maintenance + annual electricity bills). As the price per kWh rises, the size of the installation required increases, and so does the percentage of savings achieved. For instance, in the case of fruits and vegetables and 4.0 PSH, the optimal peak power ranges from 13 kW at 0.05 EUR/kWh to 87 kW at 0.50 EUR/kWh; the savings generated compared to the scenario without PV range from 2% to 36% (
Figure 4). Therefore, the new energy context, with a substantial rise in energy prices, requires significant increases in installed peak power if savings are to be maximised.
If the installation is oversized, part of the energy is wasted in the form of excess, and as a consequence, the total cost of energy supply, considering the lifetime of the installation (PV investment plus annual electricity bills), may exceed one of the reference scenarios without PV.
The uncertainty of possible future energy price variations and the initial investment required may justify a more conservative sizing. Even more so when the low slope of the total cost curve around the inflection point shows wide power ranges with savings values close to the optimum (
Figure 4). The “Savings/payback” ratio can be a good reference for a dimensioning that combines savings and profitability. As it is a modular installation, it can be progressively expanded to reduce the initial investment required and the associated risk.
For a wide range of energy prices, the range of powers maximising the ratio is relatively small, with required powers significantly lower than the maximum savings scenario in 20 years. Thus, for instance, in the above case, the required power range would be between 11 kW at 0.05 EUR/kWh and 38 kW at 0.50 EUR/kWh; it would be between 28 kW and 38 kW if the first price of 0.05 EUR/kWh is excluded. Sizing around average values of the range reduces the risk of future energy price changes, while maintaining savings close to the optimum. Therefore, at the cost of sacrificing a small percentage of the potential savings generated on the energy bill, the initial investment required is significantly reduced.
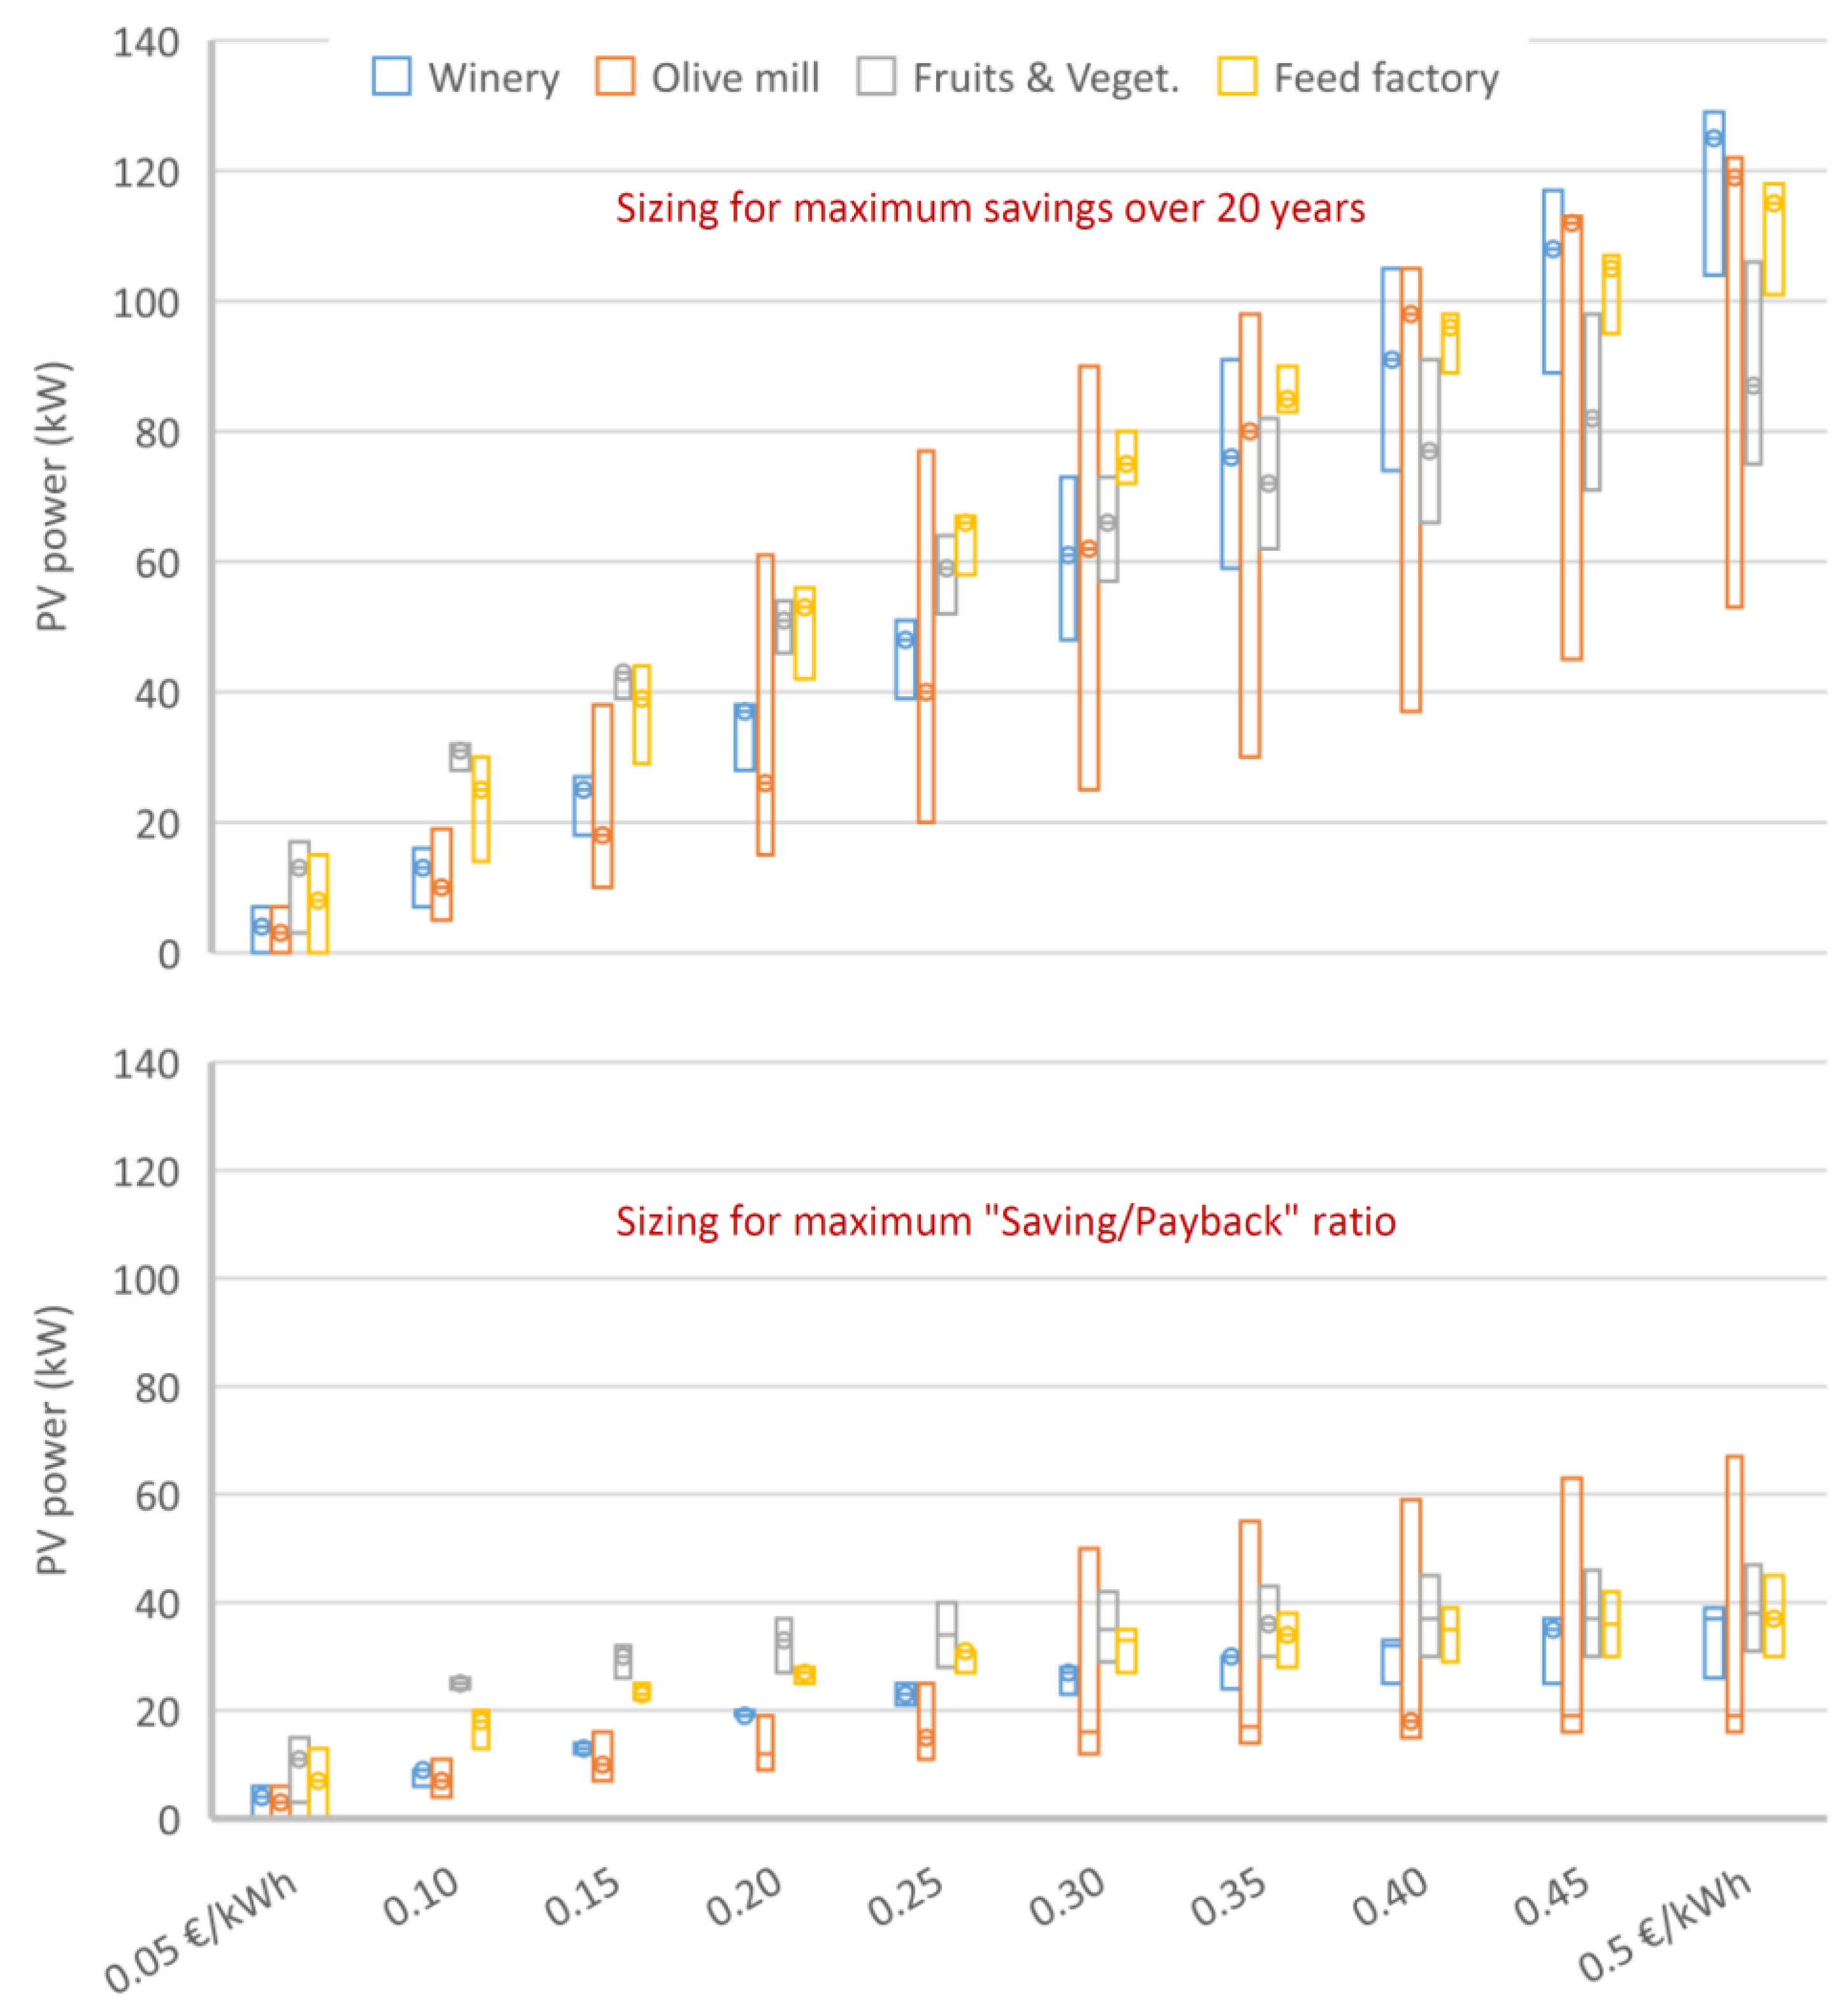
The consumption pattern of the industries is a second key factor to bear in mind when sizing the PV installation. At low energy prices, industries with seasonal consumption (wineries and oil mills) required a smaller PV installation size than the non-seasonal ones. In some cases, the power required in the non-seasonal consumption industries was twice as high as in the seasonal ones (
Figure 5). This is due to the fact that in highly seasonal industries, excess unused energy increases as the PV size grows.
In the current energy context, high energy prices make it possible to compensate for the initial investment and to homogenise the installations size in many cases. However, the differences in absolute value increase notably, highlighting the importance of analysing the consumption pattern in detail for a correct design. For example, in the case of the olive oil mill, the differences between scenarios with high and low radiation are much more noticeable than in other industries, inasmuch as peak consumption is concentrated in winter (
Figure 5).
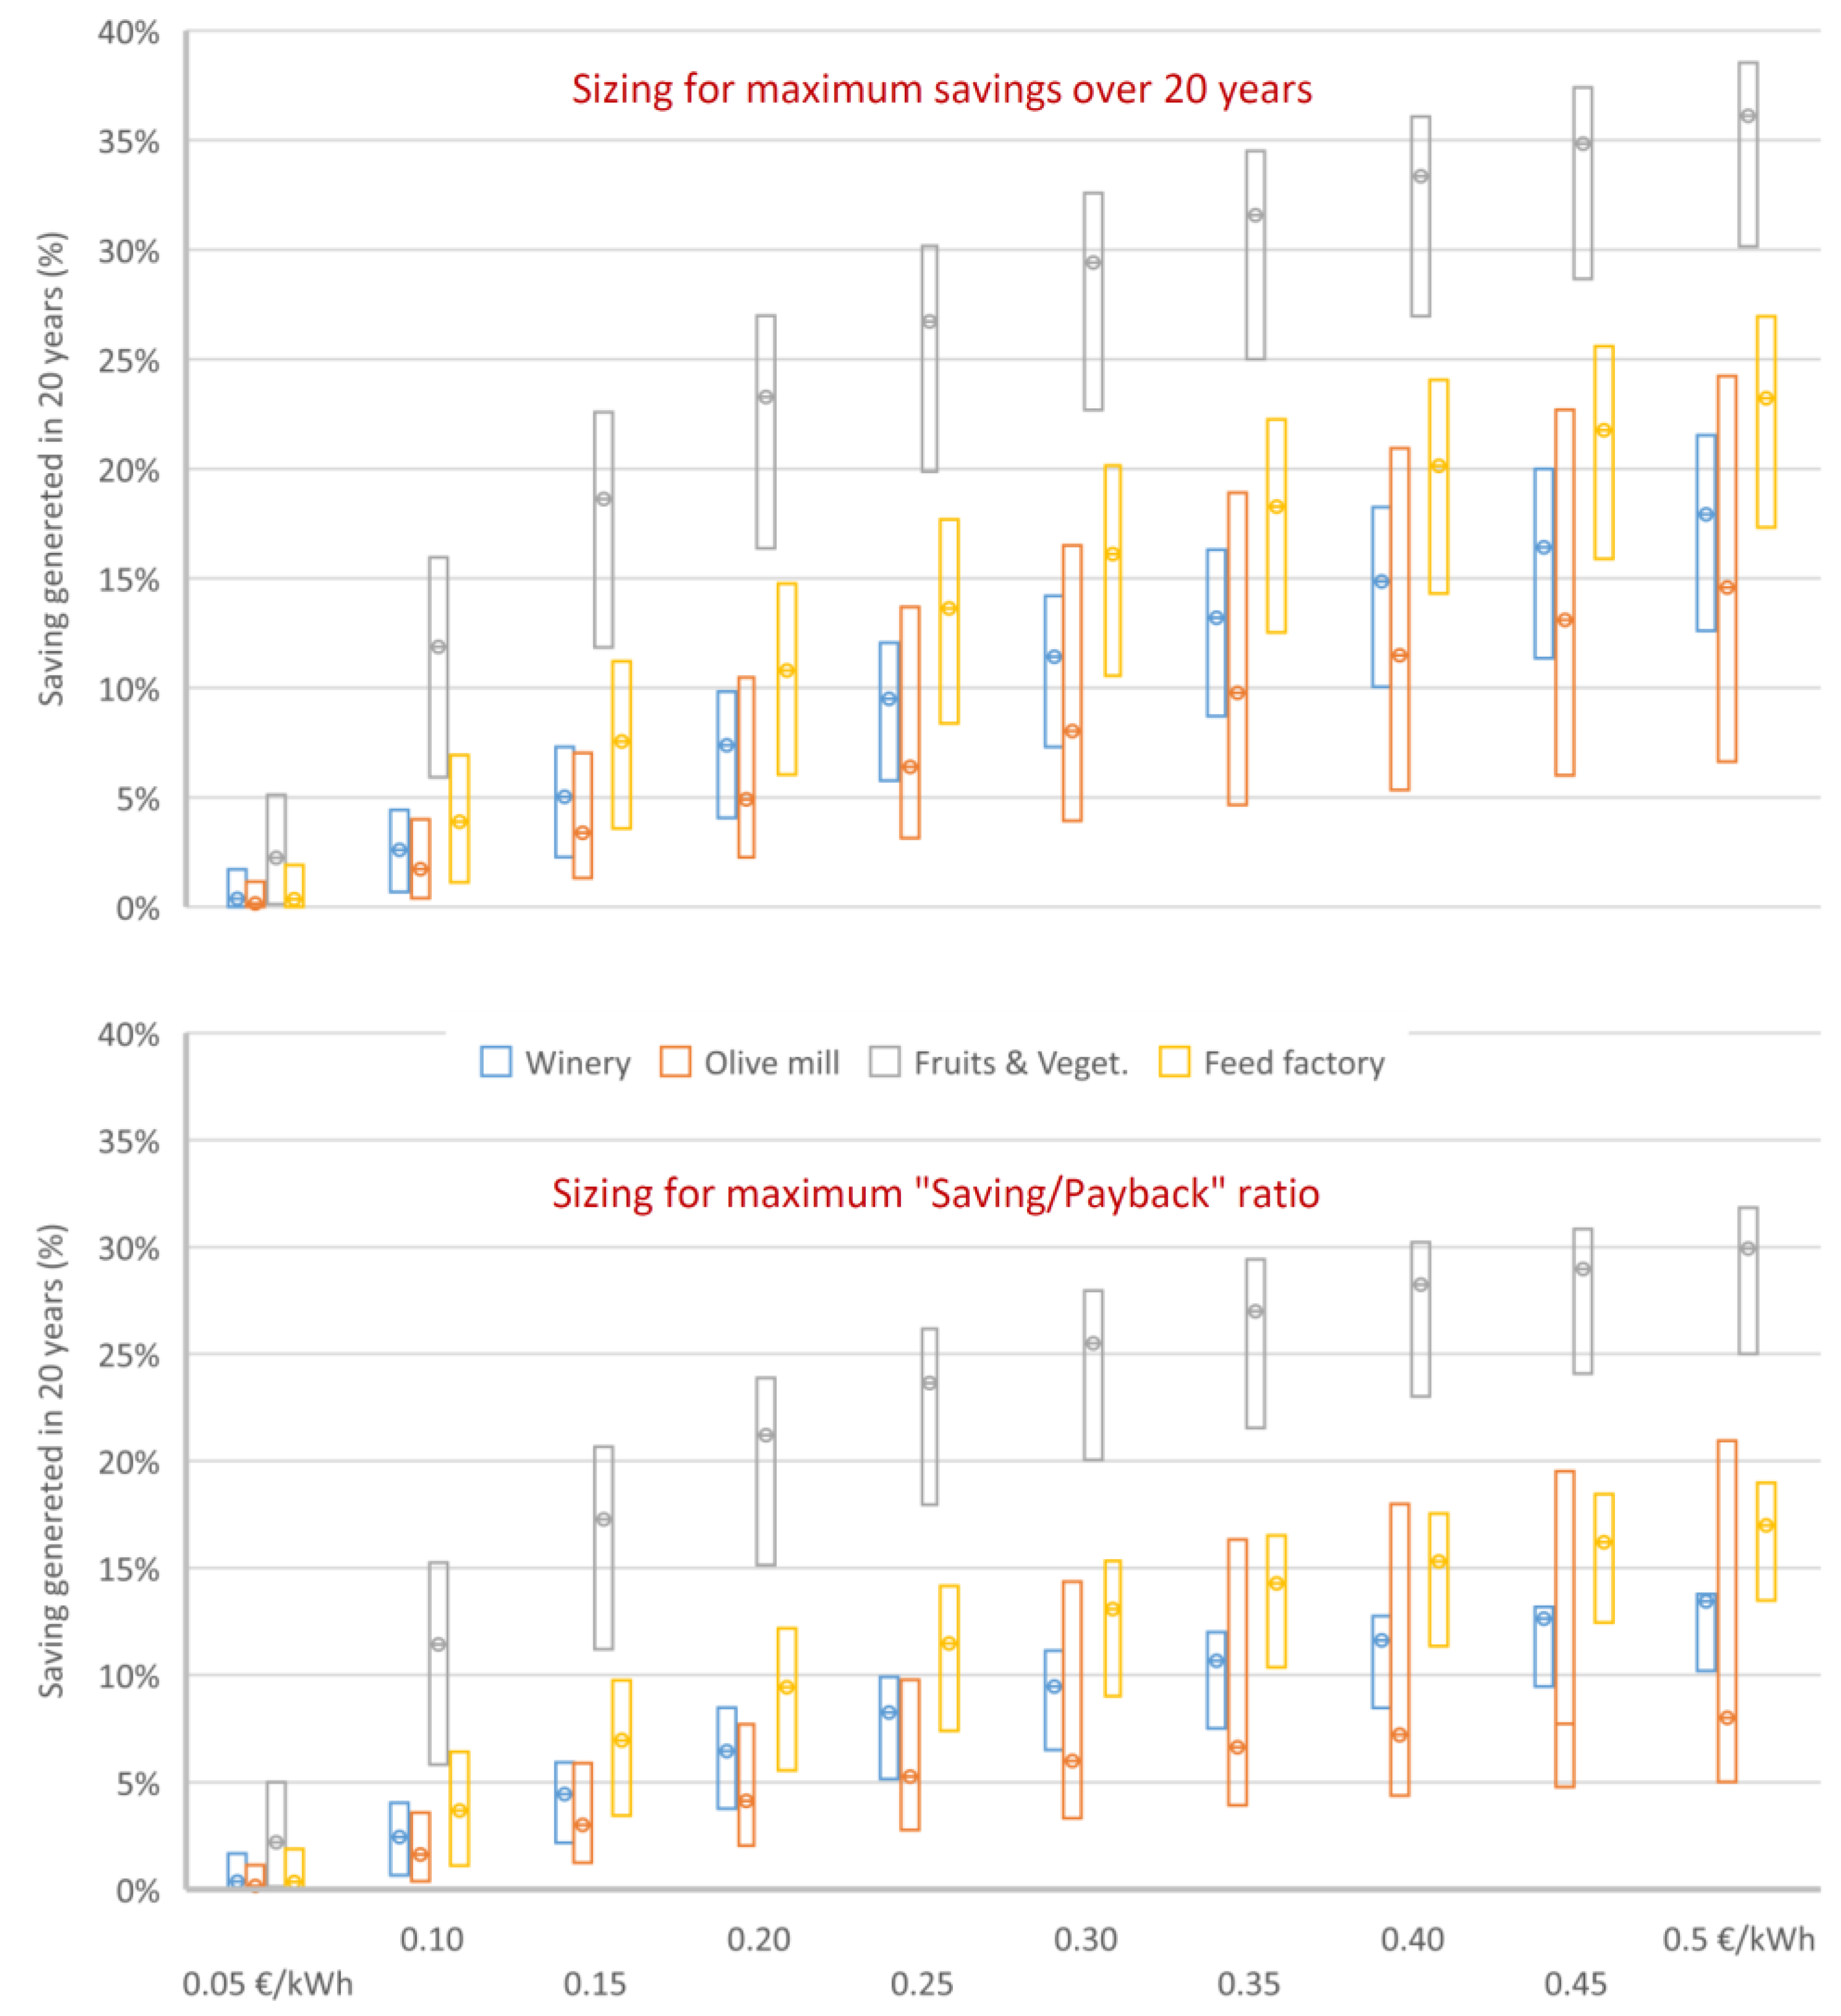
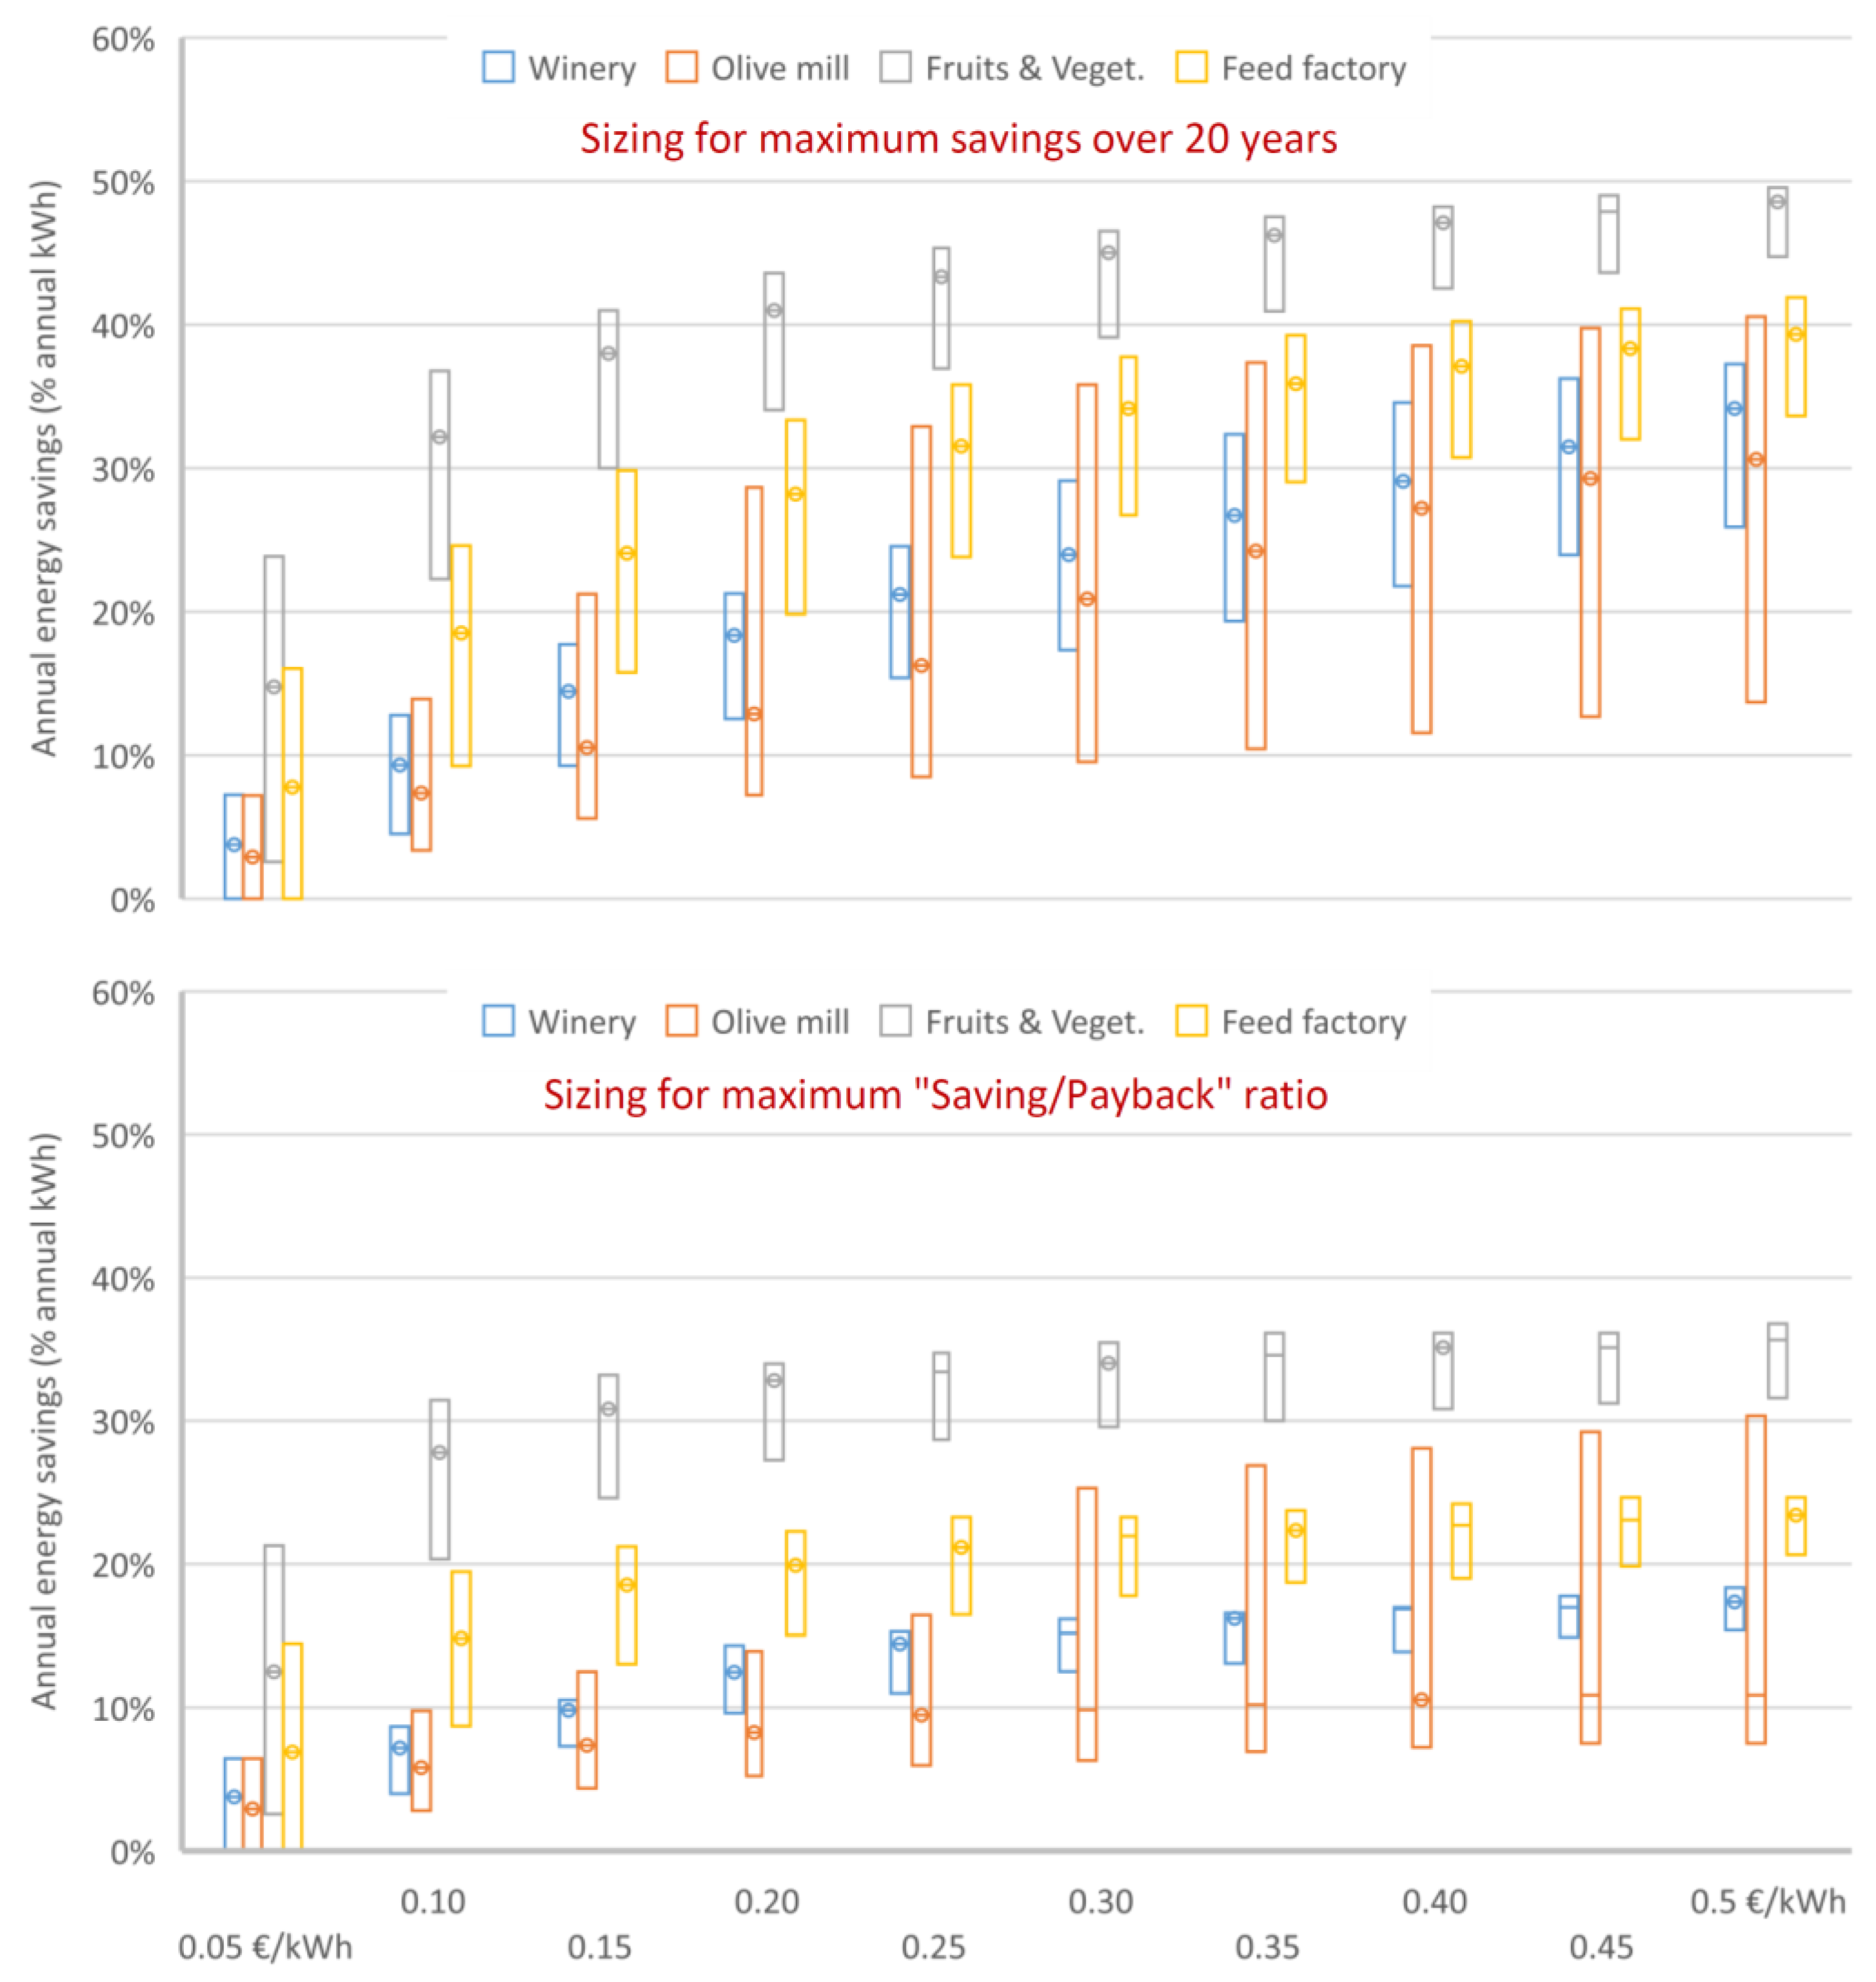
The differences between industries are even greater when analysing the savings generated. The size of the installation is not associated with the same percentage of savings in the different industries. Despite the fact that, in some scenarios, the optimal sizing is similar, the savings generated are quite different (
Figure 6).
Industries with marked seasonality have a limited savings capacity compared to the scenario without PV. Savings only exceed 15–20% in the most favourable cases, with high energy costs and high radiation. The olive mill, with peak demand in winter, is the most sensitive to reduction in radiation, with significant drops in the savings generated.
In the case of the feed mill, potential savings are limited by low utilisation at weekends and sharp consumption peaks during production days. Despite a relatively stable consumption throughout the year, the maximum savings percentages barely exceed 25% in the most favourable cases.
It is the fruit and vegetable plant with its stable consumption—including weekends—that has the greatest savings potential when installing PV. Savings of 35% of the energy bill can be exceeded in the most favourable cases.
The most conservative sizing based on the “savings/payback” ratio leads to lower savings compared to the scenario without PV, with an average loss of 2.4 ± 2.2%. The differences increase with rising energy prices, with a maximum savings reduction value of 8% in the most extreme cases (
Figure 6).
3.2. Photovoltaic System Profitability
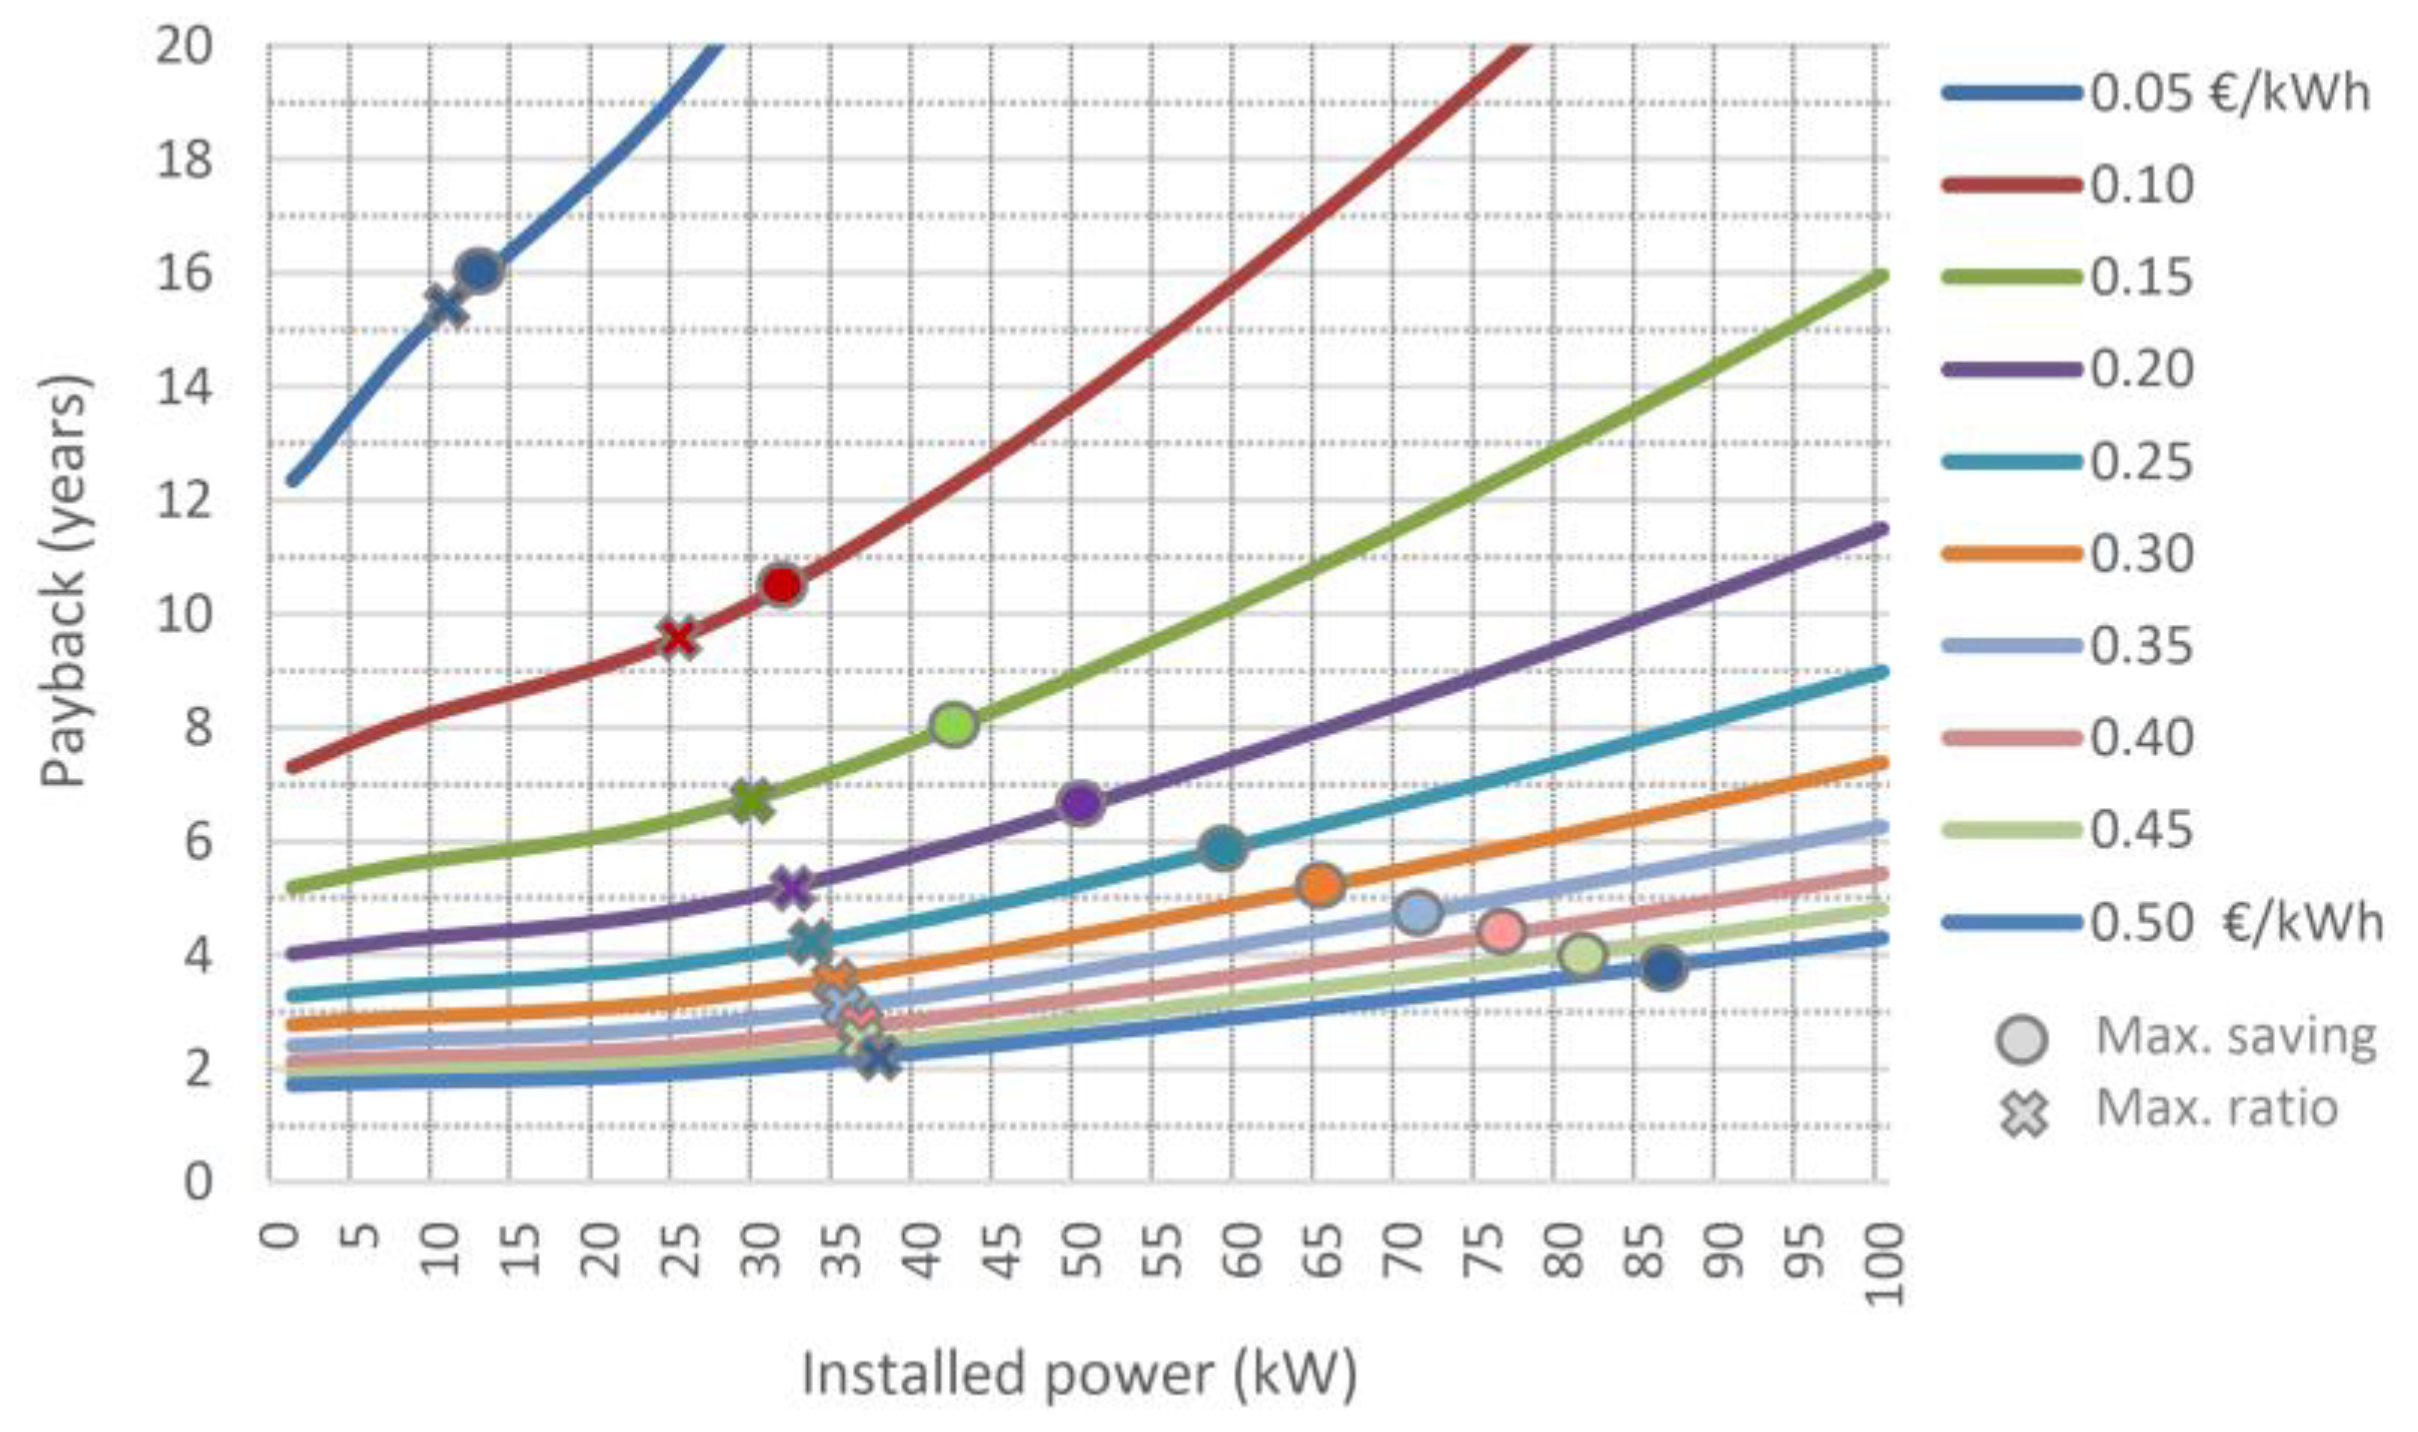
The new energy context is also associated with changes in the profitability of the investment made. Of course, the profitability of the PV system depends on the price of electricity. In addition, it is also strongly linked to the installed peak power. An increase in the power required leads to an increase in the payback of the investment compared to smaller installations (
Figure 7). This is because the smaller the size of the PV, the higher the utilisation rate of the energy produced, resulting in a higher annual cash flow.
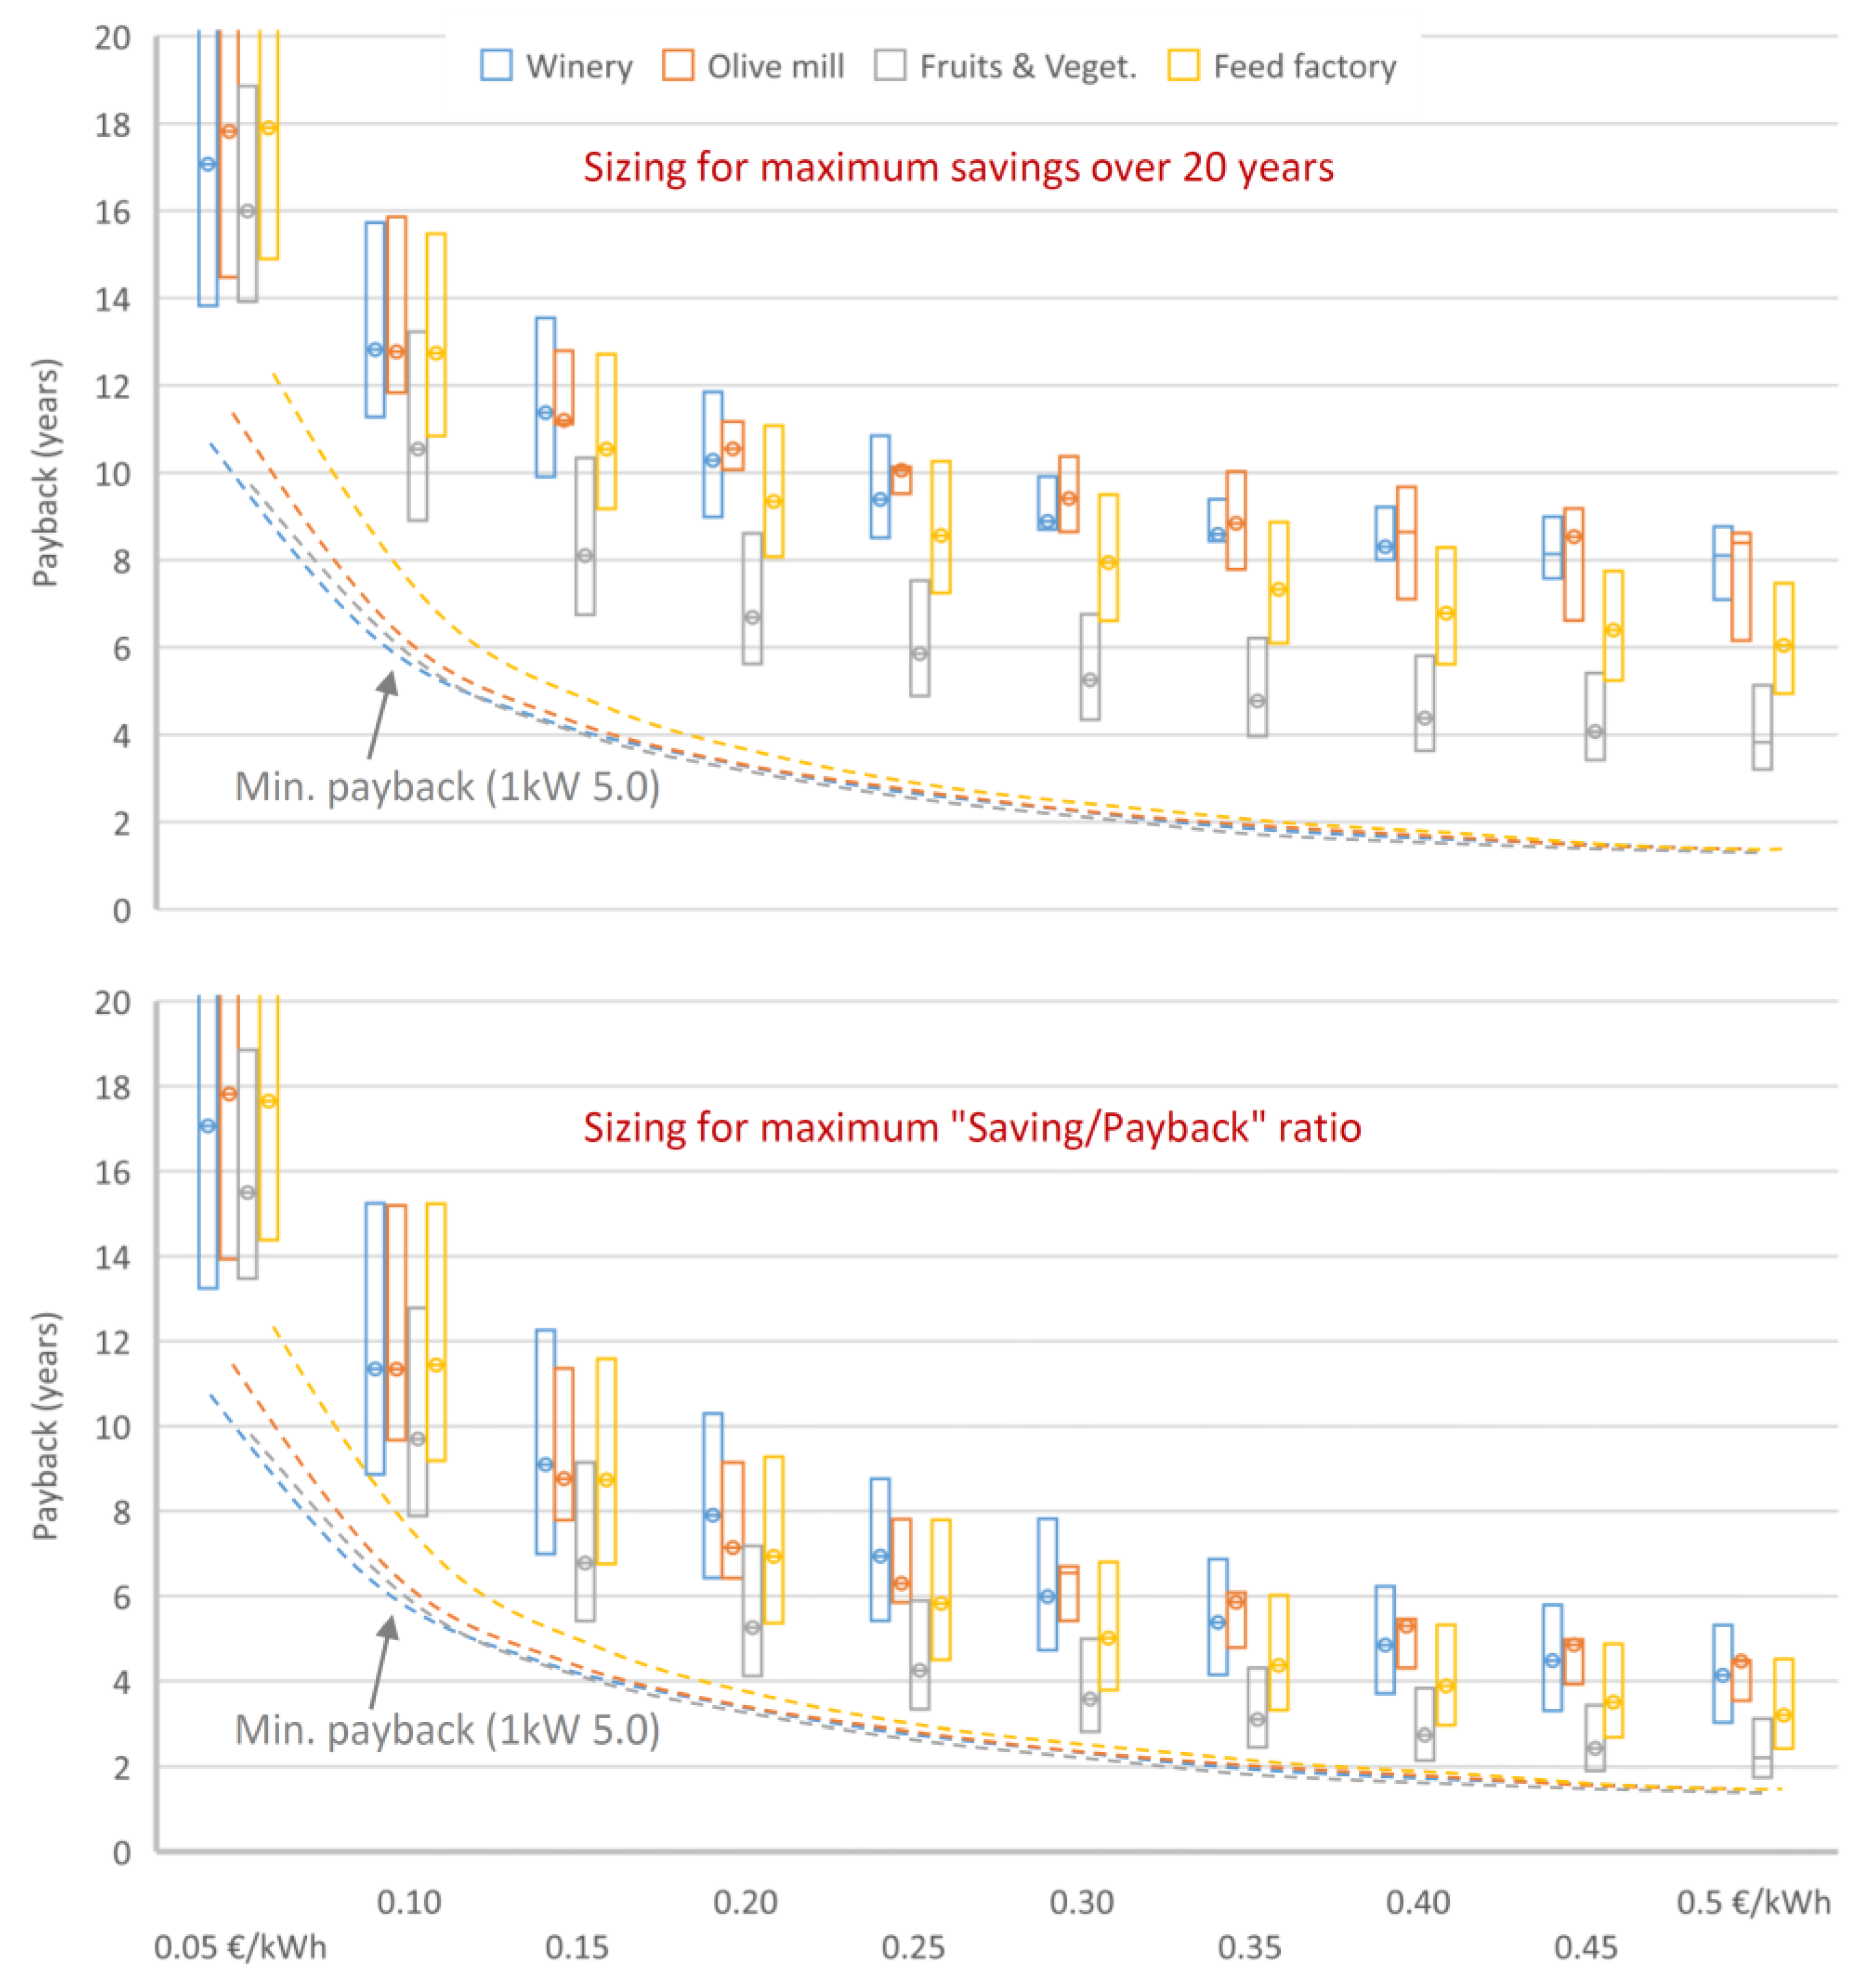
The difference in payback between the scenarios maximising savings and the maximum cost-effective scenario (1 kW power and PSH 5.0) can be as much as several years, even in cases with 5.0 irradiation (
Figure 8). Despite the increase in energy costs, the search for maximum savings is associated with paybacks of more than 6 years in seasonal industries. Only in the case of a very stable consumption pattern (fruit and vegetable plant) did the difference to the best possible payback remain below 2 years.
Sizing the installation to maximise the “savings/payback” ratio reduces the payback of the investment by an average of 2.3 ± 1.2 years (
Figure 8).
3.3. Reduction in Energy Consumption
Although the sizing of the scenarios analysed was based on profitability criteria, considering the cost of the investment, the associated energy savings is another aspect to be taken into account during the decision-making process.
Sizing to maximise economic savings is associated with a greater reduction in energy consumption than the more conservative criterion of maximising the “savings/payback” ratio (
Figure 9). As in the other aspects analysed, the consumption pattern and radiation strongly condition the energy reduction achieved. The search for profitability limits reduced energy consumption, with maximum values close to 50% in the industries with the most stable patterns and 40% in the others.
3.4. Use of Excess Energy Generated
The use of excess energy generated is a complex issue, given the broad legal contexts. The results of the study should only be interpreted as the most favourable threshold, as it is assumed that all excess power generated can be sold, regardless of consumption and the saturation state of the grid nodes. Where there are legal restrictions, such as limiting the payment of surplus to the daily consumption of the industry, the results will tend toward those set out in the previous sections.
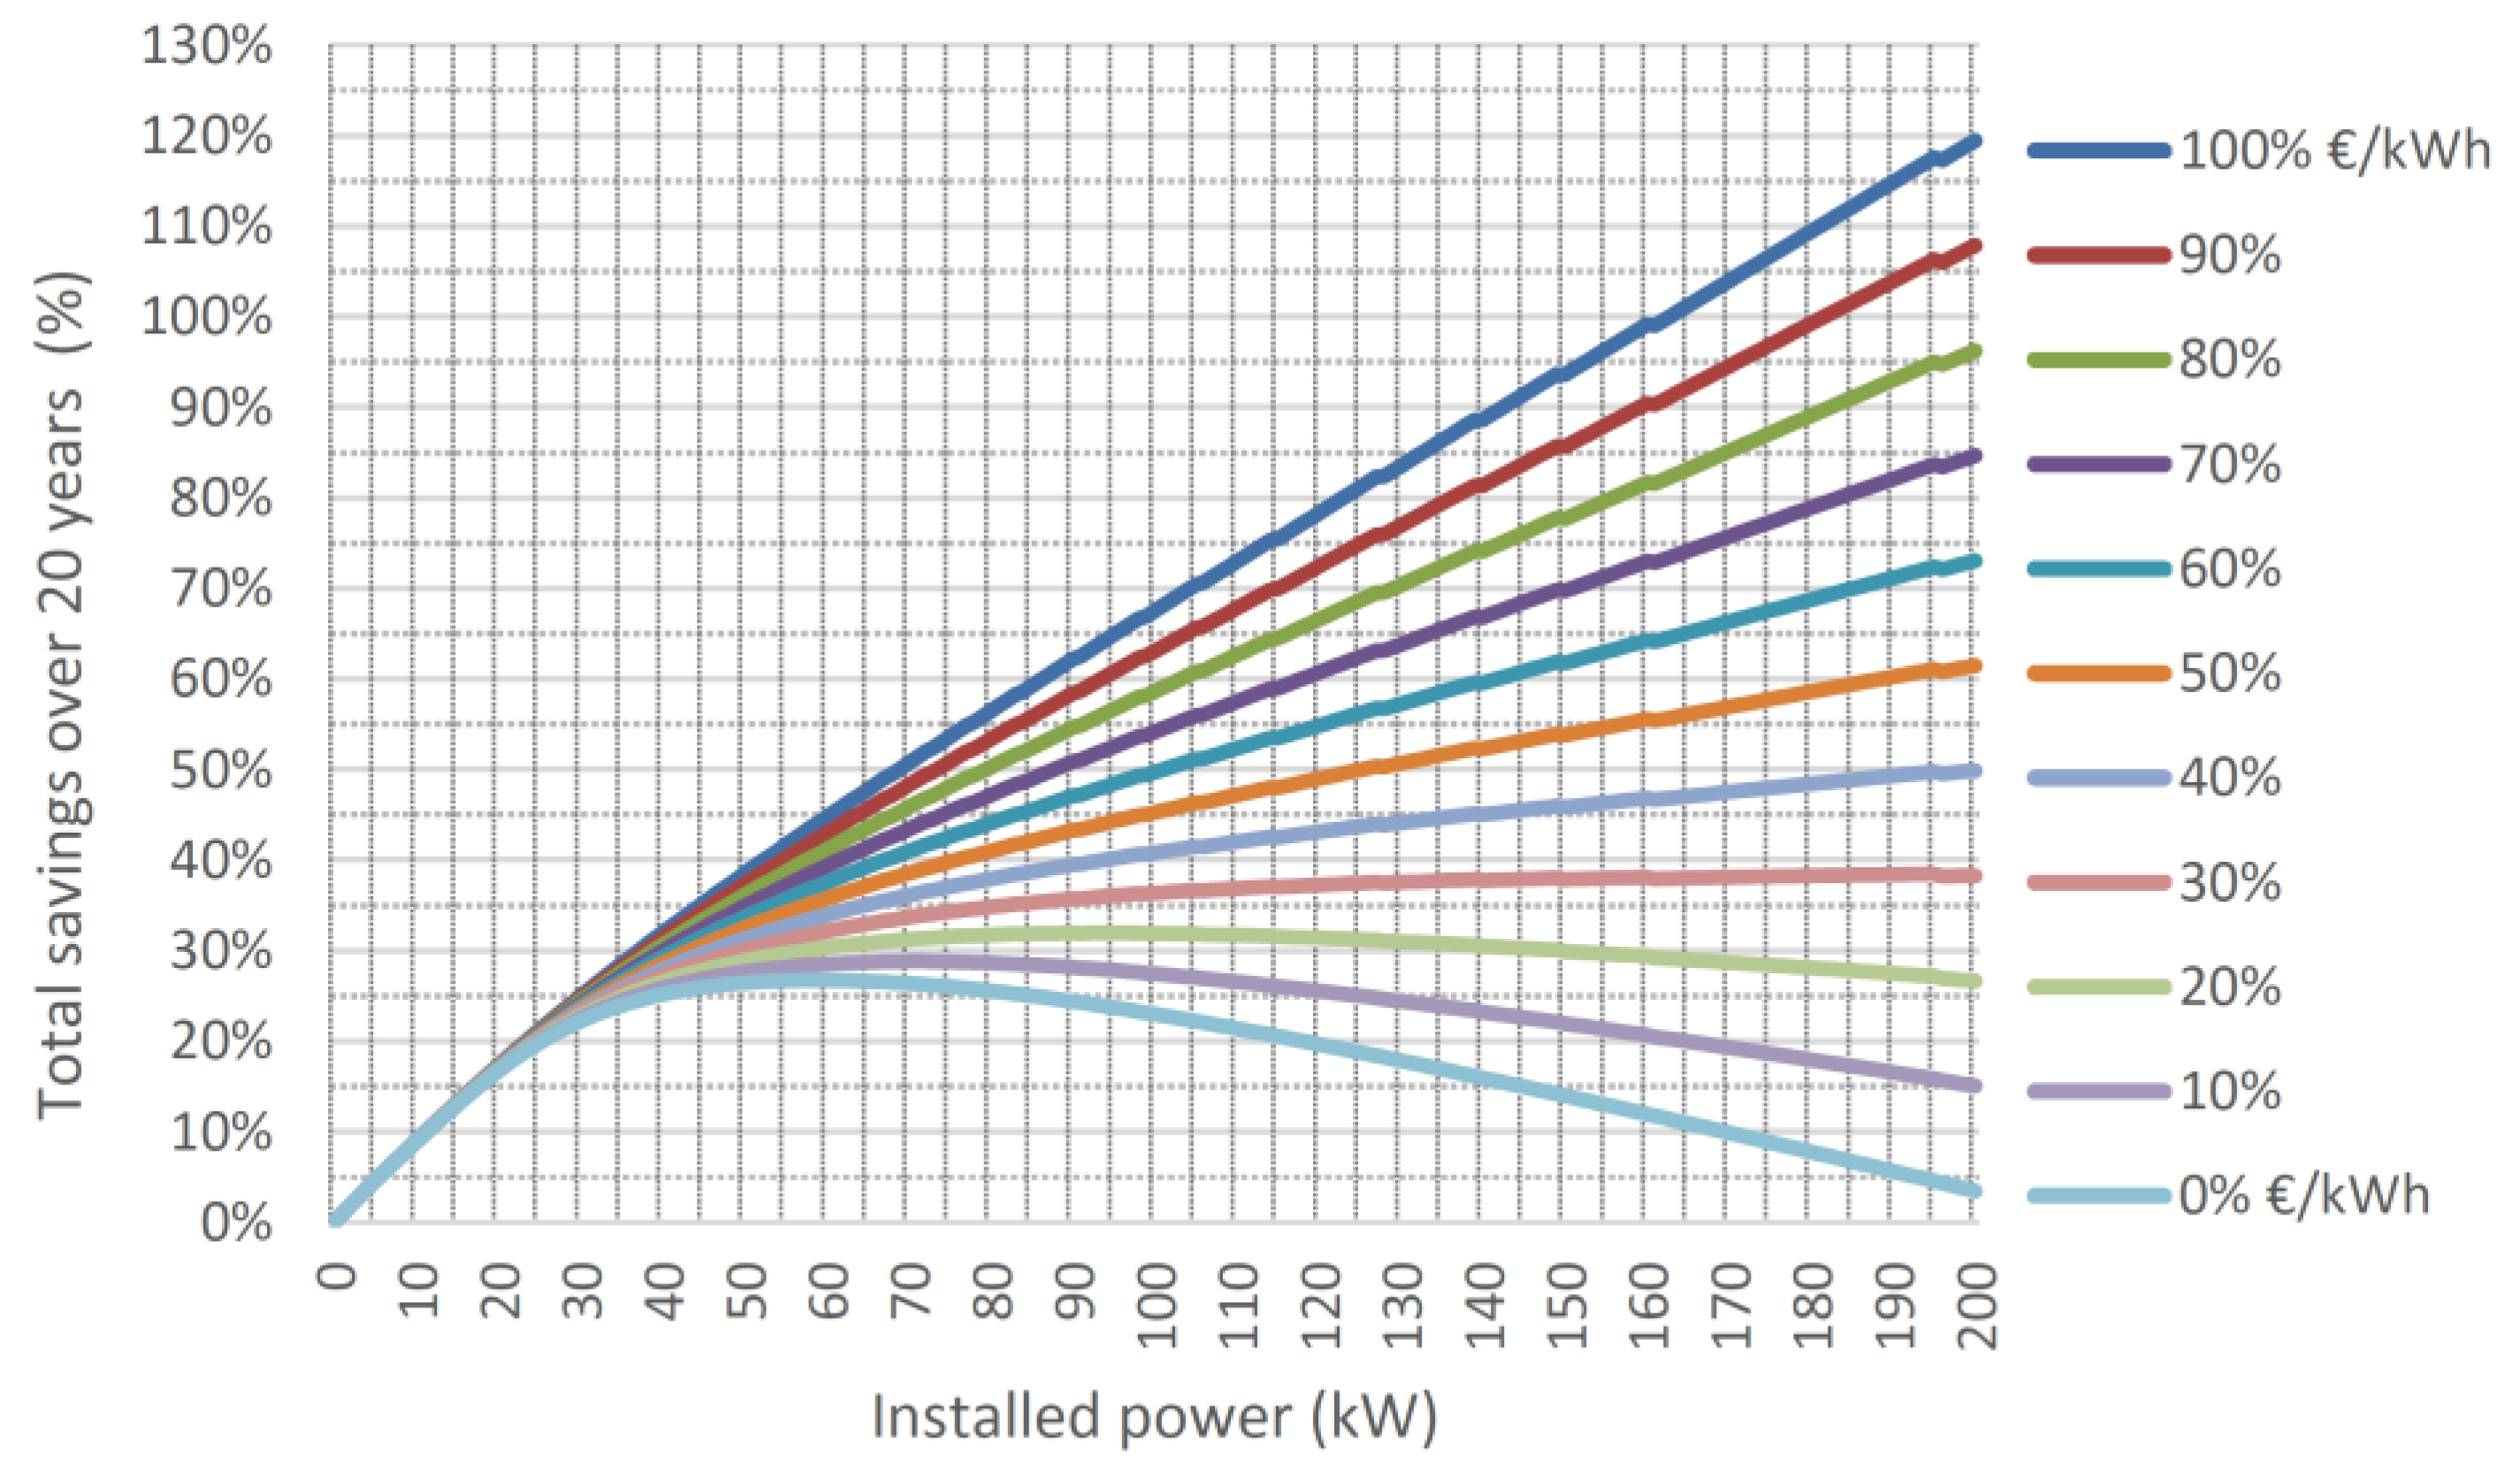
In this context, a larger PV size will be necessary to maximise savings over the installation lifetime whenever overcharging takes place. The larger the size of the installation, the higher the savings generated compared to the scenario without overcharging due to the increase in overruns. The increase in sizing is stronger as the price paid for the overruns increases. So much so that, from a given price onwards, the savings generated increase indefinitely as the size of the installation grows, since the revenue from overruns exceeds the cost of investment.
Thus, for instance, in the case of a fruit and vegetable plant and 4.0 PSH (
Figure 10), the situation with 100% EUR/kWh is logically the most positive since the contract with the electricity supplier would allow the industry to inject surpluses charging the same price at which it pays for the energy. The situation with 0% EUR/kWh is the most unfavourable: the industry does not charge anything for the overages. The case of each industry in the graph will depend on the type of contract with the electricity supplier allowed by each country’s regulations.
Despite increasing savings, a rise in the size of the PV is associated with a reduction in the profitability of the investment made (higher payback) and a higher risk in the face of future price changes. In this context, changes in profitability are more pronounced in seasonal industries due to greater excesses.
3.5. Sensitivity Analysis of the Investment Price
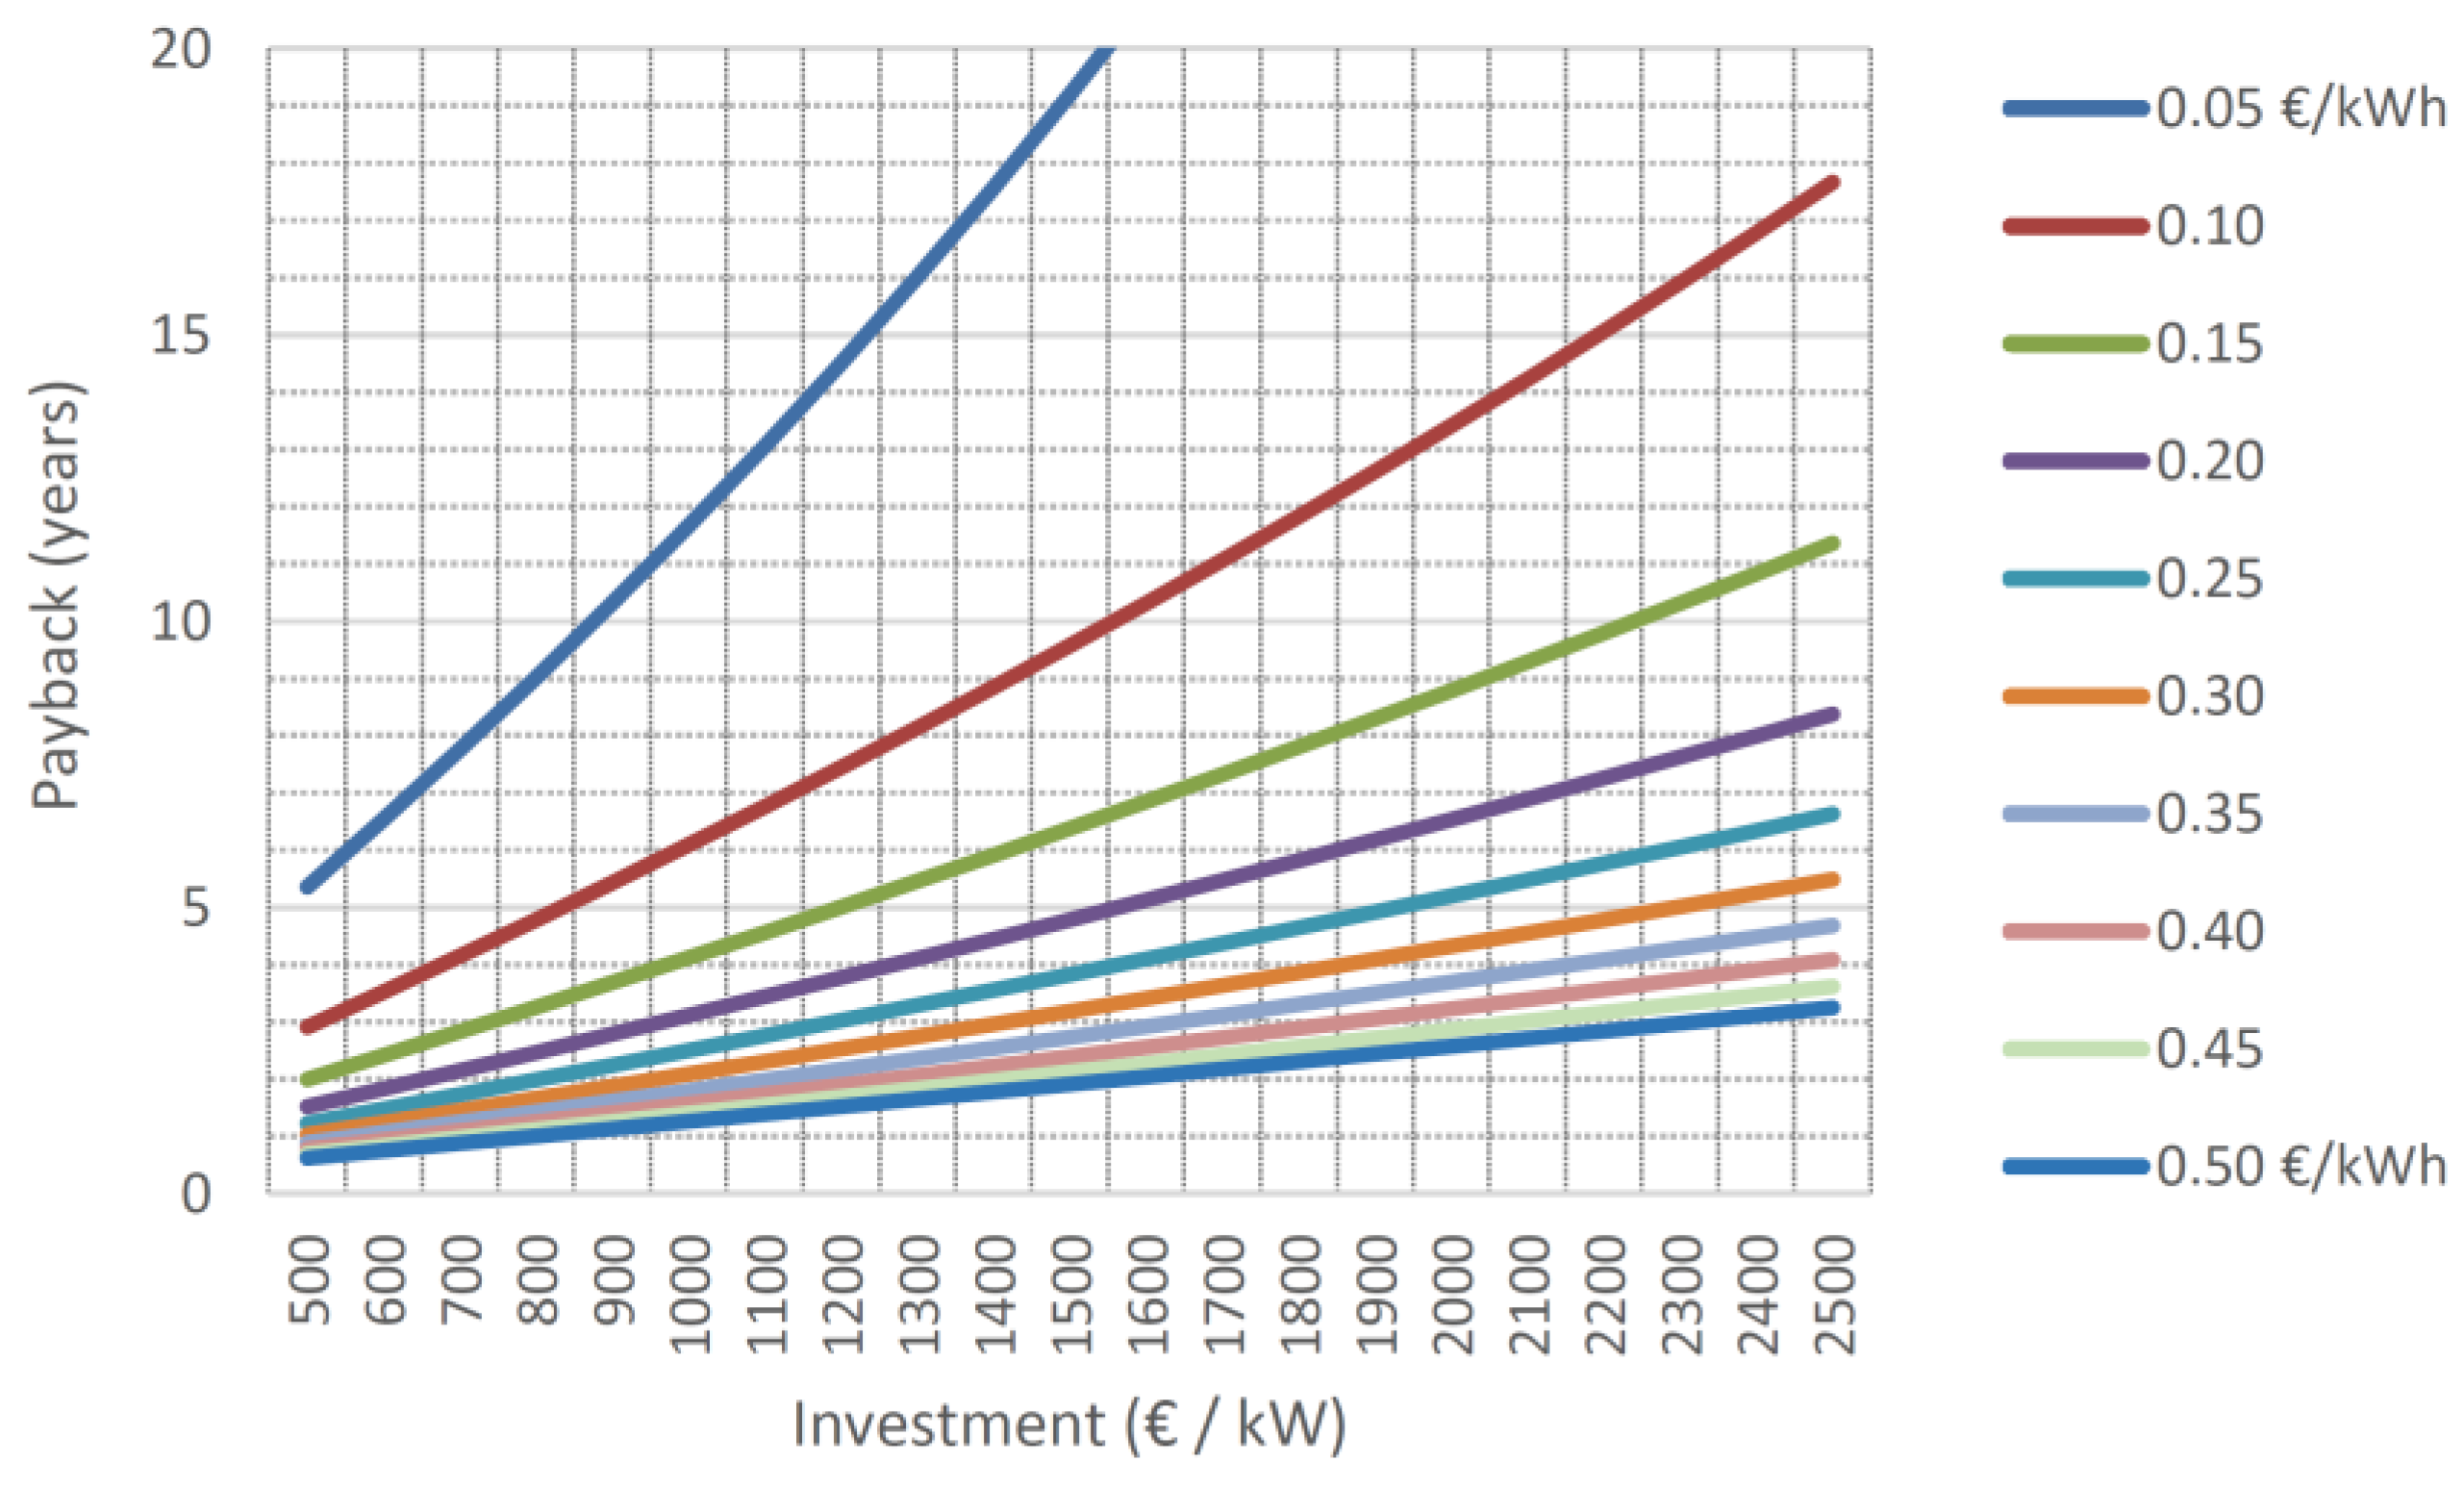
The increase in the price of power (EUR/kW) in the new energy context is associated with a lower sensitivity of profitability to changes in the cost of investment. Radiation and consumption patterns also condition the changes in profitability associated with changes in investment.
In most cases, for values of 0.25 EUR/kWh onwards, the payback variations are less than 0.5 years per 100 EUR/kW installed. Most notably, the average value ranges between 0.3 (5.0 PSH) and 0.5 (3.0 PSH) in the winery, 0.3 and 0.6 in the olive mill, 0.2 and 0.3 in the fruit and vegetable plant and 0.2 and 0.4 in the feed factory.
At lower energy price values, as in recent years, payback variations are typically between 1 and 3 years for every 100 EUR/kW variation (
Figure 11).
4. Conclusions
In the new context, photovoltaic energy must be one of the pillars on which the transition of agribusinesses is based, helping to maintain the competitiveness and viability of the sector and contributing to reducing climate change. Nowadays, the question to be answered is no longer whether PV is cost-effective but how much power needs to be installed to optimise profitability and savings for agribusinesses.
So far, the seasonality of the consumption pattern of many agroindustries, associated with a moderate cost of energy, has hindered the implementation of PV systems. This paper demonstrates that in the current context, PV can be profitable in most agroindustries, even in those with noticeable seasonality located in areas with limited radiation. However, for the same annual consumption, the optimal size of the solar installation, the potential savings and the profitability of the installation vary greatly depending on the consumption pattern. In the most extreme cases, the savings achieved are limited.
- (a)
Sizing of the PV system
The new energy context entails changes in the dimensioning of PV systems in all the industries analysed. If the increase in energy prices is maintained in the long term, the installed peak power must rise significantly if the energy bill is to be optimised (maximising savings).
The consumption pattern of industries is a second key factor to consider when sizing the PV installation. The differences in peak power required (in absolute value) increase significantly depending on the scenario and radiation. This highlights the importance of analysing the consumption pattern in detail for a correct design.
- (b)
Energy bill reduction (PV + annual bills)
The size of the installation does not lead to the same savings in all industries. Even in cases where the PV size is similar, the savings generated differ greatly depending on the consumption pattern. In industries with strong seasonality, the PV installation has a limited capacity to generate savings compared to the scenario without PV, even when energy prices rocket (maximum values of reduction around 15%). Industries with a stable consumption pattern throughout the year but with very marked consumption peaks and breaks at weekends also see limited potential savings from PV. Industries with stable consumption—including weekends—have the greatest savings potential when installing PV; in the most positive cases, reductions of more than 35% in energy costs can be achieved over the installation lifetime. The cold room–photovoltaic combination seems to be very successful.
- (c)
Profitability of the PV
The new energy context is also associated with changes in the return on investment. The increase in the installed power required leads to a longer payback of the investment compared to smaller installations, with paybacks of more than 6 years in seasonal industries. The difference in payback between the scenarios maximising savings and the ones with the highest payback (1 kW power and PSH 5.0) can last several years. The uniform and constant consumption of a fruit and vegetable plant allows for paybacks 2 years lower than the others.
The uncertainty of possible future energy price variations and the initial investment required may justify a more conservative sizing. Maximising the ratio “Savings/payback” seems to be an appropriate reference for a sizing combining savings and profitability. The range of powers maximising the ratio is relatively small under a wide range of energy prices, with required powers significantly lower than the maximum savings scenario over 20 years. This results in a significant reduction in the required investment and associated payback (average 2.3 years), at the cost of sacrificing a small percentage of potential savings on the energy bill (average 2.4%).
- (d)
Reduction in energy consumption
In the current context, it is vital that the agroindustrial sector contributes to limiting energy dependence on other countries by reducing energy consumption. The search for profitability limits the reduction in annual energy consumption with maximum values close to 50% in the industry with the most stable pattern and 40% in the others.
- (e)
Sale of excess energy
In the most favourable scenario, the sale of the surplus generated by the PV requires a larger PV size if savings are to be maximised. However, the increase in the size of the PV is associated with a reduction in investment profitability and a greater risk in the face of future price changes. Industries with strong seasonality benefit more from increased revenues than non-seasonal industries, as they have larger surpluses.
When there are legal restrictions, such as limiting the payment of surpluses to the industry’s daily consumption, the outcome would tend to be similar to those described in previous sections. Therefore, in each specific scenario, depending on the excess payment and the other variables involved, the sizing of the installation must be carried out by combining the search for greater savings in terms of energy bills and the investment profitability that the industry is willing to assume.
Author Contributions
Conceptualization, J.L.G. and F.R.M.; methodology, J.L.G. and F.R.M.; software, A.P., R.M.B. and J.Á.; validation, A.P. and R.M.B.; formal analysis, F.R.M., A.P. and R.M.B.; investigation, A.P.; resources, J.L.G. and F.B.; writing, original draft preparation, F.R.M. and J.Á.; writing—review and editing, R.M.B., F.B. and J.Á.; visualization, A.P. and J.Á.; supervision, J.L.G. and F.B.; project administration, J.L.G. and F.B.; funding acquisition, J.L.G. and F.B. All authors have read and agreed to the published version of the manuscript.
Funding
This research received no external funding.
Data Availability Statement
The data presented in this study are available upon request from the corresponding author.
Acknowledgments
The authors would like to thank the participating agroindustries for their collaboration in the research, and also to the R+D+i 2023 Program of the UPM for the support received to carry out an international research stay.
Conflicts of Interest
The authors declare no conflict of interest.
References
- FAO. Renewable Energy and Agrifood Systems: Advancing Energy and Food Security towards Sustainable Development Goals|Knowledge for Policy. 2021. Available online: https://knowledge4policy.ec.europa.eu/publication/renewable-energy-agrifood-systems-advancing-energy-food-security-towards-sustainable_en (accessed on 9 November 2021).
- FAO. Energy-Smart Food for People and Climate. 2011. Available online: https://www.fao.org/family-farming/detail/es/c/285125/ (accessed on 18 July 2022).
- United Nations. Población n.d. Available online: https://www.un.org/es/global-issues/population (accessed on 3 July 2022).
- Food Drink Europe Annual Report 2021. Food Drink Eur 2021. Available online: https://www.fooddrinkeurope.eu/resource/fooddrinkeurope-annual-report-2021/ (accessed on 25 June 2022).
- Glatzl, W.; Brunner, C.; Fluch, J. GREENFOODS—Energy Efficiency in the Food and Beverage Industry. In Proceedings of the Eceee Summer Study on Energy Efficiency, Toulon/Hyères, France, 1–6 June 2015; pp. 1–6. [Google Scholar]
- MAPA Informe Anual de la Industria Alimentaria Española Periodo 2020–2021 (Annual Report of the Spanish Food Industry Period 2020–2021). 2021. Available online: https://www.mapa.gob.es/es/alimentacion/temas/industria-agroalimentaria/cifras-industria/ (accessed on 15 June 2022).
- MAPA Informe Anual de la Industria Alimentaria Española. Período 2021–2022 (Annual Report of the Spanish Food Industry Period 2021–2022). 2022. Available online: https://www.mapa.gob.es/es/alimentacion/temas/industria-agroalimentaria/cifras-industria/ (accessed on 15 June 2022).
- Tarifas de Electricidad—Som Energía. 2022. Available online: https://www.somenergia.coop/es/tarifas-de-electricidad/ (accessed on 3 July 2022).
- García, J.L.; Perdigones, A.; Benavente, R.M.; Mazarrón, F.R. Influence of the New Energy Context on the Spanish Agrifood Industry. Agronomy 2022, 12, 977. [Google Scholar] [CrossRef]
- Madurai Elavarasan, R.; Mudgal, V.; Selvamanohar, L.; Wang, K.; Huang, G.; Shafiullah, G.M.; Markides, C.N.; Reddy, K.S.; Nadarajah, M. Pathways toward high-efficiency solar photovoltaic thermal management for electrical, thermal and combined generation applications: A critical review. Energy Convers. Manag. 2022, 255, 115278. [Google Scholar] [CrossRef]
- Immonen, J.; Powell, K.M. Dynamic optimization with flexible heat integration of a solar parabolic trough collector plant with thermal energy storage used for industrial process heat. Energy Convers. Manag. 2022, 267, 115921. [Google Scholar] [CrossRef]
- Kata, R.; Cyran, K.; Dybka, S.; Lechwar, M.; Pitera, R. Economic and Social Aspects of Using Energy from PV and Solar Installations in Farmers’ Households in the Podkarpackie Region. Energies 2021, 14, 3158. [Google Scholar] [CrossRef]
- Martínez-Calahorro, A.J.; Jiménez-Castillo, G.; Rus-Casas, C.; Gómez-Vidal, P.; Muñoz-Rodríguez, F.J. Photovoltaic Self-Consumption in Industrial Cooling and Refrigeration. Electronics 2020, 9, 2204. [Google Scholar] [CrossRef]
- González-Peña, D.; García-Ruiz, I.; Díez-Mediavilla, M.; Dieste-Velasco, M.I.; Alonso-Tristán, C. Photovoltaic Prediction Software: Evaluation with Real Data from Northern Spain. Appl. Sci. 2021, 11, 5025. [Google Scholar] [CrossRef]
- Panaras, G.; Tzimas, P.; Tolis, E.I.; Papadopoulos, G.; Afentoulidis, A.; Souliotis, M. Combined Investigation of Indoor Climate Parameters and Energy Performance of a Winery. Appl. Sci. 2021, 11, 593. [Google Scholar] [CrossRef]
- Gómez-Lorente, D.; Rabaza, O.; Aznar-Dols, F.; Mercado-Vargas, M.J. Economic and Environmental Study of Wineries Powered by Grid-Connected Photovoltaic Systems in Spain. Energies 2017, 10, 222. [Google Scholar] [CrossRef]
- Garcia-Casarejos, N.; Gargallo, P.; Carroquino, J. Introduction of Renewable Energy in the Spanish Wine Sector. Sustainability 2018, 10, 3157. [Google Scholar] [CrossRef]
- Álvarez, F.J.; Xiberta, J. Energy Optimization of Distribution Centers of the Dairy Industry of the Dominican Republic through Photovoltaic Installations and Saving and Efficiency Measures. Proceedings 2018, 2, 1475. [Google Scholar] [CrossRef]
- Jiménez-Castillo, G.; Muñoz-Rodríguez, F.J.; Martinez-Calahorro, A.J.; Tina, G.M.; Rus-Casas, C. Impacts of Array Orientation and Tilt Angles for Photovoltaic Self-Sufficiency and Self-Consumption Indices in Olive Mills in Spain. Electronics 2020, 9, 348. [Google Scholar] [CrossRef]
- Rabaza, O.; Contreras-Montes, J.; García-Ruiz, M.J.; Delgado-Ramos, F.; Gómez-Lorente, D. Techno-Economic Performance Evaluation for Olive Mills Powered by Grid-Connected Photovoltaic Systems. Energies 2015, 8, 11939–11954. [Google Scholar] [CrossRef]
- Bilčík, M.; Božiková, M.; Čimo, J. Influence of Roof Installation of PV Modules on the Microclimate Conditions of Cattle Breeding Objects. Appl. Sci. 2021, 11, 2140. [Google Scholar] [CrossRef]
- Lakomiak, A.; Zhichkin, K.A. Photovoltaics in horticulture as an opportunity to reduce operating costs. A case study in Poland. J. Phys. Conf. Ser. 2019, 1399, 044088. [Google Scholar] [CrossRef]
- Elamri, Y.; Cheviron, B.; Lopez, J.-M.; Dejean, C.; Belaud, G. Water budget and crop modelling for agrivoltaic systems: Application to irrigated lettuces. Agric. Water Manag. 2018, 208, 440–453. [Google Scholar] [CrossRef]
- Weselek, A.; Bauerle, A.; Zikeli, S.; Lewandowski, I.; Högy, P. Effects on Crop Development, Yields and Chemical Composition of Celeriac (Apium graveolens L. var. rapaceum) Cultivated Underneath an Agrivoltaic System. Agronomy 2021, 11, 733. [Google Scholar] [CrossRef]
- AL-agele, H.A.; Proctor, K.; Murthy, G.; Higgins, C. A Case Study of Tomato (Solanum lycopersicon var. Legend) Production and Water Productivity in Agrivoltaic Systems. Sustainability 2021, 13, 2850. [Google Scholar] [CrossRef]
- INE Encuesta Industrial Anual de Productos 2020: Frutas y Hortalizas 2021. Available online: https://www.mapa.gob.es/es/agricultura/temas/producciones-agricolas/frutas-y-hortalizas/ (accessed on 18 July 2022).
- INE Encuesta Industrial Anual de Productos 2020: Vitivinicultura 2021. Available online: https://www.mapa.gob.es/es/agricultura/temas/producciones-agricolas/vitivinicultura/ (accessed on 18 July 2022).
- Kavlak, G.; McNerney, J.; Trancik, J.E. Evaluating the causes of cost reduction in photovoltaic modules. Energy Policy 2018, 123, 700–710. [Google Scholar] [CrossRef]
Figure 1.
Monthly energy consumed in each of the industries analysed.
Figure 1.
Monthly energy consumed in each of the industries analysed.
Figure 2.
Maximum power demand in the industries analysed.
Figure 2.
Maximum power demand in the industries analysed.
Figure 3.
Daily average of incident radiation on horizontal plane (kWh/m2 day) in the 3 sub-scenarios considered. Data extracted from EnergyPlus climatological files.
Figure 3.
Daily average of incident radiation on horizontal plane (kWh/m2 day) in the 3 sub-scenarios considered. Data extracted from EnergyPlus climatological files.
Figure 4.
Example of the relative cost of energy supply versus the case of not having PV, considering a period of 20 years in a fruit and vegetable plant and 4.0 PSH. Scenarios maximising savings are represented using points and maximising the “Savings/payback” ratio are represented using crosses.
Figure 4.
Example of the relative cost of energy supply versus the case of not having PV, considering a period of 20 years in a fruit and vegetable plant and 4.0 PSH. Scenarios maximising savings are represented using points and maximising the “Savings/payback” ratio are represented using crosses.
Figure 5.
PV power ranges that maximise savings over 20 years (top) and the “Savings/payback” ratio (bottom) for different values of the energy price. Upper limits for 5.0 PSH, intermediate points for 4.0 PSH and lower limits for 3.0 PSH.
Figure 5.
PV power ranges that maximise savings over 20 years (top) and the “Savings/payback” ratio (bottom) for different values of the energy price. Upper limits for 5.0 PSH, intermediate points for 4.0 PSH and lower limits for 3.0 PSH.
Figure 6.
Savings generated in energy bills (PV investment and maintenance + annual electricity bills) compared to the scenario without PV over a period of 20 years. Scenarios maximising savings (top) and “savings/payback” ratio (bottom). Upper bounds for 5.0 PSH, mid-points for 4.0 PSH and lower bounds for 3.0 PSH.
Figure 7.
Example of variation of PV payback as a function of installed power for the fruit and vegetable plant and PSH 4.0. Scenarios maximising savings over 20 years are represented using points and maximising the “Savings/payback” ratio are represented by crosses.
Figure 7.
Example of variation of PV payback as a function of installed power for the fruit and vegetable plant and PSH 4.0. Scenarios maximising savings over 20 years are represented using points and maximising the “Savings/payback” ratio are represented by crosses.
Figure 8.
Payback of the PV installation in the scenarios that maximise savings (top) and the “Savings/payback” ratio (bottom). Upper limits for PSH 3.0, intermediate points for PSH 4.0 and lower limits for PSH 5.0.
Figure 8.
Payback of the PV installation in the scenarios that maximise savings (top) and the “Savings/payback” ratio (bottom). Upper limits for PSH 3.0, intermediate points for PSH 4.0 and lower limits for PSH 5.0.
Figure 9.
Reduction in annual energy consumption compared to the scenario without PV (% of 115,000 kWh/year). Scenarios maximising savings (top) and “Savings/payback” ratio (bottom). Upper limits for 5.0 PSH, mid-points for 4.0 PSH and lower limits for 3.0 PSH.
Figure 9.
Reduction in annual energy consumption compared to the scenario without PV (% of 115,000 kWh/year). Scenarios maximising savings (top) and “Savings/payback” ratio (bottom). Upper limits for 5.0 PSH, mid-points for 4.0 PSH and lower limits for 3.0 PSH.
Figure 10.
Example of the savings achieved on the energy bill over a period of 20 years depending on the percentage charged by the industry for excess energy. Case of a fruit and vegetable plant and 4.0 PSH.
Figure 10.
Example of the savings achieved on the energy bill over a period of 20 years depending on the percentage charged by the industry for excess energy. Case of a fruit and vegetable plant and 4.0 PSH.
Figure 11.
Example of PV payback variation for different investment costs and energy prices for a fruit and vegetable plant with 25 kW PV and 4.0 PSH.
Figure 11.
Example of PV payback variation for different investment costs and energy prices for a fruit and vegetable plant with 25 kW PV and 4.0 PSH.
| Disclaimer/Publisher’s Note: The statements, opinions and data contained in all publications are solely those of the individual author(s) and contributor(s) and not of MDPI and/or the editor(s). MDPI and/or the editor(s) disclaim responsibility for any injury to people or property resulting from any ideas, methods, instructions or products referred to in the content. |
© 2023 by the authors. Licensee MDPI, Basel, Switzerland. This article is an open access article distributed under the terms and conditions of the Creative Commons Attribution (CC BY) license (https://creativecommons.org/licenses/by/4.0/).


 ,
, 


