
Sustainable Grazing by Cattle and Sheep for Semi-Natural Grasslands in Sweden
by
 , , and
Anders Glimskär
1,*,
Jan Hultgren
2,
Matthew Hiron
1,
Rebecka Westin
2,
Eddie A. M. Bokkers
3 and
Linda J. Keeling
4 1
Department of Ecology, Swedish University of Agricultural Sciences, 75007 Uppsala, Sweden
2
Department of Animal Environment and Health, Swedish University of Agricultural Sciences, 53223 Skara, Sweden
3
Animal Production Systems, Department of Animal Sciences, Wageningen University and Research, 6700AH Wageningen, The Netherlands
4
Department of Animal Environment and Health, Swedish University of Agricultural Sciences, 75007 Uppsala, Sweden
*
Author to whom correspondence should be addressed.
Agronomy 2023, 13(10), 2469; https://doi.org/10.3390/agronomy13102469
Submission received: 24 July 2023
/
Revised: 20 August 2023
/
Accepted: 14 September 2023
/
Published: 25 September 2023
(This article belongs to the Special Issue Advance in Grassland Productivity and Sustainability)
Abstract
:Despite their importance for biodiversity and other ecosystem services, many semi-natural grasslands deteriorate or have even disappeared due to insufficient grazing and neglect. Preservation of grassland habitats depends on a good understanding of sustainable grazing management as well as effective agricultural policy measures that ensure long-term economic sustainability for the farmer. Through meta-evaluation and synthesis of previous investigations and discussion of scientific literature, we aimed to evaluate factors that determine the extent to which cattle and sheep in Sweden graze semi-natural grasslands instead of more productive land and what this means for biodiversity and sustainability. We also aimed to propose which practises and policy measures may be the most cost-effective to promote habitat quality and the sustainable use of grasslands. Results from a nationwide survey of Swedish farmers’ attitudes towards agri-environmental payment schemes are discussed in relation to farm characteristics and other factors influencing the use of cattle and sheep for sustainable grazing. This study supports recommendations by environmental economists that payments should be targeted more strongly at the most valuable grasslands, emphasising the need for a more detailed and nuanced framework for classifying grasslands in Europe. A comparison with independent estimates of the area of agricultural land from nation-wide, sample-based monitoring shows that the data from official statistics normally used for nationwide evaluations are partly biased and of insufficient quality, underscoring the need for more sophisticated and precise methods for monitoring both overall trends and detailed environmental effects related to the preservation of semi-natural grasslands.
1. Introduction
Sustainable utilisation of grasslands is an important topic in many countries and has become increasingly important in the work to achieve the United Nations' Sustainable Development Goals [1]. The use and management status of grasslands in Europe depend largely on consumer demands, policy directives, and environmental conditions such as soil type and climate [2,3,4,5,6]. Grasslands have an important role in food production since ruminants can convert non-edible biomass into edible products for humans. However, grasslands are also important for the delivery of several ecosystem services, including water flow regulation, reduction of greenhouse gas emissions, and provision of pollinator habitats, even if the actual contribution to such services has rarely been quantified [7,8,9,10,11,12,13,14,15].
Natural or semi-natural grasslands can be defined as grasslands more or less strongly influenced by long-term grazing or mowing but not strongly influenced by cultivation (ploughing, seeding, or fertilization). Such grasslands are usually characterised by lower nutritional value and constraints on vegetation growth by climate and topography [12,13,16,17]. This, in combination with a generally lower intensity of management, can lead to heterogeneity over space and time in grazing impact and vegetation structure. One consequence of such variation is that more ecological niches are available for wild plants and animals, which contributes to biodiversity [5,18,19,20]. Low-productive semi-natural grasslands with a long history of grazing or mowing are very important for the preservation of biodiversity since they include some of the most species-rich habitats in agricultural landscapes [5,16,20,21,22,23]. Despite their importance for biodiversity, many semi-natural grasslands in Europe and other parts of the world have disappeared or deteriorated due to abandonment, over-fertilization, overgrazing, or insufficient grazing [2,3,13,17,21,24,25,26,27,28]. In Sweden, earlier evaluations of factors that influence the use of semi-natural grasslands have mainly focused on general environmental factors and management types [29,30,31,32] and less on variation between farmers, farms, and regions. Nationwide evaluations and surveys of valuable grasslands have highlighted the need to take into account the large variation in climate, vegetation type, species richness, and productivity [33,34,35,36]. The most apparent gradients are related to altitude and latitude, from arctic and alpine regions in the north and northwest to temperate and nemoral regions in the south, but also include a very large local variation. In northern Sweden, the proportion of agricultural land is much smaller, and the historical continuity of grazing is much shorter. The most species-rich grasslands are found in the dry and often calcareous grasslands in the southeast parts of the country [34,37,38], which corresponds to similar trends in other countries [6].
At the farm level, however, grassland management decisions made by individual farmers often determine the outcome of land use patterns and the potential for grasslands to deliver ecosystem services [39,40,41,42,43]. The priorities of the farmers are influenced by policy measures like agri-environmental payment schemes, which may be directly designed to stimulate grazing on relatively low-productive semi-natural grasslands. However, it is not only the contribution to the farm economy that determines the decisions of farmers in relation to such measures but also administrative, logistical, and social factors [29,42,44,45,46]. Indeed, grazing may not even be a management option for some specialised arable farms.
Until now, there has been a lack of knowledge about the various reasons why semi-natural grasslands are or are not grazed and how this influences biodiversity, in particular knowledge that explicitly takes into account differences among farms and regions [31,32,35,43]. Publications that evaluate the effectiveness and cost-efficiency of agri-environmental payments are generally based on data from national administrative databases but seldom go into detail about the characteristics of individual farms and differences in how the agri-environmental scheme rules are perceived and interpreted at the farm level. Secondly, the administrative data used for the evaluations was not primarily intended or designed to be used for evaluation or analysis of trends and may therefore contain biases or a lack of information or content. As regards the actual effects of policy measures on biodiversity, the information (if present) is often not presented with the overall variation among grassland types or regions in mind. Therefore, the advice from policy evaluations should be linked to farm characteristics and geographical variation in grassland availability.
We aimed to evaluate factors that determine to what extent cattle and sheep in Sweden graze semi-natural grasslands instead of more productive land and what this means for biodiversity in such habitats. More specifically, we attempted to identify and describe: (1) Variation in conditions on Swedish semi-natural grasslands, which affects the grazing requirements and political priorities, making comparisons with other countries with a comparable landscape structure; (2) Variation in farmers’ priorities and motives for using semi-natural grasslands for grazing, including environmental, economic, social and animal health considerations; (3) The most efficient policy measures and evaluation tools to achieve sustainable land use and preserved biodiversity by grazing in relation to, e.g., EU Common Agricultural Policy (CAP); (4) Requirements for evaluating effects of grassland grazing on biodiversity, biomass production available for grazing, and animal supervision, taking into account the large variation in grassland types and grazing demands. To achieve these aims, we analysed a previously unpublished nationwide survey of farmers’ attitudes and carried out additional analyses of environmental monitoring data from different grassland types in Sweden. How these data were obtained and analysed is presented in the next section. The main part of this paper, however, is the meta-evaluation of evidence from our own and other sources, presented in subsequent sections, each focusing on a different issue related to the sustainable grazing of semi-natural grasslands.
2. Material and Methods for the Additional Data Analyses
2.1. Data Acquisition
Data were acquired from a previous survey of farmer attitudes by the Swedish company Mind Research (unpublished, 2017) [47]. The survey was commissioned by the Swedish Board of Agriculture, aiming to better understand how farmers used grazing and their attitudes towards agri-environmental payment for grazing, as presented by Karlsson [47]. The focus of the survey was the payment scheme for management of pastures and meadows under CAP pillar II, and the replies related to farmers’ attitudes regarding their five-year commitments within the programme period for agri-environmental schemes in Sweden at the time (2014–2020). The survey was performed during August–September 2017 as a postal questionnaire with telephone reminders, with a total of 23 questions related to the size and number of animals at the farm, which areas of the farm were used for grazing and hay harvesting, which agri-environmental payments had been granted, and the farmer’s response and attitudes in relation to the rules for payment (Swedish Board of Agriculture and Mind Research, unpublished, 2017). The questionnaire was sent to 2600 Swedish farmers and was answered by 1117 farmers (43% response rate), out of a total population of 30,000 farms in Sweden. The results were weighted to represent the total population of farms with respect to two herd size categories for cattle (1–100 or >100) and sheep (1–50 or >50), respectively, and four geographical regions. The four regions corresponded to an administrative division of Sweden based on the dominant structure of the landscape and other factors influencing the potential for farm production (“jordbrukets produktionsområden”) [48].
To exemplify some of the most important aspects of small-scale and large-scale variation relevant for the handling and evaluation of agri-environmental policy tools, data were also collected from a monitoring programme by the Swedish University of Agricultural Sciences [49,50]. Starting in 2015, and as an extension of an earlier monitoring programme, a group of 18 Swedish county administrative boards (out of a total of 21) commissioned the Swedish University of Agricultural Sciences to start sample-based data collection for environmental monitoring of all agricultural grassland types [49]. This was done using stratified sampling [51,52,53,54] in landscape squares distributed over the total land area within all the participating counties [49]. According to the design of the monitoring programme, each landscape square was revisited every sixth year to evaluate both the spatial relations of grasslands and the changes in area, land use, vegetation structure, and natural quality for biodiversity over time. The dataset included data from 2015 to 2020, which was the full dataset from the six-year rotational sample. This sampling design implies that each site in the long-term time series is visited once every sixth year, and each year contains a random sample of sites from the full six-year period.
The methods for data collection in the monitoring programme included mapping of grassland habitats in both arable and semi-natural land with visual interpretation of aerial photographs in 3D, using frequently updated, high-resolution false-colour infrared aerial photographs in a digital computer environment [55,56]. This included full-cover mapping of polygons of arable land and pastures with 0.1 hectares as the minimum mappable unit and precision of polygon borders to a maximum 4 m deviation within landscape squares with a size of 3 × 3 km. Arable land and pasture grasslands were classified in accordance with existing statistics and official definitions and with high relevance to gradual land use changes and effects on habitat quality over time [50]. Within these grasslands, an additional sample of field plots with a 3-m radius were randomly distributed, and an extensive list of vascular plants, bryophytes, and lichens was used to describe plant species number and composition. For each circular plot, we used the total number of plant species as a continuous variable and a threshold value of five or more indicator species based on indicator values for reaction to grazing or mowing management by Tyler et al. [57] to categorise plots into “species-rich” or "species-poor," respectively. In addition, land use type and vegetation structure were described by a number of quantitative or categorical variables [49]. Earlier studies have shown that plant indicator values for, e.g., nutrients and moisture can be useful as efficient proxies for environmental factors determining management effects, productivity, and potential value for biodiversity in grasslands and other habitat types [23,36,58,59,60]. In the field plots of the monitoring programme, a classification of valuable grassland habitats was made for each of the plots as a data source for Sweden’s reporting to the EU’s Habitats Directive [61]. These data were also used to indicate which of the grasslands had a particularly high natural value.
2.2. Statistical Analysis
Results from sample-based monitoring data from grassland were used in this study to exemplify some of the most important aspects of small-scale and large-scale variation relevant for the handling and evaluation of agri-environmental policy tools. All included variables were treated as binary variables in the calculations, coded as 1 or 0. To compare proportions between groups, two-tailed adjusted Wald’s two-sample z tests for proportions were performed, setting alpha to 0.05. The variation among geographical regions and several levels of soil moisture and nutrient availability were only illustrated in figures and not tested statistically. All statistical analyses were made in SAS JMP software 16.0.0.
3. Variation in Biodiversity Value and Environmental Conditions of Grasslands
Before Swedish forestry became a lucrative business in itself, the land used for grazing was often forested with stony soils or sometimes rocky outcrops with thin soil layers, not suitable for more intensive agricultural uses such as mowing for hay or cultivation of crops [16,22]. When artificial fertilisers and efficient machinery for ploughing became available, more land could be intensively cultivated. Land with heavy clay soils, for example, could be drained, ploughed, and used for growing arable crops, and hay could be taken from cultivated leys (temporal grasslands). This meant that more land became available, and grazing could take place on better land formerly used for mowing or cultivation [19,22,62,63].
Present-day pastures can have a history of forest, hay meadow or arable land in different combinations and of different ages. Much of the land that currently has the vegetation and natural values of semi-natural grasslands was actually used for cultivation in the past [5,6,63,64]. The relationship between the time after last cultivation and the value for biodiversity depends heavily on soil conditions, moisture and tree layer. All this contributes to a large variation in the types of land in Sweden used for grazing and mowing nowadays [9,18,19,23,37,38].
Soil conditions are of fundamental importance to understanding and predicting both the production and biodiversity values of grasslands. In effect, both the biodiversity of plants in grassland vegetation [6,65] and the productivity in terms of biomass per hectare available for grazing are influenced by soil type and moisture in very much the same way [14,33,66]. However, empirical data on biomass production in relation to site characteristics and the effects of management by grazing on vegetation quality in Swedish semi-natural grasslands are scarce and partly unreliable [66]. In an attempt to predict the availability and possible lack of grazing animals in various parts of Sweden, Blom [33] used climate-related regional data for a quantitative model linking biomass production to vegetation type, length of the growing season, and the estimated availability of grazing animals. The study of Blom indicated that the availability of grazing cattle, sheep, and horses was a limiting factor for sufficient management of the available grasslands in about 40% of the 276 municipalities in Sweden [33].
The tradition of using forested land for extensive grazing partly explains why the majority of semi-natural grassland in Sweden still has quite a large amount of trees and shrubs, with varying coverage and structure. Wooded pastures and meadows may even be particularly useful in some regions because the intermediate shading reduces evaporation from plants and heat stress in animals during hot summer periods (mainly in south-eastern Sweden) and because leaves and twigs can be used as fodder [21,67]. However, it is common practise to remove woody plants because it is difficult to achieve a grazing intensity that completely prevents spontaneous recruitment and expansion of trees and shrubs [68]. What is a favourable status and an appropriate land management for biodiversity or cultural landscape values is determined by the extent to which trees and shrubs are valuable as traditional and desirable characteristic components of the site and should be maintained or are expanding because of insufficient grazing and should be removed [68,69,70].
Since the most productive and intensively used agricultural land is usually situated close to the farm centre, the most valuable grasslands for biodiversity and traditional cultural landscape preservation are often located in remote areas. The management may be labour-intensive and costly due to the need for repeated clearing, fencing, and time-demanding attendance and transport of animals. In Sweden, it has been repeatedly suggested that larger continuous pasture areas should be encouraged and facilitated by including adjacent woodland or other land to reduce the costs of fencing, attendance, and other management activities [16,46,71]. However, this would require more flexible agricultural policies and agri-environmental schemes [32,44], as well as new technical solutions for, for example, fencing or more efficient use of buildings for shelter, to save costs and labour [11,43]. It may also require a more sophisticated approach to regulations, management advice, monitoring, and evaluation tailored to local and regional variations in productivity, grazing costs, animal welfare, natural values, and other ecosystem services [11,72]. For example, Jamieson and Hessle [43] suggested that both cattle and sheep should be kept outdoors more often, even in winter, if they are sheltered from wind and if adequate measures are taken to prevent trampling damage and the accumulation of manure on the ground. The authors also indicated that so-called “virtual fencing” can be cost-effective for cattle. This is a technology where the animals wear collar-mounted GPS units that emit an audio tone or electrical pulse when an animal approaches the virtual fence line.
4. Incentives and Attitudes to Agri-Environmental Payment among Farmers
Several studies have concluded that economic and structural factors, such as farm size and ownership (tenancy), are important for farmers’ adoption of environmental management practices, but that socio-demographic factors and attitudes may also have a large and often underestimated impact [41,42,73,74]. Hansson and Ferguson [75] have shown the importance of such factors for strategic development decisions on Swedish dairy farms. Furthermore, farm size in itself may be correlated with on-farm landscape heterogeneity and the biodiversity of various organism groups [76].
Several studies have attempted to categorise farmers by their behaviour and attitudes. For example, Methorst et al. [77] used dairy farmers’ perceptions of opportunities for farm development to distinguish between three main options for future production: (1) to diversify, (2) to get more income from other sources (and possibly stop dairy production), and (3) to maximise production. This categorisation was useful to interpret differences in development at the farm level. Andersen et al. [78] compared farms according to size and type (for example, small hobby farms vs. large full-time farms) and showed that they differed in their willingness to adopt a multifunctional perspective that also included recreation and the provision of wildlife habitats. In a review, Burton [79] focused on farmer age, experience, education, and gender as important factors to determine behaviour in relation to environmental concern but concluded that the effects of such factors are complex and also influenced by cultural-historical patterns. According to Johansen et al. [13], Henle et al. [2] and FAO [17,26], more effort should be made to monitor and design indicators of possible conflicts between agricultural production and biodiversity conservation.
Boke Olén et al. [80] combined a set of quantitative indicators to analyse landscape change in relation to farm type for three regions of Sweden. The overall trends between 2008 and 2016 were similar for the three regions in terms of the total farm area and the proportion of semi-natural pastures. However, there were marked differences among farm types. Farms dominated by dairy, pig, or poultry production became larger, and there was a sharp reduction in the number of farms, which led to a slow decrease in the total area of agricultural land. However, farms with grass-based beef production increased in total area despite a decrease in the number of farms, and farms with field crops increased in both area and number. There were also large differences between the farm types in landscape openness, semi-natural grassland area, High Nature Values (HNV) area, and greenhouse gas emissions [80].
Pavlis et al. [45] presented a thorough discussion of different farm conditions in European grasslands, with great relevance for Sweden. The authors found large farms in general to be more likely to apply for agri-environmental payments, in which farmers may be granted payment in exchange for providing services linked to, for example, conservation of biodiversity, typically by maintaining grazing or mowing on land with high values for biodiversity. However, this was said to apply to a much greater extent to farms with livestock production than to those with crop production. The authors also referred to studies showing that younger farmers more often participate in agri-environmental schemes out of a personal interest in conservation, whereas older farmers take part to a lesser extent and then mainly for economic reasons. Family traditions and social factors were also important for some farmers. Lack of information or knowledge seemed to be a major reason hobby farmers did not participate [45].
5. Cost-Effectiveness of Policy Measures
Batáry et al. [81] emphasised that it is a common feature of European landscapes that areas of biodiversity interest are to a large extent linked to continued long-term agricultural practices. This is in contrast to other continents, such as North and South America, where agricultural practises are often not linked to high biological conservation values. In their review from 2015, they concluded that in general, studies showing positive effects of agri-environmental payments have generally been performed in countries and regions with intensive agriculture and a high proportion of cropland, for example, the United Kingdom and Germany, rather than in regions with agriculturally marginal practices. Also, new eastern EU member states have adopted similar practices, also in extensively farmed areas, with seemingly little or even negative effects on biodiversity [82,83].
It has frequently been shown from evaluation studies in the last decades that the existing agri-environmental schemes in the EU's CAP have often failed to prevent environmental deterioration. They may even, in some cases, have actively favoured agricultural intensification. This is mainly because they do not sufficiently take into account the large variation among farms and in the various factors influencing the decision-making of farmers [42], where the variation tends to be larger between farms within EU countries than between countries, despite the variation among countries in how the payment schemes are implemented. It is a conclusion with very general applicability within the EU that the agri-environmental scheme needs to be much more target-oriented, with specific aims, with a participatory design, and with simple, trusted implementation [42].
As a comparison with countries outside the EU, Norway has since the early 1970s, through legislation and economic subsidies, actively favoured traditional, small-scale farming, even in remote locations and regions with less favourable conditions for farming [84]. This is the reason Norway has significantly smaller farms than, for example, Sweden, which has much more actively favoured rationalisation into larger and structurally more efficient farms. Especially traditional mountain summer farming with diversified milk production in a varied and biologically rich landscape has remained a viable form of land use for much longer in central Norway than in Sweden [85]. However, more recently, in Norway, rationalisation and intensification have increased because the payments have not been sufficient to stop the decline in farm numbers [84].
In Switzerland too, a very active policy for preserving valuable landscapes and encouraging traditional grazing management has had clear effects [86]. This has been achieved through ambitious payment schemes focused on both cultural values and biodiversity, with payments based on detailed criteria such as the number of grazing days per season and the number of grazing animals. Furthermore, for decades, Switzerland has implemented a payment scheme based on a multitude of indicators, both positive quality indicators such as the occurrence of valuable plant species and indicators of negative influence such as erosion and shrub encroachment [86]. Ansell et al. [44] emphasised the importance of evaluating the cost-effectiveness of agri-environmental schemes in combination with assessments of their effects on biodiversity conservation and other public goods. According to their review, very few studies of the environmental effects of Common Agricultural Policy (CAP) measures have included costs and cost-effectiveness, which limits the usefulness of such studies as a basis for policy decisions. Despite this, Ansell et al. [44] argued that such evaluations should be performed much more often.
Brady et al. [32] evaluated important aspects of the CAP measures from both a European and Swedish perspective by contrasting and comparing economic models. The direct payments in CAP Pillar I are based on the area of agricultural land, and it is clear that the payments contribute significantly to keeping large areas of land in active use, especially marginal land. However, this form of payment has negative side effects, such as lower incentives for structural change and capitalisation due to higher prices to buy or rent farmland, making it inefficient. Brady et al. [32] predicted that it has hardly any effect on the total area of agricultural land in regions with intensive, high-productive agriculture, which would also exist without this additional payment. According to the same authors, the goal of preserving agricultural land in active use would be achieved more efficiently, at a much lower cost, and with fewer unintended side effects by directing the payment specifically to maintaining the use of marginal agricultural land with high costs and low productivity, i.e., land with the highest risk of being abandoned. The resources made available could then be used to increase the agri-environmental payments for activities that specifically benefit public goods, such as investments for reducing emissions, creating wetlands for nutrient retention, and managing low-productive grasslands for biodiversity. In order to achieve the goals of the CAP, the instruments must therefore better than today take into account regional characteristics and local conditions for land use [32,80].
A common strategy of several EU countries to deal with poor performance of agri-environmental schemes and low interest of farmers is to work towards some type of result-based payment scheme where farmers themselves can take a more active part in the evaluation and selection of activities. The higher flexibility and the link to actual effects on biodiversity can lead to a higher level of engagement and better cost efficiency [87,88]. However, this puts high demands on good and practically feasible indicators that can be linked to environmental effects [89,90]. Studies of farmers’ attitudes toward such reforms have been performed, for example, in Finland, Ireland, and Germany, where the expectations seem to be mixed but often cautiously optimistic [91,92,93,94].
The seemingly inefficient aspects of the CAP and the high costs for subsidies and payments have also led to a broader discussion of how the objectives can be reached and farmers compensated for costs and loss of income related to environmental management in relation to the newly adapted greening measures of Ecological Focus Areas and the European Green Deal [95]. This again highlights the importance of taking into account not only social, economic, and structural factors but also variation in attitudes and behaviour [42], and more scientifically well-founded requirements and incentives for such measures [96,97]. The Farm to Fork Strategy adopted by the EU in 2020 also puts this in context with climate policy and other broader policies for sustainable development [98].
Several studies [25,32,35,73,99] have concluded that agri-environmental payments and other guidelines for management would be much more cost-effective if they more clearly addressed the grasslands that are most valuable and that are most in need of support for maintaining appropriate grazing.
Some of the evaluation studies also emphasised that a large proportion of the payments went to farms in regions with the most intensive and productive agriculture, where grazing would be economically sustainable and where farmers, to a large extent, would manage the grasslands without such payments [25,32,73]. Brady et al. [32] concluded that a crude area-based payment scheme would counteract land abandonment in regions with marginal agriculture but would have much less effect in productive regions. The combination of production-based support in the direct payments in Pillar I and the payments for environmental values in Pillar II introduces conflicts of incentives, which to a large extent counteract the effects of the agri-environmental payments themselves. For example, in Sweden, the productivity criteria in Pillar I were implemented as a tree density limit to which grasslands were granted direct payments. Even if wooded pastures with high natural values were entitled to the agri-environmental payment of Pillar II, the strict implementation of this rule often led to the loss of direct payments for such land, which drastically reduced the economic incentives for maintaining the grazing or mowing management [68].
6. Data Quality and Availability for Evaluating Grazing Effects and Sustainability Goals
Attempts have been made to calculate the demand for grazing animals in all parts of Sweden, taking into account estimated biomass production in various vegetation types in relation to, for example, climate variation [33]. However, a recent study indicated that the available data on biomass production and nutritive quality from different types of semi-natural grasslands are too few and unreliable and may underestimate biomass production [66]. In addition, several Swedish studies have shown that grazing effects on biodiversity are not always simple and consistent but that they vary between animal species groups [18,100] and between sites and regions [36,101]. Similar results have been presented from other countries. For example, Diekmann et al. [23] showed that wet grasslands in Germany change and lose their natural values much faster than dry grasslands due to nutrient enrichment or changes in land use. In a broad comparison of land use type and history, Bonari et al. [102] emphasised that a variety of management types within and among landscapes is necessary to preserve a broad range of species diversity. A summary of the variation in land use, environmental factors, and vegetation in the Palearctic is provided by Dengler et al. [5].
The large variation in environmental conditions, biodiversity, and biomass production highlights the demands for more process-oriented studies of the management effects of grazing over a large range of ecological and geographical gradients as a background for broadly applicable and reliable policy decisions and priorities and for reliable statistics and evaluations. Prescriptions for grazing and mowing also need to take into account that the Swedish grasslands are almost always heterogeneous and include variation in site conditions [16,18,46,103]. A recent review of international scientific literature [104] highlighted some of the potential problems with designing and interpreting results from studies that aim to evaluate intervention measures, with a special focus on agri-environmental schemes. The review revealed disturbing weaknesses in study design and an unwillingness to discuss possible biases and caveats in scientific studies of intervention effects related to CAP measures. A majority of the 215 reviewed studies that attempted to investigate the environmental effects of agri-environmental payment schemes or organic farming did not include appropriate statistical control-impact or before-after treatments in the study design and also did not evaluate or discuss possible sources of bias [104]. The quantitative and structured review by Josefsson et al. [104] constitutes a meta-evaluation [105,106] in relation to the effects of policy measures.
7. Farmers’ Attitudes towards Agri-Environmental Schemes
Nitsch [29] conducted in-depth interviews with Swedish farmers in various types of farms and regions. Interviewees emphasised that the trend towards larger farm sizes also leads to higher costs for transporting animals, and higher investments in equipment entail demands for high revenues. In contrast, the farmers pointed out, it is more difficult for smaller farms to mobilise the money needed for large investments. Most farmers were supportive of keeping semi-natural grasslands but could feel controlled by rigid regulations. A common comment was that grazing intensity regulations must allow for variation between years, as weather conditions lead to large differences between years in biomass production and the timing of grazing and harvest. Other comments related to the preservation of trees and shrubs, with farmers often favouring a mosaic of open and wooded areas, both for aesthetic reasons and because trees provide additional shelter from wind and rain for grazing animals. The responding farmers also would like more flexible fencing rules for semi-natural grasslands, which today may not be fenced together with improved grassland on former arable land due to a risk of nutrient transfer to the semi-natural grasslands [103]. It was felt that fencing larger areas, including more grassland types, would facilitate the maintenance of a mosaic landscape [29,71].
The survey of farmers’ attitudes indicated that farms in mosaic regions in southern Sweden had a considerably higher proportion of permanent pasture (including semi-natural grasslands), whereas the opposite was the case in northern Sweden (Figure 1).
Furthermore, the data also showed that cattle farms in northern Sweden had a much higher proportion of grasslands where the farmers had not applied for any agri-environmental payment (“NP”) compared to when the farmers had applied for such agri-environmental payment (“SV” and/or “GV”) for all or parts of the grasslands in the farm (Figure 2). This indicates that there is an important regional factor that should be taken into account in further investigations. For sheep farms, there is a low proportion of farms that have agri-environmental payments in all regions, but the differences between regions are also large (Figure 3).
The attitude survey also showed large variation among farmers in what determined how they used their land for grazing. In general, farmers appreciated the agri-environmental payments for grazing or mowing semi-natural grasslands, acknowledged that they contributed to the continued management of such land, and could see the environmental benefits [47]. However, there were a large number of reasons for not applying for the subsidy payment in spite of this, the most common being concerns about sanctions (Figure 4).
Based on the attitude survey, several authors concluded that many farmers found the agri-environmental schemes to be useful [31,47]. However, 71% of the farmers replied that they would have managed the land in the same way without payment, which was interpreted by the Board of Agriculture [31] as meaning that there should be a rise in payment for the most valuable grasslands in terms of biodiversity because the need for detailed and specific rules and guidelines is the highest. Furthermore, the main effect until now has been improved incentives for managing seminatural grasslands overall rather than specific changes in management practices. The farmer's reply to how the agri-environmental payments influenced management decisions on a more detailed level gave a complex and partly contradictory picture of the grazing period and clearing of woody plants. The most common and consistent reply was that supplementary feeding would have been used more if it had been allowed in the agri-environmental scheme regulations (Figure 5). This might imply that farmers were concerned about the welfare of the grazing animals. However, Hultgren et al. [107] found no evidence for a relationship between the body condition of grazing cattle or sheep and the use of semi-natural grasslands for grazing. By combining free-text comments from the survey, Karlsson [47] obtained a more detailed picture, which would require a more in-depth evaluation with even more information about farm characteristics and possibly a set of follow-up questions in a future nationwide questionnaire. Land ownership was highlighted, for example, if the landowner or tenant who used the land for grazing was the one applying for an agri-environmental payment.
The main findings by Karlsson [47], based on results from the attitude survey of Swedish farmers, can be summarised as follows, separated according to general patterns relating to animal and farm type:
Sheep farms:
- On average, farms are smaller and have a high proportion of semi-natural grasslands.
- Focus on landscape care rather than production—especially on small part-time farms.
- More concerned about costs for attendance and fencing
- More sensitive to wild predators (wolves, etc.)
- Animal care is more sensitive to parasites.
Small farms with cattle, mainly beef:
- A higher proportion of these farms are in forest regions and in northern Sweden.
- A larger proportion of farmers are above retirement age.
- More reluctant to the administrative effort of applying for payment.
- Fewer animals per unit area
- More pressure on the farm economy because of lower income in relation to costs
Large farms with livestock grazing cattle for beef production:
- Often, farmers apply for agri-environmental payments.
Large dairy farms:
- Smaller area proportion of semi-natural grassland
- Semi-natural grasslands are grazed mainly by heifers.
- Milk cows graze only productive land because of higher energy requirements.
Large farms with indoor meat production from bulls:
- Bulls are kept indoors all year around.
- Only focus on meat production
- Less interest in grazing or landscape care
Farms in general:
- Land ownership and leasing affect the ability to apply for payment since it is often the landowner that applies for payment, not the leaser of land for grazing.
- Result-based payment may have higher efficiency and acceptance.
Overall, it seems that small farms in forest regions are more reluctant to apply for agri-environmental payments, but the reason for this differs between hobby or part-time farmers and full-time farmers, as well as between sheep and cattle farms. However, high costs for transporting animals, fencing, and animal attendance seem to be a general feature of small farms.
8. Evaluation of Existing Data
One of the most disturbing results of recent studies on nationwide environmental monitoring, at least in Sweden, is that the official statistics used for evaluation and policy decisions may be biased and incomplete in terms of the amount, geographical distribution, type, and even management status and natural values. The most commonly used information on potentially valuable semi-natural grasslands in Sweden comes from the nationwide survey called the National Meadows and Pastures Inventory (TUVA), which was initially performed in 2002–2005 but has since been complemented in various ways [34,108,109,110]. Another important source of information is the administrative database of the Swedish Land Parcel Information System (LPIS) [101,111,112], which contains yearly information about all agricultural land where the farmer has applied for some type of agricultural subsidy or agri-environmental payment.
Additional analysis of this nationwide environmental monitoring [49], as referred to in the methods, indicates that the area of grasslands outside of these databases is much larger than previously known (Table 1).
The results from environmental monitoring indicate that the grasslands missing from available statistics include a large proportion of valuable grasslands, but also that they are relatively more often abandoned from grazing (Figure 6). This means that the available statistics and evaluations based on available databases risk underestimating area and, at the same time, overestimating the quality, status, and proportion of grasslands that still have active grazing. This underestimation of area in available statistics was shown to have a strong geographical component, which also directly or indirectly implies that there may be strong biases in the information about natural values and management status due to grazing or mowing. The lack of information relates to all of Sweden, but much more to northern Sweden and other forest-dominated regions.
Our analysis indicates that the proportion of grazed plots in semi-natural grasslands within and outside of LPIS was 85.9 and 40.4%, respectively (p < 0.0001). For improved grassland, the proportion within and outside of LPIS was 78.8 and 26.6%, respectively (p < 0.0001). The proportion of plots in semi-natural grassland that were classified as species-rich based on a threshold value of five or more indicator plant species was 42.8% within LPIS and 28.9% outside LPIS (p < 0.0001). For improved grasslands, the proportion was 20.0% within LPIS and 15.4% outside LPIS, but this difference was not statistically significant (p = 0.0846). A preliminary summary of results for classification of valuable grassland habitats according to the EU’s Habitats Directive (Figure 7) [61] shows that the grasslands included in available databases (LPIS and TUVA; cf. Table 1) [108,109,111,112] indeed have a higher proportion of valuable grassland habitats, but the overlap with grasslands not included is large. Whereas 60–80% of grasslands were classified as valuable grassland habitat in the well-documented grasslands that occur in both the LPIS and TUVA databases, the grasslands outside of the databases still have around 30% of valuable grassland habitat (Figure 7). A quick comparison with the results from Table 1 would yield the conclusion that about 20,000 ha of grasslands with valuable habitats risk being neglected by CAP and environmental statistics.
The proportion of plots with valuable grassland habitats in semi-natural grasslands within and outside of LPIS was 42.0 and 23.4%, respectively (p < 0.0001). Within LPIS grasslands, the proportion of plots within and outside objects in the TUVA database was 58.6 and 29.5%, respectively (p < 0.0001). The comparison for TUVA objects outside of LPIS was excluded because the number of plots in this category was small (cf. Figure 7).
9. Variation among Grassland Types in Soil Moisture and Nutrient Availability
The distinction between temporal grasslands (leys), improved permanent grasslands, and semi-natural grasslands is well established [113,114]. However, also within these categories, there is variation depending on soil type, climate, and grazing intensity [14,115]. The largest variation is generally among semi-natural grasslands, where human efforts to maximise, production have been less intensive. The European Nature Information System (EUNIS) habitat classification was developed for the European Environmental Agency as a pan-European classification covering both marine and terrestrial habitats [116]. In EUNIS, soil moisture has been chosen as one of the major classification criteria for grasslands, sometimes in combination with other criteria, and classes similar to EUNIS have also been used in a regional context, for example, for environmental indicators for the Nordic countries (Table 2) [117].
The relevance of grassland classification is also apparent for its strong influence of soil moisture and shading on biomass production and grazing requirements; the productivity of wet grasslands can be five times higher than that of dry grasslands (Table 2) [33,66]. In dry grasslands, late grazing and periods with low-intensity grazing can be favourable for biodiversity in that plant species can have the opportunity to flower [101]. However, in wet grasslands, such relaxed grazing protocols may lead to lower nutritive quality and the accumulation of grass litter, creating a feedback loop of deteriorated grazing quality for both grazing animals and biodiversity [23,103,118].
The lack of reliable quantitative data on production from hay fields and pastures (especially for semi-natural grasslands) in Sweden, but probably also in other countries, is a severe obstacle to the design and evaluation of cost-efficient agri-environmental payment schemes [11]. Calculations of costs and profitability for grasslands must take into account the large variation between regions, management types, and types of land. Calculations based only on averages can be misleading. Besides being important for the design and evaluation of policy tools, such data are also useful at the local level for the priorities, activities, and economic decisions of farmers and landowners, in which case they must be reliable in much detail even at the local level for and within a specific farm.
The total number of plant species, as a measure of biodiversity and natural value, also indicates strong relationships with soil moisture and nutrient status (Figure 8) [58,59]. Furthermore, and as expected, improved (fertilized and/or with a history of cultivation) and grasslands with lower agri-environmental payments (“general values”) and outside the LPIS database in general have a lower species richness of plants than semi-natural grasslands. However, in relative terms, the difference between land type categories in species number is small compared to the difference related to soil moisture and nutrient status, and the pattern in relation to these soil factors is remarkably similar among land type categories (Figure 8).
The proportion of plots that were classified as species-rich based on a threshold value of five or more indicator plant species (cf. Figure 6) was 37.4% in semi-natural grassland and 18.3% in improved grassland (p < 0.0001, n = 2048; adjusted Wald’s test, two-tailed). Within semi-natural grasslands, the proportion of plots that were classified as species-rich among grasslands with agri-environmental payment for special values was 53.0% and those without such payment 33.0% (p < 0.0001). We also used the classification of moisture and nutrients in relation to geographical regions. The common pattern among regions is that extremes of soil moisture and nutrients are quite rare in terms of total area. However, they still contribute to the total variation in habitat types, and in particular, the drier and most nutrient-poor sites may contribute proportionally more to total biodiversity when the most demanding management-dependent plant species are considered [6,36,58,119].
The comparison between regions also shows that the northern region of Norrland has a clearly larger proportion of grasslands in moister classes. The Baltic islands of Öland and Gotland have a larger proportion of the driest and most nutrient-poor grasslands included in the agricultural LPIS database, whereas this is not the case for grasslands outside LPIS. The grasslands of these islands differ from the mainland in that they mostly have thin soils on dense calcareous bedrock, which often means lower productivity but higher potential for biodiversity (Figure 6 and Figure 9). This means that comparisons based only on overall differences between regions or soil types risk being confused because of these regional differences. For example, the general species diversity of northern regions may be seen as lower only because they are to a higher extent moister or wetter grassland types, and the opposite may be the case for Öland and Gotland, with higher diversity in drier types. This highlights the need to understand what influences the use of cattle and sheep for grazing these semi-natural grasslands and the underlying causes of abandonment from grazing.
The proportion of plots that were classified as moist or wet in semi-natural grasslands within and outside of LPIS was 7.0 and 14.4%, respectively (p < 0.0001). The proportion of plots that were classified as nutrient-rich or very rich within and outside of LPIS was 51.4 and 51.1%, respectively, but this difference was not statistically significant (p = 0.921).
Our examples from monitoring data and from literature show that it is indeed possible to distinguish between different grassland types based on available databases (such as soil nutrients and moisture) or quantitative indicators (number of plant species or proportion of valuable habitat types). Such grassland types have different requirements for grazing and biodiversity, and they should therefore be treated differently in evaluations and management guidelines. Also, the tree and shrub layers are always included in the evaluation of status and management requirements, but more distinct, flexible, and ecologically motivated criteria would increase the ability to evaluate the response of trees and shrubs in relation to site conditions [120].
10. Consideration of Local and Regional Variation in Design and Evaluation of Policy Measures
The most unique and highly valuable grasslands are often well taken care of in protected areas, in payment schemes, and in evaluation programmes. For example, this includes much of the highly biodiverse calcareous grassland habitats in the Baltic islands of Öland and Gotland. However, these types of unique sites are still a very small proportion of the total grassland area in Sweden, and in large-scale evaluations, they are often outliers, both in natural value and in ecological conditions. Such areas would be better served by policy measures and monitoring efforts specifically designed for these habitat types.
The deterioration of grasslands due to a lack of grazing or mowing in some regions is more severe than the available data indicate. The lack of information about the most deteriorated or threatened grasslands means that evaluation must be changed to include all types of grasslands with natural values dependent on grazing. When better information about the actual state of grasslands has been achieved, policy measures need to be directed more towards regions where this lack of information is most serious, especially forest-dominated regions with smaller farms, less intensive agriculture, and lower productivity of agricultural land.
The attitude survey discussed above [47] indicated that small farms to a greater extent have sheep for landscape conservation purposes, but they are also more sensitive to high investment and maintenance costs, which are aggravated by more spatially fragmented agricultural land, higher transport costs for animals, and a higher risk of damage by large predators, parasites, or disease (especially for sheep).
The calculations of Cederberg et al. [11], based on estimations from interviewed farmers in the absence of reliable official data, showed that even detailed information of grassland area characteristics was not sufficient to calculate the economic outcome of payment schemes because the production costs per quantity produced from grazing were highly dependent on pasture size and location through their effect on costs for grazing management, including transport, attendance, and fencing. Since the costs were strongly related to land size, Cederberg et al. [11] suggested a payment based on the length of the permanent edges of fields and pastures rather than their area. This would favour more varied small-scale agricultural land, typically in varied landscapes with high biodiversity, where ecosystem services are highest and the need for such support is strongest [121].
As already mentioned, a large part of the Swedish grasslands is a broad mosaic of intermediate types where site conditions, management status, and natural values vary in a number of ways, both locally and regionally. A clear-cut distinction between “rich” and “poor” grasslands within this mosaic risks being quite arbitrary and makes the administration and control of management measures and policy guidelines difficult because the variation within each class can be larger than between classes. The results of Larsson et al. [35] indicate that quality criteria should be adapted to the character and possible threats to biodiversity in a more flexible way. This principle was tested in models by Larsson et al. [35], who argued that the difference in payment between the lower and the higher biodiversity quality grassland was too low, and therefore farmers could decide that the higher payment for more demanding management of valuable grasslands was not worth the effort or the risk of fines in case of non-compliance at controls.
11. Weaknesses, Potential Shortcomings and Suggestions for Future Research
This study aims to discuss a broad range of topics and the relationship between them, but the only data available were collected in other contexts and not specifically for this purpose. This resulted, for example, in it not being possible to separate the results from the monitoring data in a way that made them directly comparable with the results from the attitudes survey. Furthermore, because of the broad aims of the study, the literature survey included reports and scientific publications from various disciplines and of different character, making it difficult to compare the conclusions from socio-economical studies with corresponding results from ecological studies of biodiversity and actual effects on management. A more narrowly defined study could use more sophisticated and in-depth methods for meta-evaluation [105,106]. In this study, it has been repeatedly emphasised that there is a need to take differences in farm type, region, natural conditions, and prerequisites much more into consideration for the evaluation and design of policy measures. Future research should aim at formulating how such information can be incorporated and making this the basis for further evaluation in the form of questionnaires, socio-economical models, ecological experiments, and environmental monitoring. The most elaborate quantitative evaluations of agri-environmental policy are all based on administrative and/or socio-economic data, but there are no corresponding data with that explanatory potential for biodiversity and concrete management effects, which is a major limitation.
12. Conclusions
There are a variety of important factors that influence the costs and revenues related to maintaining the grazing of semi-natural grasslands, including the variation within the grasslands themselves. More sophisticated evaluation models are needed to take this variation into account. This seems to be the case for other EU countries as well. However, both Norway and Switzerland clearly exemplify that an active and consistent policy to support agriculture in landscapes with high natural values and a long history of traditional management may have large positive effects on biodiversity and landscape variation. There are many reasons why farmers choose not to include all available land in their agri-environmental payment applications. In general, smaller farms in northern or otherwise marginal agricultural regions of Sweden are more often reluctant to apply for such payments, even if they have more negative trends for area and quality of grasslands. Overall, the conclusions from the literature and the survey of attitudes are that existing policy measures are helpful to maintain or increase the area of semi-natural grasslands with grazing. However, agri-environmental payments are clearly insufficient in regions and farm categories with the most negative trends in areas of managed grasslands. A more differentiated payment and a stronger link to the actual value of biodiversity and ecosystem services are needed, and criteria for how to design and quantitatively evaluate a more differentiated scheme must be developed. There is a severe lack of reliable data and indicators for the evaluation of natural values and the effects of management practises over a broad range of grassland types, regions, and environmental conditions. One major limitation is that most evaluations of grassland policy measures rely heavily on administrative databases, which are often incomplete and biased in that land without agricultural subsidies or agri-environmental payments is strongly underrepresented. Independently collected and statistically representative data are of great importance and should be incorporated into all such evaluations.
Author Contributions
Conceptualization, A.G. and M.H.; methodology, A.G.; formal analysis, A.G., M.H. and J.H.; data curation, A.G. and M.H.; writing—original draft preparation, A.G.; writing—review and editing, A.G., M.H., R.W., E.A.M.B., J.H. and L.J.K.; project administration, L.J.K.; funding acquisition, L.J.K., E.A.M.B., A.G. and J.H. All authors have read and agreed to the published version of the manuscript.
Funding
This research was funded by the Swedish Research Council FORMAS, grant number 2017-00698.
Data Availability Statement
Data from environmental monitoring presented in this study are available on request from the corresponding author. Data from the survey of farmers’ attitudes were obtained from the Swedish Board of Agriculture and are available from the corresponding authors with their permission.
Acknowledgments
Lisa Karlsson, Swedish Board of Agriculture, for providing data from an unpublished survey on farmers’ attitudes. Data of agricultural land from the Swedish Land Parcel Information system (data: Jordbruksblock) were delivered from Swedish Board of Agriculture according to a CC BY 2.5 SE licence (https://creativecommons.org/licenses/by/2.5/se/).
Conflicts of Interest
The authors declare no conflict of interest. The funders had no role in the design of the study, in the collection, analysis, or interpretation of data, in the writing of the manuscript, or in the decision to publish the results.
References
- Maes, J.; Teller, A.; Erhard, M.; Condé, S.; Vallecillo, S.; Barredo, J.I.; Paracchini, M.L.; Malak, D.A.; Trombetti, M.; Vigiak, O.; et al. Mapping and Assessment of Ecosystems and Their Services: An EU Ecosystem Assessment; EUR 30161 EN; Publications Office of the European Union: Ispra, Italy, 2020. [Google Scholar]
- Henle, K.; Alard, D.; Clitherow, J.; Cobb, P.; Firbank, L.; Kull, T.; McCracken, D.; Moritz, R.F.A.; Niemelä, J.; Rebane, M.; et al. Identifying and managing the conflicts between agriculture and biodiversity conservation in Europe—A review. Agric. Ecosyst. Environ. 2008, 124, 60–71. [Google Scholar] [CrossRef]
- Hejcman, M.; Hejcmanová, P.; Pavlů, V.; Beneš, J. Origin and history of grasslands in Central Europe—A review. Grass Forage Sci. 2013, 68, 345–363. [Google Scholar] [CrossRef]
- Beilin, R.; Lindborg, R.; Stenseke, M.; Pereira, H.M.; Llausàs, A.; Slätmo, E.; Cerqueira, Y.; Navarro, L.; Rodrigues, P.; Reichelt, N.; et al. Analysing how drivers of agricultural land abandonment affect biodiversity and cultural landscapes using case studies from Scandinavia, Iberia and Oceania. Land Use Policy 2014, 36, 60–72. [Google Scholar] [CrossRef]
- Dengler, J.; Janišová, M.; Török, P.; Wellstein, C. Biodiversity of Palaearctic grasslands: A synthesis. Agric. Ecosyst. Environ. 2014, 182, 1–14. [Google Scholar] [CrossRef]
- Karlík, P.; Poschlod, P. Identifying plant and environmental indicators of ancient and recent calcareous grasslands. Ecol. Indic. 2019, 104, 405–421. [Google Scholar] [CrossRef]
- Lemaire, G.; Wilkins, R.; Hodgson, J. Challenges for grassland science: Managing research priorities. Agric. Ecosyst. Environ. 2005, 108, 99–108. [Google Scholar] [CrossRef]
- Schils, R.L.; Bufe, C.; Rhymer, C.M.; Francksen, R.M.; Klaus, V.H.; Abdalla, M.; Milazzo, F.; Lellei-Kovács, E.; Berge, H.T.; Bertora, C.; et al. Permanent grasslands in Europe: Land use change and intensification decrease their multifunctionality. Agric. Ecosyst. Environ. 2022, 330, 107891. [Google Scholar] [CrossRef]
- Karlsson, J.O.; Tidåker, P.; Röös, E. Smaller farm size and ruminant animals are associated with increased supply of non-provisioning ecosystem services. Ambio 2022, 51, 2025–2042. [Google Scholar] [CrossRef]
- Wästfelt, A.; Saltzman, K.; Berg, E.G.; Dahlberg, A. Landscape care paradoxes: Swedish landscape care arrangements in a European context. Geoforum 2012, 43, 1171–1181. [Google Scholar] [CrossRef]
- Cederberg, C.; Henriksson, M.; Rosenqvist, H. Ekonomi och Ekosystemtjänster i Gräsbaserad Mjölk-och Nötköttsproduktion [Economy and Ecosystem Services in Grass-Based Dairy and Cattle Beef Production]; Chalmers Tekniska Högskola: Göteborg, Sweden, 2018. [Google Scholar]
- Bengtsson, J.; Bullock, J.M.; Egoh, B.; Everson, C.; Everson, T.; O’Connor, T.; O’Farrell, P.J.; Smith, H.G.; Lindborg, R. Grasslands–more important for ecosystem services than you might think. Ecosphere 2019, 10, e02582. [Google Scholar] [CrossRef]
- Johansen, L.; Taugourdeau, S.; Hovstad, K.A.; Wehn, S. Ceased grazing management changes the ecosystem services of semi-natural grasslands. Ecosys. People 2019, 15, 192–203. [Google Scholar] [CrossRef]
- Le Clec’h, S.; Finger, R.; Buchmann, N.; Gosal, A.S.; Hörtnagl, L.; Huguenin-Elie, O.; Jeanneret, P.; Lüscher, A.; Schneider, M.K.; Huber, R. Assessment of spatial variability of multiple ecosystem services in grasslands of different intensities. J. Environ. Manage. 2019, 251, 109372. [Google Scholar] [CrossRef]
- Paudel, S.; Cobb, A.B.; Boughton, E.H.; Spiegal, S.; Boughton, R.K.; Silveira, M.L.; Swain, H.M.; Reuter, R.; Goodman, L.E.; Steiner, J.L. A framework for sustainable management of ecosystem services and disservices in perennial grassland agroecosystems. Ecosphere 2021, 12, e03837. [Google Scholar] [CrossRef]
- Lindborg, R.; Bengtsson, J.; Berg, Å.; Cousins, S.A.O.; Eriksson, O.; Gustafsson, T.; Hasund, K.P.; Lenoir, L.; Pihlgren, A.; Sjödin, E.; et al. A landscape perspective on conservation of semi-natural grasslands. Agric. Ecosyst. Environ. 2008, 125, 213–222. [Google Scholar] [CrossRef]
- FAO. Biodiversity and the Livestock Sector—Guidelines for Quantitative Assessment—Version 1. In Livestock Environmental Assessment and Performance Partnership (FAO LEAP); FAO: Rome, Italy, 2020. [Google Scholar]
- Söderström, B.; Svensson, B.; Vessby, K.; Glimskär, A. Plants, insects and birds in semi-natural pastures in relation to local habitat and landscape factors. Biodivers. Conserv. 2001, 10, 1839–1863. [Google Scholar] [CrossRef]
- Cousins, S.A.O.; Auffret, A.G.; Lindgren, J.; Tränk, L. Regional-scale land-cover change during the 20th century and its consequences for biodiversity. Ambio 2015, 44 (Suppl. S1), S17–S27. [Google Scholar] [CrossRef]
- Eriksson, O. The importance of traditional agricultural landscapes for preventing species extinctions. Biodiv. Conserv. 2021, 30, 1341–1357. [Google Scholar] [CrossRef]
- Emanuelsson, U. The Rural Landscape of Europe: How Man Has Shaped European Nature; The Swedish Research Council Formas: Stockholm, Sweden, 2009. [Google Scholar]
- Eriksson, O.; Cousins, S.A.O. Historical landscape perspectives on grasslands in Sweden and the Baltic region. Land 2014, 3, 300–321. [Google Scholar] [CrossRef]
- Diekmann, M.; Andres, C.; Becker, T.; Bennie, J.; Blüml, V.; Bullock, J.M.; Culmsee, H.; Fanigliulo, M.; Hahn, A.; Heinken, T.; et al. Patterns of long-term vegetation change vary between different types of semi-natural grasslands in Western and Central Europe. J. Veg. Sci. 2019, 31, 187–202. [Google Scholar] [CrossRef]
- Huyghe, C.; De Vliegher, A.; van Gils, B.; Peeters, A. Grasslands and Herbivore Production in Europe and Effects of Common Policies; Éditions Quae: Versailles, France, 2014. [Google Scholar]
- Pe’er, G.; Dicks, L.V.; Visconti, P.; Arlettaz, R.; Báldi, A.; Benton, T.G.; Collins, S.; Dieterich, M.; Gregory, R.D.; Hartig, F.; et al. EU agricultural reform fails on biodiversity. Science 2014, 344, 1090–1092. [Google Scholar] [CrossRef]
- FAO. A review of indicators and methods to assess biodiversity–application to livestock production at global scale. In Livestock Environmental Assessment and Performance Partnership (FAO LEAP); FAO: Rome, Italy, 2015. [Google Scholar]
- Harpole, W.S.; Sullivan, L.L.; Lind, E.M.; Firn, J.; Adler, P.B.; Borer, E.T.; Chase, J.; Fay, P.A.; Hautier, Y.; Hillebrand, H.; et al. Addition of multiple limiting resources reduces grassland diversity. Nature 2016, 537, 93–96. [Google Scholar] [CrossRef] [PubMed]
- Sartorello, Y.; Pastorino, A.; Bogliani, G.; Ghidotti, S.; Viterbi, R.; Cerrato, C. The impact of pastoral activities on animal biodiversity in Europe: A systematic review and meta-analysis. J. Nat. Conserv. 2020, 56, 125863. [Google Scholar] [CrossRef]
- Nitsch, U. Bönder, myndigheter och naturbetesmarker. [Farmers, authorities and semi-natural pastures]. In CBM:s Skriftserie 23. SLU; Centrum för Biologisk Mångfald: Uppsala, Sweden, 2009. [Google Scholar]
- Nordberg, A.; Asplund, L. Förenkling av åtagandeplaner för betesmarker och slåtterängar. [Simplification of commitment plans for pastures and meadows.]. In Swedish Board of Agriculture, Report 2002/5; Swedish Board of Agriculture: Jönköping, Sweden, 2020. [Google Scholar]
- Wallander, J.; Karlsson, L.; Berglund, H.; Mebus, F.; Nilsson, L.; Bruun, M.; Johansson, L. Plan för odlingslandskapets biologiska mångfald. [Plan for biological diversity in the agricultural landscape]. In Swedish Board of Agriculture, Report 2019/1; Swedish Board of Agriculture: Jönköping, Sweden, 2019. [Google Scholar]
- Brady, M.; Hristov, J.; Höjgård, S.; Jansson, T.; Johansson, H.; Larsson, C.; Nordin, I.; Rabinowicz, E. Impacts of direct payments. Lessons for CAP post-2020 from a quantitative analysis. In AgriFood Economics Centre, Report 2017/2; Lund University and Swedish University of Agricultural Sciences: Lund, Sweden, 2017. [Google Scholar]
- Blom, S. (Ed.) Utveckling av ängs- och betesmarker–går, idag och imorgon [Development of meadows and pastures–yesterday, today and tomorrow]. In Swedish Board of Agriculture, Report 2009/10; Swedish Board of Agriculture: Jönköping, Sweden, 2009. [Google Scholar]
- Berg, Å.; Cronvall, E.; Eriksson, Å.; Glimskär, A.; Hiron, M.; Knape, J.; Pärt, T.; Wissman, J.; Żmihorski, M.; Öckinger, E. Assessing agri-environmental schemes for semi-natural pastures during a 5-year period: Can we see positive effects for vascular plants and pollinators? Biodivers. Conserv. 2019, 28, 3989–4005. [Google Scholar] [CrossRef]
- Larsson, C.; Boke Olén, N.; Brady, M. Naturbetesmarkens framtid–en fråga om lönsamhet [The future om semi-natural grasslands–a question about profitability]. In AgriFood Economics Centre, Report 2020/1; Lund University and Swedish University of Agricultural Sciences: Lund, Sweden, 2020. [Google Scholar]
- Milberg, P.; Bergman, K.-O.; Glimskär, A.; Nilsson, S.; Tälle, M. Site factors are more important than management for indicator species in semi-natural grasslands in southern Sweden. Plant Ecol. 2020, 221, 577–594. [Google Scholar] [CrossRef]
- Rosén, E.; Borgegård, S.-O. The open cultural landscape. In Swedish Plant Geography; Rydin, H., Shoeijs, P., Diekmann, M., Eds.; Acta Phytogeographica Suecica 84; Swedish Phytogeographical Society: Uppsala, Sweden, 1999. [Google Scholar]
- Ihse, M.; Lindahl, C. A holistic model for landscape ecology in practice: The Swedish survey and management of ancient meadows and pastures. Landsc. Urban Plan. 2000, 50, 59–84. [Google Scholar] [CrossRef]
- Vik, J.; McElwee, G. Diversification and the entrepreneurial motivations of farmers in Norway. J. Small Bus. Manag. 2011, 49, 390–410. [Google Scholar] [CrossRef]
- Kristensen, S.B.P.; Busck, A.G.; van der Sluis, T.; Gaube, V. Patterns and drivers of farm-level land use change in selected European rural landscapes. Land Use Policy 2016, 57, 786–799. [Google Scholar] [CrossRef]
- Dessart, F.J.; Barreiro-Hurlé, J.; van Bavel, R. Behavioural factors affecting the adoption of sustainable farming practices: A policy-oriented review. Eur. Rev. Agric. Econ. 2019, 46, 417–471. [Google Scholar] [CrossRef]
- Brown, C.; Kovács, E.; Herzon, I.; Villamayor-Tomas, S.; Albizua, A.; Galanaki, A.; Grammatikopoulou, I.; McCracken, D.; Olsson, J.A.; Zinngrebe, Y. Simplistic understandings of farmer motivations could undermine the environmental potential of the common agricultural policy. Land Use Policy 2021, 101, 105136. [Google Scholar] [CrossRef]
- Jamieson, A.; Hessle, A. Hinder och möjligheter för ökad naturbetesdrift ur ett lantbrukarperspektiv–en kunskapsöversikt. [Obstacles and opportunies for increased grazing of semi-natural pastures from a farmer’s perspective–a literature review]. In SustAinimal Reports 1; SLU, Institutionen för Husdjurens Utfodring Och Vård: Uppsala, Sweden, 2021. [Google Scholar]
- Ansell, D.; Freudenberger, D.; Munro, N.; Gibbons, P. The cost-effectiveness of agri-environment schemes for biodiversity conservation: A quantitative review. Agric. Ecosyst. Environ. 2016, 225, 184–191. [Google Scholar] [CrossRef]
- Pavlis, E.S.; Terkenli, T.S.; Kristensen, S.B.P.; Busck, A.G.; Cosor, G.L. Patterns of agri-environmental scheme participation in Europe: Indicative trends from selected case studies. Land Use Policy 2016, 57, 800–812. [Google Scholar] [CrossRef]
- Holmström, K.; Kumm, K.-I.; Andersson, H.; Nadeau, E.; Arvidsson-Segerkvist, K.; Hessle, A. Economic incentives for preserving biodiverse semi-natural pastures with calves from dairy cows. J. Nat. Conserv. 2021, 62, 126010. [Google Scholar] [CrossRef]
- Karlsson, K. Management of Pastures–Whas Is Affecting the Farmers' Priority? Independent project in biology; SLU, Department of Ecology: Uppsala, Sweden, 2020. [Google Scholar]
- Karlsson, L.; Cristvall, C.; Edman, T.; Lindberg, G. Betesmarker och slåtterängar med miljöersättning [Pastures and meadows with agri-environmental payment]. In Swedish Board of Agriculture, Report 2012/41; Swedish Board of Agriculture: Jönköping, Sweden, 2012. [Google Scholar]
- Lundin, A.; Kindström, M.; Glimskär, A.; Gunnarsson, U.; Hedenbo, P.; Rygne, H. Metodik för Regional Miljöövervakning av Gräsmarker och Våtmarker 2015–2020 [Methods for Regional Environmental Monitoring of Grasslands and Wetlands 2015–2020]; County Administrative Board in Örebro, Report 2016/21; Swedish Board of Agriculture: Örebro, Sweden, 2016.
- Glimskär, A.; Skånes, H. Land type categories as a complement to land use and land cover attributes in landscape mapping and monitoring. In Land Use and Land Cover Semantics–Principles, Best Practices and Prospects; Ahlqvist, O., Janowicz, K., Varanka, D., Fritz, S., Eds.; CLC Press/Taylor & Francis: Boca Raton, FL, USA, 2015; pp. 171–190. [Google Scholar] [CrossRef]
- Green, R.H. Power analysis and practical strategies for environmental monitoring. Environ. Res. 1989, 50, 195–205. [Google Scholar] [CrossRef]
- Vos, P.; Meelis, E.; ter Keurs, W.J. Framework for the design of ecological monitoring programs as a tool for environmental and nature management. Environ. Monit. Assess. 2000, 61, 317–344. [Google Scholar] [CrossRef]
- McDonald, T.L. Review of environmental monitoring methods: Survey designs. Environ. Monit. Assess. 2003, 85, 277–292. [Google Scholar] [CrossRef] [PubMed]
- Grafström, A.; Schelin, L. How to select representative samples. Scand. J. Statist. 2014, 41, 277–290. [Google Scholar] [CrossRef]
- Cousins, S.A.O.; Ihse, M. A methodological study for biotope and landscape mapping based on CIR aerial photographs. Landsc. Urban Plan. 1998, 41, 183–192. [Google Scholar] [CrossRef]
- Ihse, M. Colour infrared aerial photography as a tool for vegetation mapping and change detection in environmental studies of Nordic ecosystems: A review. Nor. J. Geogr. 2007, 61, 170–191. [Google Scholar] [CrossRef]
- Tyler, T.; Herbertsson, L.; Olofsson, J.; Olsson, P.A. Ecological indicator and traits values for Swedish vascular plants. Ecol. Indic. 2021, 120, 106923. [Google Scholar] [CrossRef]
- Löfgren, O.; Hall, K.; Schmid, B.C.; Prentice, H.C. Grasslands ancient and modern: Soil nutrients, habitat age and their relation to Ellenberg N. J. Veg. Sci. 2019, 31, 367–379. [Google Scholar] [CrossRef]
- Diekmann, M. Species indicator values as an important tool in applied plant ecology—A review. Basic Appl. Ecol. 2003, 4, 493–506. [Google Scholar] [CrossRef]
- Ellenberg, H.; Weber, H.E.; Düll, R.; Wirth, V.; Werner, W.; Paulissen, D. Zeigerwerte von Pflanzen in Mitteleuropa. Scr. Geobot. 1992, 18, 1–248. [Google Scholar]
- European Commission. Interpretation Manual of European Union Habitats, EUR 28; European Commission–DG Environment: Brussels, Belgium, 2013. [Google Scholar]
- Dahlström, A.; Cousins, S.A.O.; Eriksson, O. The History (1620–2003) of land use, people and livestock, and the relationship to present plant species diversity in a rural landscape in Sweden. Environ. Hist. 2006, 12, 191–212. [Google Scholar] [CrossRef]
- Käyhkö, N.; Skånes, H. Change trajectories and key biotopes—Assessing landscape dynamics and sustainability. Landsc. Urban Plan. 2006, 75, 300–321. [Google Scholar] [CrossRef]
- Schmid, B.C.; Poschlod, P.; Prentice, H.C. The contribution of successional grasslands to the conservation of semi-natural grasslands species—A landscape perspective. Biol. Conserv. 2017, 206, 112–119. [Google Scholar] [CrossRef]
- Mescher, B. Relations between Animal Welfare and Biodiversity in Swedish Beef and Dairy Farms. Master’s Thesis, Animal Production Systems Group, Wageningen University, Wageningen, The Netherlands, 2020. [Google Scholar]
- Spörndly, E.; Glimskär, A. Betesdjur och betestryck i naturbetesmarker [Grazing animals and grazing intensity in semi-natural grasslands]. In Rapport 297; SLU, Institute för Husdjurens Utfodring och Vård: Uppsala, Sweden, 2018. [Google Scholar]
- Broom, D.M.; Galindo, F.A.; Murgueitio, E. Sustainable, efficient livestock production with high biodiversity and good welfare for animals. Proc. R. Soc. B 2013, 280, 20132025. [Google Scholar] [CrossRef] [PubMed]
- Sandberg, M.; Jakobsson, S. Trees are all around us: Farmers’ management of wood pastures in the light of a controversial policy. J. Environ. Manag. 2018, 212, 228–235. [Google Scholar] [CrossRef]
- Pihlgren, A.; Lennartsson, T. Shrub effects on herbs and grasses in semi-natural grasslands: Positive, negative or neutral relationships? Grass Forage Sci. 2008, 63, 9–21. [Google Scholar] [CrossRef]
- Waldén, E.; Lindborg, R. Facing the future for grassland restoration—What about the farmers? J. Environ. Manag. 2018, 227, 305–312. [Google Scholar] [CrossRef]
- Kumm, K.-I. Sustainable management of Swedish seminatural pastures with high species diversity. J. Nat. Conserv. 2003, 11, 117–125. [Google Scholar] [CrossRef]
- Tscharntke, T.; Clough, Y.; Wanger, T.C.; Jackson, L.; Motzke, I.; Perfecto, I.; Vandermeer, J.; Whitbread, A. Global food security, biodiversity conservation and the future of agricultural intensification. Biol. Conserv. 2012, 151, 53–59. [Google Scholar] [CrossRef]
- Bartolini, F.; Vergamini, D.; Longhitano, D.; Povellato, A. Do differential payments for agri-environmental schemes affect the environmental benefits? A case study in the North-Eastern Italy. Land Use Policy 2021, 107, 104862. [Google Scholar] [CrossRef]
- Elahi, E.; Zhang, H.; Lirong, X.; Khalid, Z.; Xu, H. Understanding cognitive and socio-psychological factors determining farmers’ intentions to use improved grassland: Implications of land use policy for sustainable pasture production. Land Use Policy 2021, 102, 105250. [Google Scholar] [CrossRef]
- Hansson, H.; Ferguson, R. Factors influencing the strategic decision to further develop dairy production—A study of farmers in central Sweden. Livest. Sci. 2011, 135, 110–123. [Google Scholar] [CrossRef]
- Belfrage, K.; Björklund, J.; Salomonsson, L. Effects of farm size and on-farm landscape heterogeneity on biodiversity—Case study of twelve farms in a Swedish landscape. Agroecol. Sustain. Food Syst. 2015, 39, 170–188. [Google Scholar] [CrossRef]
- Methorst, R.; Roep, D.; Verhees, F.; Verstegen, J. Drivers for differences in dairy farmers’ perceptions of farm development strategies in an area with nature and landscape as protected public goods. Local Econ. 2016, 31, 554–571. [Google Scholar] [CrossRef]
- Andersen, P.S.; Vejre, H.; Dalgaard, T.; Brandt, J. An indicator-based method for quantifying farm multifunctionality. Ecol. Indic. 2013, 25, 166–179. [Google Scholar] [CrossRef]
- Burton, R.J.F. The influence of farmer demographic characteristics on environmental behaviour: A review. J. Environ. Manag. 2014, 135, 19–26. [Google Scholar] [CrossRef]
- Boke Olén, N.; Roger, F.; Brady, M.V.; Larsson, C.; Andersson, G.K.S.; Ekroos, J.; Caplat, P.; Smith, H.G.; Dänhardt, J.; Clough, Y. Effects of farm type on food production, landscape openness, grassland biodiversity, and greenhouse gas emissions in mixed agricultural-forestry regions. Agric. Syst. 2021, 189, 103071. [Google Scholar] [CrossRef]
- Batáry, P.; Dicks, L.V.; Kleijn, D.; Sutherland, W.J. The role of agri-environment schemes in conservation and environmental management. Conserv. Biol. 2015, 29, 1006–1016. [Google Scholar] [CrossRef]
- Concepción, E.D.; Aneva, I.; Jay, M.; Lukanov, S.; Marsden, K.; Moreno, G.; Oppermann, R.; Pardo, A.; Piskol, S.; Rolo, V.; et al. Optimizing biodiversity gain of European agriculture through regional targeting and adaptive management of conservation tools. Biol. Conserv. 2020, 241, 108384. [Google Scholar] [CrossRef]
- Pardo, A.; Rolo, V.; Concepción, E.D.; Díaz, M.; Kazakova, Y.; Stefanova, V.; Marsden, K.; Brandt, K.; Jay, M.; Piskol, S.; et al. To what extent does the European common agricultural policy affect key landscape determinants of biodiversity? Environ. Sci. Policy 2020, 114, 595–605. [Google Scholar] [CrossRef]
- Forbord, M.; Bjørkhaug, H.; Burton, R.J.F. Drivers of change in Norwegian agricultural land control and the emergence of rental farming. J. Rural Stud. 2014, 33, 9–19. [Google Scholar] [CrossRef]
- Bele, B.; Norderhaug, A.; Sickel, H. Localized agri-food systems and biodiversity. Agriculture 2018, 8, 22. [Google Scholar] [CrossRef]
- Schulz, T.; Lauber, S.; Herzog, F. Summer farms in Switzerland: Profitability and public financial support. Mt. Res. Dev. 2018, 28, 14–23. [Google Scholar] [CrossRef]
- Burton, J.F.; Schwarz, G. Result-oriented agri-environmental schemes in Europe and their potential for promoting behavioural change. Land Use Policy 2013, 30, 628–641. [Google Scholar] [CrossRef]
- Herzon, I.; Birge, T.; Allen, B.; Povellato, A.; Vanni, F.; Hart, K.; Radley, G.; Tucker, G.; Keenleyside, C.; Oppermann, R.; et al. Time to look for evidence: Results-based approach to biodiversity conservation on farmland in Europe. Land Use Policy 2018, 71, 347–354. [Google Scholar] [CrossRef]
- Bartkowski, B.; Droste, N.; Liess, M.; Sidemo-Holm, W.; Weller, U.; Brady, M.V. Payments by modelled results: A novel design for agri-environmental schemes. Land Use Policy 2021, 102, 105230. [Google Scholar] [CrossRef]
- Ruas, S.; Rotchés, R.; Huallacháin, D.; Ahmed, K.D.; Gormally, M.; Stout, J.C.; White, B.; Moran, J. Selecting appropriate plant indicator species for result-based agri-environment payments schemes. Ecol. Indic. 2021, 126, 107679. [Google Scholar] [CrossRef]
- Birge, T.; Herzon, I. Exploring cultural acceptability of a hypothetical results-based agri-environment payment for grassland biodiversity. J. Rural Stud. 2019, 67, 1–11. [Google Scholar] [CrossRef]
- McGurk, E.; Hynes, S.; Thorne, F. Participation in agri-environmental schemes: A contingent valuation study of farmers in Ireland. J. Envir. Manage. 2020, 262, 110243. [Google Scholar] [CrossRef]
- Niskanen, O.; Tienhaara, A.; Haltia, E.; Pouta, E. Farmers’ heterogeneous preferences towards results-based environmental policies. Land Use Policy 2021, 102, 105227. [Google Scholar] [CrossRef]
- Massfeller, A.; Meraner, M.; Hüttel, S.; Uehleke, R. Farmers’ acceptance of results-based agri-environmental schemes: A German perspective. Land Use Policy 2022, 120, 106281. [Google Scholar] [CrossRef]
- Rudnicki, R.; Wiśniewski, Ł.; Biczkowski, M. A spatial typography of environmentally friendly common agricultural policy support relevant to European Green Deal objectives. Land 2021, 10, 1092. [Google Scholar] [CrossRef]
- Pe’er, G.; Zinngrebe, Y.; Hauck, J.; Schindler, S.; Dittrich, A.; Zingg, S.; Tscharntke, T.; Oppermann, R.; Sutcliffe, L.M.E.; Sirami, C.; et al. Adding some green to the greening: Improving the EU’s Ecological Focus Areas for biodiversity and farmers. Conserv. Lett. 2017, 10, 517–530. [Google Scholar] [CrossRef]
- Pe’er, G.; Bonn, A.; Bruelheide, H.; Dieker, P.; Eisenhauer, N.; Feindt, P.H.; Hagedorn, G.; Hansjürgens, B.; Herzon, I.; Lomba, Â.; et al. Action needed for the EU Common Agricultural Policy to address sustainability challenges. People Nat. 2020, 2, 305–316. [Google Scholar] [CrossRef]
- Bazzan, G.; Daugbjerg, C.; Tosun, J. Attaining policy integration through the integration of new policy instruments: The case of the Farm to Fork Strategy. Appl. Econ. Perspect. Policy 2023, 45, 803–818. [Google Scholar] [CrossRef]
- Pinto-Correia, T.; Ferraz-de-Oliveira, I.; Guimarães, M.H.; Sales-Baptista, E.; Pinto-Cruz, C.; Godinho, C.; Vieira Santos, R. Result-based payments as a tool to preserve the High Nature Value of complex silvo-pastoral systems: Progress toward farm-based indicators. Ecol. Soc. 2022, 27, 39. [Google Scholar] [CrossRef]
- Vessby, K.; Söderström, B.; Glimskär, A.; Svensson, B. Species-richness correlations of six different taxa in Swedish semi-natural grasslands. Conserv. Biol. 2002, 16, 430–439. [Google Scholar] [CrossRef]
- Wissman, J.; Lennartsson, T. Betestryck ur Ekologisk Synvinkel [Grazing Intensity from an Ecological Viewpoint]; CBM Swedish Biodiversity Centre: Uppsala, Sweden, 2010. [Google Scholar]
- Bonari, G.; Fajmon, K.; Malenovský, I.; Zelený, D.; Holuša, J.; Jongepierová, I.; Kočárek, P.; Konvička, O.; Uřičář, J.; Chytrý, M. Management of semi-natural grasslands benefiting both plant and insect diversity: The importance of heterogeneity and tradition. Agric. Ecosyst. Environ. 2017, 246, 243–252. [Google Scholar] [CrossRef]
- Pelve, M.E.; Spörndly, E.; Olsson, I.; Glimskär, A. Grazing and fouling behaviour of cattle on different vegetation types within heterogeneous semi-natural and naturalized pastures. Livest. Sci. 2020, 241, 104253. [Google Scholar] [CrossRef]
- Josefsson, J.; Hiron, M.; Arlt, D.; Auffret, A.G.; Berg, Å.; Chevalier, M.; Glimskär, A.; Hartman, G.; Kačergytė, I.; Klein, J.; et al. Improving scientific rigour in conservation evaluations and a plea deal for transparency on potential biases. Conserv. Lett. 2020, 2020, e12726. [Google Scholar] [CrossRef]
- Stufflebeam, D.L. The Metaevaluation Imperative. Am. J. Eval. 2001, 22, 183–209. [Google Scholar] [CrossRef]
- Ministry of Foreign Affairs. Meta-Evaluation–Private and Business Sector Development Interventions; Danida/Ministry of Foreign Affairs: Aarhus, Denmark, 2004.
- Hultgren, J.; Hiron, M.; Glimskär, A.; Bokkers, E.A.M.; Keeling, L.J. Environmental quality and compliance with animal welfare legislation at Swedish cattle and sheep farms. Sustainability 2022, 14, 1095. [Google Scholar] [CrossRef]
- Persson, K. Ängs- och betesmarksinventeringen–inventeringsmetod [National Inventory of Meadows and Pastures–inventory method]. In Swedish Board of Agriculture, Report 2005/2; Swedish Board of Agriculture: Jönköping, Sweden, 2005. [Google Scholar]
- Nordberg, A. Utvärdering av Ängs-och Betesmarksinventeringen och Databasen TUVA [Evaluation of the Meadow and Pasture Inventory and the TUVA Database]. In Swedish Board of Agriculture, Report 2013; Swedish Board of Agriculture: Jönköping, Sweden, 2013; p. 32. [Google Scholar]
- Nordberg, A. National Meadow and Pasture Inventory (TUVA). GBIF-Sweden. Occurrence Dataset. 2023. Available online: https://www.gbif.org/dataset/59bc8df0-0c71-11dd-84d4-b8a03c50a862 (accessed on 12 September 2023).
- Board of Agriculture. Instruktion för Fältinventering av Brukarblock [Instruction for Field Control of Arable Fields in LPIS]; Version 1; Swedish Board of Agriculture: Jönköping, Sweden, 2009.
- Board of Agriculture. Uppdatering av blockdatabasen med stöd av satellitdata [Updating arable fields in LPIS with use of satellite data]. In Swedish Board of Agriculture, Report 2009/3; Swedish Board of Agriculture: Jönköping, Sweden, 2009. [Google Scholar]
- Andersen, E.; Verhoog, A.D.; Elbersen, B.S.; Godeschalk, F.E.; Koole, B. A Multidimensional Farming System Typology; SEAMLESS Integrated Project, Report no. 12. EU 6th Framework Programme; 2006; Available online: https://edepot.wur.nl/144237 (accessed on 12 September 2023).
- Tonn, B.; ten Berge, H.; Eggers, S.; Hiron, M.; Klaus, V.H.; Korevaar, H.; Newell-Price, P.; Sacco, D.; Schils, R. Permanent Grassland Typology. Level-1 and Level-2 Classes; Milestone M2.1. Super-G, Sustainable Permanent Grasslands; EU Horizon 2020 Research and Innovation Programme: Göttingen, Germany, 2018. [Google Scholar]
- Slabbert, E.L.; Knight, T.M.; Wubet, T.; Kautzner, A.; Baessler, C.; Auge, H.; Roscher, C.; Schweiger, O. Abiotic factors are more important than land management and biotic interactions in shaping vascular plant and soil fungal communities. Glob. Ecol. Conserv. 2022, 33, e01960. [Google Scholar] [CrossRef]
- Chytrý, M.; Tichý, L.; Hennekens, S.M.; Knollová, I.; Janssen, J.A.M.; Rodwell, J.S.; Peterka, T.; Marcenò, C.; Landucci, F.; Danihelka, J.; et al. EUNIS Habitat Classification: Expert system, characteristic species combinations and distribution maps of European habitats. Appl. Veg. Sci. 2020, 23, 648–675. [Google Scholar] [CrossRef]
- Normander, B.; Levin, G.; Auvinen, A.-P.; Bratli, H.; Stabbetorp, O.; Hedblom, M.; Glimskär, A.; Gudmundsson, G.A. Indicator framework for measuring quantity and quality of biodiversity—Exemplified in the Nordic countries. Ecol. Indic. 2012, 13, 104–116. [Google Scholar] [CrossRef]
- Spörndly, E.; Widén, O. Grazing semi-natural pastures late in the season or every second year–effects on the weight gain of steers and composition of selected vegetation. Acta Agric. Scand. Sect. A Anim. Sci. 2012, 57, 159–172. [Google Scholar] [CrossRef]
- Grandin, U.; Lenoir, L.; Glimskär, A. Are restricted species checklists or ant communities useful for assessing plant community composition and biodiversity in grazed pastures? Biodiv. Conserv. 2013, 22, 1415–1434. [Google Scholar] [CrossRef]
- Bergmeier, E.; Petermann, J.; Schröder, E. Geobotanical survey of wood-pasture habitats in Europe: Diversity, threats and conservation. Biodivers. Conserv. 2020, 19, 2995–3014. [Google Scholar] [CrossRef]
- Clough, Y.; Kirchweger, S.; Kantelhardt, J. Field sizes and the future of farmland biodiversity in European landscapes. Conserv. Lett. 2019, 13, e12752. [Google Scholar] [CrossRef] [PubMed]
Figure 1.
Average area per farm of improved temporal grassland on arable land (ley) and permanent grassland, including semi-natural grassland (pasture), on cattle and sheep farms according to the questionnaire sent out to farmers in 2017 (n = 1117 farms with a reply rate of The results of the questionnaire are separated into four regions of Sweden: agriculturally dominated (Agric. ); mosaic with a mix of arable land, pasture, and woodland in the south-east (Mosaic); forest-dominated in the south (Forest); and northern parts with much forest and a low proportion of semi-natural grassland (North), corresponding to the administrative regions in official Swedish agricultural statistics [46,48].

Figure 2.
Number of cattle farmers who stated in 2017 that they had applied for agri-environmental scheme (AES) payment for grazing management of grassland. A distinction is made for payments of grasslands with high natural (special, SV) values or with low natural (general, GV) values, in which the farmer has chosen to apply for such an AES payment for all of the grassland area within the farm that is eligible for such payment (”all land"), none or only a part of the area (”not all land”), and farmers that did not apply for any payment (NP). Unpublished data from the Swedish Board of Agriculture For an explanation of regions, see Figure 1.

Figure 3.
Number of sheep farmers who stated in 2017 that they had applied for agri-environmental scheme (AES) payment for grazing management of grassland. A distinction is made for payments of grasslands with high natural (special, SV) values and with low natural (general, GV) values, in which the farmer has chosen to apply for such AES payment for all of the grassland area within the farm that is eligible for such payment (”all land”) or none or only a part of the area (”not all land”), and farmers that did not apply for any payment (NP). Unpublished data from the Swedish Board of Agriculture. For an explanation of regions, see Figure 1.

Figure 4.
Number of farmers who in 2017 gave different reasons for not applying for agri-environmental payment for grazing in all or parts of the agricultural land (unpublished data from the Swedish Board of Agriculture). A: I will phase out parts of my farm; B: Insufficient payment; C: Difficult to change assignment; D: Rules are difficult to understand; E: Application is too complicated; F: I can see no environmental gains; G: I worry about sanctions; H: I lease out my land to others; I: I only graze some years; J: Other reasons For an explanation of regions, see Figure 1.

Figure 5.
Number of farmers who in 2017 stated different activities that would have been preferred if they had been allowed by the agri-environmental scheme regulations (unpublished data from the Swedish Board of Agriculture). A: Use additional feeding; B: Let animals out earlier; C: Let animals out later; D: Graze for a longer period; E: Graze for a shorter period; F: More clearing of woody plants; G: Less clearing of woody plants; H: Other. For an explanation of regions, see Figure 1.

Figure 6.
Proportion of the estimated area of grazed and ungrazed grassland within and outside the Swedish Land Parcel Information System (LPIS) [111,112] according to grassland monitoring from aerial photographs and field data [49,50]. Sp-rich is defined as having five indicator plant species or more. Note that this regional classification differs from the one used in the interview survey (Figure 1, Figure 2, Figure 3, Figure 4 and Figure 5).

Figure 7.
Proportion of visited plots from grassland monitoring classified as semi-natural grassland, with or without valuable grassland habitat according to the EU’s Habitats Directive [61], within and outside objects in the database of the National Inventory of Meadows and Pastures (TUVA) [108,109] and the administrative database of the Swedish Land Parcel Information System (LPIS) [111,112]. Since the number of plots in TUVA objects outside of LPIS was small, these were excluded from this comparison (cf. area figures in Table 1). For an explanation of regions, see Figure 6.

Figure 8.
Average number of vascular plant species in sampling plots with a radius of 3 m from nation-wide sample-based monitoring, combined with data from the administrative database of the Swedish Land Parcel Information System (LPIS) [111,112] Error bars are the standard error of the mean.

Figure 9.
Proportion of visited plots from nation-wide sample-based grassland monitoring for plots that were in the field classified as semi-natural grassland, combined with information in the administrative database of the Swedish Land Parcel Information System (LPIS) [111,112]. For an explanation of regions, see Figure 6. The classification of nutrient and moisture conditions was made based on plant indicator values [59,60].


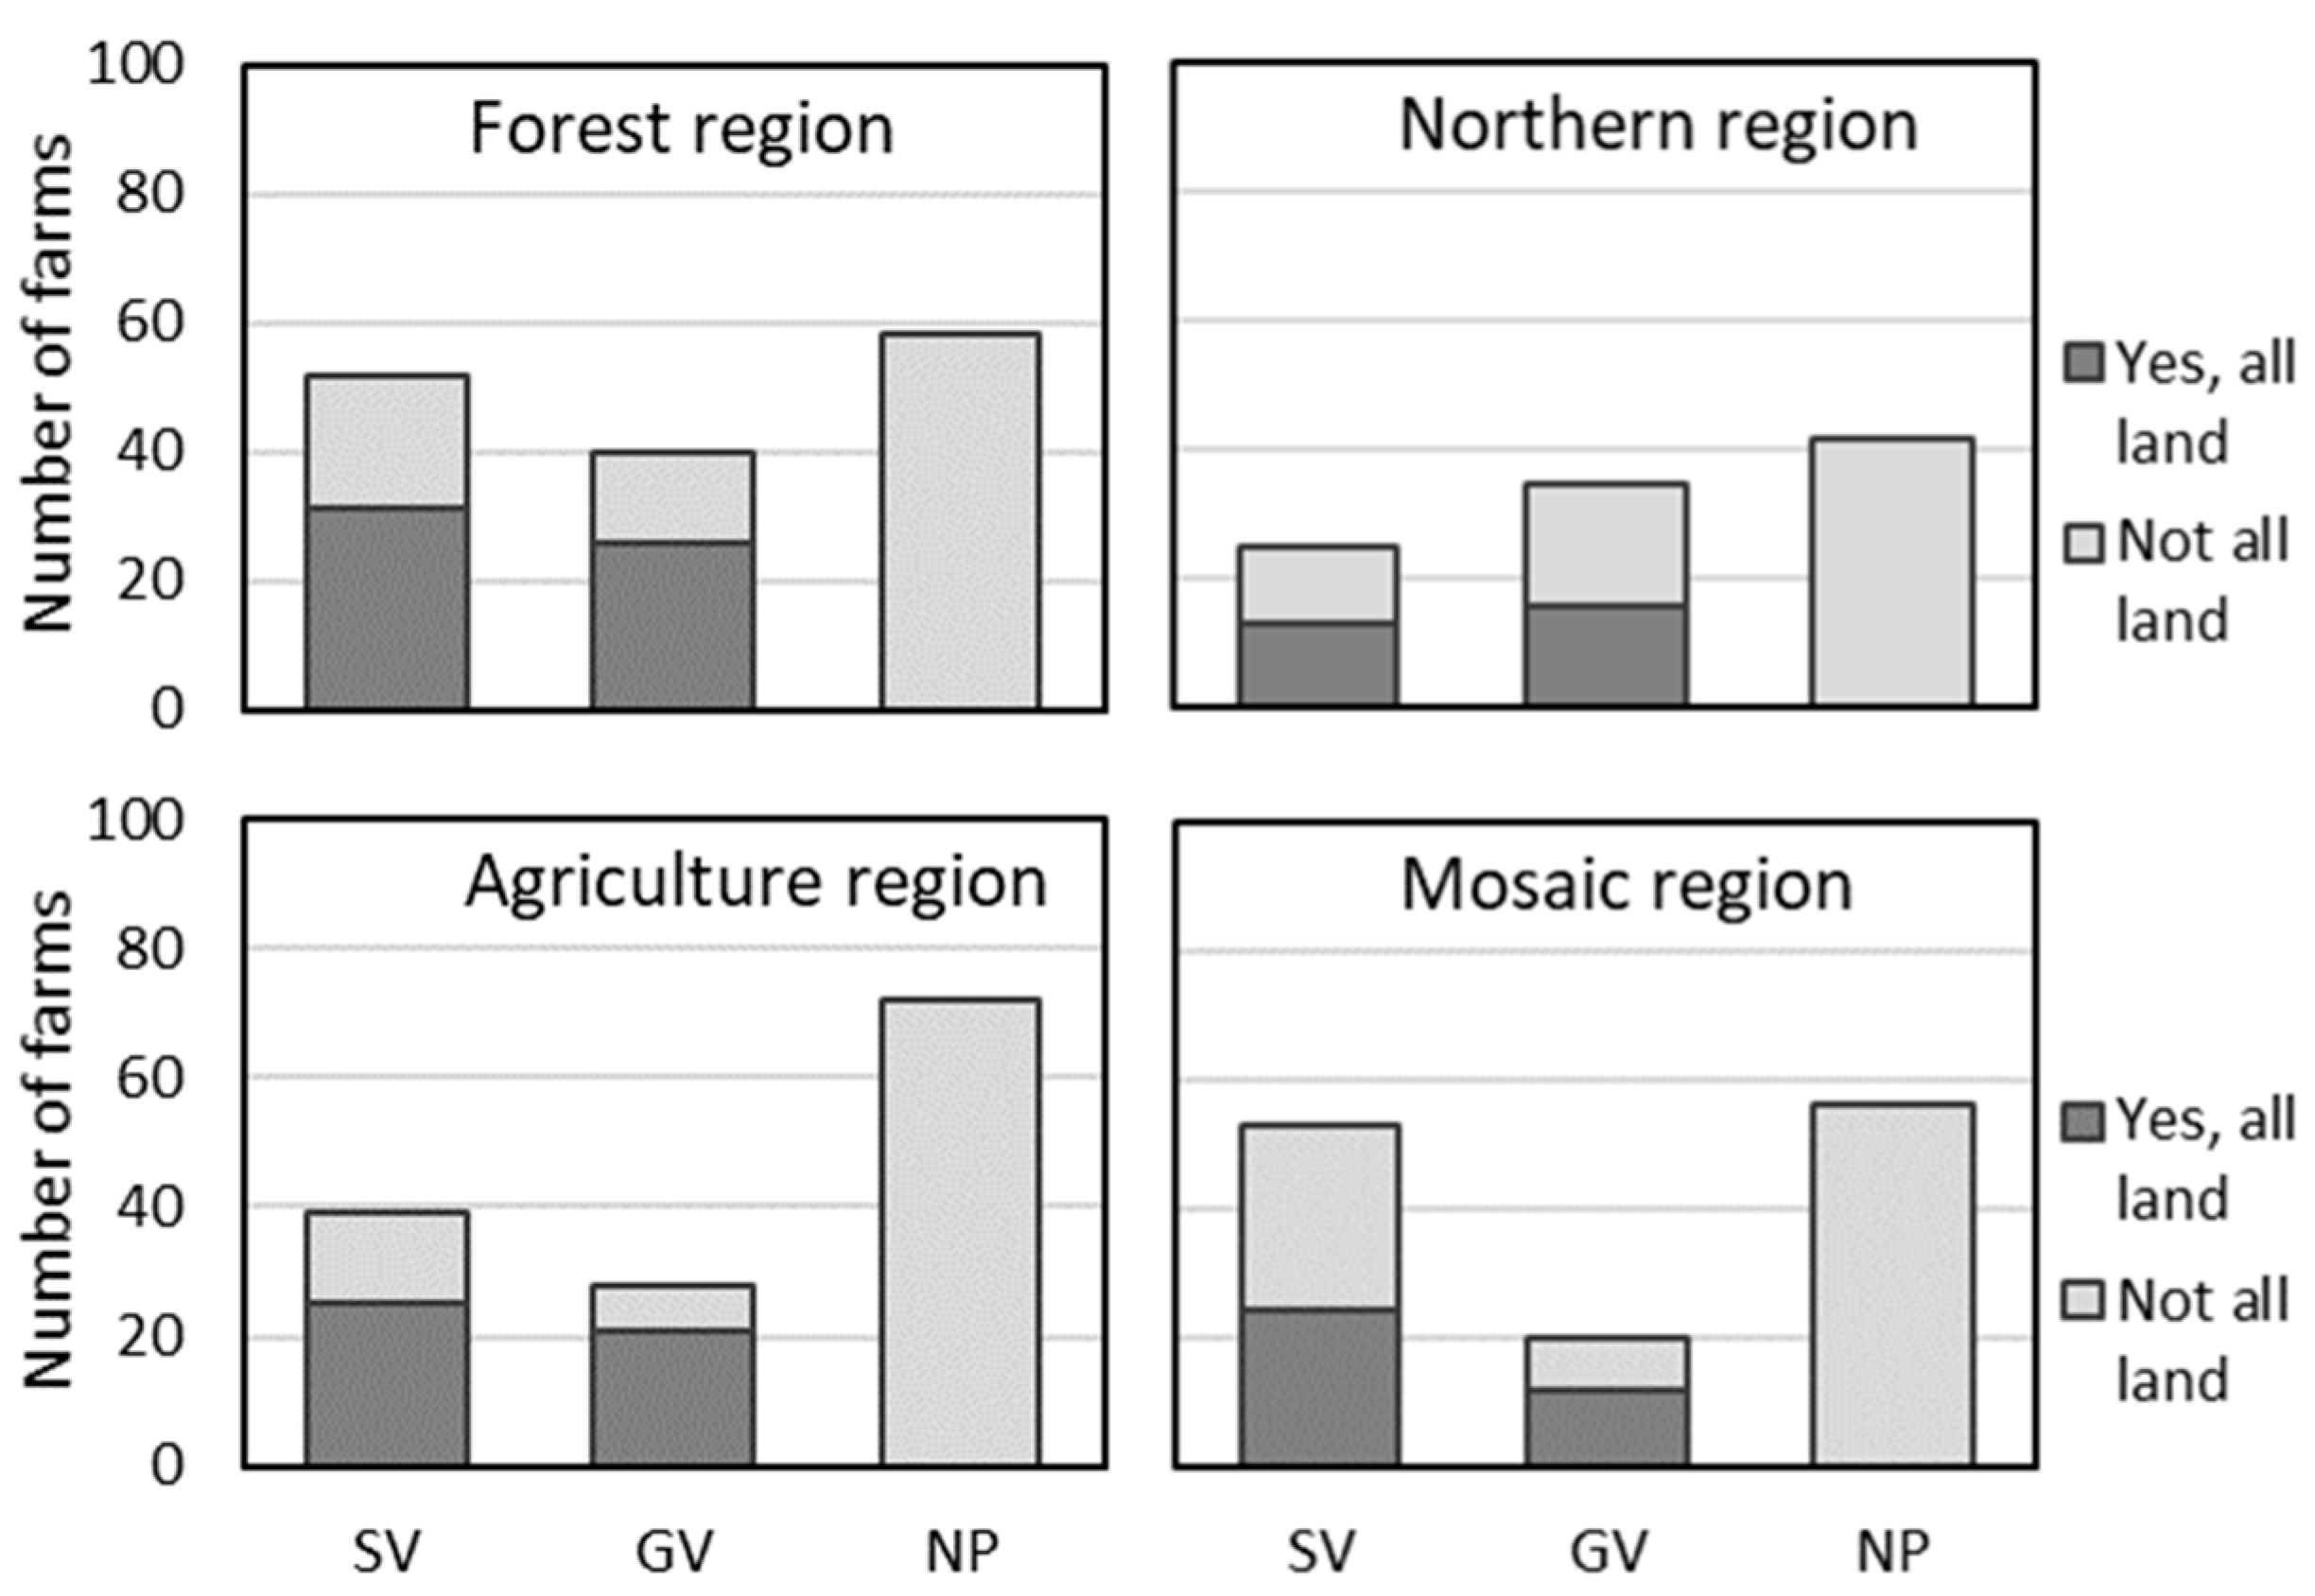
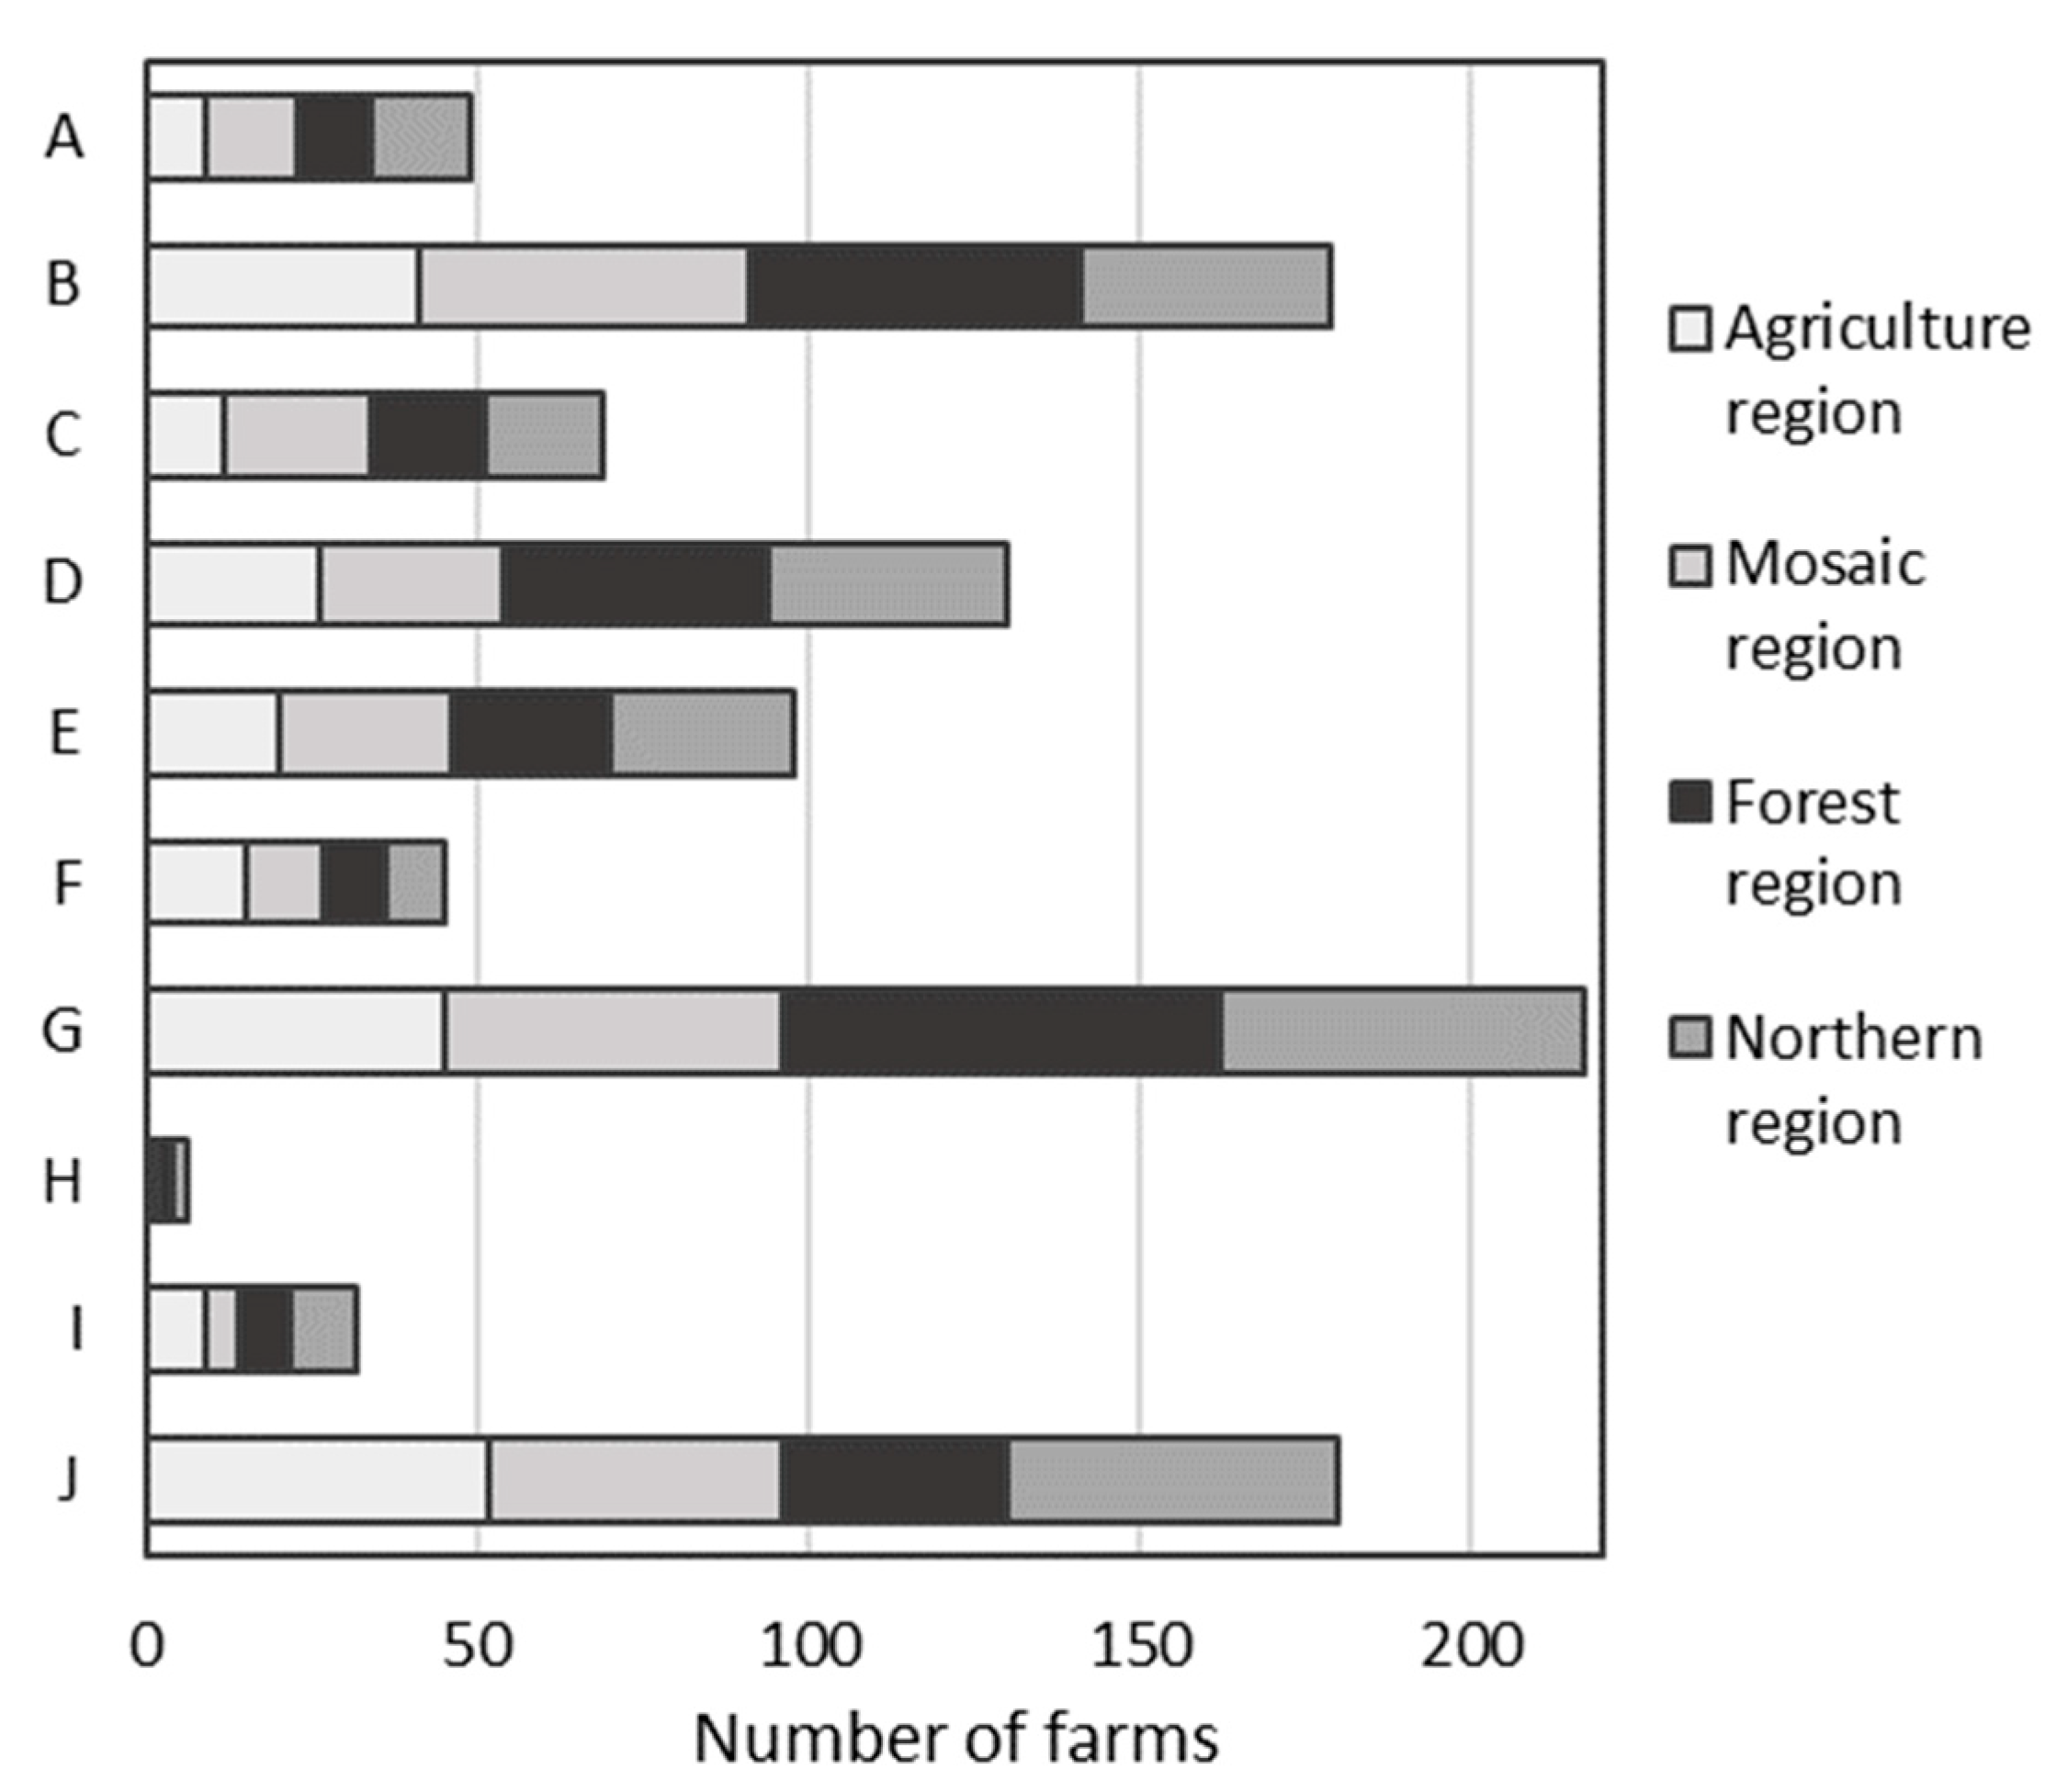
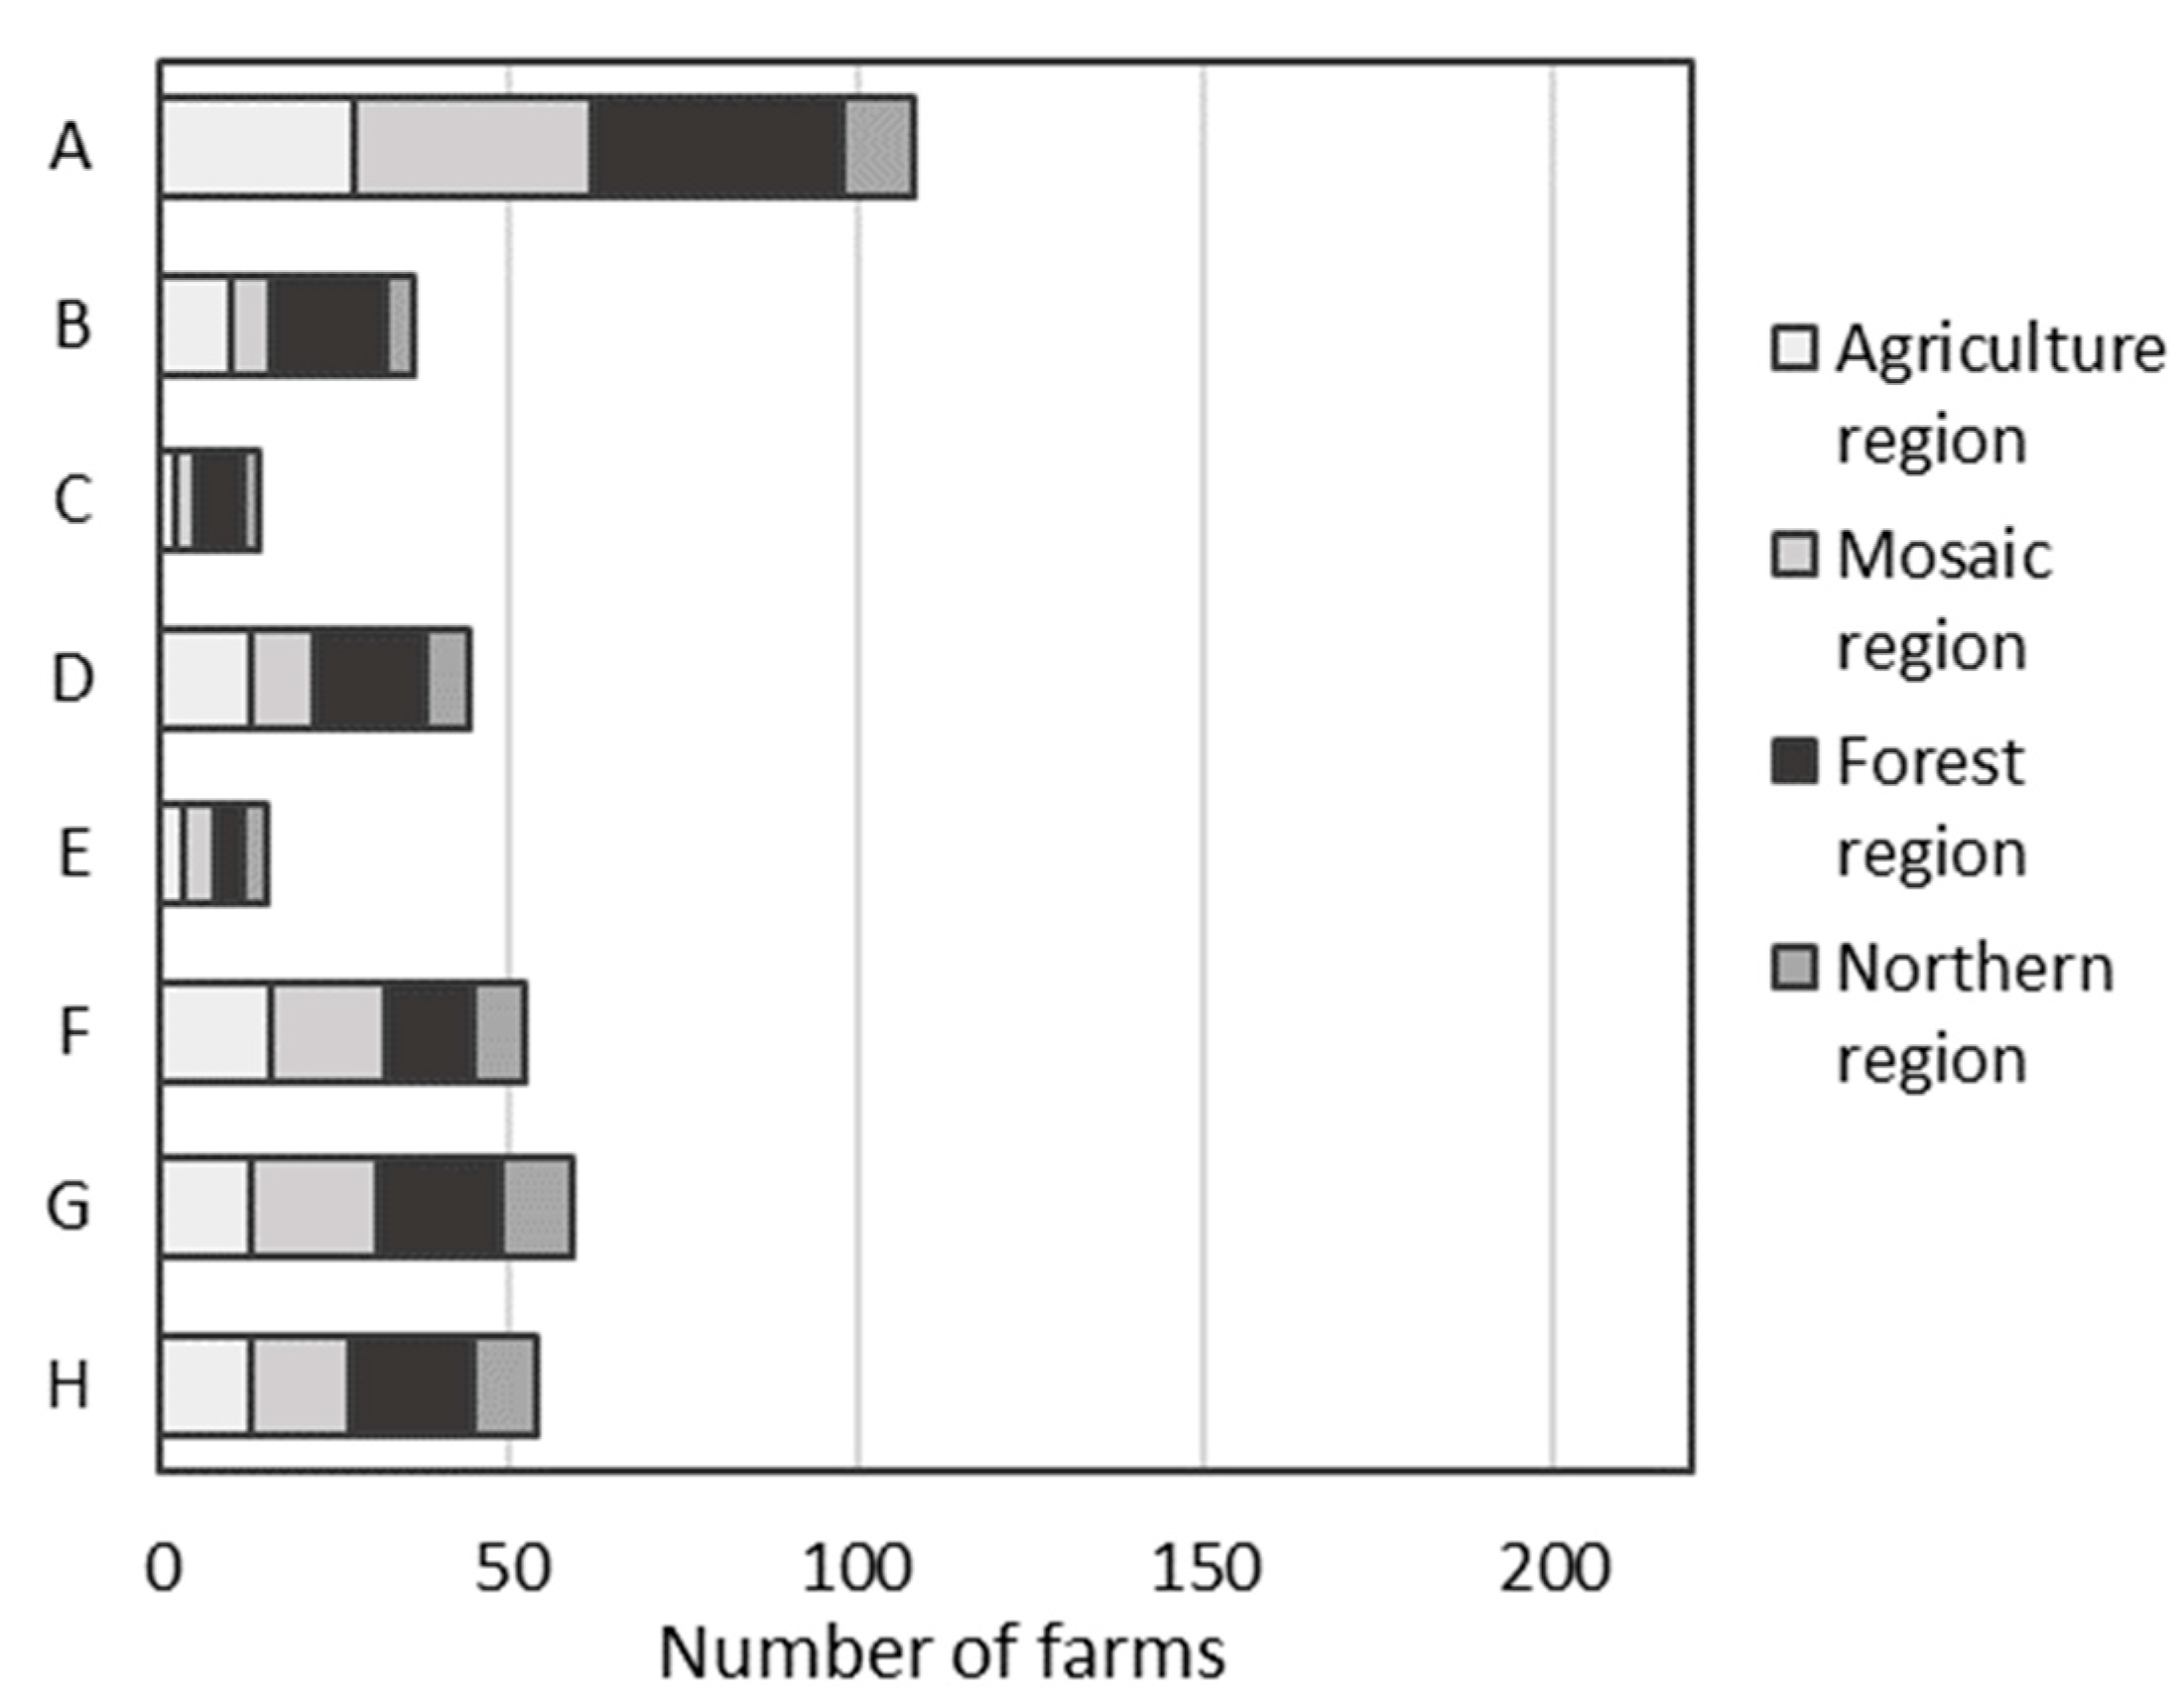
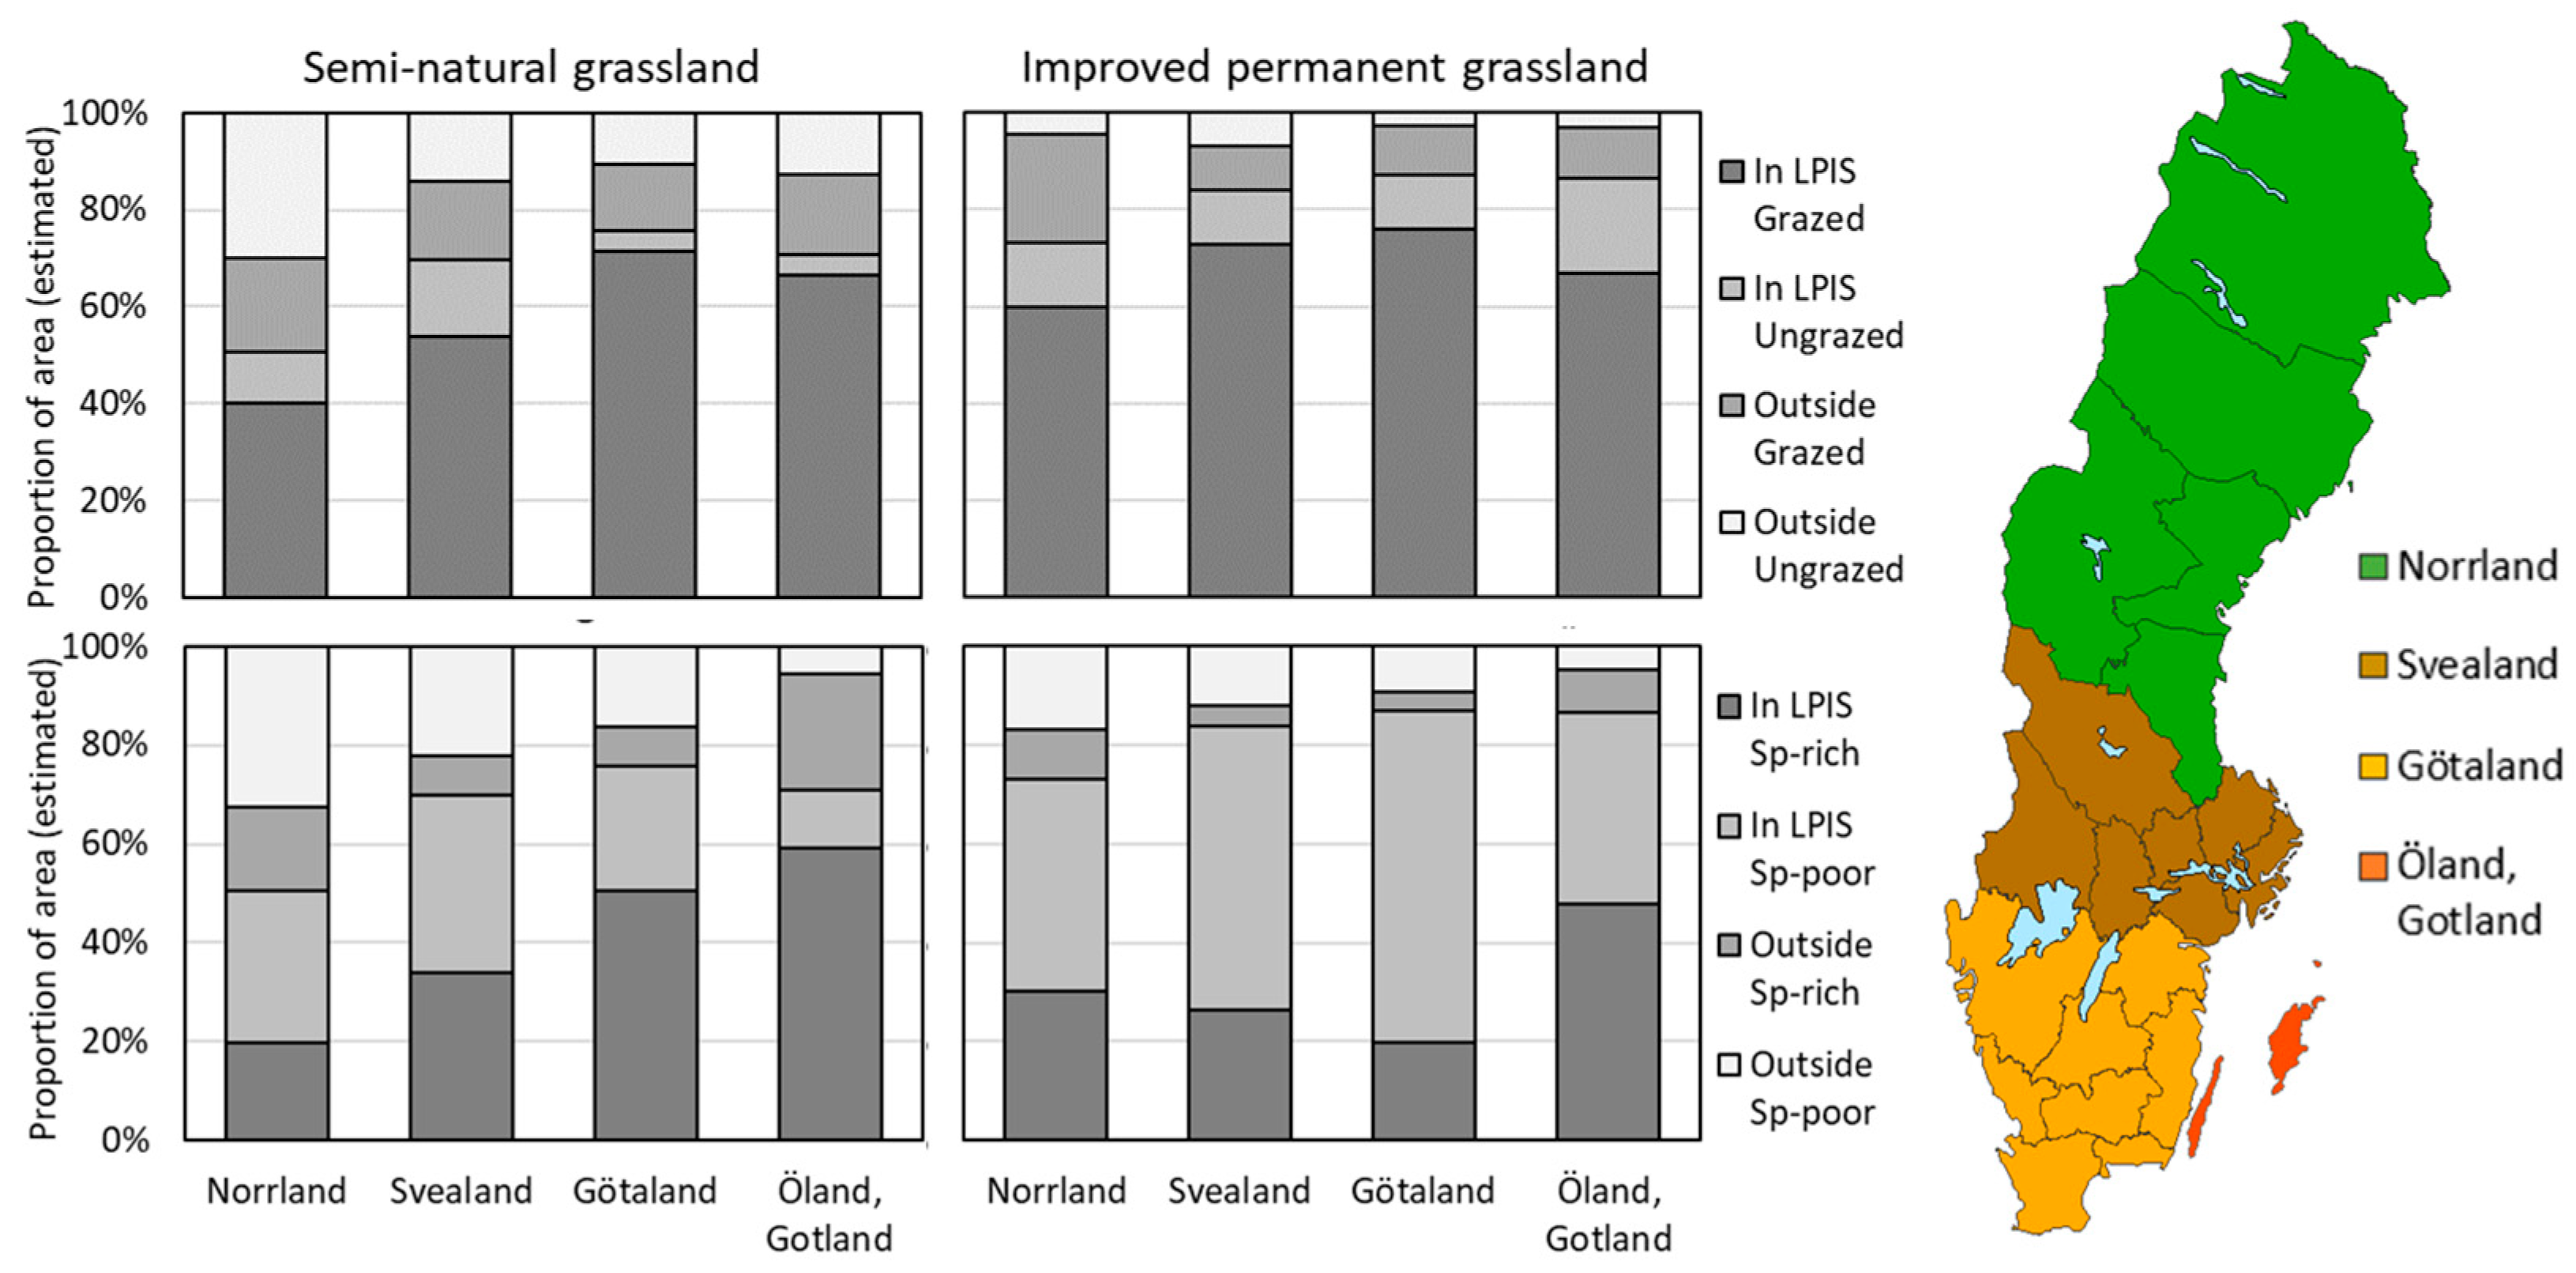
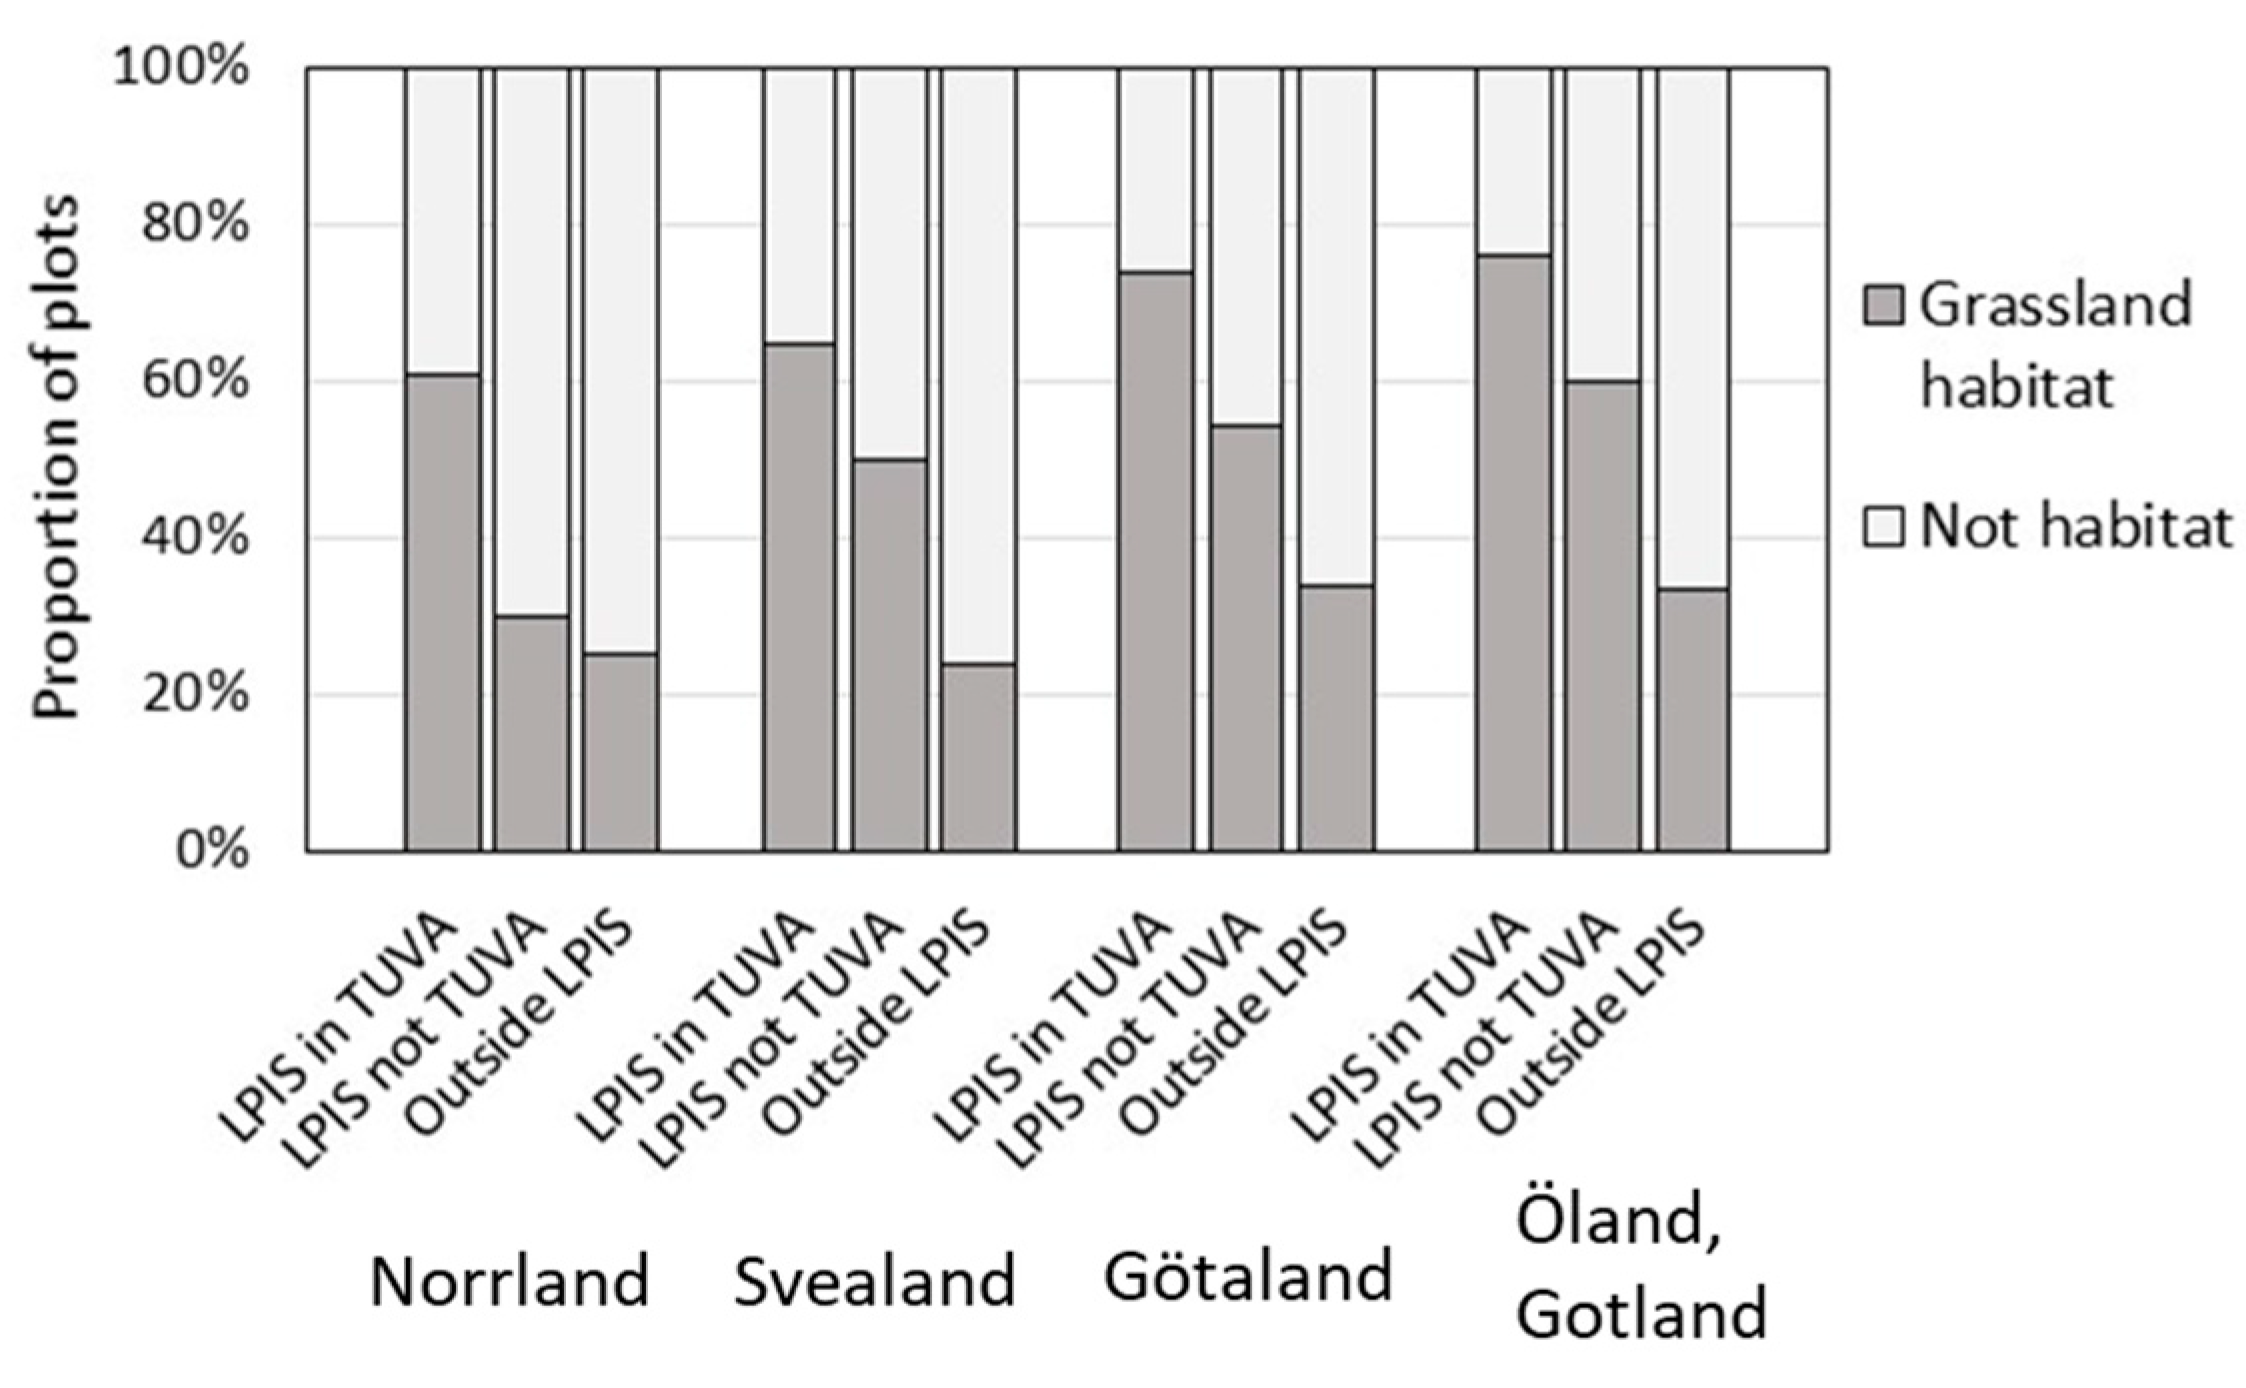
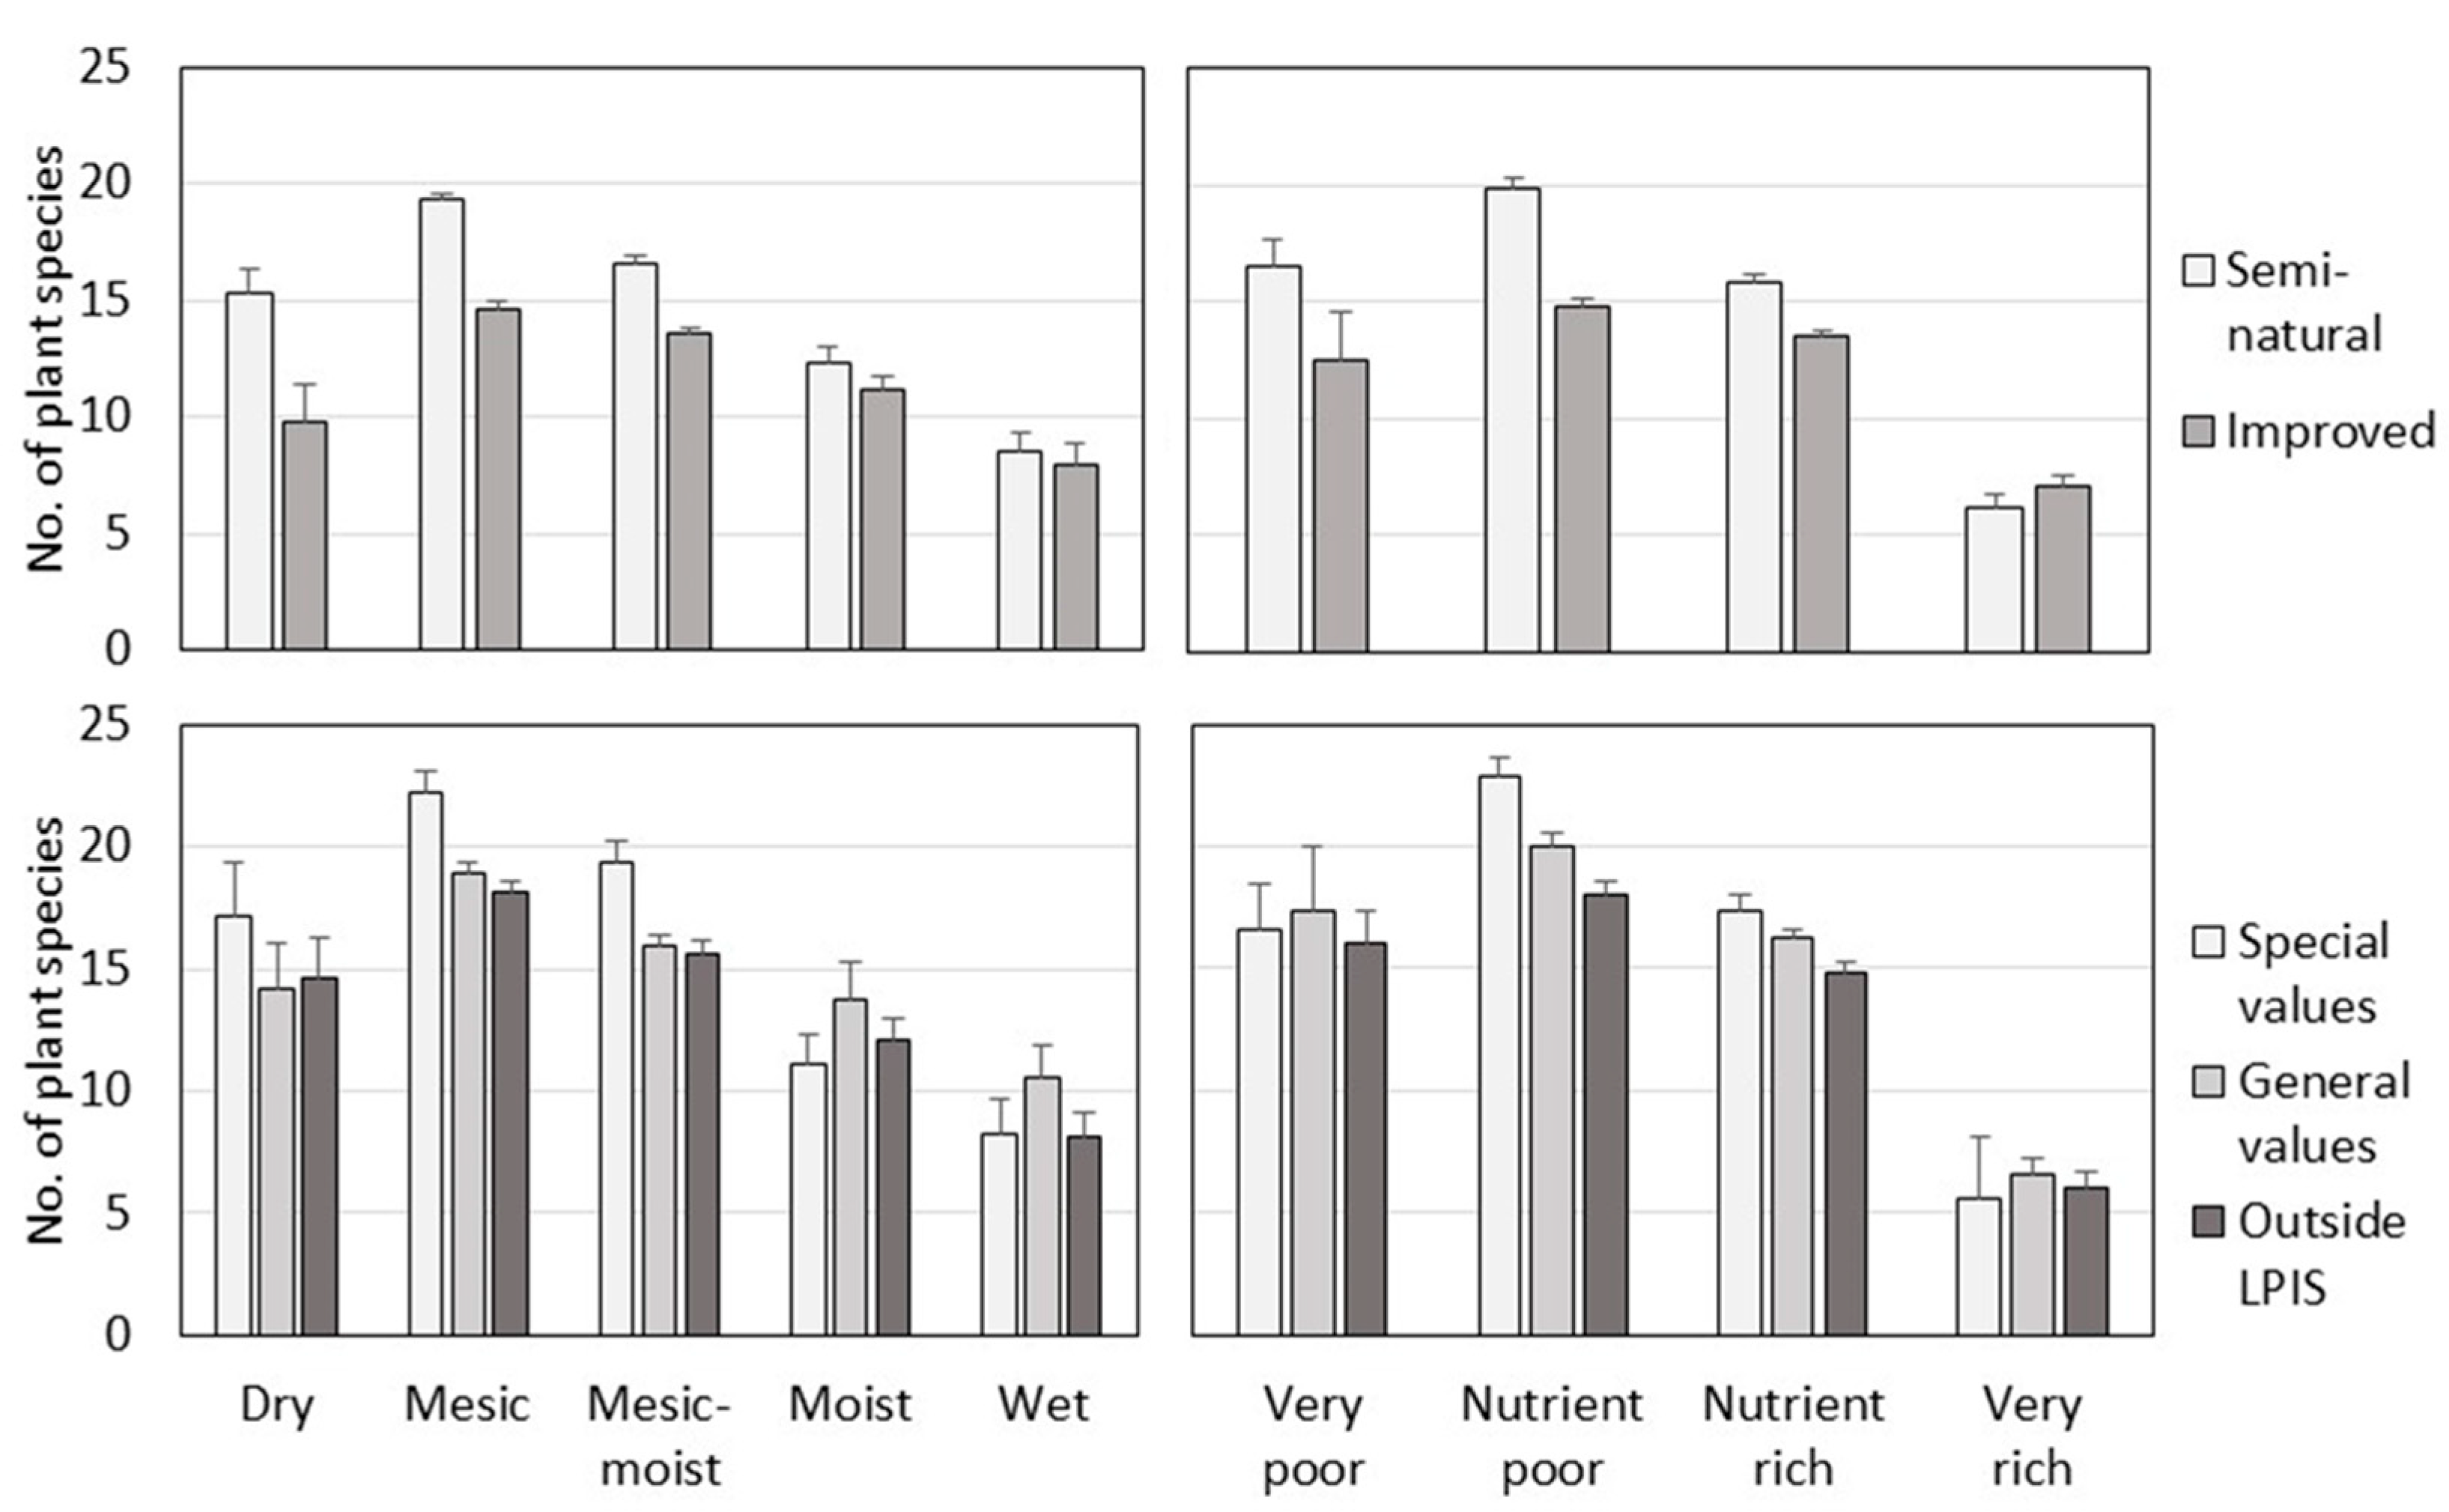
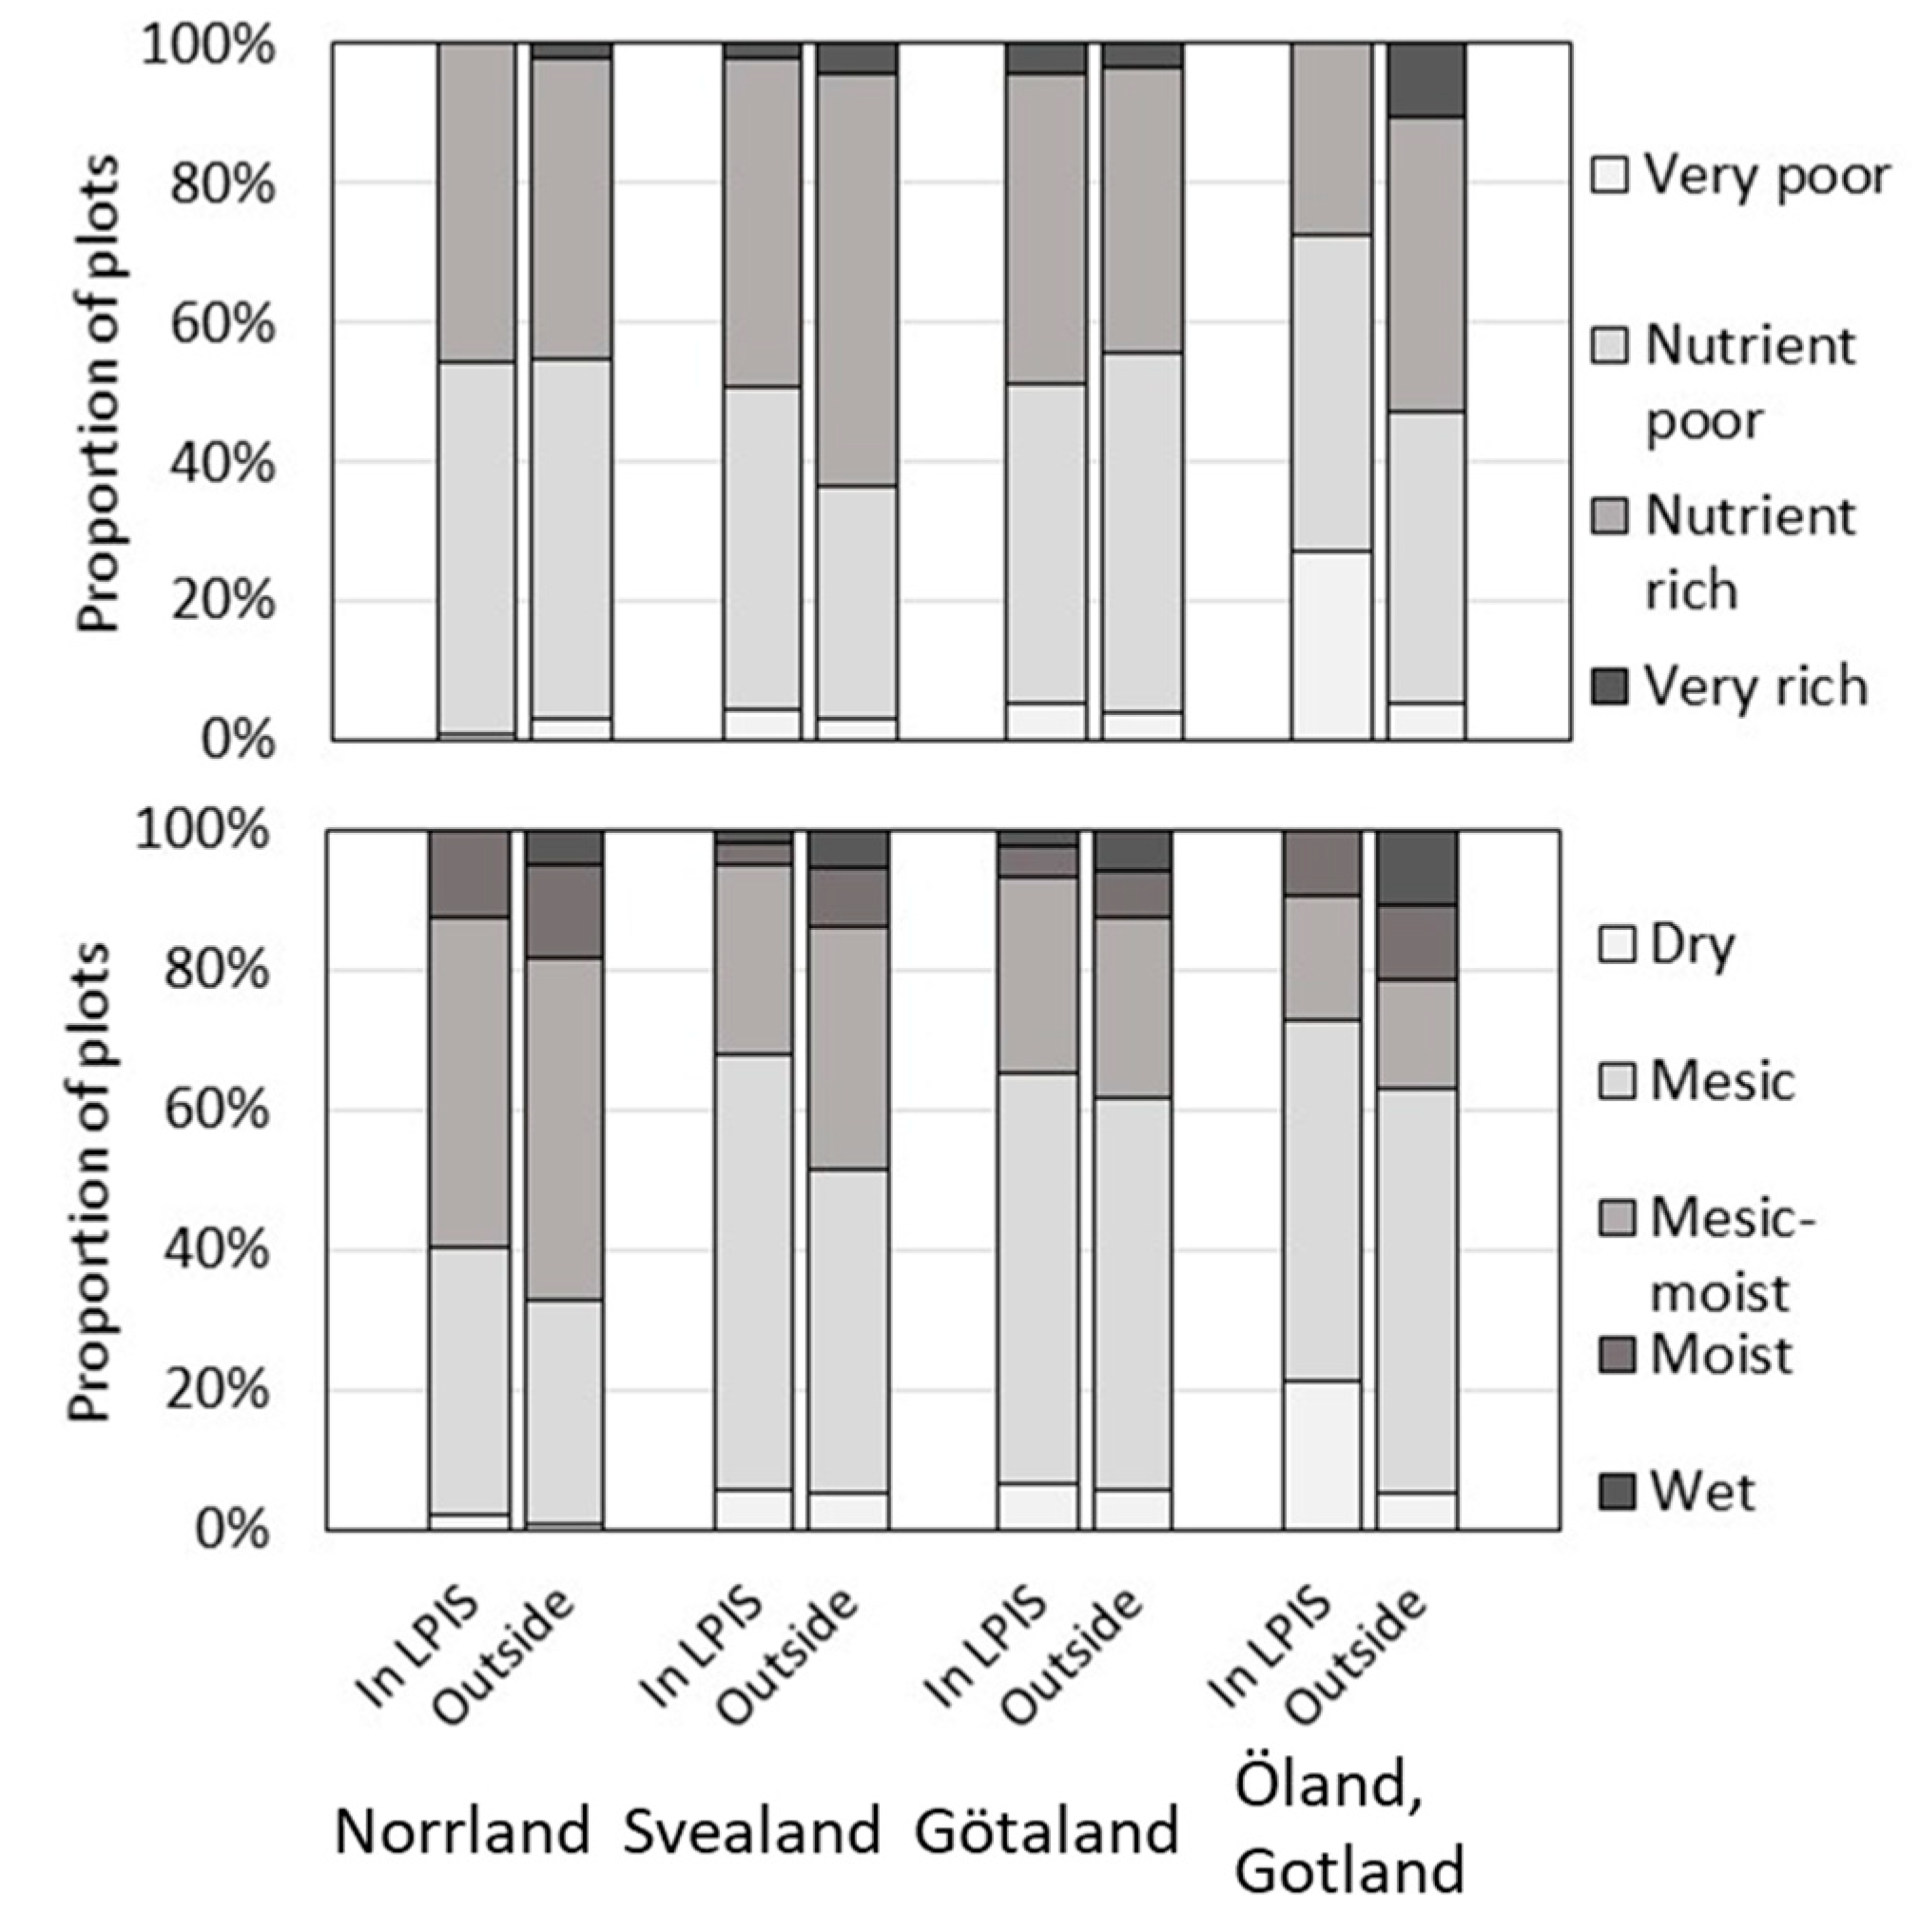
Table 1.
Estimated area (mean, standard error (SE), and relative standard error (RSE)) of Swedish grassland and other agricultural land according to nationwide sample-based monitoring with areas mapped in high-resolution infrared aerial photographs, After mapping, the GIS layer was then overlayed with GIS layers from the database of the National Inventory of Meadows and Pastures (TUVA) [108,109] and the administrative database of the Swedish Land Parcel Information System (LPIS) [111,112].
| Area (ha) | |||
|---|---|---|---|
| Mean | SE | RSE | |
| Semi-natural grassland | 320,000 | 50,000 | 15.6% |
| Improved permanent grassland | 580,000 | 80,000 | 13.8% |
| Arable land, including temporal grassland | 1,800,000 | 370,000 | 20.6% |
| Semi-natural within TUVA | 130,000 | 15,000 | 12.5% |
| Semi-natural outside TUVA | 190,000 | 20,000 | 10.5% |
| Semi-natural outside TUVA but within LPIS | 130,000 | 20,000 | 15.4% |
| Semi-natural within TUVA but outside LPIS | 10,000 | 2500 | 25.0% |
| Semi-natural outside both TUVA and LPIS | 60,000 | 12,000 | 20.0% |
Table 2.
Dry matter production for grazing of different habitats of the European Nature Information System (EUNIS) habitat classification [51,98], relevant for lowland grasslands in Northern Europe.
| EUNIS Level 2 | Dry Matter (kg ha−1) |
|---|---|
| Dry grasslands | 1800 |
| Mesic grasslands | 3000 |
| Seasonally wet and wet grasslands | 4400 |
| Sparsely wooded grasslands | 1400 |
| Arable land and market gardens | 4100 |
Disclaimer/Publisher’s Note: The statements, opinions and data contained in all publications are solely those of the individual author(s) and contributor(s) and not of MDPI and/or the editor(s). MDPI and/or the editor(s) disclaim responsibility for any injury to people or property resulting from any ideas, methods, instructions or products referred to in the content. |
© 2023 by the authors. Licensee MDPI, Basel, Switzerland. This article is an open access article distributed under the terms and conditions of the Creative Commons Attribution (CC BY) license (https://creativecommons.org/licenses/by/4.0/).
Share and Cite
MDPI and ACS Style
Glimskär, A.; Hultgren, J.; Hiron, M.; Westin, R.; Bokkers, E.A.M.; Keeling, L.J. Sustainable Grazing by Cattle and Sheep for Semi-Natural Grasslands in Sweden. Agronomy 2023, 13, 2469. https://doi.org/10.3390/agronomy13102469
AMA Style
Glimskär A, Hultgren J, Hiron M, Westin R, Bokkers EAM, Keeling LJ. Sustainable Grazing by Cattle and Sheep for Semi-Natural Grasslands in Sweden. Agronomy. 2023; 13(10):2469. https://doi.org/10.3390/agronomy13102469
Chicago/Turabian StyleGlimskär, Anders, Jan Hultgren, Matthew Hiron, Rebecka Westin, Eddie A. M. Bokkers, and Linda J. Keeling. 2023. "Sustainable Grazing by Cattle and Sheep for Semi-Natural Grasslands in Sweden" Agronomy 13, no. 10: 2469. https://doi.org/10.3390/agronomy13102469
Note that from the first issue of 2016, this journal uses article numbers instead of page numbers. See further details here.