Article

Biofertilizers Enriched with PGPB Improve Soil Fertility and the Productivity of an Intensive Tomato Crop

by
Raúl Ortega Pérez
1,*,
José Carlos Nieto García
1,
Victor M. Gallegos-Cedillo
2,3,
Miguel Ángel Domene Ruiz
4,
Mila Santos Hernández
1,
Cinthia Nájera
1,5,
Isabel Miralles Mellado
1 and
Fernando Diánez Martínez
1
1
Department of Agronomy, CIAIMBITAL Research Centre, Universidad de Almería, Carretera Sacramento s/n, 04120 Almeria, Spain
2
Department of Engineering, CIAIMBITAL Research Centre, Universidad de Almería, Carretera Sacramento s/n, 04120 Almeria, Spain
3
Department of Agronomical Engineering, Universidad Politécnica de Cartagena, 30203 Cartagena, Spain
4
Health and Food Department, Cajamar Experimental Station, 04710 El Ejido, Spain
5
Department of Soil and Water Conservation and Organic Wastes Management, CEBAS-CSIC, 30100 Murcia, Spain
*
Author to whom correspondence should be addressed.
Agronomy 2023, 13(9), 2286; https://doi.org/10.3390/agronomy13092286
Submission received: 5 May 2023 / Revised: 19 August 2023 / Accepted: 27 August 2023 / Published: 30 August 2023
(This article belongs to the Section Soil and Plant Nutrition)

Abstract

:
The use of microorganisms capable of promoting the growth and development of crops is generating interest at a global level as a sustainable technique in modern agriculture, especially in intensive farming systems, where the excessive use of synthetic fertilizers has led to environmental problems. The objective of this research was to evaluate the biofertilizing power of formulations enriched with plant growth-promoting bacteria (PGPB) (Azotobacter spp. to fix N and strains of Bacillus spp. to solubilize P and K not bioavailable for plants) to improve the fertility, quality, and productivity of a tomato crop and their potential use as an alternative to conventional fertilizers. Thus, NPK levels in soils, leaves, and fruits were evaluated; various parameters of fruit quality were measured; and an exhaustive analysis of the production and economic yields of the harvest was carried out. The results showed that the periodic supply of biofertilizers based on PGPB increased the harvest yield (20–32%) and favored the development of larger fruit sizes, which are economically more valuable, and the incomes increased even more than production (32–52%). The biofertilizers also demonstrated a positive effect on the solubilization of P and K in the soil, and the levels of P in leaves were also promoted. The capacity to mobilize the nutrients from soil to fruits was clearly favored when PGPB were inoculated periodically, and a reduction of up to 20% in synthetic fertilizers was accomplished (16, 34, and 23% increases for N, P, and K, respectively, against the treatment without PGPB and no fertigation reduction). Finally, the use of PGPB did not show appreciable differences regarding fruit quality parameters.

1. Introduction

The model of intensive agriculture in plastic greenhouses used in southeastern Spain exploits the advantage of good regional climate characteristics to, together with technological and innovative developments, obtain vegetable yields that supply the European market during much of the year [1]. Within horticultural crops, tomato (Solanum lycopersicum) stands out, with an estimated global production of more than 180 billion tons and a cultivation area of more than 5 million ha in 2021 [2]. Spain is one of the largest tomato producers, with a production of 4,754,380 tons and a cultivation area of 56,106 hectares, with Andalusia being the community with the largest tomato cultivation area in the country, with 21,356 ha [3]. At the provincial level, Almería has the largest surface area of 8201 ha [4]. The majority of this crop is grown in an intensive greenhouse cultivation system. These cultivation systems, although they have yielded great results in terms of production, have caused negative effects on the ecosystem, including salinization and contamination of aquifers and the generation of waste derived from the intensive use of fertilizers and phytosanitary treatments [5,6,7]. Therefore, developing a more sustainable agriculture model will lead to the implementation of strategies that will increase the efficient use of resources, such as water and fertilizers. For example, the use of biofertilizers or bacterial inoculants (plant growth-promoting bacteria, PGPB) capable of promoting the growth and development of crops is generating interest at the global level as a sustainable modern agricultural technique [8,9]. The positive effects of the application of certain microorganisms on the productivity of crops are known [10,11,12]. However, the extent to which microorganisms can offer plant protection [9] and the ability to increase the availability of nutrients through the biological fixation of N2 or the solubilization of forms of P and K that are not bioavailable for plants remain unclear [13,14,15]. The use of PGPB in intensive agriculture is of great interest for two reasons: PGPB can increase crop yields and help reduce the inputs of fertilizers and pesticides. It has been demonstrated that the use of biofertilizers enriched with microorganisms can stimulate growth and increase crop yields through different direct or indirect mechanisms of action. They can increase nutrient availability in the rhizosphere, biological nitrogen fixation, siderophore production, nutrient uptake, and translocation [16], and can enhance the photosynthetic activity and growth parameters [17]. Additionally, some PGPRs are able to decrease ethylene levels, and the biosynthesis and signaling of phytohormones (such as indole-3-acetic acid (IAA)) that can boost plant growth and fruit size [18,19,20]. Although there are studies on the potential of PGPB for crop improvement, they are limited to intensively cultivated crops [21]. Thus, the objectives of this study are to analyze the use of biofertilizer products based on PGPB to improve the production of a commercial tomato crop and reduce the use of synthetic fertilizers and to evaluate the influence of PGPB on soil fertility and fruit quality.

2. Materials and Methods

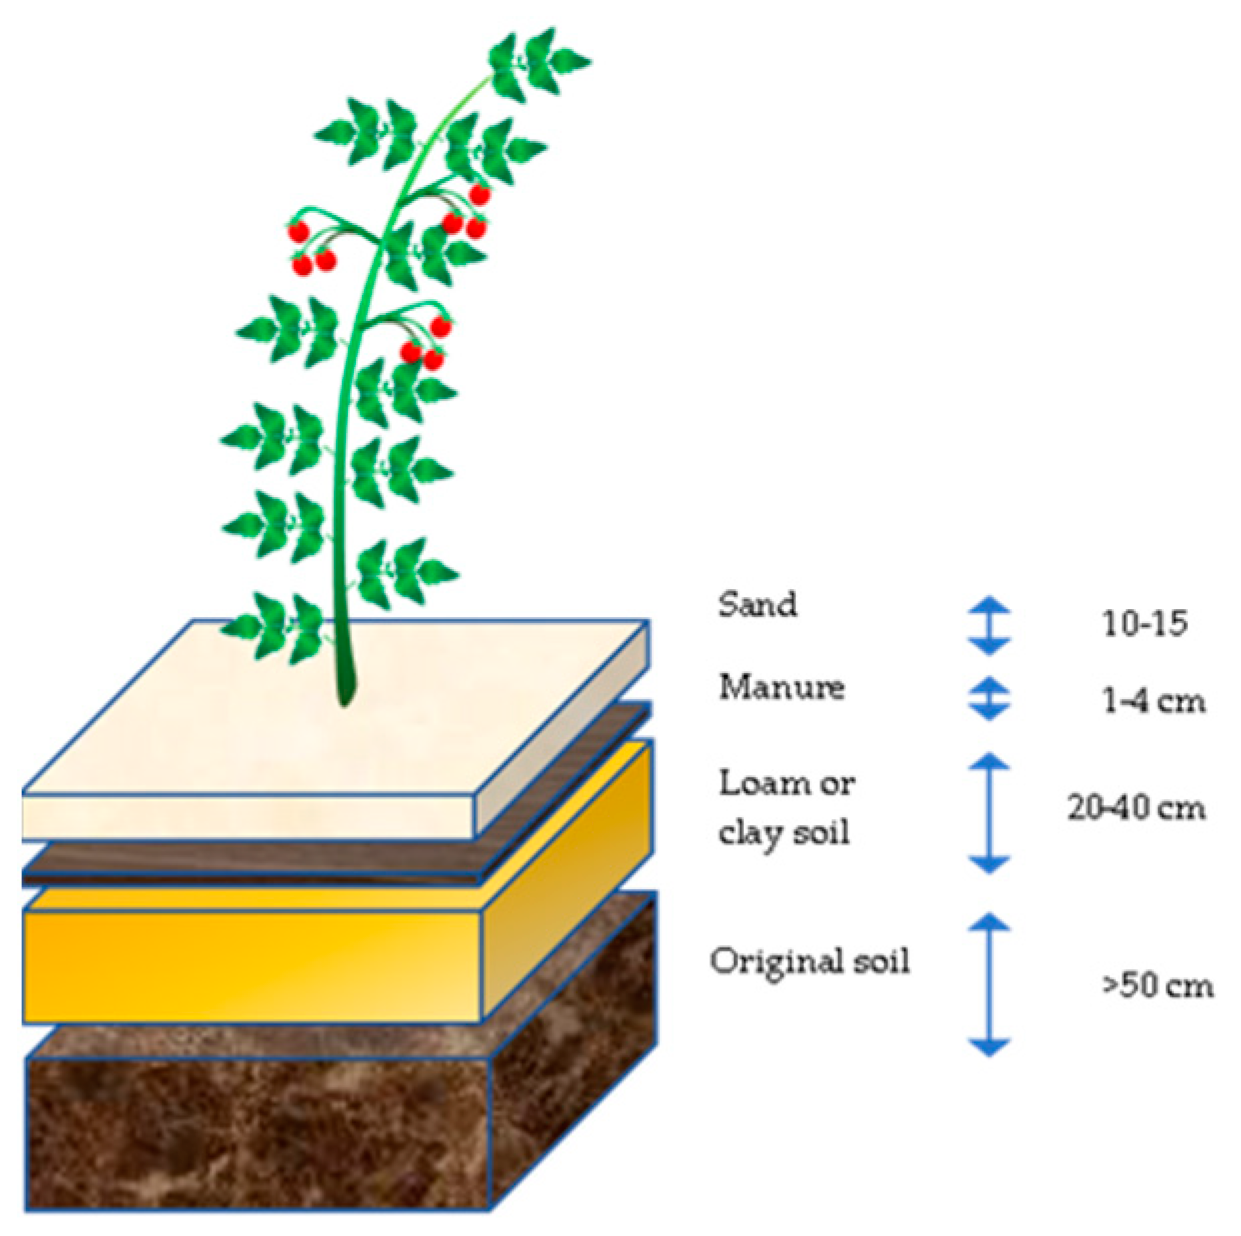
2.1. Location and Crop Characteristics

The trial was carried out in an intensive long-life tomato cultivation cycle from September 2020 to May 2021. Cultivation was performed in a commercial “raspa and amagado” greenhouse (13,700 m2) with a north-south orientation at the following coordinates: 36°52′37.3″ N and 2°23′40.5″ W (Almería, Spain). The plant material used was tomato (Solanum lycopersicum L.) var. Rebellion VT-3831 grafted on Emperador rootstock; plants were transplanted on 20 September 2020 at the 4-leaf stage to a “sanded” soil system (Figure 1). The planting density was 0.8 plants/m2 (1.6 stems/m2). The agronomic management of the crop was similar to the conventional techniques recommended in commercial greenhouses in the Almería region [22].

2.2. Fertigation System

The supply of irrigation water and fertilizers was carried out through an automated fertigation system, consisting of an irrigation head, 4 fertilizer tanks with a capacity of 1000 L each, and a Venturi system that allowed the modification of the proportional injection from each tank and the division of the cultivation area into different irrigation sectors, making it possible to apply a different nutrient formula in each sector.
The tanks contained the following fertilizer preparations: Tank 1, 100 kg of calcium nitrate per 1000 L; Tank 2, 100 kg of potassium nitrate per 1000 L; Tank 3, 25 L of phosphoric acid and 25 kg of magnesium sulfate; and Tank 4, 50 kg of ammonium nitrate (33.5%) and 50 kg of ammonium sulfate (21%).
Fertilization was modified throughout the stages of the cultivation cycle. Table 1 lists the injection rates used for each tank during each cultivation phase.
The concentration of the fertilizers was regulated by the values of the electrical conductivity (EC) and pH established in the irrigation programmer, which controlled the irrigation time and duration. For this study, the irrigation water had a conductivity of 4.1 mS/cm, and a base increase in the EC was established by inorganic fertilizers (1.2 mS/cm) (Table 1).
The provision of irrigation water and fertilizers was carried out through a system of self-compensating drippers (the flow was independent of the pressure) separated by 50 cm. The duration of the irrigation was 30 min, with a flow of 1.5 L/h.

2.3. Biofertilizers

The microorganisms used were the bacteria Azotobacter vinelandii (atmospheric nitrogen fixer), Bacillus aerius (phosphorus solubilizer), and Bacillus aerophillus (potassium solubilizer). The selection of an Azotobacter strain as N biofertilizer is based on its known ability to fix atmospheric N [23]. The identification and selection of the bacteria were carried out by morphological (color, texture, size, margins of the colony, elevation on the agar, and shape of the colony) and biochemical (catalase activity, motility test, oxidase activity, citrate test, indole test, methyl red test, Voges–Proskauer test, triple sugar ion test, and nitrate reduction test) characteristics [24]. Potential P and K solubilizing bacteria were selected and tested, placing colonies in Reyes and Aleksandrow agar media, respectively, and incubated at 28 ± 2 °C for fifteen days and checked daily. Bacterial colonies with clear halos (zones) indicated solubilizing activity. The phosphate (PSI) and potassium solubilization indices (KSI) were calculated as colony diameter + halo diameter/colony diameter. Bio P showed a PSI value of 3.58 and Bio K a KSI value of 4.01.
The microorganisms were applied on the basis of the commercial products Bio N®, Bio P®, and Bio K® from Nostoc Biotech SL. The products consist of 1 L bottles with culture medium and a bacterial concentration of 108 UFC/mL. The application of the biofertilizers was carried out using the same drip irrigation system that was used for inorganic fertigation, and there was no mixing of fertilizer types.

2.4. Treatments and Experimental Design

The greenhouse surface was divided into four zones with similar areas (approximately 3400 m2 each, 2700 tomato plants in each area, with a 0.8 plant m−2 density); the zones were delimited by the irrigation sectors and placed in the same orientation as the greenhouse. The treatments applied in each area were as follows: T0 (control), application of conventional fertigation throughout the crop cycle and without biofertilizers (EC made equal to that of the irrigation water (+1.2 mS/cm) by inorganic fertilizers); T1, application of conventional fertigation throughout the cycle and only an initial inoculation of bacteria 12 days after transplantation; T2, same fertigation system as in the previous treatments and inoculation of bacteria every approximately 40 days, starting 12 days after transplantation; and T3, inoculation of bacteria as in the previous treatment (T2) and a 20% reduction in fertigation with inorganic fertilizers (EC made equal to that of irrigation water (+0.96 mS/cm) by inorganic fertilizers). In each biofertilizer application, a 1 L bottle of each of the Bio N®, Bio P®, and Bio K® products was used, with the first application in 3 of the 4 greenhouse treatments and the remaining applications in half of the treatments (Table 2). The bacterial density was 108 UFC ml−1 in each bottle, which resulted in the number of each bacterial type per plant and inoculation ranging theoretically between 1.23 and 1.84 × 10⁷ UFC.

2.5. Fruit Production and Quality

Nineteen tomato fruit collections were performed between January and May of 2021 (114, 120, 127, 135, 139, 144, 150, 157, 164, 171, 178, 184, 190, 197, 215, 219, 226, 233, and 289 DAT). For each collection, data from 4 groups of 10 plants (totaling 20 stems) per treatment were recorded. The equatorial diameter of the fruit was measured by calipers, according to the sales criteria of the marketing company CASI: G (67–82 mm); GG (82–102 mm); GGG (>102 mm), and lower categories (<67 mm). These values correspond to categories lower than 8, 8 (G), 9 (GG), and 10 (GGG), respectively, of the standard Codex Stan 293-2008 [25]. The fruits were counted and subsequently weighed with an ADAM BCKT-48K-001 scale (resolution 2 g). The production data were normalized to the ratio of kg m−2 of surface area, and after the farmer supplied the sales data by size, the income for each treatment was extrapolated (Table 2).
Several of the fruits were used to determine various quality parameters. The equatorial firmness of the fruits was measured with a penetrometer (PCE-PTR 200 N, Albacete, Spain) with an 8 mm diameter strut and a surface area of 0.5 cm2. The pH, electrical conductivity, °Brix (total soluble solids, % TSS), and titratable acidity were measured in the juice of liquefied fruits. The pH and EC were measured with Laqua pH 1100-S and EC2000 sensors (Horiba Advanced Techno, Co., Kisshoin, Japan), respectively. The percentage TSS was obtained with a hand-held refractometer (Atago Co., Tokyo, Japan). For titratable acidity (TA), 20 mL of the filtered juice was collected under vacuum for subsequent titration with 0.1 N NaOH, and the maturity index (%) was calculated as the TSS/TA ratio [26].

2.6. NPK Macronutrient Analysis in Soils, Leaves, and Fruits

Before the establishment of the crops, soil samples were taken at 4 random points within the greenhouse to determine the initial values of soil nutrients. Later, during the development of the crop, five points were randomly selected within each treatment sector, and two samplings were carried out on different dates, one in the vegetative growth phase (99 DAT) and the other in the fruit harvesting season (171 DAT, on the date of the tenth cut). To obtain the samples, pits were made in the area of the irrigation bulb, approximately 10 cm from a dripper and between 5 and 15 cm deep after the surface sand layer was removed. Approximately 1.5 kg of soil was collected from the 5 sampling points in each sector, and the soil was divided into 3 replicates of 500 g for laboratory analysis.
Leaf sampling was carried out at 157 and 171 DAT (on the dates of the eighth and tenth fruit cuts). On each date and in each treatment, 45 fully developed leaves were randomly taken from the plants located in the central lines of each treatment sector, thus eliminating the edge effect [27]. Subsequently, they were placed in plastic bags in isothermal containers until analysis in the laboratory. The leaves were washed and dried at 65 °C to a constant weight. They were then sorted into groups of 15 and ground in a mill (Bosch TSM6A011 W, Germany) to a fine powder.
Fruit sampling was carried out approximately halfway through the harvesting season (10th cut, 171 DAT), and 18 fruits were randomly taken per treatment. Parts of different fruits were cut into pieces, and three samples of 200 g per treatment were dried at 65 °C to a constant weight and then ground into a fine powder.
Finally, the levels of nitrogen, phosphorus, and potassium in the soil, leaves, and fruits were determined using the Kjeldahl method [28], Olsen method [29], and atomic absorption [30], respectively.

2.7. Statistical Analysis

The sampling described above was established in a completely randomized block design. The results obtained were subjected to analysis of variance (ANOVA) to assess the differences between treatments. If significant differences existed, the separation of means was evaluated by a Tukey test at p ≤ 0.05. Statistical analysis was carried out using the Statgraphics Centurion 18 software.

3. Results and Discussion

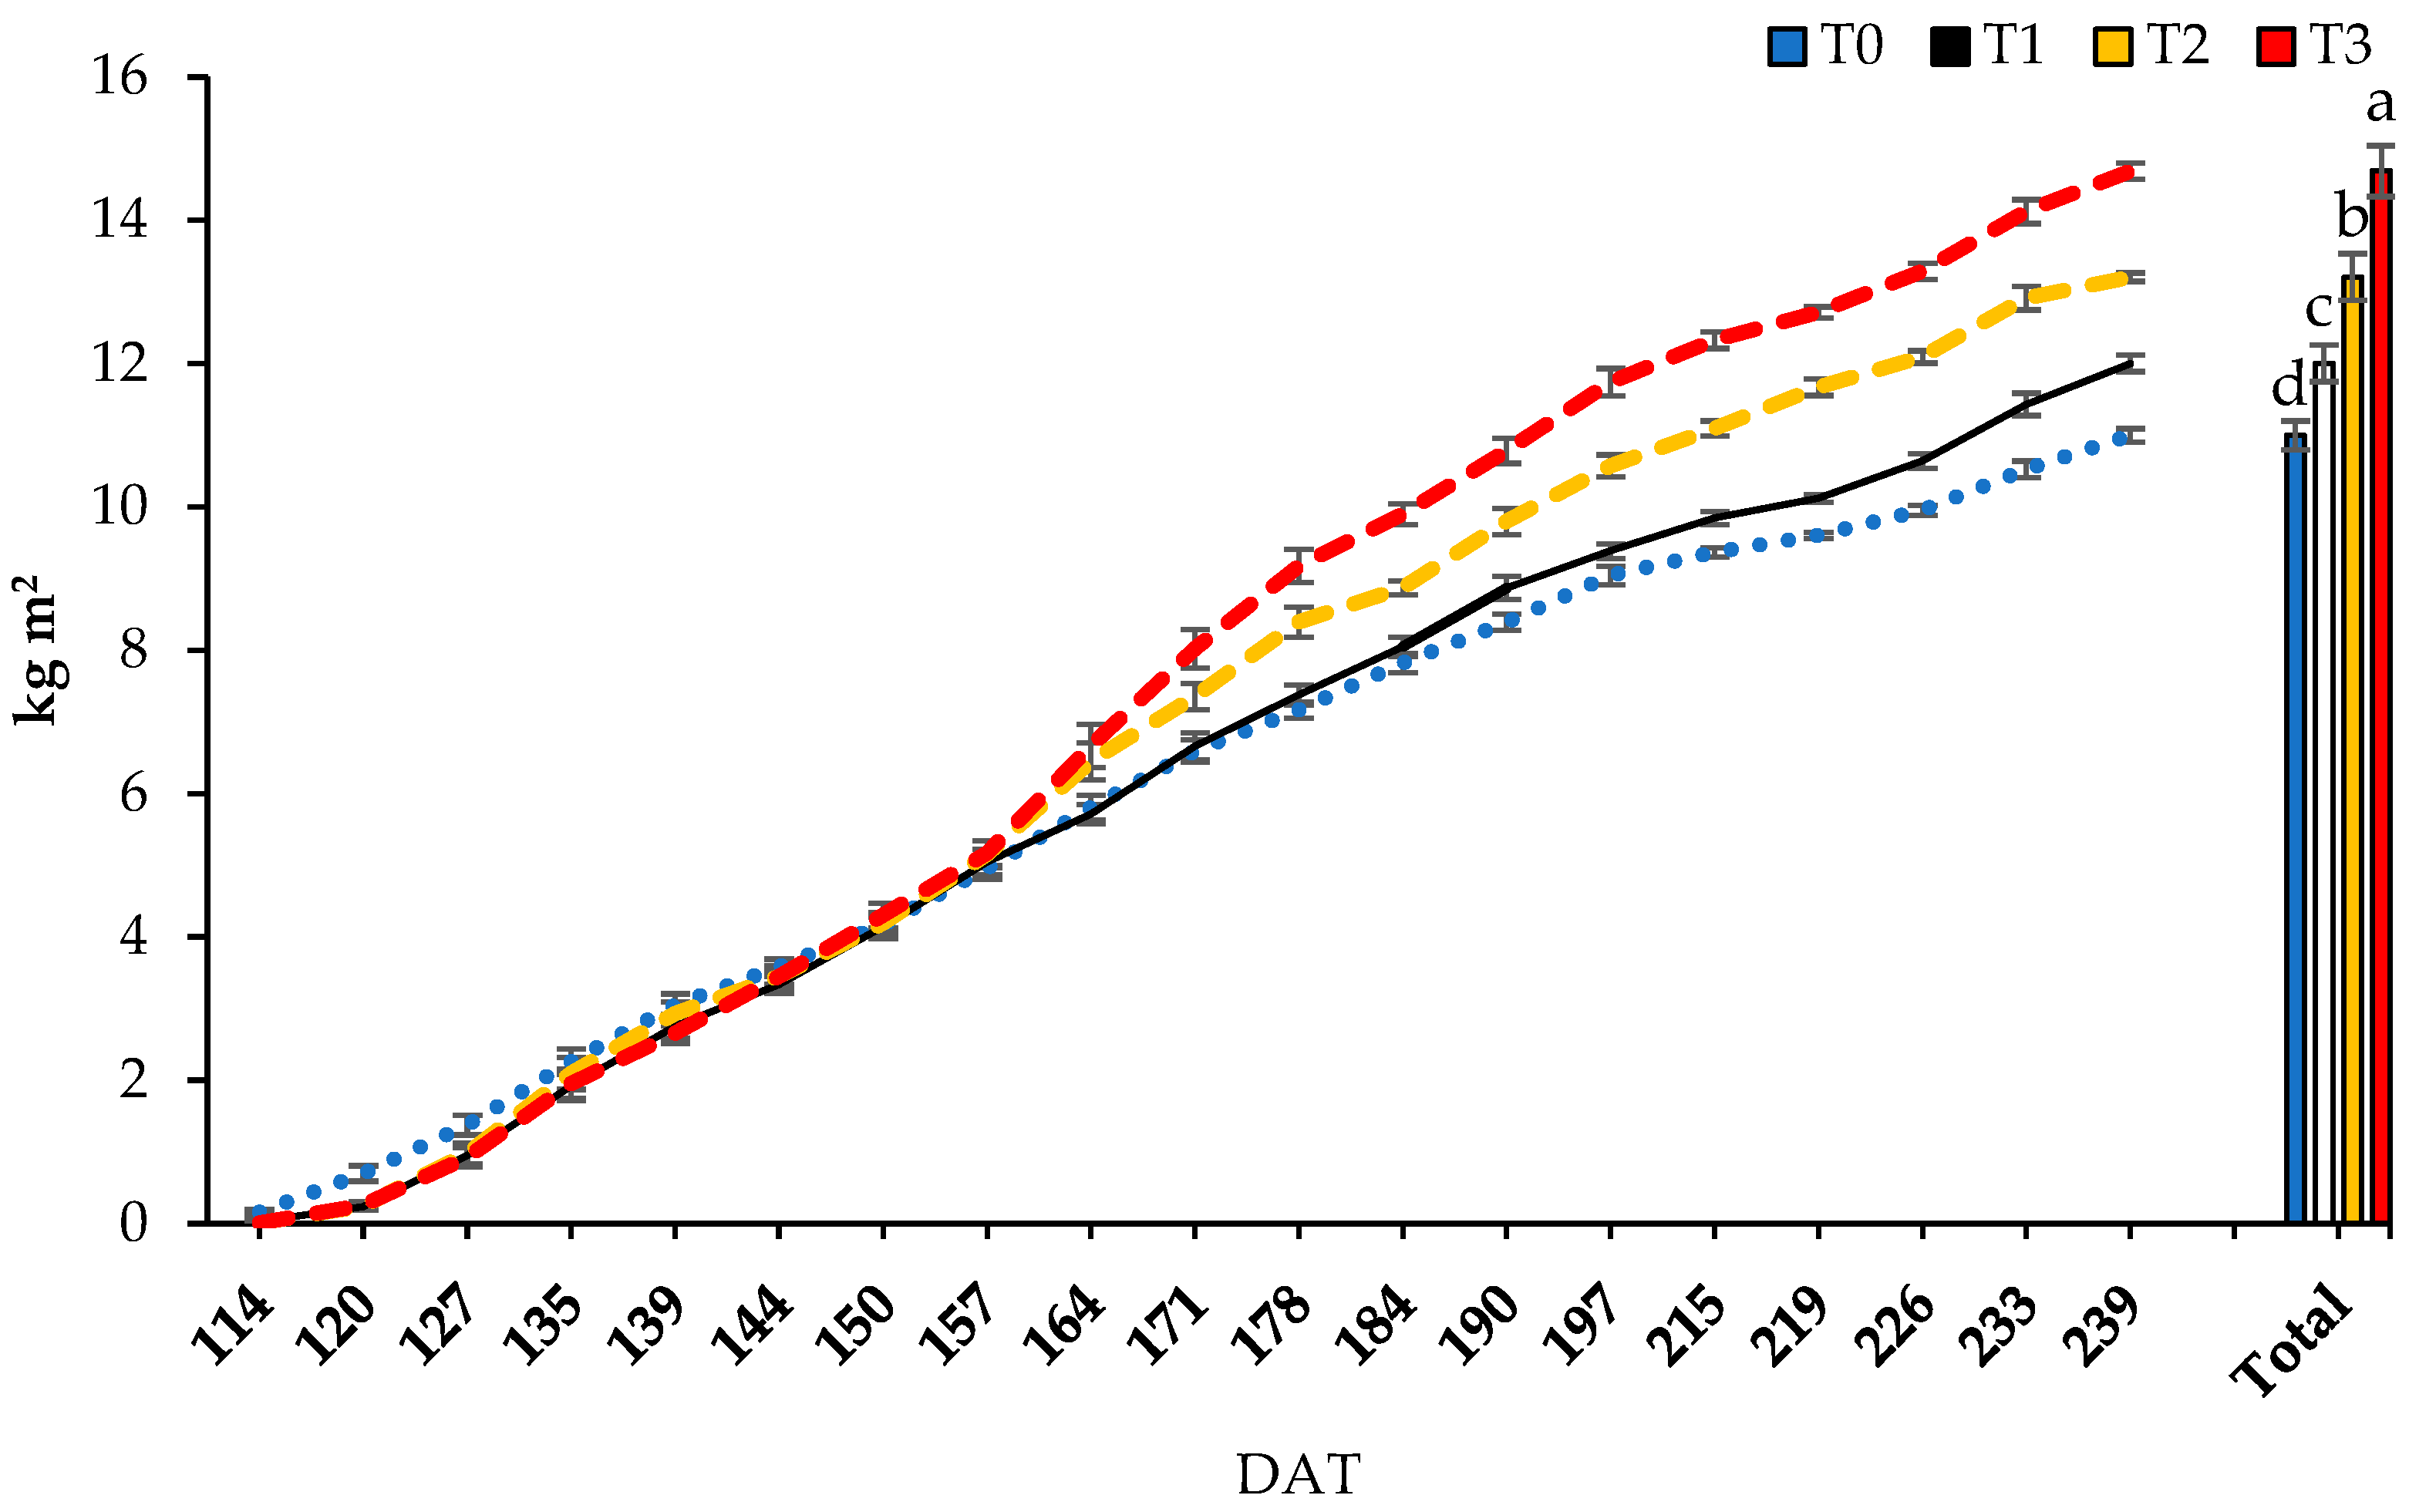
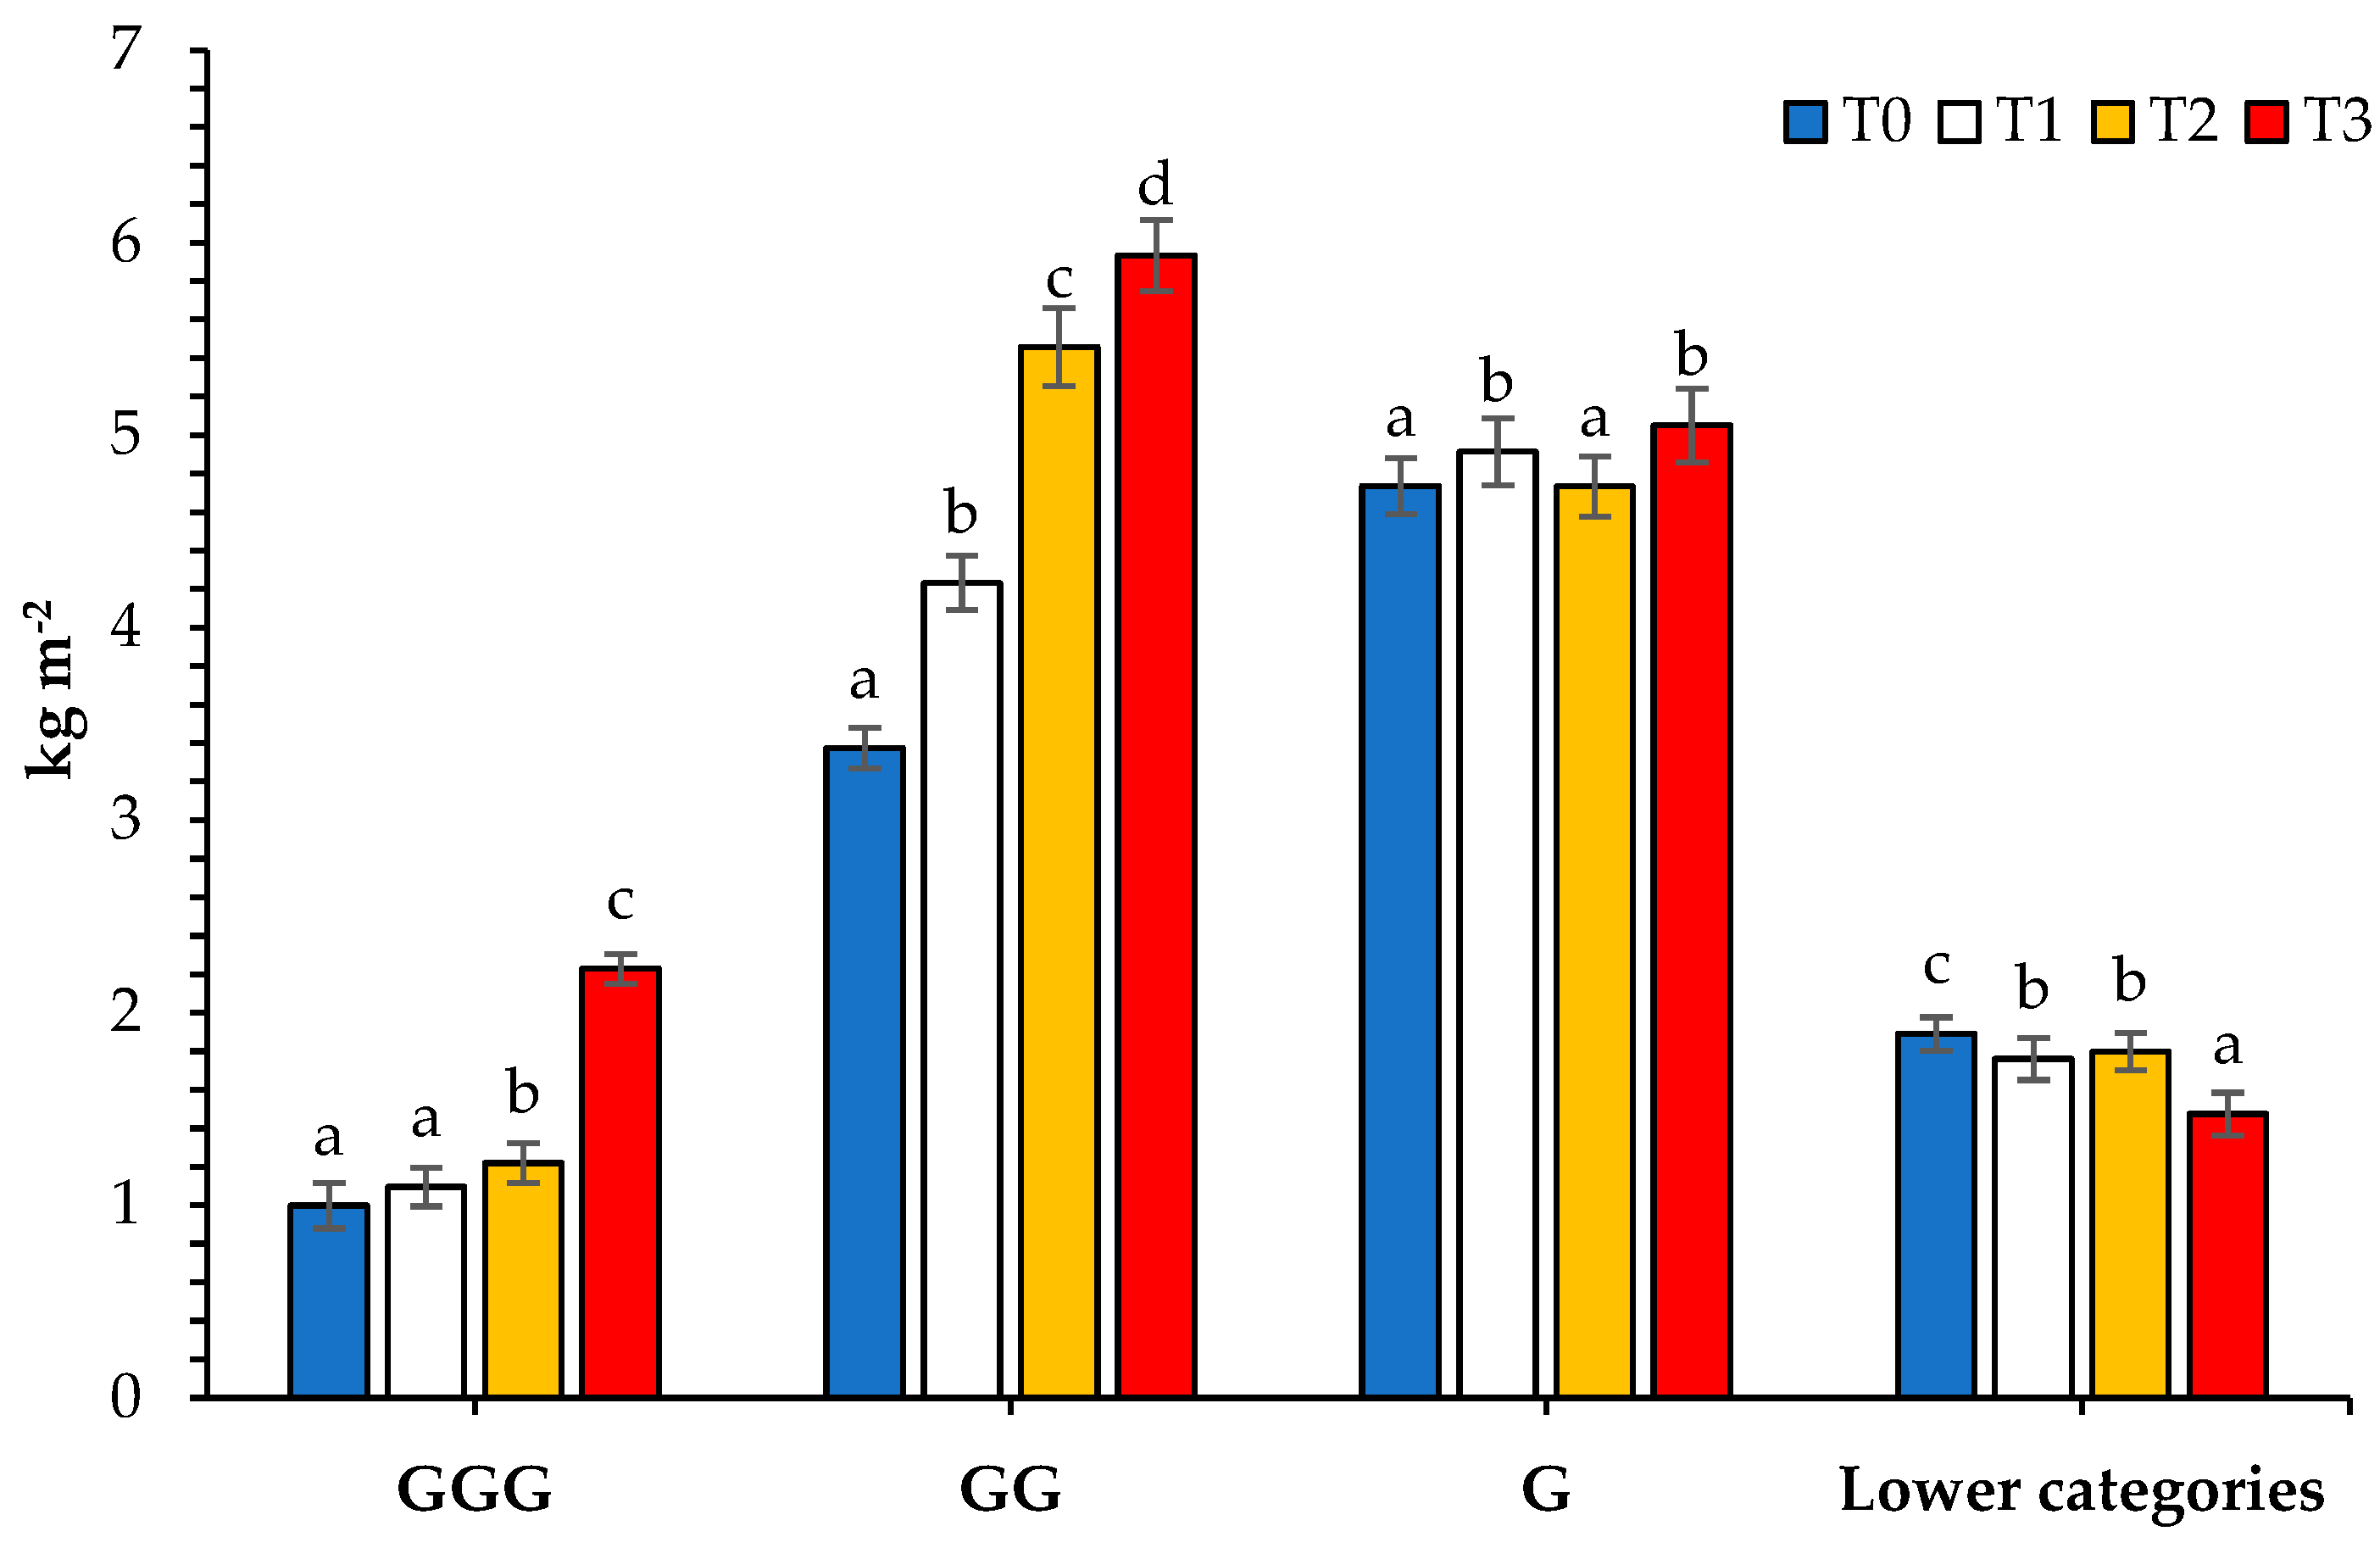
3.1. Harvest Productivity

Although the production data in all treatments were initially similar, after cut 8 (157 DAT), the recurrent treatments with biofertilizers (T2 and T3) began to stand out (Figure 2), with final accumulated production values of 13.21 kg m−2 and 14.69 kg m−2. This represented a production increase of 20 and 33%, respectively, compared to the control treatment T0 (11.00 kg m−2). The enhancing and cumulative effects of the PGPB used in this study were evident in the T1 treatment, for which a production of 12.00 kg m−2 was obtained after a single application (9% more productive than T0).
One key factor in the higher production achieved in treatments T2 and T3 was the production of higher percentages of fruits of the largest sizes (GGG and GG) (>40%, 6.68 and 8.16 kg m−2, respectively). On the other hand, in the T0 treatment, the smallest sizes (G and lower categories) represented up to 70% of the fruits, totaling 6.62 kg m−2 (Figure 3).
The average weight of the fruits by treatment and commercial category (Figure 4) did not show significant differences, except in the lower categories. However, the T3 treatment showed, on average, slightly heavier fruit weights.
The ability of selected bacteria to promote productivity has been demonstrated in previous studies [31,32,33]. Luna et al. [34] studied the influence of the application of different PGPB (Bacillus sp., Bacillus licheniformis, Bacillus amyloliquefaciens, and Gluconacetobacter diazotrophicus) on the harvest yield, the number of fruits, and the weight of the fruits in tomato, reporting increases of 52%, 13%, and 31%, respectively. The authors pointed out, as a probable cause of these increases, the stimulation of the synthesis of phytohormones (IAA, gibberellic acid, ethylene, etc.). Other authors showed that bacteria could be key in increasing the synthesis of hormones, such as auxins, cytokinins, and gibberellins [35,36,37]. In this study, it was not possible to analyze the values of phytohormones in plants, but we suspect that the bacteria used in this study could also influence the production of some of the hormones described above. This would explain the higher fruit production and larger fruit sizes.

3.2. NPK Contents in Soils, Leaves, and Fruits

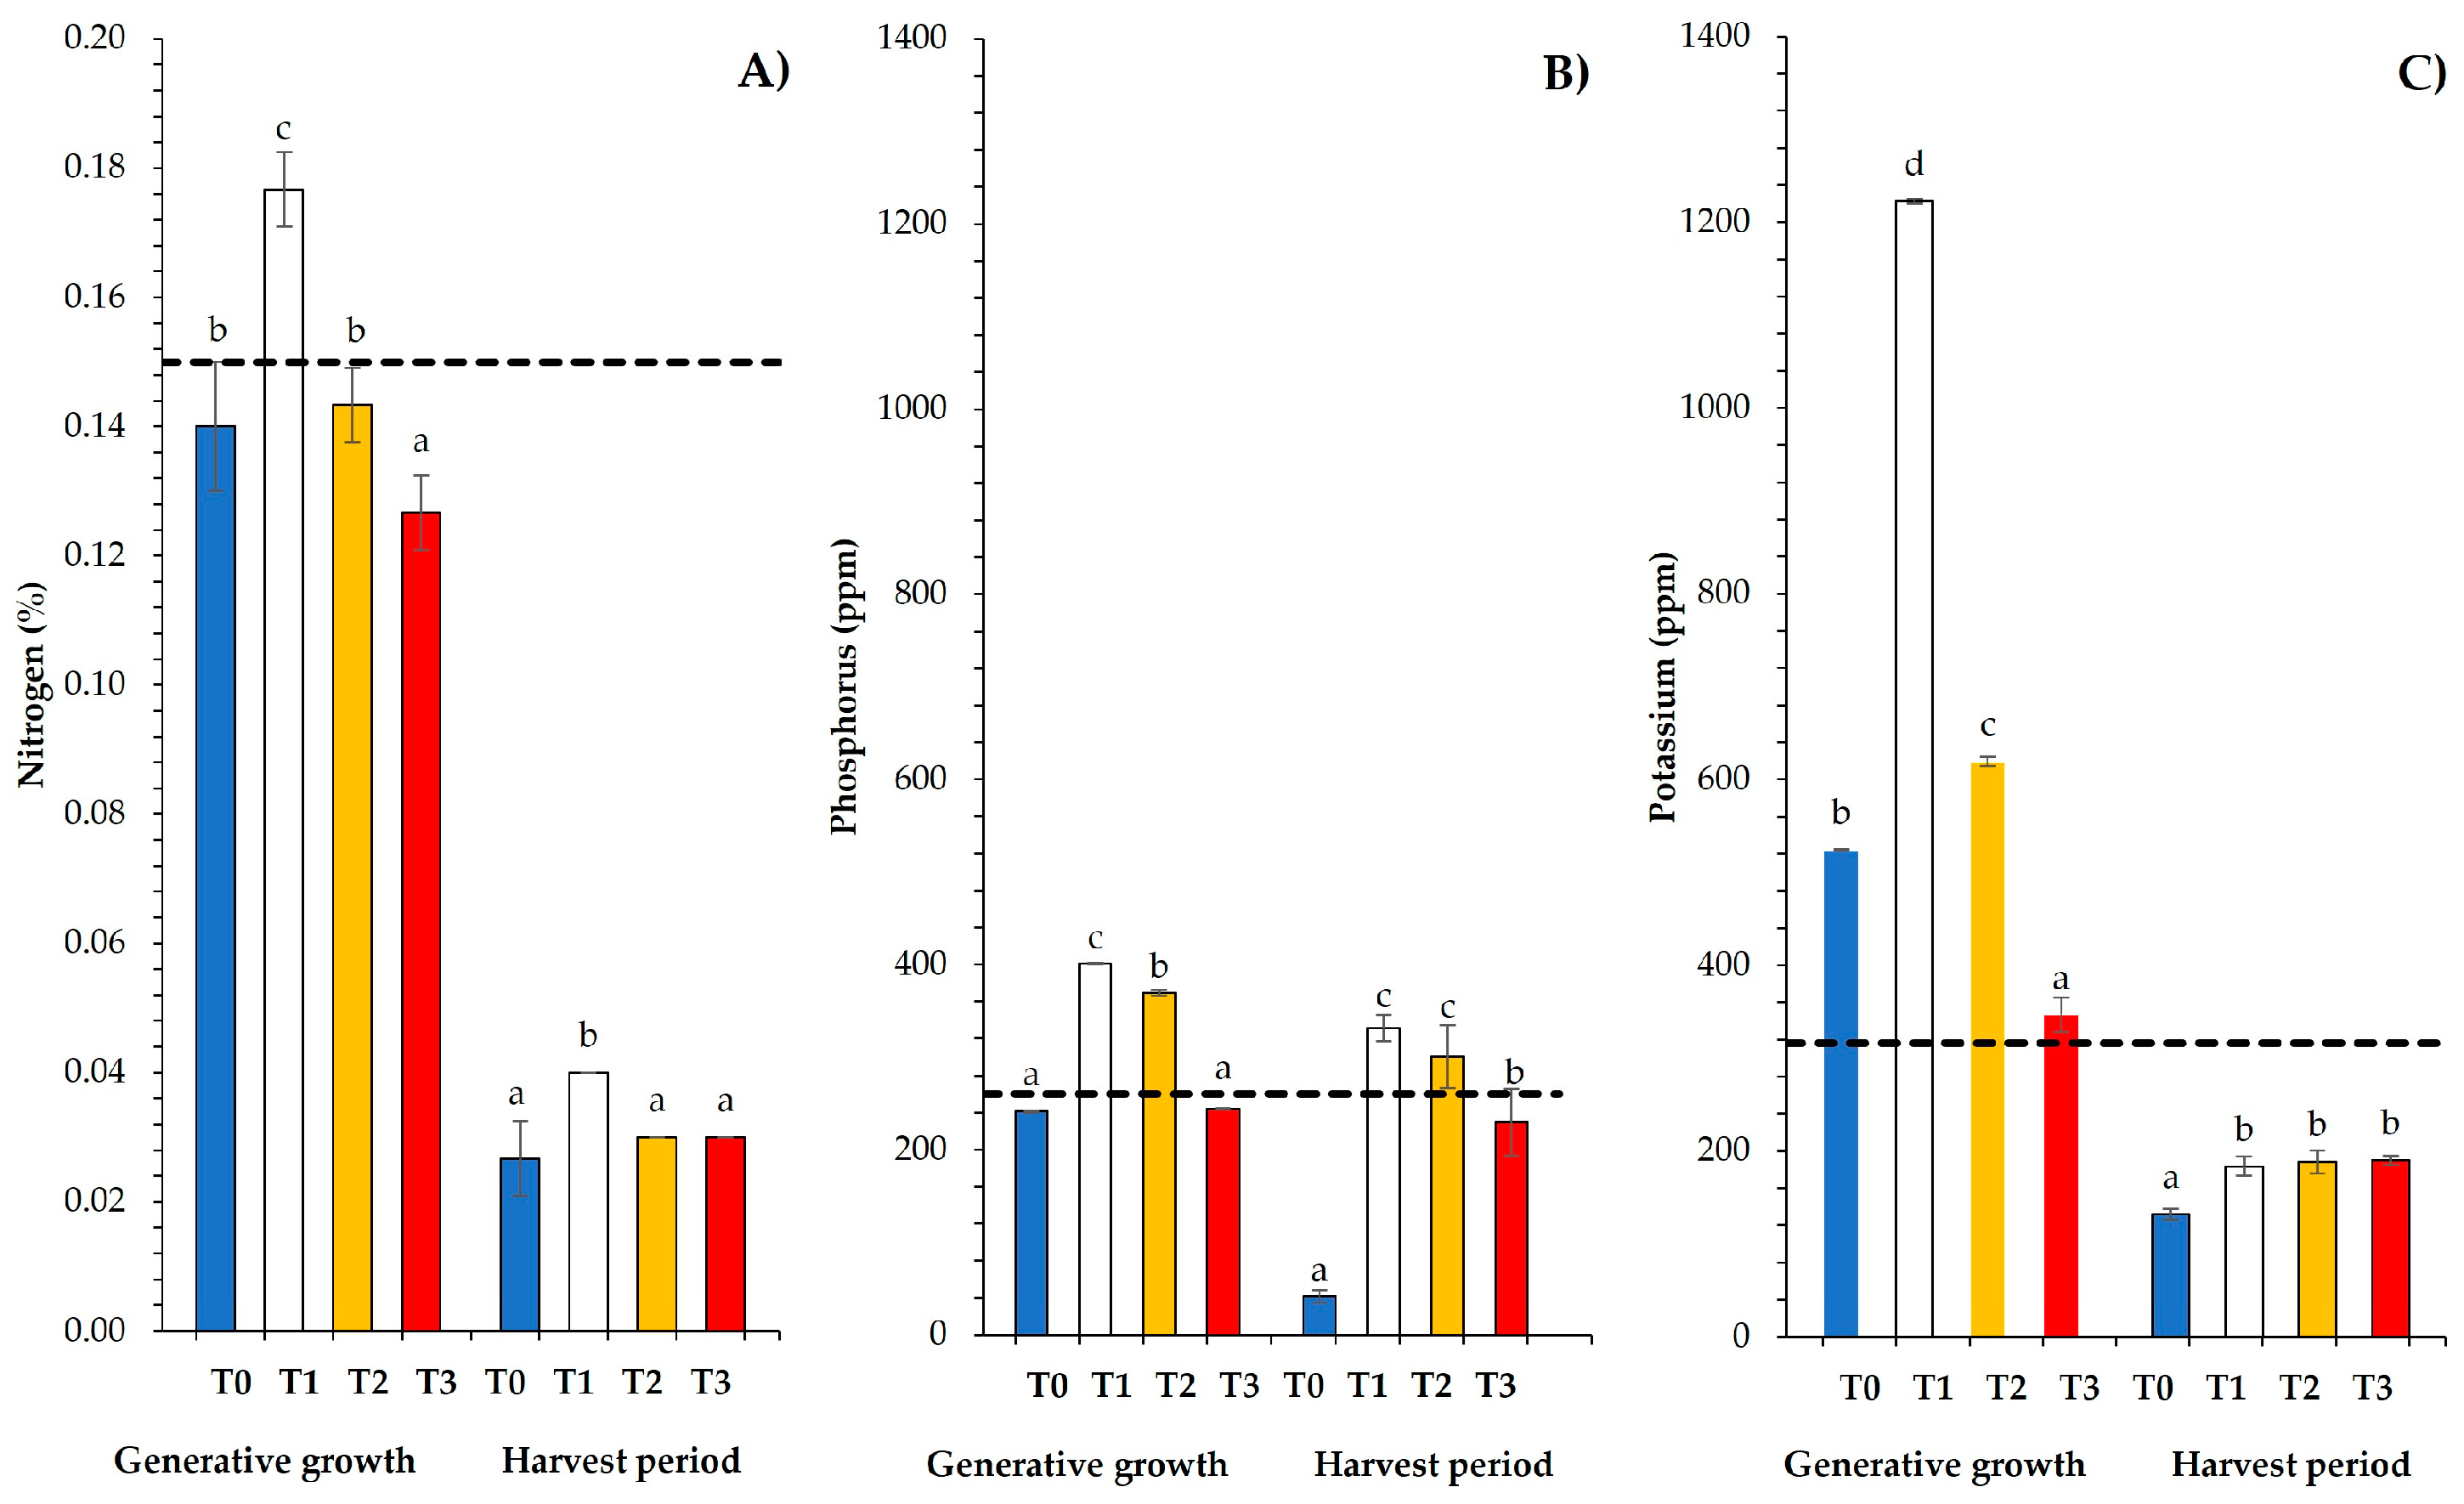
3.2.1. NPK Contents in Soils

The results of the initial soil analysis prior to the establishment of the crop reflected a moderate fertility level for N (0.15 ± 0.02%) and high fertility levels for P (260.43 ± 37.79 ppm) and K (316.25 ± 70.16 ppm), according to the ranges found in soils with similar characteristics in greenhouses of the Almería region [6,38]. Figure 5 shows the variations in the levels of soil fertility in samples taken in two crop stages (vegetative growth phase and fruit collection phase) after the application of PGPB, showing the fertilizing effect of the bacteria. In Figure 5A, the levels of total nitrogen (%) are shown. There were no relevant differences between treatments, and all showed an ostensible decrease towards the end of the crop life, probably because of a greater demand for and extraction of this nutrient in the fruit formation stage. Regarding the assimilable P in the soil (Figure 5B), in the treatments with the inoculation of bacteria, the levels of this macronutrient were maintained in the fruit harvesting stage, while in the control treatment (T0), P was clearly reduced, as occurred for N. On the other hand, K levels increased notably with respect to the initial values in all treatments in the vegetative growth phase, but they also decreased significantly in the fruit collection stage in all treatments (Figure 5C). However, the availability of K was significantly higher (p ≤ 0.05) in the treatments with bacteria than in the control treatment without biofertilizers (T0) in the fruit collection phase. Comparatively higher NPK contents were measured in the T1 treatment than in the other treatments; this may not be due to the effect of a single inoculation of the bacteria, but rather due to the fact that the soil sampling in this sector was carried out in an area of overfertilization due to a malfunction of the drippers or because it was an area where subsurface drainage accumulated.
In general, discounting the effect of previous overfertilization in the T1 treatment, the results show that the T2 treatment (periodic inoculation of PGPB and without a reduction in inorganic fertigation) was the most effective in maintaining or improving the fertility of the soils in terms of NPK nutrients. This is not surprising since the bacteria contained in the Bio K and Bio P products remobilize those inorganic fertilizers, which precipitate into non-bioavailable forms for plants after being applied by fertigation. Results similar to those presented in this work have been described by Reyes-Castillo et al. [11], who mentioned that with the inoculation of a tomato culture with endemic rhizobacteria strains (N2-fixing bacteria Pseudomonas, strain Tmt-16 and K solubilizing bacteria, strains P. gessardi, Ls-C21, P. koreensis, Ltj-62 P. brassicacearum Acinetobacter: LsC-58, and A. calcoaceticus), the levels of N and K available to plants in soil with a low level of fertility were maintained and even increased. To explain these results, the authors cited the acidifying effect of PGPB on the soil and the higher root growth promoted by the N2-fixing bacteria. Saia et al. [39] found an increase in the availability of P (over 300%) and a significant improvement in the growth and accumulation of biomass in tomato and corn plants when using different consortiums of PGPB (Micrococcus, Pantoea, and Pseudomonas) and a low-solubility P fertilizer (Gafsa rock phosphate). These results demonstrate the strong capacity of PGPB to solubilize P from recalcitrant sources, probably due to the greater release of organic acids, such as gluconic and acetic acids and citric and 2-ketogluconic acids. On the other hand, Mehta et al. [10] reported a significant increase in NPK levels in the soil, with increases greater than 95% for N, 30% for P, and 60% for K with B. circulans CB7 inoculation. They explained the increase in N by the capacity of the CB7 strain to fix N based on its nitrogenase activity and the increase in the availability of phosphorus by the decrease in soil pH due to the production of organic acids by said bacteria.

3.2.2. NPK Contents in Leaves

The analysis of NPK contents in leaves is also very useful for understanding the nutritional status of plants. Regarding the levels of N and K, significantly lower values were observed in treatment T3 (probably due to the 20% reduction in EC from fertigation) than in the other treatments, between which there were no significant differences (Table 3). For all treatments, the contents were within the range sufficient for plants [36,38]. Likewise, the N values were slightly higher than those published by Reyes-Castillo et al. [11] for tomato plants. These researchers found the highest N content (>2.6%) in plant tissue when using N2-fixing bacteria (Pseudomonas as the Tmt-16 strain). On the other hand, the PGPB used in this study did show a good capacity for the mobilization and absorption of P by plants, increasing P by 46% on average in the treatments with the inoculation of bacteria (T1, T2, and T3) compared to the control (T0).
Kalozoumis et al. [12] evaluated the effect of a consortium of microorganisms (Enterobacter sp.; Paenibacillus sp.; Enterobacter mori.; and Lelliottia sp.) against stress induced by a 50% reduction in water and nutrients (N and P) in a greenhouse tomato cultivation. The results showed a general decrease in the levels of NPK in the leaves; nevertheless, the treatments with bacteria were able to maintain the levels of N and P absorption due to the biosynthesis of metabolic compounds in response to induced stress. Mehta et al. [10] also found a significant increase in absorption and nutrient content (NPK, 0.76, 0.44, and 2.87%, respectively) in tomato plants inoculated with Bacillus circulans CB7.

3.2.3. NPK Contents in Fruits

The NPK contents in fruits did not show clear differences among treatments when expressed in the percentage of dry weight (Table 3). However, it was possible to calculate the amounts of macronutrients NPK extracted from the soils by the fruits (gm−2) (Table 4) when combining the previous data with the production (kg m−2) and liquid contents (%). Referring to the absorption values against the control treatment (T0), the treatment with the recurrent inoculation of bacteria and a 20% reduction in fertigation (T3) resulted in a greater extraction of all nutrients (16%, 34%, and 23% for N, P, and K, respectively). In the other treatments with bacterial inoculations, positive increases were also observed with respect to T0 for P and K, although the result was not as marked as that for T3. However, for N, the T2 and T1 treatments did not improve the extractions compared to T0 (Table 4).
In other studies, increases in these macronutrients have also been found in fruits. Ordookhani et al. [40] showed a significant improvement in the K content in tomato fruits (4.1%) when the plants were inoculated with PGPB and arbuscular mycorrhizae (AMF). Zhao et al. [41] also found that the application of microorganisms (Bacillus megaterium and Bacillus mucilaginous) increased the levels of P and K in fruits. They attributed this improvement in the absorption of nutrients to different mechanisms of bacteria, such as the production of phytohormones, organic acids, and enzymes.

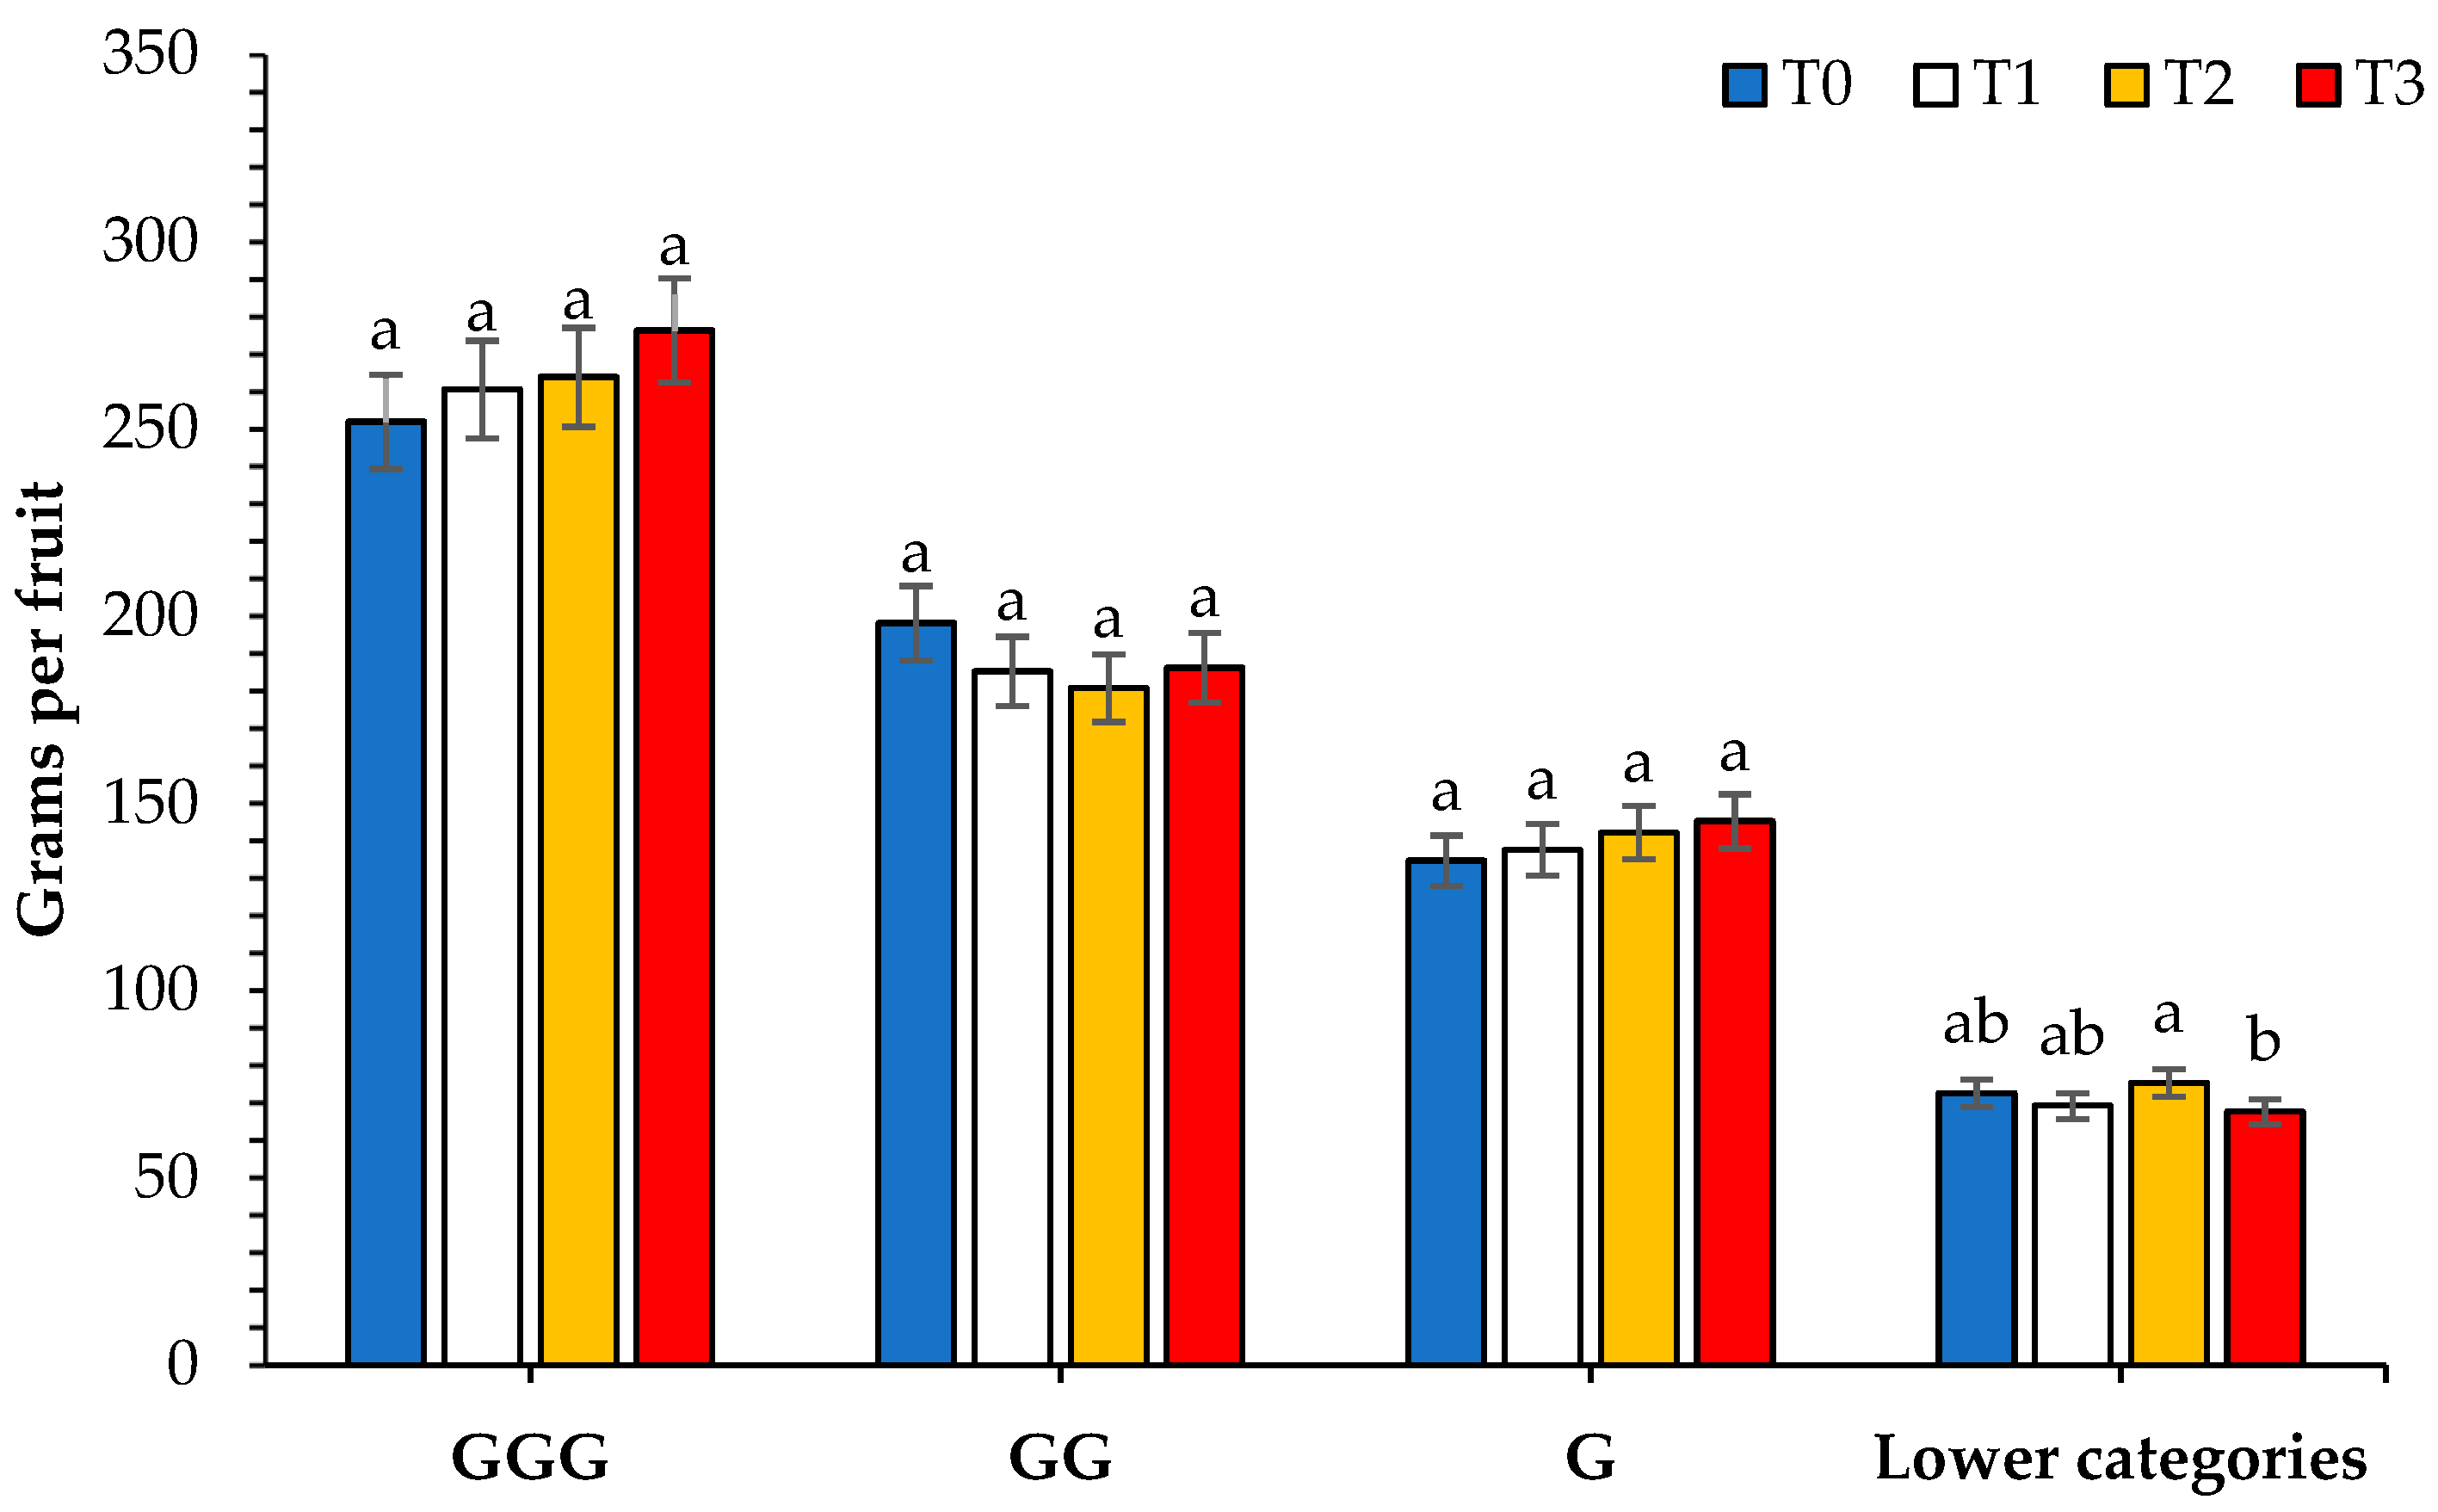
3.3. Quality Parameters in Fruits

There were no significant differences in the quality parameters of the fruits studied, except for pH and EC (Table 5), with the values of these parameters decreasing in the order of the treatments from T0 to T3. The reason for this result is that the average size of the fruits also increased according to this treatment order; therefore, the content of liquids was higher, and the proportions of components that influenced the pH and conductivity were diluted.
However, other authors did find significantly positive influences of PGPB on parameters such as °Brix, pectin methyleneterase activity, polygalacturonase activity, antioxidant activity, lycopene content, percentage citric acid, and firmness [31,32,33].

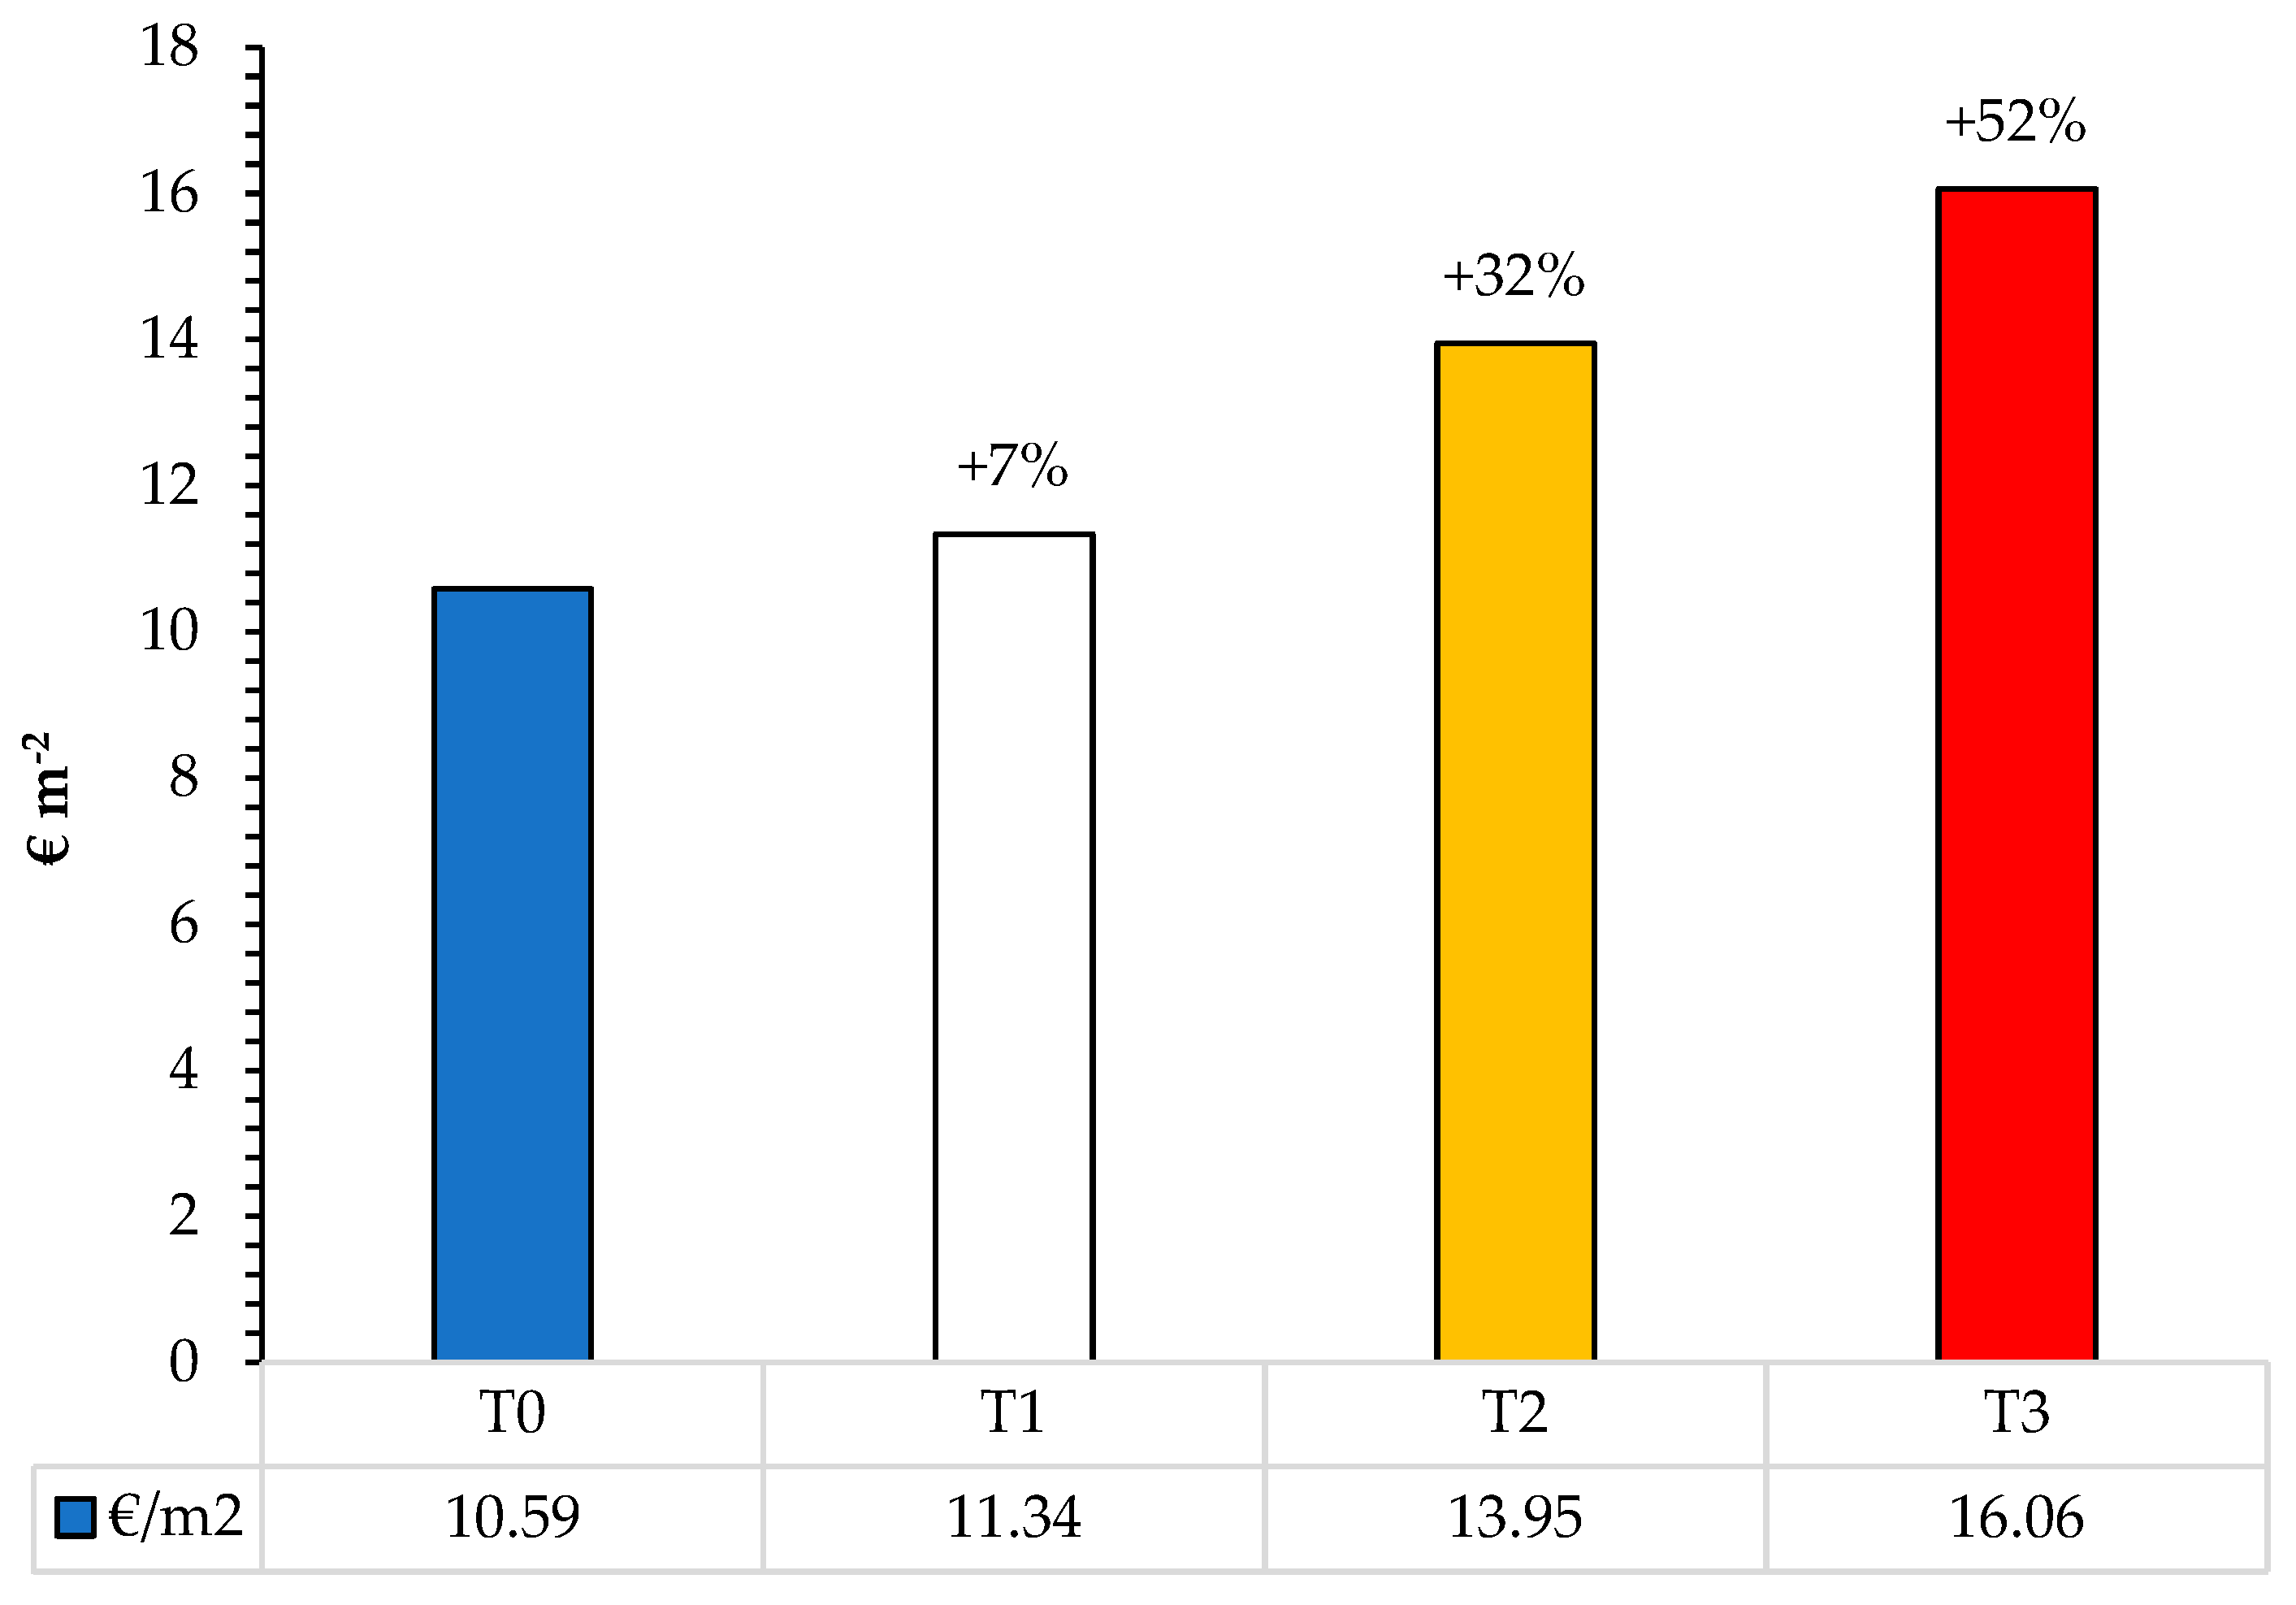
3.4. Economic Performance

The fact that the treatments with recurrent applications of bacteria favored the development of larger fruits with better sale prices resulted in higher economic yields for the farmer. Thus, while the T2 treatment yielded an increase of 22% in terms of production compared to the control treatment (T0), there was a 32% increase in terms of economic income compared to that in T0. More prominent was the difference for the T3 treatment, going from a 32% increase in production to a 52% increase in income (Figure 6). These results highlight that the application of commercial products based on microorganisms presents advantages not only from the environmental point of view, but also from the economic point of view, suggesting that they are especially profitable. In fact, it must also be considered that in the T3 treatment, there was also a reduction in costs due to the savings in inorganic fertilizers, and according to communications from the farmer and the company supplying the commercial formulations, the savings in inorganic fertilizers were similar to the costs of the Bio N, Bio P, and Bio K products used in the experiment. Thus, the 52% increase in income in the T3 treatment can be considered a net benefit for the farmer.

4. Conclusions

The use of biofertilizers represents a more ecofriendly management of crops, as their use can favor the reduction of inorganic fertilizers, which is demanded by international environmental policies (e.g., European Green deal, Agenda 2030). In this study, the use of PGPB was profitable in terms of fruit production and economic income in a highly intensified commercial tomato crop under greenhouse conditions. The results also showed that the reduction in conventional fertilization is key to maximizing the activity of biofertilizers, as plants form stronger associations with soil microorganisms when there is a deficit of nutrients. Almería Province (Southeast Spain) accounts for 35,000 ha of greenhouses, mainly devoted to intensive horticulture production. This represents an important potential market for the use of biofertilizers, which has resulted in the appearance of biotechnological companies that are continuously developing new products based on microorganisms and organic fertilizers. The possibilities for developing new biofertilizer products are extremely high; however, it is necessary to test them under real crop conditions and using a scientific approach. This study supports this point of view and points out interesting results in terms of soil fertility, plant nutritional status, and tomato fruit production when using PGPB and reducing inorganic fertilizers.

Author Contributions

Conceptualization, R.O.P., V.M.G.-C. and F.D.M.; methodology, R.O.P., J.C.N.G., V.M.G.-C. and F.D.M.; investigation, R.O.P., J.C.N.G. and V.M.G.-C.; writing—original draft preparation, R.O.P., J.C.N.G. and V.M.G.-C.; review, M.Á.D.R., M.S.H., C.N., I.M.M. and F.D.M. All authors have read and agreed to the published version of the manuscript.

Funding

This work was funded by the following research projects: UAL-TRANSFIERE project TRFE-I-2019/011, Field4ever, H2020 European Union Grant agreement No 947084. EVOCLIMED-RNM-A2063 UAL/CTEICU/FEDER). BIOQUALIREST-PID2021-127591OB-100, funded by MCIN/AEI/10.13039/501100011033/FEDER, UE, CLIMARESTOR—TED2021-132687B-I00/AEI/10.13039/501100011033/Unión Europea NextGenerationEU/PRTR.

Institutional Review Board Statement

Not applicable.

Informed Consent Statement

Not applicable.

Data Availability Statement

Not applicable.

Acknowledgments

This work was funded by the following research projects: UAL-TRANSFIERE project TRFE-I-2019/011, Field4ever, H2020 European Union Grant agreement No 947084. EVOCLIMED-RNM-A2063 UAL/CTEICU/FEDER). BIOQUALIREST-PID2021-127591OB-100, funded by MCIN/AEI/10.13039/501100011033/FEDER, UE, CLIMARESTOR—TED2021-132687B-I00/AEI/10.13039/501100011033/Unión Europea NextGenerationEU/PRTR. Raúl Ortega is grateful for his HIPATIA postdoctoral contract (UAL), and Isabel Miralles is grateful for her Ramón y Cajal postdoctoral grant (RYC-2016-21191). The authors want to thank Nostoc Biotechnologies S.L for providing the biofertilizers, CASI cooperative and Miguel Ángel Vargas for providing the greenhouse facilities where the experiments were carried out, and Luis Teruelo for his assistance during data collection. Victor M. Gallegos-Cedillo and Fernando Diánez are grateful for the aid granted for the transfer of research oriented to the strategic sectors of the province of Almeria (UAL-TRANSFIERE project TRFE-I-2019/011). Victor M. Gallegos-Cedillo and Cinthia Nájera would like to thank the University of Almería for awarding them the Margarita Salas grant to upgrade the Spanish University System, funded by Ministerio de Universidades and by the “European Union NextGenerationEU/PRTR”.

Conflicts of Interest

The authors declare no conflict of interest.

References

  1. Jiménez-Díaz, J.F. Procesos de desarrollo en el poniente almeriense: Agricultores e inmigrados. Rev. Estud. Reg. 2011, 90, 179–206. [Google Scholar]
  2. FAOSTAT. Available online: https://www.fao.org/faostat/en/#data/QCL/visualize (accessed on 23 March 2023).
  3. INE. Instituto Nacional de Estadística. Available online: https://www.ine.es/dyngs/INEbase/es/categoria.htm?c=Estadistica_P&cid=1254735727106 (accessed on 23 March 2023).
  4. Cajamar. Análisis de la Campaña Hortofrutícola de Almería Campaña 2021–2022; Cajamar Caja Rural: Almería, Spain, 2022; pp. 1–101. [Google Scholar]
  5. García Lorca, A. Tendencias y transformaciones en la agricultura intensiva almeriense. Nimbus 1999, 4, 109–128. [Google Scholar]
  6. Ramos Miras, J.J.; Gil de Carrasco, C.; Boluda-Hernández, R. Estudio da las características de los antrosoles cumílicos de los invernaderos de la comarca del poniente almeriense. Influencia de las prácticas agrícolas sobre los cambios de sus propiedades. Edafología 2002, 9, 129–142. [Google Scholar]
  7. van Rijswick, C. World Vegetable Map 2018. Available online: https://research.rabobank.com/far/en/sectors/regional-food-agri/world_vegetable_map_2018.html (accessed on 24 March 2023).
  8. Aguado Santacruz, G.A.; Moreno Gómez, B. Biofertilizantes bacterianos desarrollados por el INIFAP. In Introducción al Uso y Manejo de los Miofertilizantes en la Agricultura; Aguado Santacruz, G.A., Ed.; Instituto Nacional de Investigaciones Forestales, Agrícolas y Pecuarias (INIFAP): Celaya, Guanajuato, Mexico, 2012; pp. 151–170. [Google Scholar]
  9. Murphy, J.F.; Reddy, M.S.; Ryu, C.-M.; Kloepper, J.W.; Li, R. Rhizobacteria-mediated growth gromotion of tomato leads to protection against Cucumber Mosaic Virus. Phytopathology 2003, 93, 1301–1307. [Google Scholar] [CrossRef]
  10. Mehta, P.; Walia, A.; Kulshrestha, S.; Chauhan, A.; Shirkot, C.K. Efficiency of plant growth-promoting P-solubilizing Bacillus circulans CB7 for enhancement of tomato growth under net house conditions. J. Basic Microbiol. 2015, 55, 33–44. [Google Scholar] [CrossRef] [PubMed]
  11. Reyes-Castillo, A.; Gerding, M.; Oyarzúa, P.; Zagal, E.; Gerding, J.; Fischer, S. Plant growth-promoting rhizobacteria able to improve NPK availability: Selection, identification and effects on tomato growth. Chil. J. Agric. Res. 2019, 79, 473–485. [Google Scholar] [CrossRef]
  12. Kalozoumis, P.; Savvas, D.; Aliferis, K.; Ntatsi, G.; Marakis, G.; Simou, E.; Tampakaki, A.; Karapanos, I. Impact of plant growth-promoting rhizobacteria inoculation and grafting on tolerance of tomato to combined water and nutrient stress assessed via metabolomics analysis. Front. Plant Sci. 2021, 12, 670236. [Google Scholar] [CrossRef]
  13. Calvo García, S. Bacterias simbióticas fijadoras de nitrógeno. Cuad. Tomás 2011, 3, 173–186. [Google Scholar]
  14. Corrales Ramírez, L.C.; Arévalo Galvez, Z.Y.; Moreno Burbano, V.E. Solubilización de fosfatos: Una función microbiana importante en el desarrollo vegetal. Nova 2014, 12, 68–79. [Google Scholar] [CrossRef]
  15. Florez Jalixto, M.A.; Roldán Acero, D.J.; Juscamaita Morales, J.G. Phytotoxicity and characterization of a liquid fertilizer produced by lactic acid fermentation using rainbow trout by-products (Oncorhynchus mykiss). Ecol. Apl. 2020, 19, 121–131. [Google Scholar] [CrossRef]
  16. Rouphael, Y.; Colla, G. Toward a sustainable agriculture through plant biostimulants: From experimental data to practical applications. Agronomy 2020, 10, 1461. [Google Scholar] [CrossRef]
  17. Gashash, E.A.; Osman, N.A.; Alsahli, A.A.; Hewait, H.M.; Ashmawi, A.E.; Alshallash, K.S.; El-Taher, A.M.; Azab, E.S.; Abd El-Raouf, H.S.; Ibrahim, M.F.M. Effects of plant-growth-promoting rhizobacteria (PGPR) and cyanobacteria on botanical characteristics of tomato (Solanum lycopersicon L.) plants. Plants 2022, 11, 2732. [Google Scholar] [CrossRef]
  18. De Pascale, S.; Rouphael, Y.; Colla, G. Plant biostimulants: Innovative tool for enhancing plant nutrition in organic farming. Eur. J. Hortic. Sci. 2018, 82, 277–285. [Google Scholar] [CrossRef]
  19. Shao, J.; Xu, Z.; Zhang, N.; Shen, Q.; Zhang, R. Contribution of indole-3-acetic acid in the plant growth promotion by the rhizospheric Strain Bacillus amyloliquefaciens SQR9. Biol. Fertil. Soils 2015, 51, 321–330. [Google Scholar] [CrossRef]
  20. De Jong, M.; Mariani, C.; Vriezen, W.H. The role of auxin and gibberellin in tomato fruit set. J. Exp. Bot. 2009, 60, 1523–1532. [Google Scholar] [CrossRef]
  21. Bona, E.; Todeschini, V.; Cantamessa, S.; Cesaro, P.; Copetta, A.; Lingua, G.; Gamalero, E.; Berta, G.; Massa, N. Combined bacterial and mycorrhizal inocula improve tomato quality at reduced fertilization. Sci. Hortic. 2018, 234, 160–165. [Google Scholar] [CrossRef]
  22. García-García, M.C.; Céspedes, A.J.; Lorenzo, P.; Pérez-Parra, P.P.; Escudero, M.C.; Sánchez-Guerrero, M.C.; Medrano, E.; Baeza, E.; López, J.C.; Magán, J.J.; et al. El Sistema de Producción Hortícola de la Provincia de Almería, 1st ed.; IFAPA (Instituto de Formación Agraria y Pesquera de Andalucía): Huelva, Spain, 2016; pp. 1–179. [Google Scholar]
  23. Sumbul, A.; Ansari, R.A.; Rizvi, R.; Mahmood, I. Azotobacter. A potential bio-fertilizer for soil and plant health management. Saudi J. Biol. Sci. 2020, 27, 3634–3640. [Google Scholar] [CrossRef] [PubMed]
  24. Kasa, P.; Modugapalem, H.; Battini, K. Isolation, screening, and molecular characterization of plant growth promoting rhizobacteria isolates of Azotobacter and Trichoderma and their beneficial activities. J. Nat. Sci. Biol. Med. 2015, 6, 360–363. [Google Scholar] [CrossRef]
  25. FAO; WHO. Codex Standard for Tomatoes CODEX STAN 293-2008. Available online: https://www.fao.org/fao-who-codexalimentarius/codex-texts/list-standards/en/ (accessed on 24 March 2023).
  26. Nájera, C.; Guil-Guerrero, J.L.; Enríquez, L.J.; Álvaro, J.E.; Urrestarazu, M. LED-enhanced dietary and organoleptic qualities in postharvest tomato fruit. Postharvest Biol. Technol. 2018, 145, 151–156. [Google Scholar] [CrossRef]
  27. Hochmuth, G.; Hochmuth, R. Plant petiole sap-testing for vegetable crops: CV004/CIR1144, Rev. 5/2022. EDIS 2022, 2022, 1–6. [Google Scholar] [CrossRef]
  28. Kjeldahl, J. Neue Methode zur bestimmung des stickstoffs in organischen körpern. Z. Anal. Chem. 1883, 22, 366–382. [Google Scholar] [CrossRef]
  29. Olsen, S.R.; Cole, C.V.; Watanabe, F.S.; Dean, L.A. Estimation of Available Phosphorus in Soils by Extraction with Sodium Bicarbonate; United States Department of Agriculture: Washington, DC, USA, 1954; pp. 1–19.
  30. Soil Survey Staff. Soil Survey Laboratory Methods Manual. Soil Survey Laboratory Investigations Report No. 42, USDA-NRCS; National Soil Survey Center: Lincoln, NE, USA, 2004.
  31. González Rodríguez, G.; Espinosa Palomeque, B.; Cano Ríos, P.; Moreno Reséndez, A.; Leos Escobedo, L.; Sánchez Galván, H.; Sáenz Mata, J.; González Rodríguez, G.; Espinosa Palomeque, B.; Cano Ríos, P.; et al. Influencia de rizobacterias en la producción y calidad nutracéutica de tomate bajo condiciones de invernadero. Rev. Mex. Cienc. Agric. 2018, 9, 367–379. [Google Scholar] [CrossRef]
  32. Katsenios, N.; Andreou, V.; Sparangis, P.; Djordjevic, N.; Giannoglou, M.; Chanioti, S.; Stergiou, P.; Xanthou, M.-Z.; Kakabouki, I.; Vlachakis, D.; et al. Evaluation of plant growth promoting bacteria strains on growth, yield and quality of industrial tomato. Microorganisms 2021, 9, 2099. [Google Scholar] [CrossRef] [PubMed]
  33. Ruiz-Cisneros, M.F.; Ornelas-Paz, J.J.; Olivas-Orozco, G.I.; Acosta-Muñiz, C.H.; Sepúlveda-Ahumada, D.R.; Zamudio-Flores, P.B.; Berlanga-Reyes, D.I.; Salas-Marina, M.A.; Cambero-Campos, O.J.; Rios-Velasco, C. Efecto de cepas de Bacillus solas y en interacción con hongos fitopatógenos sobre el crecimiento vegetal y calidad del fruto de jitomate. Rev. Bio Cienc. 2019, 6, 17. [Google Scholar] [CrossRef]
  34. Luna, M.F.; Aprea, J.; Crespo, J.M.; Boiardi, J.L. Colonization and yield promotion of tomato by Gluconacetobacter diazotrophicus. Appl. Soil Ecol. 2012, 61, 225–229. [Google Scholar] [CrossRef]
  35. Hernández-Montiel, L.G.; Chiquito Contreras, C.J.; Murillo Amador, B.; Vidal Hernández, L.; Quiñones Aguilar, E.E.; Chiquito Contreras, R.G. Efficiency of two inoculation methods of Pseudomonas putida on growth and yield of tomato plants. J. Soil Sci. Plant Nutr. 2017, 17, 1003–1012. [Google Scholar] [CrossRef]
  36. Espinosa Palomeque, B.; Moreno Reséndez, A.; Cano Ríos, P.; de Álvarez Reyna, V.P.; Sáenz Mata, J.; Galván, H.; González Rodríguez, G. Inoculación de rizobacterias promotoras del crecimiento vegetal en tomate (Solanum lycopersicum L.) cv. Afrodita en invernadero. Tierra Latinoam. 2017, 35, 169–178. [Google Scholar] [CrossRef]
  37. Aini, N.; Dwi Yamika, W.S.; Wahidah Pahlevi, R. The Effect of nutrient concentration and inoculation of PGPR and AMF on the yield and fruit quality of hydroponic cherry tomatoes (Lycopersicum esculentum Mill. var. Cerasiforme). J. Appl. Hortic. 2019, 21, 116–122. [Google Scholar] [CrossRef]
  38. Fernández Fernández, M.M.; Aguilar Pérez, M.I.; Carrique Pérez, J.R.; Tortosa Domingo, J.; García García, C.; López Rodríguez, M.; Pérez Morales, J.M. Suelo y Medio Ambiente en Invernaderos, 5th ed.; Junta de Andalucía, Consejería de Agricultura, Pesca y Desarrollo Rural: Sevilla, España, 2014; pp. 1–135. [Google Scholar]
  39. Saia, S.; Aissa, E.; Luziatelli, F.; Ruzzi, M.; Colla, G.; Ficca, A.G.; Cardarelli, M.; Rouphael, Y. Growth-promoting bacteria and arbuscular mycorrhizal fungi differentially benefit tomato and corn depending upon the supplied form of phosphorus. Mycorrhiza 2020, 30, 133–147. [Google Scholar] [CrossRef]
  40. Ordookhani, K.; Khavazi, K.; Moezzi, A.; Rejali, F. Influence of PGPR and AMF on antioxidant activity, lycopene and potassium contents in tomato. Afr. J. Agric. Res. 2010, 5, 1108–1116. [Google Scholar]
  41. Zhao, Y.; Zhang, M.; Yang, W.; Di, H.J.; Ma, L.; Liu, W.; Li, B. Effects of microbial inoculants on phosphorus and potassium availability, bacterial community composition, and chili pepper growth in a calcareous soil: A greenhouse study. J. Soils Sediments 2019, 19, 3597–3607. [Google Scholar] [CrossRef]
Figure 1. Sand cultivation system used in the trial and typical of intensive agriculture in Almería (Spain).
Agronomy 13 02286 g001
Figure 2. Evolution of the cumulative and total production of tomato during the cultivation cycle. DAT: Days after transplanting. T0: control treatment; T1: inoculation with bacteria once, without a reduction in fertigation; T2: inoculation with bacteria every 40 days, without a reduction in fertigation; T3: inoculation with bacteria every 40 days and a 20% reduction in fertigation. Different letters indicate significant differences at p ≤ 0.05 (Tukey’s test).
Agronomy 13 02286 g002
Figure 3. Distribution of fruits by treatment and commercial size. T0: control treatment; T1: inoculation with bacteria once, without a reduction in fertigation; T2: inoculation with bacteria every 40 days, without a reduction in fertigation; T3: inoculation with bacteria every 40 days and a 20% reduction in fertigation. Different letters indicate significant differences at p ≤ 0.05 (Tukey’s test).
Agronomy 13 02286 g003
Figure 4. Average weight of fruits by treatment and commercial category. T0: control treatment; T1: inoculation with bacteria once, without a reduction in fertigation; T2: inoculation with bacteria every 40 days, without a reduction in fertigation; T3: inoculation with bacteria every 40 days and a 20% reduction in fertigation. Different letters indicate significant differences at p ≤ 0.05 (Tukey’s test).
Agronomy 13 02286 g004
Figure 5. NPK fertility levels in soil. (A) Nitrogen (%); (B) Available Phosphorus; (C): Potassium content. T0: control treatment; T1: inoculation with bacteria once, without a reduction in fertigation; T2: inoculation with bacteria every 40 days, without a reduction in fertigation; T3: inoculation with bacteria every 40 days and a 20% reduction in fertigation. The dashed line indicates the initial NPK values prior to the establishment of the culture. Different letters indicate significant differences at p ≤ 0.05 (Tukey’s test).
Agronomy 13 02286 g005
Figure 6. Economic income derived from the sale of the fruits. T0: control treatment; T1: inoculation with bacteria once, without a reduction in fertigation; T2: inoculation with bacteria every 40 days, without a reduction in fertigation; T3: inoculation with bacteria every 40 days and a 20% reduction in fertigation.
Agronomy 13 02286 g006
Table 1. Distribution of percentages (%) of the use of the irrigation tanks according to the cultivation phase.
PhaseTank 1Tank 2Tank 3Tank 4
Growth17333317
Setting33332013
Collection33331122
Table 2. Application of biofertilizers by treatment.
Inoculation with
PGPR
DATT0T1T2T3 *
1st12 xxx
2nd52 xx
3rd92 xx
4th120 xx
5th162 xx
DAT: Days after transplanting. T0: control treatment; T1: inoculation with bacteria once, without a reduction in fertigation; T2: inoculation with bacteria every 40 days, without a reduction in fertigation; T3: inoculation with bacteria every 40 days and a 20% reduction in fertigation. * In this treatment, fertigation based on inorganic fertilizers was reduced by 20%.
Table 3. NPK contents in dry weight in leaves and fruits.
Treatment Leaf Fruit
NPKNPK
% %
T03.54 ± 0.17 b0.29 ± 0.01 a3.45 ± 0.20 b1.83 ± 0.01 b0.32 ± 0.02 a3.17 ± 0.11 b
T13.61 ± 0.14 b0.39 ± 0.06 b3.12 ± 0.34 b1.62 ± 0.08 a0.33 ± 0.03 a3.34 ± 0.07 c
T23.47 ± 0.12 b0.42 ± 0.09 b3.38 ± 0.51 b1.66 ± 0.03 a0.35 ± 0.02 a3.06 ± 0.09 ab
T33.08 ± 0.13 a0.46 ± 0.07 b2.64 ± 0.15 a1.59 ± 0.05 a0.32 ± 0.01 a2.91 ± 0.11 a
Mean values ± standard deviations, (n = 6 in leaves, n = 3 in fruits). T0: control treatment; T1: inoculation with bacteria once, without a reduction in fertigation; T2: inoculation with bacteria every 40 days, without a reduction in fertigation; T3: inoculation with bacteria every 40 days and a 20% reduction in fertigation (20%). Different letters indicate significant differences at p ≤ 0.05 (Tukey’s test).
Table 4. Contents of macronutrients (NPK) (gm−2) in fruits and variations relative to the T0 control treatment.
TreatmentN (g/m2)Increase (%)P (g/m2)Increase (%)K (g/m2)Increase (%)
T09.26-1.62-16.01-
T18.63−6.811.768.7317.7811.09
T28.93−3.51.8816.5416.472.85
T310.7416.012.1633.7319.6522.77
T0: control treatment; T1: inoculation with bacteria once, without a reduction in fertigation; T2: inoculation with bacteria every 40 days, without a reduction in fertigation; T3: inoculation with bacteria every 40 days and a 20% reduction in fertigation. The increase refers to the T0 treatment.
Table 5. Quality parameters of fruits.
TreatmentpHEC (mS/cm)Firmness (N)TSS (%)TA (%)Maturity Index
T04.52 ± 0.03 b7.00 ± 0.13 c34.91 ± 4.12 a6.10 ± 1.01 a0.59 ± 0.05 a10.27 ± 1.10 a
T14.43 ± 0.09 ab6.70 ± 0.44 bc38.78 ± 8.92 a6.00 ± 1.00 a0.58 ± 0.02 a10.39 ± 1.43 a
T24.42 ± 0.09 ab6.47 ± 0.15 b33.20 ± 5.88 a6.33 ± 0.58 a0.59 ± 0.03 a10.65 ± 0.42 a
T34.37 ± 0.05 a5.97 ± 0.07 a36.19 ± 6.64 a6.17 ± 0.29 a0.53 ± 0.04 a11.65 ± 0.29 a
TSS: total soluble solids; EC: electrical conductivity; TA: titratable acidity; maturity index: TSS%/TA%. T0: control treatment; T1: inoculation with bacteria once, without a reduction in fertigation; T2: inoculation with bacteria every 40 days, without reduction in fertigation; and T3: inoculation with bacteria every 40 days and a 20% reduction in fertigation. Different letters indicate significant differences at p ≤ 0.05 (Tukey’s test). n = 3.
Disclaimer/Publisher’s Note: The statements, opinions and data contained in all publications are solely those of the individual author(s) and contributor(s) and not of MDPI and/or the editor(s). MDPI and/or the editor(s) disclaim responsibility for any injury to people or property resulting from any ideas, methods, instructions or products referred to in the content.

