Article

Evaluation of the ECOSSE Model for Estimating Soil Respiration from Eight European Permanent Grassland Sites

1
Institute of Biological and Environmental Sciences, School of Biological Sciences, University of Aberdeen, 23 St. Machar Drive, Aberdeen AB24 3UU, UK
2
Department of Environmental Systems Science, Institute of Agricultural Sciences, ETH Zürich, 8092 Zurich, Switzerland
3
Department of Ecology, University of Innsbruck, Sternwartestrasse 15, 6020 Innsbruck, Austria
4
UK Centre for Ecology & Hydrology, Penicuik EH26 0QB, UK
5
MTA-MATE Agroecology Research Group, Department of Plant Physiology and Plant Ecology, Institute of Agronomy, Hungarian University for Agricultural and Life Sciences, Pater 1, 2100 Godollo, Hungary
6
Department of Animal Nutrition and Forage Production, Mendel University in Brno, 61300 Brno, Czech Republic
7
ADAS, Mansfield NG20 9PD, UK
*
Author to whom correspondence should be addressed.
Agronomy 2023, 13(7), 1734; https://doi.org/10.3390/agronomy13071734
Submission received: 28 April 2023 / Revised: 19 June 2023 / Accepted: 24 June 2023 / Published: 28 June 2023
(This article belongs to the Special Issue Advance in Grassland Productivity and Sustainability)

Abstract

:
This study used the ECOSSE model (v. 5.0.1) to simulate soil respiration (Rs) fluxes estimated from ecosystem respiration (Reco) for eight European permanent grassland (PG) sites with varying grass species, soils, and management. The main aim was to evaluate the strengths and weaknesses of the model in estimating Rs from grasslands, and to gain a better understanding of the terrestrial carbon cycle and how Rs is affected by natural and anthropogenic drivers. Results revealed that the current version of the ECOSSE model might not be reliable for estimating daily Rs fluxes, particularly in dry sites. The daily estimated and simulated Rs ranged from 0.95 to 3.1 g CO2-C m−2, and from 0.72 to 1.58 g CO2-C m−2, respectively. However, ECOSSE could still be a valuable tool for predicting cumulative Rs from PG. The overall annual relative deviation (RD) value between the cumulative estimated and simulated annual Rs was 11.9%. Additionally, the model demonstrated accurate simulation of Rs in response to grass cutting and slurry application practices. The sensitivity analyses and attribution tests revealed that increased soil organic carbon (SOC), soil pH, temperature, reduced precipitation, and lower water table (WT) depth could lead to increased Rs from soils. The variability of Rs fluxes across sites and years was attributed to climate, weather, soil properties, and management practices. The study suggests the need for additional development and application of the ECOSSE model, specifically in dry and low input sites, to evaluate the impacts of various land management interventions on carbon sequestration and emissions in PG.

1. Introduction

Atmospheric carbon dioxide (CO2) concentration has been increasing since the beginning of industrialisation [1]. In 2021, the concentration of CO2 in the atmosphere set a record of about 415 ppm, and it is anticipated that it could potentially reach around 800 ppm by the end of this century [2]. Beside respiration and fires, which are significantly increasing atmospheric CO2 emissions, human activities, including agricultural production, are not only increasing CO2, but also the concentration of other greenhouse gases (GHGs), such as methane (CH4) and nitrous oxide (N2O) [1]. Moreover, Caldeira and Wickett [3] reported that man-made CO2 emissions are contributing to acidification of open oceans; however, direct pH measurements and experience in this area are still limited [4,5]. Interaction between management practices, climate, and soil properties influence soil carbon stocks. For example, intensive management of permanent grasslands (PG) to support ruminant livestock production alters GHG emissions from EU grasslands and can reduce their ability to act as C sinks [6]. Further, in 2017, the livestock sector was responsible for 81–86% of the total agriculture GHG emissions in the EU-28 [7].
In Europe (EU-27 plus the UK and Switzerland), PG cover approximately 34% of the agricultural area and represent a source for many ecosystem services, for example climate regulation and carbon sequestration, cultural values, and high-quality animal feed [6,8,9,10,11]. In terms of total area, the countries with the largest grassland area found are the United Kingdom (11 million ha), France (7.6 million ha), Germany (4.8 million ha), and Italy (4.5 million ha) [12]. PG potentially contribute to mitigation of climate change by assimilating atmospheric CO2 and sequestering it in the soil, depending on climate, soil, and management [13]. Improving grassland management by improving grass and herb species, irrigation, liming, and fertilisation can increase the annual soil organic carbon (SOC) stocks by 10% [14,15].
Soils are the largest C pool in terrestrial ecosystems, containing more than two thirds of the total C. However, soil respiration (i.e., total CO2 effluxes from the soil surface, which consists of autotrophic root and heterotrophic respiration from decomposition of litter roots and soil organic matter (SOM)) is a critical component of the global carbon cycle and greatly contributes to the atmospheric CO2 concentration [16]. The decomposition of litter, roots, and SOM results in Rs fluxes [17]. In a global meta-analysis, Wang and Fang [18] quantified annual soil CO2 efflux from temperate and tropical natural grasslands as 389.8 ± 45.5 and 601.3 ± 45.6 g C m−2, respectively. Previous studies have found that increases in Rs are due to increasing soil temperature [19,20,21]. Higher temperatures also increase the long-term soil C decomposition and impact CO2 emissions from the soil to the atmosphere [22,23]. Further, elevated CO2 concentrations in the atmosphere, due to anthropogenic emissions and the positive feedback loops resulting from global warming, increase both the below- and above-ground biomass production and, thereby, although uncertain due to high photosynthesis, can increase CO2 fluxes from soils [18,24].
The model to Estimate Carbon in Organic Soils—Sequestration and Emissions (ECOSSE) was created to simulate C and nitrogen (N) cycling and GHG fluxes from soils. The principles of two mother models, RothC [25,26,27] and SUNDIAL [28,29], were used for this purpose. The ECOSSE uses a pool-type approach of humus (HUM), inert organic matter (IOM), biomass (BIO), resistant plant material (RPM), and decomposable plant material (DPM) [30]. Material moves between these pools during the decomposition process according to first-order rate equations, characterised by a decay rate constant for each pool. The exchange between pools is controlled by temperature, moisture, crop cover, and soil pH. The soil pH affects aerobic SOC decomposition, according to Equation (1) [31]:
m p H = m p H , m i n + 1 m p H , m i n p H p H m i n p H m a x p H m i n
The values of m p H , m i n , p H m i n , and p H m a x can be set for each site, but by default are set at m p H , m i n = 0.2, p H m i n = 1, and p H m a x = 4.5.
The work by Jenkinson [25] on the impact of plant cover on the decomposition of 14C-labelled ryegrass is relevant to the modelling of soil organic matter (SOM) decomposition in ECOSSE. In ECOSSE, the rate of SOM decomposition is slowed using a crop cover rate modifier ( m c ) of 0.6 if plants are actively growing, and 1 if the soil is bare. The active SOC pools implicitly encompass different qualities of SOC (e.g., lignin quantity, etc.) through their different intrinsic decomposition rates and stable C:N ratios, with N being either mineralised or immobilised to maintain that ratio. Variation in the quality of plant inputs to the soil is expressed through land-use types having different DPM:RPM ratios, e.g., grassland has a DPM:RPM ratio of 1.44, whereas forestry has a DPM:RPM ratio of 0.25 to account for its more recalcitrant plant material. In addition, the plant inputs from other land-use types have different C:N ratios [27]. Clay content of the soil impacts aerobic decomposition by altering the partitioning between CO2 evolved and BIO+HUM formed during decomposition [25,28]. Clay content is used to determine the efficiency of decomposition ( E ) under non-N-limiting conditions. The objectives of this research were to [1] evaluate the ECOSSE model to understand its strengths and weakness for estimating Rs from eight European permanent grasslands with their respective climate, grass type, and management, and [2] to obtain a better understanding of the terrestrial C cycle and attribution of Rs to variability in natural and anthropogenic (climate and management) drivers in the European PG ecosystem.

2. Materials and Methods

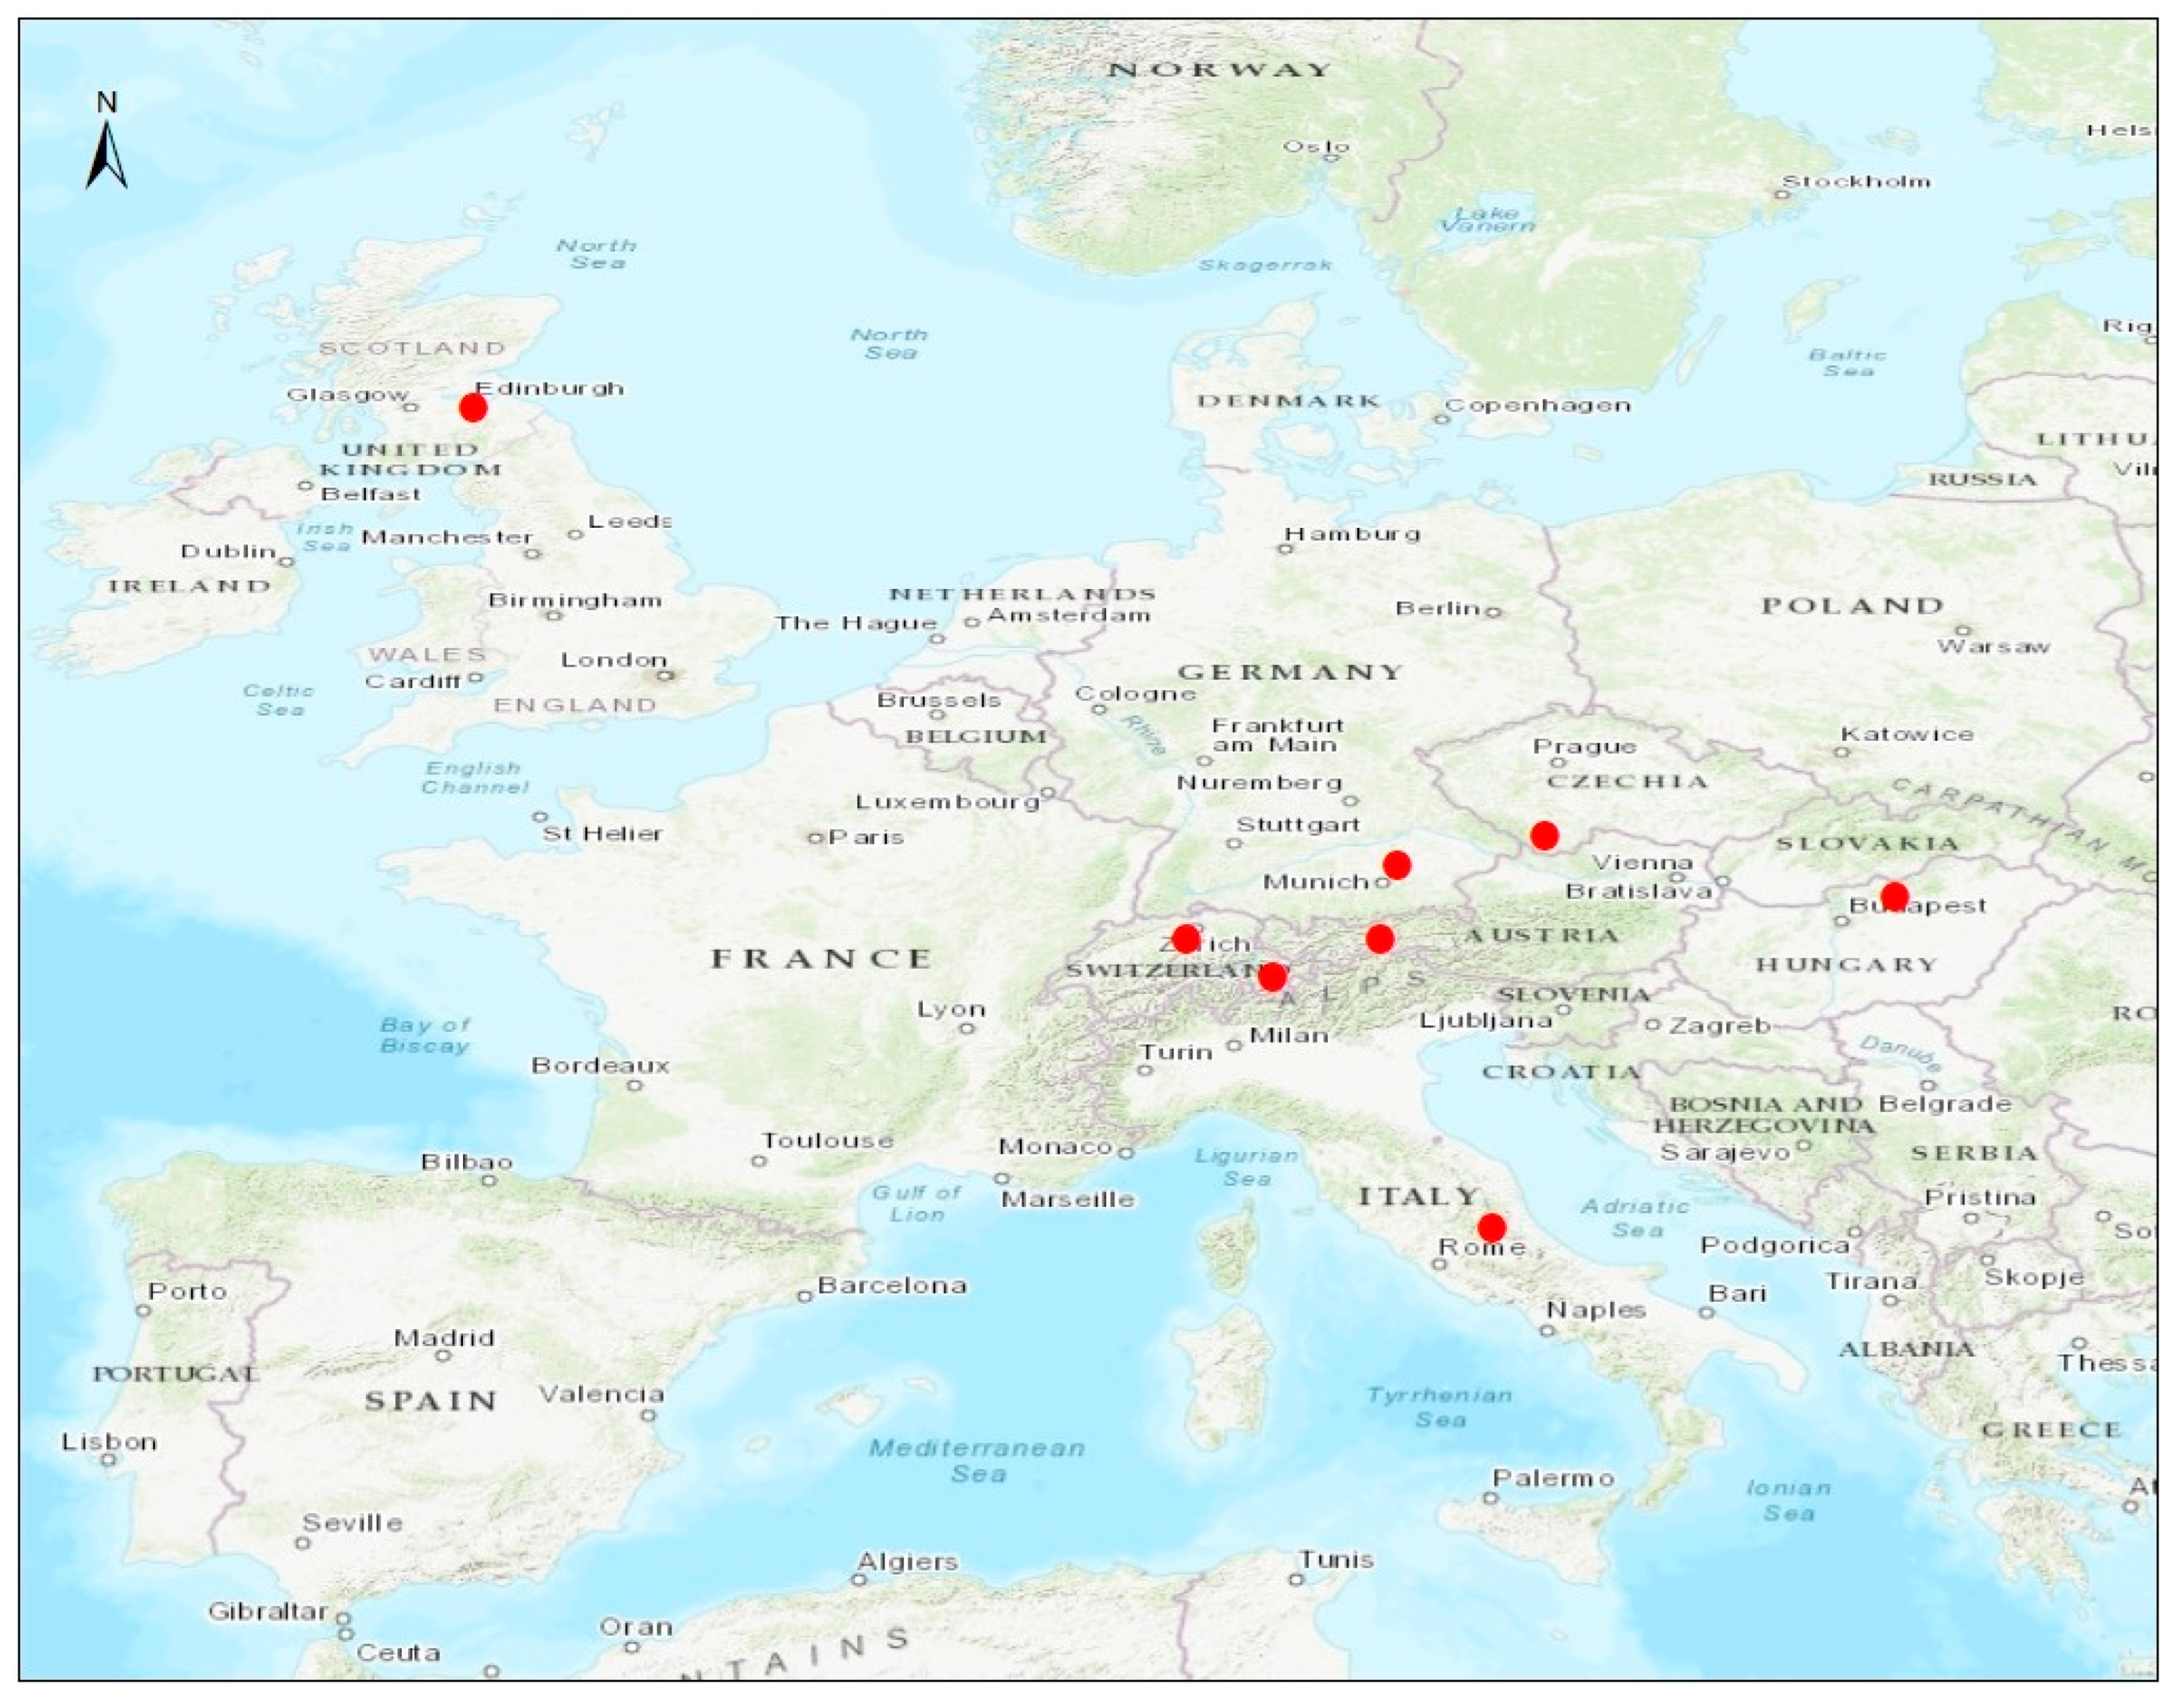
2.1. The Study Sites

In this study, Rs fluxes from eight European permanent grassland sites were investigated (Figure 1). The sites cover seven countries and have different soils, climatic conditions, and management. Average annual temperatures and precipitation ranged from 4 to 10.2 °C and from 622 to 1365 mm, respectively. Site information with geographic coordinates, climatic conditions, grassland type, and management are given in Table 1. The soil types at the sites varied from sandy loam to clay soils. Initial SOC contents were either measured or estimated using soil % C, bulk density, and sampling depth at the site. Details of soil properties, water table depth, and SOC can be found in Table 2. Soil pH was measured using a pH probe or meter in deionised water. The pH probe, specifically designed for soil pH measurements, was inserted into the soil sample, and the pH meter provided a digital readout of the pH value. Deionized water was used as the solvent for the measurement to minimise interference from other ions or substances in the soil.

2.2. CO2 Flux Measurements

Measurements of the net ecosystem exchange (NEE) at each site were made by eddy covariance (EC) using either open- or closed-path infrared gas analysers [32,33]. Then, the ecosystem respiration (Reco) of CO2 fluxes was calculated from the NEE data and made available by the Super-G, GHG-Europe and Carbo-Europe projects, and the Flux-net website. Full descriptions of the sites, EC data corrections, quality control, footprint, gap filling procedures, and calculations of Reco can be found in the literature: Easter Bush in Jones et al. [34], Alp Weissenstein in Hiller et al. [35], Neustift in Wohlfahrt et al. [36], Chamau in Fuchs et al. [37], Matra in Pinter et al. [38], Grünschwaige in Hirl et al. [39], Borova in Cuhel et al. [40], and Amperlo in Balzarolo et al. [41]. Meteorological data (average daily air temperature and precipitation) over the period 2002 to 2018 were collected from the investigated sites to be used as inputs to the model. Measurement durations differed among sites and ranged from 3 to 11 years. To estimate Rs from Reco, the approach (Equation (2)) of Hardie et al. [42] and Abdalla et al. [19] was applied. To the best of our knowledge, this is the only available method, at the time of this study, to estimate Rs from the Reco.
Rs = Rs (from surface soils) + Rs (below water table soils) = 46–59% of Reco
where Rs is suggested to be 46% of Reco during the summer (June–August), 59% during the winter (December–February), and mean value (52.5% of Reco) during the rest of the year (March–May and September–November). More details about the estimation can be found in Hardie et al. [42] and Abdalla et al. [19].

2.3. The ECOSSE Model

The ECOSSE model (v. 5.0.1) was applied to simulate Rs from grassland soils at all sites. Then, the outputs of the model were compared with the estimated Rs values. ECOSSE is a process-based model that uses a pool-type approach, and all major processes of C and N turnover in the soil are included and described using simple equations driven by readily available input parameters. The model can be applied for all types of soils and ecosystems on site, national, or global scales. To run the model, data of climate, soil characteristics, vegetation biomass inputs, and management practices of each site are required (Table 1 and Table 2). ECOSSE uses the water module of the SUNDIAL model [43], where water moves through the soil pores by ‘piston flow’. The 5 cm layer soil profiles in ECOSSE gradually fill with water until saturation, and then water either drains to the layer below or evaporates from the topmost layer. The model estimates the addition or loss of C and N using their amounts in the above- and below-ground biomass. The model can also estimate the amount of organic matter (OM) input from the vegetation biomass if information on grass is not provided. The total SOC estimated by a steady-state (10,000 year) run using default biomass inputs is compared with the total observed SOC, and a revised estimate is made of the OM inputs so that the simulated steady-state SOC matches the observed values. Plant material is divided into resistant and decomposable material based on a ratio of 1.44 (as used in the RothC model) for DPM:RPM. Daily potential evapotranspiration was calculated using the Thornthwaite equation [44]. More details about the ECOSSE approach can be found in [31].

2.4. Model Sensitivity and Attribution

To investigate the impacts of anthropogenic management and natural drivers on Rs, sensitivity and attribution tests were carried out for each site. Here, only one input parameter was altered at a time, whilst all others were kept constant [19,45]. Simulations were run to assess the impacts on Rs by changes in climate variables: mean temperature (increasing/decreasing the daily mean temperature by 3 °C, from here onward named as Temp+3 and Temp–3) and precipitation (altering the daily precipitation by +30 and −30%, named as Rain+30% and Rain−30%). Simulations were also run to assess how Rs was affected by changes in soil physical properties, i.e., SOC, pH, and water table (WT; i.e., WT depth). SOC (named as SOC+30% and SOC−30%) and pH (named as pH+30% and pH−30%) were altered by +30 and −30%, whilst WT was lowered by 30 cm (named as WT+30).

2.5. ECOSSE Evaluation

Multi-criteria evaluations of the ECOSSE model were applied to identify how well it predicted the estimated Rs. Comparisons of simulated Rs with estimated Rs were undertaken for each site separately. Analysis was carried out to detect the coincidence and association between simulated and estimated values, following the methods described in [45,46]. Model accuracy and performance were evaluated by calculating the relative deviation (RD; Equation (3)) between annual simulated Rs and annual estimated Rs, the coefficient of determination (R2) to measure the closeness between daily simulated and estimated Rs values, the root mean square error (RMSE; Equation (4)) to measure total error, and the index of agreement (d; Equation (5)) to measure the ratio of the mean square error and the potential error. The index of agreement value of 1 indicates a perfect match, and 0 indicates no agreement at all. Annual cumulative Rs for model outputs were calculated as the sum of simulated daily fluxes [47].
RD = (Mi − Si)/Mi
RMSE = √[Ʃ(Si − Mi)2/n]
d = 1 Ʃ   ( Si Mi ) 2 / Ʃ   [ ( Si X ¯ ) + Mi X ¯ ] 2
where Mi is the Rs value estimated from Reco and Si is the Rs value simulated by the ECOSSE model. N is the number of investigated days and X ¯ is the mean of estimated Rs values.

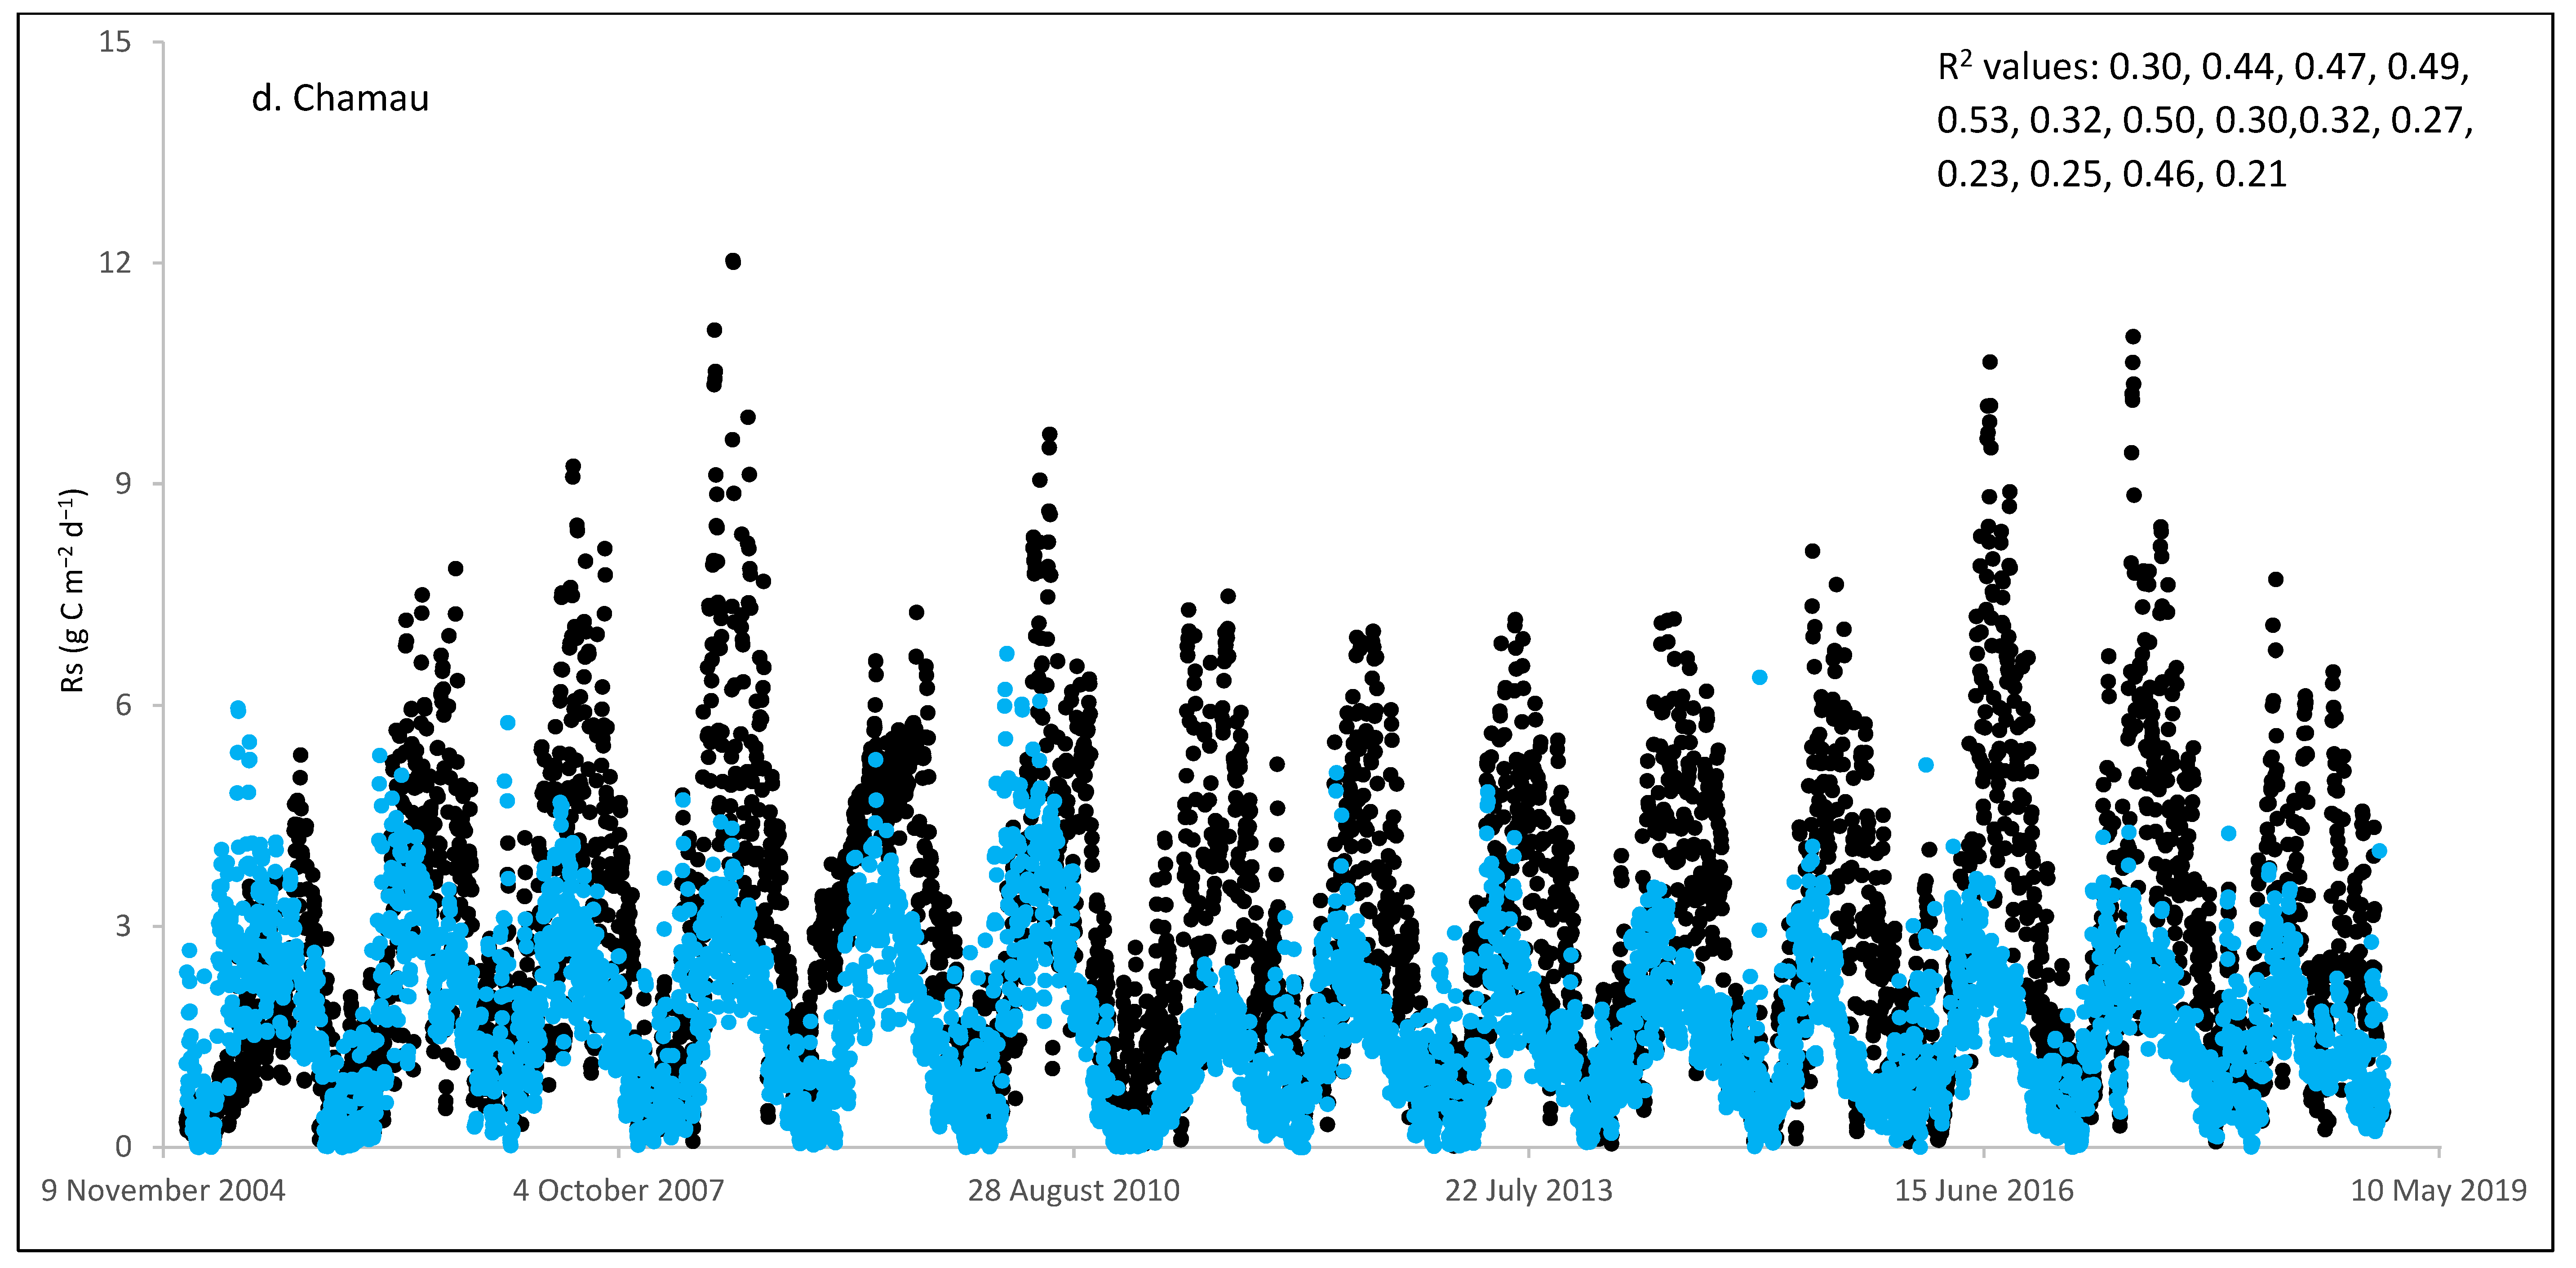
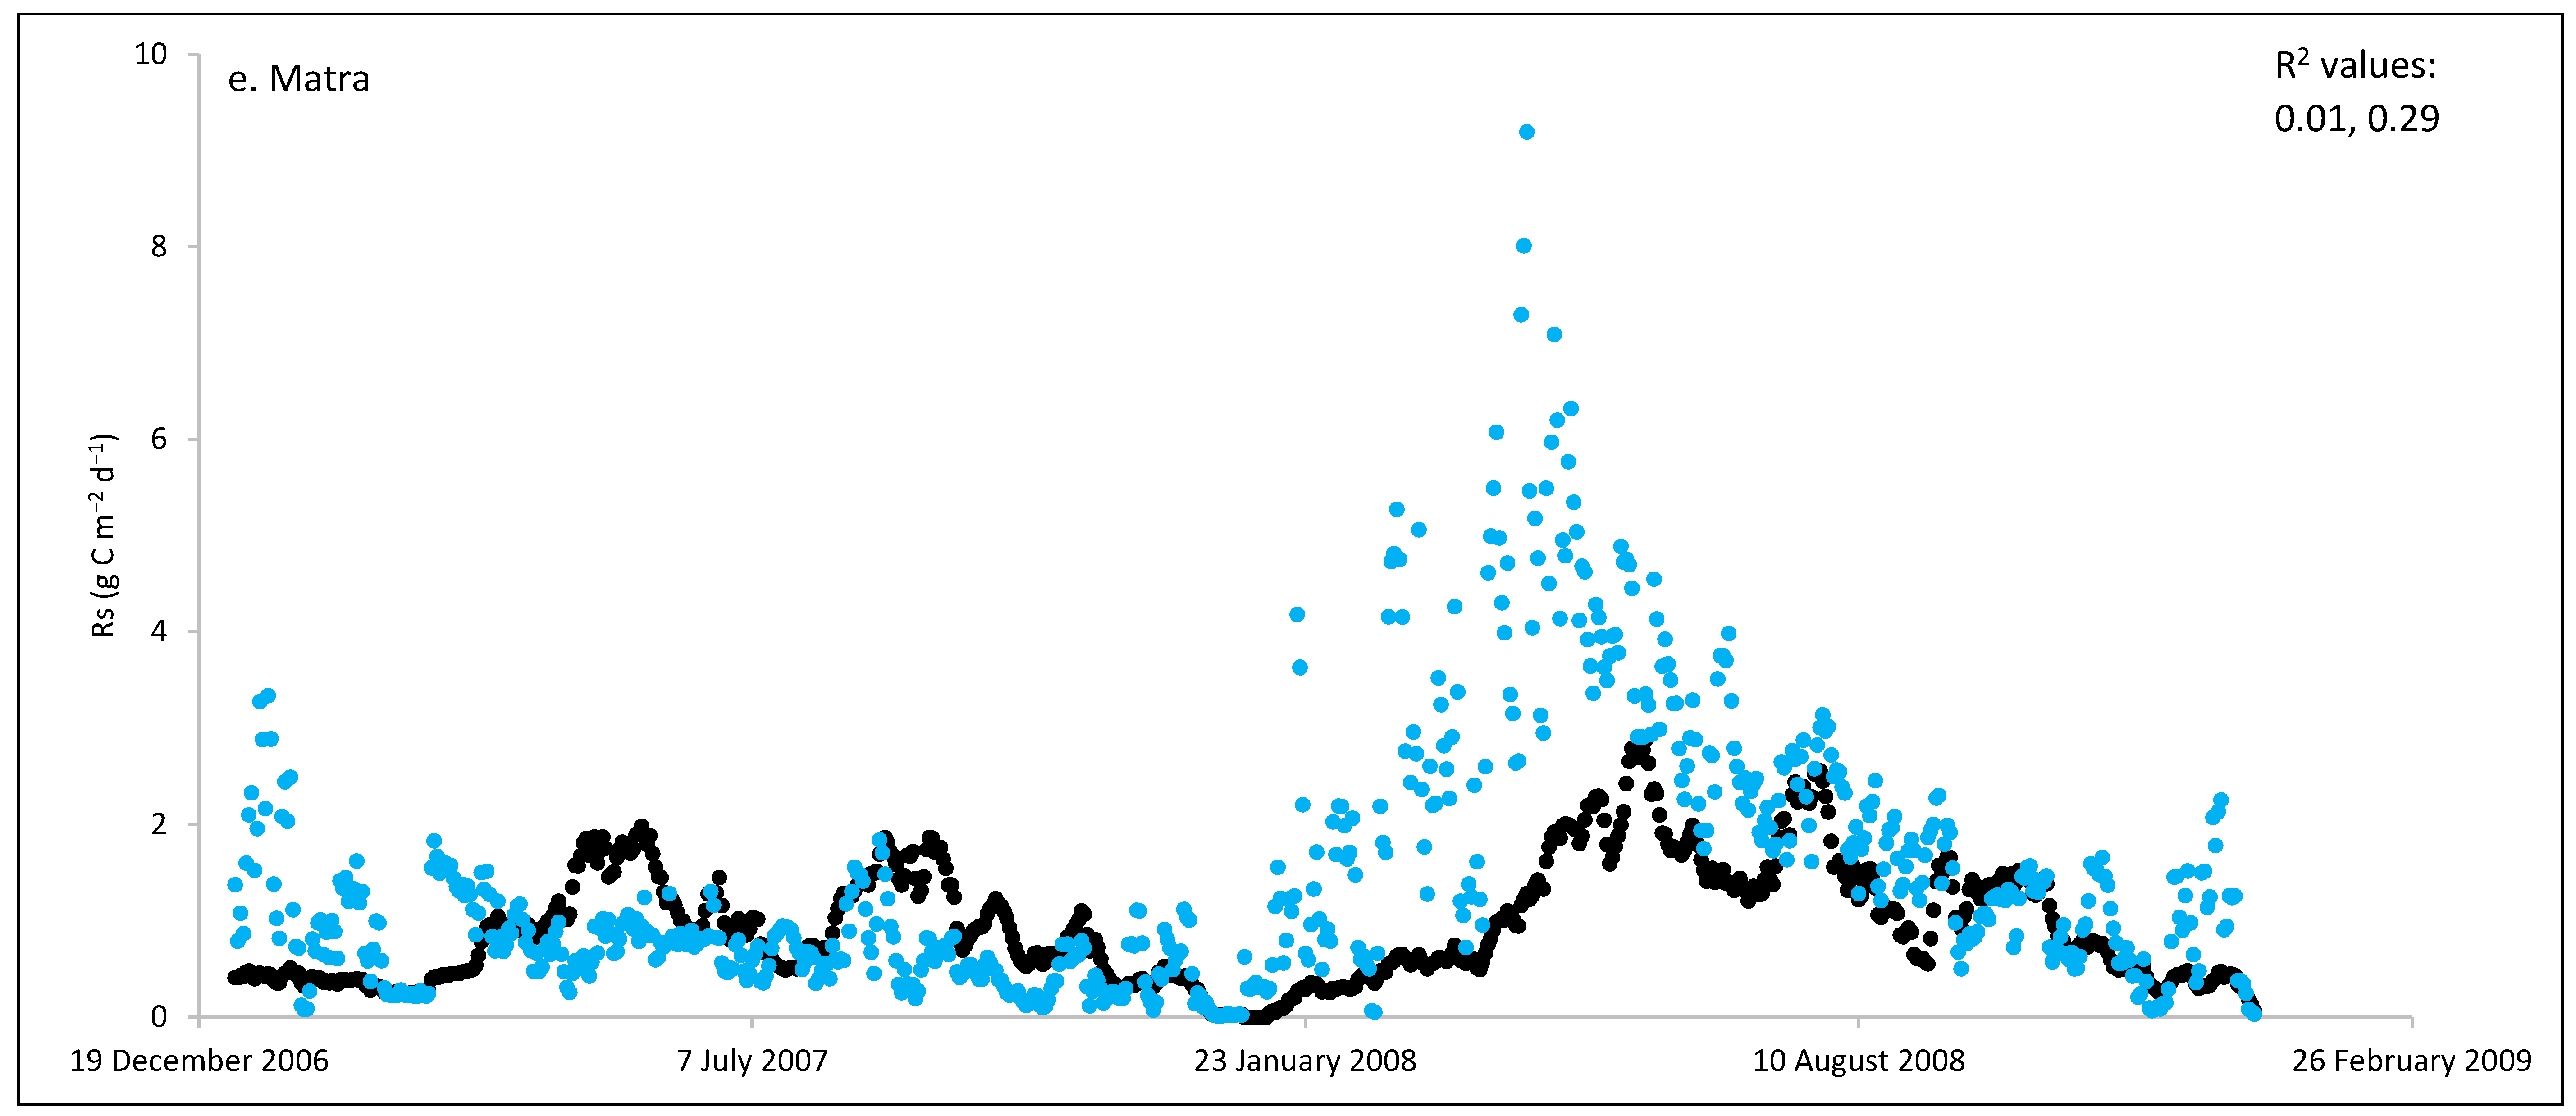
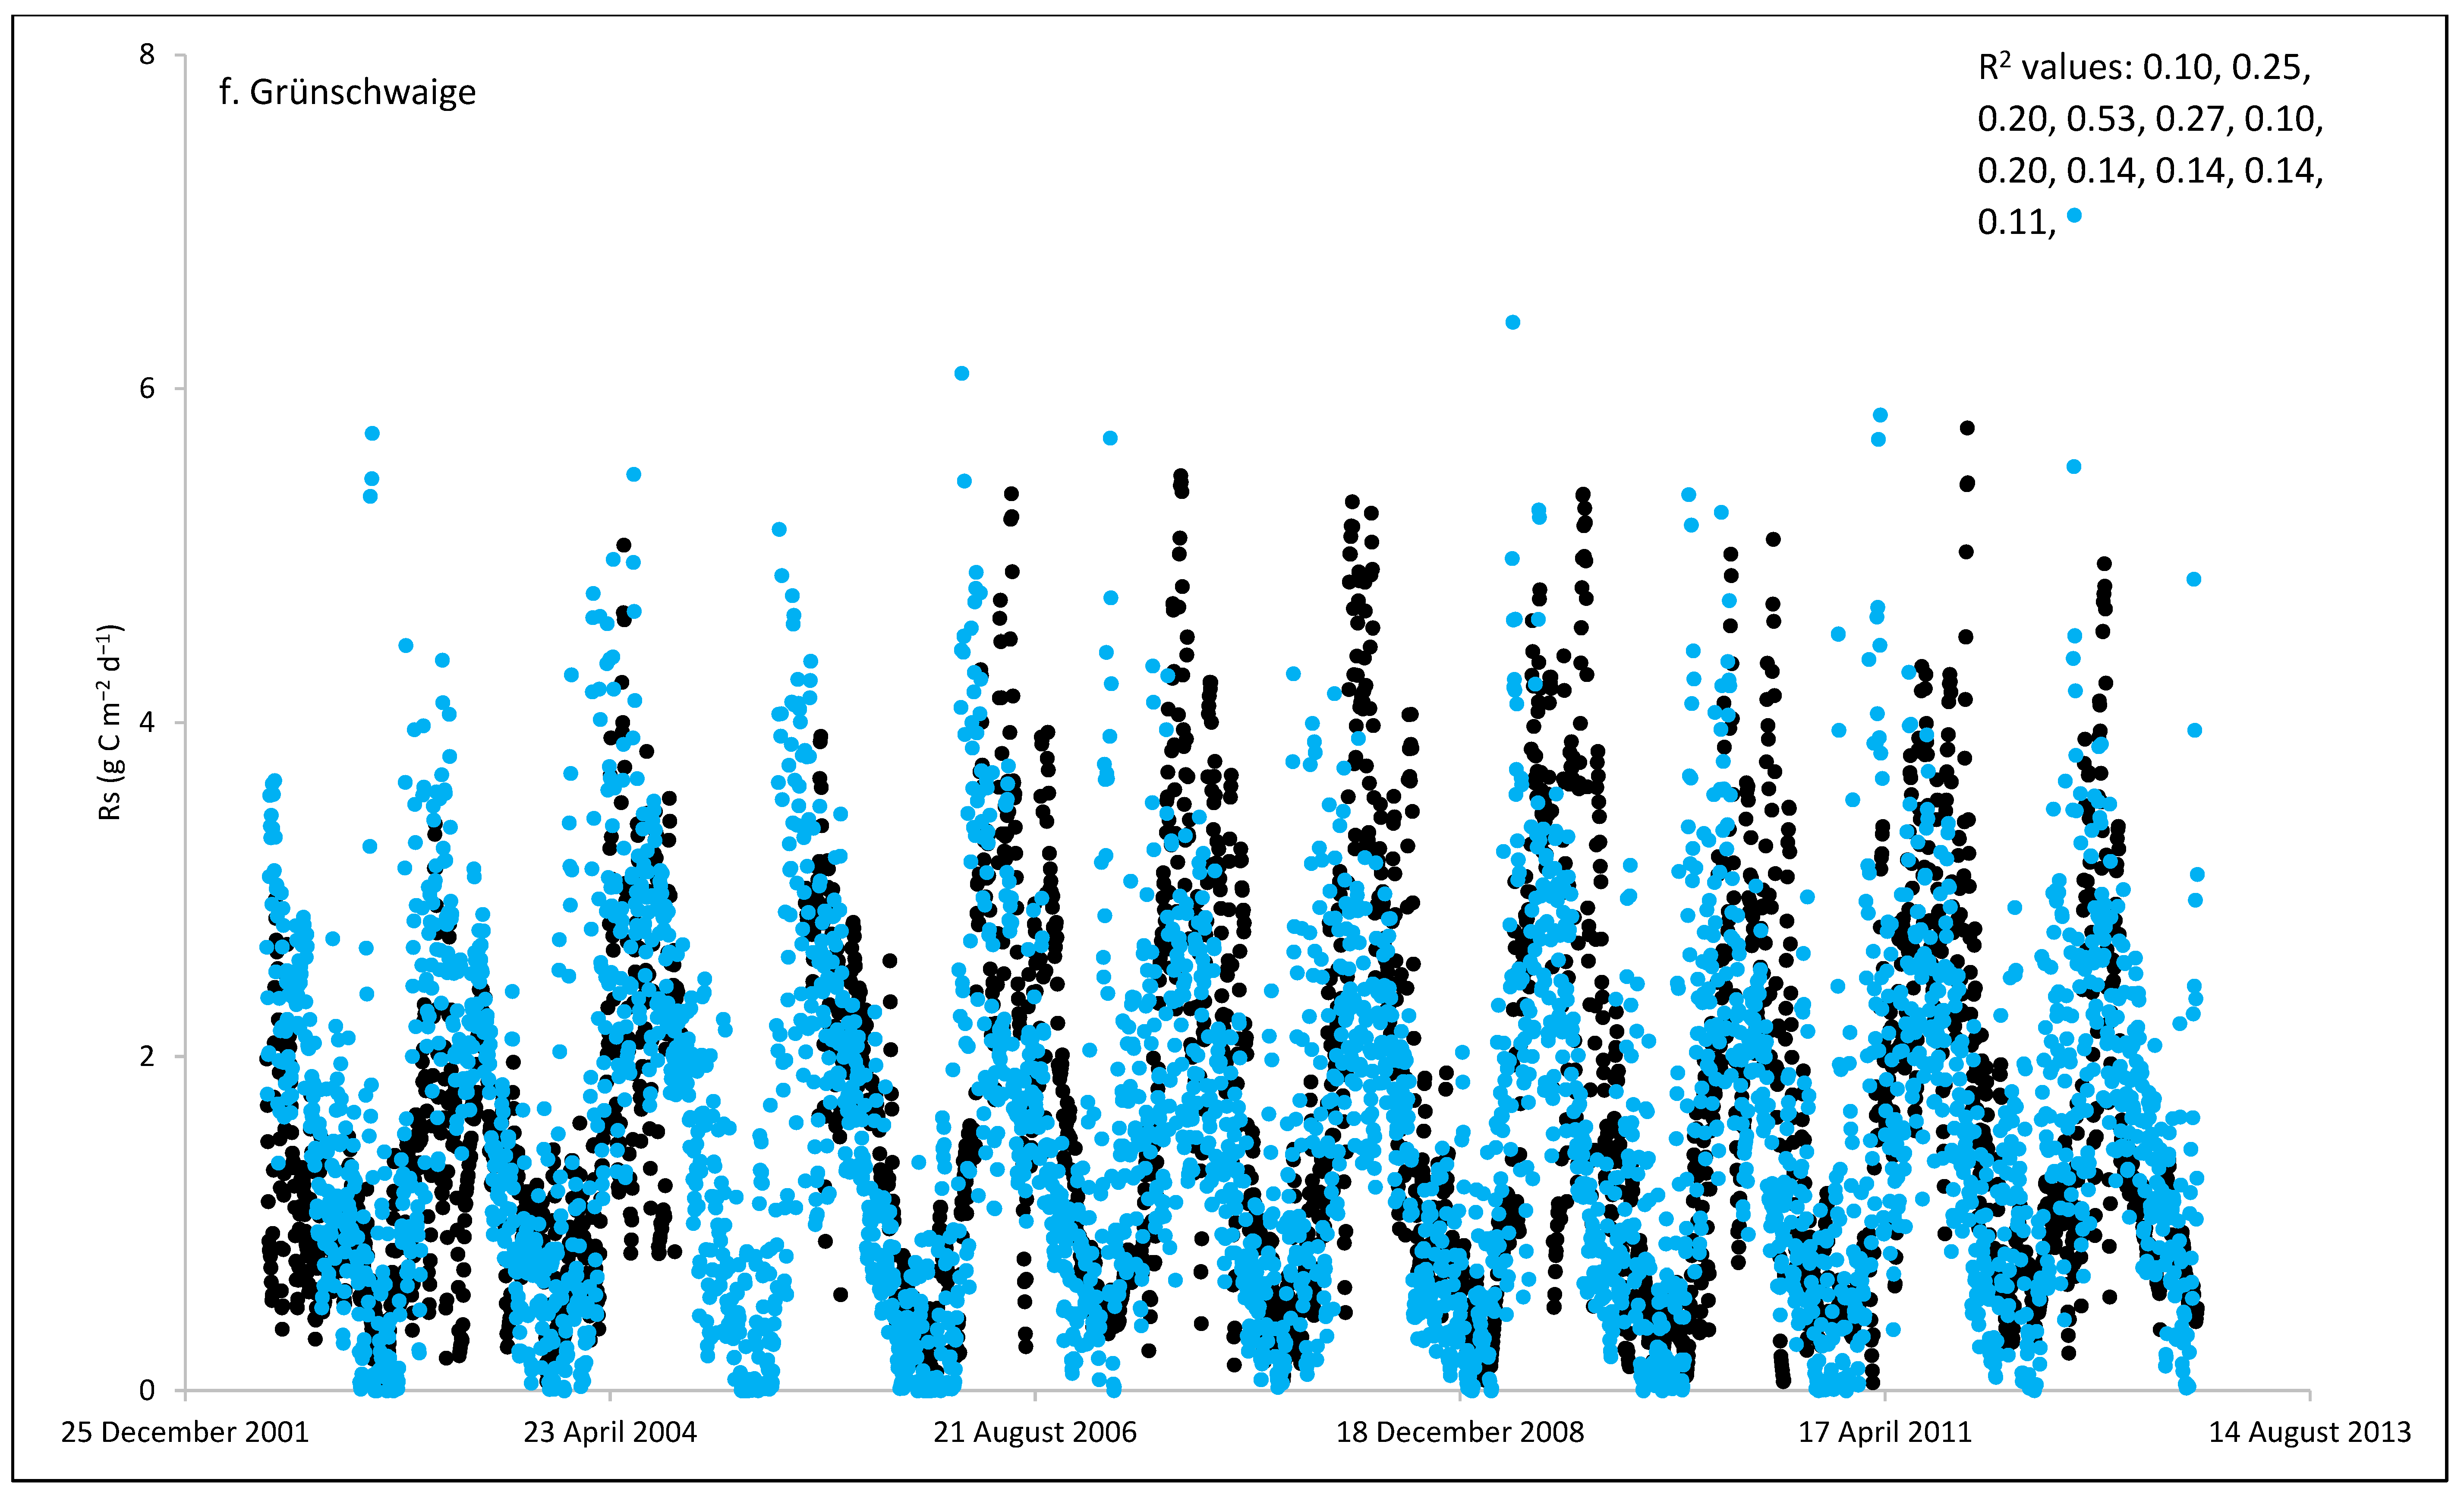
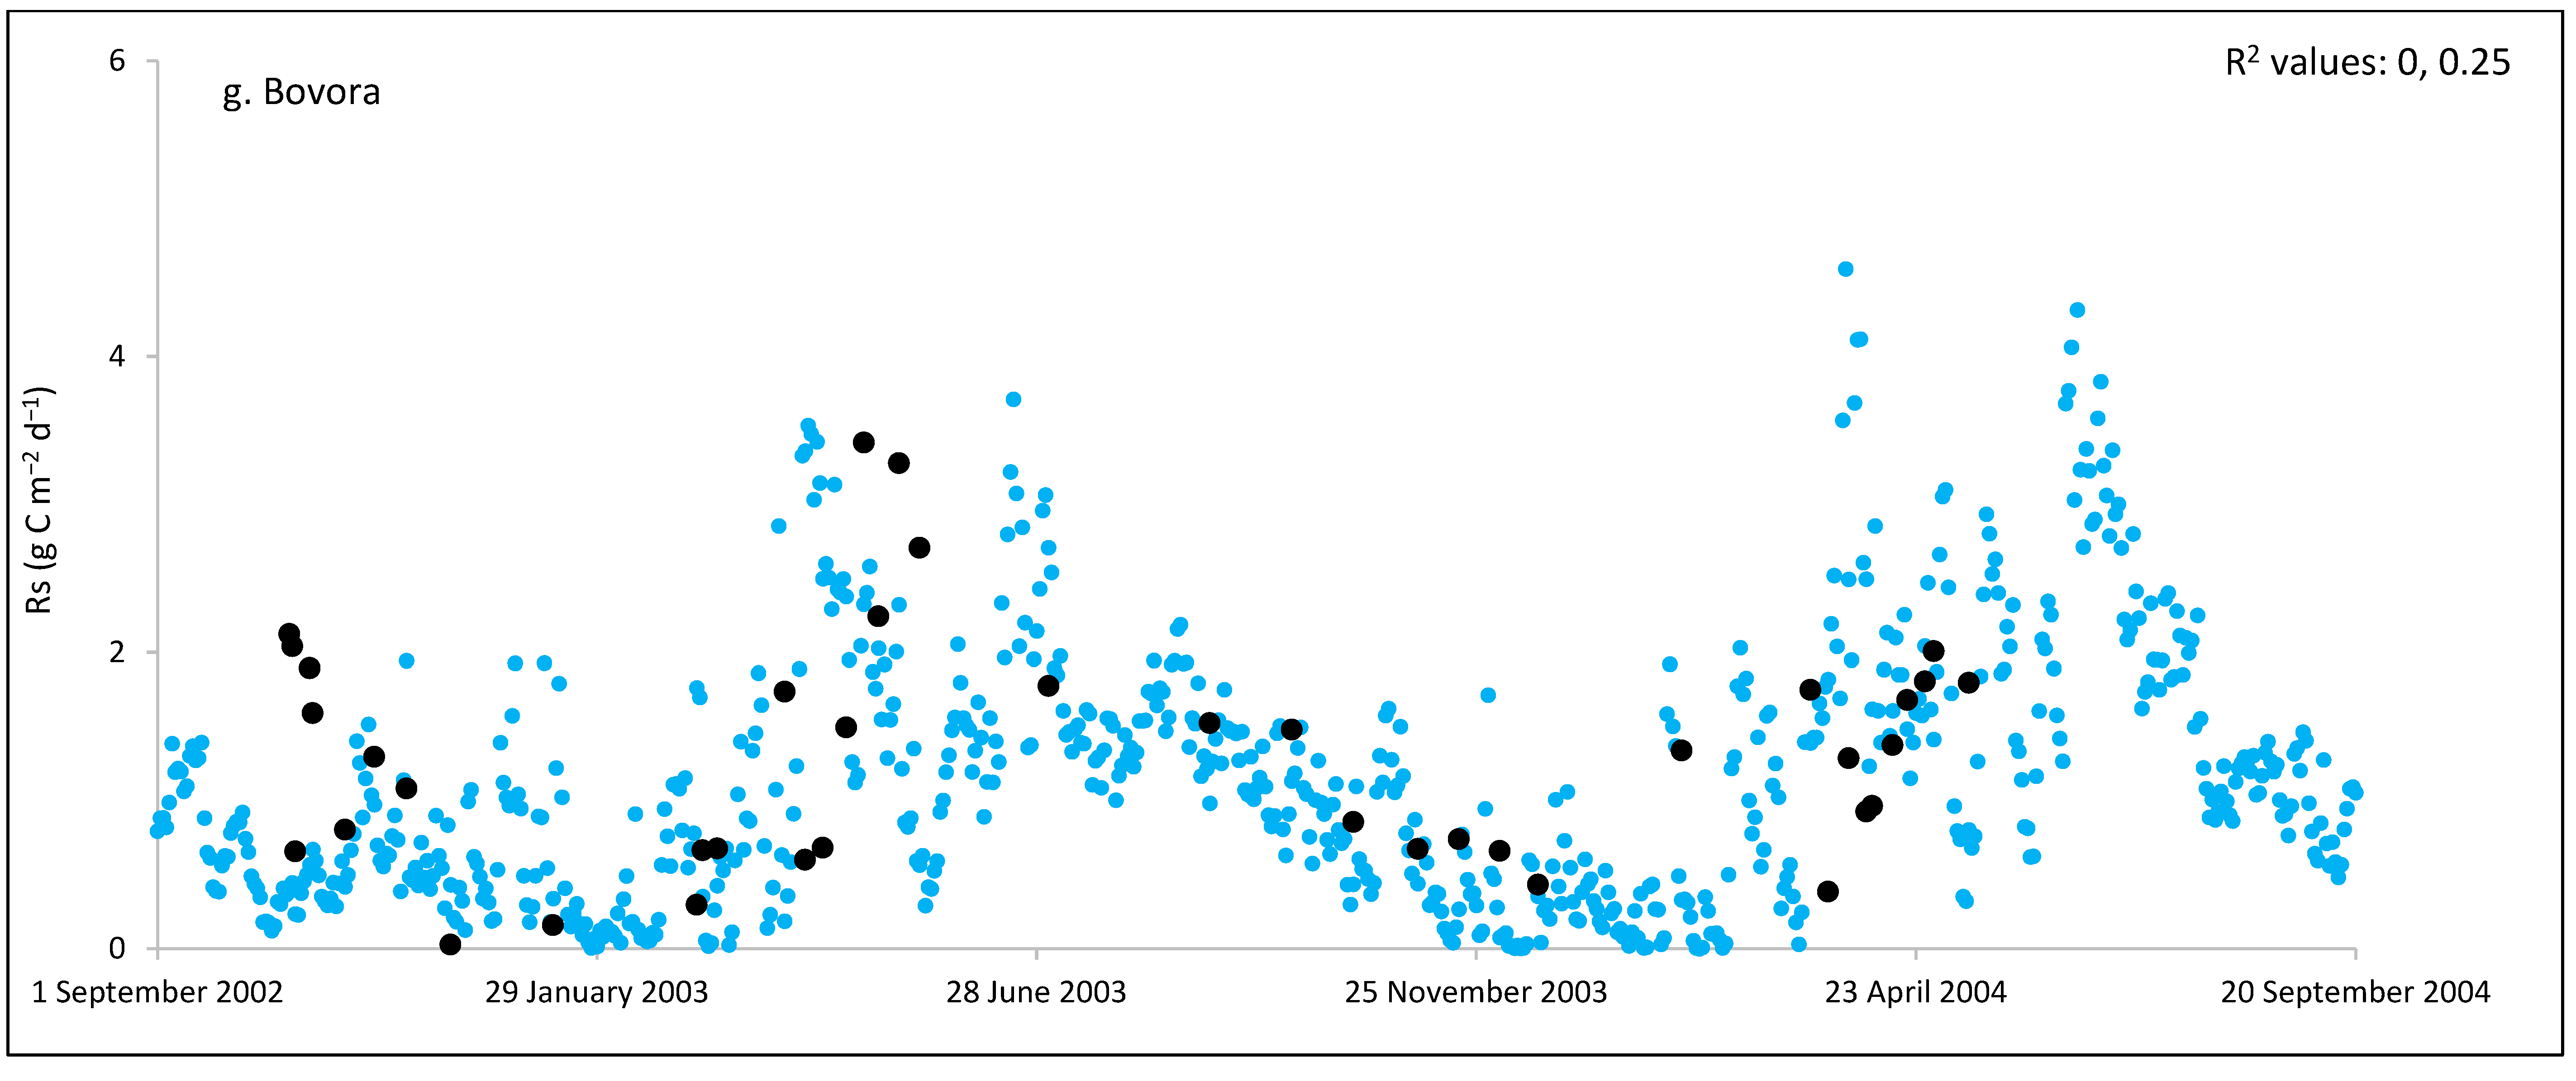
3. Results and Discussion

3.1. Field Estimated Soil Respiration (Rs) from Reco

In this study, average annual estimated Rs flux values from the investigated sites ranged from 350 to 1120 g C m−2, which fall within the annual range of 58 to 1988 g C m−2 measured by Bahn et al. [48] from 20 EU grassland sites. Additionally, in a global meta-analysis, Wang and Fang [18] quantified the annual Rs flux from natural grasslands in temperate and tropical regions. Their results showed that the annual Rs was 389.8 ± 45.5 g C m−2 for temperate natural grasslands and 601.3 ± 45.6 g C m−2 for tropical natural grasslands. However, to ensure unbiased comparison among the results of various studies, it is vital to maintain consistent soil depth in future studies through the implementation of soil stratification analysis. The long-term MAT and MAP values and soil properties were varied among the investigated sites (Table 1 and Table 2). Variabilities were also clear in the average daily temperature and precipitation values at the sites, as shown in Figure S1. In Europe, climate variability, especially in the summer, is expected to increase with more frequent heat waves and droughts [49]. The estimated daily and annual Rs flux values were also substantially variable, among sites and between years at the same site (Figure 2 and Table 3). These variabilities in Rs can be attributed to several factors. The spatial heterogeneity [50] in soil characteristics and microclimate conditions, and variations in grass type and species composition between sites can have impacts on the amount of carbon inputs through photosynthesis. Temporal dynamics in temperature, precipitation, and seasonal changes can directly impact metabolic activity of soil organisms involved in Rs. Other factors, such as natural variability in microbial activity [51], root respiration, and soil moisture fluctuations, can also play a role in these variabilities.
Peak values of estimated Rs were observed during late summer and autumn, whereas lower values were observed during the wintertime (Figure 1 and Figure S1). The lowest average daily estimated Rs value of 0.95 g C m−2 was found for Matra in Hungary (dry site), whilst the highest daily value of 3.1 g C m−2 was derived for Neustift in Austria, which was intensively managed. The low Rs efflux from Matra estimated in this study could be due to the site being dry, with low input and no animal grazing. Soil moisture content has a strong positive relationship with Rs; however, as it continues to increase and reaches high levels, anaerobic conditions can develop, which can depress aerobic microbial activity and lead to a decrease in soil Rs. This is because, under anaerobic conditions, microbes switch to alternative metabolic pathways that do not produce CO2 [52,53]. Additionally, Frank et al. [54] found high Rs efflux from a grazed mixed-grass prairie compared with a non-grazed mixed-grass prairie due to the addition of N and C by the grazing animals. Animal grazing leads to changes in vegetation composition, soil structure, nutrient cycling, and microbial communities, which can subsequently affect Rs. Trampling [55] can also impact soil physical properties, such as compaction, which can affect Rs by altering soil oxygen availability.
Cumulative monthly Rs values also followed the seasonal patterns of temperature, with the highest monthly average Rs rates in June, July, and August, and the lowest rates in January, February, November, and December (Figure S2). For all sites, positive regression relationships between daily estimated Rs and daily temperature were found, with regression-R values at the different sites ranging from 0.24 to 0.66 (Figure 3). However, in this study, correlation of Rs with precipitation was weak and inconsistent (data not shown). Solomon et al. [56] found that the variations in both temperature and precipitation rates significantly influenced local and regional Rs fluxes from soils.
However, in order to gain a comprehensive understanding of carbon cycling and accurately evaluate the influence of climate drivers on Rs flux, it is crucial to take into account the effects of management practices on PG.
Management practices have the potential to alter soil properties and influence soil microbial communities and their diversity [57], and these in turn affect Rs [58]. Although inconsistent, the daily Rs fluxes at the Easter Bush and Chamau sites (i.e., sites where detailed management data were available) decreased after grass cutting and increased after slurry application (Table 4). Cutting of grass affects C cycling and decreases Rs fluxes by decreasing root biomass [48]. Conversely, the carbon and other nutrients present in slurry can enhance productivity and microbial biomass, consequently increasing Rs fluxes from the soils [59]. High WT can decrease Rs due to creation of anaerobic conditions, which are unfavourable for oxidation of SOM, plant debris, and aerobic respiration [60]. Generally, in this study, fluxes of Rs can be explained by the interaction between the above-ground microclimate and belowground metrics. This is due to their interconnectedness and influence on C dynamics. Previous studies using data sets from the investigated sites in this study reported that the CO2 fluxes were mainly controlled by a set of variables including climate, soil, biomass, and management (e.g., [34,35,36]).

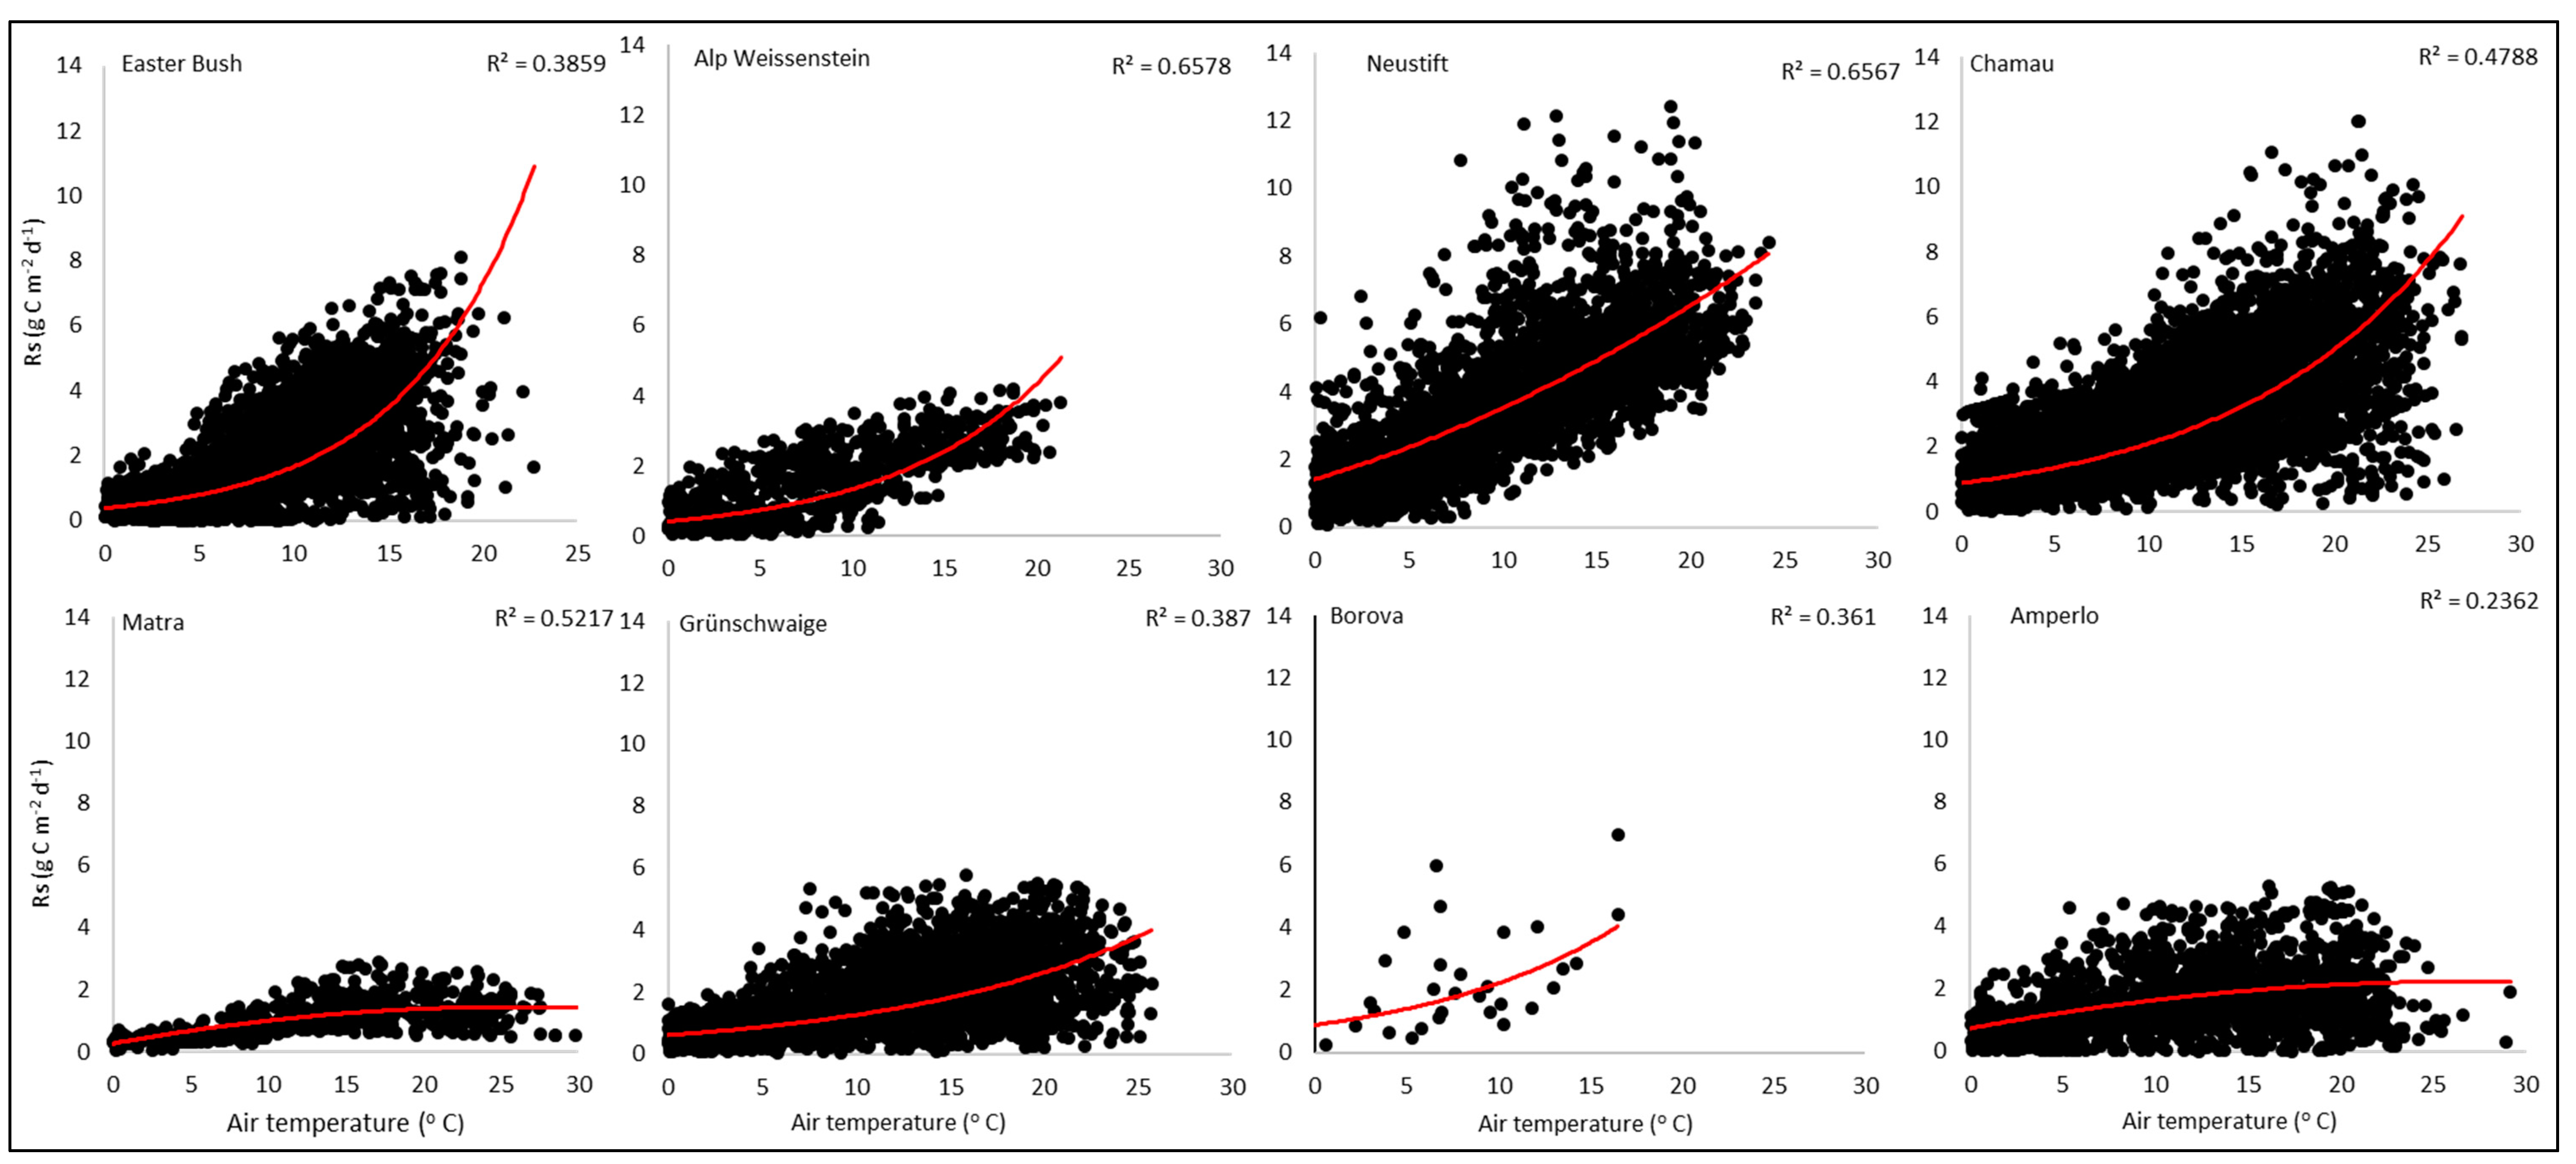
3.2. Model Sensitivity and Attribution

The ECOSSE attribution analysis revealed that the model is sensitive to the input parameters. ECOSSE showed similar responses in all grassland sites except for Matra, where the responses to changes of two input parameters were different, i.e., decreasing rainfall (Rain−30%), decreased Rs, and decreasing SOC (SOC−30%) increased Rs fluxes (Table 5). This site was a dry and low-input site, with low daily and annual cumulative Rs fluxes. This is in agreement with other studies, which suggest that soil drying reduces Rs due to soil moisture deficit, which limits microbial activities [61]. Overall, Rs values increased with increasing mean daily air temperature, depth to WT, SOC, and soil pH, but decreased with increasing daily precipitation (Table 5). Across all sites, increases in Rs fluxes, ranging from 16 to 25% and from 2 to 16%, were calculated when the daily mean temperature increased by 3 °C and SOC increased by 30%, respectively. Decreasing the temperature by 3 °C, compared with the original temperature, and SOC by 30% decreased the Rs flux by 11 to 23% and by 1 to 3%, respectively. Increasing the daily precipitation by 30%, compared with the original precipitation, decreased Rs by 1 to 18%, whilst decreasing the precipitation by 30% increased the flux by up to 11%. Lowering WT by 30 cm increased Rs by up to 16%, whilst a 30% higher pH increased the flux by up to 11%, and a 30% lower pH decreased the flux by up to 16% (Table 5). Previous studies reported that increasing temperature increased Rs rates [18,62]. As plant materials, including leaves, stems, and roots, undergo decomposition in the soil, microbial activity breaks them down. This process leads to the decomposition of organic matter, resulting in the conversion of complex compounds into simpler forms and the release of CO2 as a by-product. The decomposition process of plant materials is dependent on temperature [63,64], and, consequently, the rate of Rs. Higher soil moisture creates unfavourable conditions for decomposition of SOM [60]. Moreover, decreasing soil pH inhibits microbial utilisation of substrates and thereby decreases Rs [65].

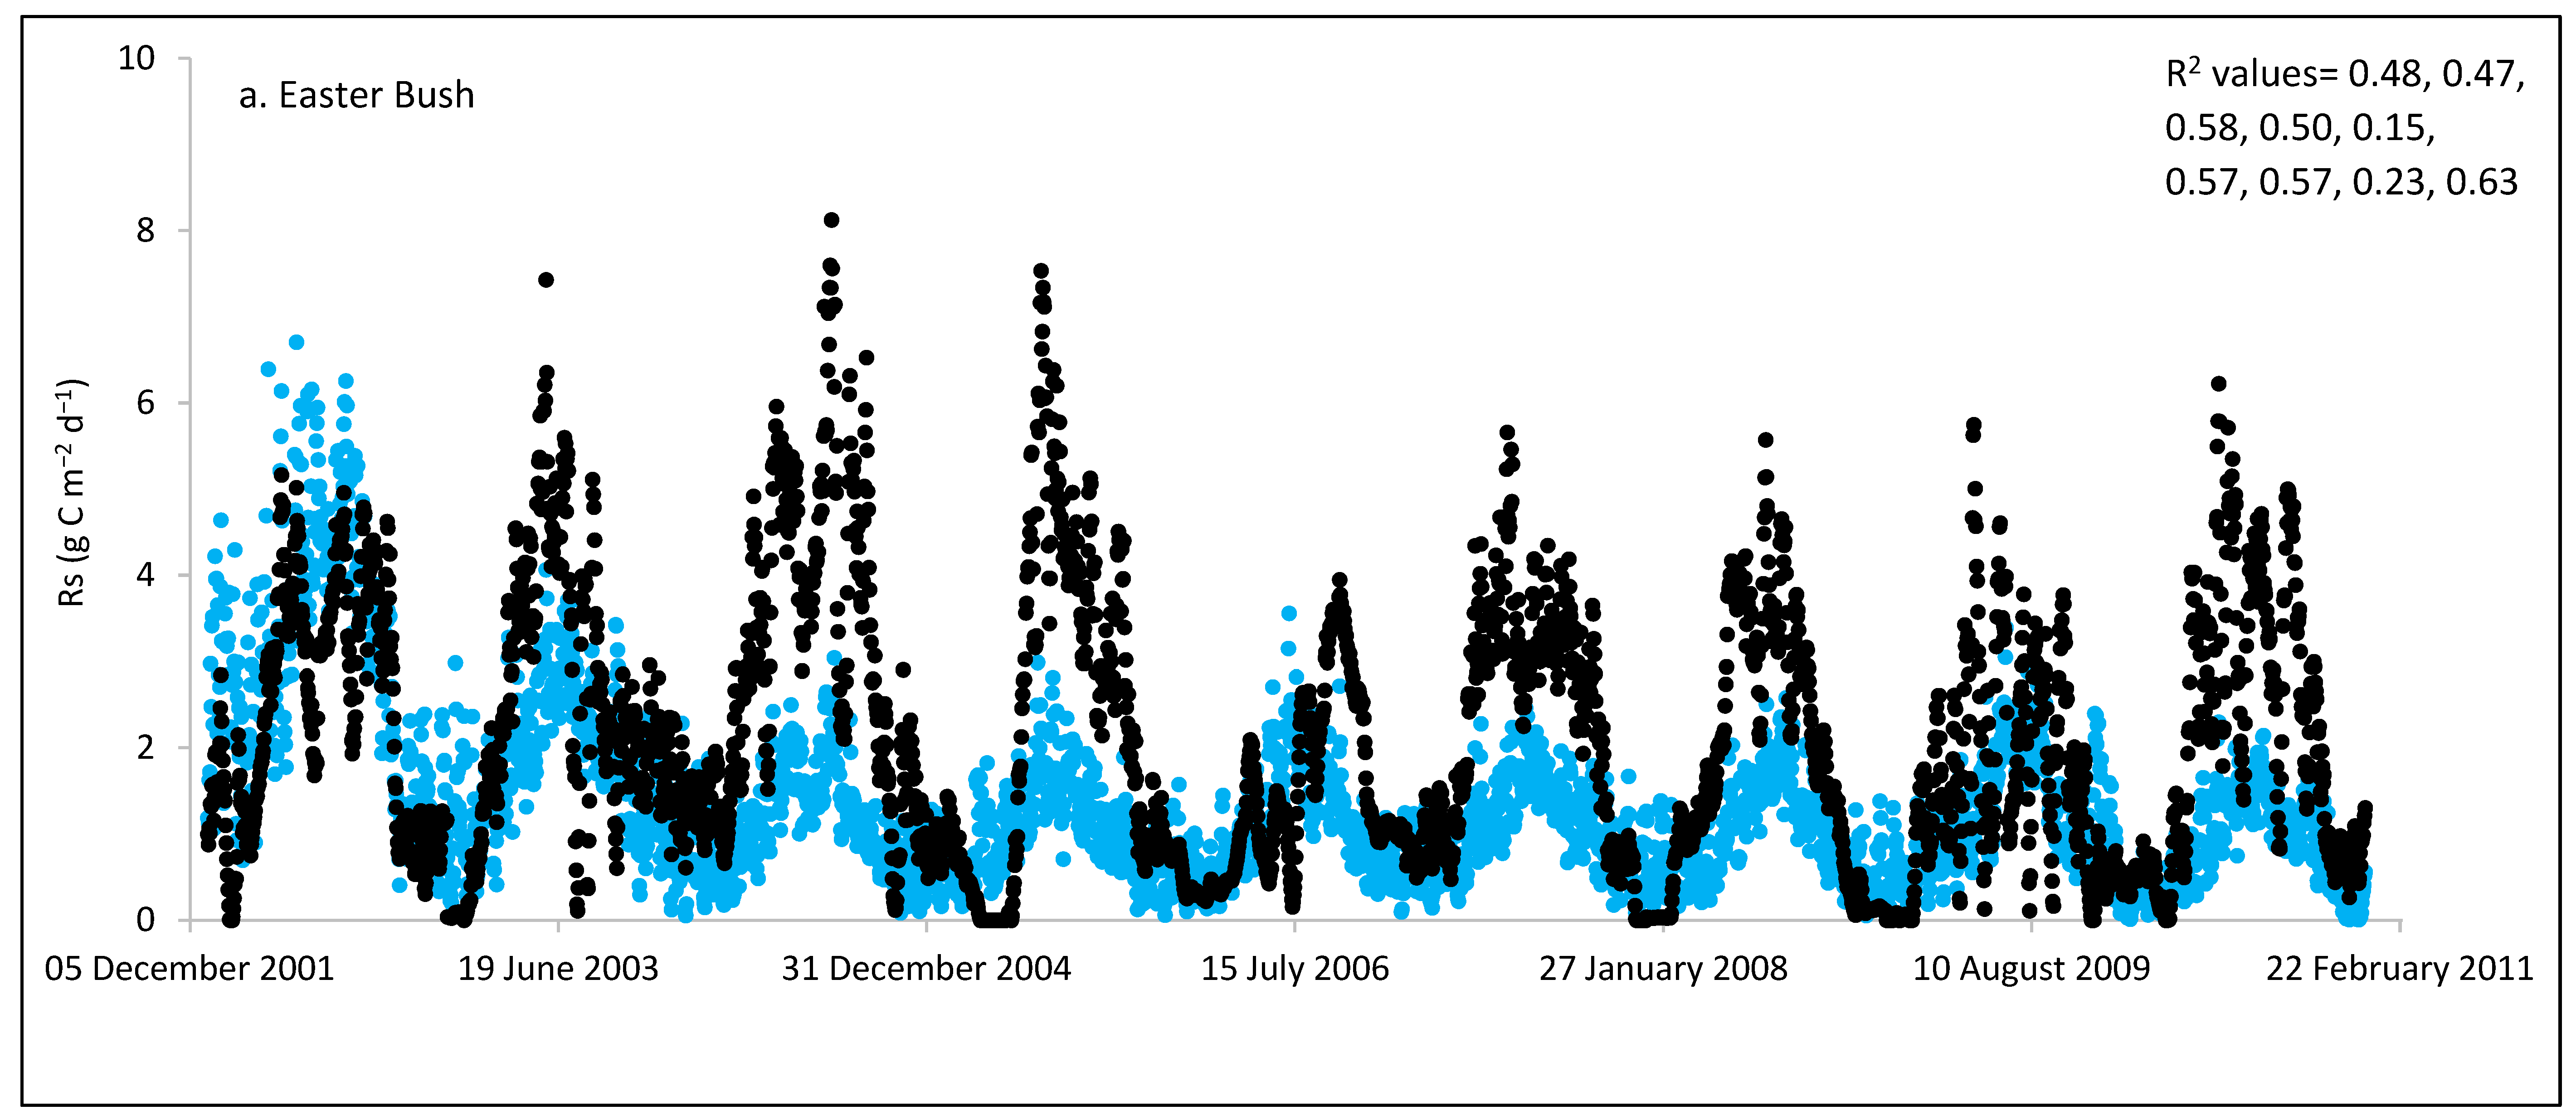
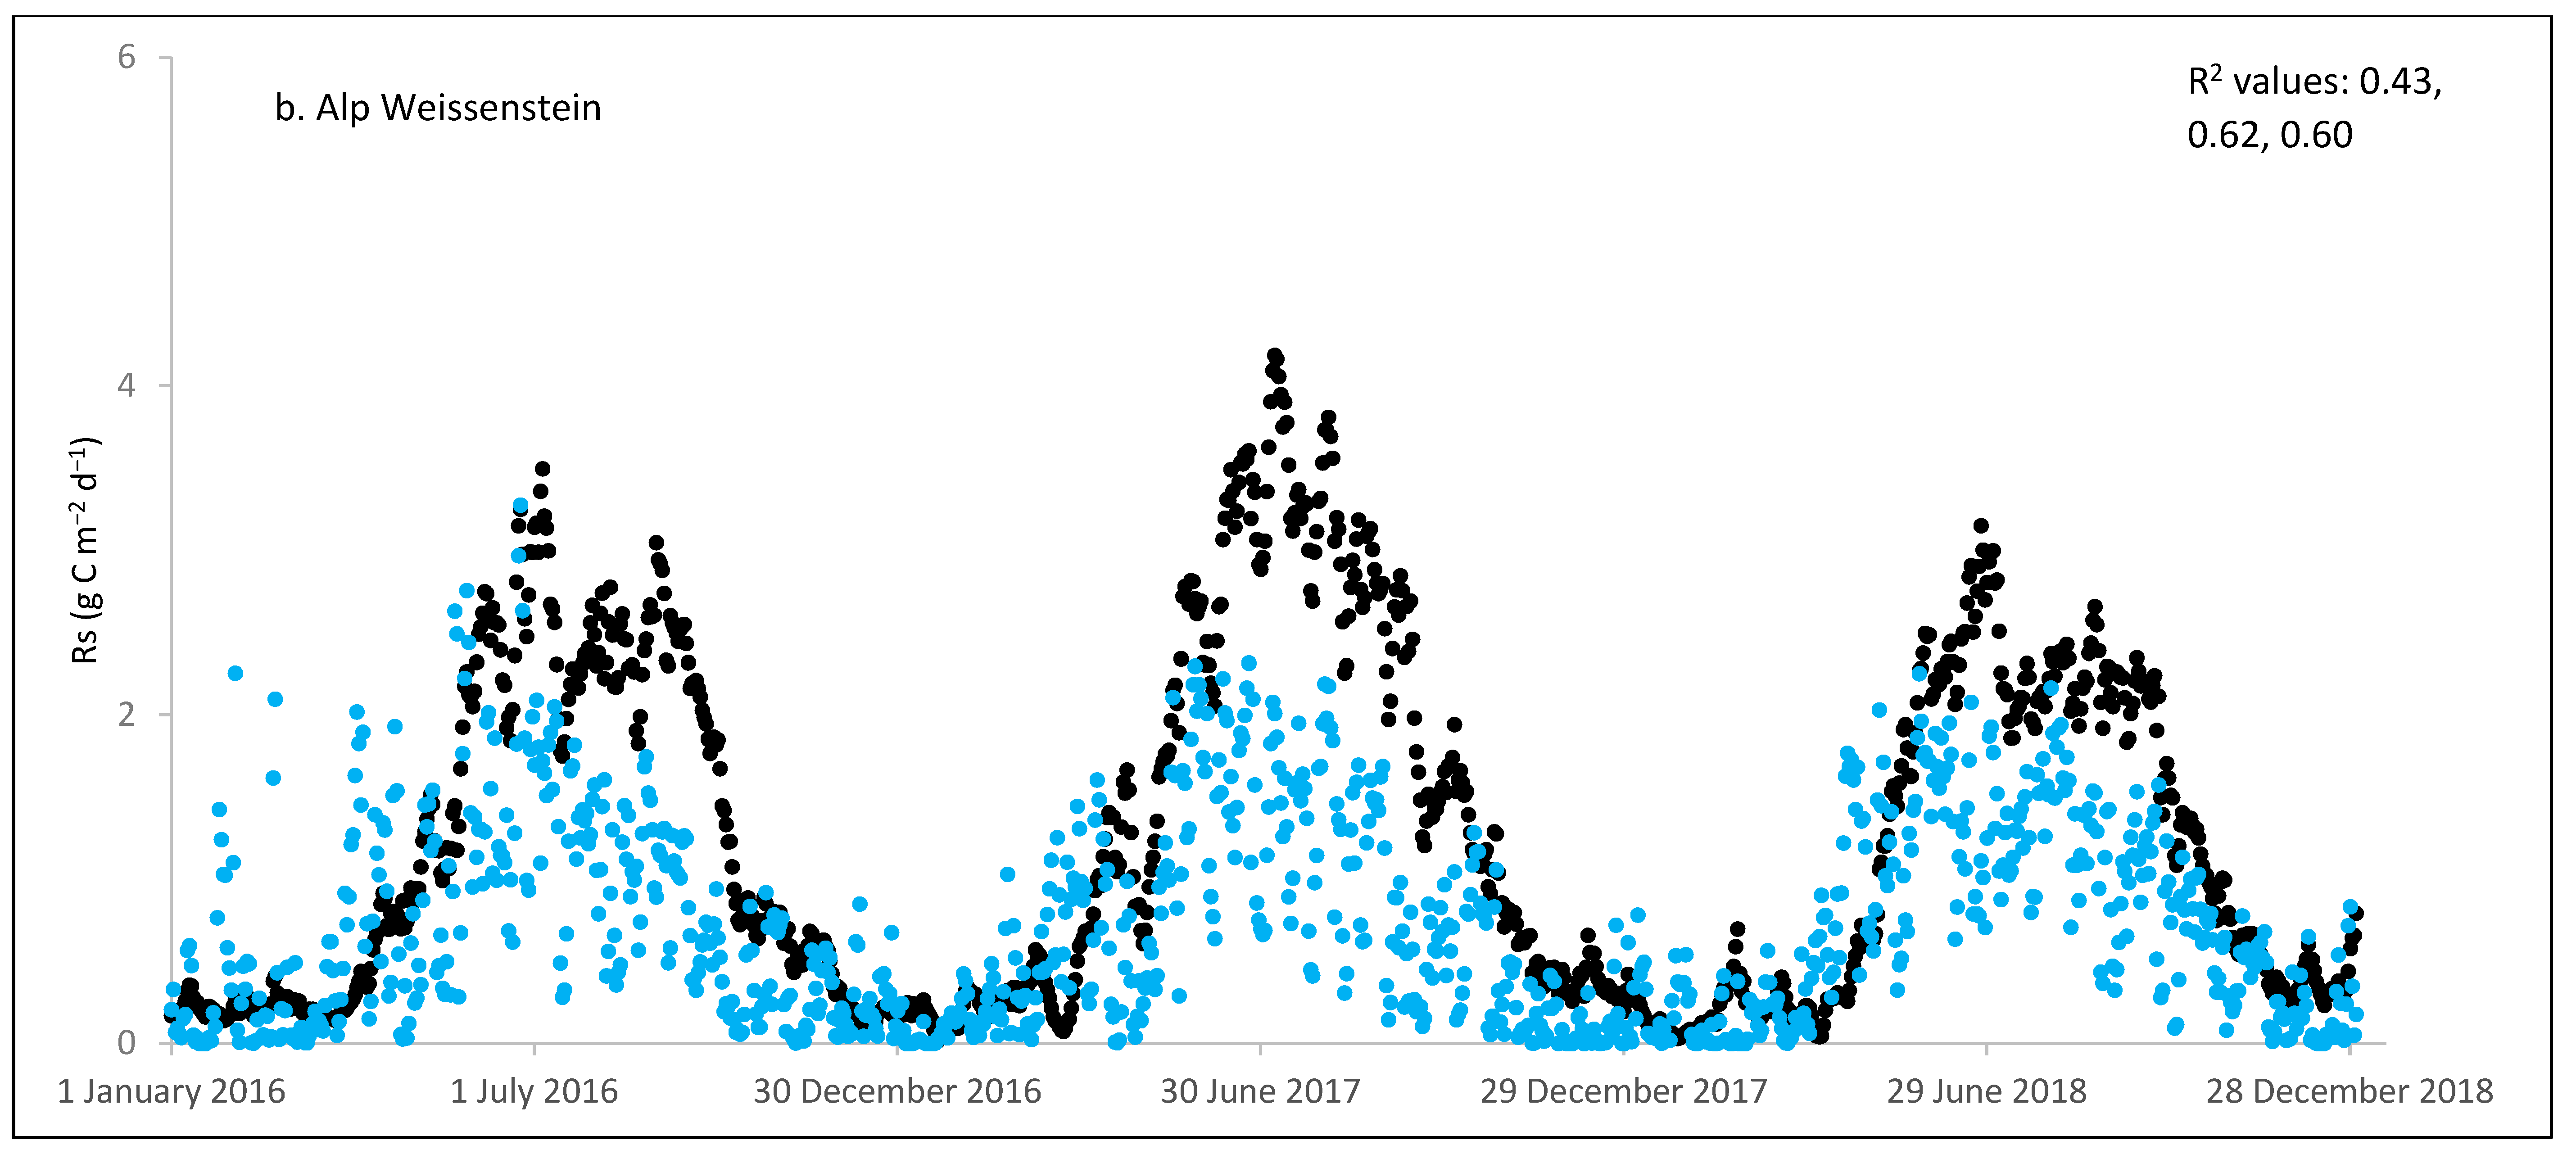
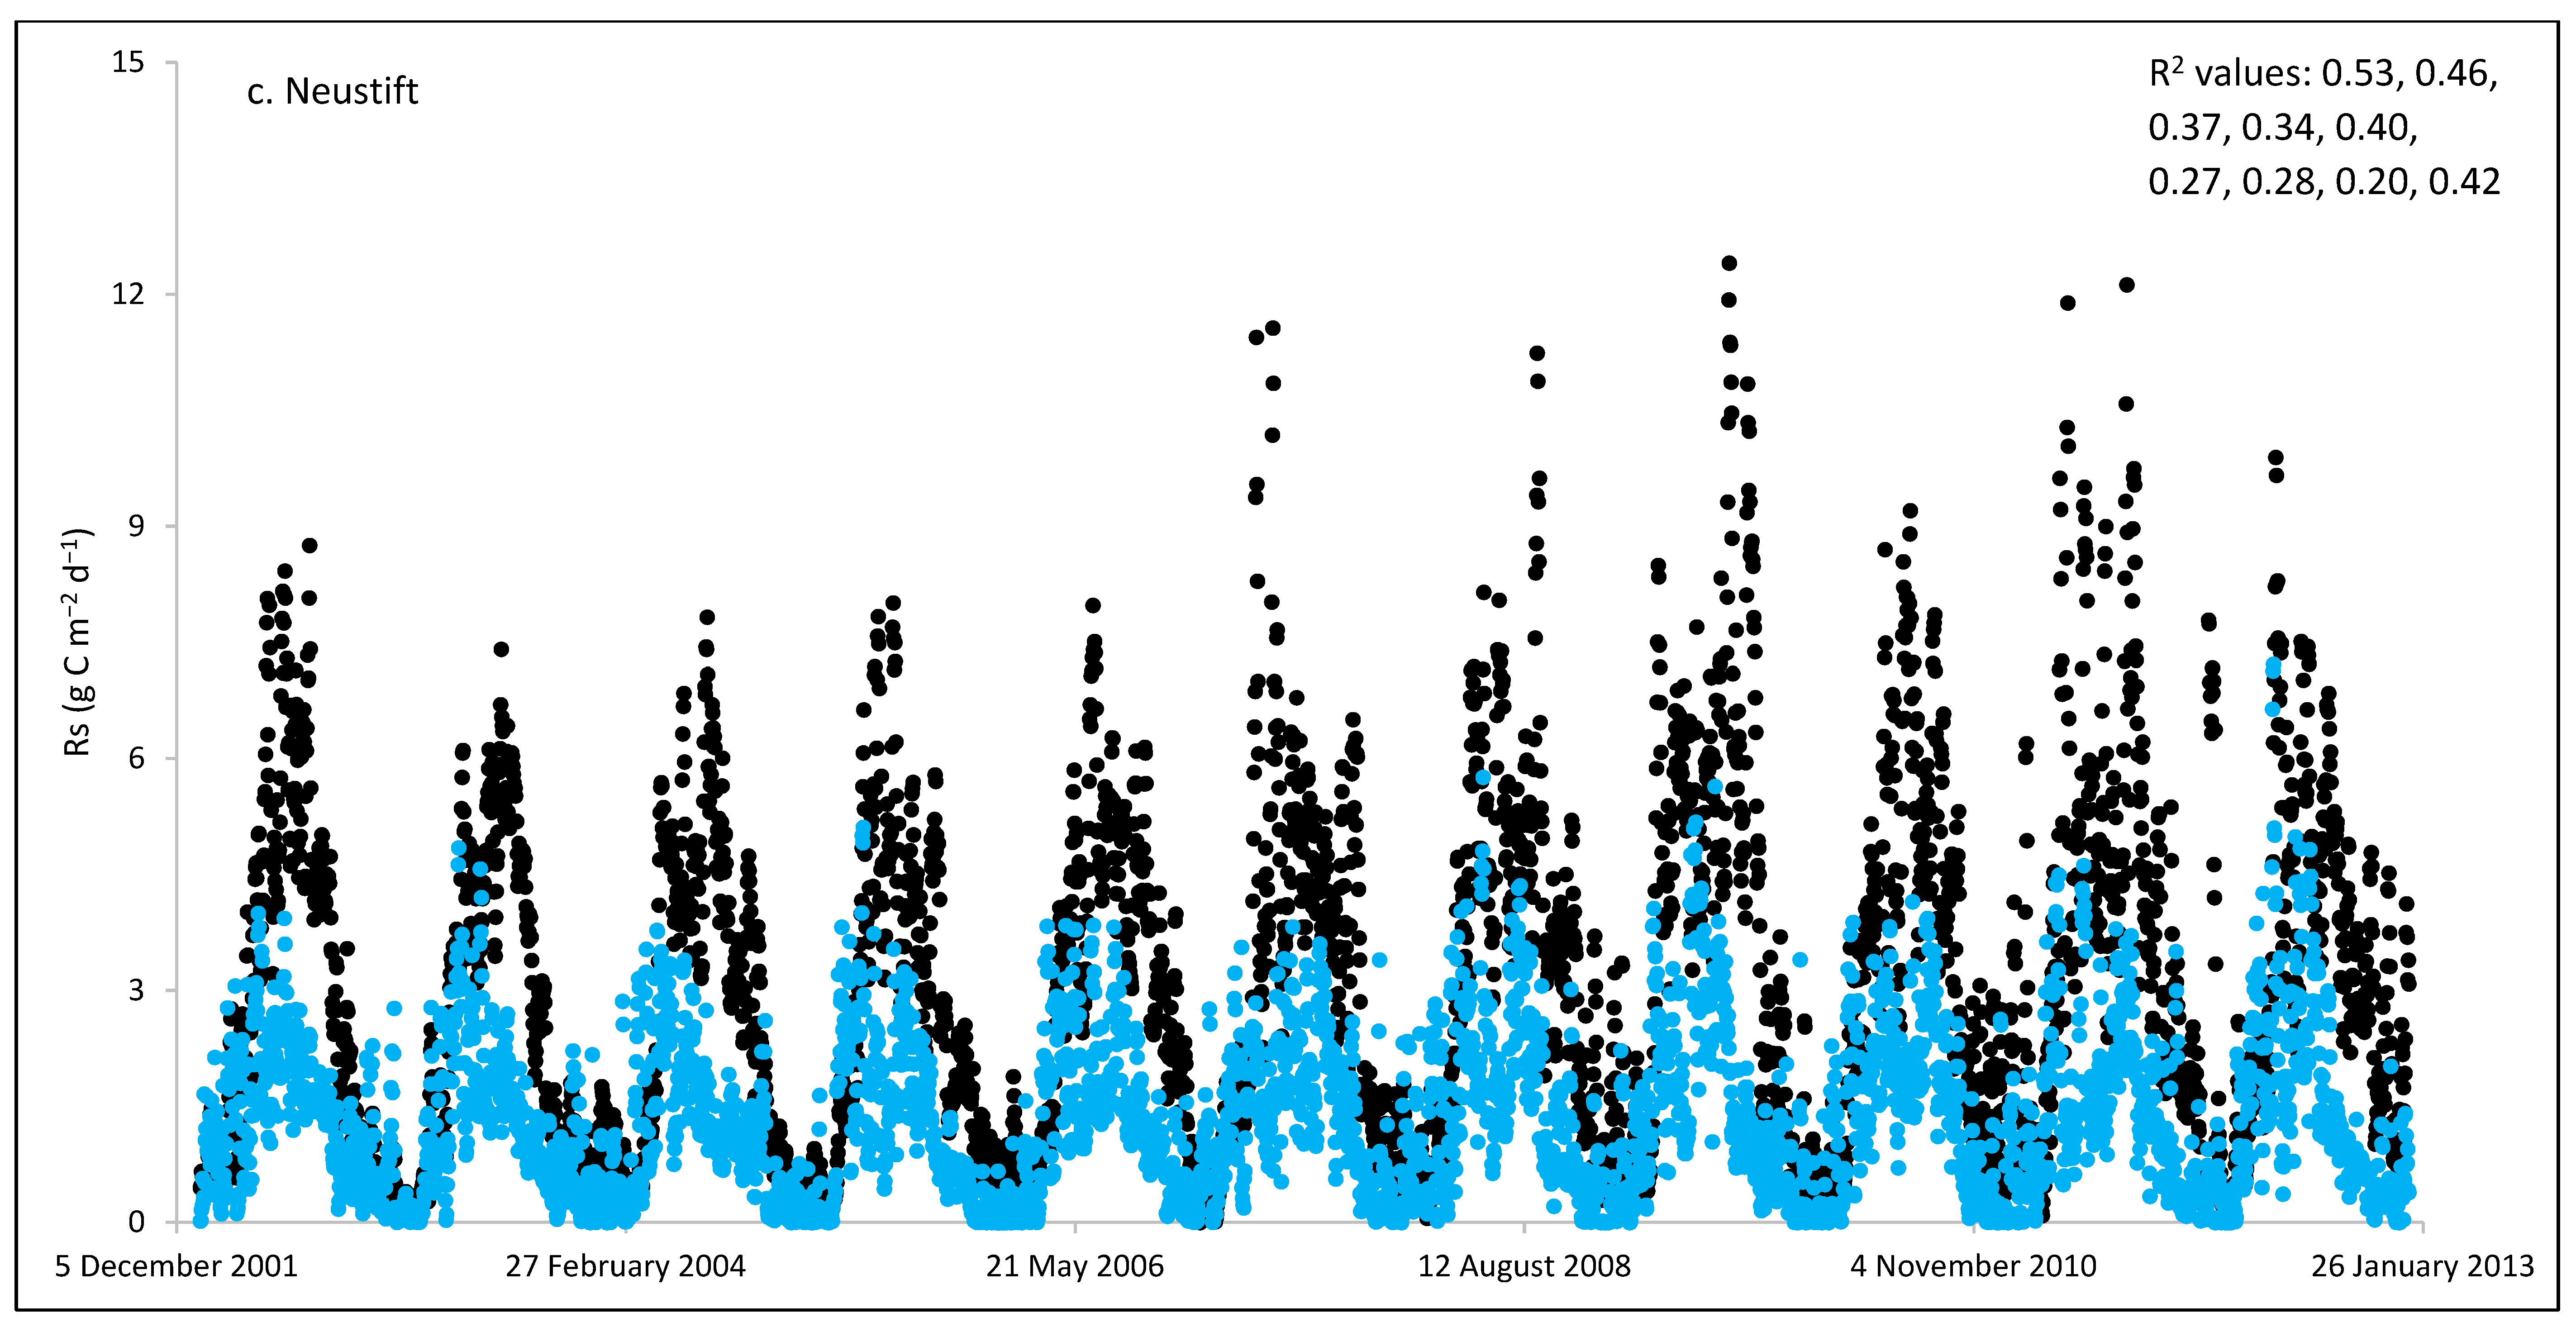
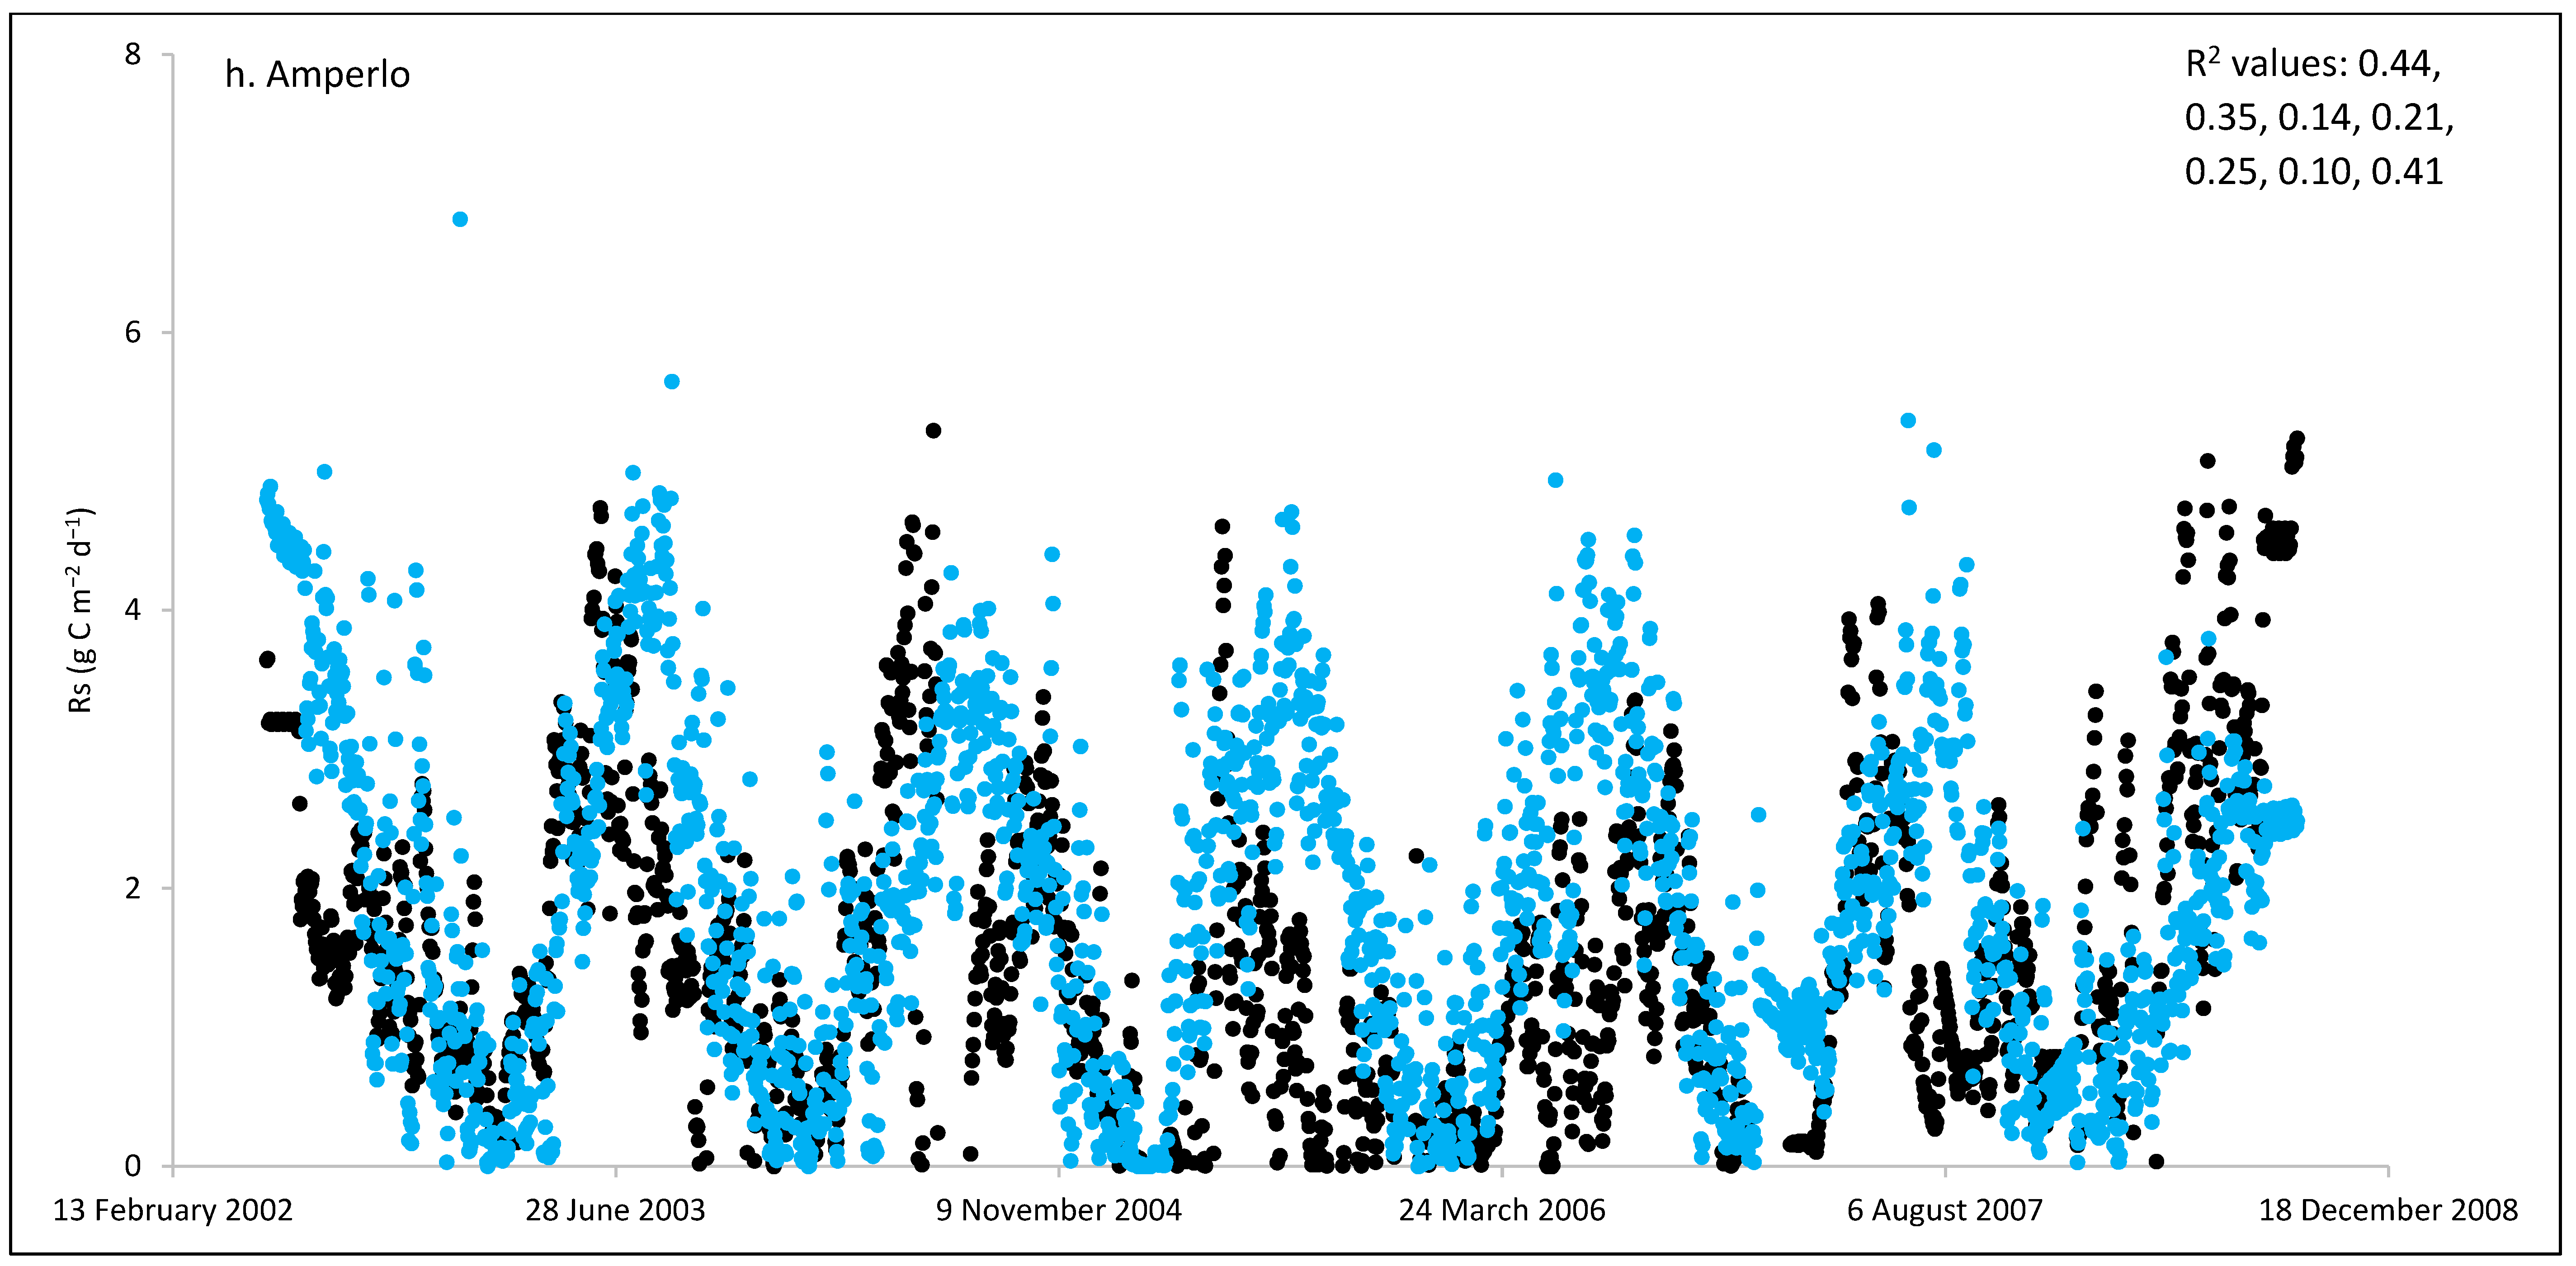
3.3. ECOSSE Simulations

As shown in Figure 2, on many occasions the ECOSSE model was able to capture the seasonal trends, peak values, and timings of estimated Rs fluxes correctly; however, the model often over- or under-estimated their values during warm weather conditions in spring and summer. Evaluation of the ECOSSE model is shown in Table 3, where the estimated Rs fluxes from these grassland sites were compared with the model’s outputs. The daily estimated and simulated Rs ranged from 0.95 to 3.1 g CO2-C m−2, and from 0.72 to 1.58 g CO2-C m−2, respectively. Summer Rs values ranging from 2.8 to 3.9 g CO2-C m−2 were reported for a temperate grassland in Germany [66]. Differences between estimated and simulated daily Rs were investigated by calculating RMSE and d. The model generally underestimated the flux, with RMSE values ranging from 0.91 to 3.30 g C m−2 day−1 (Table 3), and d values ranging from 0.28 to 0.87. The R2 between estimated and simulated daily Rs values were variable between sites (0.25, 0.52, 0.35, 0.33, 0.22, 0.15, 0.10, and 0.17 for Easter Bush, Alp Weissenstein, Neustift, Chamau, Matra, Grünschwaige, Borova, and Amperlo, respectively) and years within the same site, with the highest value of 0.63 found in Easter Bush (Table 3). Great variabilities in the model fit among the years for each site can be seen from the R2 range values between the daily estimated and simulated Rs fluxes. Both estimated and simulated Rs responded to seasonal temperature, precipitation, and management, which have strong impacts on Rs (Figure 2, Figure 3, Figures S1 and S2). These variables impact plant photosynthetic capability, plant growth, and accumulation of litter, which impacts C supply to soil decomposers [67]. As shown in Table 4, on most occasions, both daily estimated and simulated Rs values from Easter Bush and Chamau sites decreased after grass cutting and increased after slurry application. Here, although inconsistent, the model was able to predict estimated Rs following field management. ECOSSE was also able to predict annual cumulative estimated Rs at most of the sites, with an overall RD value (between annual estimated and simulated Rs) of −11.9%. Similar model fits and responses of cumulative Rs flux from grasslands to changes in climate and management parameters using the ECOSSE and DNDC models were reported in the literature [23,68]. The use of a simple generic method to estimate field Rs from the Reco data, use of estimated SOC at some sites, and factors such micronutrient deficiencies and topography, which are not considered in the model, may contribute to the differences in the simulation results. SOC content can vary spatially and temporally due to factors such as land management practices, soil type, and grass types [69]. By not considering these variations in SOC explicitly, the estimation method may not fully capture the heterogeneity of carbon inputs and microbial processes, leading to differences in simulated Rs. Moreover, measurement techniques, sampling variability, and spatial and temporal variability of sampling locations and intervals can all contribute to variability in Rs flux values.
ECOSSE had difficulties in correctly simulating Rs values from the Matra site, which was dry and had low inputs such as no fertilizers, manure, or animal grazing. Moinet et al. [70] found a significantly positive correlation between Rs and soil water content in dry permanent grasslands. This strong dependence of Rs on water content can explain most of the variations in Rs. Additionally, in low input sites, both soil and plant respiration can be reduced by the limited N input [71]. Nitrogen input leads to a decrease in soil C:N ratios by reducing plant species richness, which results in an increase in Rs [66]. Moreover, traditional models such as ECOSSE do not consider the proportion of legume species in the grass sward or microbial mechanisms, which can affect overall productivity and lead to an underestimation of nitrogen and carbon balance in the soil [55], and, consequently, underestimate simulated Rs [37]. Furthermore, these models are not sensitive to common management options used in grasslands, such as nitrification inhibitors and feed supplementation, which can affect nutrient availability. To improve our understanding of Rs, it is crucial to integrate the relationship between substrate supply and the soil biota, and their responses to changes in abiotic soil conditions in the model [72]. Possible refinements to the ECOSSE model could include further improving its sensitivity to grassland management practices and including microbial mechanisms. These improvements could enhance the accuracy and reliability of the model to capture complexity of management practices, account for microbial processes in soils, consider feedback mechanisms, and enhance the model’s ability to capture the dynamics of Rs. Further, it is recommended to develop a comprehensive multi-scale observational data-model fusion system that can effectively capture and analyse the intricate interrelationships among different components and variables. This fusion system would enable a holistic understanding of complex systems and provide valuable insights for scientific research and analysis.

4. Conclusions

This study found that the ECOSSE model (v. 5.0.1) has limitations in accurately estimating daily soil respiration (Rs) fluxes, especially in dry and low-input permanent grassland (PG) sites. Additionally, the model does not account for factors such as the proportion of legume species in the grass sward, animal feed supplements, and microbial mechanisms. Therefore, further development and refinement of the model are needed. However, the model is effective in estimating cumulative Rs from PG, and is sensitive to input data related to soil, climate, and management practices. The attribution analysis revealed that Rs increased as temperature, WT, and SOC levels increased, while it decreased with decreasing precipitation. Consequently, management practices that lower the WT depth should be avoided from a carbon emissions perspective, as they could lead to a significant increase in anthropogenic Rs. The model can simulate Rs following grass cutting and slurry application management accurately. Soil respiration can be explained by above-ground microclimate, below-ground metrics, and management practices.

Supplementary Materials

The following supporting information can be downloaded at: https://www.mdpi.com/article/10.3390/agronomy13071734/s1, Figure S1: Average daily air temperature (°C; black line) and precipitation (mm; blue line) at the experimental sites during the measurements of net ecosystem respiration; Figure S2: Relationships between estimated (blue bar) and simulated (orange bar) monthly cumulative soil respiration (Rs) and average monthly air temperature (black line) at the investigated sites.

Author Contributions

Conceptualization, M.A.; methodology, M.A.; investigation, M.A.; Resources, I.F., S.H.V., G.W., U.S., K.P., Z.N. and S.H.; formal analysis, M.A.; visualization, M.A.; writing—review and editing, M.A., I.F., S.H.V., G.W., U.S., K.P., Z.N., S.H., P.S., P.N.-P., N.B. and M.R. All authors have read and agreed to the published version of the manuscript.

Funding

This work is funded by the Super-G project (funded under EU Horizon 2020 programme: project number 774124).

Data Availability Statement

The data presented in this study are available on request from the corresponding author.

Acknowledgments

We are grateful to Lukas Hörtnagl, Keller Sabina, Shiva Ghiasi and people from other investigated sites for providing us with the data.

Conflicts of Interest

The authors declare no conflict of interest.

References

  1. IPCC. Climate Change 2021: The Physical Science Basis. Contribution of Working Group I to the Sixth Assessment Report of the Intergovernmental Panel on Climate Change; Cambridge University Press: Cambridge, UK, 2021; Available online: https://www.ipcc.ch/report/ar6/wg1/ (accessed on 9 November 2022).
  2. NOAA Climate. National Oceanic and Atmospheric Administration. Climate Change: Atmospheric Carbon Dioxide. 2022. Available online: https://www.climate.gov/news-features/understanding-climate/climate-change-atmospheric-carbon-dioxide#:~:text=Based%20on%20the%20annual%20report,setting%20a%20new%20record%20high (accessed on 9 November 2022).
  3. Caldeira, K.; Wickett, M.E. Anthropogenic carbon and ocean pH. Nature 2003, 425, 365. [Google Scholar] [CrossRef] [PubMed] [Green Version]
  4. Byrne, R.H.; Mecking, S.; Feely, R.A.; Liu, X. Direct observations of basin-wide acidification of the North Pacific Ocean. Geophys. Res. Lett. 2010, 37, L02601. [Google Scholar] [CrossRef] [Green Version]
  5. Hofmann, G.E.; Smith, J.E.; Johnson, K.S.; Send, U.; Levin, L.A.; Micheli, F.; Paytan, A.; Price, N.N.; Peterson, B.; Takeshita, Y.; et al. High-Frequency Dynamics of Ocean pH: A Multi-Ecosystem Comparison. PLoS ONE 2011, 6, e28983. [Google Scholar] [CrossRef] [PubMed] [Green Version]
  6. Schils, R.L.; Bufe, C.; Rhymer, C.M.; Francksen, R.M.; Klaus, V.H.; Abdalla, M.; Milazzo, F.; Lellei-Kovács, E.; ten Berge, H.; Bertora, C.; et al. Permanent grasslands in Europe: Land use change and intensification decrease their multifunctionality. Agric. Ecosyst. Environ. 2022, 330, 107891. [Google Scholar] [CrossRef]
  7. European Commission. Directorate-General for Agriculture and Rural Development. Commission Publishes External Study on Future of EU Livestock (europa.eu). 2020. Available online: https://agriculture.ec.europa.eu/news/commission-publishes-external-study-future-eu-livestock-2020-10-14_en#:~:text=Once%20emissions%20related%20to%20the,of%20total%20agricultural%20GHG%20emissions (accessed on 9 November 2022).
  8. Soussana, J.-F.; Tallec, T.; Blanfort, V. Mitigating the greenhouse gas balance of ruminant production systems through carbon sequestration in grasslands. Int. J. Anim. Biosci. 2010, 4, 334–350. [Google Scholar] [CrossRef] [Green Version]
  9. Van Den Pol, A.; Becker, T.; Botana Fernandez, A.; Hennessy, T.; Peratoner, G. Social and economic impacts of grass based ruminant production. In Proceedings of the 27th European Grassland Federation General Meeting Cork (EGF 2018), Cork, Ireland, 17–21 June 2018; Horan, B., Hennessy, D., O’Donovan, M., Kennedy, E., McCarthy, B., Finn, J.A., O’Brien, B., Eds.; European Grassland Federation EGF: Zürich, Switzerland, 2018; pp. 697–708. [Google Scholar]
  10. Hussain, R.I.; Walcher, R.; Eder, R.; Allex, B.; Wallner, P.; Hutter, H.-P.; Bauer, N.; Arnberger, A.; Zaller, J.G.; Frank, T. Management of mountainous meadows associated with biodiversity attributes, perceived health benefits and cultural ecosystem services. Sci. Rep. 2019, 9, 14977. [Google Scholar] [CrossRef] [Green Version]
  11. Eurostat. Share of Main Land Types in Utilised Agricultural Area (UAA) by NUTS 2 Regions. 2020. Available online: https://ec.europa.eu/eurostat/statistics-explained/SEPDF/cache/73319.pdf (accessed on 9 November 2022).
  12. Eurostat. Eurostat Regional Yearbook 2013. 2013. Available online: https://ec.europa.eu/eurostat/web/products-statistical-books/-/ks-ha-13-001 (accessed on 9 November 2022).
  13. Follett, R.F.; Reed, D.A. Soil Carbon Sequestration in Grazing Lands: Societal Benefits and Policy Implications. Rangel. Ecol. Manag. 2010, 63, 4–15. [Google Scholar] [CrossRef] [Green Version]
  14. Conant, R.T.; Cerri, C.E.P.; Osborne, B.B.; Paustian, K. Grassland management impacts on soil carbon stocks: A new synthesis. Ecol. Appl. 2017, 27, 662–668. [Google Scholar] [CrossRef] [Green Version]
  15. Abdalla, M.; Espenberg, M.; Zavattaro, L.; Lellei-Kovacs, E.; Mander, U.; Smith, K.; Thorman, R.; Damatirca, C.; Schils, R.; Ten-Berge, H.; et al. Does liming grasslands increase biomass productivity without causing detrimental impacts on net greenhouse gas emissions? Environ. Pollut. 2022, 300, 118999. [Google Scholar] [CrossRef]
  16. Folger, P. The Carbon Cycle: Implications for Climate Change and Congress. CRS Report for Congress. 2009. Available online: www.fas.org/sgp/crs/misc/RL34059.pdf (accessed on 9 November 2022).
  17. Bernhardt, E.S.; Barber, J.J.; Pippen, J.S.; Taneva, L.; Andrews, J.A.; Schlesinger, W.H. Long-term effects of Free Air CO2 Enrichment (FACE) on soil respiration. Biogeochemistry 2006, 77, 91–116. [Google Scholar] [CrossRef]
  18. Wang, W.; Fang, J. Soil respiration and human effects on global grasslands. Glob. Planet. Change 2009, 67, 20–28. [Google Scholar] [CrossRef]
  19. Abdalla, M.A.; Hastings, M.; Bell, J.; Smith, J.U.; Richards, M.; Nilsson, M.B.; Peichl, M.; Löfvenius, M.O.; Lund, M.; Helfter, C.; et al. Simulation of CO2 and attribution analysis at six European peatland sites using the ECOSSE model. Wat Air Soil Pollut. 2014, 225, 2182. [Google Scholar] [CrossRef]
  20. Meyer, N.; Welp, G.; Amelung, W. The temperature sensitivity (Q10) of soil respiration: Controlling factors and spatial prediction at regional scale based on environmental soil classes. Glob. Biogeochem. Cycles 2018, 32, 306–323. [Google Scholar] [CrossRef]
  21. Dacal, M.; Delgado-Baquerizo, M.; Barquero, J.; Berhe, A.A.; Gallardo, A.; Maestre, F.T.; Garcı’a-Palacios, P. Temperature Increases Soil Respiration Across Ecosystem Types and Soil Development, But Soil Properties Determine the Magnitude of This Effect. Ecosystems 2022, 25, 184–198. [Google Scholar] [CrossRef]
  22. Smith, S.D.; Huxman, T.E.; Zitzer, S.E.; Charlet, T.N.; Housman, D.C.; Coleman, S.; Fenstermaker, L.K.; Seeman, J.R.; Nowak, R.S. Elevated CO2 increases productivity and invasive species success in an arid ecosystem. Nature 2000, 408, 79–82. [Google Scholar] [CrossRef]
  23. Abdalla, M.; Kumar, S.; Jones, M.; Burke, J.; Williams, M. Testing DNDC model for simulating soil respiration and assessing the effects of climate change on the CO2 gas flux from Irish agriculture. Glob. Planet. Change 2011, 78, 106–115. [Google Scholar] [CrossRef]
  24. Zak, D.R.; Pregitzer, K.S.; King, J.S.; Holmes, W.E. Elevated atmospheric CO2, fine roots and the response of soil microorganisms: A review and hypothesis. New Phytol. 2000, 147, 201–222. [Google Scholar] [CrossRef] [Green Version]
  25. Jenkinson, D.S.; Rayner, J.H. The turnover of soil organic matter in some of the Rothamsted classical experiments. Soil Sci. 1977, 123, 298–305. [Google Scholar] [CrossRef]
  26. Jenkinson, D.S.; Hart, P.B.S.; Rayner, J.H.; Parry, L.C. Modelling the turnover of organic matter in long-term experiments at Rothamsted. Intecol Bull. 1987, 15, 1–8. [Google Scholar]
  27. Coleman, K.; Jenkinson, D.S. RothC-26.3: A model for the turnover of carbon in soil. In Evaluation of Soil Organic Matter Models Using Existing, Long-Term Datasets, NATO ASI Series I; Powlson, D.S., Smith, P., Smith, J.U., Eds.; Springer: Berlin/Heidelberg, Germany, 1996; Volume 38, pp. 237–246. [Google Scholar]
  28. Bradbury, N.J.; Whitmore, A.P.; Hart, P.B.S.; Jenkinson, D.S. Modelling the fate of nitrogen in crop and soil in the years following the application of 15N-labelled fertilizer to winter wheat. J. Agric. Sci. 1993, 121, 363–379. [Google Scholar] [CrossRef]
  29. Smith, J.U.; Glendining, M.J. A decision support system for optimising the use of nitrogen in crop rotations. Rotations and cropping systems. Asp. Appl. Biol. 1996, 47, 103–110. [Google Scholar]
  30. Smith, J.; Gottschalk, P.; Bellarby, J.; Richards, M.; Nayak, D.; Coleman, K.; Hillier, J.; Wattenbach, M.; Aitkenhead, M.; Yeluripurti, J.; et al. Model to Estimate Carbon in Organic Soils-Sequestration and Emissions (ECOSSE) User-Manual; University of Aberdeen: Aberdeen, UK, 2010; pp. 1–76. [Google Scholar]
  31. Reth, S.; Riechstein, M.; Falge, E. The effect of soil water content, soil temperature, soil pH-value and the root mass on soil CO2 efflux–A modified model. Plant Soil 2005, 268, 21–33. [Google Scholar] [CrossRef]
  32. McMillen, R.T. An eddy correlation technique with extended applicability to non-simple terrain. Bound Layer Meteorol. 1988, 43, 231–245. [Google Scholar] [CrossRef]
  33. Aubinet, M.; Vesala, T.; Papale, D. Eddy Covariance: A Practical Guide to Measurement and Data Analysis; Spring Atmospheric Science: London, UK, 2012; ISSN 2194-5217. [Google Scholar]
  34. Jones, S.K.; Helfter, C.; Anderson, M.; Coyle, M.; Campbell, C.; Famulari, D.; Di Marco, C.; van Dijk, N.; Topp, C.F.E.; Kiese, R.; et al. The nitrogen, carbon and greenhouse gas budget of a grazed, cut and fertilised temperate grassland. Biogeosciences 2017, 14, 2069–2088. [Google Scholar] [CrossRef] [Green Version]
  35. Hiller, R.M.; Zeeman, J.; Eugster, W. Eddy-covariance flux measurements in the complex terrain of an alpine valley in Switzerland. Bound. Layer Meteorol. 2008, 127, 449–467. [Google Scholar] [CrossRef] [Green Version]
  36. Wohlfahrt, G.; Anderson-Dunn, M.; Bahn, M.; Balzarolo, M.; Berninger, F.; Campbell, C.; Carrara, A.; Cescatti, A.; Christensen, T.; Dore, S.; et al. Biotic, abiotic and management controls on the net ecosystem CO2 exchange of European mountain grasslands. Ecosystems 2008, 11, 1338–1351. [Google Scholar] [CrossRef]
  37. Fuchs, K.; Hörtnagl, L.; Buchmann, N.; Eugster, W.; Snow, V.; Merbold, L. Management matters: Testing a mitigation strategy for nitrous oxide emissions using legumes on intensively managed grassland. Biogeosciences 2018, 15, 5519–5543. [Google Scholar] [CrossRef] [Green Version]
  38. Pintér, K.; Barcza, Z.; Balogh, J.; Czóbel Sz Csintalan Zs Tuba, Z.; Zoltán, N. Interannual variability of grasslands’ carbon balance depends on soil type. Community Ecol. 2008, 9 (Suppl. S1), 43–48. [Google Scholar] [CrossRef]
  39. Hirl, R.T.; Schnyder, H.; Ostler, U.; Schäufele, R.; Schleip, I.; Vetter, S.; Auerswald, K.; Baca Cabrera, J.C.; Wingate, L.; Barbour, M.M.; et al. The 18O ecohydrology of a grassland ecosystem—Predictions and observations. Hydrol. Earth Syst. Sci. 2019, 23, 2581–2600. [Google Scholar] [CrossRef] [Green Version]
  40. Cuhel, J.; šimek, M.; Laughlin, R.J.; Bru, D.; Chèneby, D.; Watson, C.J.; Philippot, L. Insights into the effect of soil pH on N2O and N2 emissions and denitrifier community size and activity. Appl. Environ. Microbiol. 2010, 76, 870–1878. [Google Scholar] [CrossRef] [Green Version]
  41. Balzarolo, M.; Balzarolo, M.; Boussetta, S.; Balsamo, G.; Beljaars, A.; Maignan, F.; Calvet, J.-C.; Lafont, S.; Barbu, A.; Poulter, B.; et al. Evaluating the potential of large-scale simulations to predict carbon fluxes of terrestrial ecosystems over a European Eddy Covariance network. Biogeosciences 2014, 11, 266–2678. [Google Scholar] [CrossRef] [Green Version]
  42. Hardie, S.M.L.; Garnett, M.H.; Fallick, A.E.; Ostle, N.J.; Rowland, A.P. Bomb 14C analysis of ecosystem respiration reveals that peatland vegetation facilitates release of old carbon. Geoderma 2009, 153, 393–401. [Google Scholar] [CrossRef] [Green Version]
  43. Wu, L.; McGechan, M.B. A review of carbon and nitrogen processes in four soil nitrogen dynamics models. J. Agric. Eng. Res. 1998, 69, 279–305. [Google Scholar] [CrossRef]
  44. Thornthwaite, C.W. An approach toward a rational classification of climate. Geogr. Rev. 1948, 38, 55–94. [Google Scholar] [CrossRef]
  45. Smith, J.; Smith, P. Environmental Modelling: An Introduction; Oxford University Press: Oxford, UK, 2007; pp. 1–178. [Google Scholar]
  46. Smith, P.; Smith, J.U.; Powlson, D.S.; McGill, W.B.; Arah, J.R.M.; Chertov, O.G.; Coleman, K.; Franko, U.; Frolking, S.; Jenkinson, D.S.; et al. A comparison of the performance of nine soil organic matter models using seven long-term experimental datasets. Geoderma 2007, 81, 153–225. [Google Scholar] [CrossRef]
  47. Cai, Z.; Swamoto, T.; Li, C.; Kang, G.; Boonjawat, J.; Mosier, A.; Wassmann, R.; Tsuruta, H. Field validation of the DNDC-model for greenhouse gas emissions in East Asian cropping systems. Glob. Biogeochem. Cycles 2003, 17, 1107. [Google Scholar] [CrossRef] [Green Version]
  48. Bahn, M.; Rodeghiero, M.; Anderson-Dunn, M.; Dore, S.; Gimeno, C.; Drösler, M.; Williams, M.; Ammann, C.; Berninger, F.; Flechard, C.; et al. Soil Respiration in European Grasslands in Relation to Climate and Assimilate Supply. Ecosystems 2008, 11, 1352–1367. [Google Scholar] [CrossRef] [Green Version]
  49. Schär, C.; Vidale, P.; Lüthi, D.; Frei, C.; Häberli, C.; Liniger, M.; Appenzeller, C. The role of increasing temperature variability in European summer heatwaves. Nature 2004, 427, 332–336. [Google Scholar] [CrossRef]
  50. Li, J.; Pei, J.; Pendall, E.; Fang, C. Ming Ni Spatial heterogeneity of temperature sensitivity of soil respiration: A global analysis of field observations. Soil Biol. Biochem. 2020, 141, 107675. [Google Scholar] [CrossRef]
  51. Carbone, M.S.; Winston, G.C.; Trumbore, S.E. Soil respiration in perennial grass and shrub ecosystems: Linking environmental controls with plant and microbial sources on seasonal and diel timescales. J. Geophys. Res. 2008, 113, G02022. [Google Scholar] [CrossRef] [Green Version]
  52. Liu, X.Z.; Wan, S.Q.; Su, B.; Hui, D.F.; Luo, Y.Q. Response of soil CO2 efflux to water manipulation in a tallgrass prairie ecosystem. Plant Soil 2002, 240, 213–223. [Google Scholar] [CrossRef]
  53. Xu, L.K.; Baldocchi, D.D.; Tang, J.W. How soil moisture, rain pulses, and growth alter the response of ecosystem respiration to temperature. Glob. Biogeochem. Cycles 2004, 18, GB4002. [Google Scholar] [CrossRef]
  54. Frank, A.B.; Liebig, M.A.; Hanson, J.D. Soil carbon dioxide fluxes in northern semiarid grasslands. Soil Biol. Biochem. 2002, 34, 1235–1241. [Google Scholar] [CrossRef]
  55. Hamza, M.A.; Anderson, W.K. Soil compaction in cropping systems: A review of the nature, causes and possible solutions. Soil Tillage Res. 2005, 82, 121–145. [Google Scholar] [CrossRef]
  56. Solomon, S.; Qin, D.; Manning, M.; Chen, Z.; Marquis, M.; Averyt, K.B.; Tignor, M.; Miller, H.L. IPCC Fourth Assessment Report: Climate Change 2007, Cambridge Univ Press, Cambridge, UK, Climate Change 2007: Working Group I: The Physical Science Basis. 2008. Available online: https://www.ipcc.ch/site/assets/uploads/2018/02/ar4-wg1-frontmatter-1.pdf (accessed on 9 November 2022).
  57. Cantarel, A.A.M.; Bloor, J.M.G.; Pommier, T.; Guillaumaud, N.; Moirot, C.; Soussana, J.-F.; Poly, F. Four years of experimental climate change modifies the microbial drivers of N2O fluxes in an upland grassland ecosystem. Glob. Change Biol. 2012, 18, 2520–2531. [Google Scholar] [CrossRef]
  58. Wieder, W.R.; Bonan, G.B.; Allison, S.D. Global soil carbon projections are improved by modelling microbial processes. Nat. Clim. Change 2013, 3, 909–912. [Google Scholar] [CrossRef] [Green Version]
  59. De Goede, R.G.M.; Brussaard, L.; Akkermans, A.D.L. On-farm impact of cattle slurry manure management on biological soil quality. NJAS Wagening. J. Life Sci. 2003, 51, 103–133. [Google Scholar] [CrossRef] [Green Version]
  60. Asmuß, T.; Bechtold, M.; Tiemeyer, B. On the Potential of Sentinel-1 for High Resolution Monitoring of Water Table Dynamics in Grasslands on Organic Soils. Remote Sens. 2019, 11, 1659. [Google Scholar] [CrossRef] [Green Version]
  61. Clair, S.B.S.T.; Sudderth, E.A.; Fischer, M.L.; Torn, M.S.; Stuart, S.A.; Salve, R.; Eggett, D.L.; Ackerly, D.D. Soil drying and nitrogen availability modulate carbon and water exchange over a range of annual precipitation totals and grassland vegetation types. Glob. Change Biol. 2009, 15, 3018–3030. [Google Scholar] [CrossRef]
  62. Davidson, E.A.; Belk, E.; Boone, R.D. Soil water content and temperature as independent or confounded factors controlling soil respiration in a temperate mixed hardwood forest. Glob. Change Biol. 1998, 4, 217–227. [Google Scholar] [CrossRef] [Green Version]
  63. Shaver, G.R.; Canadell, J.; Chapin, F.S.I.I.I.; Gurevitch, J.; Harte, J.; Henry, G.; Ineson, P.; Jonasson, S.; Melillo, J.; Pitelka, L.; et al. Global warming and terrestrial ecosystems: A conceptual framework for analysis. Bioscience 2000, 50, 871–882. [Google Scholar] [CrossRef]
  64. Shaw, M.R.; Harte, J. Control of litter decomposition in a subalpine meadow-sagebrush steppe ecotone under climate change. Ecol. Appl. 2001, 11, 1206–1223. [Google Scholar]
  65. Chen, D.; Li, J.; Lan, Z.; Hu, S.; Bai, Y. Soil acidification exerts a greater control on soil respiration than soil nitrogen availability in grasslands subjected to long-term nitrogen enrichment. Funct. Ecol. 2016, 30, 658–669. [Google Scholar] [CrossRef]
  66. Apostolakis, A.; Schöning, I.; Michalzik, B.; Klaus, V.H.; Boeddinghaus, R.S.; Kandeler, E.; Marhan, S.; Bolliger, R.; Fischer, M.; Prati, D.; et al. Drivers of soil respiration across a management intensity gradient in temperate grasslands under drought. Nutr. Cycl. Agroecosyst. 2022, 124, 101–116. [Google Scholar] [CrossRef]
  67. Sankaran, M.; Augustine, D.J. Large herbivores suppress decomposer abundance in a semiarid grazing ecosystem. Ecology 2004, 85, 1052–1061. [Google Scholar] [CrossRef] [Green Version]
  68. Barneze, A.S.; Abdalla, M.; Whitaker, J.; McNamara, N.P.; Ostle, N.J. Predicted Soil Greenhouse Gas Emissions from Climate X Management Interactions in Temperate Grassland. Agronomy 2022, 12, 3055. [Google Scholar] [CrossRef]
  69. Scharlemann, J.P.W.; Tanner, E.V.J.; Hiederer, R.; Kapos, V. Global soil carbon: Understanding and managing the largest terrestrial carbon pool. Carbon Manag. 2014, 5, 81–91. [Google Scholar] [CrossRef]
  70. Moinet, G.Y.K.; Midwood, A.J.; Hunt, J.E.; Rumpel, C.; Millard, P.; Chabbi, A. Grassland Management Influences the Response of Soil Respiration to Drought. Agronomy 2019, 9, 124. [Google Scholar] [CrossRef] [Green Version]
  71. Sándor, R.; Ehrhardt, F.; Brilli, L.; Carozzi, M.; Recous, S.; Smith, P.; Snow, V.; Soussana, J.-F.; Dorich, C.D.; Fuchs, K.; et al. The use of biogeochemical models to evaluate mitigation of greenhouse gas emissions from managed grasslands. Sci. Total Environ. 2018, 642, 292–306. [Google Scholar] [CrossRef] [Green Version]
  72. Subke, J.A.; Bahn, M. On the ‘temperature sensitivity’ of soil respiration: Can we use the immeasurable to predict the unknown? Soil Biol. Biochem. 2010, 42, 1653–1656. [Google Scholar] [CrossRef] [Green Version]
Figure 1. Locations of the investigated sites ().
Agronomy 13 01734 g001
Figure 2. Comparisons between soil respiration (Rs) estimated from ecosystem respiration (black closed circle) and ECOSSE–simulated Rs fluxes (bule closed circle) at (a) Easter Bush, (b) Alp Weissenstein, (c) Neustift, (d) Chamau, (e) Matra, (f) Grünschwaige, (g) Borova, and (h) Amperlo grassland sites. Grass cutting at Easter Bush, Neustift, Chamau, and Matra took place in the period MarchAugust each year. R2 values are the coefficient of determination between estimated and simulated Rs for the years at each site chronologically.
Agronomy 13 01734 g002aAgronomy 13 01734 g002bAgronomy 13 01734 g002cAgronomy 13 01734 g002dAgronomy 13 01734 g002eAgronomy 13 01734 g002fAgronomy 13 01734 g002gAgronomy 13 01734 g002h
Figure 3. Regression relationships between average daily air temperature (°C) and the daily soil respiration fluxes (Rs; (g C m−2 d−1)) estimated from ecosystem respiration (Reco) at the investigated sites.
Agronomy 13 01734 g003
Table 1. Site characteristics and data acquisition. MAT is mean annual air temperature; and MAP is mean annual precipitation.
Site/Location *CoordinatesMAT
(°C)
MAP
(mm)
Type of GrasslandSite ManagementSoil TypeInvestigated Years
Easter Bush/UK 55°52′ N, 03°02′ W9.0947Lolium perenne/cloverFertilised, grazed, cutSandy clay loam2002–2010
Alp Weissenstein/CH46°34′ N, 09°47′ E4.0918Mixed grasslandsExtensively grazedSandy loam2016–2018
Neustift/AT47°12′ N, 11°32′ E6.5852Mixed grasslandsGrazed, cut, manureSandy loam2002–2012
Chamau/CH47°12′ N, 08°24′ E9.11151Ryegrass/clover Cut, grazed, fertilisedSandy loam to silty loam2005–2018
Matra/HU47°52′ N, 19°56′ E10.2622Mixed grasslandsCutClay soil2007–2008
Grünschwaige/DE48°23′ N, 11°50′ E9.0775Ryegrass/cloverGrazed, manureSilt loam2002–2012
Borova/CZ48°52′ N, 14°13′ E7.0650Ryegrass/cloverExtensively grazed, fertilisedSandy loam2002–2004
Amperlo/IT41°90′ N, 13°22′ E10.01365Mixed grasslandsGrazedClay soil2002–2008
* UK = United Kingdom; CH = Switzerland; AT = Austria; HU = Hungary; DE = Germany; CZ = Czech Republic; and IT = Italy.
Table 2. Soil property at 0–50 cm for the ECOSSE model input data.
Site/LocationBulk Density (g cm−3)Soil pHClay (%)Water Table Depth (cm)Measured/Estimated SOC * (t ha−1)
Easter Bush/UK1.35.12385120
Alp Weissenstein/CH1.16.42012532.5
Neustift/AT0.75.55.512543.9
Chamau/CH1.15.02012536.7
Matra/HU1.35.43540019.5
Grünschwaige/DE1.16.42612531.3
Borova/CZ1.17.86.02527.9
Amperlo/IT1.16.65612554.2
* SOC = soil organic carbon.
Table 3. Statistical analysis of soil respiration (Rs) estimated from ecosystem respiration (Reco) and ECOSSE-simulated Rs fluxes from the eight grasslands investigated sites.
Site/LocationYears of MeasurementsCumulative Annual Estimated Rs (g C m−2)Cumulative Annual Simulated Rs (g C m−2)Mean Daily Estimated Rs (g C m−2)Mean Daily Simulated Rs (g C m−2)RD *
(%)
RMSE
(g C m−2 d−1)
dR2-Range
Easter Bush/UK97704902.111.35−361.560.860.15–0.63
Alp Weissenstein/CH34602601.250.72−420.910.870.43–0.62
Neustift/AT1111204903.071.34−562.510.280.20–0.53
Chamau/CH148104302.921.55−473.300.550.21–0.53
Matra/HU23505300.951.45511.280.670.01–0.29
Grünschwaige/DE115305501.601.5841.280.540.10–0.53
Borova/CZ34833941.321.08−181.050.870.0–0.25
Amperlo/IT74505601.551.95241.350.550.14–0.44
* RD is relative deviation between cumulative annual estimated Rs from Reco and cumulative annual simulated Rs; RMSE is root mean square error; d is index of agreement between ECOSSE-simulated Rs and estimated Rs from Reco; R2 is the coefficient of determination; and R2 range is the minimum and maximum R2 values for the investigated years at each site. Few data were available in the first year.
Table 4. Comparisons between estimated and simulated Rs values at Easter Bush (2002–2004) and Chamau (2005–2006) sites, two days following grass cut and slurry application (i.e., values compared were from day two after management).
Site NameManagementDate
(Month/Year)
Estimated Rs
(% Change)
Simulated Rs
(% Change)
Easter BushGrass cutJune 2002−21−10
August 2002−12−13
May 20032025
Slurry applicationSeptember 20041515
April 2005330
ChamauGrass cutMay 2005−36−32
June 2005−44−31
July 2005178
August 2005−10−14
July 2006−56−24
July 2006−22
September 20069055
Slurry applicationMay 20058467
June 20054631
August 20051310
December 2005−2927
March 200658>100
May 2006−43−1
June 2006>1003
July 20063816
August 2006−16−19
Table 5. ECOSSE sensitivity and attribution response of the soil respiration (Rs) fluxes to changes in soil properties and climate input factors at the investigated sites. The original daily temperature was increased or decreased by 3 °C, whilst precipitation, soil organic carbon, and pH were increased or decreased by 30%. The water table depth was lowered by 30 cm. Changes (%) were calculated in comparison with the model output using the original measured input data. Matra was not included as the response to changes parameters at this site was minor.
Site/LocationTemp+Temp−Rain+Rain−SOC+SOC−pH+pH−WT+
Easter Bush/UK20.1−23.0−0.60.04.3−0.80.4−2.20.0
Alp Weissenstein/CH25.5−22.4−17.710.92.2−2.60.0−6.311.3
Neustift/AT21.6−19.1−10.11.67.4−2.50.0−5.114.1
Chamau/CH21.4−19.2−5.50.03.1−2.50.0−11.14.7
Matra/HU16.0−11.3−6.0−5.84.51.911.2−2.50.0
Grünschwaige/DE21.8−20.1−1.40.02.1−2.20.0−11.54.8
Borova/CZ 22.4−21.5−1.21.60.6−0.60.0−6.416.2
Amperlo/IT24.4−22.1−7.25.715.6−2.25.7−15.78.1
Disclaimer/Publisher’s Note: The statements, opinions and data contained in all publications are solely those of the individual author(s) and contributor(s) and not of MDPI and/or the editor(s). MDPI and/or the editor(s) disclaim responsibility for any injury to people or property resulting from any ideas, methods, instructions or products referred to in the content.

